CHEST DISCOMFORT AID - Cornell Universitypeople.ece.cornell.edu/land/courses/eceprojects... ·...
28
CHEST DISCOMFORT AID A Design Project Report Presented to the School of Electrical and Computer Engineering of Cornell University in Partial Fulfillment of the Requirements for the Degree of Master of Engineering, Electrical and Computer Engineering Submitted by Pooja Bangalore Ramachandra Team : Ethan Green, Rashmi Rajashekar ,Weisi Chen, Orlen Shiba, Ningyu Yang, Arjun Kurian MEng Field Advisor: Dr. Bruce Land MEng Outside Advisor: Dr. Jonathan Black Degree Date: May, 2015
Transcript of CHEST DISCOMFORT AID - Cornell Universitypeople.ece.cornell.edu/land/courses/eceprojects... ·...

CHEST DISCOMFORT AID
A Design Project Report
Presented to the School of Electrical and Computer Engineering of Cornell University in
Partial Fulfillment of the Requirements for the Degree of
Master of Engineering, Electrical and Computer Engineering
Submitted by
Pooja Bangalore Ramachandra
Team : Ethan Green, Rashmi Rajashekar ,Weisi Chen, Orlen Shiba, Ningyu Yang, Arjun Kurian
MEng Field Advisor: Dr. Bruce Land
MEng Outside Advisor: Dr. Jonathan Black
Degree Date: May, 2015

2
Acknowledgement
Our project would not have been possible without strong support from numerous sources. First
and foremost, we would like to thank Professor Jonathan Black for his incredible insight,
guidance, and feedback throughout the entire process. His mentorship was instrumental in all
phases of the project, and his encouragement kept us going at key roadblocks. We would also
like to give tremendous thanks to Ms. Pam Silverstein. Her guidance in the business aspects of
the project was crucial to the formulation of our business plan and overall commercial strategy.
Her encouragement helped us achieve major breakthroughs when we encountered significant
pushback. We would like to thank Professor Bruce Land for his advice and assistance when we
met technical challenges and Professor Robert Karpman for his input on medical regulations and
physician perspective. We gained vital knowledge from these two experts, which were extremely
important in the development phase. Finally, we would like to thank Long Island Technology
Group for their industry support of the project.
2
Contents Abstract ......................................................................................................................................................... 3
Executive Summary .................................................................................................................................. 4
1.0 Introduction ............................................................................................................................................. 5
1.1 Problem Definition .............................................................................................................................. 5
1.2 Objective ............................................................................................................................................. 5
1.3 Design Specification ........................................................................................................................... 6
1.4 Prior Art Search .................................................................................................................................. 7
2.0 The Design Approach ............................................................................................................................. 9
2.1 Black Box Design ............................................................................................................................. 10
2.2 Design Alternatives ........................................................................................................................... 11
2.2.1 Concept 1: The Wrist Display Approach ................................................................................... 12
2.2.2 Concept 2: The two module approach ...................................................................................... 12
2.2.3 Concept 3: The Smartphone approach ....................................................................................... 13
3.0 Design of the Wearable unit.................................................................................................................. 13
3.1 Hardware Design .............................................................................................................................. 14
3.2 Software Design: ............................................................................................................................... 16
3. 3 Design Rationale .............................................................................................................................. 18
4.0 Evaluation ............................................................................................................................................. 20
ECG Acquisition ..................................................................................................................................... 21
Algorithm ................................................................................................................................................ 22
Lung sound Acquisition .......................................................................................................................... 23
Summary ..................................................................................................................................................... 24
References ............................................................................................................................................... 25
Justification and determination for 3-lead ECG in chest aid monitoring ................................................ 26

3
Abstract
Master of Engineering Program
School of Electrical and Computer Engineering
Cornell University
Design Project Report Project Title: Chest Discomfort Aid Author: Pooja Bangalore Ramachandra Abstract: Globally, cardiovascular diseases account for approximately 17 million deaths a year, nearly
one third of the total. Life threatening Cardiac events like Ventricular fibrillation, Angina, Arrhythmias as
well as minor events like gastro intestinal disorder all cause similar symptoms like shortness of breath,
dizziness ,palpitations etc. There is always an ambiguity among the patients when such symptoms are
experienced - if they require immediate medical care or is it just a false alarm. To overcome this, this project aims at building a system of self assessment that is safe, usable and provides actionable advice for
abnormal sensations in the chest. The product is aimed to be an over the counter, non-intrusive,
inexpensive and easy to use diagnostic device that provides continues monitoring over a period of 24
hours. The resulting device consists of 2 main units- the sensor (patch) and the display unit. The false
negatives should be less that 0.5% and should be regulatory complaint (FDA, IEC, UL). With this project,
we aim to provide personalized health advice to the user by providing long-term monitoring that
facilitates the capturing of sporadic events and produce actionable advice in real time.
Team: Literature Survey of the different causes of chest pain, Proposal of the design with
different sensing modalities, Prior Art search, Competitor review, Proposal of different business
models, Design and test of the components, Layout and the schematic of the design, Software
algorithm for classification and Development of Android app.
My Part: Literature Survey of the different causes of chest pain, Literature Survey of the different
causes of chest pain, Design and test of the components, Layout and the schematic of the design,
Software algorithm for classification
4
Executive Summary
Heart disease is the leading cause of death in the US. Every year, about 600,000 people die
of cardiac compilations and about 720,000 Americans have a heart attack. The coronary heart
disease alone cost the US $108.9 billion each year. Cardiac complication can affect any age
group and often occur without warning. We propose a device that provides continuous
monitoring to maximize the potential of detecting critical events and gives user the power to self-
assess any unusual sensations in the chest, informing users if they need to seek professional help
or not. This device focuses on collecting the maximum amount of data through non-invasive
methods to best guide the users with non-diagnostic advice their decision-making process.
The current standard of care for non-emergent medical situations is both costly and time-
consuming, filled with different exams and personnel before finally reaching a decision. This
tedious process sometimes deters individuals with mild/odd sensations to seek professional help,
which may lead to serious complication later on. On the other hand, individuals anxious about
their health are constantly visiting the ER from the slightest peculiar sensation, often clogging up
the treatment of more serious patients and are an economic burden for hospitals. To address both
categories of customers, this device provides continuous monitoring of four main non-invasive
metrics, ECG, acoustic lung sounds, spirometer and infrared measurements, to better inform
users when making health-related choices. A wearable component consists of continuous ECG
and lung sound monitoring while the stationary component consists of a spirometer and infrared
sensors. The system syncs with a smart phone and displays a list of parameters laying out risk
indicators, which customers can use to make decisions. Any abnormalities noted by the device
will be pushed to the user’s smart phone notification center, warning the user of possible
complications.
As a member of the seven member team, I worked with the whole team on the literature
survey and the design proposal. At the initial stage, we considered every possible solution to the
given problem and narrowed it down to include the most accurate and feasible measurements in
our design. We decided to start with the wearable part of the project, as it is can be used as a
standalone unit and as it was the minimum viable product to the market. Once the design was
narrowed down and finalized, I was a part of subgroup who concentrated on testing the
components, laying out the schematic and also working on the algorithm for classification of
ECG and lung sounds.
We successfully tested the components, acquired the signals, designed the app and
designed the layout of the PCB. The future work would be to fabricate the board and verify the
algorithm. After this stage, all steps should be taken to receive full approval for the device by the
FDA. Additionally testing will continue at every stage of development, both as part of the FDA
approval process as well as to ensure quality and manufacturing readiness of the device.

5
1.0 Introduction
A wearable, continuous ECG as well as acoustic monitor that will capture all the signals and advices the
user in terms of any abnormality has to be developed. This section will describe the problem, the
objective, design specification and the prior art search.
1.1 Problem Definition
When people use health services, around 150 million each year suffer severe financial hardship
because they have to pay out of their own pockets at the time they receive care, and 100 million
are pushed into poverty as a result. The annual cost of asthma in the USA is estimated to be $18
billion. If one considers the lost productivity of family members and others caring for these
individuals, the cost to society is far greater.Due to the Rural-Urban divide when it comes to
access to health care system, the distance becomes a limiting factor that hinders/obviates rural
folk, especially, from seeking timely medical interventions. And not being aware of the
symptoms that manifest when one is having, say, an arrhythmia which could lead to potential
cardiac complications, adds to the notion of I don’t know what it means, so I don’t care, which
down the line could result in avoidable health complications, increased medical expenses and
even loss of life.
Health care, in general, is therefore expensive, not easily accessible and user is unaware of
his/her health status. Devices that currently exist such as a Holter Monitor and Spirometer, are
expensive or prescription based, not easy or convenient to use, are not user-centric and don’t
apprise the user of the state of their heart and lung during use. Recently, we also have had a
wave of fitness devices, such as Fitbit™, that monitor and apprise user of non-critical parameters
such as steps taken, heart rate and calories burnt. But even these fail to address the gap that
currently exists when it comes to monitoring critical health parameters. Therefore we aim to
address these problem(s) by developing a system of self-assessment that is safe, usable and
marketable for abnormal sensations in the chest.
1.2 Objective
The goal of this is project is to design and develop a wearable, continuous monitoring device that
detects any abnormalities in the chest. The system should be able to acquire ECG data and lung
sounds, process the data and analyze it. It should be used upon the detection of any odd sensation
and should be worn up to 24 hours to catch any abnormalities in the measurements. The device
must be able to withstand everyday physical activity and be as comfortable and unobtrusive as
possible. The device must perform on par or better than the devices that exist today. It could be
used as an alternative to clinically available monitors, but would give actionable advice as well
as be more easy to use.

6
1.3 Design Specification
After extensive review of contemporary literature and technology on personalized medicine,
e-medicine and wearable technology, we were able to establish a set of fundamental
requirements for our device. In order to satisfy the needs of a wide range of demographics that
vary by age, cultural background and gender, the device would have to adhere to a list of both
very generic as well as very specific requirements. The generic requirements include qualities
like accuracy, sensitivity, hardiness, environmental compatibility, repeatability and efficiency,
while the specific requirements mostly focus on cultural acceptability across borders, user-
friendliness, comfort of use and aesthetic qualities.
A conceptual design is essentially ideal while actual design considerations are beset by trade-
offs. It is not possible to develop an ideal product while constraints are placed on time, cost,
technology and skill. Hence, while designing a product it is important to evaluate what are the
most essential characteristics the product or device needs to have, followed by other desirable
characteristics that it ideally should have. This method of thinking helps designers achieve real
goals while at the same time produce a high quality device. This analysis is also important
because the addition or enhancement of one desired feature may lead to the loss of another. A
good example for this is technology versus cost. In order to use the latest technology to prototype
a product providing the greatest technical value, a high amount of investment is required. Here,
cost becomes a constraint and hence a trade-off between technical enhancements versus cost
must be established. This method of analysis enables the developers to place the desirable
qualities in order of priority, which is a good guideline for design. Accordingly, while
conceptualizing the design, we grouped the highest priority requirements of the device under
“must-have” characteristics. The essential characteristics that under ideal conditions, will not be
sacrificed, but can be designed flexibly, would fall under “should-have” characteristics. Finally,
qualities that add to the value of the device but are not absolutely essential to the accurate
functioning of the device come under “can-have” characteristics. Accordingly, a table of ideal
device characteristics is presented here (Table 1):
Table 1
Must have Should have Could have Regulatory Compliance
FDA Approval
IEC
UL
Environmental Limits
Temperature-20-60°C
Humidity 0-100%
Waterproof to 10m
Drop-proof to 5m
Wearable Component
ECG/Acoustic
Hypoallergenic
100g Total Mass
Electrically Safe
LED/LCD Display
3 Day Storage Capacity
Aesthetically Pleasing
Compact
Intuitive
Rechargeable
Comfortable
Adaptable: Non-User
Specific
Wireless Sensor Network
Over-The-Counter
Works With Mobile Devices
Multi-Lingual Difficult To Reverse Engineer Medical System Integration User Specific Information Cloud-Based Data Continuous Monitoring Open Source Software Doctor Endorsement Web App/Interface FDA Class II Compliant

7
Can be worn up to 48hrs
Wireless
Non-wearable Component
500g Total Mass
Electrically safe
2 Day Battery Life
Life-threat warning within 30s
DoD- Level encryption
< 0.5% False Negative Rate
< 2% False Positive Rate
Noninvasive
Visual/Audio Output
<$100 Mfg. Cost Per Unit
1.4 Prior Art Search
The recent surge in wearable devices has prompted companies and individuals to increase the
number of patent fillings related to non-invasive health. However, these patents are usually
targeted at a specific system in the body such as cardiac or respiratory, with little feedback to
the user. Our device includes a wide range of parameters from different body systems to
provide the most comprehensive analysis possible with non-invasive measurements.
Currently, there is no patent that encompasses our product.
The following highlights relevant patents. These patents encompass parts of our product or
have similar traits or measuring techniques. All patents were found on the USPTO website
(http://www.uspto.gov/) with keywords: chest, cardiac, portable, wearable, ECG, monitor.
Patient-readable portable cardiac monitor (US 8774897)
Abstract
Systems and devices to gather data from a subject's heart, analyze said data to
determine whether the subject is experiencing cardiac arrhythmia, and display
results of said determining. Use, and display of cardiac condition information, are
preferably simple and unambiguous to untrained users
Assignee: Vernon N. Reaser, JR
Publish date: 7/8/2012
Wearable medical treatment device (US 8649861)
Abstract
A wearable treatment device includes a cardiac sensing electrode, a treatment
electrode, a user interface, and a sensor. The cardiac sensing electrode detects
cardiac information, and the treatment electrode applies treatment to a subject.
The user interface receives quality of life information from the subject, and the
sensor detects subject activity and wellness information. A controller coupled
with the cardiac sensing electrode, the treatment electrode, the user interface, and

8
the sensor receives the detected cardiac information, the quality of life
information, and the detected subject activity and wellness information, and
determines that treatment is to be applied to the body of the subject based upon
the detected cardiac information. The controller can adjust the treatment based on
at least one of the detected subject activity and wellness information and the
quality of life information.
Assignee: Zoll Medical Corporation
Publish date: 2/11/2012
Health monitoring appliance (US 8747313 B2)
Abstract
A heart monitoring system for a person includes one or more wireless nodes; and
a wearable appliance in communication with the one or more wireless nodes, the
appliance monitoring vital signs.
Assignee: Bao Tran
Publish date: 6/10/2014
Electronic skin patch for real time monitoring of cardiac activity and personal health
management (US 8734339 B2)
Abstract
A novel wearable electronic skin patch sensor device configured for the real time
acquisition, processing and communicating of cardiac activity and other types of
biological information within a wired or wireless network is disclosed. A system
level scheme for networking the sensor device with client devices that include
intelligent personal health management appliances, cellular telephones, PDAs,
portable computers, personal computers, RFID Tags and servers is disclosed. The
sensor device and the system enable distributed processing, archival and
correlation of the biological information with biometrics, gastronomic
information, user profiles and health factors that include height, weight, blood
pressure and physical activity facilitating real time personal health management at
any time and any place.
Assignee: Ip Holdings, Inc.
Publish date: 5/27/2014
Non-invasive cardiac monitor and methods of using continuously recorded cardiac data
(US 8150502 B2)
Abstract
Embodiments of the invention provide methods of obtaining continuous cardiac
information from a mammal. First, attach a self-contained, wearable, portable
continuous cardiac monitor to the mammal to create a chamber containing
electrodes used to detect cardiac signals from the mammal. Next, continuously
detect without analyzing the cardiac signals from the mammal for at least 24
hours. Next, store information related to substantially all detected cardiac signals
in the cardiac monitor.
Assignee: Board of Trustees of Leland Stanford Junior University
Publish date: 4/3/2012
9
Systems and methods for processing and displaying patient electrocardiograph data (US
8798734 B2)
Abstract
A method is disclosed for displaying patient ECG data. The method includes
receiving ECG data including an ECG waveform; receiving analyzed ECG data
including arrhythmic events; generating an indicia of the detected arrhythmic
event; and displaying the indicia of the detected arrhythmic event in relation to
the ECG waveform at a position associated with a time of the detected arrhythmic
event. A system for displaying patient ECG data is also disclosed.
Assignee: Infobionic Inc.
Publish data: 8/5/2014
Summary
Although wearable devices and personal health are gathering immense interest in the market, there is no
existing product that addresses the central problem of modern healthcare. Consumers want to know more
about their health and have actionable data to make health decisions. Medical devices do not provide user
feedback and are difficult to gain access to without previous history. Fitness products give very little
feedback with limited medical significance and only monitor a few metrics. Consumers need a hybrid
device that provides actionable feedback and real health benefits. It should be safe, accessible, and easy-
to-use. This gap in the market is what our device is trying to address. Our device seeks to provide users
with understandable medical data that they can use to make informed decisions.
2.0 The Design Approach
Our design approach starts with a black box model. We first identified the problem and came up
with a possible solution and based on our literature review and market needs, we came up with
the baseline design which included all the measurements, all the outputs needed and all the
functionalities required for the design. Hence the design process was evolutionary in nature and
not the conventional approach. The proposed alternatives were combination of different modules
of the baseline design and are not discreet designs by themselves. The different proposed
alternative designs all have the same functionalities but different modules which were based on
different factors like usability, costs etc.

10
2.1 Black Box Design
Figure 1: Black Box
The black box model of our design is as shown above. The inputs for the device will be the
signals from the wearable component that is the ECG signal and the Acoustic Signal. These
Signals are analyzed in the wearable part and then transmitted to the display and handheld unit.
The other two inputs are Spirometer and Infrared Readings from the handheld device. The output
of the device is the display of certain physiological parameters like the heart rate, the audio and
visual alarm in case of emergencies and the transmission of data to cloud which can be accessed
by the physician so that it can be monitored regularly.
Block Diagram
Figure 2: Block Diagram
The Block diagram of the system is as shown in Figure 2. The main components of the device
are the power, sensing, analysis, communication and the recording units.
Power: Since the design proposed has a continuous monitoring wearable unit, Power
management will be crucial. The options considered are rechargeable batteries and
disposable batteries that are compact like the Lithium Ion and Nickel Cadmium batteries.
Sensing unit: The sensing units will have ECG electrodes and an electret microphone on
the wearable unit and an LED and a compact spirometer on the handheld device.
Analysis: The sensors reads the data, analyzes it and using this data, the physiological
parameters are calculated by the algorithms running on an ARM-Cortex based

11
microcontroller. This data from the microcontroller is then transferred to the wrist display
and the hand held device through a Bluetooth module.
Communication: The communication between the sensor and the hand held device and
the wearable unit will be through a Bluetooth module. Also, the data collected will be
uploaded to a cloud storage which can be accessed by the physician.
Recording unit: The microcontroller alone does not have enough capacity to hold all the
important recorded information. For additional storage, there will be an SD card on the
device which stores all the necessary information which can later be transmitted to a PC .
In addition to this, the important information about the variations in the physiological
parameters will be uploaded to cloud storage.
ECG and Acoustic data has to be monitored continuously to get accurate information and predict
abnormalities like arrhythmias. It has to be on a wearable unit to get continuous readings. The
blood Pressure measured by IR and the lung volume given by the spirometer does not give
information about life threatening events and need not be monitored continuously1. Hence we
propose three separate units for the device – The first one is the wearable unit that can be worn
like a patch and consists of ECG and Acoustic sensors and the second is a sleek handheld device
that has the ability to analyze, record, transmit and display the data and the third unit is a
wearable wrist display unit that only displays the important parameters and gives out alarm in
case of emergencies.
2.2 Design Alternatives
Based on the extensive literature Review and after considering many design alternatives, we
shortlisted three different design concepts. They all have same functionalities but slightly differ
in their specifications. They are - Concept one (The wrist display approach), Concept two (The
two modules approach), Concept three (The smart phone approach). Fig 11, 12 and 13 are the
mockups we designed and we visualize our end products to be similar. After designing these
modules, we plan to fabricate them with a 3D printer or get it fabricated by an external
manufacturer. Table 2: Design Concepts
12
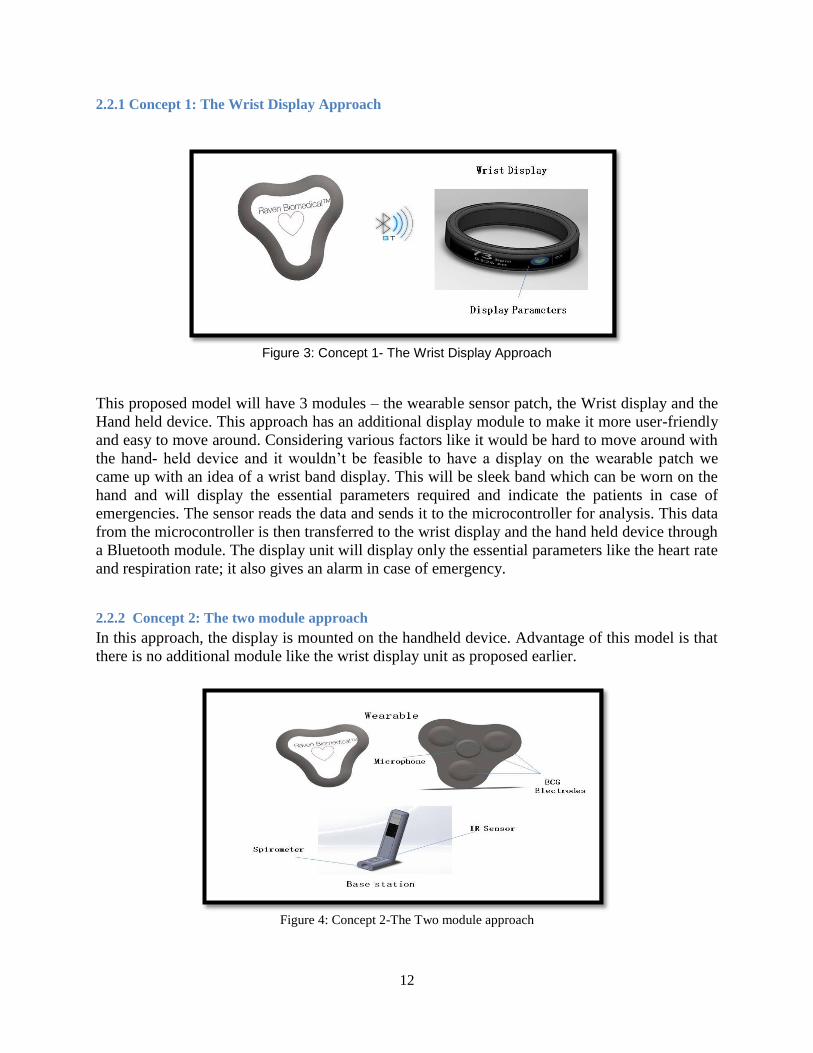
2.2.1 Concept 1: The Wrist Display Approach
Figure 3: Concept 1- The Wrist Display Approach
This proposed model will have 3 modules – the wearable sensor patch, the Wrist display and the
Hand held device. This approach has an additional display module to make it more user-friendly
and easy to move around. Considering various factors like it would be hard to move around with
the hand- held device and it wouldn’t be feasible to have a display on the wearable patch we
came up with an idea of a wrist band display. This will be sleek band which can be worn on the
hand and will display the essential parameters required and indicate the patients in case of
emergencies. The sensor reads the data and sends it to the microcontroller for analysis. This data
from the microcontroller is then transferred to the wrist display and the hand held device through
a Bluetooth module. The display unit will display only the essential parameters like the heart rate
and respiration rate; it also gives an alarm in case of emergency.
2.2.2 Concept 2: The two module approach
In this approach, the display is mounted on the handheld device. Advantage of this model is that
there is no additional module like the wrist display unit as proposed earlier.
Figure 4: Concept 2-The Two module approach

13
The wearable unit will transfer the data to the handheld device. The hand held device will house
the spirometer and the infrared sensors. The hand held device will also analyze the data and run
the classification algorithms on it. The result will be displayed by the LCD unit on mounted on
the handheld device. There is also an option of transferring the data to a PC through an USB port
on this unit. In case of detection of abnormalities, the data is transferred directly to the cloud, so
that a physician can access it quickly.
Since the display is on the hand-held device, the patient has to carry around the hand-held device
to view and monitor the parameters. But it also gives information about the spirometer and the
IR readings on the go, which can be useful for many patients. So there is a significant tradeoff
between the first proposed model and this model.
2.2.3 Concept 3: The Smartphone approach
Figure 5: Concept 3 The Smartphone approach
This proposed model is a portable ECG and Acoustic monitor based on a Smartphone App. The
wearable unit will collect the ECG and Acoustic readings and transmit it to the smart phone
through a Bluetooth module for analysis and storage. The App designed for this purpose will run
the filtering and detection algorithms to detect the variations in the parameters and detect
abnormalities. In case of detection of any abnormalities, the app will transfer the data to the
physician and also alert the patient2.This model will have only one module that is the wearable
unit. This model will be cost effective since it includes only the wearable unit. Since almost
everyone is familiar with the use of the Smartphone, this model will be handy and very easy to
use.
3.0 Design of the Wearable unit
The Wearable Unit
The wearable unit consists of a chest patch that acquires the ECG and the lung sounds and
processes this data, classifies them and transmits it to a smart phone app over Bluetooth. The
processing includes amplification of the low level signals, filtering out all the unwanted noise
signals and passing it though an interpretative algorithm. The output of this stage is passed to a
14
Bluetooth low energy module (BLE) which, then wirelessly transmits the data to the smart phone
app. This app displays the information to the user.
3.1 Hardware Design
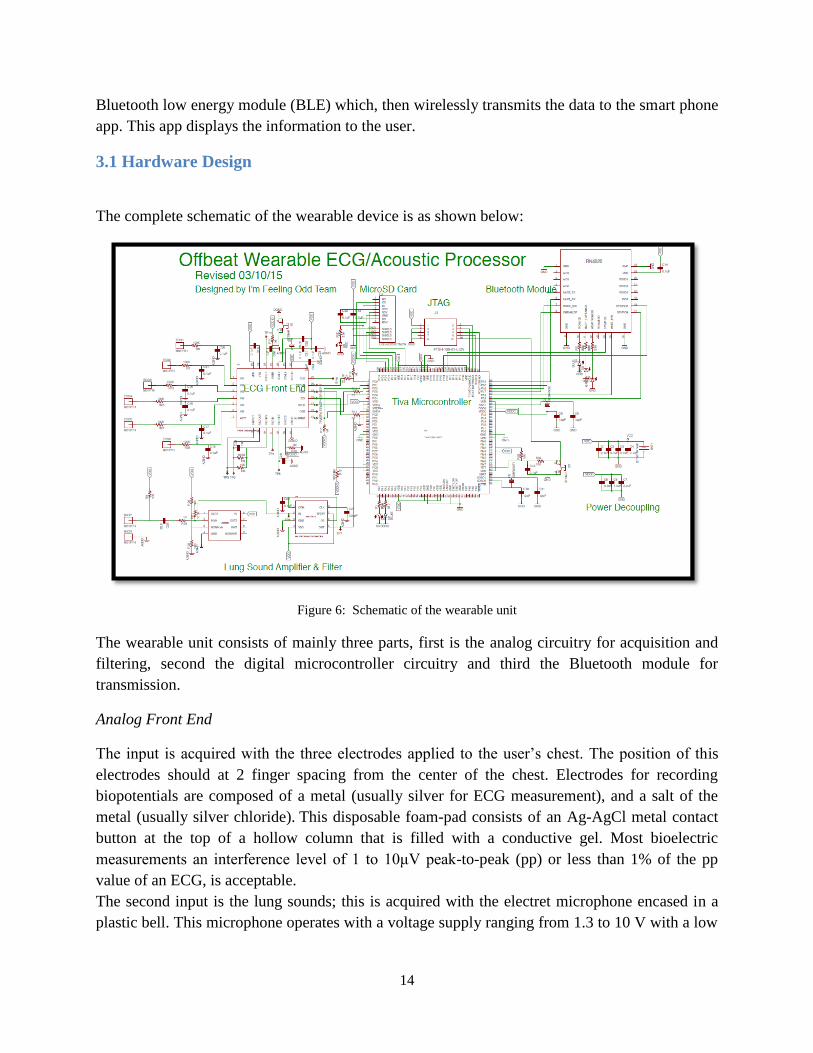
The complete schematic of the wearable device is as shown below:
Figure 6: Schematic of the wearable unit
The wearable unit consists of mainly three parts, first is the analog circuitry for acquisition and
filtering, second the digital microcontroller circuitry and third the Bluetooth module for
transmission.
Analog Front End
The input is acquired with the three electrodes applied to the user’s chest. The position of this
electrodes should at 2 finger spacing from the center of the chest. Electrodes for recording
biopotentials are composed of a metal (usually silver for ECG measurement), and a salt of the
metal (usually silver chloride). This disposable foam-pad consists of an Ag-AgCl metal contact
button at the top of a hollow column that is filled with a conductive gel. Most bioelectric
measurements an interference level of 1 to 10μV peak-to-peak (pp) or less than 1% of the pp
value of an ECG, is acceptable.
The second input is the lung sounds; this is acquired with the electret microphone encased in a
plastic bell. This microphone operates with a voltage supply ranging from 1.3 to 10 V with a low

15
amplifier current drain of 50 µA, provides a flat frequency response between 50 and 3000 Hz,
and offers advantages in terms of high durability compared to contact sensors3.
Amplification and Filtering
The ECG signal acquired is filtered, amplified and converted to digital format in the Texas
Instruments©
ADS 12934.The amplification of the lung sounds is carried out using the traditional
audio amplifier LM358N5. A fixed gain of 100x is applied to amplify the signals from mV to V
for compatibility to the microcontroller. This signal will be further filtered to remove the
electrode noise and the power line noise. A bandpass filter with cut off of 100Hz and 1500Hz
was designed using the six order maxim filter.
Signal Processing
The amplified and filtered signal from the microphone and the digital signals from the ADS1293
are fed into the microcontroller through the ADC (analog to digital converter) and SPI ( Serial
Port Interface) respectively. The basic function of the microcontroller is to further amplify,
digitize and filter the acquired signals. The TIVA©
Driver library is used to program the
microcontroller.
Bluetooth module
The transmission of the processed signal is done with the help of a Bluetooth low energy
module. RN220©
is used as the Bluetooth module6; this is chosen as the power consumption is
minimum compared to other the Bluetooth devices7.
Power supply unit
A Coin Cell - CR2032 lithium ion battery8 is used to power the system. It has a capacity of 250
mAH at 3V and is 20mm by 3.2cm. The battery is placed at the bottom of the board and can be
secured with medical tape during testing.
SD card and JTAG
A SD (Secure Digital) card is used to store the data for a period of time. SD card is used as
opposed to a flash memory as it is flexible for expansion in the future.
A JTAG (Joint Test Action Group) port is added to the device for debugging purposes and is also
used for programming the microcontroller as well the ADS 1293.
Output
The microcontroller transfers the data to the Bluetooth module using UART (Universal
Asynchronous Receiver/Transmitter). The signal from the Bluetooth module is then transmitted
to the Android app that alerts the user in case of any abnormalities.

16
3.2 Software Design:
Figure 7: Software Implementation
The microcontroller acquires the input signals from its peripherals and in the next stage it
performs additional digital filtering, feature extraction and then feeds it to the classification
algorithm. When there is no data at the input, the microcontroller is put to ‘Sleep’ mode to
reduce power consumption. A watchdog timer will look out for the inputs at its peripherals and
‘wake’ the microcontroller up when necessary.
Algorithm for classification:
The classification algorithm consists of 3 stages.
1. Preprocessing
2. Feature Extraction
3. Feature Reduction
4. SVM Classifier
We use the MIT Arrythmia database10
to train the data we obtain. This source has over 4000 long
term Holter recordings. Each of the records is slightly over 30 minutes long. This database is
considered as the gold standard and has been proved very accurate in many research projects
over the years9.
17
Preprocessing
At the preprocessing stage, we filter out the additional noise with the appropriate cutoff values of
the digital filters. The main categories of noise are: low-frequency baseline wander caused by
respiration and body movements, high-frequency random noises caused by mains interference
(50 Hz, 60 Hz) and muscular activity, and random shifts of the signal amplitude caused by poor
electrode contact and body movements.
Feature Extraction
The important features of the signal that are used for classification are extracted from the raw
signal. The Pan Tomkins algorithm10
was used for the selection of QRS complex from the raw
ECG signal. This algorithm gives us a pulse train of extracted features and this can be used for
the classification purposes as the different conditions shows different characteristic features. The
algorithm’s source code is available as open source released under the clause-3 BSD license.
Feature Reduction
A large amount of data that is obtained from the feature extraction stage. This can be reduced by
application of principle component analysis which reduces the number of features that is
repeated over a period of time and gives out only the significant morphological variations of the
signal.
SVM classification
Support vector machines are supervised learning models with associated learning algorithms that
analyze data and recognize patterns, used for classification and regression analysis. Given a set
of training examples, each marked as belonging to different categories, an SVM training
algorithm builds a model that assigns new examples into one category or other, making it a non-
probabilistic new examples into one category or the other, making it a non-probabilistic binary
linear classifier11
.We use multiclass SVM which aims to assign various labels to instances by
using support vector machines. This source code is available as open source released under the
clause-3 BSD license.
At the end of this stage the output obtained is the classified data suggesting the category a
particular signal. This is then transmitted to the app by the Bluetooth module. The user interface
for this model is the android app. This app lets the user input the basic parameters required for
establishing the baseline like age, weight, height, gender etc and provides an actionable advice to
the user by indicating that something is wrong when an abnormality is detected.

18
3. 3 Design Rationale
The design of the device followed an evolutionary approach rather than by elimination. The first
stage was identification of all measurements that detected discomfort in the chest. Next step was
to verify how closely each of these measurements meets the design specification.
The most common non invasive measurements were
1. ECG
2. Lung sound
3. GI
3. Ultra sound
4. Infrared
5. Spirometry
The factors that affect our design are mostly – portability, feasibility of the measurement, cost,
simplicity and the impact of measurements (the number of conditions each of these
measurements can capture). Each of these factors was associated with a weight depending upon
its influence on the design. Then each of the measurements were rated based on how closely it
related to our desired design goal (A rating of 10 indicates that it matches our design goal
completely). For example, cost of measuring ECG is around 40$, whereas cost of an Ultrasound
unit will be around 150-300$. Hence ECG receives a rating of 9 on Cost and Ultrasound receives
a 3 as we want the whole devices to cost under 200$. Similarly, this table was constructed for all
the measurements and design requirements.
Table 3
Factors Weig
ht
Measurements
(Rating form 1-10)
ECG Lung
sound
GI Ultras
ound
Infrared Spirometry
Feasibility 0.20 8 8 1 3 10 6
Portable 0.20 9 9 2 3 10 8
Simplicity/Compo
nent Requirements
0.10 8 9 1 3 9 7
Cost 0.25 9 9 5 3 9 7
Impact of
Measurement
0.25 9 9 5 5 7 8
Weighted Sum 9.1 8.5 3.25 3.8 8.9 7.05
Based on the numbers from the table, Ultrasound was eliminated as it was not feasible, not
portable and it was difficult to implement and did not fit into the specification of the device. GI
had mostly invasive techniques for measurements and did not meet the design specifications that
19
well, Hence it was also eliminated. Thus the 4 modalities – ECG, Lung sounds (Acoustic),
Infrared and spirometry was chosen as it gave out the maximum information that was required to
detect abnormalities in the chest, fitted into the specification of the device and also improved the
accuracy of the device.
Initial Module
The Smartphone model of the 3 proposed models was chosen on the basis of its feasibility. It
also gives out the most important information needed for the detection of abnormalities (ECG
and Lung sounds). Also, it is the minimum viable product to the market. Based on the usability
and user feedback, the complete, improved module can be developed in the later stage.
Sensor Selection
ECG sensors- Ag/Agcl are well known for its safety, accuracy and reliability12
.Hence this was
most suitable for the device. For the acquisition of lung sounds, based on our literature survey,
three most common types of sensors were used – Condenser microphone, Dynamic microphone
and Piezo microphone13
. The best sensor that met our end design goal had to be chosen.
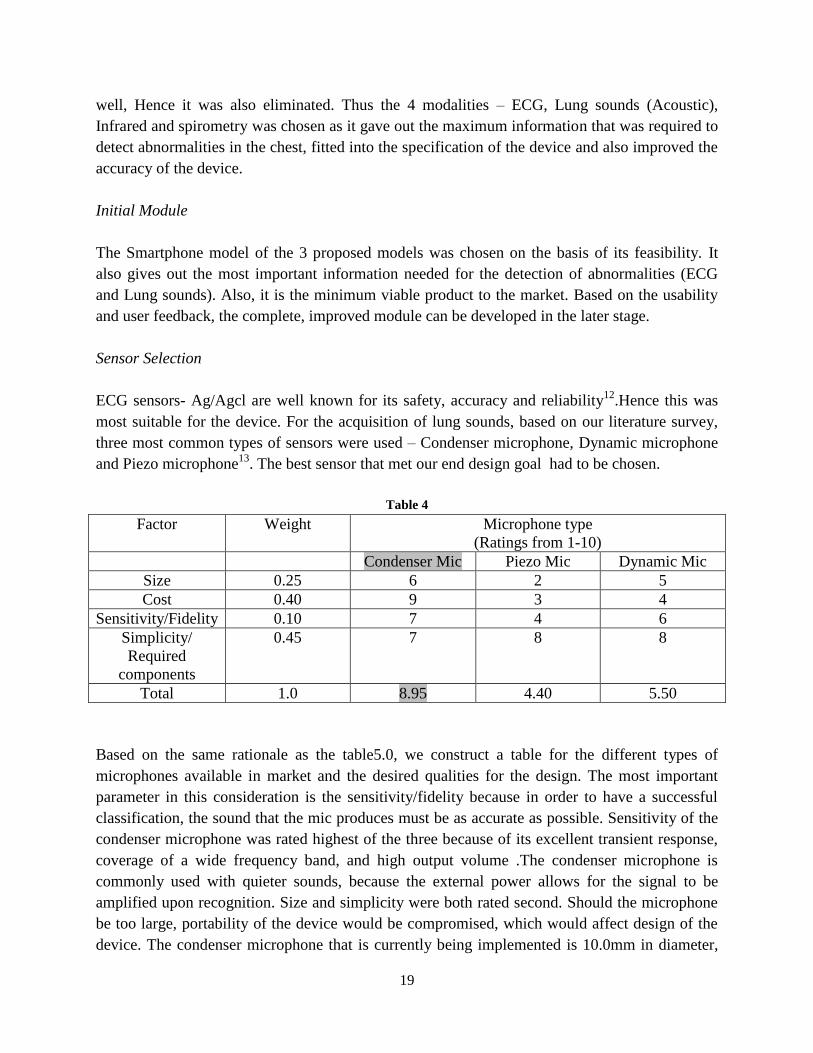
Table 4
Factor Weight Microphone type
(Ratings from 1-10)
Condenser Mic Piezo Mic Dynamic Mic
Size 0.25 6 2 5
Cost 0.40 9 3 4
Sensitivity/Fidelity 0.10 7 4 6
Simplicity/
Required
components
0.45 7 8 8
Total 1.0 8.95 4.40 5.50
Based on the same rationale as the table5.0, we construct a table for the different types of
microphones available in market and the desired qualities for the design. The most important
parameter in this consideration is the sensitivity/fidelity because in order to have a successful
classification, the sound that the mic produces must be as accurate as possible. Sensitivity of the
condenser microphone was rated highest of the three because of its excellent transient response,
coverage of a wide frequency band, and high output volume .The condenser microphone is
commonly used with quieter sounds, because the external power allows for the signal to be
amplified upon recognition. Size and simplicity were both rated second. Should the microphone
be too large, portability of the device would be compromised, which would affect design of the
device. The condenser microphone that is currently being implemented is 10.0mm in diameter,

20
by 5.0mm in depth, pretty small to maintain portability of the device. The Piezo Mic is the most
expensive among the three and also it is least sensitive than the other two. Hence the numbers
show that the condenser microphone is the best option for the device.
Algorithm
Compared to the other most commonly used algorithms for classification, like the
MLP(Multilayer Perceptron) , Hybrid, TSK and SVM 14
. SVM (Support Vector Machine) was
proven to be most accurate (97.3%) had least number of misclassification in many research
papers17
. In addition to this, the simplicity and the intuitiveness of the algorithm was the main
reason for selection in the device15,16
.
Output
The way the information of the device is conveyed to the user plays a very important part in
deciding which class the device will belong to according to the FDA classification. In order to
avoid regulatory issues, the app was developed in such a way that it advices the user the degree
of urgency in contacting the physician and the percentage of potential risk with respect to the
chest. Based on this advice, the user can make a decision - if there is an immediate need to visit
the physician. The physician will have access to all the data that is recorded, based on which he
can take appropriate action. The app will have the same output universally until there is a scope
of improvement which can be analyzed based on both user and physician feedback.
4.0 Evaluation As the device complete prototype is being finalized, the testing of the hardware and the individual circuits
is discussed in this section. The complete setup for the acquisition of the ECG signal and the Lung sound
is as shown in the figure 8.
Figure 8. The Complete Setup

21
ECG Acquisition
We make use of the chip ADS129318
form Texas Instruments©
which is an analog-front-end (AFE) IC.
The TI AD1293 can support one to 5 leads with a single AFE. We acquire 3 lead signals in this design
appendix. This is ideal chip for our device because of its size (5mm*5mm), low power consumption and
cost. The functional block diagram of the chip as shown in the figure 9.
Figure 9. Block Diagram of ADS1293
This chip features three high – resolution channel with data rate upto 25.6 ksps capable of operating up to
25.6 ksps. In this configuration, the right-arm (RA), left-arm (LA), left-leg (LL) and right-leg (RL)
electrodes are connected to the IN1, IN2, IN3 and IN4 pins. It incorporates EMI filters to reduce power
line interference and an instrumentation amplifier and an ADC to amplify and convert the acquired ECG
signal to Digital values. This data can be transmitted over Serial Port Interface. The acquired ECG signal
was collected for about 10 seconds and around 15 heartbeats were observed with the signal to noise ratio
of around 110 dB .The acquired ECG signals from the ADS1293 are as shown in figure 10.
Figure 10. Acquired ECG signal (Texas Instruments Software)
22
Algorithm
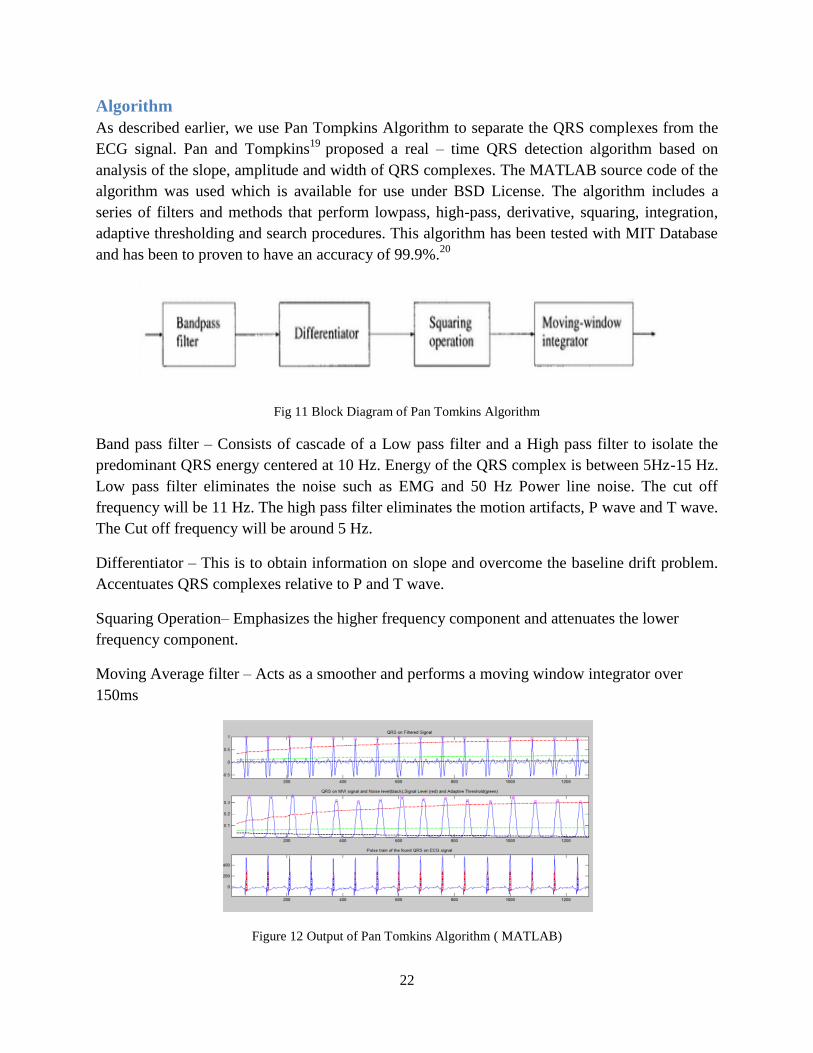
As described earlier, we use Pan Tompkins Algorithm to separate the QRS complexes from the
ECG signal. Pan and Tompkins19
proposed a real – time QRS detection algorithm based on
analysis of the slope, amplitude and width of QRS complexes. The MATLAB source code of the
algorithm was used which is available for use under BSD License. The algorithm includes a
series of filters and methods that perform lowpass, high-pass, derivative, squaring, integration,
adaptive thresholding and search procedures. This algorithm has been tested with MIT Database
and has been to proven to have an accuracy of 99.9%.20
Fig 11 Block Diagram of Pan Tomkins Algorithm
Band pass filter – Consists of cascade of a Low pass filter and a High pass filter to isolate the
predominant QRS energy centered at 10 Hz. Energy of the QRS complex is between 5Hz-15 Hz.
Low pass filter eliminates the noise such as EMG and 50 Hz Power line noise. The cut off
frequency will be 11 Hz. The high pass filter eliminates the motion artifacts, P wave and T wave.
The Cut off frequency will be around 5 Hz.
Differentiator – This is to obtain information on slope and overcome the baseline drift problem.
Accentuates QRS complexes relative to P and T wave.
Squaring Operation– Emphasizes the higher frequency component and attenuates the lower
frequency component.
Moving Average filter – Acts as a smoother and performs a moving window integrator over
150ms
Figure 12 Output of Pan Tomkins Algorithm ( MATLAB)

23
The output of the Pan Tomkins algorithm will give us a train of QRS complexes. The Hermite
coefficients were then calculated to obtain the features for the training data of the SVM.
Different labels will be then assigned to each of the different 17 conditions and the input will be
trained against this data and output will correspond to the label of the input signals.
Lung sound Acquisition
The lung sounds were acquired with the help of a electrets microphone. This microphone was enclosed in
a stethoscope tubing to reduce the effects of the atmospheric noise and amplify the signal. The input was
taken from the trachea for testing purposes. This signal was then preamplified using LM358p and then the
passed through the a bandpass filter with cutoffs 100Hz and 1000 Hz. This will filter out all the low
frequency signals like the electrode noise , heart sounds and also the atmospheric high frequency signals.
This signal is then passed through NI DAQ for further analysis in LabVIEW. The real time acquisition of
the lung sounds is as shown in the figure 13.
Figure 13. Acquisition of Lung sounds
This signal was then further amplified and filtered in LabVIEW and the frequency domain analysis was
done to obtain the spectrograph of the lung sounds, with this we were able to analyze the dominant
frequencies of each of the conditions and analyze their variations. The RALE repository was used to
obtain the waveforms for different lung conditions like wheezes, crackles, ronchi and pneumonia The
output spectrographs for each of the conditions is as shown in the following figures.
Figure 14. The lung conditions and their
corresponding spectrographs ( LabVIEW)

24
Summary
Our design is specifically targeted at a major problem in the healthcare chain. The healthcare system
needs a device that helps users make the right decision when facing a medical situation, helps physicians
prioritize their schedule and make doctor-user interaction easier, helps hospitals and insurance companies
save cost on unnecessary visits. Our design targets all of the criteria necessary for optimizing the
healthcare chain. We believe it benefits every party and does not try to exclude or bypass any stakeholder
from the current chain.
The device gives users a third-party view in addition to what they might be experiencing and what their
friends and family are suggesting, and it gives a peace of mind to the user when they know the device is
monitoring them continuously throughout the night. The device give doctors the option of monitoring the
user remotely rather than keeping them in the hospital overnight, and allow for preventative intervention
when an abnormality is detected, even before the user calls the physician’s office. Also, the doctors can
now actively schedule their appointments based on real-data rather than a simple 6-month checkup with
no user feedback in between. From an economical perspective, the device help hospitals and insurance
companies save significant resources when dealing with individuals without medical coverage and
healthy hypochondriacs. The team plans to make a commercial product under the company name Raven
Biomedical after the initial prototype is complete -My contribution to the prototype being the hardware
design and testing, schematic layout and the classification algorithm .With this product, the tedious
process from diagnosis to treatment could be shorted significantly at lower costs to each party. This is the
start of a new era in healthcare.
25
References
[1] SPIROMETRY FOR HEALTH CARE PROVIDERS Global Initiative for Chronic Obstructive Lung
Disease (GOLD)
[2] Www.ijecs.in. ANDROID BASED PORTABLE ECG MONITOR
[3] Reyes, Bersain A., Natasa Reljin, and Ki H. Chon. "Tracheal Sounds Acquisition Using
Smartphones." Sensors 14.8 (2014): 13830-13850.
[4] HE, Lingli, et al. "Design of an Acquisition System for Portable and Low-power ECG Based on the
ADS1293."
[5] http://www.ti.com/lit/ds/symlink/lm158-n.pdf
[6] http://www.ti.com.cn/general/cn/docs/lit/getliterature.tsp?baseLiteratureNumber=spmu298&fileTy
pe=pdf
[7] http://ww1.microchip.com/downloads/en/DeviceDoc/rn-bt-srl-um-1.0r.pdf
[8] Wong, Alan, et al. "A 1V 5mA multimode IEEE 802.15. 6/bluetooth low-energy WBAN transceiver
for biotelemetry applications." Solid-State Circuits Conference Digest of Technical Papers
(ISSCC), 2012 IEEE International. IEEE, 2012.
[9] https://www.sparkfun.com/products/338
[10] Moody, George B., and Roger G. Mark. "The impact of the MIT-BIH arrhythmia database."
Engineering in Medicine and Biology Magazine, IEEE 20.3 (2001): 45-50.
[11] Pan, Jiapu, and Willis J. Tompkins. "A real-time QRS detection algorithm."Biomedical
Engineering, IEEE Transactions on 3 (1985): 230-236.
[12] Clifford, Gari D., and Francisco Azuaje. Advanced methods and tools for ECG data analysis.
London: Artech house, 2006.
[13] Gruetzmann, Anna, Stefan Hansen, and Jörg Müller. "Novel dry electrodes for ECG monitoring."
Physiological measurement 28.11 (2007): 1375.
[14] Drew Birrenkott . “HEART & BREATH SOUNDS AMPLIFIER”. University of Wisconsin-
Madison(2011)
[15] Clifford, Gari D., and Francisco Azuaje. Advanced methods and tools for ECG data analysis.
London: Artech house, 2006.
[16] Arora, Sandhya, et al. "Performance comparison of SVM and ANN for handwritten devnagari
character recognition." arXiv preprint arXiv:1006.5902(2010).
[17] Mohandes, M. A., et al. "Support vector machines for wind speed prediction."Renewable Energy
29.6 (2004): 939-947.
[18] http://www.ti.com/lit/ds/symlink/ads1293.pdf
[19] Hundewale, Nisar. "The application of methods of nonlinear dynamics for ECG in Normal Sinus
Rhythm." Int. J. of Computer Science 9 (2012): 458-467.
[20] Clifford, Gari D., and Francisco Azuaje. Advanced methods and tools for ECG data analysis.
London: Artech house, 2006.

26
Appendix
Justification and determination for 3-lead ECG in chest aid monitoring
ECG (electrocardiogram) is the current “gold standard” for cardiac event measurement and pathological
diagnosis. Computer programs for interpretation of ECG signals have been optimized to yield accuracy
and diagnostic value comparable to that of cardiologists 1. In clinical evaluation setting, 12-lead ECG has
been a routine method for clinicians to make the decision whether a patient shall be sent to the emergency
room (ER) or not. The accuracy in pre-hospitalization diagnosis by ECG would help in saving time for
determining the optimal treatment as well as directing more sophisticated diagnosis. Here we justify the
necessity and reliability of using ECGs with reduced lead number (three) for pre-hospital diagnosis rather
than anatomically applicable and skill-required 12-lead ECGs.
Introduction
The critical need for 12-lead ECG arises from its diagnostic value in ST elevation myocardial infarction
(STEMI) 2, one major type of coronary artery disease (CAD, also termed ischemic heart disease). STEMI
is now the no.1 killer in the U.S. as well as globally 3 and makes up for 25%~40% of the patients
diagnosed with acute myocardium infarction (AMI) in U.S, slightly lower than NSTEMI annually 4. Even
with lower prevalence than angina pectoris, another subtype of CAD, AMI has a much higher morbidity,
especially in males diagnosed with CAD 5. Even though, STEMI has caused millions of death and is
expected to continue to cause more patients to die in the coming future.
Discussion
The reason why some clinicians emphasize the importance of a 12-lead ECG for diagnosis is that if there
is any possibility of STEMI in patients, it could lead to more accurate evaluation and prepare both the
patients and the physicians for necessary acute treatment since not all the hospitals would be equipped
with techniques to treat such disease 6,7
. Tough a 3-lead ECG can also detect abnormality ST segment
elevation, decreased detection rate and duration of ST episode limits its diagnostic value in ischemia 11
.
It is worth considering that even with a 12-lead ECG, additional tests such as X-ray are still required for
diagnostic decision and improvement after the primary treatment 8. And even for STEMI, a 12-lead ECG
can still lead to measurement with false. For other cardiac conditions, a 12-lead ECG provided less
consistency with the clinical findings in detecting abnormalities than a 3-lead ECG, suggesting a higher
false positive or negative for 12-lead ECGs 8.
Moreover, when we target elder individuals, such as those who are over 55 or 60, a 12-lead ECG is
expected to have decreased benefit. A 12-lead ECG requires more time is more difficult to determine and
thus is hard for patients to self-administer 9. Thus a 12-lead device appears to be less desirable (then a 3-
lead design) for daily monitoring especially for elder people or people with certain disabilities.
From the prevalence use of 3-lead ECGs in portable medical devices and during patient transport to the
ER, no technical problems having been reported in most medical diagnosis or tests and no clinical

27
difference has been observed between a 12-lead ECG and a 3-lead one. There are previous clinical
researches studying the correlation between 3-lead and 12-lead ECG in diagnosis, which sometimes draw
contrary conclusions10 11 12 13
. However, after proper transformation and recovery of raw signals collected
by the 3-lead ECG, a 12-lead ECG-similar output can be achieved in many studies 14
.
Diseases that can be diagnosed by 3-lead ECG include right atrial enlargement, advanced interatrial
block, advanced superoanterior hemi- and bifascicular block, inferior myocardial infarction, valve
prolapse and some other common cardiac diseases 15
. According to the significant overlap of efficacy
between 12-lead and 3-lead ECG in disease detection and diagnosis, using 3-lead ECG in Offbeat, for
simplicity, seems a reasonable choice.
For commercialized cardiac monitors, the implanted ECGs with reduced leads are of much more
convenience for customers in applying, adjusting and detaching the product. Many current cardiac
monitoring (or diagnostic) products use single-lead ECG. In such case, the products are limited to
detecting merely one disease 16
. Some other conditions including atrial fibrillate (which can be detected
even by a 2-lead ECG), AV conduction block and etc. could be missed with these products.
Summary
A 3-lead ECG has multiple superiorities over the single-lead ECG and shows considerable
competitiveness in monitoring cardiac events as a 12-lead ECG does (Table 1.). Accordingly, Offbeat
uses 3-lead ECG for detecting and diagnosing for cardiac disorders.
ECG
type
Pros Cons
3-lead
ECG Convenience to USE
Considerable diagnostic information for
most cardiac diseases
Higher cost-efficiency *
Poor performance in specifying
MI subtypes
Less information
12-lead
ECG Detailed information for pre-hospital
diagnosis
Better performance in specifying MI
subtypes
Complexity for placing
More difficult in designing and
manufacturing
Table 1. Pros and cons of 3-lead and 12-lead ECG.