CHESAPEAKE BAY RESTORATION SPENDING ROSSCUT · FY 2017 Chesapeake Bay Restoration Spending Crosscut...
30
CHESAPEAKE BAY RESTORATION SPENDING CROSSCUT Report to Congress Office of Management and Budget December, 2016
Transcript of CHESAPEAKE BAY RESTORATION SPENDING ROSSCUT · FY 2017 Chesapeake Bay Restoration Spending Crosscut...

CHESAPEAKE BAY RESTORATION SPENDING CROSSCUT
Report to Congress
Office of Management and Budget
December, 2016

1
The Chesapeake Bay Watershed
FY 2017 Chesapeake Bay Restoration Spending Crosscut
This report represents an accounting of Federal and, to the extent available, State, funding for Chesapeake Bay restoration activities.
This report is provided to Congress in response to Section 3 of the Chesapeake Bay Accountability and Recovery Act (CBARA) of 2014.
The Fiscal Year (FY) 2017 Budget continues the Administration’s commitment to Chesapeake Bay environmental restoration by requesting $482 million
for high priority programs and projects in the Chesapeake Bay Watershed. FY 2017 funding levels will allow for robust restoration efforts, in reflection of
the region’s environmental significance.
2
This crosscut presents information on Federal funding from FY 2014 enacted through the FY 2017 Budget for Chesapeake Bay restoration work in the
following formats for those Federal agencies on the Federal Leadership Committee for the Chesapeake Bay:
Total Federal funding by agency;
Agency funding details
As directed in CBARA, the Office of Management and Budget (OMB) also requested Chesapeake Bay restoration funding data from the Chesapeake Bay
Watershed States—Maryland, Virginia, Pennsylvania, Delaware, West Virginia, New York, and the District of Columbia through FY 2017. By September 7,
OMB received tabular data from all of the states. This report includes the states’ data, which is presented in the formats received. OMB greatly appreciates
but cannot verify the completeness or accuracy of the State data. Further, because the state data includes funding received from Federal sources, there
may be double-counting between the state and Federal tables.
It is important to note that in many instances the funding numbers shown are extrapolated from past funding provided to the region or estimated based
on the portion of the program focused directly on Chesapeake Bay restoration activities. The funding ultimately provided to Chesapeake Bay watershed
efforts may differ from these estimates.
A few other funding notes are necessary. All Federal and State dollars are reported in thousands, and rounding errors may occur. The data request for
both Federal agencies and States excluded programs and projects that received less than $300,000 in funding, though all data received is included in the
tables below. In addition, the current year (FY 2016) funding only reflects data through the second quarter of the fiscal year. Depending on the program,
fiscal outlays may be weighted toward the third or fourth quarters. As a result, second quarter numbers reflect only a partial snapshot of program
execution.

3
Federal Data
Table 1--Federal Agency Totals1
FY 2014 FY 2015 FY 2016 FY 2017
(Budget authority in thousands) Operating
Level Obligations Outlays
Operating
Level Obligations Outlays Operating
Level Obligations Through Q2
Outlays Through
Q2 President’s
Budget
Department of Agriculture 154,803 141,953 147,829 155,870 143,953 142,091 160,372 65,979 83,320 156,984
Department of Defense (non-Army Corps) 57,404 93,855 87,458 41,841 115,286 106,249 70,722 38,146 43,877 50,123
Department of Commerce 16,375 16,106 12,553 16,071 15,491 18,928 16,345 4,390 12,263 13,405
Department of Homeland Security2 0 0 0 0 0 0 0 0 0 0
Department of the Interior 46,174 41,184 28,228 40,206 34,565 39,136 39,295 16,190 20,223 42,496
Department of Transportation3 0 0 0 0 0 0 0 0 0 0
Environmental Protection Agency 183,548 175,976 170,594 185,786 199,917 173,640 193,839 45,013 71,170 160,766
Army Corps of Engineers 26,013 27,679 8,628 22,792 12,058 31,561 55,848 8,895 3,410 66,487
Total, All Agencies 484,317 496,753 455,290 462,566 521,270 511,605 536,421 178,613 234,263 490,261
1 In all tables, funding amounts are rounded to the nearest thousand. Rounding errors may result. 2 Though DHS is a member of the Chesapeake Bay Federal Leadership Committee and conducts environmental-related activities in the Chesapeake Bay watershed, none meet the definitional limits of this crosscut. 3 Though DOT is a member of the Chesapeake Bay Federal Leadership Committee and conducts environmental-related activities in the Chesapeake Bay watershed, none meet the definitional limits of this crosscut.

4
Table 2—Department of Agriculture1
FY 2014 FY 2015 FY 2016 FY 2017
(Budget authority in thousands) Operating
Level Obligations Outlays
Operating
Level Obligations Outlays Operating
Level
Obligations Through
Q2
Outlays Through
Q2 President’s
Budget
Animal and Plant Health Inspection Service
Wildlife Services, Virginia-Federal Cooperative Funding 16 16 16 15 15 15 25 25 25 0
Wildlife Services, Virginia-Non-Federal Cooperative Funding 23 16 16 22 16 16 19 19 19 0
Wildlife Services, Maryland-Federal Cooperative Funding 1,018 1,018 1,018 1,075 1,075 1,075 1,050 527 527 1,050
Wildlife Services, Maryland-Non-Federal Cooperative Funding 0 0 0 400 400 400 400 238 238 0
Total, APHIS 1,058 1,050 1,050 1,512 1,506 1,506 1,494 809 809 1,050
Agricultural Research Service
Water Availability and Water Management 4,188 4,188 4,188 4,188 4,188 4,188 4,268 4,268 4,268 4,268
Climate Change, Soils, and Emissions 5,186 5,186 5,186 5,186 5,186 5,186 5,186 5,186 5,186 5,186
Agricultural and Industrial Byproducts 1,784 1,784 1,784 1,784 1,784 1,784 1,784 1,784 1,784 137
Pasture, Forage, and Rangeland Systems 413 413 413 413 413 413 413 413 413 413
Total, ARS 11,570 11,570 11,570 11,570 11,570 11,570 11,650 11,650 11,650 10,004
Economic Research Service
Varied Research Activities 239 239 239 599 599 599 434 434 434 441
Total, ERS 239 239 239 599 599 599 434 434 434 441
Farm Service Agency
Conservation Reserve Enhancement Program 43,000 30,158 24,632 43,000 31,089 24,673 43,000 31,089 23,252 43,000
Total, FSA 43,000 30,158 24,632 43,000 31,089 24,673 43,000 31,089 23,252 43,000

5
Forest Service
NFS2 521 521 521 422 422 422 467 467 467 350
LWCF-NFS3 0 0 0 845 845 845 2,036 2,036 2,036 1,000
SPF Cooperative Lands4 1,307 1,307 1,307 1,203 1,203 1,203 1,092 1,092 1,092 905
LWCF- Forest Legacy 0 0 0 1,085 1,085 1,085 0 0 0 0
Research and Development5 1,000 1,000 1,000 1,000 1,000 1,000 1,000 1,000 1,000 1,000
Total, FS 2,828 2,828 2,828 4,555 4,555 4,555 4,595 4,595 4,595 3,255
Natural Resource Conservation Service
Conservation Operations 14,958 14,958 14,958 14,494 14,494 14,494 14,494 4,832 4,832 14,494
Agricultural Conservation Easement Program (ACEP) 6,680 6,680 1,827 8,269 8,269 2,833 8,269 4,192 2,192 8,269
Agricultural Management Assistance (AMA) 911 911 434 613 613 503 613 17 136 613
Chesapeake Bay Watershed Program (CBWP) 6,951 6,951 29,531 3,830 3,830 19,915 3,830 0 5,012 3,830
Conservation Reserve Program (CRP) 2,018 2,018 2,018 2,254 2,254 2,254 2,254 850 850 2,254
Conservation Security Program (CSP) 1,402 1,402 729 867 867 285 867 0 0 867
Conservation Stewardship Program (CStP) 601 601 10,117 5,534 5,534 11,127 5,534 935 8,260 5,534
Environmental Quality Incentives Program (EQIP) 56,290 56,290 32,635 49,258 49,258 35,772 53,809 1,345 15,226 53,809
Farm and Ranch Lands Protection Program (FRPP) n/a6 n/a n/a 305 305 301 305 23 18 305
Regional Conservation Partnership Program (RCPP)7 n/a n/a n/a 3,260 3,260 2,225 3,260 269 268 3,260
Wetlands Reserve Program (WRP) 1,609 1,609 9,569 1,108 1,108 4,741 1,108 621 1,221 1,108
Wildlife Habitat Incentives Program (WHIP) 338 338 1,341 490 490 1,387 490 39 286 490
Total, NRCS 91,757 91,757 103,159 90,283 90,283 95,837 94,833 13,123 38,301 94,833
National Institute of Food and Agriculture
1890 Colleges and Tuskegee (Evans Allen) 473 473 473 473 473 473 488 488 488 523
Hatch Act 450 450 450 450 450 450 450 450 450 450
Agriculture and Food Research Initiative (AFRI) 2,563 2,563 2,563 2,563 2,563 2,563 2,563 2,563 2,563 2,563

6
Crop Protection/Pest Management Program 210 210 210 210 210 210 210 210 210 210
1890 Capacity Building Grants 480 480 480 480 480 480 480 480 480 480
Total, NIFA 4,176 4,176 4,176 4,176 4,176 4,176 4,191 4,191 4,191 4,226
Office of the Chief Economist
Environmental Market Development 175 175 175 175 175 175 175 88 88 175
Total, OCE 175 175 175 175 175 175 175 88 88 175
Total, USDA 154,803 141,953 147,829 155,870 143,953 142,091 160,372 65,979 83,320 156,984
1 All agencies except for FSA and NRCS are showing outlays equal to obligations. FSA and NRCS show multi-year outlays. 2 NFS amounts include all Watershed, Wildlife and Fish restoration activities, Non-native Invasive Species treatments and Prescribed burning to improve habitat. Reported amounts do not include: Salary for permanent employees, Fleet vehicles, or travel. 3 LWCF-NFS includes LWCF Collaborative funding in FY16 and FY17 4 State and Private Forestry Cooperative Lands includes programs and projects directly associated with Chesapeake restoration. Includes $100k from NFWF each year. 5 Research and Development funding is an estimate of annual expenditures on Chesapeake Bay activities directly and indirectly associated with Chesapeake restoration. 6 Lines reading n/a do not meet the $300,000 threshold for reporting. 7 RCPP obligations do not include obligations made using funding from covered programs (ACEP, CStP, or EQIP); those obligations are reported under the parent program.

7
Table 3- Department of Defense
FY 2014 FY 2015 FY 2016 FY 2017
(Budget authority in thousands) Operating
Level Obligations Outlays1
Operating
Level Obligations Outlays Operating
Level Obligations
Through Q22 Outlays
Through Q2 President’s
Budget
Services
DoD Operations and Maintenance3 57,404 93,855 87,458 41,842 115,286 106,249 70,722 38,146 43,877 50,143
Total, Services 57,404 93,855 87,458 41,842 115,286 106,249 70,722 38,146 43,877 50,143
Total, DOD 57,404 93,855 87,458 41,842 115,286 106,249 70,722 38,146 43,877 50,143
1 DoD (Services) FY14 - FY16 Outlays are based on DoD O&M Defense Wide Outlay Rates over a typical 5-year outlay period. 2 DoD (Services) FY16 Obligation is an average based on FY12 - FY15 obligations. 3 DoD (Services) does not have a direct line item for Chesapeake Bay funding for restoration/protection. Reported budget amounts are based on compliance with environmental protection requirements in the Chesapeake Bay Watershed and are part of the larger DoD Operations and Maintenance budget. Reported amounts are based on annual data collected from each DoD Component. Example environmental protection projects include stormwater pollution prevention, stormwater project design and management, water quality monitoring, wastewater treatment plant upgrades, integrated natural resources planning and management, environmental outreach and stewardship activities, and land conservation.

8
Table 4- Department of Commerce
FY 2014 FY 2015 FY 2016 FY 2017
(Budget authority in thousands) Operating
Level Obligations Outlays
Operating
Level Obligations Outlays Operating
Level
Obligations Through
Q2
Outlays Through
Q2 President’s
Budget
National Oceanic and Atmospheric Administration
Habitat Conservation and Restoration 6,816 6,384 3,734 6,690 6,468 4,503 6,690 1,583 2,533 6,738
Coastal Science, Assessment, Response and Restoration 2,816 2,771 2,771 2,723 2,395 2,395 2,948 1,851 1,851 2,667
Office of Education: Bay Watershed Education and Training (BWET) 2,743 2,743 2,092 2,658 2,658 2,717 2,707 0 1,582 0
National Sea Grant College Program 4,000 4,208 3,956 4,000 3,970 4,212 4,000 956 1,787 4,000
Total, NOAA 16,375 16,106 12,553 16,071 15,491 13,827 16,345 4,390 7,753 13,405
Economic Development Administration1
FY 2012 Disaster Funds provided by P.L. 112-552 0 0 0 0 0 5,101 0 0 4,510 0
Total, EDA 0 0 0 0 0 5,101 0 0 4,510 0
Total, Commerce 16,375 16,106 12,553 16,071 15,491 18,928 16,345 4,390 12,263 13,405
1 EDA does not have any programs that are for the sole purpose to directly benefit the Chesapeake Bay watershed, so there is no budget amount for FY 2017. EDA does have programs that can benefit the Chesapeake Bay watershed if a qualifying grant is submitted by a local government or not for profit economic development organization. EDA's programs can be used for planning grants, technical assistance grants, and public works grants. 2 The $30 million Columbia County Flood Risk Management Project ($15M EDA matched by $15M non-Federal) will provide a significant level of flood protection for two key employers in the Town of Bloomsburg. The flood protection project is for the Susquehanna River, tributary was which flows into the Chesapeake Bay. In 2011, Tropical Storm Lee resulted in a record crest of 32.7 feet on the Susquehanna River, leaving approximately one-third of the town of Bloomsburg underwater. The project includes construction of flood protection systems at two separate industrial sites that are adjacent to the Susquehanna River. The first includes construction of a 5,300-foot flood wall, relocation of about 2,100 feet of Snyder Run, a new pump station, and a stormwater and groundwater conveyance and collection system. The second site includes construction of a 3,000-foot flood wall, a sewage pump station, and relocation of utilities. The project will support the retention of 900 jobs, according to grantee estimates.

9
Table 5- Department of the Interior
FY 2014 FY 2015 FY 2016 FY 2017
(Budget authority in thousands) Operating
Level Obligations Outlays
Operating
Level Obligations Outlays Operating
Level
Obligations Through
Q2
Outlays Through
Q2 President’s
Budget
U.S. Fish and Wildlife Service
Ecological Services
2,917 2,672 2,858 3,058 2,803 2,831 3,180 1,448 1,361 3,303
National Wildlife Refuge System 5,336 5,896 5,252 4,985 5,129 5,644 4,968 2,657 2,453 5,216
Habitat Conservation 3,312 3,153 3,458 3,554 3,344 3,354 3,554 1,220 1,536 3,696
Fish & Aquatic Conservation 1,526 1,482 1,659 1,725 1,704 1,659 1,737 819 900 1,789
Land Acquisition 1,809 1,166 1,007 2,000 66 1,302 5,346 2,245 1,085 7,707
Natural Resource Damage Assessment and Restoration 0 335 461 0 739 621 0 277 239 0
Wildland Fire 732 773 542 857 1,059 1,290 563 344 346 563
Reimbursable Services 2,156 1,949 1,742 2,441 1,705 1,516 480 596 548 480
Hurricane Sandy Emergency Supplemental: Resilience 12,732 9,845 166 0 362 4690 0 -113 3,818 0
Hurricane Sandy Emergency Supplemental: Recovery 1,727 796 23 0 268 834 0 -4 18 0
Total, USFWS
32,246 28,067 17,168 18,620 17,179 23,741 19,828 9,489 12,304 22,754
National Park Service
Operation of the National Park System-National Trails 900 892 874 928 921 961 940 411 571 948
NPS Field Offices & Associated Areas 472 472 565 475 452 446 484 231 276 493
Nat’l Recreation & Preservation-Ches. Gateways & Water Trails 1,997 1,999 1,009 1,999 2,002 1,471 2,014 392 637 2,020
Construction - Management Planning 503 279 76 272 275 309 611 353 446 500
Land Acquisition & State Assistance-Land Acquisition 0 0 0 4,000 0 0 2,237 0 0 2,100
Land Acquisition & State Assistance-Stateside Grants 367 367 10 1,292 1,292 230 1,190 0 0 1,190
Total, NPS 4,239 4,009 2,534 8,966 4,942 3,417 7,476 1,387 1,930 7,251

10
U.S. Geological Survey
Ecosystems 4,131 3,883 3,635 5,009 4,956 4,780 5,009 2,204 2,491 5,009
Climate and Land Use Change 1,115 1,048 981 1,679 1,645 1,578 1,679 739 831 1,679
Energy and Minerals, and Environmental Health 1,469 1,381 1,293 1,669 1,657 1,601 1,669 734 832 1,669
Water Resources 2,974 2,796 2,617 4,263 4,186 4,019 3,634 1,637 1,835 3,634
Core Science Systems 0 0 0 0 0 0 0 0 0 500
Total, USGS 9,689 9,108 8,526 12,620 12,444 11,978 11,991 5,314 5,989 12,491
Total, DOI 46,174 41,184 28,228 40,206 34,565 39,136 39,295 16,190 20,223 42,496
Notes on USFWS: Hurricane Sandy Emergency Supplemental Funds are no-year funds, so the budget authority is only displayed in FY 2014. Not all budget authority in each account was distributed to the lowest functional unit within the financial system and some budget authority may be under-estimated. Notes on U.S. Geological Survey: USGS Operating Level includes only appropriated funding from Surveys, Investigations, and Research by budget activity (mission area). All USGS funding falls under the scientific research or monitoring category. Obligation rate for FY 2014 and FY 2015: Historical data shows that USGS obligates 94% in the first year of multi-year funding authority and that carryover is typically 6%. Based on this trend, USGS will show the obligation rate as 94% and 6%. The obligations "cascade" from year to year. For FY 2016: The actual spend rate through Q2 is 38% and was applied to the 2016/2017 multi-year operating level. In addition, 6% is applied to the 2nd year of 2015/2016 funds. Outlay rate: Historical data shows that USGS outlays at the following cascading rate - 88%, 9% and 3%. In 2016, outlays are projected through Q2 only.
11
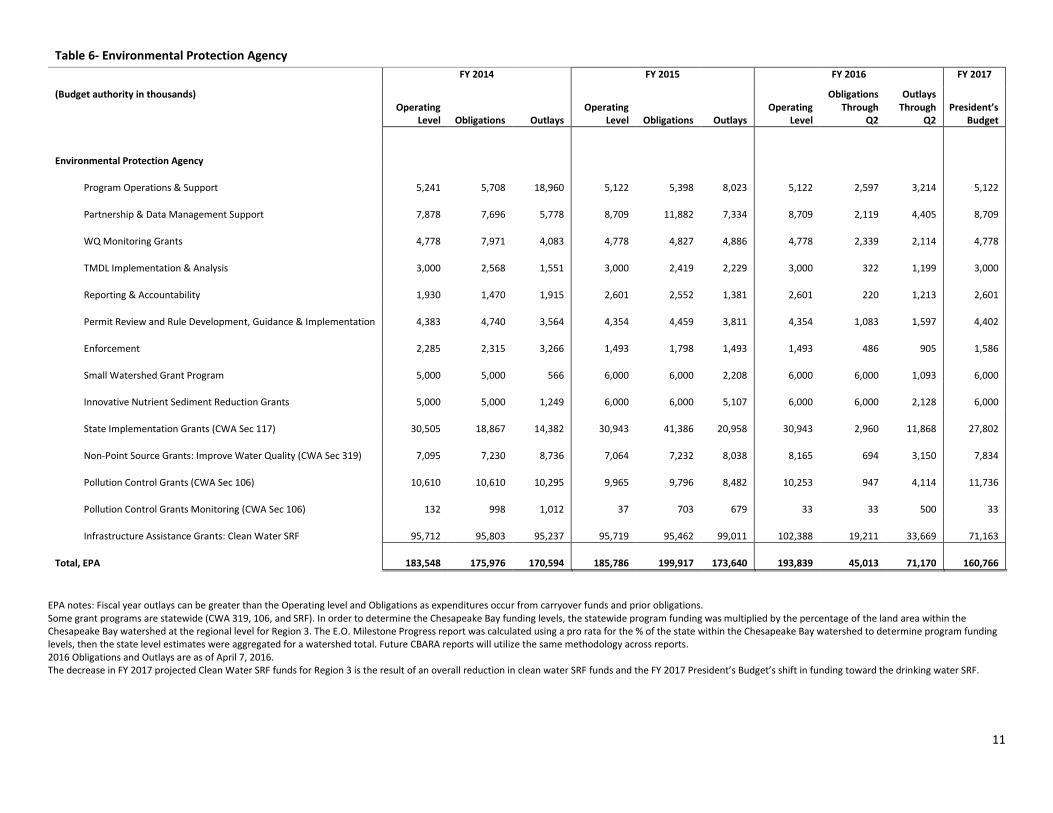
Table 6- Environmental Protection Agency
FY 2014 FY 2015 FY 2016 FY 2017
(Budget authority in thousands) Operating
Level Obligations Outlays
Operating
Level Obligations Outlays Operating
Level
Obligations Through
Q2
Outlays Through
Q2 President’s
Budget
Environmental Protection Agency
Program Operations & Support 5,241 5,708 18,960 5,122 5,398 8,023 5,122 2,597 3,214 5,122
Partnership & Data Management Support 7,878 7,696 5,778 8,709 11,882 7,334 8,709 2,119 4,405 8,709
WQ Monitoring Grants 4,778 7,971 4,083 4,778 4,827 4,886 4,778 2,339 2,114 4,778
TMDL Implementation & Analysis 3,000 2,568 1,551 3,000 2,419 2,229 3,000 322 1,199 3,000
Reporting & Accountability 1,930 1,470 1,915 2,601 2,552 1,381 2,601 220 1,213 2,601
Permit Review and Rule Development, Guidance & Implementation 4,383 4,740 3,564 4,354 4,459 3,811 4,354 1,083 1,597 4,402
Enforcement 2,285 2,315 3,266 1,493 1,798 1,493 1,493 486 905 1,586
Small Watershed Grant Program 5,000 5,000 566 6,000 6,000 2,208 6,000 6,000 1,093 6,000
Innovative Nutrient Sediment Reduction Grants 5,000 5,000 1,249 6,000 6,000 5,107 6,000 6,000 2,128 6,000
State Implementation Grants (CWA Sec 117) 30,505 18,867 14,382 30,943 41,386 20,958 30,943 2,960 11,868 27,802
Non-Point Source Grants: Improve Water Quality (CWA Sec 319) 7,095 7,230 8,736 7,064 7,232 8,038 8,165 694 3,150 7,834
Pollution Control Grants (CWA Sec 106) 10,610 10,610 10,295 9,965 9,796 8,482 10,253 947 4,114 11,736
Pollution Control Grants Monitoring (CWA Sec 106) 132 998 1,012 37 703 679 33 33 500 33
Infrastructure Assistance Grants: Clean Water SRF 95,712 95,803 95,237 95,719 95,462 99,011 102,388 19,211 33,669 71,163
Total, EPA 183,548 175,976 170,594 185,786 199,917 173,640 193,839 45,013 71,170 160,766
EPA notes: Fiscal year outlays can be greater than the Operating level and Obligations as expenditures occur from carryover funds and prior obligations. Some grant programs are statewide (CWA 319, 106, and SRF). In order to determine the Chesapeake Bay funding levels, the statewide program funding was multiplied by the percentage of the land area within the Chesapeake Bay watershed at the regional level for Region 3. The E.O. Milestone Progress report was calculated using a pro rata for the % of the state within the Chesapeake Bay watershed to determine program funding levels, then the state level estimates were aggregated for a watershed total. Future CBARA reports will utilize the same methodology across reports. 2016 Obligations and Outlays are as of April 7, 2016. The decrease in FY 2017 projected Clean Water SRF funds for Region 3 is the result of an overall reduction in clean water SRF funds and the FY 2017 President’s Budget’s shift in funding toward the drinking water SRF.
12
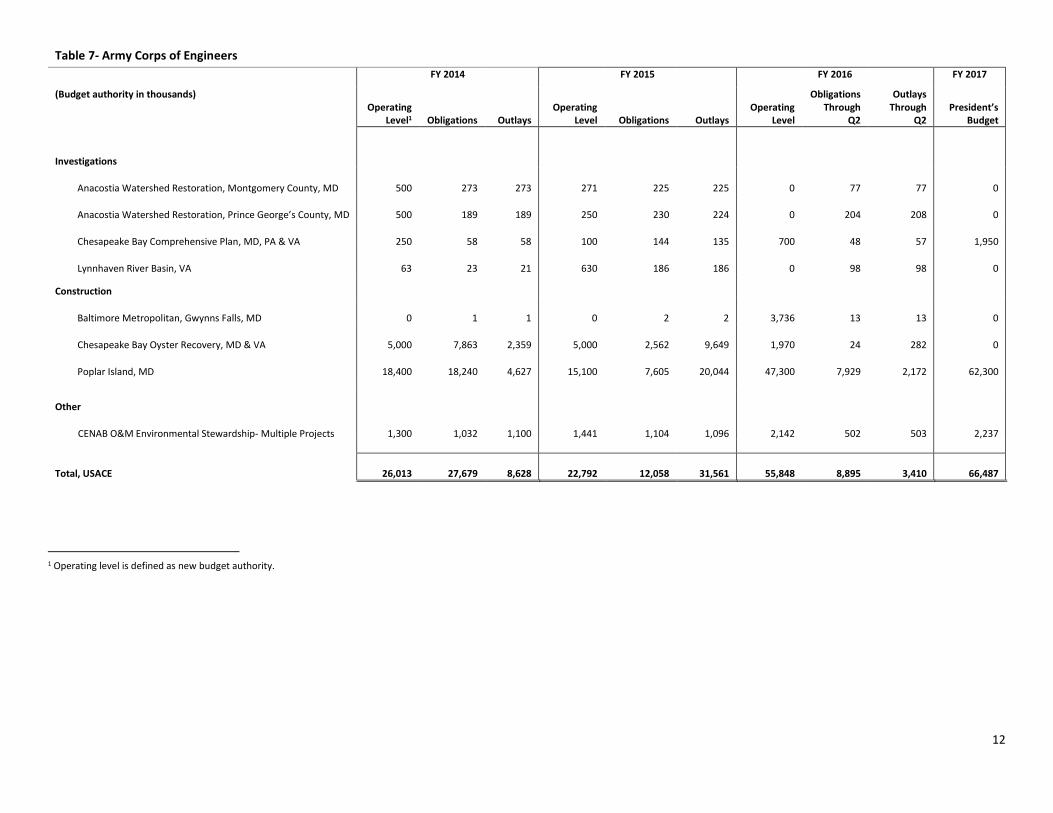
Table 7- Army Corps of Engineers
FY 2014 FY 2015 FY 2016 FY 2017
(Budget authority in thousands) Operating
Level1 Obligations Outlays
Operating
Level Obligations Outlays Operating
Level
Obligations Through
Q2
Outlays Through
Q2 President’s
Budget
Investigations
Anacostia Watershed Restoration, Montgomery County, MD 500 273 273 271 225 225 0 77 77 0
Anacostia Watershed Restoration, Prince George’s County, MD 500 189 189 250 230 224 0 204 208 0
Chesapeake Bay Comprehensive Plan, MD, PA & VA 250 58 58 100 144 135 700 48 57 1,950
Lynnhaven River Basin, VA 63 23 21 630 186 186 0 98 98 0
Construction
Baltimore Metropolitan, Gwynns Falls, MD 0 1 1 0 2 2 3,736 13 13 0
Chesapeake Bay Oyster Recovery, MD & VA 5,000 7,863 2,359 5,000 2,562 9,649 1,970 24 282 0
Poplar Island, MD 18,400 18,240 4,627 15,100 7,605 20,044 47,300 7,929 2,172 62,300
Other
CENAB O&M Environmental Stewardship- Multiple Projects 1,300 1,032 1,100 1,441 1,104 1,096 2,142 502 503 2,237
Total, USACE 26,013 27,679 8,628 22,792 12,058 31,561 55,848 8,895 3,410 66,487
1 Operating level is defined as new budget authority.

13
Table 8—Army Corps of Engineers—Project Detail
(Budget authority in thousands) FY 2017 Budget Description Status
Authorized Funding Level1
Army Corps of Engineers
Poplar Island, MD 62,300 This project is in the Construction phase and is an aquatic ecosystem restoration project to restore Poplar Island. The Poplar Island project will restore 1,715 acres of remote island habitat in the Chesapeake Bay and is accomplished through the construction of armored dikes to contain uncontaminated dredged material from the Baltimore Harbor and Channels navigation project. The dredged material is needed to form tidal marsh wetlands and upland habitat that supports many aquatic and wildlife species.
1,651,000
Chesapeake Bay Comprehensive Plan, MD, PA & VA
1,950 This is a watershed assessment that will result in a comprehensive master plan for restoring, preserving, and protecting the Chesapeake Bay ecosystem that aligns with existing Federal, State and local plans, and the Chesapeake Bay Agreement and Executive Order 13508 Chesapeake Bay Protection and Restoration goals. This plan will identify potential projects that may be implemented by the USACE or other Federal, State, or local entities to address identified problems.
Funded to completion in
FY 2017 Budget. If
enacted, no additional
funding will be required.
3,600
Environmental Stewardship 2,237 The USACE is the steward of the lands and waters at Corps water resources projects and has a mission for Environmental Stewardship. The financial data shown in this table is a roll-up of data for the Environmental Stewardship business line within the Operations and Maintenance account, and represents multiple projects that are budgeted and receive budget authority at the project level within the Chesapeake Bay watershed.
n/a
1 The authorized funding level amounts shown in this table is the maximum project cost limit for Construction projects (Poplar Island, MD) in accordance with Section 902 of WRDA 1986 and the total estimated cost for the Chesapeake Bay Comprehensive Plan, MD, PA & VA. The Chesapeake Bay Comprehensive Plan, MD, PA & VA and Environmental Stewardship investments do not have authority cost limits.

14
State Data
Table 9--Delaware, State Programs
(Budget authority in thousands) FY 2014 FY 2015 FY 2016 FY 2017
Department of Natural Resources and Environmental Control
Conservation Cost Share, State Budget (CB portion estimate) 750 750 750 750
Total, Delaware, State Programs 750 750 750 750
Table 10--Delaware, Federal Funds Received
(Budget authority in thousands) Federal Agency Federal Program FY 2014 FY 2015 FY 2016
Department of Natural Resources and Environmental Control
Nonpoint Source Program EPA CWA Section 319 375 375 375
Chesapeake Bay Implementation Grant EPA CWA Section 117 1,250 1,250 1,250
Local Government Funding EPA CWA Section 117 336 336 336
Chesapeake Bay Regulatory And Accountability Grant Program EPA CWA Section 117 820 820 820
Total, Delaware, Federal Funds Received 2,811 2,811 2,811

15
Table 11—District of Columbia, State Programs
(Budget authority in thousands) FY 2014 FY 2015 FY 2016 FY 2017
Department of Energy and the Environment (DOEE)
SRF Clean Water Construction (CWCMGT, EVCA, EVSD, SRF) 89 1,058 985 2,000
NPS Program (ENV01C, EVNI) 493 688 237 627
Chesapeake Bay Program ( EVCB, EVRA, EVOS) 1,646 1,727 1,230 1,074
Water Pollution Control Program (EVWP, EVWQ) 541 656 448 697
Stream Restoration and Demonstration (EVLI, EVNA, EVJB, EVSW) 0 0 0 0
Floodplain Management Program (EVFC, EVFE) 26 18 14 18
Fisheries Management and Aquatic Education (EVFS, MB, WS, AE, FM,SP, AR, TS, WT) 573 584 431 955
Fishing License Program (603) no match 66 92 68 201
MS4 Program (654) no match 8,158 8,281 1,100 20,000
Stormwater and Erosion/Sediment Control(634, 646) no match 789 1,140 1,504 1,218
Anacostia Fund (670) no match 721 407 1,760 2,500
Anacostia Sediment Study (no match) 1,550 4,550 1,786 5,000
District Department of Transportation (DDOT)
Green Infrastructure Installed As Part Of Roadway and Bridge Capital Projects 1,875 2,625 4,125 4,125
Urban Forestry Administration 1,728 2,269 1,869 2,760
DCWater
Blue Plains Operations and Maintenance excluding facilities, engineering, administration 10,044 9,015 10,987 10,951
Total, DC, State Programs 28,299 33,110 26,544 52,126
Notes on Table 11 District dollars for stream restoration and demonstration projects are captured under MS4, NPS, and CB program as match to grant funds.

16
FY17 was taken mostly from Mayor's proposed budget.
Unless specified no match, District funds are used as match to federal grant program.
District dollars include personnel but not indirect.
Anacostia Sediment Study funding came from ESA.
FY16 and FY17 numbers for the MS4 and Anacostia Fund were provided by the program manager.
DOEE's fiscal year is October to September. The expenditures for FY 16 are reported through 7-16-2016.
DDOT information was provided by Adrea Turner.
DC Water information was provided by Salil Kharker.
Please direct questions concerning this spreadsheet to Sheila Besse, 202-535-2244 or [email protected].
Table 12—District of Columbia, Federal Funds Received
(Budget authority in thousands) Federal Agency
Federal Program FY 2014 FY 2015 FY 2016
Department of Energy and the Environment (DOEE)
SRF Clean Water Construction (SRF, CWCMGT, EVCA, EVSD -350, 8201) EPA
1,741 380 1,820
NPS Program (EVNI - 350, 8201) EPA Section 319 Program 1,173 421 887
Chesapeake Bay Program (EVCB, EVRA, EVOS) EPA Section 117 Program 1,133 1,141 1,568
Water Pollution Control Program (EVWP, EVWQ) EPA Section 106and 604(b) Programs 1,261 1,256 857
Stream Restoration and Demonstration (EVLI, EVNA, EVJB, EVLI, EVSW, EVNA) EPA 903 105 436
Floodplain Management Program (EVFC, EVFE) FEMA 63 45 42
Fisheries Management and Aquatic Education DOI Wildlife and Sport Fish Restoration Program 1,499 1,492 1,204
Push-net Survey NOAA 47 29 50
District Department of Transportation (DDOT)
Green Infrastructure Program FHWA State Transportation Fund 4,125
Urban Forestry Administration US DOT FHWA 1,359

17
DCWater
Clean Water Act EPA Construction Grants for WW Treatment Works 3,500 3,500 3,500
Safe Drinking Water Act EPA Safe Drinking Water State Revolving Funds 8,300 8,300 8,300
Total, DC, Federal Funds Received 19,620 16,669 24,148
Notes on Table 12 DOEE information in () refers to the DC funding codes that generated the expenditures
Federal Funds received by the Urban Forestry Administration in FY14 & 15 are reflected in the SRF Clean Water fund figures provided by DOEE:
DOEE funding was obtained from DOEE AFO and captured in expense sheet FY08-16 cumulative Grant Data @ 07-11-16 OMB exercise.xlsx (kparson).
DOEE's fiscal year is October to September. The expenditures for FY 16 are reported through 7-16-2016.
Federal dollars include personnel but not indirect.

18
Table 13—Maryland Chesapeake Bay Restoration Activities Funded in the Budget
(Budget authority in thousands) FY 2015
Actual FY 2016
Appropriation FY 2017
Allowance
Total Funds
Department of Natural Resources 110,596 87,839 97,821
Program Open Space 15,072 24,603 19,618
Rural Legacy 16,034 10,082 17,663
Department of Planning 5,410 5,543 5,623
Department of Agriculture 46,885 50,453 52,757
Maryland Agricultural Land Preservation Foundation 22,850 31,294 22,968
Maryland Department of the Environment 281,255 287,399 285,529
Maryland State Dept. of Education 417 417 417
Maryland Higher Education 35,136 35,358 31,428
Maryland Department of Transportation 337,769 337,464 563,916
Total, Maryland Funds by Department 871,424 870,451 1,097,742
Funds by Fund Type
General Fund 32,803 34,383 38,412
Special Fund 276,779 286,259 329,608
Federal Fund 54,270 52,751 56,204
Reimbursable Funds 25,227 33,336 32,083
Current Unrestricted 23,734 25,700 27,502
Current Restricted 11,402 9,658 3,927
GO Bonds 109,440 90,900 46,092
MDOT 337,769 337,464 563,916
Total, Maryland Funds by Fund Type 871,424 870,451 1,097,742

19
Funds by Spending Category
Land Preservation 54,779 67,317 61,623
Septic Systems 21,445 21,043 21,123
Wastewater Treatment 249,916 256,315 254,685
Urban Stormwater 33,200 9,386 10,755
Agricultural BMPs 46,885 50,273 52,611
Oyster Restoration 11,889 13,085 8,281
Transit & Sustainable Transportation Alternatives 337,769 337,464 563,916
Living Resources 66,251 66,619 79,600
Education and Research 35,553 35,775 31,845
Other 13,736 13,174 13,304
Total, Maryland Funds by Spending Category 871,424 870,451 1,097,742
Notes on Table 13:
This data only includes state agency programs that have more than 50% of their activities directly related to Chesapeake Bay Restoration. Funding related to salaries and fringes does not reflect health insurance
or increment adjustments.
This table assumes enhanced funding of $4.0 million for Program Open Space Streetside, $4.9 million for Rural Legacy and $3.5 million for the Maryland Agricultural Land Preservation Foundation is passed by
the General Assembly as proposed in the Governor’s Budget.

20
Table 14—New York, State Programs1
(Budget authority in thousands) FY 2014 FY 2015 FY 2016 FY 2017
Department of Agriculture and Markets
Agricultural Nonpoint Source Abatement & Control Grant Program (AgNPS)2 2,700 3,472 3,150 3,200
Agricultural Environmental Management (AEM) Base Funding3 759 922 950 950
Department of Environmental Conservation
Water Quality Improvement Projects (WQIP) Grant Program4 65 539 317 1,216
Engineering Planning Grant (EPG)5 514 226 455 455
Environmental Facilities Corporation
Green Infrastructure Program (GIGP)6 2,452 1,122 1,168 1,168
Total, New York, State Programs 6,490 6,280 6,041 6,990
1 State Fiscal Year April 1 – March 31 2 AgNPS is a state grant program that provides funding for BMP planning and implementation on farms to reduce nonpoint source pollution. FY14 and FY15 AgNPS amount reported by NYSDAM in 2/29/16 CBIG progress report. FY16 is an estimate of AgNPS Round 22 awards and FY17 is an estimate based on awards made in prior AgNPS rounds. 3 AEM Base is a state funding program for county soil and water conservation districts to provide technical assistance for conservation planning and implementation to farms. AEM Base amounts are county-wide for those counties with area in the CBay watershed and are not watershed-only. Reported by NYSDAM in 2014-2015 Milestone progress report. FY16 and FY17 values are estimates based on funds earned in prior AEM Base program years. 4 WQIP is a state grant program for projects that address water quality problems. FY14, FY15 and FY16 amounts are actual amount paid each year (FY16 amount is through 8/17/16). FY17 amount is a projected amount generated by summing the unspent balances of all open contracts with FY17 end dates. 5 The EPG is a state grant program for municipalities for planning for wastewater infrastructure improvements. FY14 and FY15 are awarded amounts. FY16 and FY17 amounts are estimates based on average total amounts awarded 2012-2015. 6 GIGP is a state grant program for stormwater BMPs that provide stormwater treatment, habitat, flood attenuation and other benefits. FY14 and FY15 amounts are awarded amounts. FY16 and FY17 amounts are estimates using average total amounts awarded 2009-2015.

21
Table 15—New York, Federal Funds Received
(Budget authority in thousands) Federal Agency Federal Program FY 2014 FY 2015 FY 2016
Department of Environmental Conservation
Chesapeake Bay Watershed Program EPA
Chesapeake Bay Regulatory and Accountability
Program 1,082 1,057 1,007
Chesapeake Bay Watershed Program EPA Chesapeake Bay
Implementation Grant 1,200 1,700 1,700
Total, New York, Federal Funds Received 2,282 2,757 2,707

22
Table 16--Pennsylvania, State Programs1,2
(Budget authority in thousands) FY 2014 FY 2015 FY 2016 FY 2017
Department of Environmental Protection
Growing Greener 7,165 8,220 9,373 2,6453
Water Pollution Control 803 3,773 1,978 2,724
Chesapeake Bay Implementation- Program Management and Administration 1,076 1,402 513 1,061
Chesapeake Bay Implementation- Project Construction and Implementation 1,397
Chesapeake Bay Regulatory And Accountability- Program Management and Administration 1,519 631 1,635
Flood Protection Program 245 139 14
Chesapeake Bay Commission 227 227 227 227
State Conservation Commission
Conservation District Fund Allocation Program 3,491 3,491 3,502 3,502
Dirt, Gravel, and Low Volume Road Program 13,720 13,720 13,720 13,720
Nutrient Management Program 1,449 1,530 1,530 1,530
Resource Enhancement and Protection Program 4,900 4,900 4,900 4,900
Pennsylvania Infrastructure Investment Authority
Project Construction and Implementation 10,222 12,272 385 n/a4
Department of Natural Resources
Land Conservation 9,078 34,700 3,062 726
Rivers Conservation 125 702 200
Riparian Buffers (Reboot Strategy) 1,0005
Total, Pennsylvania, State Programs 53,899 86,594 40,034 33,671
1 Costs figured on federal fiscal year, FY16 costs are from October 1, 2015 through March 31, 2016. 2 Costs of some projects calculated as 49% of statewide costs, since approximately 49% of the state is in the Chesapeake Bay Watershed. 3 Actual projections cannot be made since amounts are based on projects approved. However, a minimum amount is budgeted as match to the EPA CBIG grant. 4 Amounts are based on projects approved, not funds spent. Projections cannot be made since we can't determine type, number of projects or amounts we will receive. 5 Includes $500,000 in in-kind services

23
Table 17--Pennsylvania, Federal Funds Received1,2
(Budget authority in thousands) Federal Agency Federal Program FY 2014 FY 2015 FY 2016
Department of Environmental Protection
Nonpoint Source Program- Program Management & Administrative Oversight EPA CWA 319 Nonpoint Source Program 741 616 743
Nonpoint Source Program- Project Construction & Implementation EPA CWA 319 Nonpoint Source Program 1,689 2,444 2,085
Water Pollution Control EPA CWA 106 Grant 3,195 2,730 1,765
Water Pollution Control Supplemental Monitoring EPA CWA 106 Supplemental Grant 87 69 67
Monitoring, Assessment and Planning EPA CWA 604(b) 292 143 104
Chesapeake Bay Implementation- Program Management & Administrative Oversight EPA Chesapeake Bay Implementation Grant 909 471 67
Chesapeake Bay Implementation- Project Construction & Implementation EPA Chesapeake Bay Implementation Grant 2,740 590 553
Chesapeake Bay Regulatory and Accountability EPA Ches. Bay Regulatory and Accountability Grant 1,309 3,718 2,116
SWAT Program USDA, NRCS 421 295 129
Department of Natural Resources
Land Conservation USDA, FS Forest Legacy Program 1,500
Pennsylvania Infrastructure Investment Authority
Program Management & Administrative Oversight EPA SRF 1,434 1,500 892
Project Construction & Implementation EPA SRF 40,500 2,621 315
Total, Pennsylvania, Federal Funds Received
53,317 16,697 8,835
1 Costs for some projects calculated as 49% of statewide costs, since approximately 49% of the state is in the Chesapeake Bay Watershed. 2 Costs figured on federal fiscal year, FY16 costs are from October 1, 2015 through March 31, 2016.

24
Table 18--Virginia, State Programs
(Budget authority in thousands) FY 2014 FY 2015 FY 2016 FY 2017
Department of Conservation and Recreation
Soil and Water Conservation1 1,641 1,756 2,203 1,867
Financial Assistance to Soil and Water Conservation Districts 3,798 4,127 4,272 4,314
Technical Assistance to Soil and Water Conservation Districts 1,544 1,710 1,708 4,767
Agricultural Best Management Practices Cost Share Assistance 13,448 14,878 14,502 33,217
Dam Inventory, Evaluation and Classification and Flood Plain Management2 1,729 1,829 1,466 1,675
Natural Heritage Preservation and Management3 1,924 1,964 2,416 2,101
Preservation of Open Space Lands4 3,174 2,770 3,424 3,123
Design and Construction of Outdoor Recreational Facilities 440 442 360 414
State Park Management and Operations 21,726 22,962 24,769 23,152
Natural Outdoor Recreational and Open Space Resource Research, Planning, and Technical Assistance5 576 521 667 588
General Administration Management for Chesapeake bay Program activities 3,950 5,336 5,055 4,780
Department of Environmental Quality6
Water Quality Improvement Fund point source grants 27,840 69,129 60,234 75,316
Water Quality Improvement Fund non-point source grants 425 306 1,540 3,000
Clean Water SRF 30,054 34,972 45,734 45,000
Stormwater Local Assistance grants7 0 2,715 2,975 15,000
Stormwater Management8 2,197 8,660 3,157 3,218
Water Quality Management 14,026 14,335 14,374 15,284
Air Quality9 8,293 8,594 8,584 8,766
Land Management 10 4,100 4,937 4,491 5,292
Superfund 1,193 1,656 1,657 1,702
Petroleum Remediation 21,807 22,325 23,794 23,035

25
Litter Control and Recycling 1,409 1,389 1,421 1,467
Lynchburg and City of Richmond Combined Sewer Overflow grants 827 3,585 7,980 12,000
Department of Game and Inland Fisheries
Fisheries and Aquatic Habitat 2,669 2,392 1,303 890
Species of Conservation Need and Habitat 723 514 215 611
Wildlife and Terrestrial Habitat 4,749 4,190 3,465 2,461
Land Acquisition 0 826 11,648 4,400
Department of Transportation11
MS4/Chesapeake Bay TMDL Special Condition 849 419 448 2,500
Marine Resources Commission
Oyster Restoration 2,000 2,000 2,000 2,000
Total, Virginia, State Programs 177,111 241,239 255,862 301,940
1 Includes Water Quality practices, Nutrient Mgt to prevent run off, Agricultural incentives, Resource Mgt planning, Engineering Services, Shoreline Erosion Advisory (SEAS), Adopt a Stream, Watershed and Stream Exclusion Practices, Chesapeake Bay Restoration Fund, Plant more Plants, Conservation Reserve Enhancement Program (CREP), Virginia Agricultural Best Mgt Practices 2 Public Safety, Erosion Control, Climate resiliency, Water Quality 3 Natural Area Preserves. Conservation of Virginia's biodiversity and ecosystems of lands with native plant and animal life. Protection and outdoor recreational opportunities. Clean water through Caves and Karst. 4 Land protection grants and advisory, Virginia Outdoors Fund, Virginia Land Conservation Foundation, Clean Water Revolving Loan, Land Conservation, Virginia Recreational Trails Fund, Tax Incentive Administration 5 Virginia Outdoors Plan, Land Water Conservation Fund, Recreational Trails Program, Virginia Land and Water Conservation Fund, Greenways and Trails, Blueways and Water Trails, Public Access, Virginia Scenic Resources (Rivers and Byways), Master Planning of Parks, Green Infrastructure- interconnected network of waterways wetlands, wildlife habitats, parks, and other open spaces that support native species. 6 All costs are based on June 30, state fiscal year 7 Total program costs allocated based on statewide bay land area 60% 8 Total program costs allocated based on statewide bay land area 60% 9 Total program costs allocated based on statewide bay land area 60% except for non-attainment emissions inspection expenditures at 100% 10 Total program costs allocated based on statewide bay land area 60% 11 Based on state fiscal year.

26
Table 19--Virginia, Federal Funds Received
(Budget authority in thousands) Federal Agency Federal Program FY 2014 FY 2015 FY 2016
Department of Conservation and Recreation
Soil and Water Conservation1 EPA CWA 319, CBIG, CBRAP 1,847 3,044 3,346
Dam Inventory, Evaluation, and Classification and Flood Plain Mgmt2 FEMA CTP, CAP-SSE, Dam Safety 467 634 333
Natural Outdoor Recreational and Open Space Resource Research, Planning, and Technical Assistance3 NPS and USFWS
Land Conservation, East Coast Greenway 4,391 1,712 1,870
Department of Environmental Quality
Virginia Revolving Loan Program EPA SRF 28,694 28,548 18,126
Non-point Source program EPA CWA 319 1,123 1,929 1,880
Chesapeake Bay Monitoring EPA CWA 117 d & e 1,286 1,360 1,360
Chesapeake Bay Regulatory and Accountability4 EPA CBRAP 3,037 2,438 8,726
Chesapeake Bay Implementation EPA CBIG 0 10,716 0
Leaking Underground Storage Tank EPA LUST 883 868 883
Leaking Underground Storage Tank Prevention EPA LUST Prevention 512 512 513
PPG 106 Water5 EPA CWA 106 2,073 2,125 2,073
PPG 105 Air6 EPA CAA 105 1,786 1,760 1,764
PPG RCRA7 EPA RCRA 1,194 1,205 1,200
Water Quality EPA 604B 103 103 103
Coastal Zone Management NOAA CZM 1,050 1,001 1,249
Department of Game and Inland Fisheries
Fisheries and Aquatic Habitat USFWS Sportfish Restoration 2,001 1,794 977
Species of Conservation Need and Habitat USFWS State Wildlife Grants 723 514 215
Wildlife and Terrestrial Habitat USFWS Wildlife Restoration 3,562 3,143 2,599
Land Acquisition USFWS Wildlife Restoration 0 826 11,648
27
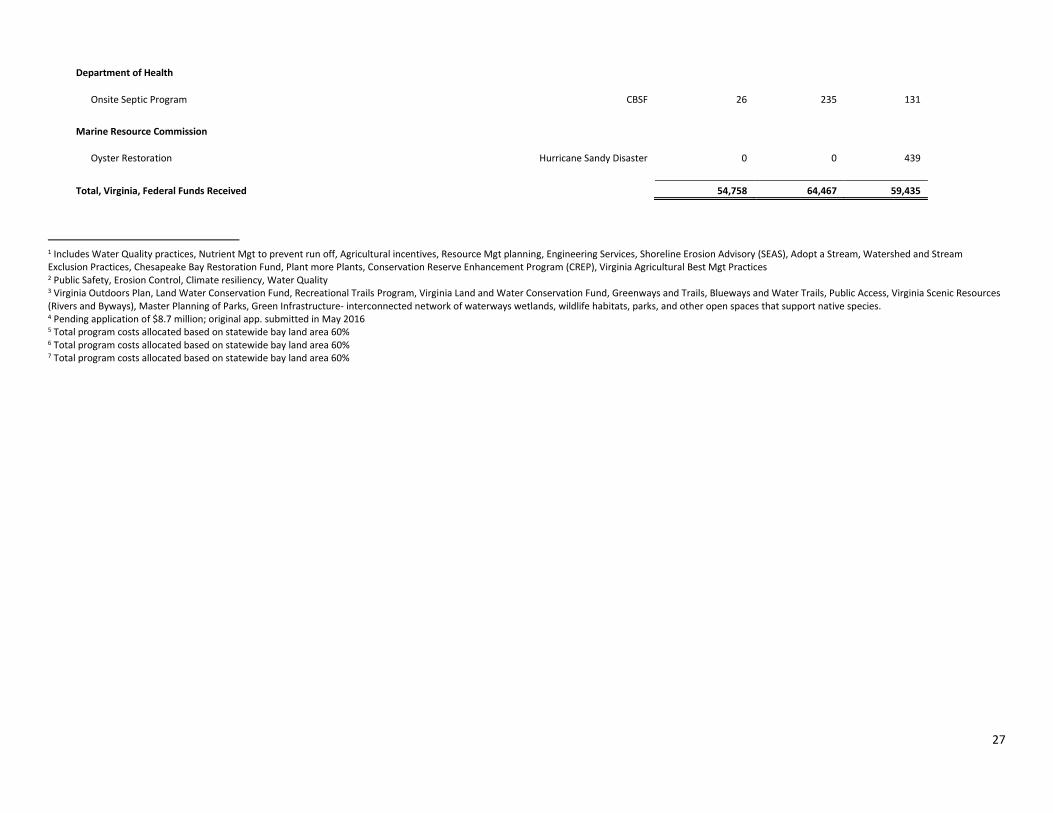
Department of Health
Onsite Septic Program CBSF 26 235 131
Marine Resource Commission
Oyster Restoration Hurricane Sandy Disaster 0 0 439
Total, Virginia, Federal Funds Received 54,758 64,467 59,435
1 Includes Water Quality practices, Nutrient Mgt to prevent run off, Agricultural incentives, Resource Mgt planning, Engineering Services, Shoreline Erosion Advisory (SEAS), Adopt a Stream, Watershed and Stream Exclusion Practices, Chesapeake Bay Restoration Fund, Plant more Plants, Conservation Reserve Enhancement Program (CREP), Virginia Agricultural Best Mgt Practices 2 Public Safety, Erosion Control, Climate resiliency, Water Quality 3 Virginia Outdoors Plan, Land Water Conservation Fund, Recreational Trails Program, Virginia Land and Water Conservation Fund, Greenways and Trails, Blueways and Water Trails, Public Access, Virginia Scenic Resources (Rivers and Byways), Master Planning of Parks, Green Infrastructure- interconnected network of waterways wetlands, wildlife habitats, parks, and other open spaces that support native species. 4 Pending application of $8.7 million; original app. submitted in May 2016 5 Total program costs allocated based on statewide bay land area 60% 6 Total program costs allocated based on statewide bay land area 60% 7 Total program costs allocated based on statewide bay land area 60%
28
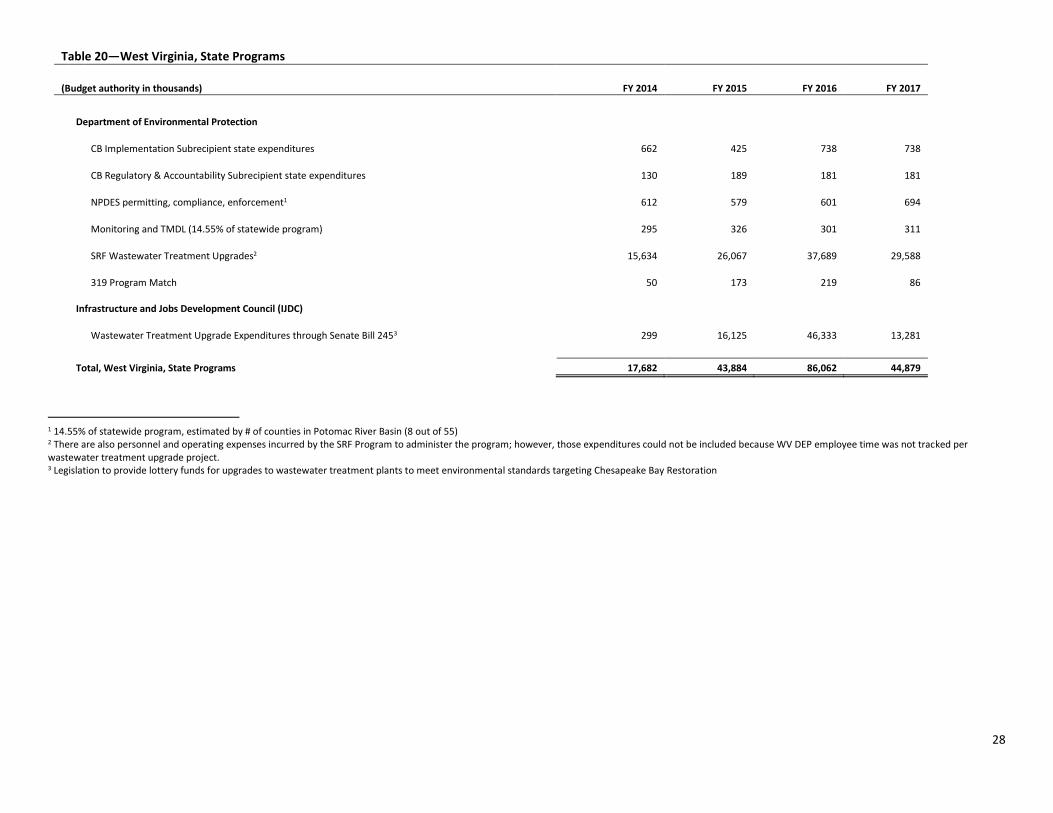
Table 20—West Virginia, State Programs
(Budget authority in thousands) FY 2014 FY 2015 FY 2016 FY 2017
Department of Environmental Protection
CB Implementation Subrecipient state expenditures 662 425 738 738
CB Regulatory & Accountability Subrecipient state expenditures 130 189 181 181
NPDES permitting, compliance, enforcement1 612 579 601 694
Monitoring and TMDL (14.55% of statewide program) 295 326 301 311
SRF Wastewater Treatment Upgrades2 15,634 26,067 37,689 29,588
319 Program Match 50 173 219 86 Infrastructure and Jobs Development Council (IJDC)
Wastewater Treatment Upgrade Expenditures through Senate Bill 2453 299 16,125 46,333 13,281
Total, West Virginia, State Programs 17,682 43,884 86,062 44,879
1 14.55% of statewide program, estimated by # of counties in Potomac River Basin (8 out of 55) 2 There are also personnel and operating expenses incurred by the SRF Program to administer the program; however, those expenditures could not be included because WV DEP employee time was not tracked per wastewater treatment upgrade project. 3 Legislation to provide lottery funds for upgrades to wastewater treatment plants to meet environmental standards targeting Chesapeake Bay Restoration

29
Table 21—West Virginia, Federal Funds Received
(Budget authority in thousands) Federal Agency Federal Program FY 2014 FY 2015 FY 2016
Department Environmental Protection
CB Implementation EPA CB Program 1,550 1,550 1,550
CB Regulatory & Accountability EPA CB Program 672 672 672
Water Pollution Control1 EPA CWA 106 Program 328 316 325
319 Program EPA CWA 319 75 287 209
CB Non-Tidal EPA CB Program 210 210 210
WQ Management Planning2 EPA WQ Management Planning 101 32 21
Total, West Virginia, Federal Funds Received 2,936 3,067 2,987
1 14.55% of statewide program, estimated by # of counties in Potomac River Basin (8 out of 55) 2 14.55% of statewide program and sub-awards issued to Potomac River Basin Projects