Cherry Picking Paper 11-03d1c25a6gwz7q5e.cloudfront.net/papers/1235.pdf · 2 Cherry Picking Using...
29
Cherry Picking Edward J. Fox (Southern Methodist University)* Stephen J. Hoch (Wharton School, University of Pennsylvania)** (keywords: cherry picking, retail, shopping behavior, customer types) June 2003 * Assistant Professor of Marketing, Edwin L. Cox School of Business, Southern Methodist University, Dallas, TX phone: 214-768 3943, http://faculty.cox.smu.edu/efox.html **John J. Pomerantz Professor, Chair of Marketing Department, Wharton School University of Pennsylvania, Philadelphia, PA 19104, 215 898-0233, http://www- marketing.wharton.upenn.edu/people/faculty/hoch.html
Transcript of Cherry Picking Paper 11-03d1c25a6gwz7q5e.cloudfront.net/papers/1235.pdf · 2 Cherry Picking Using...
Cherry Picking
Edward J. Fox (Southern Methodist University)* Stephen J. Hoch (Wharton School, University of Pennsylvania)**
(keywords: cherry picking, retail, shopping behavior, customer types)
June 2003
* Assistant Professor of Marketing, Edwin L. Cox School of Business, Southern Methodist University, Dallas, TX phone: 214-768 3943, http://faculty.cox.smu.edu/efox.html **John J. Pomerantz Professor, Chair of Marketing Department, Wharton School University of Pennsylvania, Philadelphia, PA 19104, 215 898-0233, http://www-marketing.wharton.upenn.edu/people/faculty/hoch.html
2
Cherry Picking
Using two years of household panel data, we compare the behaviors of cherry picking shoppers to other consumer shopping segments— store switchers and store loyals. For present purposes, we define cherry pickers (18% of the sample) as households that shopped at two or more grocery stores on the same day at least once per month. Households are defined as store loyals (27%) if they shopped at a single retailer more than 80% of the time. The rest of the households as classified as switchers (55%), because they shopped at multiple retailers but not on the same day. Although cherry picker households are more likely to be elderly and have slightly lower incomes, demographic and geographic differences are minor. However, significant differences in both within and across store shopping behavior do emerge. Cherry pickers shop more often, and buy more merchandise that is on deal and feature advertised. They buy larger quantities and pay lower unit prices even after controlling for package size. This greater price sensitivity is accompanied by both lower brand and store loyalty. We calculate the economic surplus that consumers gain from shopping more than one store on a given day. Across all shoppers, the extra savings is $15.05, with cherry pickers saving $17.45 compared to $10.89 for switchers and $8.68 for store loyals. Part of the savings comes from shoppers saving about 5%/item over and above what they save on single store shopping occasions. A bigger part of the savings is due to the fact that shoppers spend about two-thirds more when they cherry pick, indicating that there is a reasonable level of planning and forethought when making the decision to cherry pick. Irrespective of exactly how one calculates the incremental time taken to visit one extra store and per capita wage rates, the surplus generated appears economically justifiable for the average shopper given reasonable estimates of opportunity costs. Finally, we find that it is the shopper’s secondary stores that absorb a disproportionate cost of cherry picking. Not only do consumers save six percentage points more at secondary stores, but secondary stores capture only 60% of the expenditures made at the primary store on the same day.

3
Cherry Picking
Merriam-Webster Dictionary defines cherry picking as “selecting the best or most
desirable” or to describe one idiom with another “taking the pick of the litter.” The term
cherry picking is used to describe the behavior of both sellers and buyers in a variety of
settings. Sometimes the phrase is used to describe a seller who is selective about which
customers they wish to serve. For example, Southwest Airlines cherry picks price
sensitive travelers who place little premium on standard airline perks and Dell Computer
cherry picks customers who are capable of buying over the Internet and are savvy enough
to make the necessary customization choices without much hand holding. Both of these
firms choose not to serve other customers with a higher willingness to pay because it
would require significant changes to efficient operating models. The Cambridge
International Dictionary of Idioms defines cherry picking as choosing “only the best
people or things in a way that is not fair”, as when financial institutions and insurance
companies are vilified because they refuse to serve high-risk populations. The term also
describes behavior of buyers who are selective about which products or services they
purchase at what locations and prices. In both the seller and buyer contexts, the essential
meaning of cherry picking is the same— take the best and leave the rest.
This paper focuses on cherry-picking behavior on the buyer side. In the context
of buying at retail, there are a number of different ways that customers can take the best
and leave the rest. Cherry picking clearly can occur within a single store visit. Literally,
consumers can stand at the colorful end-cap display of Mt. Rainer cherries in June and
pick through each and every cherry, choosing the largest and plumpest and leaving
behind smaller, bruised or overripe ones. Some retailers do not appreciate cherry picking

4
of their produce and so pre-package it (think strawberries), avoiding both the wear and
tear from excessive handling and ensuring that later consumers will also encounter a
good quality selection. More than one American tourist, accustomed to supermarket self-
service, has been caught off guard by the reaction of an open air produce vendor in Asia
or Europe who acts as if picking one’s own is an affront to their very reputation.
Levy and Weitz (2004) define cherry pickers as customers who visit a store and
only buy merchandise sold at big discounts. This is more difficult to do in the context of
grocery shopping, especially when consumers display high store loyalty, because of the
many replenishment purchases not easily deferrable. But if consumers are not store
loyal, then they can follow Consumer Reports’ (1988) advice to “scrutinize the food-day
ads and 'cherry pick' the specials” (p. 158). Some industry experts believe that this type
of shopping behavior is on the rise— "For many Americans, the ... hunt for value has
replaced loyalty as a deciding factor in planning which stores to patronize - and how
many. Instead of going to the same outlet each week, every week, to complete their
grocery shopping, price-conscious consumers often visit more than one store in search of
special prices - a bargain-hunting practice known in the industry as ‘cherry picking.’”
(Mogelonsky 1994).
Recent store choice research has shown that store loyalty is low (Woolf 1994), as
the typical shopper visits supermarkets 2.2 times/week but shops 3-4 different chains on a
regular basis. Ehrenberg and colleagues (Kau and Ehrenberg 1984, Uncles and
Ehrenberg 1990) documented very high levels of penetration by competitive retailers
over a year period. Frisbie (1980) found that households average one major shopping trip
and two filler trips/week, where a filler trip is one where spending is <20% of the weekly

5
average. Kahn and Schmittlein (1989) uncovered two shopper segments: quicks, the one
third of shoppers who average two small and one large trip/week; and regulars, the two
thirds of shoppers that average one large trip/week and one quick trip every other week.
The fact that consumers make many trips per week to buy groceries and frequent a
diverse portfolio of different retailers leads to plenty of opportunities to cherry pick both
within and across stores.
Let us imagine a market with two grocery chains, say Jewel and Dominick’s Finer
Foods for example. The preceding comments imply that consumers can cherry pick in at
least two related ways. First, each week they can decide which chain to visit depending
on where they expect to get the best deals. Each week they buy their complete market
basket at the one store that they visit. Store switching across weeks in this manner would
seem to increase the number of cherry picking opportunities as compared to consumers
who are store loyal. Moreover, the transaction costs associated with switching stores
across weeks do not seem to be much greater than those incurred by store loyal shoppers,
assuming that travel costs to stores from which they choose are similar and that
consumers switch often enough so that they are adequately familiar with store layouts.
Second, shoppers could engage in a more extreme version of cherry picking,
where store switching occurs within weeks. In this case customers split their market
basket of purchases across stores within a week (or potentially within the same day) to
benefit from deals offered by different stores— in essence cherry picking two stores rather
than just one. Since grocery retailers typically offer new specials each and every week
and often have uncoordinated promotions on the same brands (Drèze 1999; Lal 1990),
this second form of shopping behavior offers many more cherry picking opportunities.
6
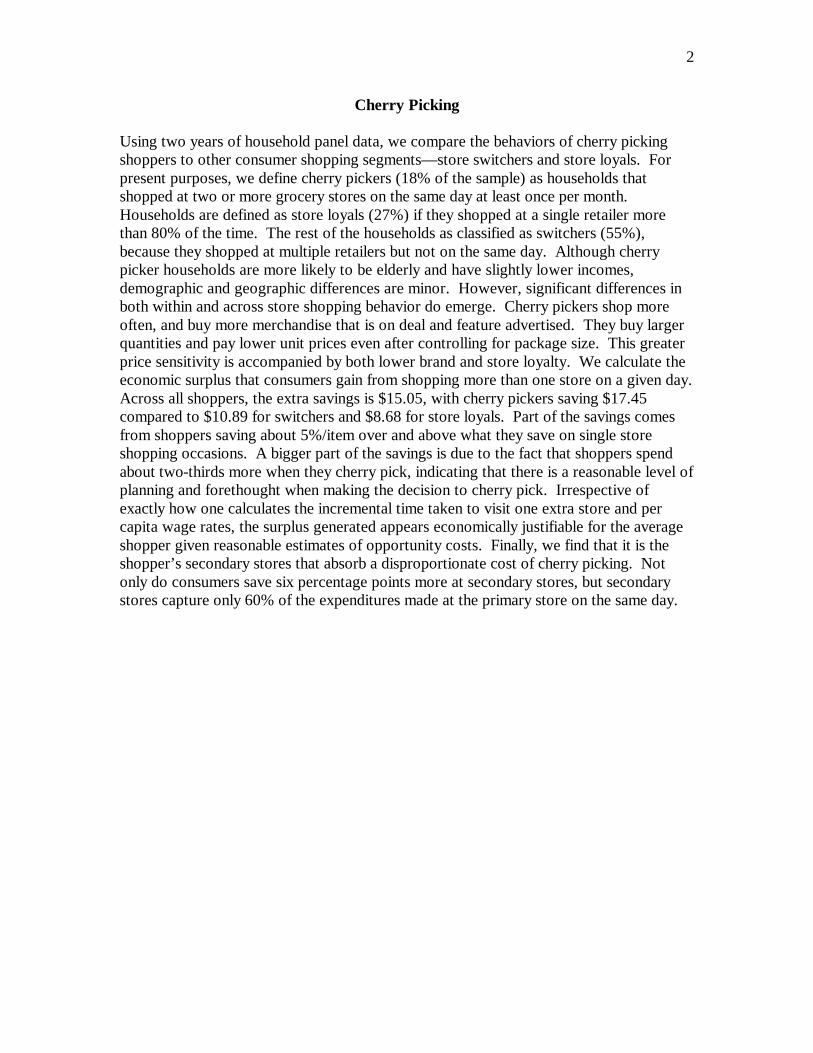
The nature of these opportunities is illustrated in Figure 1, a histogram of the
differences in prices at Jewel and Dominick’s for about 21,000 sku’s over a several week
period. The average difference in prices is about 10% even though the average prices in
the two chains are almost identical. Moreover, there is substantial surplus available to the
cherry picker that is selective about which cherries they pick. For example, the top decile
of price differences is 41%, the second decile 21%, and the third 14%.
Figure 1: Histogram of Differences in Prices Across Chains
But unlike cherry picking across weeks, within week (or day) cherry picking is likely to
substantially increase transaction costs. Compared to time-constrained shoppers, cherry
pickers apparently have lower opportunity costs of time and are therefore willing to
search for information on deals and visit more than one store to benefit from them (Lal
and Rao 1997).
As pointed out by Drèze (1999), retailers bemoan this second form of extreme
cherry picking because it is seen as damaging to margins (e.g., MMR 2002) and
penalizing to the practice of using loss leader pricing to increase store traffic. Loss leader
0.00%
5.00%
10.00%
15.00%
20.00%
25.00%
30.00%
35.00%
1% 6% 11%
16%
21%
26%
31%
36%
41%
46%
51%
56%
61%
66%
71%
Discount
Obs
erva
tions
Top Decile
39% Surplus
2nd Decile
21% Surplus
3rd Decile
14% Surplus
Difference in Prices Across Stores

7
pricing involves the retailer aggressively pricing a few key items below cost in order to
bring more consumers into the store with the hope that either: (a) on that occasion the
consumer will buy a market-basket of goods including both sale- and regular-priced
merchandise; and/or (b) the consumer will enjoy the shopping experience, evincing a
higher probability of patronizing the store in the future and so increasing store traffic in
the long-run. Instead extreme cherry picking consumers only buy deeply discounted
items and go elsewhere to do the rest of their weekly shopping for household goods.
Retailers vilify cherry pickers but, excepting quantity limits, have not developed effective
mechanisms for discouraging the practice. At one point retailers had hoped that frequent
shopper cards could serve such a purpose, but that has not happened.
We view cherry picking as one end of the price sensitivity/deal proneness
continuum. In terms of models of horizontal competition in the Hotelling tradition,
cherry pickers are assumed to have very low travel and search costs (Narasimhan 1988;
Raju et al 1988).
The goal of this paper is to gain an in depth understanding of the shopping
behavior of consumers in the far right tail of the cherry picking distribution, specifically
shoppers who visit two or more grocery stores on the same day at least once per month
(actually this group averaged more than two cherry picking occasions per month), as
compared with shoppers whose cherry picking behaviors are less extreme. There is
nothing magical about this cut-off except that it guarantees that the group to be examined
is fairly committed to what might be considered by many to be a perverse form of
shopping behavior. Because there are obvious time and travel costs associated with such
vigilant cherry picking, we attempt to calculate the surplus (money saved) gained through

8
such behavior and argue that it represents a reasonable estimate of shoppers’ opportunity
costs of time. We find that the savings on cherry picking days average over $15 more
than that saved on single store days. This economic benefit exceeds the opportunity costs
of the extra store visit for about half of consumers (at a median income of $30,000/year).
The Study
The remainder of the paper is organized as follows. The next section describes
the data and presents our typology of shopping behaviors— store loyals, switchers and
cherry pickers. Comparing and contrasting these shopper types, the following section
examines demographic and geographic characteristics, general shopping behaviors, and
in-store shopping behaviors. This section also links within and between store shopping
by relating store loyalty to brand loyalty. The next section measures the economic
returns that shoppers generate by cherry picking and includes a comparison of cherry
picking versus single-store shopping occasions. Drilling down into cherry picking
occasions, this section also investigates differences in shopping behavior on primary
(larger) and secondary (smaller) store visits while cherry picking. The concluding
section discusses the results of our study, its limitations and future research.
Data Source
The data come from a multi-outlet IRI household panel in Chicago covering a
two-year period (104 weeks) between October 1995 and October 1997. This dataset is
different from the majority of panel datasets used in academic research because panelists
record their purchases using in-home scanning equipment, so their purchase histories are
not limited to the usual small sample of stores. All purchases, including the UPCs of
packaged goods purchases, are captured on all trips to a wide variety of retailers. Our
9
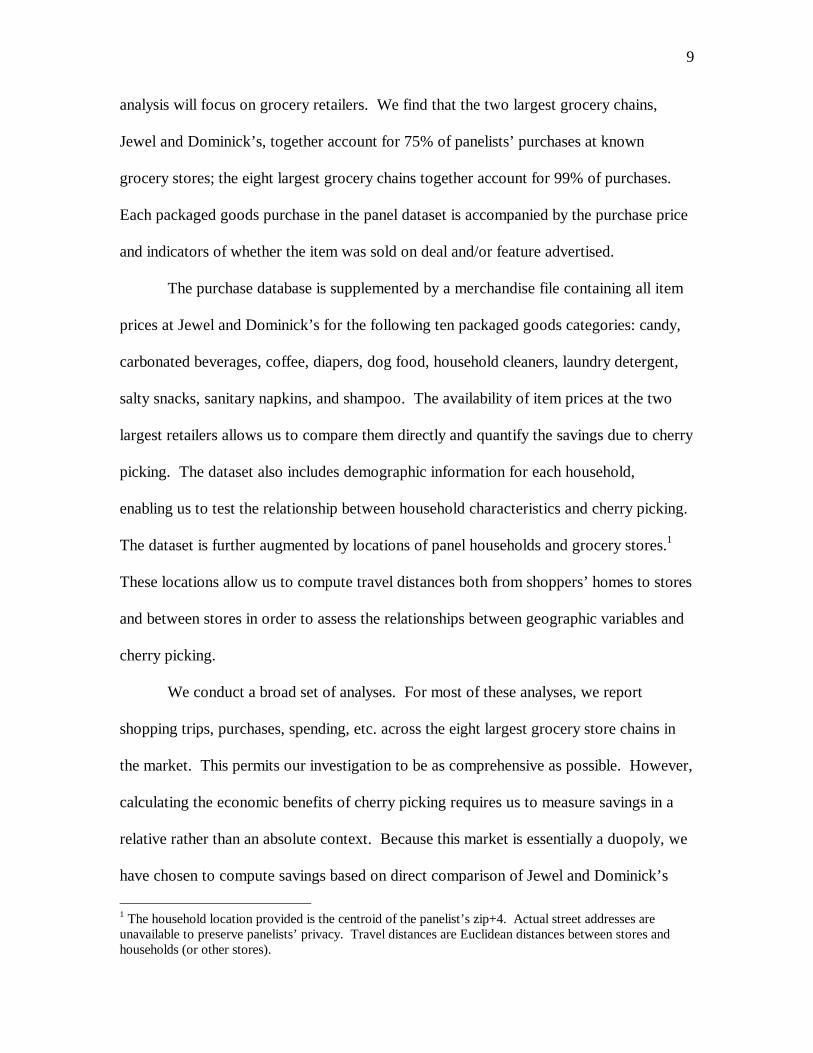
analysis will focus on grocery retailers. We find that the two largest grocery chains,
Jewel and Dominick’s, together account for 75% of panelists’ purchases at known
grocery stores; the eight largest grocery chains together account for 99% of purchases.
Each packaged goods purchase in the panel dataset is accompanied by the purchase price
and indicators of whether the item was sold on deal and/or feature advertised.
The purchase database is supplemented by a merchandise file containing all item
prices at Jewel and Dominick’s for the following ten packaged goods categories: candy,
carbonated beverages, coffee, diapers, dog food, household cleaners, laundry detergent,
salty snacks, sanitary napkins, and shampoo. The availability of item prices at the two
largest retailers allows us to compare them directly and quantify the savings due to cherry
picking. The dataset also includes demographic information for each household,
enabling us to test the relationship between household characteristics and cherry picking.
The dataset is further augmented by locations of panel households and grocery stores.1
These locations allow us to compute travel distances both from shoppers’ homes to stores
and between stores in order to assess the relationships between geographic variables and
cherry picking.
We conduct a broad set of analyses. For most of these analyses, we report
shopping trips, purchases, spending, etc. across the eight largest grocery store chains in
the market. This permits our investigation to be as comprehensive as possible. However,
calculating the economic benefits of cherry picking requires us to measure savings in a
relative rather than an absolute context. Because this market is essentially a duopoly, we
have chosen to compute savings based on direct comparison of Jewel and Dominick’s
1 The household location provided is the centroid of the panelist’s zip+4. Actual street addresses are unavailable to preserve panelists’ privacy. Travel distances are Euclidean distances between stores and households (or other stores).
10
prices in the ten categories where we have item-level price information. We then
extrapolate from these sample categories to the entire market basket in order to assess the
magnitude of savings. Using this approach, our analysis of the economic benefits of
cherry picking includes a sample of 23,452 individual purchases made during 9,973
shopping trips. We should also point out that our analyses of store loyalty and store
switching refer to behavior across, not within, store chains. After all, the retailer’s
primary interest is that shoppers patronize its stores, not that they choose any particular
store in preference to others in the same chain.
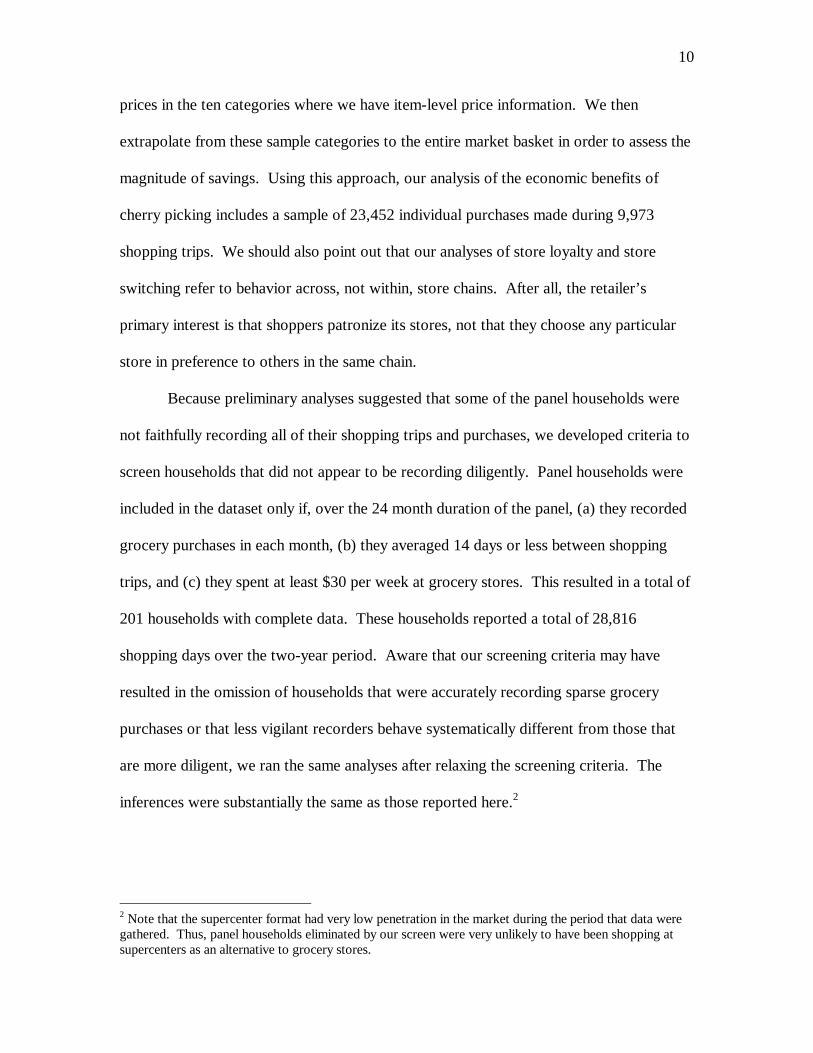
Because preliminary analyses suggested that some of the panel households were
not faithfully recording all of their shopping trips and purchases, we developed criteria to
screen households that did not appear to be recording diligently. Panel households were
included in the dataset only if, over the 24 month duration of the panel, (a) they recorded
grocery purchases in each month, (b) they averaged 14 days or less between shopping
trips, and (c) they spent at least $30 per week at grocery stores. This resulted in a total of
201 households with complete data. These households reported a total of 28,816
shopping days over the two-year period. Aware that our screening criteria may have
resulted in the omission of households that were accurately recording sparse grocery
purchases or that less vigilant recorders behave systematically different from those that
are more diligent, we ran the same analyses after relaxing the screening criteria. The
inferences were substantially the same as those reported here.2
2 Note that the supercenter format had very low penetration in the market during the period that data were gathered. Thus, panel households eliminated by our screen were very unlikely to have been shopping at supercenters as an alternative to grocery stores.

11
Classifying Shoppers
As mentioned earlier, we view cherry picking as a continuum much like a
shopper’s degree of price sensitivity or deal proneness. Our research strategy is to isolate
a group of shoppers at the extreme tail of the distribution, people who display a major
commitment to cherry picking over a significant time interval, and compare their
behavior to that of the rest of the shopping population. For the purpose at hand,
households are labeled cherry pickers if they shop at two grocery stores on the same day
at least once per month. Clearly, this operationalization misses some cherry picking
households who, with complete foresight, visit two or more stores on different days
during the same week to acquire that week’s worth of provisions. At the same time, we
avoid confusing fill-in trips, where the consumer runs out of items or forgets to get
everything on their list, with a pre-planned and purposeful attempt to split their complete
market basket of purchases in order to save money. We find that 36?201 = 18% of
shoppers meet or exceed the once per month cherry picking cut-off; in fact the average
number of cherry picking occasions per month (days when the household visits two or
more stores) for this group is 2.3 or 25% of the 9.4 total shopping occasions/month).
The remaining 82% of the sample cherry picks less frequently (on average 0.3
times/month). However, there is substantial heterogeneity in this group and so we divide
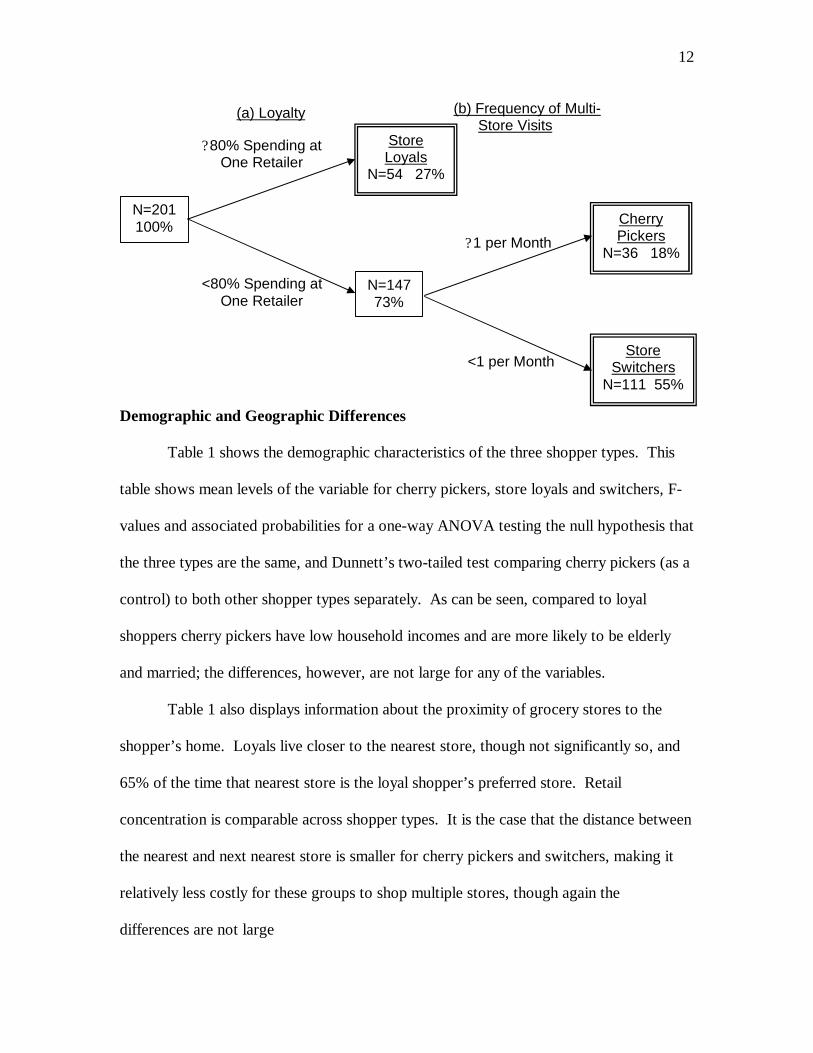
the complete sample according to the scheme shown in Figure 2, where shopper types are
determined by two factors: (a) extent of store loyalty, and (b) frequency of same day
multi-store visits. Store switchers represent 55% of the sample and store loyals 27%.
Figure 2: Classification of Shopper Types
12
Demographic and Geographic Differences
Table 1 shows the demographic characteristics of the three shopper types. This
table shows mean levels of the variable for cherry pickers, store loyals and switchers, F-
values and associated probabilities for a one-way ANOVA testing the null hypothesis that
the three types are the same, and Dunnett’s two-tailed test comparing cherry pickers (as a
control) to both other shopper types separately. As can be seen, compared to loyal
shoppers cherry pickers have low household incomes and are more likely to be elderly
and married; the differences, however, are not large for any of the variables.
Table 1 also displays information about the proximity of grocery stores to the
shopper’s home. Loyals live closer to the nearest store, though not significantly so, and
65% of the time that nearest store is the loyal shopper’s preferred store. Retail
concentration is comparable across shopper types. It is the case that the distance between
the nearest and next nearest store is smaller for cherry pickers and switchers, making it
relatively less costly for these groups to shop multiple stores, though again the
differences are not large
Cherry Pickers
N=36 18%
N=201100%
Store Loyals
N=54 27%
<80% Spending at One Retailer
N=14773%
(a) Loyalty
Store Switchers
N=111 55%
? 1 per Month
<1 per Month
(b) Frequency of Multi-Store Visits
? 80% Spending at One Retailer
13
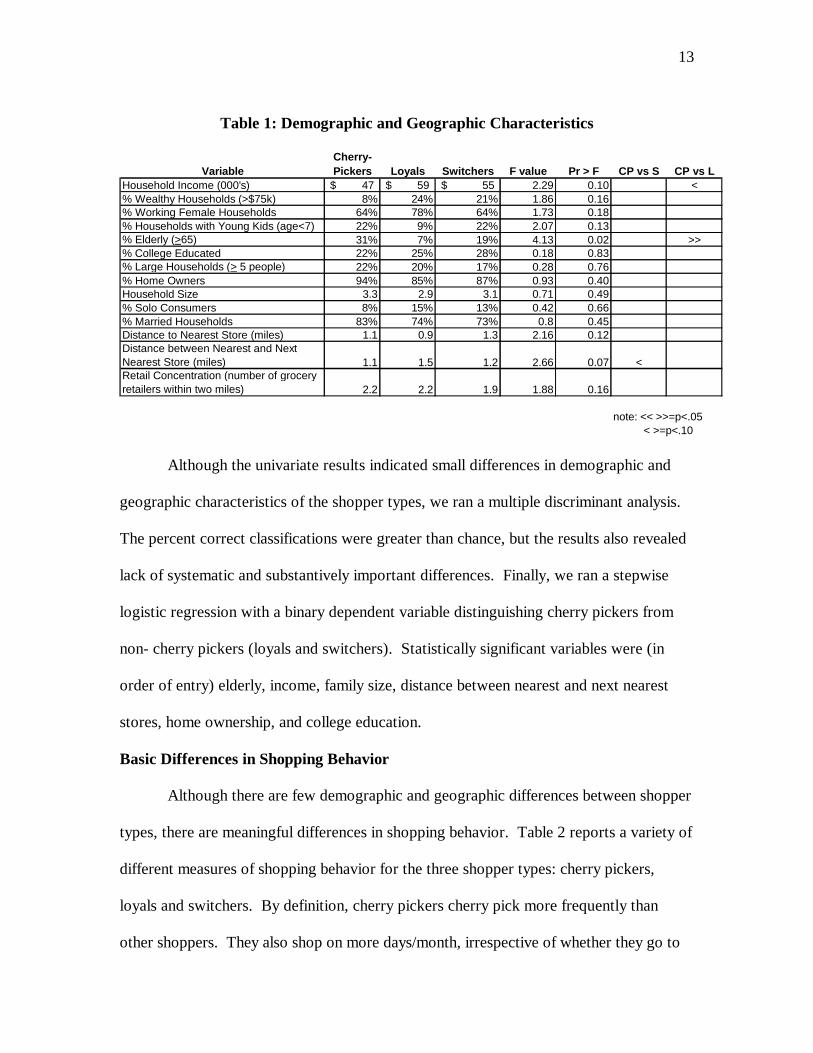
Table 1: Demographic and Geographic Characteristics
VariableCherry-Pickers Loyals Switchers F value Pr > F CP vs S CP vs L
Household Income (000's) 47$ 59$ 55$ 2.29 0.10 <% Wealthy Households (>$75k) 8% 24% 21% 1.86 0.16% Working Female Households 64% 78% 64% 1.73 0.18% Households with Young Kids (age<7) 22% 9% 22% 2.07 0.13% Elderly (>65) 31% 7% 19% 4.13 0.02 >>% College Educated 22% 25% 28% 0.18 0.83% Large Households (> 5 people) 22% 20% 17% 0.28 0.76% Home Owners 94% 85% 87% 0.93 0.40Household Size 3.3 2.9 3.1 0.71 0.49% Solo Consumers 8% 15% 13% 0.42 0.66% Married Households 83% 74% 73% 0.8 0.45Distance to Nearest Store (miles) 1.1 0.9 1.3 2.16 0.12Distance between Nearest and Next Nearest Store (miles) 1.1 1.5 1.2 2.66 0.07 <Retail Concentration (number of grocery retailers within two miles) 2.2 2.2 1.9 1.88 0.16
note: << >>=p<.05 < >=p<.10
Although the univariate results indicated small differences in demographic and
geographic characteristics of the shopper types, we ran a multiple discriminant analysis.
The percent correct classifications were greater than chance, but the results also revealed
lack of systematic and substantively important differences. Finally, we ran a stepwise
logistic regression with a binary dependent variable distinguishing cherry pickers from
non- cherry pickers (loyals and switchers). Statistically significant variables were (in
order of entry) elderly, income, family size, distance between nearest and next nearest
stores, home ownership, and college education.
Basic Differences in Shopping Behavior
Although there are few demographic and geographic differences between shopper
types, there are meaningful differences in shopping behavior. Table 2 reports a variety of
different measures of shopping behavior for the three shopper types: cherry pickers,
loyals and switchers. By definition, cherry pickers cherry pick more frequently than
other shoppers. They also shop on more days/month, irrespective of whether they go to

14
only one or more stores, 38% more often than loyals and 27% more often than switchers.
By virtue of their higher shopping frequency, cherry pickers spend less and buy fewer
units per shopping day. They also wait for a shorter interval between shopping days.
Table 2: General Shopping Behavior Cherry-Pickers Loyals Switchers F value Pr > F CP vs S CP vs L
% of Shopping Days with Cherry Picking 24% 2% 6% 1489.98 0.0000 >> >>Shopping Days/Month 9.4 6.8 7.4 114.62 0.0000 >> >>Cherry Picking Days/Month 2.0 0.1 0.3 238.81 0.0000 >> >>Spending/Shopping Day $67 $82 $71 137.28 0.0000 << <<Number of Items/Shopping Day 30 38 33 111.38 0.0000 << <<Inter-Shopping Interval (# Days between Shopping Days) 4.1 5.5 6.1 274.8 0.0000 << <<$ Spending/Month Grocery $615 $527 $490 69.69 0.0000 >> >>$ Spending/Month Non-Grocery (Mass, Drug, Club) $271 $244 $288 12.99 0.0000 >>Total $ Spending Across Channels $886 $778 $771 25.46 0.0000 >> >>
note: << >>=p<.05 < >=p<.10
Table 2 also indicates that cherry pickers report spending more money at grocery
stores, as well as across retail formats (grocery, drug and club stores and mass
merchandisers), than the other two groups. It is not clear exactly what to make of this
difference since household sizes are comparable across groups and, by virtue of lower
household incomes, cherry pickers generally face a more severe budget constraint. We
offer two possible explanations for this result. An interesting possibility is that cherry
pickers eat out less frequently, which is possible given their lower household incomes.
This implies that grocery purchases are an inferior good, given the alternative of eating
outside the home. This conjecture is consistent with survey results from the Food
Marketing Institute (2002). Unfortunately, panel members do not report whether they eat
in versus out of home, so we cannot test this conjecture in our data. A second possibility
is that cherry pickers were more vigilant than other panelists in recording all of their
purchases. Given their obvious commitment to shopping, we cannot rule this out. We

15
are confident, however, that our substantive conclusions are unaffected if this is the case;
we conducted a variety of sensitivity analyses including or excluding lower spending
loyals and switchers and found our results were robust to the selection criteria.
Figure 3 shows each type’s shopping frequency by the day of the week. Cherry
pickers and loyals display similar patterns, where the three biggest shopping days are
Sunday followed by Friday and Saturday. Cherry pickers shop 52% of the time on those
three days and switchers 48%. Loyals also shop extensively on Sunday but shop just as
frequently on Mondays.
Figure 3: Shopping by Day of the Week
0%
5%
10%
15%
20%
25%
Mon Tues Wed Thurs Fri Sat Sun
Day of Week
Per
cent
of S
hopp
ing
Day
s
LoyalsSwitchers
Cherry Pickers
Within Store Shopping Behavior
Table 3 shows differences in within store buying behavior for the three shopper
types. These results clearly show that cherry pickers are more sensitive to in-store
promotions and more likely to buy products that carry a temporary price discount: 36%
more likely than loyals and 19% more likely than switchers. They also are more likely to
buy products that are feature advertised, probably because they are more vigilant in
reading retailers’ feature ads (Urbany, Dickson and Key 1991 and Urbany, Dickson and
Sawyer 2000 hint at this), though we cannot observe this directly. Cherry pickers are
16
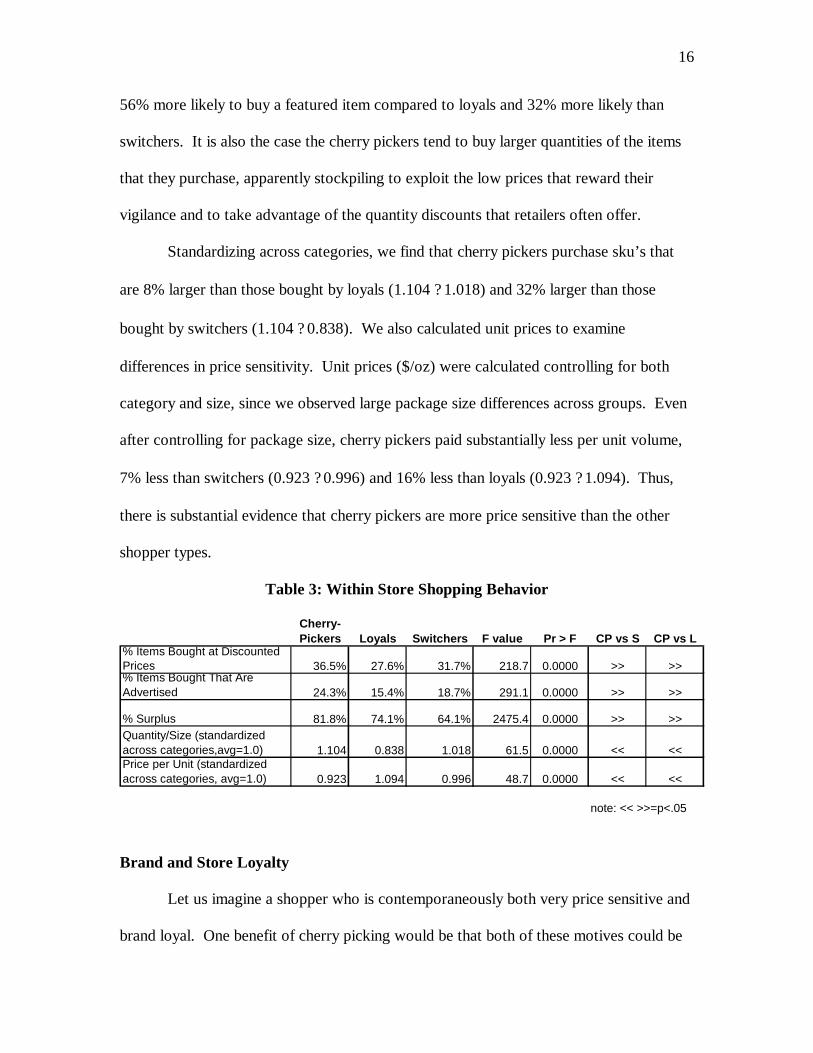
56% more likely to buy a featured item compared to loyals and 32% more likely than
switchers. It is also the case the cherry pickers tend to buy larger quantities of the items
that they purchase, apparently stockpiling to exploit the low prices that reward their
vigilance and to take advantage of the quantity discounts that retailers often offer.
Standardizing across categories, we find that cherry pickers purchase sku’s that
are 8% larger than those bought by loyals (1.104 ? 1.018) and 32% larger than those
bought by switchers (1.104 ? 0.838). We also calculated unit prices to examine
differences in price sensitivity. Unit prices ($/oz) were calculated controlling for both
category and size, since we observed large package size differences across groups. Even
after controlling for package size, cherry pickers paid substantially less per unit volume,
7% less than switchers (0.923 ? 0.996) and 16% less than loyals (0.923 ? 1.094). Thus,
there is substantial evidence that cherry pickers are more price sensitive than the other
shopper types.
Table 3: Within Store Shopping Behavior
Cherry-Pickers Loyals Switchers F value Pr > F CP vs S CP vs L
% Items Bought at Discounted Prices 36.5% 27.6% 31.7% 218.7 0.0000 >> >>% Items Bought That Are Advertised 24.3% 15.4% 18.7% 291.1 0.0000 >> >>
% Surplus 81.8% 74.1% 64.1% 2475.4 0.0000 >> >>Quantity/Size (standardized across categories,avg=1.0) 1.104 0.838 1.018 61.5 0.0000 << <<Price per Unit (standardized across categories, avg=1.0) 0.923 1.094 0.996 48.7 0.0000 << <<
note: << >>=p<.05 Brand and Store Loyalty
Let us imagine a shopper who is contemporaneously both very price sensitive and
brand loyal. One benefit of cherry picking would be that both of these motives could be
17
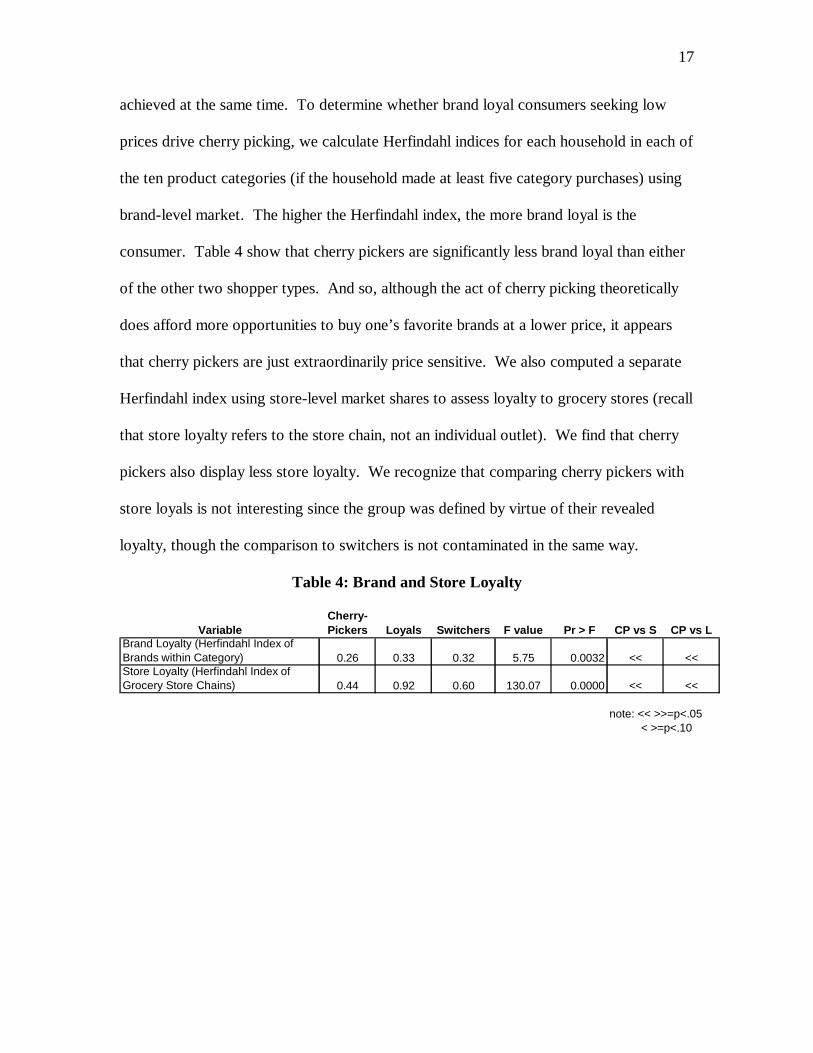
achieved at the same time. To determine whether brand loyal consumers seeking low
prices drive cherry picking, we calculate Herfindahl indices for each household in each of
the ten product categories (if the household made at least five category purchases) using
brand-level market. The higher the Herfindahl index, the more brand loyal is the
consumer. Table 4 show that cherry pickers are significantly less brand loyal than either
of the other two shopper types. And so, although the act of cherry picking theoretically
does afford more opportunities to buy one’s favorite brands at a lower price, it appears
that cherry pickers are just extraordinarily price sensitive. We also computed a separate
Herfindahl index using store-level market shares to assess loyalty to grocery stores (recall
that store loyalty refers to the store chain, not an individual outlet). We find that cherry
pickers also display less store loyalty. We recognize that comparing cherry pickers with
store loyals is not interesting since the group was defined by virtue of their revealed
loyalty, though the comparison to switchers is not contaminated in the same way.
Table 4: Brand and Store Loyalty
VariableCherry-Pickers Loyals Switchers F value Pr > F CP vs S CP vs L
Brand Loyalty (Herfindahl Index of Brands within Category) 0.26 0.33 0.32 5.75 0.0032 << <<Store Loyalty (Herfindahl Index of Grocery Store Chains) 0.44 0.92 0.60 130.07 0.0000 << <<
note: << >>=p<.05 < >=p<.10

18
Economic Surplus Generated by Cherry Picking
The previous analyses show that as a group cherry pickers are more sensitive to
in-store temporary price discounts, pay more attention to feature advertising, and pay less
per unit than other shoppers. Moreover, they are less brand and store loyal. The overall
portrait suggests that cherry pickers reside in the upper tail of the price sensitivity and
deal proneness distributions, clearly more price sensitive than store loyals but also more
price sensitive than store switchers. One key unresolved question is whether cherry
pickers behave in the observed manner because: (1) their cherry picking behavior affords
them a greater number of opportunities to take advantage of lower prices; (2) their cherry
picking behavior simply is a reflection of their greater price sensitivity; or (3) both of
these effects. Another important issue is whether there is any economic justification for
cherry picking. Clearly, cherry pickers shop more often than other people. Undoubtedly
they may experience some transaction utility from being a market maven (Feick and
Price 1987) and a smart shopper (Schindler 1992). Beyond these psychological benefits,
however, it is interesting to see whether cherry pickers save enough money to justify the
extra store visit. Our priors were that the savings would be modest at best; it turns out
that we were wrong. The next set of analyses sets out to answer these questions by
examining cherry picking shopping days versus single store visit days, first for the entire
sample of shoppers and then broken down by shopper type.
Cherry Picking Versus Single Store Shopping Days: For each shopper on each
shopping day at Jewel and/or Dominick’s, we determined whether they paid the lower or
higher price at those two retailers for all purchases in the ten categories for which we
have detailed price data. We also calculated the amount that they saved relative to the

19
higher price. Recall that the large majority of panelist purchases across all categories
were made at Jewel and Dominick’s, so direct comparison of these two alternatives is
appropriate. For simplicity of presentation, the first set of analyses ignores shopper types
and simply examines shopping behavior on cherry picking days (when a shopper visits
two stores) compared to single store days. It should be pointed out that 65% of the cherry
picking days in the data come from shoppers classified as cherry pickers whereas 80% of
the single store days come from loyals and switchers.
Table 5 shows the results. When shoppers cherry pick, they are 8% more likely
(80% ? 74%) to pay the lower price compared to those days when they only patronize one
store. The reason for this difference is that cherry picking increases the probability that
the shopper will buy lower priced discounted items. This occurs irrespective of whether
only one or both stores are selling the item at a discount. Interestingly, shoppers are more
successful selecting items that are sold by both stores at regular price when not cherry
picking. This may be because cherry picking shifts the shopper’s focus to buying
promoted items. Table 5 also suggests that people are really on a shopping mission when
they decide to cherry pick two stores; that is, the act of cherry picking is premeditated
and thought out. For example, shoppers buy larger quantities on cherry picking days, as
packages sizes are 9% larger. In addition, shoppers spend $46 more on cherry days,
which is 67% greater than the $69 they spend on single store days. A similar finding
obtains for number of items bought— shoppers buy 21 more items on cherry days, 66%
more than the 32 items they buy on single store days. This of course is not completely
surprising since the shopper is visiting twice as many stores, but again it does suggest that
the shopper planned on spending more than normal to take advantage of the extra store

20
visit. Cherry picking appears to be a case of planned opportunism (Hayes-Roth and
Hayes-Roth 1979).
Table 5: Cherry Picking Versus Single Store Shopping Days
Variable
Cherry Picking
Days
Single Store Days F value Pr > F
n=2,620 n=26,196Prob(Buying at Lower Price Store) 80% 74% 633.0 0.000Prob(Buying at Lower Price Store) when Neither Store Discounts 76% 80% 130.0 0.000Prob(Buying at Lower Price Store) when Both Stores Discount 66% 58% 267.6 0.000Prob(Buying at Lower Price Store) when Only One Store Discounts 87% 76% 1049.7 0.000Quantity (standardized across category, avg=1.0) 1.073 0.985 17.0 0.000$ Spending/Day $115 $69 1523.3 0.000Units/Day 53 32 1026.6 0.000% Items Bought at Discounted Prices 37.1% 31.0% 229.1 0.000% Items Bought that Are Advertised 25.2% 18.2% 385.5 0.000% Savings Off Higher Price 15.6% 10.5% 1940.9 0.000% of Potential Surplus 82.3% 71.8% 1697.1 0.000$ Savings 22.90$ 7.85$ 12554.8 0.000
As expected, shoppers are more likely to buy items at discounted prices and items
that are feature advertised when cherry picking, and as a result save 15.6% off the higher
price compared to only 10.5% on single store days. Moreover, shoppers appropriate
12.5% (82.3%-71.8%) more surplus when cherry picking. Finally, we calculate the
overall dollar savings, which in this case is simply:
aySpending/D $ -rice Highest POff Savings %-100%
aySpending/D $Savings$ ? .
The economic benefit when shoppers cherry pick is $22.90 off of the higher price
available that day compared to $7.85 on single store visit days, which is a $15.05
difference. Before discussing whether a savings of $15.05 is worth the extra store visit

21
that shoppers make on cherry picking days, we will discuss the results in Table 6, which
presents the same analyses as Table 5 broken down by the three shopper types.
Table 6: Cherry Picking Versus Single Store Shopping Days for the Three Shopper Types
Variable Cherry PickNo Cherry
Pick Cherry PickNo Cherry
Pick Cherry PickNo Cherry
PickTotal Number of Purchases 1690 5286 113 7281 749 12772
Prob(Lower Price Store) 83% 78% 75% 71% 76% 75%Prob(Lower Price Store) when Neither Store Discounts 77% 80% 84% 81% 70% 79%Prob(Lower Price Store) when Both Stores Discount 67% 57% 60% 51% 64% 63%Prob(Lower Price Store) when Only One Store Discounts 91% 82% 81% 70% 80% 76%Quantity (standardized across category, avg=1.0) 1.145 1.058 1.253 0.819 1.072 1.011
Trip Size $ $115 $51 $121 $81 $113 $68
Trip Size Units 53 23 53 38 52 32% Items Bought at Discounted Prices 38.1% 35.3% 31.1% 27.5% 35.6% 31.2%% Items Bought that Are Advertised 26.4% 22.8% 18.8% 15.3% 23.6% 18.1%% off Higher Price 16.7% 12.5% 10.2% 8.4% 14.0% 11.0%% of Potential Surplus 85.6% 78.4% 65.5% 63.7% 76.6% 73.7%$ Savings 25.04$ 7.59$ 16.07$ 7.39$ 19.11$ 8.22$ Note: All Cherry Picking vs. Non-Cherry Picking differences are significant at p<.05 except for shaded cells.
Loyals SwitchersCherry Pickers
These results largely replicate those in Table 5 with cherry pickers usually a bit
more extreme than switchers and store loyals. An exception is that loyals experience an
increase in the probability of buying at the lowest price when both items are regularly
priced, an opportunity not usually available to them given their normal store loyalty. All
three shopper groups spend more money and buy more items when they shop two rather
than one store on the same day, though the cherry picker group shows the biggest
differences, spending 125% more ($115 ? $51) dollars and buying 130% more items (53 ?
23) on cherry picking days compared to single store days. As a consequence, the
22
marginal benefit that cherry pickers gain from the extra store visit is larger, $17.45,
compared to $10.89 for switchers and $8.68 for store loyals.
There appear to be two reasons why cherry pickers benefit more from the extra
store visit. First, they are more experienced and consequently more accomplished at
taking advantage of the extra savings opportunities afforded by the extra store visit.
Cherry pickers appropriate more of the potential surplus irrespective of whether it is a
cherry picking occasion or not, but the difference in % of surplus is greatest for cherry
pickers, 7.2% (85.6%-78.4%) compared to a 2.9% and 1.8% difference for switchers and
loyals. Cherry pickers also save 16.7% off the highest price when cherry picking while
loyals save only 10.2%. However, switchers are almost as opportunistic at 14.0%,
suggesting that cherry pickers’ in-store shopping acumen is not the entire story. Instead,
a key contribution to their greater marginal benefit is the fact that they appear to
opportunistically plan their shopping trips into two types: much smaller single store visits
that may be fill-in trips, and larger two store trips where they buy significantly more
(+125%).
Cherry Picking at Primary Versus Secondary Stores: We also were interested
how cherry picking behavior varies depending upon whether the store is the shopper’s
primary grocery outlet or a secondary grocery outlet. The reasoning for this analysis is
that it is one thing to be a shopper’s primary store, where every so often the shopper
cherry picks your competition and thus spends a bit less money in your store that week as
compared to a non-cherry picking week. It is another thing to be a secondary store— the
one which is actually being cherry picked. Not only does the shopper fail to spend as
much in your store, but when they do patronize it, they opportunistically buy more sale

23
items. Since we could not directly observe whether a store was primary or secondary, for
each household we determined at which grocery chain they spent the most money over
the two-year period and designated this retailer as the primary store. All other stores
were designated secondary outlets. Note that this analysis is confined to store visits made
on cherry picking days.
Table 7 shows the results. The basic finding is that secondary stores are hurt
more by cherry picking than the primary store, which is probably not unexpected.
Shoppers get 42% more savings off of the highest price (17.0% ? 12.0%) and appropriate
8.4% more of the surplus when shopping at a secondary store compared to the primary
store. Some of this savings is due to buying at the lower price more often (82% at a
secondary store vs. 75% at the primary store), but the magnitude of the savings suggests
that most of the benefit comes from shoppers using feature advertising to plan out their
shopping trips. This result is corroborated by the fact that shoppers are more than 25%
more likely to buy advertised items at the secondary store (27.5% ? 21.9%). Dollar
savings are greater at the primary store in large part because most of the market basket is
purchased there. Shoppers allocate most of their day’s expenditures to the primary store,
with primary store spending 67% greater than spending at a secondary store ($70 ? $42).
The net result is that the secondary store is cherry picked to a greater extent than the
primary store, a state of affairs that the secondary store might (fairly accurately)
characterize as adding insult (selling a higher percentage of lower margin, discounted
merchandise) to injury (receiving a significantly lower share of the shoppers market
basket expenditures).

24
It is also interesting to note that a visit to the primary store in many ways
resembles the average shopping day, shown in the right-most column of Table 7. In
particular, the probability of selecting items at the lower price, the size of the trip (in
dollars and units), the percent savings off the higher price and the dollar savings are very
similar. This suggests that the primary store fares about as well on a cherry picking day
as it does when it alone is visited on a single store shopping day.
Table 7: Cherry Picking at Primary vs. Secondary Stores
Primary Secondary F Pr > FAll Shoppers, All Occasions
Prob(Lower Price Store) 75% 82% 159.2 0.0000 75%
Prob(Lower Price Store) when Neither Store Discounts 76% 79% 6.0 0.0140 80%
Prob(Lower Price Store) when Both Stores Discount 58% 66% 44.9 0.0000 60%
Prob(Lower Price Store) when Only One Store Discounts 83% 90% 154.1 0.0000 77%Quantity (control for keycat) 1.111 1.057 1.54 0.2151 1.000Store Visit Size $ $70 $42 561.2 0.0000 $73
Store Visit Size Units 32 19 432.1 0.0000 33% Items Bought at Discounted Prices 35.6% 38.1% 8.2 0.0016 32.3%% Items Bought that Are Advertised 21.9% 27.5% 49.8 0.0000 18.9%
% Off Higher Price 12.0% 17.0% 294.7 0.0000 11.2%
% of Potential Surplus 75.6% 84.0% 148.1 0.0000 73.4%$ Savings $9.85 $9.05 9.9 0.0016 $9.07
Conclusions
This paper has examined buyer side cherry picking, asking and hopefully
answering a number of previously open questions. Specifically, is cherry picking
worthwhile for consumers in the sense that the surplus generated from visiting two
grocery stores on the same day is greater than the costs associated with the extra store
visit? And secondly, how badly is the retailer hurt by this extreme manifestation of high
price sensitivity? Our research strategy was to isolate a group of habitual cherry pickers,
25
those shoppers who undeniably reside at the extreme tail of the price sensitivity and deal
proneness continuum, and then compare this group to other shopper types, i.e., store
loyals and switchers. Despite the fact that cherry pickers are more likely to be elderly
and have slightly lower household incomes, we found no dramatic differences in
demographics or geographic proximity to stores. At the same time, we uncovered
substantial differences in both within and across store shopping behaviors.
Cherry pickers shop more often than loyals and switchers and, as a consequence
of shorter inter-shopping intervals, spend less and buy fewer units on the average
shopping day. Cherry pickers are more vigilant, price sensitive shoppers. They buy
significantly more merchandise at discounted prices, at least partly due to the fact that
they are more aware of and attentive to retailers’ weekly feature advertising of specials.
Cherry pickers also buy larger-sized packages, suggesting that they are more willing to
incur inventory holding costs to reduce their per unit purchase costs, which indeed are
significantly lower than those of loyals and switchers. It is also the case that, owing to
their greater price sensitivity, cherry pickers are less loyal both to specific stores and
individual brands.
Our analysis of cherry picking versus single store shopping days reveals two
related but separate ways in which consumers save money by visiting two grocery stores
on the same day. First, two same-day store visits afford the shopper more opportunities
to save money, especially when they can plan out their shopping informed by feature
advertising. When people cherry pick, they buy more items on deal, buy more items that
are advertised, and are more likely to buy any given item at the lowest available price,
compared to single store shopping days. As a result, cherry picking affords the shopper
26
about a 5% savings on their total shopping basket. But this is only part of the story, and
in fact arguably not the most important aspect of cherry picking from a consumer welfare
perspective. A key reason that cherry picking can generate surplus is because consumers
plan out their cherry picking days and purchase significantly more (two thirds more on
average) on such occasions. And so due to planned opportunism the 5% savings is
applied to a much larger price tag than what would normally be spent on a single store
shopping day.
Is the decision to make an extra store visit on the same day economically
justifiable? Our answer is yes for a large percentage of shoppers. Across all shopper
types, the incremental saving from cherry picking is $22.90 - $7.85 = $15.05. Habitual
cherry pickers, by virtue of extended practice, gain a greater incremental savings of
$17.45 compared to $10.89 for switchers and $8.68 for store loyals. Let us assume that
the shopper incurs the following time costs for an extra store visit: (a) transit to and
parking at a second store = 10 minutes; (b) shopping time to buy 30 items = 30 minutes
(Bishop 1991, Sorenson 2003); and (c) check-out time = 5 minutes (Tom and Lucey
1995). Using these assumptions the cost of an incremental store visit works out to 45
minutes (very close to InsightExpress.com’s (2003) survey estimate of 47 minutes), but
to allow for the possibility that planning the larger trip is time consuming, we will assume
a range of 45 minutes to one hour. The implied wage rate and opportunity cost of time
are therefore $15.05 to $20.07/hour for all shoppers and $17.45 to $23.27/hour for cherry
pickers. The average per capita income in Chicago in 1996 was approximately $31,500,
with a median household income of $45,800. Assuming 2000 work hours/year, this
implies a wage rate of $15.76. Because the households in our sample have slightly
27
higher incomes ($55,000, about 20% higher), we increase the implied wage rate
accordingly to 1.2 ? $15.76 = $18.93/hour. Irrespective of exactly how one does these
“back of the envelope” calculations (like Blattberg, et al 1981 we have assumed no extra
holding costs for the bigger basket purchased when cherry picking), the surplus generated
appears economically justifiable for many households, given reasonable estimates of their
opportunity costs.
Finally, we consider the impact of cherry picking on the retailers being cherry
picked. The fact is that cherry picking gives shoppers access to more of the consumer
surplus— more than five percent of the premium (higher) market price per item. Is this
tolerable or excessive? That is a tough question in the absolute, though comparing this
savings to supermarket gross margins of roughly 25% and net margins of 1.5% - 2%
suggests that cherry picking has a material effect on customer profitability. However, it
is clear that cherry picking shoppers are far more likely to be unprofitable for their
secondary stores compared to their primary store. Not only do secondary stores sell less
per shopper, but they also make lower margins on what they sell to those cherry pickers,
which really do “pick the best and leave the rest.”

28
References
Bishop, Willard (1991), How Consumers Are Shopping the Supermarket 1991, Food Marketing Institute, Washington DC. Blattberg, Robert C., Gary D. Eppen, and Joshua Lieberman (1981), “A Theoretical and Empirical Evaluation of Price Deals for Consumer Nondurables,” Journal of Marketing, 45 (Winter), 116-129 Consumer Reports (1988), “How Much Money Smart Supermarket Shopping Can Save,” (March), 158. Drèze, Xavier (1999), “Rehabilitating Cherry-Picking,” working paper, University of Southern California. Marshall School of Business. Feick, Lawrence F. and Price, Linda L. (1987), “The Market Maven: A Diffuser of Marketplace Information,” Journal of Marketing, 51(1), 83–97. Food Marketing Institute (2002), Trends – Consumer Attitudes and the Supermarket, Washington DC. Frisbie, Gilbert A. Jr. (1980), “Ehrenberg’s Negative Binomial Model Applied to Grocery Store Trips,” Journal of Marketing Research, 17 (3), 385-390. Hayes-Roth, Barbara, & Hayes-Roth, Frederick. (1979), “A Cognitive Model of Planning,” Cognitive Science, 3 (4), 275-310. Kahn, Barbara E., and David C. Schmittlein (1989), “Shopping Trip Behavior: An Empirical Investigation,” Marketing Letters, 1 (1), 55-69. InsightExpress.com (2003), http://www.insightexpress.com/ix/toplines.asp. Kau, A.K, and Andrew S.C. Ehrenberg (1984), “Patterns of Store Choice,” Journal of Marketing Research, 21 (4), 399-409. Lal, Rajiv (1990), “Price Promotions: Limiting Competitive Encroachment”, Marketing Science, 9 (3), 247-262. Lal, Rajiv, and Ram C. Rao (1997), “Supermarket Competition: The Case of Everyday Low Pricing,” Marketing Science, 16(1), 60-80. Levy, Michael and Barton A. Weitz (2004), Retailing Management (5th Edition), New York, NY: McGraw-Hill Irwin. MMR (2002). “Wal-Mart’s Challenge,”19(5), 5.

29
Mogelonsky, Marcia (1994), “Please Don't Pick the Cherries,” Marketing Tools, (September/October), 10. Narasimhan, Chakravarti (1988), “Competitive Promotional Strategies”, Journal of Business, 61 (4), 427-449. Raju, Jagmohan, V. Srinivasan and Rajiv Lal (1988), “The Effects of Brand Loyalty on Competitive Price Promotional Strategies”, Management Science, 36 (March), 276-304. Schindler, Robert M. (1992), "A Coupon is More Than a Low Price: Evidence From a Shopping-Simulation Study," Psychology and Marketing, 9 (Nov/Dec), 431-451. Sorenson, Herb (2003), personal communication. Tom, Gail, and Scott Lucey (1995), “Waiting Time Delays and Customer Satisfaction in Supermarkets,” Journal of Service Marketing, 9 (5), 20-29. Uncles, M.D., and Andrew S.C. Ehrenberg (1990), “The Buying of Packaged Goods at US Retail Chains,” Journal of Retailing, 66 (3), 278-296. Urbany, Joel E., Peter R. Dickson, and Alan G. Sawyer (2000), “Insights into Cross- and Within-Store Price Search: Retailer Estimates vs. Consumer Self-Reports,” Journal of Retailing, 76(2), 243-258. Urbany, Joel E., Peter R. Dickson, and Rosemary Key (1991), “Actual and Perceived Consumer Vigilance in the Retail Grocery Industry,” Marketing Letters, 2(1), 15-25. Woolf, Brian (1994), Measured Marketing: A Tool to Shape Food Store Strategy, Coca Cola Research Council, Atlanta GA.

![BUS 1235 [Topic 1]](https://static.fdocuments.in/doc/165x107/577ce3431a28abf1038bb430/bus-1235-topic-1.jpg)