Cherry Creek Reservoir · Cherry Creek Reservoir ... 3.1.3 Surface Hydrology 9 3.2 Laboratory...
130
Geotechnical Water Resources Environmental and Ecological Services Cherry Creek Reservoir 2006 Annual Aquatic Biological Nutrient Monitoring Study and Cottonwood Creek Phosphorus Reduction Facilities Monitoring Submitted to: Cherry Creek Basin Water Quality Authority Fiddler’s Green Center, Building 1 6399 South Fiddler’s Green Circle, Suite 102 Greenwood Village, CO 80111-4974 Submitted by: GEI Consultants, Inc. Chadwick Ecological Division 5575 S. Sycamore Street, Suite 101 Littleton, CO 80120 June 2007 Project 062470
Transcript of Cherry Creek Reservoir · Cherry Creek Reservoir ... 3.1.3 Surface Hydrology 9 3.2 Laboratory...

Geotechnical Water Resources
Environmental and Ecological Services
Cherry Creek Reservoir 2006 Annual Aquatic Biological Nutrient Monitoring Study and Cottonwood Creek Phosphorus Reduction Facilities Monitoring Submitted to: Cherry Creek Basin Water Quality Authority Fiddler’s Green Center, Building 1 6399 South Fiddler’s Green Circle, Suite 102 Greenwood Village, CO 80111-4974
Submitted by: GEI Consultants, Inc. Chadwick Ecological Division 5575 S. Sycamore Street, Suite 101 Littleton, CO 80120
June 2007 Project 062470

GEI Consultants, Inc. June 2007 Chadwick Ecological Division Cherry Creek Monitoring Report
i
Table of Contents
1.0 Introduction 1
2.0 Study Area 3 2.1 Sampling Sites 3
2.1.1 Cherry Creek Reservoir 3 2.1.2 Shop Creek 3 2.1.3 Cherry Creek 5 2.1.4 Cottonwood Creek 5
3.0 Methods 7 3.1 Sampling Methodologies 7
3.1.1 Reservoir Sampling 7 3.1.2 Stream Sampling 8 3.1.3 Surface Hydrology 9
3.2 Laboratory Procedures 9 3.2.1 Nutrient Laboratory Analysis 9 3.2.2 Biological Laboratory Analysis 10
3.3 Quality Assurance/Quality Control 10 3.4 Calculation of Phosphorus Loading 11 3.5 Calculation of Long Term Trends in Cherry Creek Reservoir 11
4.0 Results and Discussion 13 4.1 Reservoir Water Quality 13
4.1.1 2006 Transparency 13 4.1.2 Long Term Secchi Transparency Trends in Cherry Creek Reservoir 14 4.1.3 2006 Dissolved Oxygen and Temperature 14 4.1.4 2006 Nutrients 18 4.1.5 Long Term Phosphorus Trends in Cherry Creek Reservoir 20 4.1.6 2006 Chlorophyll a Levels 22 4.1.7 Long term Chlorophyll a Trends in Cherry Creek Reservoir 22
4.2 Reservoir Biology 23 4.2.1 2006 Phytoplankton 23 4.2.2 Long Term Phytoplankton 24 4.2.3 Fish Populations 25
4.3 Stream Water Quality 26 4.3.1 2006 Phosphorus Concentrations in Streams 26 4.3.2 Long Term Trends in Phosphorus Concentrations in Cherry Creek
Reservoir Tributaries 26 4.3.3 Long Term Trends in Phosphorus Concentrations in Cherry Creek
Reservoir Alluvium 31

GEI Consultants, Inc. June 2007 Chadwick Ecological Division Cherry Creek Monitoring Report
ii
4.4 Reservoir Phosphorus Loads and Export 32 4.4.1 Phosphorus Load from Tributary Streams 33 4.4.2 Phosphorus Export from Reservoir Outflow 33 4.4.3 Phosphorus Load from Precipitation 34 4.4.4 Phosphorus Load from Alluvium 35 4.4.5 Mass Balance/Net Loading of Phosphorus to the Reservoir 35
4.5 Effectiveness of Pollutant Reduction Facilities 38 4.5.1 Cottonwood Creek Peoria Pond 38 4.5.2 Cottonwood Creek Perimeter Pond 39 4.5.3 Shop Creek and Quincy Drainage Pond 39
5.0 Summary and Conclusions 41 5.1 Transparency 41 5.2 Temperature and Dissolved Oxygen 41 5.3 Total Phosphorus 42 5.4 Chlorophyll a 42 5.5 Phosphorus Loading 42 5.6 Pollutant Reduction Facility Effectiveness 42
6.0 References 44
List of Tables Table 1: Number of storm samples collected from tributary streams to Cherry Creek Reservoir,
2006. See Appendix C for sample dates. Table 2: Parameter list, method number, and detection limits for chemical and biological analyses
of water collected from Cherry Creek Reservoir and tributaries, 2006. Table 3: Comparison of annual mean (monitoring period) and July to September mean
phosphorus, nitrogen, and chlorophyll a levels in Cherry Creek Reservoir, 1987 to 2006. Table 4: Density (cells/mL) of phytoplankton and total number of taxa collected from all three
sites on Cherry Creek Reservoir, 2006. Table 5: Comparison of median base flow and median storm flow concentrations of total
phosphorus (TP) and total suspended solids (TSS) in tributaries to Cherry Creek Reservoir, 2006.
Table 6: Comparison of base flow median annual total phosphorus and soluble reactive phosphorus concentrations for Sites CC-10, SC-3, and CT-2 from 1995 to 2006.
Table 7: Comparison of storm flow median annual total phosphorus and soluble reactive phosphorus concentrations for Sites CC-10, SC-3, and CT-2 from 1995 to 2006.
Table 8: Estimated phosphorus loading and export (lbs/year) for Cherry Creek Reservoir, 1992 to 2006.
Table 9: Phosphorus loading into Cherry Creek Reservoir from precipitation, 1987 to 2006. Data from 1987 to 1991 are based on water years, while data for 1992 to present are based on calendar years. Load is based on the long term (1995 to 2005) median total phosphorus concentration of 116 µg/L for sampled precipitation events.

GEI Consultants, Inc. June 2007 Chadwick Ecological Division Cherry Creek Monitoring Report
iii
Table 10: Historical total phosphorus and total suspended solids concentrations and total phosphorus loads upstream and downstream of the Cottonwood Creek - Peoria wetlands system, 2002 to 2006.
Table 11: Historical total phosphorus and total suspended solids concentrations and total phosphorus loads upstream and downstream of the Cottonwood Creek stormwater detention pond (1997-2006).
Table 12: Water quality and total phosphorus loads for Cherry Creek Reservoir, (1992 to 2006). Highlighted cell indicates value meets the respective standard, goal, or phased-TMAL value.
List of Figures Figure 1: Sampling sites on Cherry Creek Reservoir and selected streams, 2006. Figure 2: Whole-lake patterns for Secchi depth, 1% transmissivity, and chlorophyll a in Cherry
Creek Reservoir, 2006. Figure 3: Whole-lake seasonal mean (July to September) Secchi depths (m) measured in Cherry
Creek Reservoir, 1987 to 2006. Error bars represent a 95% confidence interval for each mean.
Figure 4: Temperature (°C) recorded at depth during routine monitoring at Site CCR-1 in 2006. Figure 5: Dissolved oxygen (mg/L) recorded at depth during routine monitoring at Site CCR-1 in
2006. The dissolved oxygen basic standards table value for Class 2 warm water lakes and reservoirs is provided for comparison (5 mg/L).
Figure 6: Temperature (°C) recorded at depth during routine monitoring at Site CCR-2 in 2006. Figure 7: Dissolved oxygen (mg/L) recorded at depth during routine monitoring at Site CCR-2 in
2006. The dissolved oxygen basic standards table value for Class 2 warm water lakes and reservoirs is provided for comparison (5 mg/L).
Figure 8: Temperature (°C) recorded at depth during routine monitoring at Site CCR-3 in 2006. Figure 9: Dissolved oxygen (mg/L) recorded at depth during routine monitoring at Site CCR-3 in
2006. The dissolved oxygen basic standards table value for Class 2 warm water lakes and reservoirs is provided for comparison (5 mg/L).
Figure 10: Annual pattern of photic zone total phosphorus, total nitrogen and USACE inflow in Cherry Creek Reservoir, 2006.
Figure 11: Total phosphorus concentrations recorded for the photic zone composite and at depth during routine monitoring in 2006.
Figure 12: Seasonal mean (July to September) total phosphorus concentrations (μg/L) measured in Cherry Creek Reservoir, 1987 to 2006. Error bars represent a 95% confidence interval for each mean.
Figure 13: Concentration of chlorophyll a (μg/L) in Cherry Creek Reservoir, 2006. Error bars represent 95% confidence interval around each mean. Highlighted area denotes the seasonal period for the chlorophyll a standard.
Figure 14: Seasonal mean (July to September) chlorophyll a concentrations measured in Cherry Creek Reservoir, 1987 to 2006. Error bars represent 95% confidence interval around each mean.
Figure 15: Annual pattern of blue-green and green algal densities and photic zone total phosphorus and total nitrogen concentrations in Cherry Creek Reservoir, 2006.
Figure 16: Base flow and storm flow total phosphorus concentrations measured in Site CC-10, 1994 to 2006.

GEI Consultants, Inc. June 2007 Chadwick Ecological Division Cherry Creek Monitoring Report
iv
Figure 17: Base flow and storm flow soluble reactive phosphorus concentrations measured in Site CC-10, 1994 to 2006.
Figure 18: Base flow and storm flow total phosphorus concentrations measured in Site SC-3, 1994 to 2006.
Figure 19: Base flow and storm flow soluble reactive phosphorus concentrations measured in Site SC-3, 1994 to 2006.
Figure 20: Base flow and storm flow total phosphorus concentrations measured in Site CT-2, 1996 to 2006.
Figure 21: Base flow and storm flow soluble reactive phosphorus concentrations measured in Site CT-2, 1996 to 2006.
Figure 22: Total dissolved phosphorus and soluble reactive phosphorus concentrations measured at Site MW-9 (1994 to 2006).
Figure 23: Mass balance diagram of phosphorus loading in Cherry Creek Reservoir, 2006. List of Appendices Appendix A Cherry Creek Reservoir Sampling and Analysis Plan
Appendix B 2006 Reservoir Water Quality Data
Appendix C 2006 Stream Water Quality and Precipitation Data
Appendix D 2006 Streamflow, Rainfall, Phosphorus Loading Calculations and Final Inflow and Load Data Normalized to the U.S. Army Corps of Engineers Inflow Data
Appendix E Biological Data
Appendix F Quality Assurance/Quality Control

GEI Consultants, Inc. June 2007 Chadwick Ecological Division Cherry Creek Monitoring Report
1
1.0 Introduction An inter-governmental agreement was executed in 1985 by several local governmental entities within the Cherry Creek basin to form the Cherry Creek Basin Water Quality Authority (CCBWQA). This Authority was created for the purpose of coordinating and implementing the investigations necessary to maintain the quality of water resources of the Cherry Creek basin while allowing for further economic development. Based on a clean lakes water study (Denver Regional Council of Governments [DRCOG], 1984), the Colorado Water Quality Control Commission (CWQCC) set standards for phosphorus, and a TMDL for phosphorus. An in-lake phosphorus standard of 35 micrograms per liter (μg/L) was adopted to maintain a seasonal mean chlorophyll a goal of 15 μg/L. Subsequently, a phosphorus TMDL was prepared for Cherry Creek Reservoir (Reservoir) allocating loads among point sources, background, and nonpoint sources within a net annual load of 14,270 pounds (lbs) total phosphorus. The Cherry Creek Basin Master Plan (DRCOG, 1985), approved by the CWQCC in 1985, was adopted in part as the "Regulations for Control of Water Quality in Cherry Creek Reservoir" (Section 4.2.0, 5C.C.R.3.8.11). An annual monitoring program (In-Situ, Inc. 1986, as amended, Advanced Sciences, Inc., 1994a and 1994b) was implemented at the end of April 1987 to assist in the assessment of several aspects of the Master Plan. These monitoring studies have included long term monitoring of: 1) nutrient levels within the Reservoir and from tributary streams during base flows and storm flows; 2) nutrient levels in precipitation; and 3) chlorophyll a levels within the Reservoir. In September 2000, following a hearing before the CWQCC, the standard for Cherry Creek Reservoir was changed to a seasonal July-to-September mean value of 15 μg/L of chlorophyll a to be met 9 out of 10 years, with an underlying total phosphorus goal of 40 μg/L, also as a July-to-September mean. In May 2001 at the CWQCC hearing, a new control regulation was adopted for the Cherry Creek Reservoir, which maintained the annual allowable total phosphorus load (total maximum annual load [TMAL]) of 14,270 lbs/year as part of a phased total maximum daily load (TMDL) for the Reservoir. From 1993 to 1998, Dr. John Jones of the University of Missouri contributed greatly to the Cherry Creek Reservoir annual monitoring program (Jones, 1994 to 2001), and assisted with the transition of the program to Chadwick Ecological Consultants, Inc. (CEC) in 1994. Results of the aquatic biological and nutrient analyses have been summarized in annual monitoring reports (CEC, 1995 to 2006). In 2006, CEC merged with GEI Consultants, Inc. (GEI). GEI continues to perform the annual monitoring duties of Cherry Creek Reservoir. The present study was designed to continue the characterization of the potential relationships

GEI Consultants, Inc. June 2007 Chadwick Ecological Division Cherry Creek Monitoring Report
2
between nutrient loading (both in-lake and external) and Reservoir productivity. The specific objectives of this annual monitoring study include the following:
Determine the concentrations of selected nutrients, primarily nitrogen and phosphorus compounds, in Cherry Creek Reservoir, major tributary inflows, and the Reservoir outflow.
Determine the pounds of phosphorus entering Cherry Creek Reservoir from streams
and precipitation and leaving the Reservoir through its outlet.
Determine biological productivity in Cherry Creek Reservoir, as measured by algal biomass (chlorophyll a concentration) and algal densities. In addition, determine species composition of the algal assemblage.
Determine potential relationships between the nutrient levels and biological
productivity in Cherry Creek Reservoir through correlation of the various measurements made during the study.
Assess the effectiveness of pollutant reduction facilities (PRF) on Cottonwood Creek to
reduce phosphorus loads into the Reservoir. This report presents the 2006 water quality data collected from Cherry Creek Reservoir and its three primary tributaries, Cherry Creek, Shop Creek, and Cottonwood Creek, and provides comparisons for many parameters to the long term monitoring data collected since 1987. The report also examines the CCBWQA PRFs located on Cottonwood Creek, evaluates their effectiveness in reducing phosphorus loads to the Reservoir, and provides comparisons to historical data.

GEI Consultants, Inc. June 2007 Chadwick Ecological Division Cherry Creek Monitoring Report
3
2.0 Study Area Cherry Creek was impounded in 1950 by the U.S. Army Corps of Engineers (USACE) to protect the City of Denver from flash floods that may originate in the 995 square kilometers (385 square miles) drainage basin. The Reservoir has maintained a surface area of approximately 350 ha (approximately 852 acres) since 1959. The Reservoir and surrounding state park has also become an important recreational site, providing opportunities for activities that include fishing, boating, swimming, bicycling, bird watching, and hiking.
2.1 Sampling Sites Sampling in 2006 was conducted at 10 sites, including three sites in Cherry Creek Reservoir, six sites on tributary streams, and one site on Cherry Creek downstream of the Reservoir (Figure 1). The sampling sites are summarized below: 2.1.1 Cherry Creek Reservoir CCR-1 This site is also called the Dam site, and was established in 1987. CCR-1
corresponds to the northwest area within the lake (Knowlton and Jones, 1993). Sampling was discontinued at this site in 1996 following determination that this site exhibited similar characteristics to the other two sites in this well-mixed Reservoir. Sampling recommenced in July 1998 at the request of consultants for Greenwood Village.
CCR-2 This site is also called the Swim Beach site, and was established in 1987. Site
CCR-2 corresponds to the northeast area within the lake (Knowlton and Jones, 1993).
CCR-3 This site is also called the Inlet site and was established in 1987, corresponding to
the south area within the lake (Knowlton and Jones, 1993). 2.1.2 Shop Creek SC-3 This site was established on Shop Creek in 1990 upstream of the Perimeter Road
and downstream of the Shop Creek detention pond and wetland system. In 1994, this site was moved just downstream of the Perimeter Road and again moved farther downstream to a location just upstream of its confluence with Cherry Creek in 1997. This site serves to monitor the water quality of Shop Creek as it joins Cherry Creek.

GEI Consultants, Inc. June 2007 Chadwick Ecological Division Cherry Creek Monitoring Report
4
Cherry
Shop Creek
Cottonwood
Cherry C
reekP
AR
KE
R R
OA
D
PERIMETER ROAD
PA
RK
ER
RO
AD
CC-O
CT-1
SC-3
RAINSAMPLER
Cherry
Creek
Reservoir
Cherry Creek D
am
CT-2
Bel
levi
ew
Dra
inag
e
Quincy Drainage
CCR-2
CCR-3
CCR-1
CC-10
Sample SiteRoadStreamReservoir / Pond / PRF
Creek
CT-P2
BELLEVIEW ROAD
PE
OR
IA S
TR
EE
T
CALEY AVENUE
Cre
ek
CT-P1
N
Approximate Scale
0.25 0.50 1.0 km0.0
Lon
e Tr
ee C
reek
JOR
DAN
RO
AD
Figure 1: Sampling sites on Cherry Creek Reservoir and selected streams, 2006.

GEI Consultants, Inc. June 2007 Chadwick Ecological Division Cherry Creek Monitoring Report
5
2.1.3 Cherry Creek CC-10 This site was originally established in 1987 on Cherry Creek near the historic U.S.
Geological Survey (USGS) Melvin gage, approximately 3.5 kilometers (km) upstream of the Reservoir (roughly due west of the intersection of Parker Road and Orchard Road). This location is in an area of Cherry Creek that frequently becomes dry during summer months as a result of the natural geomorphology and alluvial pumping for domestic water supply (John C. Halepaska & Associates, Inc. [JCHA], 1999 and 2000).
In 1995, this site was relocated farther downstream between the Perimeter Road and the Reservoir, approximately 800 meters upstream of the Reservoir. This site was moved still farther downstream in 1996, just upstream of the confluence with Shop Creek and closer to the Reservoir. In 1999, it was moved below the confluence with Shop Creek to eliminate the effect of a stream crossing on the CC-10 hydrograph. Since 1995, Cherry Creek has been monitored in a reach with perennial flow, allowing for more accurate monitoring of water quality and surface flow in Cherry Creek before entering the Reservoir. Historically, this site has been referred to as CC or CC-I (i.e., CC-Inflow), but was renamed CC-10 in 1997 to place it in context with concurrent monitoring in Cherry Creek mainstem upstream of the Reservoir (JCHA, 1999 to 2006).
CC-O This site was established in 1987 on Cherry Creek downstream of Cherry Creek Reservoir and upstream of the Hampden Avenue-Havana Street junction in the Kennedy Golf Course near the USGS gage. Site CC-O (i.e., CC-Outflow) monitors the water quality of Cherry Creek downstream of the Reservoir outlet.
2.1.4 Cottonwood Creek CT-P1 This site was established in 2002 and is located just north of where Caley Avenue
crosses Cottonwood Creek, and west of Peoria Street. This site monitors the water quality of Cottonwood Creek before it enters the Peoria Pond PRF, also created in 2001/2002 on the west side of Peoria Street.
CT-P2 This site was established in 2002 and is located at the outfall of the PRF, on the west
side of Peoria Street. The ISCO stormwater sampler and pressure transducer is located inside the outlet structure. This site monitors the effectiveness of the PRF on water quality.
CT-1 This site was established in 1987 where the Cherry Creek Park Perimeter Road
crosses Cottonwood Creek. It was chosen to monitor the water quality of Cottonwood Creek before it enters the Reservoir. During the fall/winter of 1996, a

GEI Consultants, Inc. June 2007 Chadwick Ecological Division Cherry Creek Monitoring Report
6
PRF, consisting of a water quality/detention pond and wetland system, was constructed downstream of this site. As a result of the back-flow from this pond inundating this site, this site was relocated approximately 250 m upstream near Belleview Avenue in 1997.
CT-2 This site was established in 1996 and originally located downstream of the
Perimeter Pond on Cottonwood Creek. The ISCO pressure transducer and staff gage was located in a section of the stream relatively unobstructed by vegetation, and approximately 50 m downstream of the PRF. However, over the years the growth of vegetation considerably increased along the channel, creating problems with accurately determining stream flow. Eventually, when no accurate and reliable streamflow measurements could be performed in 2003 other locations were evaluated. In August 2004, the pressure transducer and staff gage were relocated inside of the outlet structure for the PRF to mitigate problems associated with streamflow measurements. Water quality samples are collected from the outlet structure as well. This site monitors the effectiveness of the PRF on Cottonwood Creek water quality and provides information on the stream before it enters the Reservoir.

GEI Consultants, Inc. June 2007 Chadwick Ecological Division Cherry Creek Monitoring Report
7
3.0 Methods
3.1 Sampling Methodologies Field sampling protocols and analytical methods used for monitoring the Reservoir and stream sites follow the Cherry Creek Reservoir Sampling and Analysis Plan (CEC, 2003b) (Appendix A). 3.1.1 Reservoir Sampling The general sampling schedule included regular sampling trips to the Reservoir at varying frequencies over the annual sampling period, as outlined below, with increased sampling frequency during the summer growing season. A total of 14 reservoir sampling events were conducted in 2006, with events not being performed in January, February, and December 2006 due to unsafe ice conditions. Sampling Trips per Sampling Period
Sampling Period Frequency Planned
Trips/Period Actual Trips/Period Jan - Apr Monthly 4 2
May - Sept Bi-Monthly 10 10 Oct - Dec Monthly 3 2
Total 17 14
During each sampling episode on the Reservoir, three main tasks were conducted, including: 1) determining water clarity; 2) collecting depth profile measurements for temperature, dissolved oxygen, pH, and conductivity; and 3) collecting water samples for chemical and biological analyses. 3.1.1.1 Water Clarity Transparency was determined using a Secchi disk and Licor quantum sensors (ambient and underwater). Detailed methods of both instruments can be found in the Sampling and Analysis Plan (Appendix A). 3.1.1.2 Profile Measurements The second task involved collecting dissolved oxygen, temperature, conductivity, and pH measurements every meter from the surface to near the bottom of the Reservoir to develop depth profiles for each site during each sampling episode. Data were collected using a

GEI Consultants, Inc. June 2007 Chadwick Ecological Division Cherry Creek Monitoring Report
8
Yellow Springs Instrument (YSI) meter, with Model #600 XL multi-probe sonde, that was calibrated prior to each sampling event to ensure accuracy of the measurements. 3.1.1.3 Water Sampling Water samples for nutrient, phytoplankton, and chlorophyll a analyses were collected at the three Reservoir sites. Data collected from each site during a single sampling event (i.e., three replicate samples), are averaged to provide a whole-reservoir mean estimate for each parameter. Sample event means are then used to calculate annual or seasonal mean values for key parameters such as chlorophyll a and total phosphorus, to facilitate comparison with regulatory standards and goals that apply to the Reservoir. Depending upon the distributional characteristics of each parameter, annual values may be compared to either the long term mean or median value. Secchi depth and chlorophyll a are two parameters that reveal normal distributions, thus it is more appropriate to compare annual values with the long term mean. Conversely, the total phosphorus data exhibit a log normal distribution; therefore it is more appropriate to compare annual values to the long term median value. The Sampling and Analysis Plan (Appendix A) outlines the detailed methods used to collect lake water samples, as well as some of the laboratory methods in sample handling and preparation. 3.1.1.4 Fish Population Data Historically, this monitoring study has also reviewed fish stocking and population data collected by the Colorado Division of Wildlife (CDOW). As part of their sampling schedule to reduce mortality to a walleye brood-stock population in Cherry Creek Reservoir, CDOW samples fish populations every 2 to 3 years. The most recent fish population survey was conducted in 2004 by the CDOW (personal communication with Harry Vermillion, CDOW). Therefore, only the 2006 fish stocking data are presented herein. 3.1.2 Stream Sampling 3.1.2.1 Base Flow Sampling Base flow stream sampling was conducted on a monthly basis (11 events; July event excluded, see below) in conjunction with the routine reservoir sampling trips to Cherry Creek Reservoir. This sampling was performed in order to characterize base flow conditions, which corresponds to the low-flow ambient samples collected in past studies. Monthly samples are assumed to be representative of non-storm, base flow periods. However, in 2006 there was one exception to this basic premise. On July 5, base flow water quality samples were collected from the six inflow sites, which happened to occur between two major storm events, one on July 2 and the second on July 7. The flow during this period

GEI Consultants, Inc. June 2007 Chadwick Ecological Division Cherry Creek Monitoring Report
9
is categorized as storm event flows (i.e., >90th percentile flow), and is not representative of base flow conditions. Therefore, the water quality data collected on July 5 was categorized as storm event data and used in the calculation of the annual storm event median. For the purposes of estimating total phosphorus loads, the July base flow data was interpolated, using June and August base flow data. 3.1.2.2 Storm Sampling Storm events sampled at the inflow sites on Cherry Creek, Cottonwood Creek, and Shop Creek characterize non-base flow conditions during the 2006 sampling season (Table 1). A detailed outline of storm sampling protocols can be found in the Sampling and Analysis Plan (Appendix A). Table 1: Number of storm samples collected from tributary streams to Cherry Creek
Reservoir, 2006. See Appendix C for sample dates.
Sites
CC-10 SC-3 CT-P1 CT-P2 CT-1 CT-2
Number of Storm Samples 6 6 6 6 6 6
3.1.3 Surface Hydrology Pressure transducers attached to ISCO Series 4200 or 6700 flowmeters measured and recorded water levels (stage) at six sites on the three tributaries to Cherry Creek Reservoir (Figure 1). These flow meters are programmed to record water level on 15-minute intervals year round. Streamflow (discharge) was estimated at Sites CC-10, SC-3, CT-1, CT-P1 using stage-discharge relationships developed for each stream site. For Sites CT-2 and CT-P2, where the flow meters are located inside the concrete outlet structure, multi-level orifice and weir equations were used to estimate discharge. Periodic stream discharge measurements were collected using a Marsh McBirney Model 2000 flowmeter. For a complete description of streamflow determination, see Appendix D.
3.2 Laboratory Procedures 3.2.1 Nutrient Laboratory Analysis Physicochemical and biological analyses on Reservoir and stream water quality samples were performed by the GEI analytical laboratory in Littleton, Colorado (Table 2). Randomly selected QA water samples were also sent to the University of Colorado, Center for Limnology, for nutrient analyses as a quality assurance check. Detailed methodologies and laboratory Quality Assurance/Quality Control (QA/QC) procedures are available from GEI, with the comparison of inter-laboratory data provided in Appendix F.

GEI Consultants, Inc. June 2007 Chadwick Ecological Division Cherry Creek Monitoring Report
10
3.2.2 Biological Laboratory Analysis Biological analyses of the Reservoir phytoplankton samples were conducted by the University of Colorado Center of Limnology and GEI. The University of Colorado performed phytoplankton identification and enumeration, which provided cell counts per unit volume (cells/mL) and taxa richness, while GEI performed the chlorophyll a concentrations (µg/L). The methods for these analyses, with appropriate QA/QC procedures, are available from GEI.
3.3 Quality Assurance/Quality Control To ensure data quality, a number of quality assurance checks were used. During each reservoir sampling event, a QA sample was randomly collected at one of the Reservoir sites, and analyzed by the University of Colorado, Center for Limnology. No QA samples were collected from the stream sites during any of the stream sampling events. These QA samples resulted in approximately 7 percent of the total samples collected during the year as having a duplicate sample, and provided a reasonable independent assessment of lake water nutrient analyses conducted by GEI. Table 2: Parameter list, method number, and detection limits for chemical and biological
analyses of water collected from Cherry Creek Reservoir and tributaries, 2006. Parameter Method Detection Limit
Total Phosphorus QC 10-115-01-1-U 2 μg/L Total Dissolved Phosphorus QC 10-115-01-1-U 2 μg/L Soluble Reactive Phosphorus QC 10-115-01-1-T 3 μg/L Total Nitrogen APHA 4500-N B (modified) 4 μg/L Total Dissolved Nitrogen APHA 4500-N B (modified) 4 μg/L Ammonia QC 10-107-06-3-D 3 μg/L Nitrate and Nitrite QC 10-107-04-1-B 5 μg/L TSS APHA 2540D 4 mg/L TVSS APHA 2540E 4 mg/L Chlorophyll a APHA 10200 H (modified) 1 μg/L
APHA = American Public Health Association, 1998.
In addition, field sampling quality control included the use of a field blank. This field blank contained laboratory grade deionized water in a sample container identical to those used in the field collections and was carried through the entire sampling episode. The cap of this container was removed at each Reservoir site and left open during the regular sampling effort at that site. Upon completion of sampling at that site, the cap was replaced. One field blank was used for every sampling trip. The field blanks and duplicate samples were analyzed for all the parameters, identical to a routine sample. Chain of custody procedures were observed during the field sampling and delivery of samples to GEI, and for samples shipped to the Center for Limnology, University of Colorado.

GEI Consultants, Inc. June 2007 Chadwick Ecological Division Cherry Creek Monitoring Report
11
Detailed methods and results of QA/QC checks performed on the water quality data from the Reservoir for 2006, with comparison between labs, are located in Appendix F. This analysis showed that results from the analytical labs were similar. As such, all values reported herein are based on results obtained from the GEI analytical laboratory.
3.4 Calculation of Phosphorus Loading During the past year, there has been extensive dialogue with the Colorado Water Quality Control Division (WQCD) regarding the calculation of phosphorus loads when placed in the context of long term modeling and the predictive use for control regulation usage. From these discussions, a methodology was agreed upon that would create some continuity among Colorado reservoirs with control regulations in place, and also create a long term database using consistent methodologies based on contemporary scientific understandings. While these methodological changes are expected to have minimal changes on the annual external phosphorus load to the Reservoir, comparative differences within a source may exist between 2006 data and the long term data. Notably, in the past when methodologies have changed (i.e., 2002-alluvial flow changed to residual flow estimate), these changes have been carried throughout the historical database such that the long term annual values are compared using consistent methodologies. Given the timing of these recent changes, the long term data present herein do not reflect the current methodology used to calculate loads. The long term data are being evaluated and updated values will be provided in the near future. Detailed discussion of the streamflow measurements and derivation of loads can be found in Appendix D.
3.5 Calculation of Long Term Trends in Cherry Creek Reservoir Long term seasonal trends were evaluated for Secchi depth, chlorophyll a, and total phosphorus using whole-lake mean values from 1987 to 2006 and linear regression analysis (described below). Additionally, 95 percent confidence intervals provided information on data dispersal around the mean annual values. These analyses were used to determine whether there were significant increasing or decreasing trends in Secchi depth, total phosphorus, and chlorophyll a levels over time. Linear regression analyses was also used to evaluate QA/QC relationships between labs, and comparisons of biological and physical parameters for each site were conducted using SPSS 2006 or NCSS 2000 statistical software (Hintze, 2001). Basic descriptive statistics were used to evaluate the distributional characteristics of the data, and to determine whether a variable required transformation to meet the basic assumptions of normality. Logarithmic transformations were used to increase the symmetry of the data about the mean, approximating a normal distribution. If the transformation did not improve normality, the untransformed data were used in subsequent analyses.

GEI Consultants, Inc. June 2007 Chadwick Ecological Division Cherry Creek Monitoring Report
12
The least-squares linear regression was used to estimate slope, with ANOVA being used to determine if the slope was significantly different than zero. A probability of < 0.05 was used to indicate statistical significance. In the cases of the linear regressions, the R2 value provided a measure of how well the variance is explained by the regression equation. R2 values measure the proportion of total variation that is explained or accounted for by the fitted regression line; i.e., it is a measure of the strength of the relationship with the observed data.

GEI Consultants, Inc. June 2007 Chadwick Ecological Division Cherry Creek Monitoring Report
13
4.0 Results and Discussion
4.1 Reservoir Water Quality 4.1.1 2006 Transparency The whole-reservoir mean Secchi depth varied from 0.71 m in April to 1.98 m in early June (Figure 2). The seasonal (July to September) whole-reservoir mean Secchi depth was 1.05 (Figure 3) and is similar to the long term mean value of 1.06 m. The depth at which 1 percent of photosynthetically active radiation (PAR) penetrated (i.e., photic zone depth) ranged from 2.17 m in early May to a maximum depth of 4.71 m in late July (Figure 2). The period from late May through June, and again in September, represented a time when Reservoir water clarity was at its best, with 1 percent light transmittance averaging 4.1 m. There was a significant negative relationship between 1 percent PAR transmittance and chlorophyll a concentration (p < 0.05), though chlorophyll a concentrations only accounted for 33 percent of the variation observed in water clarity.
Jan Feb Mar Apr May Jun Jul Aug Sep Oct Nov Dec
Sec
chi
Dep
th (
m)
1% T
ran
smis
sivi
ty (
m)
0
1
2
3
4
5
6
7
8
Ch
loro
ph
yll
a (µ
g/L
)
0
10
20
30
40
50
Secchi1% TransmissivityChlorophyll-a
Figure 2: Whole-lake patterns for Secchi depth, 1% transmissivity, and chlorophyll a in Cherry Creek Reservoir, 2006.

GEI Consultants, Inc. June 2007 Chadwick Ecological Division Cherry Creek Monitoring Report
14
4.1.2 Long Term Secchi Transparency Trends in Cherry Creek Reservoir In general, seasonal mean (July-to-September) Secchi depths increased from 1987 to 1996, then decreased in 1997 and have been relative stable since (Figure 3). There is not, however, a statistically significant long term upward or downward trend for seasonal mean Secchi depths over the period of record.
198
7
198
8
198
9
199
0
199
1
199
2
199
3
199
4
199
5
199
6
199
7
199
8
199
9
200
0
200
1
200
2
200
3
200
4
200
5
200
6
0
0.5
1
1.5
2
2.5
Se
cch
i Dep
th (
m)
Figure 3: Whole-lake seasonal mean (July to September) Secchi depths (m) measured in
Cherry Creek Reservoir, 1987 to 2006. Error bars represent a 95% confidence interval for each mean.
4.1.3 2006 Dissolved Oxygen and Temperature Analysis of past Cherry Creek Reservoir temperature profiles indicates that stratification typically occurs when there is greater than 2 °C difference between the surface and bottom water temperatures (Jones, 1998). Differences of less than 1°C between the surface and bottom waters suggest a recent mixing event (Jones, 1998). This criterion is generally supported by the classical definition of a thermocline, as being the layer with the greatest rate of change in temperature or dt/dz greater than 1° C/m. However, given the relatively shallow nature of the Reservoir and the temperature-density relationships, the Reservoir can become stratified even though the greatest rate of change may be less than 1°C. Dissolved oxygen profiles are also used to evaluate periods of stratification when the rate of temperature change is less than 1 °C/m. Using the above criteria, Cherry Creek Reservoir was evaluated for periods of potential stratification and low dissolved oxygen levels (Figures 4 through 9).

GEI Consultants, Inc. June 2007 Chadwick Ecological Division Cherry Creek Monitoring Report
15
Jan
24
Feb
21
Mar
14
Apr
12
Ma
y 8
May
24
Jun
6
Jun
20
Jul 5
Jul 1
8
Aug
1
Aug
15
Sep
7
Sep
19
Oct
18
Nov
8
De
c 12
Sample Date
0
5
10
15
20
25
30T
emp
erat
ure
oC
0m1m
2m3m
4m5m
6m
PPS - Period of Potential Thermal Stratification
PPS
Figure 4: Temperature (°C) recorded at depth during routine monitoring at Site CCR-1 in
2006.
Jan
24
Fe
b 21
Ma
r 1
4
Ap
r 1
2
May
8
May
24
Jun
6
Jun
20
Jul 5
Jul 1
8
Aug
1
Aug
15
Sep
7
Sep
19
Oct
18
No
v 8
De
c 12
Sample Date
0
5
10
15
20
Dis
so
lve
d O
xyg
en
(m
g/L
)
0m1m
2m3m
4m5m
6m
5 mg/L
PPS
Figure 5: Dissolved oxygen (mg/L) recorded at depth during routine monitoring at Site CCR-1
in 2006. The dissolved oxygen basic standards table value for Class 2 warm water lakes and reservoirs is provided for comparison (5 mg/L).

GEI Consultants, Inc. June 2007 Chadwick Ecological Division Cherry Creek Monitoring Report
16
Jan
24
Feb
21
Mar
14
Apr
12
May
8
May
24
Jun
6
Jun
20
Jul 5
Jul 1
8
Aug
1
Aug
15
Sep
7
Sep
19
Oct
18
Nov
8
Dec
12
Sample Date
0
5
10
15
20
25
30T
emp
erat
ure
oC
0m1m
2m3m
4m5m
6m7mPPS - Period of
Potential Thermal Stratification
PPSPPS
Figure 6: Temperature (°C) recorded at depth during routine monitoring at Site CCR-2 in
2006.
Jan
24
Fe
b 21
Ma
r 1
4
Apr
12
May
8
Ma
y 2
4
Jun
6
Jun
20
Jul 5
Jul 1
8
Aug
1
Aug
15
Sep
7
Sep
19
Oct
18
No
v 8
De
c 12
Sample Date
0
5
10
15
20
Dis
solv
ed O
xyg
en
(m
g/L
)
0m1m
2m3m
4m5m
6m7m
5 mg/LPPSPPS
Figure 7: Dissolved oxygen (mg/L) recorded at depth during routine monitoring at Site CCR-2
in 2006. The dissolved oxygen basic standards table value for Class 2 warm water lakes and reservoirs is provided for comparison (5 mg/L).

GEI Consultants, Inc. June 2007 Chadwick Ecological Division Cherry Creek Monitoring Report
17
Jan
24
Feb
21
Mar
14
Apr
12
May
8
May
24
Jun
6
Jun
20
Jul 5
Jul 1
8
Aug
1
Aug
15
Sep
7
Sep
19
Oct
18
Nov
8
Dec
12
Sample Date
0
5
10
15
20
25
30T
emp
erat
ure
oC
0m1m
2m3m
4m5m
PPS
PPS - Period ofPotential Thermal Stratification
PPS PPS
Figure 8: Temperature (°C) recorded at depth during routine monitoring at Site CCR-3 in
2006.
Jan
24
Feb
21
Mar
14
Apr
12
Ma
y 8
May
24
Jun
6
Jun
20
Jul 5
Jul 1
8
Au
g 1
Au
g 1
5
Se
p 7
Se
p 1
9
Oct
18
Nov
8
Dec
12
Sample Date
0
5
10
15
20
Dis
so
lved
Ox
ygen
(m
g/L
)
0m1m
2m3m
4m5m
5 mg/L
PPS PPS PPS
Figure 9: Dissolved oxygen (mg/L) recorded at depth during routine monitoring at Site CCR-3
in 2006. The dissolved oxygen basic standards table value for Class 2 warm water lakes and reservoirs is provided for comparison (5 mg/L).
GEI Consultants, Inc. June 2007 Chadwick Ecological Division Cherry Creek Monitoring Report
18
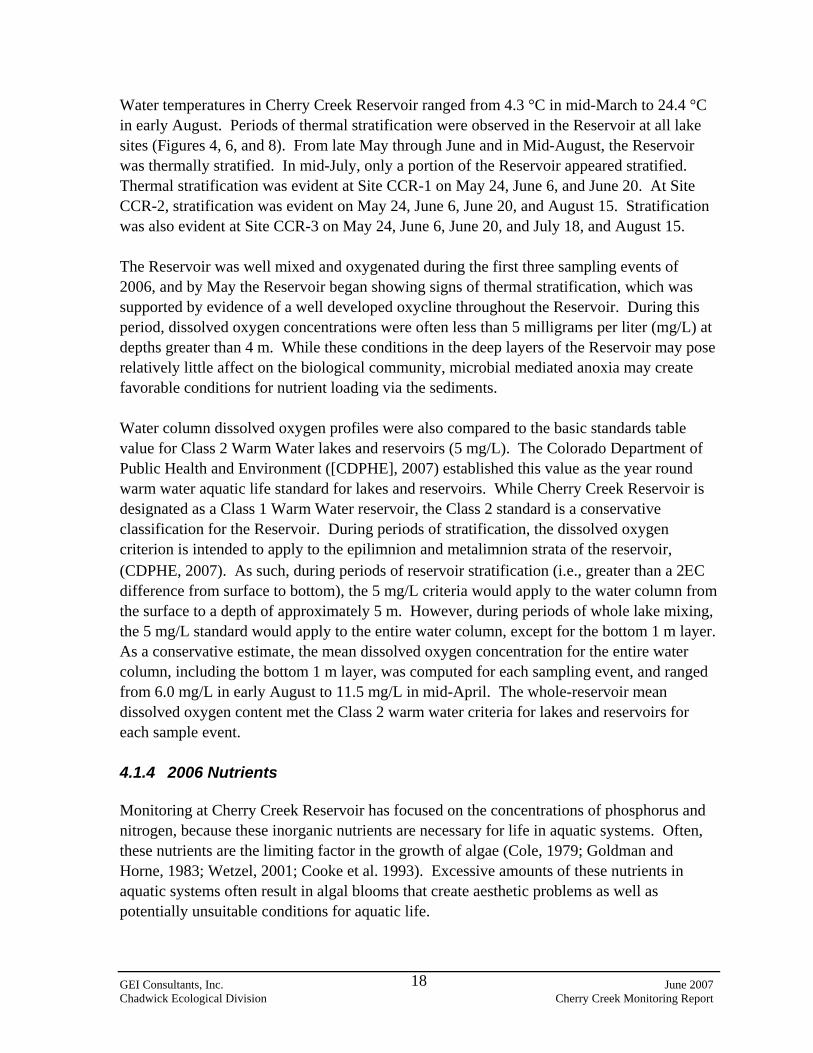
Water temperatures in Cherry Creek Reservoir ranged from 4.3 °C in mid-March to 24.4 °C in early August. Periods of thermal stratification were observed in the Reservoir at all lake sites (Figures 4, 6, and 8). From late May through June and in Mid-August, the Reservoir was thermally stratified. In mid-July, only a portion of the Reservoir appeared stratified. Thermal stratification was evident at Site CCR-1 on May 24, June 6, and June 20. At Site CCR-2, stratification was evident on May 24, June 6, June 20, and August 15. Stratification was also evident at Site CCR-3 on May 24, June 6, June 20, and July 18, and August 15. The Reservoir was well mixed and oxygenated during the first three sampling events of 2006, and by May the Reservoir began showing signs of thermal stratification, which was supported by evidence of a well developed oxycline throughout the Reservoir. During this period, dissolved oxygen concentrations were often less than 5 milligrams per liter (mg/L) at depths greater than 4 m. While these conditions in the deep layers of the Reservoir may pose relatively little affect on the biological community, microbial mediated anoxia may create favorable conditions for nutrient loading via the sediments. Water column dissolved oxygen profiles were also compared to the basic standards table value for Class 2 Warm Water lakes and reservoirs (5 mg/L). The Colorado Department of Public Health and Environment ([CDPHE], 2007) established this value as the year round warm water aquatic life standard for lakes and reservoirs. While Cherry Creek Reservoir is designated as a Class 1 Warm Water reservoir, the Class 2 standard is a conservative classification for the Reservoir. During periods of stratification, the dissolved oxygen criterion is intended to apply to the epilimnion and metalimnion strata of the reservoir, (CDPHE, 2007). As such, during periods of reservoir stratification (i.e., greater than a 2C difference from surface to bottom), the 5 mg/L criteria would apply to the water column from the surface to a depth of approximately 5 m. However, during periods of whole lake mixing, the 5 mg/L standard would apply to the entire water column, except for the bottom 1 m layer. As a conservative estimate, the mean dissolved oxygen concentration for the entire water column, including the bottom 1 m layer, was computed for each sampling event, and ranged from 6.0 mg/L in early August to 11.5 mg/L in mid-April. The whole-reservoir mean dissolved oxygen content met the Class 2 warm water criteria for lakes and reservoirs for each sample event. 4.1.4 2006 Nutrients Monitoring at Cherry Creek Reservoir has focused on the concentrations of phosphorus and nitrogen, because these inorganic nutrients are necessary for life in aquatic systems. Often, these nutrients are the limiting factor in the growth of algae (Cole, 1979; Goldman and Horne, 1983; Wetzel, 2001; Cooke et al. 1993). Excessive amounts of these nutrients in aquatic systems often result in algal blooms that create aesthetic problems as well as potentially unsuitable conditions for aquatic life.

GEI Consultants, Inc. June 2007 Chadwick Ecological Division Cherry Creek Monitoring Report
19
In 2006, the photic zone mean concentration of total phosphorus ranged from 44 to 144 μg/L with an overall annual mean of 81 μg/L. The seasonal photic zone mean (July-to-September) concentration ranged from 44 to 129 μg/L, with a seasonal mean of 87 μg/L (Figure 10). The annual pattern in Reservoir phosphorus concentration corresponds well to the USACE inflow pattern, and when evaluated on a monthly basis, Reservoir total phosphorus concentrations are significantly (p < 0.05) related to monthly inflow total phosphorus load (R2 = 0.80).
Jan
1
Jan
31
Mar
3
Apr
3
May
4
Jun
4
Jul 5
Aug
5
Sep
5
Oct
6
Nov
6
Dec
7
0
100
200
300
400
500
Infl
ow
(af
/d)
0
20
40
60
80
100
120
140
160
USACE InflowTotal PhosphorusTotal Nitrogen
To
tal P
ho
sph
oru
s (
g/L
)T
ota
l Nit
rog
en x
10
(µg
/L
Figure 10: Annual pattern of photic zone total phosphorus, total nitrogen and USACE inflow in
Cherry Creek Reservoir, 2006.
Patterns in total phosphorus concentrations collected along depth profiles showed a well-mixed Reservoir during the spring and fall (Figure 11). There were periods of nutrient release from bottom sediments from May through July as evidenced by increasing TP concentrations in the deeper layers of the Reservoir (Figure 11). The photic zone mean concentration of total nitrogen ranged from 573 to 1,209 µg/L, with an annual mean of 897 µg/L in 2006. During the July-to-September period, the photic zone mean total nitrogen concentration ranged from 789 to 1,016 µg/L, with a mean concentration of 914 µg/L. The annual pattern of Reservoir total nitrogen concentrations did not correlate with the USACE inflow pattern, and when evaluated on a monthly basis, Reservoir total nitrogen concentrations are not significantly related to monthly inflow.

GEI Consultants, Inc. June 2007 Chadwick Ecological Division Cherry Creek Monitoring Report
20
Jan
24
Feb
21
Mar
14
Apr
12
May
8
May
24
Jun
6
Jun
20
Jul 5
Jul 1
8
Aug
1
Aug
15
Sep
7
Sep
19
Oct
18
Nov
8
Dec
12
Sample Date
0
50
100
150
200
250
300
350
To
tal P
ho
sph
oru
s (
g/L
)
Photic Zone 4m 5m 6m 7m
Figure 11: Total phosphorus concentrations recorded for the photic zone composite and at
depth during routine monitoring in 2006.
4.1.5 Long Term Phosphorus Trends in Cherry Creek Reservoir In any long term database, consistency in data analysis (i.e., analytical chemistry) is paramount, especially when evaluating long term trends. Differences in methodologies or analytical laboratories may bias the data, which hinders the evaluation of potential trends. This is particularly evident in the total phosphorus and chlorophyll a database for Cherry Creek Reservoir. This database represents a variety of data produced by different analytical laboratories, and while the same standard method may have been utilized, subtle differences are apparent in the database. Over the monitoring period, analytical method detection limits varied and the precision of the analyses have increased with time. During the late 1990s, a transition from Metro Wastewater analytical services to GEI occurred, with the period from 1999 to 2006 representing the most consistent data processing methodologies. Furthermore, 1999 represents a time when a concerted effort started to implement best management practices throughout the basin, along with PRFs being established along Shop Creek and Cottonwood Creek to control storm flow and reduce the amount of phosphorus entering the Reservoir. Therefore, GEI also evaluated more recent trends in the data from 1999. Routine monitoring data collected since 1987 indicates a general increasing pattern in summer mean concentrations of total phosphorus (Figure 12). In 2006, the July to September mean concentration of total phosphorus was 87 μg/L. This value is greater than the long term median value of 78 µg/L (Table 3). Regression analyses performed on 1987 to 2006 seasonal mean TP data indicates a significant (p < 0.01) increasing trend, though the relationship is likely a result of the shift in the data that occurred in 1997. With the exception

GEI Consultants, Inc. June 2007 Chadwick Ecological Division Cherry Creek Monitoring Report
21
of the seasonal mean value observed in 1989 (39 µg/L), seasonal mean concentrations have consistently exceeded the goal of 40 μg/L over the past 20 years of monitoring.
1987
198
8
1989
199
0
199
1
199
2
199
3
1994
199
5
1996
199
7
199
8
199
9
200
0
2001
200
2
2003
200
4
200
5
200
6
0
20
40
60
80
100
120
140T
ota
l Ph
osp
ho
rus
(g
/L)
40 g/L
Figure 12: Seasonal mean (July to September) total phosphorus concentrations (μg/L)
measured in Cherry Creek Reservoir, 1987 to 2006. Error bars represent a 95% confidence interval for each mean.
Table 3: Comparison of annual mean (monitoring period) and July to September mean
phosphorus, nitrogen, and chlorophyll a levels in Cherry Creek Reservoir, 1987 to 2006.
Year Total Nitrogen (μg/L) Total Phosphorus (μg/L) Mean Chlorophyll a (μg/L)
Annual Jul-Sep Annual Jul-Sep Annual Jul-Sep1987 1,580 741 86 93 11.1 8.31988 902 1,053 52 49 21.8 31.8 1989 803 828 45 39 8.5 5.6 1990 600 -- 58 55 2.3 8.6 1991 1,067 1,237 86 56 9.7 9.8 1992 790 970 54 66 12.1 17.0 1993 790 826 50 62 12.5 14.4 1994 1,134 1,144 56 59 4.7 6.2 1995 910 913 48 48 13.9 15.6 1996 889 944 54 62 16.9 20.5 1997 976 1,120 75 96 16.1 22.3 1998 850 880 82 89 20.4 26.5 1999 715 753 80 81 20.8 28.9 2000 784 802 81 81 22.0 25.2 2001 740 741 81 87 26.7 26.1 2002 847 858 70 74 21.7 18.8 2003 990 1,121 87 90 23.2 25.8 2004 923 977 84 102 17.0 18.4 2005 907 990 93 116 16.1 17.1 2006 897 914 81 87 15.9 14.7 Mean 905 937 70 75 15.7 18.1
Median 893 914 78 78 16.1 17.8

GEI Consultants, Inc. June 2007 Chadwick Ecological Division Cherry Creek Monitoring Report
22
4.1.6 2006 Chlorophyll a Levels The annual pattern of photic zone chlorophyll a concentrations revealed relatively low concentrations (5 - 7 μg/L) of chlorophyll a in late May, June, and late September, with levels greater than 20 µg/L occurring in late August, late October, and early November (Figure 13). The 2006 annual mean chlorophyll a concentration was 15.9 μg/L, and represents the lowest annual value since 1995 (Table 3). The July to September mean chlorophyll a concentration in 2006 was 14.7 μg/L, and is the first time since 1994 that the seasonal chlorophyll a levels met the Reservoir standard.
Jan
1
Feb
1
Mar
4
Apr
4
Ma
y 5
Jun
5
Jul 6
Aug
6
Sep
6
Oct
7
Nov
7
Dec
8
0
10
20
30
40
50
60
Ch
loro
ph
yll-
a (
g/L
)
Annual Mean = 15.9 µg/LJuly-September Mean = 14.7 µg/L
15 g/L Standard
Figure 13: Concentration of chlorophyll a (μg/L) in Cherry Creek Reservoir, 2006. Error bars
represent 95% confidence interval around each mean. Highlighted area denotes the seasonal period for the chlorophyll a standard.
4.1.7 Long term Chlorophyll a Trends in Cherry Creek Reservoir The seasonal mean chlorophyll a concentration has met the standard of 15 μg/L only five out of the past 20 years (Figure 14), and not since 1994. Since 1987, there is no significant trend in the seasonal mean chlorophyll a concentration (Figure 14). However, since 1999 there has been a steady decline in the seasonal mean chlorophyll a concentration, with the Reservoir meeting the standard in 2006 for the first time in 12 years.

GEI Consultants, Inc. June 2007 Chadwick Ecological Division Cherry Creek Monitoring Report
23
1987
1988
1989
1990
1991
1992
1993
1994
1995
1996
1997
1998
1999
2000
2001
2002
2003
2004
2005
2006
0
10
20
30
40
50
60
Ch
loro
ph
yll a
( g
/L)
15 g/L
Figure 14: Seasonal mean (July to September) chlorophyll a concentrations measured in
Cherry Creek Reservoir, 1987 to 2006. Error bars represent 95% confidence interval around each mean.
4.2 Reservoir Biology 4.2.1 2006 Phytoplankton Phytoplankton density in the photic zone ranged from 8,889 cells/mL on September 19 to 601,915 cells/ml on April 12 (Table 4). The number of algal taxa present in the Reservoir ranged from 24 on May 24 to 49 on July 18. Annually, the assemblage was dominated in terms of density by green algae, with blue-green algae being the second most abundant taxonomic group (Figure 15). Regression analysis revealed no significant correlation between phytoplankton density and total or soluble reactive phosphorus concentrations during 2006. Additionally, no significant relationship was observed between phytoplankton density and chlorophyll a. Chlorophyll a concentrations did not correlate well with Reservoir total phosphorus concentrations, but did reveal a significant correlation (p <0.001, R2 = 0.67) with Reservoir total nitrogen concentrations. These relationships suggest that algal biomass (chlorophyll a) was limited by nitrogen during 2006, and support conclusions made by Lewis et al. 2004. Lewis et al. observed that algal biomass was often limited by nitrogen given the surplus of phosphorus in the system. During their study, May to October 2003, photic zone phosphorus concentrations would need to be reduced to approximately 30 µg/L, to induce phosphorus limitation in the algal assemblage.

GEI Consultants, Inc. June 2007 Chadwick Ecological Division Cherry Creek Monitoring Report
24
4.2.2 Long Term Phytoplankton In 2006, the phytoplankton assemblage was dominated by green and blue-green algae, 65 percent and 32 percent, respectively (Table 4). The dominance of green algae over blue-green algae is only the fourth occurrence since 1984, but has been the general trend for the last 3 years. Historically, the blue-green algae have dominated the phytoplankton assemblage in terms of density. The proportion of the phytoplankton assemblage comprised by diatoms, golden-brown algae, and dinoflagellates was greater than their respective long term median values (Appendix E). Additionally, the cryptomonad density in 2006 was greater than their long term mean density, while euglenoids were less than their long term mean density. Table 4: Density (cells/mL) of phytoplankton and total number of taxa collected from all
three sites on Cherry Creek Reservoir, 2006. Taxa Mar 14 Apr 12 May 08 May 24 Jun 06 Jun 20 Jul 05
Diatoms Centrics 280 7,700 0 8 42 820 2,450Pennates 220 1,700 2,203 1,250 240 3,750 920Green Algae 81,530 560,830 37,289 54,198 77,427 32,389 144,270Blue-Green Algae 58,400 25,630 3,526 0 8,798 45,980 32,000Golden-Brown Algae 0 0 5 2 0 20 380Yellow-Green Algae 0 5 0 0 0 0 0Euglenoids 20 0 0 0 0 2 35Dinoflagellates 110 35 0 0 3 17 15Cryptomonads 5,300 5,040 1,534 840 1,955 643 3,654Haptomonads 960 800 0 0 0 0 0Microflagellates 90 175 0 0 0 0 60Total Density 146,910 601,915 44,557 56,298 88,465 83,621 183,784Total Taxa 35 41 34 24 28 33 41
Taxa Jul 18 Aug 01 Aug 15 Sep 07 Sep 19 Oct 18 Nov 08 Diatoms Centrics 1,400 5,855 NA 16 340 1,972 738Pennates 5 30 NA 1 20 27 49Green Algae 184,620 88,260 NA 43,720 7,328 30,316 16,071Blue-Green Algae 18,825 272,732 NA 188,045 220 2,000 9,540Golden-Brown Algae 0 0 NA 0 0 10 125Yellow-Green Algae 0 0 NA 0 0 0 0Euglenoids 55 980 NA 454 1 2 0Dinoflagellates 25 70 NA 30 0 5 20Cryptomonads 1,610 1,700 NA 4,600 955 6,240 6,440Haptomonads 320 0 NA 0 0 0 0Microflagellates 1,040 500 NA 800 25 80 0Total Density 207,900 370,127 237,666 8,889 40,652 32,983Total Taxa 49 43 46 31 38 31

GEI Consultants, Inc. June 2007 Chadwick Ecological Division Cherry Creek Monitoring Report
25
Jan Feb Mar Apr May Jun Jul Aug Sep Oct Nov Dec
Alg
al A
bu
nd
ance
(ce
lls/m
l)
0
100000
200000
300000
400000
500000
600000
To
tal P
ho
sph
oru
s (µ
g/L
)T
ota
l Nit
rog
en ×
10 (
µg
/L)
0
20
40
60
80
100
120
140
160
180
Blue-green Algae Green Algae Photic Zone TP
Photic Zone TN
Figure 15: Annual pattern of blue-green and green algal densities and photic zone total phosphorus and total nitrogen concentrations in Cherry Creek Reservoir, 2006.
4.2.3 Fish Populations Historically, the fish assemblage has been composed of many species that represent a variety of trophic levels, which include omnivores, insectivores, zooplanktivores, and piscivores. Fish can exert a strong influence on the structure and productivity of phytoplankton and zooplankton assemblage through food web pathways between different levels (phytoplankton, zooplankton, and fish) of the aquatic ecosystem (Carpenter et al. 1985). In addition, these trophic dynamics can affect the variability, distribution, and ratios of limiting nutrients, such as phosphorus and nitrogen (Vanni et al. 1996). Mechanisms that may possibly result because of fish predation include decreased herbivory by zooplankton when fish are abundant, modification of nutrient recycling rates by herbivorous zooplankton as fish abundance varies, and nutrient recycling by fish (Vanni and Layne, 1996). Stocking data from the Colorado Division of Wildlife (CDOW) shows that 11 species and three hybrids have been stocked in Cherry Creek Reservoir from 1985 to 2006 (Appendix E). The three stocked hybrids have been the wiper, striped bass × white bass, the tiger musky, northern pike × muskellunge, and a trout hybrid, rainbow × cutthroat trout. Of these 14 stocked fish taxa, rainbow trout and walleye have been stocked every year. In 2006, eight fish taxa were stocked (Appendix E): rainbow trout, Snake River cutthroat trout, rainbow × cutthroat hybrid, walleye, wiper, channel catfish, black crappie, and largemouth bass.

GEI Consultants, Inc. June 2007 Chadwick Ecological Division Cherry Creek Monitoring Report
26
4.3 Stream Water Quality 4.3.1 2006 Phosphorus Concentrations in Streams The median annual total phosphorus concentration for base flow conditions ranged from 52 μg/L at CT-P2 to 157 μg/L at CC-10 (Table 5). At most stream sites, the median seasonal (July-to-September) base flow concentration was greater than the annual median concentration. The seasonal median concentration of total phosphorus ranged from 71 μg/L at Site CT-2 to 166 μg/L at Site CC-10. At all stream sites, the storm flow TP concentration was greater than concentrations during base flow conditions. The annual median storm flow concentration ranged from 161 μg/L at Site SC-3 to 477 μg/L at Site CC-10. Table 5: Comparison of median base flow and median storm flow concentrations of total
phosphorus (TP) and total suspended solids (TSS) in tributaries to Cherry Creek Reservoir, 2006.
Stream, Site Base Flow Storm Flow
Summer Annual AnnualTP (μg/L) TSS (mg/L) TP (μg/L) TSS (mg/L) TP (μg/L) TSS (mg/L)
Cherry Creek CC-10 166 10 157 18 477 122 CC-O 190 19 83 17 -- -- Cottonwood Creek CT-1 55 19 73 29 326 167 CT-2 71 39 64 38 259 83 CT-P1 96 21 64 13 227 61 CT-P2 80 31 52 19 218 57 Shop Creek SC-3 113 5 93 7 161 10
4.3.2 Long Term Trends in Phosphorus Concentrations in Cherry Creek
Reservoir Tributaries Long term patterns (1995-2006) in total phosphorus and soluble reactive phosphorus concentrations were evaluated for the three main tributary sites (CC-10, SC-3, and CT-2) to Cherry Creek Reservoir, for both base flow and storm flow conditions. The long term median annual base flow total phosphorus concentration for Cherry Creek (CC-10) and Shop Creek (SC-3) are 219 µg/L and 105 µg/L, respectively (Table 6), with storm flow concentrations being approximately 1.5 fold greater (Table 7). In Cottonwood Creek (CT-2), the long term median annual base flow total phosphorus concentration is 84 µg/L; however, the long term median storm flow concentration is approximately 2.5 fold greater. Soluble reactive phosphorus fractions for base flows in Cherry Creek and Shop Creek were approximately 78 percent and 70 percent, respectively, of the total phosphorus concentrations, while soluble reactive phosphorus fractions in Cottonwood Creek (CT-2) have been approximately 27 percent of total phosphorus concentrations.

GEI Consultants, Inc. June 2007 Chadwick Ecological Division Cherry Creek Monitoring Report
27
Table 6: Comparison of base flow median annual total phosphorus and soluble reactive phosphorus concentrations for Sites CC-10, SC-3, and CT-2 from 1995 to 2006.
Year CC-10 SC-3 CT-2
TP (µg/L)
SRP (µg/L)
TP (µg/L)
SRP (µg/L)
TP (µg/L)
SRP (µg/L)
1995 177 148 83 63 -- -- 1996 145* 155* 77 70 100 78 1997 202 184 104 83 108 62 1998 264 229 78 71 105 66 1999 258 195 99 60 87 37 2000 284 195 156 125 87 24 2001 222 165 164 126 74 18 2002 193 147 160 125 72 11 2003 205 162 81 66 93 14 2004 214 154 163 105 81 8 2005 216 176 140 80 81 12 2006 157 134 128 63 64 7
Median 219 171 105 74 84 23 * Results for total phosphorus and soluble reactive phosphorus are obtained independently and are within the 10 percent analytical error rate for all data used to calculate the median annual value.
Table 7: Comparison of storm flow median annual total phosphorus and soluble reactive
phosphorus concentrations for Sites CC-10, SC-3, and CT-2 from 1995 to 2006.
Year CC-10 SC-3 CT-2
TP (µg/L)
SRP (µg/L)
TP (µg/L)
SRP (µg/L)
TP (µg/L)
SRP (µg/L)
1995 181 161 122 95 -- -- 1996 323 270 132 85 336 160 1997 402 316 175 74 391 221 1998 378 277 155 124 314 108 1999 348 247 141 112 118 58 2000 673 274 407 166 277 93 2001 293 172 227 84 209 33 2002 251 171 207 110 175 21 2003 365 171 197 134 204 35 2004 285 237 208 100 208 35 2005 354 187 190 129 175 26 2006 477 221 161 122 259 74
Median 319 209 165 106 220 65
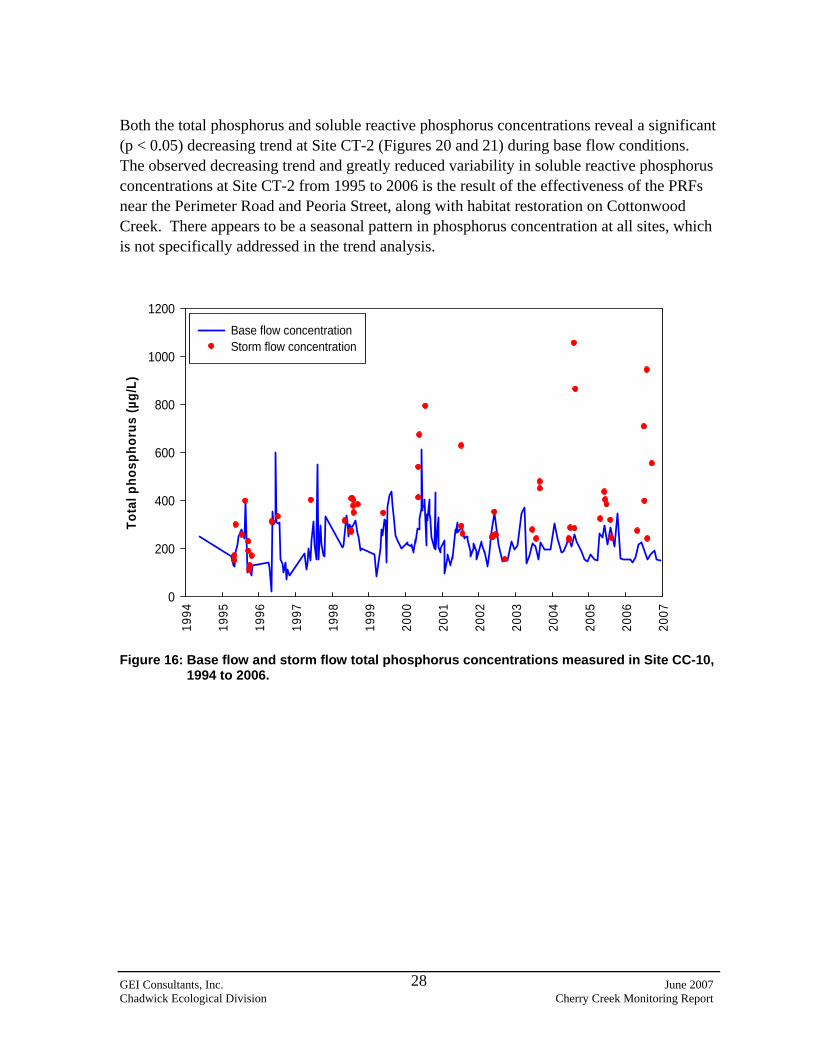
Base flow total phosphorus and soluble reactive phosphorus concentrations revealed no trends over time at Site CC-10 (Figures 16 and 17). At Site SC-3, base flow phosphorus concentrations for both total and SRP fractions, have exhibited a significant (p < 0.05) increasing trend over time (Figures 18 and 19). However, the increased variability in data since 1999 may have resulted in the significant trend. This may be an indication of potentially reduced effectiveness of the Shop Creek wetlands over time.
GEI Consultants, Inc. June 2007 Chadwick Ecological Division Cherry Creek Monitoring Report
28
Both the total phosphorus and soluble reactive phosphorus concentrations reveal a significant (p < 0.05) decreasing trend at Site CT-2 (Figures 20 and 21) during base flow conditions. The observed decreasing trend and greatly reduced variability in soluble reactive phosphorus concentrations at Site CT-2 from 1995 to 2006 is the result of the effectiveness of the PRFs near the Perimeter Road and Peoria Street, along with habitat restoration on Cottonwood Creek. There appears to be a seasonal pattern in phosphorus concentration at all sites, which is not specifically addressed in the trend analysis.
1994
1995
1996
1997
1998
1999
2000
2001
2002
2003
2004
2005
2006
2007
To
tal
ph
os
ph
oru
s (
µg
/L)
0
200
400
600
800
1000
1200
Base flow concentrationStorm flow concentration
Figure 16: Base flow and storm flow total phosphorus concentrations measured in Site CC-10,
1994 to 2006.

GEI Consultants, Inc. June 2007 Chadwick Ecological Division Cherry Creek Monitoring Report
29
1994
1995
1996
1997
1998
1999
2000
2001
2002
2003
2004
2005
2006
2007
So
lub
le R
eact
ive
Ph
osp
ho
rus
(µg
/L)
0
200
400
600
800
1000
1200
Base flow concentrationStorm flow concentration
Figure 17: Base flow and storm flow soluble reactive phosphorus concentrations measured in
Site CC-10, 1994 to 2006.
1994
1995
1996
1997
1998
1999
2000
2001
2002
2003
2004
2005
2006
2007
To
tal
ph
osp
ho
rus(
µg
/L)
0
200
400
600
800
1000
1200
Base flow concentrationStorm flow concentration
Figure 18: Base flow and storm flow total phosphorus concentrations measured in Site SC-3,
1994 to 2006.

GEI Consultants, Inc. June 2007 Chadwick Ecological Division Cherry Creek Monitoring Report
30
1994
1995
1996
1997
1998
1999
2000
2001
2002
2003
2004
2005
2006
2007
So
lub
le R
eact
ive
Ph
osp
ho
rus
(µg
/L)
0
200
400
600
800
1000
1200
Base flow concentrationStorm flow concentration
Figure 19: Base flow and storm flow soluble reactive phosphorus concentrations measured in
Site SC-3, 1994 to 2006.
1996
1997
1998
1999
2000
2001
2002
2003
2004
2005
2006
2007
To
tal
ph
osp
ho
rus
(µg
/L)
0
200
400
600
800
1000
1200
Base flow concentrationStorm flow concentration
Figure 20: Base flow and storm flow total phosphorus concentrations measured in Site CT-2,
1996 to 2006.

GEI Consultants, Inc. June 2007 Chadwick Ecological Division Cherry Creek Monitoring Report
31
1996
1997
1998
1999
2000
2001
2002
2003
2004
2005
2006
2007
So
lub
le R
eact
ive
Ph
osp
ho
rus
(µg
/L)
0
200
400
600
800
1000
1200
Base flow concentrationStorm flow concentration
Figure 21: Base flow and storm flow soluble reactive phosphorus concentrations measured in
Site CT-2, 1996 to 2006.
4.3.3 Long Term Trends in Phosphorus Concentrations in Cherry Creek
Reservoir Alluvium Alluvial phosphorus data were obtained from JCHA for Site MW-9, and are used to estimate the alluvial phosphorus load component, as summarized in Appendix D. Given the ability of alluvium to filter out particulates, total dissolved phosphorus was used as a surrogate to total phosphorus. Alluvial total dissolved phosphorus concentrations show a slight, but significant (p <0.05), increasing trend over time (1994 – 2006) at Site MW-9 (Figure 22).

GEI Consultants, Inc. June 2007 Chadwick Ecological Division Cherry Creek Monitoring Report
32
199
4
199
5
199
6
199
7
199
8
199
9
200
0
200
1
200
2
200
3
200
4
200
5
200
6
200
7
To
tal
Dis
solv
ed P
ho
ph
oru
s an
d
So
lub
le R
eact
ive
Ph
osp
ho
rus
(µg
/L)
0
100
200
300
400
500
600
700
Total dissolved phosphorusSoluble reactive phosphorus
Figure 22: Total dissolved phosphorus and soluble reactive phosphorus concentrations
measured at Site MW-9 (1994 to 2006).
4.4 Reservoir Phosphorus Loads and Export Nutrients that limit or enhance algal growth in Cherry Creek Reservoir have many sources, both within the Reservoir (internal loading) or from outside the Reservoir (external loading). The direct release of nutrients from sediment, fish and plankton excrement, and the decay of organic matter are all internal sources of nutrients in a reservoir (Goldman and Horne 1983). However, the release of phosphorus from sediment during anoxic water conditions is the most substantial component of internal loading, and has been previously estimated to be 4,000 pounds per year in Cherry Creek Reservoir (Nürnberg and LaZerte, 2000; and LaZerte and Nürnberg, 2000). Recent studies evaluating internal loading from the sediments suggest lower estimates of internal phosphorus loading ranging between 810 lbs/yr and 1,590 lbs/yr (AMEC et al. 2005). External sources of nutrients include flow from streams, direct precipitation and the alluvium, which carry nutrients from soil erosion, agricultural and residential runoff, treated wastewater, and airborne particulates. While both phosphorus and nitrogen are potentially important, past studies have concluded that Cherry Creek Reservoir was generally phosphorus limited (DRCOG, 1985). However, a more recent nutrient enrichment study by

GEI Consultants, Inc. June 2007 Chadwick Ecological Division Cherry Creek Monitoring Report
33
Lewis et al. (2005) indicated that nitrogen was often the primary limiting nutrient in Cherry Creek Reservoir during the growing season. Phosphorus (unlike nitrogen) does not have a gas phase. Thus, phosphorus concentrations cannot be reduced by interactions with the atmosphere or gases within the water column. For these reasons, efforts in past years and during the present study have concentrated on phosphorus loading. In 2006, changes were made to the phosphorus loading methodology (Appendix D) in response to comments from CDPHE, which are expected to have minimal changes on the annual total phosphorus load to the Reservoir when compared to past methodologies. Total phosphorus loads were determined for several primary sources, including the tributary streams Cherry Creek, Shop Creek, and Cottonwood Creek, as well as from precipitation and alluvium, as summarized in Appendix D. 4.4.1 Phosphorus Load from Tributary Streams Monthly base flow phosphorus concentrations, along with the annual storm flow median concentration were applied to their respective flow to estimate loads for each stream site. Stream flows that were greater than the 90th percentile of all flows measured for that site were categorized as storm flows. The greatest proportion (57 percent) of the total phosphorus load to the Reservoir was from Cherry Creek mainstem flows (3,691 lbs). Because Cherry Creek is monitored downstream of Shop Creek, the 76 lbs contributed by Shop Creek has been subtracted from the total load calculated for Site CC-10. Cottonwood Creek accounted for 20 percent of the phosphorus load, or 1,325 lbs. In 2006, the total phosphorus load to Cherry Creek Reservoir from tributary streams was 5,092 lbs (Table 8). 4.4.2 Phosphorus Export from Reservoir Outflow The total outflow from Cherry Creek Reservoir as measured by the USACE was 11,292 acre-feet per year (ac-ft/yr) (Appendix D). Monthly total phosphorus data collected from Site CC-O was used to estimate the phosphorus export (3,278 lbs/yr) leaving the Reservoir in 2006 (Table 8).

GEI Consultants, Inc. June 2007 Chadwick Ecological Division Cherry Creek Monitoring Report
34
Table 8: Estimated phosphorus loading and export (lbs/year) for Cherry Creek Reservoir,
1992 to 2006.
Year Shop Creek
Cherry Creek
Cottonwood Creek
Stream Load
Subtotal
Cherry Creek
Alluvium
Direct Precipita-
tion*
External Load
Cherry Creek
Outflow
Net External Load
Flow-weighted
TP (lbs/ac-ft)
1992 131 2,894 1,081 4,106 874 414 5,394 1,314 4,080 0.78 1993 83 1,727 177 1,987 1,387 349 3,723 711 3,012 0.70 1994 135 2,142 321 2,598 967 245 3,810 993 2,817 0.58 1995 115 2,795 2,184 5,094 1,676 561 7,331 2,049 5,282 0.68 1996 107 2,347 553 3,007 968 328 4,303 992 3,311 0.62 1997 117 2,041 646 2,804 1,937 487 5,228 1,628 3,600 0.56 1998 127 7,666 1,143 8,936 3,787 449 13,172 4,207 8,965 0.65 1999 96 8,745 1,822 10,663 5,912 471 17,046 9,650 7,396 0.63 2000 82 8,306 1,087 9,475 2,341 398 12,214 4,790 7,424 0.68 2001 103 3,412 1,292 4,807 4,444 359 9,610 4,842 4,768 0.57 2002 79 1,105 789 1,973 1,006 288 3,267 1,501 1,766 0.57 2003 103 4,637 1,130 5,870 2,307 423 8,600 4,978 3,622 0.51 2004 210 7,379 2,592 10,181 2,181 454 12,816 4,812 8,004 0.73 2005 127 6,636 1,697 8,460 1,123 346 9,929 3,669 6,260 0.54 2006 76 3,692 1,325 5,093 1,034 376 6,502 3,278 3,224 0.51
Median 107 3,412 1,130 5,093 1,676 398 7,331 3,278 4,080 0.62Precipitation loads have been recalculated using the 1995 to 2005 median TP concentration Note: Pre-2006 loads are in the process of being recalculated using a consistent methodology for all years
4.4.3 Phosphorus Load from Precipitation In 2006, at total of 16.7 inches of precipitation was recorded at the KAPA meteorological station located at Centennial Airport. When scaled to the areal extent of the Reservoir (852 acres), precipitation accounted for a total of 1,189 acre-feet of inflow to the Reservoir. The mean concentration of total phosphorus collected from rainfall samples in 2006 was 55 μg/L, which is considerably less than the long term (1995 to 2005) median value of 116 μg/L used in the recalculation of the long term precipitation phosphorus loads. The period from 1995 to 2005 represents a more consistent portion of the data in sample collection, analytical methods, and data variability. Therefore, the median value since 1995 was used for the recalculation process (Appendix D), and to calculate the 2006 annual total phosphorus load of 376 lbs/yr. The long-term median total phosphorus load from precipitation events collected from 1987 to 2006 is 387 lbs (Table 9).

GEI Consultants, Inc. June 2007 Chadwick Ecological Division Cherry Creek Monitoring Report
35
Table 9: Phosphorus loading into Cherry Creek Reservoir from precipitation, 1987 to 2006. Data from 1987 to 1991 are based on water years, while data for 1992 to present are based on calendar years. Load is based on the long term (1995 to 2005) median total phosphorus concentration of 116 µg/L for sampled precipitation events.
Year Precipitation (inches/yr)
Total Phosphorus Load (lbs/yr)
1987 18.1 405 1988 23.3 522 1989 13.0 292 1990 15.2 341 1991 16.5 370 1992 18.5 414 1993 15.6 349 1994 11.0 245 1995 25.1 561 1996 14.6 328 1997 21.7 487 1998 20.0 449 1999 21.0 471 2000 17.8 398 2001 16.0 359 2002 12.9 288 2003 18.9 423 2004 20.3 454 2005 15.5 346 2006 16.7 376
Median 17.2 387
4.4.4 Phosphorus Load from Alluvium In 2006, the alluvial inflow quantity was set as a constant 2000 ac-ft/yr with the rationale being summarized in Appendix D, per recommendations from CDPHE. The long-term (1994 to 2006) median total dissolved phosphorus concentration of alluvial flows from Site MW-9 is 190 µg/L. The alluvial phosphorus load to the Reservoir was estimated to be 1,034 lbs in 2006 (Table 8). 4.4.5 Mass Balance/Net Loading of Phosphorus to the Reservoir The USACE calculates daily inflow to Cherry Creek Reservoir as a function of change in storage (i.e., reservoir volume) based on: 1) changes in reservoir level; 2) measured outflow; 3) precipitation; and 4) evapotranspiration. This method for calculating reservoir volume accounts for groundwater inflow via alluvium, but does not directly quantify the flow. GEI monitors surface water inflow to the Reservoir using gaged stations on the three main surface inflows, Cherry Creek, Cottonwood Creek, and Shop Creek. Given the differences in the two methods for determining inflow, combined with the potential for unmonitored multiple

GEI Consultants, Inc. June 2007 Chadwick Ecological Division Cherry Creek Monitoring Report
36
Cherry Creek channels in the wetlands adjacent to the Reservoir, unmonitored surface flow (i.e., Belleview and Quincy drainages), and the potential for the USACE calculations to underestimate dam leakage (Lewis and Saunders 2002), an exact match between USACE and GEI calculated inflows is not expected. In 2006, the USACE calculated inflow was 12,799 ac-ft/yr, while the GEI calculated stream inflow was 8,821 ac-ft/yr (Appendix D). To compare these two inflow values, the USACE inflow was adjusted for precipitation (1,189 ac-ft/yr) and alluvial inflows (2,000 ac-ft/yr), which resulted in an adjusted USACE inflow of 9,610 ac-ft/yr. The difference between the adjusted USACE inflow and the GEI stream inflow was 789 acre-feet of water. This volume of water was reapportioned to both Cherry Creek and Cottonwood Creek, with a flow-weighted total phosphorus concentration being used to calculate the associated load of 317 lbs. The flow-weighted concentration was calculated using the three sources of external flow and loads (i.e., GEI stream inflow, alluvial inflow, and precipitation). Following this adjustment to complete the water balance, in 2006, flow from the three tributary streams accounted for a total of 5,092 lbs of phosphorus to the Reservoir (Table 8). The alluvial inflow contributed 1,034 lbs of phosphorus, with precipitation events contributing 376 lbs to the Reservoir. The total external load of phosphorus to the Reservoir in 2006 was 6,502 lbs (Figure 23), which meets the TMAL of 14,270 lbs/yr. The Reservoir outflow phosphorus load was estimated to be 3,278 lbs. Consistent with the TMAL, these values do not include any estimates of internal phosphorus loads. The flow-weighted total phosphorus concentration for all external sources of inflow to the Reservoir is 0.51 lbs/ac-ft and the flow-weighted export concentration for the Reservoir is 0.29 lbs/ac-ft The difference of 0.22 lbs/ac-ft was retained by the Reservoir. The net external phosphorus load to the Reservoir was 3,224 lbs in 2006.

GEI Consultants, Inc. June 2007 Chadwick Ecological Division Cherry Creek Monitoring Report
37
Figure 23: Mass balance diagram of phosphorus loading in Cherry Creek Reservoir, 2006.

GEI Consultants, Inc. June 2007 Chadwick Ecological Division Cherry Creek Monitoring Report
38
4.5 Effectiveness of Pollutant Reduction Facilities 4.5.1 Cottonwood Creek Peoria Pond The effectiveness of the Cottonwood Creek Peoria Pond is gaged by monitoring the concentrations of phosphorus and total suspended solids (TSS), and the loading of phosphorus upstream and downstream of the facility. Notably, the loads used to evaluate the effectiveness of the PRF are not affected by the “normalization” of GEI inflow to USACE inflow values for Cherry Creek Reservoir. In 2006, the mean total phosphorus concentration both upstream and downstream of the PRF was nearly identical (Table 10). Total suspended solids were slightly greater downstream of the PRF system when compared to the upstream value (Table 10). Despite the comparable total phosphorus and total suspended solids values upstream and downstream of the PRF in 2006, the total phosphorus load downstream of the PRF system was reduced by 24 percent. This reduction in load is primarily a function of water loss due to the PRF, either by evapotranspiration or percolation into the shallow groundwater. The flow-weighted total phosphorus concentration upstream and downstream of the PRF was 0.38 lbs/ac-ft and 0.37 lbs/ac-ft, respectively, which indicates a low efficiency in removing phosphorus from flow despite the reduction in load. Table 10: Historical total phosphorus and total suspended solids concentrations and total
phosphorus loads upstream and downstream of the Cottonwood Creek - Peoria wetlands system, 2002 to 2006.
Parameter Year Sampling Sites
Difference Percent Change
Downstream CT-P1 CT-P2
Mean Total Phosphorus Concentration (µg/L) (base flow and storm flow samples combined)
2002 138 152 14 10 2003 101 92 -9 -9 2004 142 123 -19 -13 2005 92 101 9 10 2006 132 133 1 1 Mean 121 120 -0.8 -0.2
Mean Total Suspended Solids (mg/L)
2002 66 79 13 20 2003 31 34 3 10 2004 87 53 -34 -39 2005 47 51 4 9 2006 38 47 9 24 Mean 54 53 -1 4.8
Total Phosphorus Load (pounds)
2002 449 231 -228 -49 2003 771 574 -197 -26 2004 2,590 1,499 -1,091 -42 2005 596 649 53 9 2006 699 530 -169 -24 Mean 1021 697 -326 -26.4

GEI Consultants, Inc. June 2007 Chadwick Ecological Division Cherry Creek Monitoring Report
39
4.5.2 Cottonwood Creek Perimeter Pond The effectiveness of the Cottonwood Creek storm water Perimeter Pond in reducing phosphorus loads to the Reservoir is similarly gaged by comparing data from sites upstream and downstream of the PRF (Table 11). During 2006, the mean concentration of total phosphorus slightly decreased from 170 to 161 μg/L after passing through the PRF, representing a 5 percent reduction in phosphorus concentration (Table 11). The mean concentration of TSS increased slightly, from 86 mg/L upstream to 95 mg/L downstream of the PRF. The total phosphorus load decreased downstream of the pond by 36 percent, with the flow-weighted concentration showing a reduction from 0.46 lbs/ac-ft to 0.37 lbs/ac-ft. This PRF is effective in reducing the overall hydrologic load through this stretch of Cottonwood Creek, by evapotranspiration or percolation, and appears to be more efficient in removing phosphorus from stream flows than the Peoria Pond. The reduction in the flow-weighted concentration indicates that this PRF continues to be effective in reducing total phosphorus loads to Cherry Creek Reservoir. In past years, greater flow-weighted concentrations observed at Site CT-1, when compared to Site CT-P2, indicated potential loading from stream channel erosion or additional inputs from Lonetree Creek, which is a tributary to Cottonwood Creek upstream of Site CT-1. In an effort to reduce phosphorus loading in the Reservoir from the stream itself, channel reconstruction was conducted on Cottonwood Creek downstream of the Cottonwood Creek - Peoria wetland system in 2004, with completion of Phase 2 pending. While the channel reconstruction or inputs from Lonetree Creek may have accounted for the increased loads observed between these two existing PRFs, the flow-weighted concentration downstream of the Cottonwood Creek Perimeter Pond indicates that this PRF continues to be effective in reducing the total phosphorus load to Cherry Creek Reservoir. 4.5.3 Shop Creek and Quincy Drainage Pond Historical sampling of the PRFs on Shop Creek and Quincy Drainage indicate efficient phosphorus removal in these streams. Shop Creek was monitored for 10 years from 1990 to 2000 at sites upstream and downstream of PRF stations (detention pond and wetlands). The Shop Creek PRF had an average annual phosphorus load reduction of 173 lbs, with an average of 63 percent reduction in load. Quincy Drainage was even more efficient with 99 percent reduction in loads over the period of 1996 to 1999. The average phosphorus load reduction was 138 lbs. GEI has not monitored the Shop Creek and Quincy Drainage PRFs for effectiveness since 2000. Based on past data, loads from these two drainages averaged less than 1 percent of total external load to the Reservoir.

GEI Consultants, Inc. June 2007 Chadwick Ecological Division Cherry Creek Monitoring Report
40
Table 11: Historical total phosphorus and total suspended solids concentrations and total phosphorus loads upstream and downstream of the Cottonwood Creek stormwater detention pond (1997-2006).
Parameter Year Sampling Sites
Difference Percent Change
Downstream CT-1 CT-2
Average Total Phosphorus Concentration (µg/L) (baseflow and storm samples combined)
1997 200 133 -67 -34 1998 289 210 -79 -27 1999 158 157 -1 -1 2000 187 149 -38 -20 2001 165 114 -51 -31 2002 146 143 -3 -2 2003 144 129 -15 -10 2004 212 151 -61 -29 2005 180 142 -38 -21 2006 170 161 -9 -5 Mean 185 149 -36 -18
Average Total Suspended Solids (mg/L)
1997 207 87 -120 -58 1998 311 129 -182 -59 1999 267 68 -199 -75 2000 96 64 -32 -33 2001 79 43 -36 -46 2002 130 79 -51 -39 2003 84 62 -22 -26 2004 155 77 -78 -50 2005 126 66 -60 -48 2006 86 95 9 10 Mean 154 77 -77 -42
Loading of Total Phosphorus (pounds)
1997 3,351 1,103 -2,248 -67 1998 3,209 1,930 -1,279 -40 1999 6,329 3,868 -2,461 -39 2000 3,243 1,712 -1,531 -47 2001 3,356 2,205 -1,151 -34 2002 886 789 -97 -11 2003 1,777 1,130 -647 -36 2004 3,334 2,592 -742 -22 2005 1,399 1,697 298 21 2006 1,911 1,219 -692 -36 Mean 2880 1825 -1055 -31

GEI Consultants, Inc. June 2007 Chadwick Ecological Division Cherry Creek Monitoring Report
41
5.0 Summary and Conclusions
5.1 Transparency The period in late May through June, and September 2006, represented a time when Reservoir water clarity was at its best. The whole-reservoir mean Secchi depth was 1.05 m during the July-to-September period. This value represents the deepest mean value since 1998, and is similar to the long-term mean value (Table 12). There was a significant negative relationship between water clarity and chlorophyll a concentration. Table 12: Water quality and total phosphorus loads for Cherry Creek Reservoir, (1992 to
2006). Highlighted cell indicates value meets the respective standard, goal, or phased-TMAL value.
Year
Jul-Sep Secchi
Depth (m)
Jul-Sep Total
Phosphorus (μg/L)
Jul-Sep Total
Nitrogen (µg/L)
Jul-Sep Chlorophyll a
(µg/L) Inflow (ac-ft)*
External Phosphorus
Load (lbs/yr)*
Flow-weighted Concentration
(lbs/ac-ft)
1992 0.95 66 970 17 7,474 5,857 0.78 1993 1.20 62 826 14.4 5,905 4,110 0.70 1994 1.10 59 1,144 6.2 7,001 4,049 0.58 1995 1.62 48 913 15.6 11,781 7,972 0.68 1996 1.60 62 944 20.5 7,644 4,715 0.62 1997 1.00 96 1,120 22.3 10,362 5,761 0.56 1998 1.09 89 880 26.5 20,903 13,577 0.65 1999 1.03 81 753 28.9 27,739 17,471 0.63 2000 0.96 81 802 25.2 18,610 12,593 0.68 2001 0.75 87 741 26.1 17,250 9,837 0.57 2002 0.91 74 858 18.8 7,498 4,246 0.57 2003 0.86 90 1,121 25.8 14,929 8,568 0.57 2004 0.85 102 977 18.4 17,177 12,512 0.73 2005 0.97 116 990 17.1 18,534 10,047 0.54 2006 1.05 87 914 14.7 12,799 6,502 0.51
Mean 1.06 80 930 19.8 13,707 8,521 0.62Median 1.00 81 914 18.8 12,799 7,972 0.62
*Stream, alluvium, and precipitation.
5.2 Temperature and Dissolved Oxygen The Reservoir was well mixed and oxygenated from March to early May 2006. From May through July the Reservoir showed signs of thermal stratification, which was supported by evidence of an oxycline throughout the Reservoir. During this period, dissolved oxygen concentrations were often less than 5 mg/L at depths greater than 4 m. Microbial mediated anoxia may create favorable conditions for nutrient loading via the sediments. Soluble reactive phosphorus concentrations observed at depth also provide evidence of internal

GEI Consultants, Inc. June 2007 Chadwick Ecological Division Cherry Creek Monitoring Report
42
nutrient loading during this low oxygen period. Dissolved oxygen profiles were also compared to the basic standards table value for Class 2 warm water lakes and reservoirs. As a conservative estimate, the mean dissolved oxygen concentration for the entire water column was computed for each sampling event, with each event showing that the Reservoir met the Class 2 warm water criteria for lakes and reservoirs.
5.3 Total Phosphorus The July-to-September mean total phosphorus concentration ranged from 44 to 129 μg/L, with a mean of 87 μg/L (Table 12). Since 1987, the goal of 40 μg/L total phosphorus has only been met once in 1989. When evaluated on a monthly basis, Reservoir total phosphorus concentrations are significantly related to monthly phosphorus loads.
5.4 Chlorophyll a Chlorophyll a concentrations ranged from 5.5 µg/L in late May to 41.6 µg/L in early November, with the annual mean chlorophyll a concentration being 15.9 μg/L. The seasonal (July-to-September) mean chlorophyll a concentration was 14.7 μg/L (Table 12), and is the first time in 12 years that the Reservoir met the chlorophyll a standard. Chlorophyll a concentrations were significantly correlated with Reservoir total nitrogen concentrations, but not with Reservoir phosphorus concentrations (TP or SRP). This result suggests that algal growth was limited by nitrogen in 2006.
5.5 Phosphorus Loading The total inflow of gaged tributary streams and unmonitored surface water inflows was 9,611 ac-ft/yr, and accounted for 5,092 lbs of phosphorus to the Reservoir. Annual precipitation accounted for 1,189 ac-ft of water and contributed 376 lbs of phosphorus to the Reservoir. The alluvial inflow was set to a constant value of 2000 ac-ft/yr, and accounted for 1,034 lbs of phosphorus entering the Reservoir. The total external load to the Reservoir in 2006 was 6,502 lbs, which meets the phased TMAL of 14,270 lbs/yr. The 2006 external load is less than the long term median value of 7,972 lbs/yr, with a flow-weighted total phosphorus concentration of 0.51 lbs/ac-ft, which is the lowest value on record.
5.6 Pollutant Reduction Facility Effectiveness The Cottonwood Creek Peoria Pond PRF was effective in removing 169 pounds or 24 percent of the phosphorus load from Cottonwood Creek. This load reduction is primarily the result of the reduced water load passing through the system, as the flow-weighted phosphorus concentrations upstream and downstream of the PRF were very similar. Historically, this PRF has not been as efficient as the Perimeter Pond in removing

GEI Consultants, Inc. June 2007 Chadwick Ecological Division Cherry Creek Monitoring Report
43
phosphorus or suspended solids from the surface flows, though its ability to reduce the water load directly reduces the phosphorus load. The Cottonwood Creek Perimeter Pond was effective in reducing the total phosphorus load to the Reservoir by 692 pounds or 36 percent in 2006. The effectiveness of the PRF lies in both reducing the water load through the system and removing phosphorus from the stream flows. The flow-weighted phosphorus concentration decreased by 20 percent from upstream to downstream of the system. In past years, greater flow-weighted concentrations observed at Site CT-1, when compared to Site CT-P2, indicated potential loading from stream channel erosion or additional inputs from Lonetree Creek, which is a tributary to Cottonwood Creek upstream of Site CT-1. In an effort to reduce phosphorus loading to the Reservoir from the stream itself, channel reconstruction was conducted on Cottonwood Creek downstream of the Cottonwood Creek - Peoria wetland system in 2004, with completion of Phase 2 pending. While the channel reconstruction or inputs from Lonetree Creek may have accounted for the increased loads observed between these two existing PRFs, the flow-weighted concentration downstream of the Cottonwood Creek Perimeter Pond indicates that this PRF continues to be effective in reducing the total phosphorus load to Cherry Creek Reservoir.

GEI Consultants, Inc. June 2007 Chadwick Ecological Division Cherry Creek Monitoring Report
44
6.0 References Advanced Sciences, Inc. 1994a. Cherry Creek Basin, Annual Water-Quality Monitoring
Report, 1993 Water Year. Project No. 8970. Prepared for the Cherry Creek Basin Water Quality Authority.
Advanced Sciences, Inc. 1994b. 1993 Cherry Creek Basin Water Quality Authority
Contract: Project 8790. Exhibits A through H (amended). AMEC, Earth and Environmental, Inc., Alex Horne Associates, and Hydrosphere Resource
Consultants, Inc. 2005. Cherry Creek Reservoir Destratification. Feasibility report prepared for the Cherry Creek Basin Water Quality Authority.
American Public Health Association. 1998. Standard Methods for the Examination of Water
and Wastewater, 20th Edition. Prepared and published jointly by the American Public Health Association, American Water Works Association, and Water Pollution Control Federation, Washington, DC.
Carpenter, S.R., J.F. Kitchell, and J.R. Hodgson. 1985. Cascading trophic interactions and
lake productivity. Bioscience 35:634-639. Chadwick Ecological Consultants, Inc.(CEC). 1995. Cherry Creek Reservoir Annual
Aquatic Biological and Nutrient Monitoring Study, 1994. Prepared for the Cherry Creek Basin Water Quality Authority.
Chadwick Ecological Consultants, Inc. (CEC). 1996. Cherry Creek Reservoir Annual
Aquatic Biological and Nutrient Monitoring Study, 1995. Prepared for the Cherry Creek Basin Water Quality Authority.
Chadwick Ecological Consultants, Inc. (CEC). 1997. Cherry Creek Reservoir Annual
Aquatic Biological and Nutrient Monitoring Study, 1996. Prepared for the Cherry Creek Basin Water Quality Authority.
Chadwick Ecological Consultants, Inc. (CEC). 1998a. Analysis of Phosphorus Loads to
Cherry Creek Reservoir. Prepared for the Cherry Creek Basin Water Quality Authority. Chadwick Ecological Consultants, Inc. (CEC). 1998b. Cherry Creek Reservoir Annual
Aquatic Biological and Nutrient Monitoring Study, 1997. Prepared for the Cherry Creek Basin Water Quality Authority.

GEI Consultants, Inc. June 2007 Chadwick Ecological Division Cherry Creek Monitoring Report
45
Chadwick Ecological Consultants, Inc. (CEC). 1999. Cherry Creek Reservoir 1998 Annual
Aquatic Biological and Nutrient Monitoring Study. Prepared for the Cherry Creek Basin Water Quality Authority.
Chadwick Ecological Consultants, Inc. (CEC). 2000. Cherry Creek Reservoir 1999 Annual
Aquatic Biological and Nutrient Monitoring Study. Prepared for the Cherry Creek Basin Water Quality Authority.
Chadwick Ecological Consultants, Inc. (CEC). 2001. Cherry Creek Reservoir 2000 Annual
Aquatic Biological and Nutrient Monitoring Study. Prepared for the Cherry Creek Basin Water Quality Authority.
Chadwick Ecological Consultants, Inc. (CEC). 2002. Cherry Creek Reservoir 2001 Annual
Aquatic Biological and Nutrient Monitoring Study. Prepared for the Cherry Creek Basin Water Quality Authority.
Chadwick Ecological Consultants, Inc. (CEC). 2003a. Cherry Creek Reservoir 2002 Annual
Aquatic Biological and Nutrient Monitoring Study and Cottonwood Creek Phosphorus Reduction Facility Monitoring. Prepared for the Cherry Creek Basin Water Quality Authority.
Chadwick Ecological Consultants, Inc. (CEC). 2003b. Cherry Creek Reservoir Aquatic
Biological and Nutrient Sampling and Laboratory Analyses, Sampling, Analysis, and Quality Assurance Work Plan. May 2003. Prepared for the Cherry Creek Basin Water Quality Authority.
Chadwick Ecological Consultants, Inc. (CEC). 2004. Cherry Creek Reservoir 2003 Annual
Aquatic Biological and Nutrient Monitoring Study and Cottonwood Creek Phosphorus Reduction Facility Monitoring. Prepared for the Cherry Creek Basin Water Quality Authority.
Chadwick Ecological Consultants, Inc. (CEC). 2005. Cherry Creek Reservoir 2004 Annual
Aquatic Biological and Nutrient Monitoring Study and Cottonwood Creek Phosphorus Reduction Facility Monitoring. Prepared for the Cherry Creek Basin Water Quality Authority.
Chadwick Ecological Consultants, Inc. (CEC). 2006. Cherry Creek Reservoir 2005 Annual
Aquatic Biological and Nutrient Monitoring Study and Cottonwood Creek Phosphorus Reduction Facility Monitoring. Prepared for the Cherry Creek Basin Water Quality Authority.

GEI Consultants, Inc. June 2007 Chadwick Ecological Division Cherry Creek Monitoring Report
46
Cole, G.A. 1979. Textbook of Limnology, 2nd Edition. The C.V. Mosby Company, St.
Louis, MO. Colorado Department of Public Health and Environment (CDPHE). 2007. The Basic
Standards and Methodologies for Surface Water (5 CCR 1002-31). Regulation No. 31. Water Quality Control Division, Denver, CO.
Cooke, D.C., E.B. Welch, S.A. Peterson, and P.R. Newroth. 1993. Restoration &
Management of Lakes & Reservoirs, 2nd Edition. Lewis Publishers, Boca Raton, FL. Denver Regional Council of Governments (DRCOG). 1984. Cherry Creek Reservoir Clean
Lakes Study. Denver Regional Council of Governments, Denver, CO. Denver Regional Council of Governments (DRCOG). 1985. Cherry Creek Basin Water
Quality Management Master Plan. Prepared in Cooperation with Counties, Municipalities, Water and Sanitation Districts in the Cherry Creek Basin and Colorado Department of Health.
Goldman, C.R., and A.J. Horne. 1983. Limnology. McGraw-Hill Company, NY. John C. Halepaska & Associates, Inc. (JCHA). 1999. 1998 Annual Report, Phase I Baseline
Water Quality Data Collection Study for the Upper Cherry Creek Basin. Prepared for the Cherry Creek Basin Water Quality Authority, Project No. 5601:6.
John C. Halepaska & Associates, Inc. (JCHA). 2000. 1999 Annual Report, Phase I Baseline
Water Quality Data Collection Study for the Upper Cherry Creek Basin. Prepared for the Cherry Creek Basin Water Quality Authority.
John C. Halepaska & Associates, Inc. (JCHA). 2001. 2000 Annual Report, Baseline Water
Quality Data Collection Study for the Upper Cherry Creek Basin. Prepared for the Cherry Creek Basin Water Quality Authority.
John C. Halepaska & Associates, Inc. (JCHA). 2002. 2001 Annual Report, Baseline Water
Quality Data Collection Study for the Upper Cherry Creek Basin. Prepared for the Cherry Creek Basin Water Quality Authority.
John C. Halepaska & Associates, Inc. (JCHA). 2003. 2002 Annual Report, Baseline Water
Quality Data Collection Study for the Upper Cherry Creek Basin. Prepared for the Cherry Creek Basin Water Quality Authority.

GEI Consultants, Inc. June 2007 Chadwick Ecological Division Cherry Creek Monitoring Report
47
John C. Halepaska & Associates, Inc. (JCHA). 2004. 2003 Annual Report, Baseline Water Quality Data Collection Study for the Upper Cherry Creek Basin. Prepared for the Cherry Creek Basin Water Quality Authority.
John C. Halepaska & Associates, Inc. (JCHA). 2005. 2004 Annual Report, Baseline Water
Quality Data Collection Study for the Upper Cherry Creek Basin. Prepared for the Cherry Creek Basin Water Quality Authority.
John C. Halepaska & Associates, Inc. (JCHA). 2006. 2005 Annual Report, Baseline Water
Quality Data Collection Study for the Upper Cherry Creek Basin. Prepared for the Cherry Creek Basin Water Quality Authority.
Hintze, J.L. 2001. NCSS and PASS. Number Cruncher Statistical Systems, Kaysville, UT. In-Situ, Inc. 1986 (as amended). Cherry Creek Reservoir and Cherry Creek Basin
Monitoring Program, Southeastern Denver Metropolitan Area, Colorado: Proposal No. 4405. Prepared for the Cherry Creek Basin Authority, December 3 (with later modifications).
Jones, J.R. 1994. Report on Cherry Creek Reservoir, Summer 1993. Report to Cherry
Creek Basin Water Quality Authority. Jones, J.R. 1995. Report on Cherry Creek Reservoir, Summer 1994. Report to Cherry
Creek Basin Water Quality Authority. Jones, J.R. 1996. Report on Cherry Creek Reservoir, 1995 Sampling Season. Report to
Cherry Creek Basin Water Quality Authority. Jones, J.R. 1997. Report on Cherry Creek Reservoir, 1996 Sampling Season. Report to
Cherry Creek Basin Water Quality Authority. Jones, J.R. 1998. Report on Cherry Creek Reservoir, 1997 Sampling Season. Report to
Cherry Creek Basin Water Quality Authority. Jones, J.R. 1999. Report on Cherry Creek Reservoir, 1998 Sampling Season. Report to
Cherry Creek Basin Water Quality Authority. Jones, J.R. 2001. Report on Cherry Creek Reservoir, 1992-2001 and Historical Data.
Report to Cherry Creek Basin Water Quality Authority.

GEI Consultants, Inc. June 2007 Chadwick Ecological Division Cherry Creek Monitoring Report
48
Knowlton, M.R., and J.R. Jones. 1993. Limnological Investigations of Cherry Creek Lake. Final report to Cherry Creek Basin Water Quality Authority.
LaZerte, B.D., and Nürnberg, G. 2000 Cherry Creek Reservoir Dynamic Model. Prepared
for the Cherry Creek Basin Water Quality Authority. Lewis, W.M., and J.F. Saunders. 2002. Review and Analysis of Hydrologic Information on
cherry Creek Watershed and Cherry Creek Reservoir. Prepared for the Cherry Creek Basin Water Quality Authority.
Lewis, W.M., J.F. Saunders, and J.H. McCutchan. 2004. Studies of Phytoplankton Response
to Nutrient Enrichment in Cherry Creek Reservoir, Colorado. Prepared for Colorado Department of Public Health and Environment, Water Quality Control Division.
Lewis, W.M., J.H. McCutchan, and J.F. Saunders. 2005. Estimation of Groundwater Flow
into Cherry Creek Reservoir and its Relationship to the Phosphorous Budget of the Reservoir. Prepared for the Cherry Creek Basin Water Quality Authority.
Nürnberg, G., and LaZerte, B. 2000. Modeling Future Scenarios for Cherry Creek
Reservoir. Prepared for the Cherry Creek Basin Water Quality Authority. SPSS, 2006. SPSS 15.0 for Windows. Release 15.0.0 (6 Sep 2006). Vanni, M.J., and C.D. Layne. 1996. Nutrient recycling and herbivory as mechanisms in the
top-down effect of fish on algae in lakes. Ecology 78:21-40. Vanni, M.J., C.D. Layne, and S.E. Arnott. 1996. Top-down trophic interactions in lakes:
effects of fish on nutrient dynamics. Ecology 78:1-20. Wetzel, R.G. 2001. Limnology, 3rd Edition. Academic Press, San Diego, CA.

Appendix A
Cherry Creek Reservoir Sampling and Analysis Plan

CHERRY CREEK RESERVOIR
AQUATIC BIOLOGICAL AND NUTRIENT SAMPLINGAND LABORATORY ANALYSES
SAMPLING, ANALYSIS, ANDQUALITY ASSURANCE WORK PLAN
MAY 2003
Submitted to:
Cherry Creek Basin Water Quality Authorityj R.S. Wells Corporation
6040 Greenwood Plaza Blvd, Suite 120Greenwood Village, Colorado 80111-4801
Prepared by:
Chadwick Ecological Consultants, Inc.5575 South Sycamore Street, Suite 101
Littleton, Colorado 80120www.ChadwickEcological.com

TABLE OF CONTENTS
INTRODUCTION . . . . . . . . . . . . . . . . . . . . . . . . . . . . . . . . . . . . . . . . . . . . . . . . . . . . . . . . . . . . . . . . . . 1
PROJECT DESCRIPTION . . . . . . . . . . . . . . . . . . . . . . . . . . . . . . . . . . . . . . . . . . . . . . . . . . . . . . . . . . . . 1
PROJECT ORGANIZATION AND RESPONSIBILITIES . . . . . . . . . . . . . . . . . . . . . . . . . . . . . . . . . . . 2Project Manager . . . . . . . . . . . . . . . . . . . . . . . . . . . . . . . . . . . . . . . . . . . . . . . . . . . . . . . . . . . . . . 3Quality Assurance Manager . . . . . . . . . . . . . . . . . . . . . . . . . . . . . . . . . . . . . . . . . . . . . . . . . . . . . 3Analytical and Biological Laboratory Managers . . . . . . . . . . . . . . . . . . . . . . . . . . . . . . . . . . . . . 4Sampling Crew . . . . . . . . . . . . . . . . . . . . . . . . . . . . . . . . . . . . . . . . . . . . . . . . . . . . . . . . . . . . . . . 4
AQUATIC BIOLOGICAL AND NUTRIENT SAMPLING . . . . . . . . . . . . . . . . . . . . . . . . . . . . . . . . . 5Reservoir Monitoring Sites . . . . . . . . . . . . . . . . . . . . . . . . . . . . . . . . . . . . . . . . . . . . . . . . . . . . 5Stream Monitoring Sites . . . . . . . . . . . . . . . . . . . . . . . . . . . . . . . . . . . . . . . . . . . . . . . . . . . . . . . 7PRF Monitoring Sites . . . . . . . . . . . . . . . . . . . . . . . . . . . . . . . . . . . . . . . . . . . . . . . . . . . . . . . . . 7Analyte List . . . . . . . . . . . . . . . . . . . . . . . . . . . . . . . . . . . . . . . . . . . . . . . . . . . . . . . . . . . . . . . . . 9Sampling Schedule . . . . . . . . . . . . . . . . . . . . . . . . . . . . . . . . . . . . . . . . . . . . . . . . . . . . . . . . . . . 10Field Methodologies . . . . . . . . . . . . . . . . . . . . . . . . . . . . . . . . . . . . . . . . . . . . . . . . . . . . . . . . 11Stream Sampling . . . . . . . . . . . . . . . . . . . . . . . . . . . . . . . . . . . . . . . . . . . . . . . . . . . . . . . . . . . . 14Precipitation Sampling . . . . . . . . . . . . . . . . . . . . . . . . . . . . . . . . . . . . . . . . . . . . . . . . . . . . . . . . 16Field-Related Quality Assurance/Quality Control . . . . . . . . . . . . . . . . . . . . . . . . . . . . . . . . . . . 16
LABORATORY PROCEDURES . . . . . . . . . . . . . . . . . . . . . . . . . . . . . . . . . . . . . . . . . . . . . . . . . . . . . 16Chemical Laboratory Analyses . . . . . . . . . . . . . . . . . . . . . . . . . . . . . . . . . . . . . . . . . . . . . . . . . 16Biological Laboratory Analyses . . . . . . . . . . . . . . . . . . . . . . . . . . . . . . . . . . . . . . . . . . . . . . . . . 17
DATA VERIFICATION, REDUCTION, AND REPORTING . . . . . . . . . . . . . . . . . . . . . . . . . . . . . . . 17
REFERENCES . . . . . . . . . . . . . . . . . . . . . . . . . . . . . . . . . . . . . . . . . . . . . . . . . . . . . . . . . . . . . . . . . . . . 18

Cherry Creek Reservoir Sampling Plan Chadwick Ecological Consultants, Inc.Page 1 May 2003
INTRODUCTION
An inter-governmental agreement was executed in 1985 by several local governmental entities within
the Cherry Creek basin to form the Cherry Creek Basin Water Quality Authority (Authority). The Authority
initially created by an intergovernmental agreement, was specially authorized by legislation adopted in 1988.
The Authority develops and implements the means to protect the water quality of Cherry Creek Basin and
Reservoir. Following recent legislation, the Board was reconstituted in 2001 and now includes Arapahoe and
Douglas Counties, seven municipalities (Aurora, Castle Rock, Centennial, Foxfield, Greenwood Village,
Lone Tree, and Parker), one member representing the seven special districts (Arapahoe, Cottonwood,
Inverness, Meridian, Parker, Pinery, and Stonegate Village), and seven citizens appointed by the governor.
This Authority was created for the purpose of coordinating and implementing the investigations necessary
to protect and to preserve the quality of water resources of the Cherry Creek basin while allowing for further
economic development.
The Cherry Creek Basin Master Plan (DRCOG 1985), approved by the Colorado Water Quality
Control Commission (CWQCC) in 1985, was adopted in part as the "Regulations for Control of Water
Quality in Cherry Creek Reservoir" (Section 4.2.0, 5C.C.R.3.8.11). An annual monitoring program was
implemented at the end of April 1987 to assist in the assessment of several aspects of the Master Plan. These
monitoring studies have included long-term monitoring of 1) nutrient levels within the reservoir and from
tributary streams during base flows and stormwater, 2) nutrient levels in precipitation, and 3) chlorophyll a
levels within the reservoir. This monitoring program has been modified over the years in response to changes
in the Control Regulation, various research goals, and suggestions from outside reviewers, including input
from the Water Quality Control Division (WQCD).
PROJECT DESCRIPTION
The Authority has prepared this Sampling, Analysis, and Quality Assurance Work Plan (Sampling
and Analysis Plan) for aquatic biological nutrient analyses to be conducted on Cherry Creek Reservoir and
selected off-lake sampling sites in 2003. This Sampling and Analysis Plan sets out field and laboratory
protocols necessary to achieve quality data designed to help characterize the potential relationships between

Cherry Creek Reservoir Sampling Plan Chadwick Ecological Consultants, Inc.Page 2 May 2003
nutrient loading (both in-lake and external) and reservoir productivity. The specific objectives of the
Sampling and Analysis Plan study are:
1. Determine the concentrations of selected nutrients, primarily nitrogen and phosphorus species, in
Cherry Creek Reservoir as well as in various streams flowing into the reservoir and measure nutrients
in the reservoir outflow.
2. Determine the pounds of phosphorus entering Cherry Creek Reservoir from streams and precipitation
and leaving the reservoir through the outlet.
3. Determine biological productivity in Cherry Creek Reservoir, as measured by chlorophyll a
concentrations and algal densities.
4. Provide data on the effectiveness of pollutant removal from Pollutant Removal Facilities (PRF)
constructed by the Authority.
This Sampling and Analysis Plan presents the proposed 2003 sampling and analyses requirements
for Cherry Creek Reservoir and includes discussions of: 1) project organization and responsibilities; 2)
quality assurance objectives for the measurement of data in terms of accuracy, representativeness,
comparability, and completeness; 3) field sampling and sample preservation procedures; 4) laboratory
processing and analytical procedures; and 5) guidelines for data verification and reporting, quality control
checks, corrective actions, and quality assurance reporting.
PROJECT ORGANIZATION AND RESPONSIBILITIES
All personnel involved in the investigation and in the generation of data are implicitly a part of the
overall project and quality assurance program. Certain individuals have specifically delegated
responsibilities, as described below.

Cherry Creek Reservoir Sampling Plan Chadwick Ecological Consultants, Inc.Page 3 May 2003
Project Manager
The Project Manager for the aquatic biological and field sampling portions of the study is responsible
for fiscal oversight and technical management of the project and for ensuring that all work is conducted in
accordance with Scope of Service, Sampling and Analysis Plan, and approved procedures. Tasks include:
• Maintain routine contact with the project’s progress, regularly review the project schedule, and
review all work products.
• Evaluate impacts on project objectives and the need for corrective actions based on quality control
checks, and whenever the data quality objective of 100% completeness is not met.
• Maintain a central file, which contains or indicates the location of all documents relating to this
project.
• Review and update of this Sampling and Analysis Plan, as needed.
• Coordinate with the Authority, the WQCD, and the Authority’s other consultants to ensure
compliance with the Cherry Creek Reservoir Control Regulation No. 72.
Quality Assurance Manager
Quality Assurance oversight will be provided by a qualified individual with specific education and
experience in water quality sampling and analysis. The Quality Assurance Manager shall be responsible for
evaluation and review of all data reports relevant to the project and perform data verification. The Quality
Assurance Manager shall work with the Project Manager to determine the need for corrective actions and,
together, will make recommendations for any needed changes to either sampling methodologies or laboratory
analytical procedures.

Cherry Creek Reservoir Sampling Plan Chadwick Ecological Consultants, Inc.Page 4 May 2003
Analytical and Biological Laboratory Managers
The Analytical Laboratory Manager shall ensure that all water quality samples are analyzed in a
technically sound and timely manner. The Analytical Laboratory Manager shall be responsible for ensuring
all laboratory quality assurance procedures associated with the project are followed, including proper sample
entry, sample handling procedures, and quality control records for samples delivered to the laboratory. The
Analytical Laboratory Manager will be responsible for all data reduction and verification and ensure that the
data is provided in a format agreed upon between the Project Manager, the Analytical Laboratory Manager,
and the Authority.
The Biological Laboratory Manager shall ensure that all biological samples are analyzed in a
technically sound and timely manner. The Biological Laboratory Manager shall be responsible for ensuring
all laboratory quality assurance procedures associated with the project are followed, including proper sample
entry, sample handling procedures, and quality control records for samples delivered to the laboratory. The
Biological Laboratory Manager will be responsible for all data reduction and verification, and ensure that the
data is provided in a format agreed upon between the Project Manager, the Analytical Laboratory Manager,
and the Authority.
Sampling Crew
The field sampling efforts shall be conducted by individuals qualified in the collection of chemical,
physical, and biological surface water samples. Field tasks and sampling oversight will be provided by the
Project Manager. The Sampling Crew shall be responsible for following all procedures for sample collection,
including complete and accurate documentation.

Cherry Creek Reservoir Sampling Plan Chadwick Ecological Consultants, Inc.Page 5 May 2003
AQUATIC BIOLOGICAL AND NUTRIENT SAMPLING
Reservoir Monitoring Sites
Sampling would be conducted at sites established during past sampling efforts, as modified herein
(see Figure 1 for location of all sites).
Cherry Creek Reservoir
CCR-1 This site is also called the Dam site and corresponds to the northwest trident when partitioning the
lake by estimations of volume.
CCR-2 This site is also called the Swim Beach site and corresponds to the northeast trident when
partitioning the lake by estimations of volume.
CCR-3 This site is also called the Inlet site and corresponds to the south trident when partitioning the lake
by estimations of volume.

Cherry Creek Reservoir Sampling Plan Chadwick Ecological Consultants, Inc.Page 6 May 2003
Cherry
Shop Creek
Cottonwood
Cherry C
reekP
AR
KE
R R
OA
D
PERIMETER ROAD
PA
RK
ER
RO
AD
CC-O
CT-1
SC-3
RAINSAMPLER
Cherry
Creek
Reservoir
Cherry Creek D
am
CT-2
Bel
levi
ew
Dra
inag
e
Quincy Drainage
Swim Beach
CCR-2
CCR-3
Trident
Inflow TridentCCR-1
Dam Trident
CC-10
Sample SiteRoadStreamReservoir / Pond / PRF
Creek
CT-P2
BELLEVIEW ROAD
PE
OR
IA S
TR
EE
T
CALEY AVENUE
Cre
ek
CT-P1
N
Approximate Scale
0.25 0.50 1.0 km0.0
Lone
Tre
e C
ree
k
JOR
DAN
RO
AD
MW-9
Figure 1: Sampling sites on Cherry Creek Reservoir and selected streams.

Cherry Creek Reservoir Sampling Plan Chadwick Ecological Consultants, Inc.Page 7 May 2003
Stream Monitoring Sites
Cherry Creek
CC-10 This site is on Cherry Creek immediately downstream of the Shop Creek confluence,
approximately 0.5 km upstream of Cherry Creek Reservoir. This site measures loads from Cherry
Creek and Shop Creek that enter the reservoir.
CC-O This site is on Cherry Creek downstream of Cherry Creek Reservoir near the USGS gaging station
within the Kennedy Golf Course.
Cottonwood Creek
CT-2 This site is immediately downstream of the phosphorus control facility (PRF), upstream of Cherry
Creek Reservoir (i.e., Perimeter Road Pond). Although this site also measures the performance of
the Perimeter Road Pond PRF, it is included in the reservoir portion of the effort since it is needed
to measure loads to the reservoir from Cottonwood Creek.
PRF Monitoring Sites
Shop Creek
SC-3 This site is downstream of the Shop Creek detention pond and wetland complex above the
confluence with Cherry Creek mainstem, and downstream of the Perimeter Road.
Cottonwood Creek
CT-P1 This site is located on Cottonwood Creek upstream of the new detention pond PRF at Peoria Street.
CT-P2 This site is located on Cottonwood Creek just downstream of Peoria Street Pond PRF and in the
upper end of the streambank stabilization reach.

Cherry Creek Reservoir Sampling Plan Chadwick Ecological Consultants, Inc.Page 8 May 2003
CT-1 This site is on Cottonwood Creek just downstream of Belleview Avenue, upstream of the Cherry
Creek Park Perimeter Road. Note that Site CT-2 is included in the reservoir monitoring
requirements.
Precipitation Sampling Site
This site is located near the Quincy Drainage, upstream of the Perimeter Road. The sampler consists
of a clean, inverted plastic trash can lid used to funnel rain into a one-gallon container.

Cherry Creek Reservoir Sampling Plan Chadwick Ecological Consultants, Inc.Page 9 May 2003
Analyte List
The sampling and analyses shall be conducted in accordance with the methods and detection limits
provided in Table 1.
TABLE 1: Standard methods for analysis.
AnalyteStandardMethods*
Other MethodDesignations
RecommendedHold Times
DetectionLimit
Manual AnalysespH Denver Instrument pH/ATC
Ag/AgCl combination electrode
24 hrs.
Alkalinity 2320 B 24 hrs. 2 mg/CaCO3/LHardness 2340 C (modified) HACH Method 8266,
ManVer 2 Buret Titration24 hrs. 2 mg/CaCO3/L
Total Suspended Solids
2540 D 7 days 4 mg/L
Total Volatile Suspended Solids
2540 E 7 days 4 mg/L
Chlorophyll 10200 H (modified) Hot Ethanol Extraction -24 hrs. before filtration 0.1 mg/m3
Nutrient AnalysesOrthophosphate 4500-P G QuickChem 10-115-01-1-T 48 hrs. 3 µg/LTotal Phosphorus 4500-P G QuickChem 10-115-01-1-U,
with manual digestion-24 hrs. before digestion 2 µg/L
Nitrate + Nitrite 4500-NO3 I QuickChem 10-107-04-1-B 48 hrs. 5 µg/LTotal Nitrogen 4500-N B (modified) -24 hrs. before digestion;
-7 days after digestion4 µg/L
Ammonia none QuickChem 10-107-06-3-D 24 hrs. 3 µg/LBiological Analyses
Phytoplankton University of Colorado, Center for Limnology
* From Standard Methods for Examination of Water and Waste Water (20th Edition).

Cherry Creek Reservoir Sampling Plan Chadwick Ecological Consultants, Inc.Page 10 May 2003
Sampling Schedule
Reservoir Sampling
The general sampling schedule includes regular sampling trips to the reservoir at varying frequency
over the annual sampling period, as outlined below. Sampling in our winter months (November - February)
will depend on ice conditions and safety concerns.
TABLE 2: Reservoir Sampling Schedule
Sampling Period Frequency Trips/Period
January to April (not February) Monthly 3
May to September Every 2 Weeks 11
October to November (not December) Monthly 2
Total 16
Stream Sampling
Standard sampling is conducted monthly concurrent with the regular reservoir sampling trips when
possible to generally provide information during non-storm event periods, corresponding to the low-flow
ambient samples collected in earlier studies.
TABLE 3: Stream Sampling Schedule
Sampling Period Frequency Trips/Period
January to December Monthly 12
Total 12

Cherry Creek Reservoir Sampling Plan Chadwick Ecological Consultants, Inc.Page 11 May 2003
Representative Storm Event Sampling
There are six stream sites for storm event sampling(i.e., S-3, CC-10, CT-1, CT-2, CT-P1, and CT-P2).
Storm samples are not collected at Site CC-O downstream of the reservoir, unless the Army Corps of
Engineers (Corps) alerts the Consultant to an outflow event that could be tied to a storm-related inflow. Up
to five storm events shall be collected over the summer for Cherry Creek (Site CC-10) and on Shop Creek
(Site S-3). Up to seven storm events shall be collected at the four sites on Cottonwood Creek (CT-1, CT-2,
CT-P1, and CT-P2). The actual number of storm events for which samples are obtained will be subject to
weather patterns.
The recommended storm sampling period is April through September to attempt to capture some of
the late spring snowmelt events as well as the summer “monsoon” season..
Precipitation Sampling
Precipitation samples are to be collected after “significant” rainfall events, defined as 0.5 inches or
more. The sampler shall be inspected weekly and emptied of any accumulations of insignificant precipitation
and the collector (inverted trash can lid) cleaned. This procedure is required to minimize insignificant
amounts of precipitation contaminating the sample by allowing “dry-fall” to be washed into the sampler
between significant events.
Field Methodologies
Reservoir Sampling
Transparency
Transparency shall be determined using a Secchi disk and a combined-deck photometer. The Secchi
reading would be taken from the shady side of the boat. If this is not possible, sunglasses or other shading
will be used to reduce glare. The disk is lowered slowly until the white quadrants disappear, at which point
the depth is recorded to the nearest tenth of a meter. The disk is then lowered roughly 1 m further and slowly

Cherry Creek Reservoir Sampling Plan Chadwick Ecological Consultants, Inc.Page 12 May 2003
brought back up until the white quadrants reappear and again the depth is recorded. The Secchi disk depth
is recorded as the average of these two readings.
A second method to measure the depth of the euphotic zone is to determine the depth at which 1%
of the light penetrates the water column. This is considered the point at which, on average, light no longer
can sustain photosynthesis in excess of oxygen consumption from respiration (Goldman and Horne 1983).
This is accomplished by using a double-deck photometer. One photocell remains on the surface, and the other
is lowered into the water on the sunny side of the boat. Both photocells are attached to a data logger, which
records the amount of light in micromoles per second per square meter. The underwater photocell is lowered
until the value displayed on the data logger is 1% of the value of the surface photocell, and then the depth is
recorded.
Depth Profile Measurements
Measurements for dissolved oxygen, temperature, conductivity, and pH shall be taken at 1 m
intervals using a YSI meter, Model # 600XL multi-probe meter. This meter shall be calibrated at the C&A
Laboratory prior to each sampling episode to ensure accurate readings. To determine maximum depth, a
Secchi disk will be lowered until it reaches the bottom. This reading will be taken on the opposite side of the
boat from where water samples are being taken to minimize chances of sample contamination from the
sediment. Profile measurements are taken no deeper than 0.5 m off the bottom to minimize potential
contamination of the probes.
Water Samples
A primary task is sampling of water for nutrient and biology analyses. An upper-reservoir composite
sample shall be taken at each of the three reservoir sites, kept separate for each site, and analyzed individually
for nutrients and chlorophyll. A composite comprised of equal contributed aliquots collected with a vertical
Van Dorn water sampler (approximately 3 L) at 1 m increments beginning at the surface and continuing to
the 3 m depth (the upper 3 m of the reservoir represents 71% of the lake volume).

Cherry Creek Reservoir Sampling Plan Chadwick Ecological Consultants, Inc.Page 13 May 2003
Samples are collected using a vertical Van Dorn sampler (3 L volume) by lowering to the appropriate
depth (as outlined above). A “messenger” is sent to trip the sampler, and the water is brought to the boat and
transferred to a clean plastic bucket for splitting into aliquots, as described above. The sampler is rinsed
thoroughly with lake water between samples and between sites. Aliquots are taken from the photic composite
for chemical analyses consisting of three 4-L just (two for chlorophyll and one for nutrients).
Water sample depth profile sampling is also conducted at Site CCR-2 in the deepest area in the
reservoir. At this site, additional water samples shall be obtained at the 4, 5, 6, and 7 m depths. The last
sample (7 m) would be collected roughly 1 m off the bottom, to minimize disturbance of bottom sediments
during sampling. With variation in reservoir elevation throughout the year, it may not be possible to actually
collect a sample at the 7 m depth every sampling episode. Samples are collected using a vertical Van Dorn
sampler (3 L volume). The sampler is lowered to the appropriate depth (as outlined above). A “messenger”
is sent to trip the sampler, and the water is brought to the boat and transferred to a clean bucket for splitting
into aliquots, as described above. The sampler is rinsed thoroughly with lake water between samples and
between sites.
Based on this sampling scheme, the number of samples taken at each site is as below:
TABLE 4: Samples per Station/Sampling Episode
Photic 1-m IncrementLocation Composite Depth Samples
Dam (CCR-1) 1 0
Swim Beach (CCR-2) 1 4
Inflow (CCR-3) 1 0
Total Samples/Sample Episode 3 4
Grand Total 7
Water Quality Analyses
1. Nutrients, alkalinity, hardness, and pH analyses conducted in all reservoir water samples.

Cherry Creek Reservoir Sampling Plan Chadwick Ecological Consultants, Inc.Page 14 May 2003
2. Chlorophyll would be analyzed in the 3 m photic depth profile samples only from June -
September, one set per month.
3. Phytoplankton would be sampled twice monthly from April - October, and monthly from
November - March from the 0-3 m water composite samples.
See Table 1 for the list of analytes, laboratory methods, and detection limits.
Stream Sampling
One sample shall be collected from each of the stream sampling sites during the sampling period,
when there is sufficient flow. Samples shall be taken as mid-stream mid-depth grab samples with a
polyethylene scoop and composited in a 5-gallon plastic bucket. Aliquots shall be taken from the composite
for chemical analyses consisting of two 4-L jugs for analysis of parameters, as listed in Table 5.
During these sampling episodes, water was collected from each of the seven stream sampling sites
(sites on tributary streams and on Cherry Creek downstream of the reservoir) and analyzed for nutrients and
suspended solids. No samples were collected at Site CC-O during January, February, October, and December
due to lack of water. With the exception of Site SC-3 in July, flows were sufficient at each tributary site
through the year to obtain all scheduled samples. Two samples were collected for chemical and suspended
solids analysis from each of the stream sampling sites and consisted of a mid-stream, mid-column grab sample
using two 1 L bottles. After collecting water samples, dissolved oxygen, temperature, conductivity, pH, and
oxidation-reduction potential readings were taken at each stream site. Readings were taken with a YSI meter,
model #600 XL multi-probe meter.
Automatic Sampler
Each stream sampling station upstream of the reservoir also contains an Authority-owned ISCO flow
meter and sampling device, which is powered by a 12-volt battery. The flow meter is a pressure transducer
that measures stream water level. Rating curves were developed for each sampling site by measuring stream
discharge (ft3/sec) with a Marsh McBirney Model # 2000 flowmeter, and recording the water level at the staff

Cherry Creek Reservoir Sampling Plan Chadwick Ecological Consultants, Inc.Page 15 May 2003
gage (ft) and ISCO flowmeter (ft). Discharge is measured using methods outlined in Harrelson et al 1994.
To determine flow rate, the level must be translated into flow rate using a “stage-discharge” relationship. The
Authority has developed such a relationship for each site over the years. Since stage-discharge relationships
can change over the years, the relationship is calibrated annually using a flow meter to take stream flow
measurements three to four times per year at a range of flows. These data shall be combined with previous
data to validate and modify the stage-discharge relationship for that site.
Water level data are stored in the ISCO sampler and must be downloaded to calibrate the station.
Downloading of the data shall occur at least monthly to minimize the risk of a bad battery or other power
failure resulting in a loss of data. The flow data and stage-discharge rating curves shall be checked
throughout the year by comparing calculated flow estimates to actual flow measurements taken in the field
with a flowmeter. Flow at time of sampling shall be calculated using stage-discharge relationships and is used
to develop the flow-to-phosphorus relationship necessary to calculate daily loads (which are totaled for
monthly and annual loads). The Corps is also contacted and daily precipitation and inflows/outflows from
the reservoir obtained.
Storm Event Sampling
Samples from stormwater flow events are collected with ISCO automatic samplers, which collects
samples when the water reaches a pre-set level. The level is determined by analyzing annual hydrographs
from each stream and determining storm levels. When the pre-set level is reached, the ISCO collects a sample
every 15 minutes for approximately 2.5 hours (i.e., a timed composite) or until the water recedes below the
pre-set level. This sampling procedure occurs at Sites S-3, CC-10, CT-1, CT-2, CT-P1, and CT-P2.
Following the storm event, water collected by the automatic samplers shall be composited (timed composite)
and transferred to water jugs for analysis. Approximately 4 L would be collected from the 24 bottles, with
each bottle contributing a sample amount representative of the flow at which it was taken. During the seasons
in which no storm samples are taken, the storm samplers are disabled.

Cherry Creek Reservoir Sampling Plan Chadwick Ecological Consultants, Inc.Page 16 May 2003
Precipitation Sampling
After each significant storm, the sample bottle shall be removed and taken to a qualified laboratory
for analysis of total phosphorus, total nitrogen, and nitrite-nitrate. If sufficient volume remains, samples shall
be tested for alkalinity, water hardness, pH, and suspended solids. The sampler shall be inspected and cleaned
of any accumulations of insignificant precipitation on a weekly basis. This will prevent extraneous “dry fall”
from being washed into the sampler between significant storm events.
Field-Related Quality Assurance/Quality Control
To ensure data quality, a number of quality assurance checks will be used. During each standard
sampling episode, 1-split from the reservoir and 1-split from the stream (i.e., 28 total samples) shall be
shipped to CU laboratory for analysis.
Field sampling quality control will consist of the use of a field blank. This field blank shall contain
laboratory-grade deionized water that will be carried through the entire sampling episode. The cap of this
jug will be removed at a particular site and left open during the regular sampling effort, after which time the
cap will be replaced. One field blank will be used for every sampling trip. The field blanks and trip
duplicates will be analyzed for the same parameters as a routine sample and later compared to samples
analyzed by a qualified laboratory to provide QA/QC checks. Chain of custody procedures will be observed
during the field sampling and delivery of samples to a qualified laboratory and to the CU laboratory.
LABORATORY PROCEDURES
Chemical Laboratory Analysis
Chemical analyses for the water collected in the study (Table 1) will be conducted by a qualified
laboratory. Water samples will be analyzed for the parameters listed below.

Cherry Creek Reservoir Sampling Plan Chadwick Ecological Consultants, Inc.Page 17 May 2003
TABLE 5: List of Analytes by Sample Depth
3-m Photic Composite Samples1-m IncrementDepth Samples
Stream SamplesPrecipitation Samples
pH, Conductivity, and Temperature TP, TDP, SRP TD, TDP, SRP
Total Phosphorus (TP), Total Dissolved Phosphorus (TDP), and Soluble Reactive Phosphorus (SRP)
TN, TDN, NO3+NO2,Ammonia
TN, TDN, NO3+NO2,Ammonia
Total Nitrogen (TN, Total Dissolved Nitrogen (TDN), NO3+NO2, and Ammonia
Total Suspended Solids (TSS)/Total Volatile Suspended Solids(TVSS) (not on precipitation)
Chlorophyll
Phytoplankton (sampled on reservoir sampling dates: twice monthly from April - October, and monthly from November - March from the 0-3 m water composite samples)
Biological Laboratory Analysis
Biological analyses for the samples collected in the study, as described above, will be conducted at
a qualified laboratory and analyzed for chlorophyll a. The methods of these analyses, with appropriate
QA/QC procedures shall be in accordance with the methods provided in Table 1. Phytoplankton samples will
be sent to the Colorado University Center for Limnology to be analyzed by Dr. Jim Saunders.
DATA VERIFICATION, REDUCTION, AND REPORTING
Data verification shall be conducted to insure that raw data are not altered. All field data, such as
those generated during any field measurements and observations, will be entered directly into a bound Field
Book. Sampling Crew members will be responsible for proof reading all data transfers, if necessary. At least
ten percent of all data transfers will be checked for accuracy.

Cherry Creek Reservoir Sampling Plan Chadwick Ecological Consultants, Inc.Page 18 May 2003
The Quality Assurance Project Manager will conduct data verification activities to assess laboratory
performance in meeting quality assurance requirements. Such reviews include a verification that: 1) the
correct samples were analyzed and reported in the correct units; 2) the samples were properly preserved and
not held beyond applicable holding times; 3) instruments are regularly calibrated and meeting performance
criteria; and 4) laboratory QA objectives for precision and accuracy are being met.
Data reduction for laboratory analyses is conducted by Consultant’s personnel in accordance with
EPA procedures, as available, for each method. Analytical results and appropriate field measurements are
input into a computer spreadsheet. No results will be changed in the spreadsheet unless the cause of the error
is identified and documented.
A data control program will be followed to insure that all documents generated during the project are
accounted for upon their completion. Accountable documents include: Field Books, Sample Chain of
Custody, Sample Log, analytical reports, quality assurance reports, and interpretive reports.
Data shall be summarized and provided to the Authority’s Technical Advisory Committee on a
monthly basis and presented in an annual report.
REFERENCES
American Public Health Association. 1998. Standard Methods for Examination of Water and Wastewater,20th Edition. American Public Health Association, Washington, DC.
Denver Regional Council of Governments. 1985. Cherry Creek Basin Water Quality Management MasterPlan. Prepared in Cooperation with Counties, Municipalities, and Water and Sanitation Districts inthe Cherry Creek Basin and Colorado Department of Health.
Goldman, C.R., and A.J. Horne. 1983. Limnology. McGraw-Hill Company, NY.
Hach Company. 1997. Hach Water Analysis Handbook, 3rd Edition. Hach Company, Loveland, CO.
Harrelson, Cheryl C., Rawlins, C.L., Potyondy, John P. 1994. Stream channel reference sites : an illustratedguide to field technique. Gen. Tech. Rep. RM-245. Fort Collins, CO: U.S. Department ofAgriculture, Forest Service, Rocky Mountain Forest and Range Experiment Station. 61p.

Appendix B
2006 Reservoir Water Quality Data

2 2 2 2 2 2 3
AverageChlorophyll a
(mg/m3)
3/14/06 CCR-1 Photic 83 13 8 969 508 3 16 20.64/12/06 CCR-1 Photic 86 16 4 926 484 <2 10 18.15/8/06 CCR-1 Photic 72 30 19 582 368 8 82 7.2
5/24/06 CCR-1 Photic 58 26 14 720 544 <2 17 5.06/6/06 CCR-1 Photic 62 35 17 786 621 11 23 10.2
6/20/06 CCR-1 Photic 81 35 16 773 525 <2 25 8.77/5/06 CCR-1 Photic 118 51 34 866 594 <2 24 12.1
7/18/06 CCR-1 Photic 108 38 22 834 511 <2 10 11.58/1/06 CCR-1 Photic 72 20 12 1118 744 <2 32 19.8
8/15/06 CCR-1 Photic 96 21 9 853 463 <2 11 18.39/7/06 CCR-1 Photic 76 15 6 902 709 <2 14 12.4
9/19/06 CCR-1 Photic 40 21 10 859 717 <2 65 6.510/18/06 CCR-1 Photic 71 18 14 1031 680 5 53 40.511/8/06 CCR-1 Photic 72 25 8 1009 632 21 21 32.4
Total Nitrogen μg/L
CCR-1 C&A Water Chemisty Data
Nitrate + Nitrite μg/L
Ammonia μg/L
Analytical Detection Limits
Total Dissolved
Phosphorus μg/L
Total Dissolved Nitrogen μg/L
Sample DateSample Name/
LocationTotal
Phosphorus μg/L
Ortho- Phosphate
μg/L
B-1

2 2 3 4 4 5 3
AverageChlorophyll a
(mg/m3)3/14/06 CCR-2 photic 82 14 8 995 485 <2 7 17.23/14/06 CCR-2 4m 79 14 8 938 466 <2 7 ND3/14/06 CCR-2 5m 77 14 8 922 468 <2 6 ND3/14/06 CCR-2 6m 76 14 7 900 459 <2 7 ND3/14/06 CCR-2 7m 73 14 8 937 480 <2 7 ND4/12/06 CCR-2 photic 87 14 4 923 473 <2 9 16.24/12/06 CCR-2 4m 92 15 4 956 465 <2 10 ND4/12/06 CCR-2 5m 89 18 4 954 469 <2 11 ND4/12/06 CCR-2 6m 92 16 4 944 463 <2 7 ND4/12/06 CCR-2 7m 96 15 5 951 461 <2 7 ND5/8/06 CCR-2 photic 71 30 19 592 511 9 88 6.95/8/06 CCR-2 4m 78 31 19 540 399 8 76 ND5/8/06 CCR-2 5m 71 30 19 498 424 8 79 ND5/8/06 CCR-2 6m 67 30 19 423* 462* 8 80 ND5/8/06 CCR-2 7m 66 29 19 613 446 8 79 ND
5/24/06 CCR-2 photic 60 26 13 755 546 <2 15 5.25/24/06 CCR-2 4m 59 25 14 770 534 <2 28 ND5/24/06 CCR-2 5m 75 30 18 762 549 <2 35 ND5/24/06 CCR-2 6m 115 75 67 874 706 <2 146 ND5/24/06 CCR-2 7m 175 127 121 1040 801 <2 274 ND6/6/06 CCR-2 photic 79 31 16 840 661 4 26 3.26/6/06 CCR-2 4m 80 35 19 790 557 4 28 ND6/6/06 CCR-2 5m 80 46 30 852 553 5 44 ND6/6/06 CCR-2 6m 80 50 38 701 552 5 74 ND6/6/06 CCR-2 7m 178 121 112 976 691 6 242 ND
6/20/06 CCR-2 photic 78 62 14 770 522 <2 26 9.46/20/06 CCR-2 4m 101 45 28 776 512 <2 22 ND6/20/06 CCR-2 5m 152 89 75 838 575 <2 68 ND6/20/06 CCR-2 6m 163 111 96 851 632 <2 114 ND6/20/06 CCR-2 7m 267 161 149 1125 704 2 201 ND
Analytical Detection Limits
Ammonia μg/L
CCR-2 C&A Water Chemisty Data
Total Dissolved
Phosphorus μg/L
Total Dissolved Nitrogen μg/L
Sample DateSample Name/
LocationTotal
Phosphorus μg/L
Ortho- Phosphate
μg/L
Total Nitrogen μg/L
Nitrate + Nitrite μg/L
* "ND" denotes "No Data"B-2

2 2 3 4 4 5 3
AverageChlorophyll a
(mg/m3)7/5/06 CCR-2 Photic 125 52 36 848 532 <2 13 15.37/5/06 CCR-2 4m 125 54 37 750 459 <2 9 ND7/5/06 CCR-2 5m 127 52 37 782 474 <2 10 ND7/5/06 CCR-2 6m 144 55 40 818 471 <2 19 ND7/5/06 CCR-2 7m 268 93 71 1089 604 3 166 ND
7/18/06 CCR-2 Photic 106 34 14 1147 690 <2 20 11.27/18/06 CCR-2 4m 100 31 14 850 517 <2 15 ND7/18/06 CCR-2 5m 114 29 13 904 491 <2 12 ND7/18/06 CCR-2 6m 163 34 22 987 460 <2 8 ND7/18/06 CCR-2 7m 296 59 44 1300 463 <2 10 ND8/1/06 CCR-2 Photic 67 18 11 921 548 <2 16 18.48/1/06 CCR-2 4m 63 17 11 811 467 <2 12 ND8/1/06 CCR-2 5m 70 19 13 797 479 <2 23 ND8/1/06 CCR-2 6m 79 26 20 760 469 <2 16 ND8/1/06 CCR-2 7m 92 28 23 768 454 <2 12 ND
8/15/06 CCR-2 Photic 112 29 10 1007 490 <2 13 29.58/15/06 CCR-2 4m 97 20 12 826 451 <2 10 ND8/15/06 CCR-2 5m 106 19 11 828 433 <2 9 ND8/15/06 CCR-2 6m 117 21 12 788 419 <2 9 ND8/15/06 CCR-2 7m 122 24 14 852 432 <2 8 ND9/7/06 CCR-2 Photic 70 13 6 933 577 <2 14 12.89/7/06 CCR-2 4m 62 16 6 855 506 <2 9 ND9/7/06 CCR-2 5m 79 20 13 801 506 <2 36 ND9/7/06 CCR-2 6m 101 23 16 822 497 <2 41 ND9/7/06 CCR-2 7m 93 32 17 942 526 <2 44 ND
9/19/06 CCR-2 Photic 41 19 8 767 588 <2 24 4.99/19/06 CCR-2 4m 37 16 7 669 506 <2 17 ND9/19/06 CCR-2 5m 36 15 6 679 515 <2 15 ND9/19/06 CCR-2 6m 44 15 9 721 528 <2 29 ND9/19/06 CCR-2 7m 62 18 11 739 524 <2 35 ND
Total Dissolved
Phosphorus μg/L
Total Dissolved Nitrogen μg/L
Sample DateSample Name/
LocationTotal
Phosphorus μg/L
Ortho- Phosphate
μg/L
Total Nitrogen μg/L
Nitrate + Nitrite μg/L
CCR-2 C&A Water Chemisty Data
Analytical Detection Limits
Ammonia μg/L
* "ND" denotes "No Data"B-3

2 2 3 4 4 5 3
AverageChlorophyll a
(mg/m3)10/18/06 CCR-2 photic 92 15 13 1198 683 7 101 33.010/18/06 CCR-2 4m 87 13 12 1098 648 490 98 ND10/18/06 CCR-2 5m 63 13 11 962 639 505 95 ND10/18/06 CCR-2 6m 71 9 9 971 639** 933** 101 ND10/18/06 CCR-2 7m 55 8 8 851 622** 860** 99 ND11/8/06 CCR-2 photic 76 25 7 1090 610 <2 16 31.111/8/06 CCR-2 4m 65 23 8 877 548 <2 11 ND11/8/06 CCR-2 5m 56 23 7 896 537 <2 15 ND11/8/06 CCR-2 6m 45 16 6 727 525 <2 15 ND11/8/06 CCR-2 7m 46 18 6 719 533 2 23 ND
Nitrate + Nitrite μg/L
Ammonia μg/L
Total Dissolved
Phosphorus μg/L
Total Dissolved Nitrogen μg/L
Total Nitrogen μg/L
Sample DateSample Name/
LocationTotal
Phosphorus μg/L
Ortho- Phosphate
μg/L
CCR-2 C&A Water Chemisty Data
Analytical Detection Limits
* "ND" denotes "No Data"B-4

2 2 3 4 4 5 3
AverageChlorophyll a
(mg/m3)
3/14/06 CCR-3 Photic 77 14 8 959 483 <2 7 17.24/12/06 CCR-3 Photic 102 18 4 972 482 <2 9 17.05/8/06 CCR-3 Photic 83 31 19 546 497 11 84 6.5
5/24/06 CCR-3 Photic 62 28 16 860 649 <2 35 6.26/6/06 CCR-3 Photic 49 23 11 720 525 3 9 6.0
6/20/06 CCR-3 Photic 94 36 18 772 491 <2 16 10.87/5/06 CCR-3 Photic 144 51 32 907 496 <2 11 15.5
7/18/06 CCR-3 Photic 112 33 16 1066 645 <2 13 15.18/1/06 CCR-3 Photic 71 17 11 907 514 <2 13 19.8
8/15/06 CCR-3 Photic 84 24 9 862 490 <2 9 24.69/7/06 CCR-3 Photic 67 15 6 915 563 <2 13 9.4
9/19/06 CCR-3 Photic 51 15 7 742 534 <2 17 6.610/18/06 CCR-3 Photic 62 12 9 891 669 578 103 12.711/8/06 CCR-3 Photic 87 35 13 1529 611 2 10 61.3
CCR-3 C&A Water Chemisty Data
Analytical Detection Limits
Total Dissolved
Phosphorus μg/L
Total Dissolved Nitrogen μg/L
Sample DateSample Name/
LocationTotal
Phosphorus μg/L
Ortho- Phosphate
μg/L
Total Nitrogen μg/L
Nitrate + Nitrite μg/L
Ammonia μg/L
B-5

2 2 3 5 3
Sample DateSample Name/
Location
Total Phosphorus
μg/LTotal Dissolved
Phosphorus μg/LOrtho-
Phosphate μg/LNO3+NO2-N
μg/L NH4-N μg/L
3/14/06 CCR-2 4m 61.5 21.4 3.4 0 40.44/12/06 CCR-3 photic 63.2 20.7 3.1 0 8.25/8/06 CCR-2 7m 58.5 35.2 19.5 6.5 90.2
5/24/06 CCR-1 photic 41.6 16.6 11.2 0 32.96/6/06 CCR-3 photic 55.9 37.8 17.4 0 14.7
6/20/06 CCR-3 photic 76.3 36.6 14.5 0 15.97/5/06 CCR-3 photic 94.7 48.1 29.7 0 14.0
7/18/06 CCR-2 photic 75.9 34.3 11.1 0 11.38/1/06 CCR-1 photic 67.7 21.4 5.0 0 38.79/7/06 CCR-2 photic 58.7 20.8 2.7 * 17.5
9/19/06 CCR-1 photic 37.8 21.8 8.3 0 69.410/18/06 CCR-1 photic 50.7 28.3 4.4 0 59.311/8/06 CCR-1 photic 59.3 27.4 1.9 11.8 61.8
2 2 3 5 3
Sample DateSample Name/
Location
Total Phosphorus
μg/LTotal Dissolved
Phosphorus μg/LOrtho-
Phosphate μg/LNO3+NO2-N
μg/L NH4-N μg/L
3/14/06 CCR-2 4m 79 14 8 <2 74/12/06 CCR-3 photic 102 18 4 <2 95/8/06 CCR-2 7m 66 29 19 8 79
5/24/06 CCR-1 photic 58 26 14 <2 176/6/06 CCR-3 photic 49 23 11 3 9
6/20/06 CCR-3 photic 94 36 18 <2 167/5/06 CCR-3 photic 144 51 32 <2 11
7/18/06 CCR-2 photic 106 34 14 <2 208/1/06 CCR-1 photic 72 20 12 <2 329/7/06 CCR-2 photic 70 13 6 <2 14
9/19/06 CCR-1 photic 40 21 10 <2 6510/18/06 CCR-1 photic 71 18 14 5 5311/8/06 CCR-1 photic 72 25 8 21 21
CCR University of Colorado Water Chemisty Data
Analytical Detection Limits
CCR C&A Water Chemisty Data
Analytical Detection Limits
B-6

CHERRY CREEKD.O. DATA, 2006Site CCR-1
Date 03/14/06 Date 04/12/06Secchi 1.25 m Secchi 0.74 m
1% 2.90 m 1% 2.60 mDepth (m) Temp oC Cond. DO pH Depth (m) Temp oC Cond. DO pH
0 4.59 596 5.38 6.00 0 11.01 719 11.95 7.141 4.55 596 5.97 6.01 1 10.44 701 11.96 6.482 4.54 596 5.69 6.01 2 10.36 698 11.66 6.443 4.49 596 5.27 6.01 3 10.33 698 11.31 6.354 4.38 594 5.80 6.02 4 10.34 698 11.16 6.325 4.27 592 5.75 6.04 5 10.33 698 11.98 6.286 4.29 594 4.81 6.04 6 10.24 696 10.81 6.19
Date 05/08/06 Date 05/24/06Secchi 1.25 m Secchi 1.77 m
1% 3.44 m 1% 4.60 mDepth (m) Temp oC Cond. DO pH Depth (m) Temp oC Cond. DO pH
0 13.45 838 9.03 8.14 0 19.13 845 10.53 8.321 13.34 836 9.18 8.13 1 18.08 823 10.38 8.322 13.34 836 9.23 8.13 2 17.90 819 10.22 8.333 13.26 833 9.25 8.13 3 17.85 817 10.22 8.354 13.24 833 9.28 8.13 4 17.81 817 10.22 8.345 13.25 834 9.31 8.13 5 17.77 815 10.15 8.346 13.22 833 9.33 8.13 6 15.58 782 5.05 8.20
Date 06/06/06 Date 06/20/06Secchi 2.00 m Secchi 1.45 m
1% 4.85 m 1% 3.80 mDepth (m) Temp oC Cond. DO pH Depth (m) Temp oC Cond. DO pH
0 21.18 893 10.25 8.30 0 23.05 969 12.11 8.511 20.92 882 10.53 8.29 1 22.10 947 12.53 8.482 20.42 872 10.37 8.26 2 21.50 935 11.64 8.443 19.94 863 9.01 8.20 3 20.96 929 8.82 8.274 19.53 855 7.63 8.07 4 20.43 921 5.37 8.115 19.09 847 5.70 8.02 5 20.18 917 3.84 8.076 18.13 831 3.83 8.07 6 20.09 915 3.47 8.10
Date 07/05/06 Date 07/18/06Secchi 1.17 m Secchi 1.00 m
1% 3.00 m 1% 3.00 mDepth (m) Temp oC Cond. DO pH Depth (m) Temp oC Cond. DO pH
0 23.10 968 7.85 8.43 0 23.14 923 7.71 8.001 22.00 950 6.44 8.31 1 22.90 918 7.59 8.052 21.91 949 6.42 8.28 2 22.78 916 6.94 8.043 21.86 948 6.26 8.26 3 22.74 915 6.70 8.044 21.83 948 6.22 8.23 4 22.72 914 6.58 8.045 21.76 946 5.40 8.10 5 22.66 914 6.27 8.036 21.50 947 5.14 8.07 6 22.55 912 6.11 8.02
B-7

CCR-1 DO Data Continued
Date 08/01/06 Date 08/15/06Secchi 0.90 m Secchi 0.80 m
1% 2.62 m 1% 2.60 mDepth (m) Temp oC Cond. DO pH Depth (m) Temp oC Cond. DO pH
0 24.28 984 8.28 8.16 0 23.27 944 9.03 8.551 24.10 979 7.68 8.10 1 23.08 938 9.52 8.612 23.93 977 6.89 8.06 2 22.84 931 7.46 8.433 23.84 978 6.58 8.01 3 22.54 931 7.17 8.364 23.65 975 6.03 7.90 4 22.51 930 6.82 8.335 23.42 971 1.99 7.79 5 22.48 930 6.74 8.336 22.96 966 0.50 7.80 6 22.41 929 6.40 8.32
Date 09/07/06 Date 09/19/06Secchi 0.97 m Secchi 1.80 m
1% 3.00 m 1% 4.46 mDepth (m) Temp oC Cond. DO pH Depth (m) Temp oC Cond. DO pH
0 19.84 988 8.60 8.34 0 17.24 852 8.16 8.261 19.74 987 8.43 8.37 1 16.59 838 7.91 8.312 19.46 989 7.81 8.32 2 16.46 836 7.83 8.273 19.38 991 7.41 8.26 3 16.41 835 7.77 8.264 19.30 992 7.23 8.24 4 16.34 834 7.70 8.245 19.21 993 6.52 8.18 5 16.31 834 7.70 8.236 19.13 994 5.21 8.06 6 16.29 834 7.76 8.23
Date 10/18/06 Date 11/08/06Secchi 0.90 m Secchi 1.35 m
1% 2.75 m 1% 3.60 mDepth (m) Temp oC Cond. DO pH Depth (m) Temp oC Cond. DO pH
0 11.73 762 14.75 8.24 0 8.40 654 10.49 8.521 11.71 761 12.10 8.30 1 7.82 642 9.72 8.532 11.67 761 11.04 8.31 2 7.65 640 9.46 8.493 11.65 761 10.51 8.31 3 7.62 639 8.80 8.474 11.32 755 9.80 8.26 4 7.56 637 8.70 8.455 11.21 753 9.57 8.25 5 7.44 635 8.43 8.456 11.19 753 9.42 8.25 6 7.40 634 8.34 8.45
B-8

0
1
2
3
4
5
6
2 4 6 8 10 12 14
Temp (Celsius)DO (mg/L)
March 14, 2006
De
pth
(m)
0
1
2
3
4
5
6
2 4 6 8 10 12 14
Temp (Celsius)DO (mg/L)
April 12, 2006
Dep
th (
m)
0
1
2
3
4
5
6
2 4 6 8 10 12 14 16
Temp. (Celsius)DO (mg/L)
May 8, 2006
Dep
th (
m)
0
1
2
3
4
5
6
5 10 15 20 25
Temp. (Celsius)DO (mg/L)
May 24, 2006
Dep
th (
m)
0
1
2
3
4
5
6
5 10 15 20 25
Temp. (Celsius)DO (mg/L)
June 6, 2006
De
pth
(m)
0
1
2
3
4
5
6
5 10 15 20 25
Temp. (Celsius)DO (mg/L)
June 20, 2006
De
pth
(m)
CCR-1
B-9

0
1
2
3
4
5
6
5 10 15 20 25
Temp (Celsius)DO (mg/L)
July 5, 2006
De
pth
(m)
0
1
2
3
4
5
6
5 10 15 20 25
Temp (Celsius)DO (mg/L)
July 18, 2006
Dep
th (
m)
0
1
2
3
4
5
6
0 5 10 15 20 25
Temp. (Celsius)DO (mg/L)
August 1, 2006
Dep
th (
m)
0
1
2
3
4
5
6
5 10 15 20 25
Temp. (Celsius)DO (mg/L)
August 15, 2006
Dep
th (
m)
0
1
2
3
4
5
6
5 10 15 20 25
Temp. (Celsius)DO (mg/L)
September 7, 2006
De
pth
(m)
0
1
2
3
4
5
6
5 10 15 20 25
Temp. (Celsius)DO (mg/L)
September 19, 2006
De
pth
(m)
CCR-1
B-10

0
1
2
3
4
5
6
2 4 6 8 10 12 14 16 18 20
Temp (Celsius)DO (mg/L)
October 18, 2006
De
pth
(m)
0
1
2
3
4
5
6
2 4 6 8 10 12 14
Temp (Celsius)DO (mg/L)
November 8, 2006
Dep
th (
m)
CCR-1
B-11

CHERRY CREEKD.O. DATA, 2006Site CCR-2
Date 03/14/06 Date 04/12/06Secchi 1.30 m Secchi 0.69 m
1% 3.00 m 1% 2.40 mDepth (m) Temp oC Cond. DO pH Depth (m) Temp oC Cond. DO pH
0 4.94 593 7.10 5.99 0 11.61 727 11.95 6.561 4.91 592 6.83 5.98 1 10.44 700 11.87 6.562 4.87 591 6.78 5.95 2 10.29 698 11.96 6.493 4.84 592 6.94 5.96 3 10.13 695 11.56 6.194 4.84 592 6.74 5.97 4 10.11 695 11.37 6.125 4.84 592 6.88 5.97 5 10.10 694 11.29 6.126 4.82 592 6.00 5.96 6 10.08 692 11.20 6.107 4.82 592 5.88 5.97 7 10.04 693 11.14 6.09
Date 05/08/06 Date 05/24/06Secchi 1.28 m Secchi 1.74 m
1% 3.53 m 1% 4.72 mDepth (m) Temp oC Cond. DO pH Depth (m) Temp oC Cond. DO pH
0 13.67 842 9.54 8.16 0 18.77 835 10.68 8.351 13.64 842 9.57 8.17 1 18.28 824 10.72 8.342 13.61 841 9.65 8.17 2 18.16 822 10.71 8.343 13.51 839 9.65 8.17 3 18.11 820 10.70 8.374 13.27 834 9.47 8.17 4 18.03 819 10.63 8.375 13.22 832 9.40 8.16 5 17.84 816 10.25 8.366 13.15 831 9.30 8.15 6 15.74 781 5.11 8.147 13.11 831 9.23 8.15 7 15.34 776 2.02 8.05
Date 06/06/06 Date 06/20/06Secchi 1.95 m Secchi 1.53 m
1% 4.95 m 1% 3.74 mDepth (m) Temp oC Cond. DO pH Depth (m) Temp oC Cond. DO pH
0 21.04 883 11.03 8.36 0 22.79 962 12.41 8.621 20.62 874 11.24 8.35 1 22.65 959 12.35 8.602 20.48 872 10.85 8.32 2 21.49 936 12.02 8.523 20.39 870 10.37 8.27 3 21.17 930 10.33 8.424 20.07 864 9.19 8.19 4 20.90 927 8.29 8.325 19.68 857 7.69 8.11 5 20.38 920 5.31 8.186 18.92 842 5.89 8.02 6 20.26 917 4.30 8.137 17.63 817 1.65 7.93 7 19.88 901 0.62 8.08
Date 07/05/06 Date 07/18/06Secchi 0.98 m Secchi 1.00 m
1% 2.82 m 1% 2.70 mDepth (m) Temp oC Cond. DO pH Depth (m) Temp oC Cond. DO pH
0 22.72 951 7.99 8.40 0 23.96 942 7.18 8.111 22.04 950 7.29 8.38 1 23.25 925 7.21 8.092 21.86 946 6.99 8.37 2 22.96 919 6.56 8.083 21.80 944 6.87 8.35 3 22.91 918 6.36 8.094 21.78 942 6.68 8.34 4 22.86 917 6.44 8.105 21.70 940 6.39 8.33 5 22.83 917 6.66 8.116 21.65 941 5.58 8.30 6 22.17 901 3.24 7.977 21.36 940 4.40 8.28 7 21.97 898 1.33 7.87
B-12

CCR-2 DO Data Continued
Date 08/01/06 Date 08/15/06Secchi 0.90 m Secchi 0.75 m
1% 2.75 m 1% 2.50 mDepth (m) Temp oC Cond. DO pH Depth (m) Temp oC Cond. DO pH
0 24.23 980 8.92 8.22 0 23.97 952 10.95 9.051 23.94 977 8.38 8.20 1 22.71 930 9.56 8.832 23.84 976 7.79 8.18 2 22.47 927 7.5 8.663 23.81 975 7.46 8.14 3 22.32 924 6.66 8.594 23.68 974 6.51 8.04 4 22.17 922 6.16 8.565 23.53 972 5.12 7.94 5 22.07 920 6.81 8.636 23.34 969 2.98 7.90 6 21.98 918 5.93 8.537 22.77 969 0.51 7.94 7 21.91 918 5.79 8.49
Date 09/07/06 Date 09/19/06Secchi 1.10 m Secchi 1.78 m
1% 4.10 m 1% 4.30 mDepth (m) Temp oC Cond. DO pH Depth (m) Temp oC Cond. DO pH
0 19.50 988 8.98 8.52 0 17.05 850 8.21 8.341 19.81 988 8.76 8.52 1 16.51 838 8.37 8.372 19.77 989 8.66 8.51 2 16.46 835 8.21 8.363 19.59 991 7.86 8.44 3 16.38 835 8.12 8.334 19.43 993 6.30 8.31 4 16.34 834 8.09 8.325 19.16 996 4.36 8.13 5 16.29 833 8.07 8.316 19.01 998 3.58 7.95 6 16.09 830 7.51 8.277 19.01 997 2.70 7.71 7 16.02 826 7.27 8.21
Date 10/18/06 Date 11/08/06Secchi 0.80 m Secchi 1.30 m
1% 2.50 m 1% 3.30 mDepth (m) Temp oC Cond. DO pH Depth (m) Temp oC Cond. DO pH
0 12.15 766 12.07 8.43 0 9.38 672 10.16 8.601 12.14 772 9.47 8.41 1 8.52 655 10.22 8.642 12.08 772 9.15 8.39 2 8.26 651 10.01 8.593 12.03 770 8.82 8.38 3 8.16 649 9.58 8.554 12.00 770 8.69 8.38 4 8.14 649 9.32 8.555 11.96 769 8.60 8.36 5 8.12 648 9.22 8.556 11.93 768 8.41 8.35 6 8.08 647 9.07 8.547 11.76 765 8.26 8.34 7 8.05 648 8.81 8.52
B-13

0
1
2
3
4
5
6
7
2 4 6 8 10 12 14 16
Temp (Celsius)DO (mg/L)
March 14, 2006
De
pth
(m)
0
1
2
3
4
5
6
7
2 4 6 8 10 12 14
Temp (Celsius)DO (mg/L)
April 12, 2006
Dep
th (
m)
0
1
2
3
4
5
6
7
4 8 12 16 20
Temp. (Celsius)DO (mg/L)
May 8, 2006
Dep
th (
m)
0
1
2
3
4
5
6
7
4 8 12 16 20
Temp. (Celsius)DO (mg/L)
May 24, 2006
Dep
th (
m)
0
1
2
3
4
5
6
7
5 10 15 20 25
Temp. (Celsius)DO (mg/L)
June 6, 2006
De
pth
(m)
0
1
2
3
4
5
6
7
5 10 15 20 25
Temp. (Celsius)DO (mg/L)
June 20, 2006
De
pth
(m)
CCR-2
B-14

0
1
2
3
4
5
6
7
5 10 15 20 25
Temp (Celsius)DO (mg/L)
July 5, 2006
De
pth
(m)
0
1
2
3
4
5
6
7
5 10 15 20 25
Temp (Celsius)DO (mg/L)
July 18, 2006
Dep
th (
m)
0
1
2
3
4
5
6
7
5 10 15 20 25
Temp. (Celsius)DO (mg/L)
August 1, 2006
Dep
th (
m)
0
1
2
3
4
5
6
7
5 10 15 20 25
Temp. (Celsius)DO (mg/L)
August 15, 2006
Dep
th (
m)
0
1
2
3
4
5
6
7
5 10 15 20 25
Temp. (Celsius)DO (mg/L)
September 7, 2006
De
pth
(m)
0
1
2
3
4
5
6
7
5 10 15 20 25
Temp. (Celsius)DO (mg/L)
September 19, 2006
De
pth
(m)
CCR-2
B-15

0
1
2
3
4
5
6
7
4 8 12 16 20
Temp (Celsius)DO (mg/L)
October 18, 2006
De
pth
(m)
0
1
2
3
4
5
6
7
2 4 6 8 10 12 14
Temp (Celsius)DO (mg/L)
November 8, 2006
Dep
th (
m)
CCR-2
B-16

CHERRY CREEKD.O. DATA, 2006Site CCR-3
Date 03/14/06 Date 04/12/06
Secchi 1.12 m Secchi 0.69 m
1% 2.98 m 1% 2.20 m
Depth (m) Temp oC Cond. DO pH Depth (m) Temp oC Cond. DO pH
0 4.58 582 11.45 6.00 0 11.01 713 12.28 6.59
1 4.55 582 11.30 5.98 1 10.85 710 12.55 6.65
2 4.53 582 11.20 5.91 2 10.24 698 12.09 6.32
3 4.51 582 10.87 5.92 3 10.16 697 11.65 6.13
4 4.48 582 10.80 5.91 4 9.96 695 10.61 6.04
5 4.48 582 10.02 5.88 5 9.78 690 9.37 6.01
Date 05/08/06 Date 05/24/06
Secchi 1.18 m Secchi 1.95 m
1% 3.25 m 1% 4.80 m
Depth (m) Temp oC Cond. DO pH Depth (m) Temp oC Cond. DO pH
0 13.60 842 9.49 8.19 0 19.15 839 10.68 8.37
1 13.59 842 9.49 8.19 1 18.15 823 10.65 8.34
2 13.57 842 9.50 8.19 2 17.80 815 10.64 8.36
3 13.39 837 9.42 8.19 3 17.60 813 10.58 8.36
4 12.88 829 9.16 8.18 4 17.37 808 10.21 8.35
5 12.84 828 8.99 8.17 5 17.05 803 9.03 8.31
Date 06/06/06 Date 06/20/06
Secchi 1.98 m Secchi 1.35 m
1% 4.25 m 1% 3.40 m
Depth (m) Temp oC Cond. DO pH Depth (m) Temp oC Cond. DO pH
0 21.79 892 10.99 8.38 0 22.53 959 11.63 8.60
1 21.29 889 11.01 8.37 1 21.97 947 12.01 8.61
2 20.83 879 10.96 8.35 2 21.22 932 10.81 8.55
3 20.74 878 10.46 8.31 3 20.92 928 9.54 8.51
4 20.48 874 8.60 8.19 4 20.80 926 8.71 8.49
5 19.44 855 4.22 8.12 5 20.35 920 7.12 8.46
Date 07/05/06 Date 07/18/06
Secchi 0.82 m Secchi 1.00 m
1% 2.00 m 1% 2.75 m
Depth (m) Temp oC Cond. DO pH Depth (m) Temp oC Cond. DO pH
0 23.13 967 8.56 8.46 0 24.40 948 9.10 8.23
1 22.17 941 8.13 8.42 1 23.21 926 8.72 8.26
2 21.80 925 7.62 8.38 2 22.88 916 7.29 8.20
3 21.64 923 7.19 8.34 3 22.62 912 6.50 8.17
4 21.56 915 6.10 8.31 4 22.35 909 6.74 8.17
5 21.39 905 5.11 8.26 5 22.01 903 0.64 8.03
B-17

CCR-3 DO Data Continued
Date 08/01/06 Date 08/15/06
Secchi 1.00 m Secchi 0.76 m
1% 2.80 m 1% 3.00 m
Depth (m) Temp oC Cond. DO pH Depth (m) Temp oC Cond. DO pH
0 24.41 985 9.20 8.32 0 24.03 952 10.03 8.80
1 24.10 979 8.90 8.27 1 22.52 926 8.53 8.69
2 23.80 974 7.65 8.21 2 22.33 923 7.13 8.60
3 23.67 975 6.70 8.18 3 22.23 924 5.28 8.46
4 23.43 969 6.74 8.16 4 21.78 916 5.94 8.49
5 22.47 957 0.77 8.12 5 21.54 906 4.26 8.30
Date 09/07/06 Date 09/19/06
Secchi 0.85 m Secchi 1.30 m
1% 2.75 m 1% 3.85 m
Depth (m) Temp oC Cond. DO pH Depth (m) Temp oC Cond. DO pH
0 20.50 992 8.94 8.59 0 17.35 854 8.49 8.34
1 19.81 990 8.87 8.57 1 16.41 834 8.73 8.41
2 19.13 995 4.92 8.21 2 16.16 830 8.19 8.35
3 19.01 997 3.99 8.03 3 16.02 826 7.97 8.30
4 19.00 997 3.43 7.93 4 15.96 825 7.71 8.28
5 18.99 980 0.50 7.52 5 15.92 825 7.43 8.27
Date 10/18/06 Date 11/08/06
Secchi 0.90 m Secchi 1.10 m
1% 2.80 m 1% 2.10 m
Depth (m) Temp oC Cond. DO pH Depth (m) Temp oC Cond. DO pH
0 11.93 768 11.01 8.41 0 9.98 684 10.29 8.61
1 11.94 768 9.07 8.41 1 8.49 650 10.90 8.75
2 11.77 764 8.65 8.39 2 7.83 643 9.89 8.55
3 11.18 753 8.32 8.37 3 7.81 642 9.14 8.53
4 11.08 751 8.14 8.35 4 7.76 642 8.76 8.51
5 10.87 749 8.01 8.32 5 7.70 641 7.82 8.44
B-18

0
1
2
3
4
5
2 4 6 8 10 12 14 16 18
Temp (Celsius)DO (mg/L)
March 14, 2006
De
pth
(m)
0
1
2
3
4
5
2 4 6 8 10 12 14
Temp (Celsius)DO (mg/L)
April 12, 2006
Dep
th (
m)
0
1
2
3
4
5
4 8 12 16 20
Temp. (Celsius)DO (mg/L)
May 8, 2006
Dep
th (
m)
0
1
2
3
4
5
5 10 15 20
Temp. (Celsius)DO (mg/L)
May 24, 2006
De
pth
(m)
0
1
2
3
4
5
0 5 10 15 20 25
Temp. (Celsius)DO (mg/L)
June 6, 2006
De
pth
(m)
0
1
2
3
4
5
5 10 15 20 25
Temp. (Celsius)DO (mg/L)
June 20, 2006
De
pth
(m)
CCR-3
B-19

0
1
2
3
4
5
5 10 15 20 25
Temp (Celsius)DO (mg/L)
July 5, 2006
De
pth
(m)
0
1
2
3
4
5
5 10 15 20 25
Temp (Celsius)DO (mg/L)
July 18, 2006
Dep
th (
m)
0
1
2
3
4
5
0 5 10 15 20 25
Temp. (Celsius)DO (mg/L)
August 1, 2006
Dep
th (
m)
0
1
2
3
4
5
5 10 15 20 25
Temp. (Celsius)DO (mg/L)
August 15, 2006
Dep
th (
m)
0
1
2
3
4
5
5 10 15 20 25
Temp. (Celsius)DO (mg/L)
September 7, 2006
De
pth
(m)
0
1
2
3
4
5
5 10 15 20 25
Temp. (Celsius)DO (mg/L)
September 19, 2006
De
pth
(m)
CCR-3
B-20

0
1
2
3
4
5
4 8 12 16 20
Temp (Celsius)DO (mg/L)
October 18, 2006
Dep
th (
m)
0
1
2
3
4
5
2 4 6 8 10 12 14
Temp (Celsius)DO (mg/L)
November 8, 2006
Dep
th (
m)
CCR-3
B-21

Date Secchi (m) 1% Trans (m) Ratio Date Secchi (m) 1% Trans (m) Ratio Date Secchi (m) 1% Trans (m) Ratio
3/14/06 1.25 2.90 2.32 3/14/06 1.30 3.00 2.31 3/14/06 1.12 2.98 2.66
4/12/06 0.74 2.60 3.51 4/12/06 0.69 2.40 3.48 4/12/06 0.69 2.20 3.19
5/8/06 1.25 3.44 2.75 5/8/06 1.28 3.53 2.76 5/8/06 1.18 3.25 2.75
5/24/06 1.77 4.60 2.60 5/24/06 1.74 4.72 2.71 5/24/06 1.95 4.80 2.46
6/6/06 2.00 4.85 2.43 6/6/06 1.95 4.95 2.54 6/6/06 1.98 4.25 2.15
6/20/06 1.45 3.80 2.62 6/20/06 1.53 3.74 2.44 6/20/06 1.35 3.40 2.52
7/5/06 1.17 3.00 2.56 7/5/06 0.98 2.82 2.88 7/5/06 0.82 2.00 2.44
7/18/06 1.00 3.00 3.00 7/18/06 1.00 2.70 2.70 7/18/06 1.00 2.75 2.75
8/1/06 0.90 2.62 2.91 8/1/06 0.90 2.75 3.06 8/1/06 1.00 2.80 2.80
8/15/06 0.80 2.60 3.25 8/15/06 0.75 2.50 3.33 8/15/06 0.76 3.00 3.95
9/7/06 0.97 3.00 3.09 9/7/06 1.10 4.10 3.73 9/7/06 0.85 2.75 3.24
9/19/06 1.80 4.46 2.48 9/19/06 1.78 4.30 2.42 9/19/06 1.30 3.85 2.96
10/18/06 0.90 2.75 3.06 10/18/06 0.80 2.50 3.13 10/18/06 0.90 2.80 3.11
11/8/06 1.35 3.60 2.67 11/8/06 1.30 3.30 2.54 11/8/06 1.10 2.10 1.91
Average 1.24 3.37 2.80 Average 1.22 3.38 2.86 Average 1.14 3.07 2.78
Median 1.21 3.00 2.71 Median 1.19 3.15 2.74 Median 1.05 2.89 2.75
CCR-1 CCR-2 CCR-3
Cherry Creek Reservoir Secchi and 1% Transmissivity Depths for 2006
B-22

Appendix C
2006 Stream Water Quality and Precipitation Data

2 2 3 4 4 5 3 4 4
TSS TVSSmg/L mg/L
1/24/06 CC-10 155 112* 114* 1654 1505 1151 39 20.0 5.42/21/06 CC-10 156 113 116 1626 1487 1175 43 18.3 <4.03/14/06 CC-10 143 113* 116* 1003 944 669 22 20.4 5.84/12/06 CC-10 163 135 113 956 855 321 44 21.6 4.65/8/06 CC-10 217 164 151 666 577 365 65 21.6 5.26/6/06 CC-10 225 184 179 862 711 382 29 19.0 6.48/1/06 CC-10 155 150* 151* 769 618 292 29 13.7 8.09/7/06 CC-10 176 143* 151* 616 541 300 12 7.0 4.0
10/18/06 CC-10 192 148 147 839 777 547 29 17.2 4.011/8/06 CC-10 157 131* 134* 857 794 423 24 8.8 <4.012/12/06 CC-10 151 120* 127* 1266 1187 923 48 17.6 <4.0
4/28/06 CC-10 storm 274 175 161 1080 844 473 93 41.6 5.67/5/06 CC-10 storm 709 399 380 1539 993 322 29 201.0 38.0
7/10/06 CC-10 storm 398 270 256 1271 941 312 11 63.0 11.78/2/06 CC-10 storm 944 270* 291* 2734 1280 698 34 645.0 69.08/7/06 CC-10 storm 242 160* 177* 842 645 268 24 49.0 11.0
9/21/06 CC-10 storm 555 188 186 1990 1398 787 23 181.2 16.6
CC-10 C&A Water Chemisty Data
Ortho- Phosphate
μg/L
Total Nitrogen μg/L
Total Dissolved Nitrogen μg/L
Nitrate + Nitrite μg/L
Sample Date
Sample Name/ Location
Total Phosphorus
μg/L
Total Dissolved
Phosphorus μg/L
Ammonia μg/L
Analytical Detection Limits
* Data within acceptable (10%) difference between parameters."ND" denotes "No Data"C-1

2 2 3 4 4 5 3 4 4
TSS TVSSmg/L mg/L
1/24/06 CC-O 68 11 7 928 491 27 24 10.2 6.42/21/06 CC-O 60 8 3 903 522 62 26 6.2 4.53/14/06 CC-O 68 13 8 901 480 11 8 12.2 6.84/12/06 CC-O 96 23 4 935 523 <2 8 24.6 7.65/8/06 CC-O 93 25 9 655 403 5 14 34.6 6.46/6/06 CC-O 197 150 136 962 715 25 201 15.6 5.27/5/06 CC-O 190 102 83 1159 830 86 123 30.0 12.08/1/06 CC-O 200 57 37 910 747 6 12 19.3 8.79/7/06 CC-O 80 18 8 809 511 5 9 18.4 6.0
10/18/06 CC-O 92 34 25 1567 1350 508 234 23.4 7.210/19/06 CC-O 101 29 25 1679 1377 376 344 20.4 6.411/2/06 CC-O 83 31 7 998 670 44 80 ND ND11/8/06 CC-O 62 25 7 1281 825 3 35 10.2 4.812/12/06 CC-O 53 15 5 971 554 4 28 16.2 7.8
Ortho- Phosphate
μg/L
Total Nitrogen μg/L
Nitrate + Nitrite μg/L
Ammonia μg/L
CC-O C&A Water Chemisty Data
Analytical Detection Limits
Total Dissolved
Phosphorus μg/L
Total Dissolved Nitrogen μg/L
Sample Date
Sample Name/ Location
Total Phosphorus
μg/L
* Data within acceptable (10%) difference between parameters."ND" denotes "No Data"C-2

2 2 3 4 4 5 3 4 4
TSS TVSSmg/L mg/L
1/24/06 CT-1 101 8 7 4221 3720 3050 99 38.2 6.42/21/06 CT-1 83 24 20 4014 3721 2901 197 35.0 4.23/14/06 CT-1 77 23 19 2789 2600 1894 159 32.8 7.64/12/06 CT-1 72 17 3 5058 4713 2059 1999 29.2 <4.05/8/06 CT-1 60 19 10 2397 2190 1402 301 22.8 4.46/6/06 CT-1 28 13 5 1523 1407 846 25 13.2 5.48/1/06 CT-1 37 16 13 3074 2888 2315 124 8.0 4.09/7/06 CT-1 73 14 8 3026 2671 2136 8 29.4 5.6
10/18/06 CT-1 111 28 28 1663 1511 935 142 55.8 8.411/8/06 CT-1 61 19 13 2522 2395 1706 59 18.0 <4.012/12/06 CT-1 76 35 17 4572 4252 2246 1571 40.4 4.8
4/28/06 CT-1 storm 225 17 7 2833 2274 938 1660 171.3 16.37/5/06 CT-1 storm 417 123 102 1738 966 458 9 198.5 46.5
7/10/06 CT-1 storm 242 109 94 1227 904 383 35 72.7 12.38/2/06 CT-1 storm 571 164 148 2042 1148 1408 89 384.0 64.08/7/06 CT-1 storm 248 62 56 1248 751 395 5 152.5 25.5
9/21/06 CT-1 storm 403 127 120 3053 2645 1835 37 161.7 16.7
Ortho- Phosphate
μg/L
Total Nitrogen μg/L
Nitrate + Nitrite μg/L
Ammonia μg/L
CT-1 C&A Water Chemisty Data
Analytical Detection Limits
Total Dissolved
Phosphorus μg/L
Total Dissolved Nitrogen μg/L
Sample Date
Sample Name/ Location
Total Phosphorus
μg/L
* Data within acceptable (10%) difference between parameters."ND" denotes "No Data"C-3

2 2 3 4 4 5 3 4 4
TSS TVSSmg/L mg/L
1/24/06 CT-2 67 9 8 4134 3807 3097 85 22.0 6.82/21/06 CT-2 61 18 15 4114 3730 3076 188 20.8 <4.03/14/06 CT-2 71 8 7 2634 2368 1756 140 40.0 8.04/12/06 CT-2 74 14 3 4384 4083 1803 1526 30.6 5.25/8/06 CT-2 63 12 3 1765* 1878* 1354 298 30.6 6.66/6/06 CT-2 51 8 2 1597 1296 527 148 27.4 5.48/1/06 CT-2 60 14 12 2700 2418 1571 380 39.3 12.09/7/06 CT-2 82 10 7 2373 2061 1459 76 37.8 7.0
10/18/06 CT-2 87 24* 26* 1618 1452 862 139 38.8 8.011/8/06 CT-2 45 11 6 1991 1753 1327 68 41.0 7.412/12/06 CT-2 64 15 11 3810 3557 1940 1104 58.4 7.2
4/28/06 CT-2 storm 64 8 4 4295 3914 1744 3090 34.7 8.77/5/06 CT-2 storm 320 114 96 1770 1072 480 70 92.0 25.5
7/10/06 CT-2 storm 197 109 93 1225 918 364 61 41.3 12.38/2/06 CT-2 storm 913 86* 93* 2866 1365 697 113 782.0 90.08/7/06 CT-2 storm 347 55 54 1669 893 430 6 201.5 31.5
9/21/06 CT-2 storm 179 30 11 2186 1693 942 62 74.3 13.3
Ortho- Phosphate
μg/L
Total Nitrogen μg/L
Nitrate + Nitrite μg/L
Ammonia μg/L
CT-2 C&A Water Chemisty Data
Analytical Detection Limits
Total Dissolved
Phosphorus μg/L
Total Dissolved Nitrogen μg/L
Sample Date
Sample Name/ Location
Total Phosphorus
μg/L
* Data within acceptable (10%) difference between parameters."ND" denotes "No Data"C-4
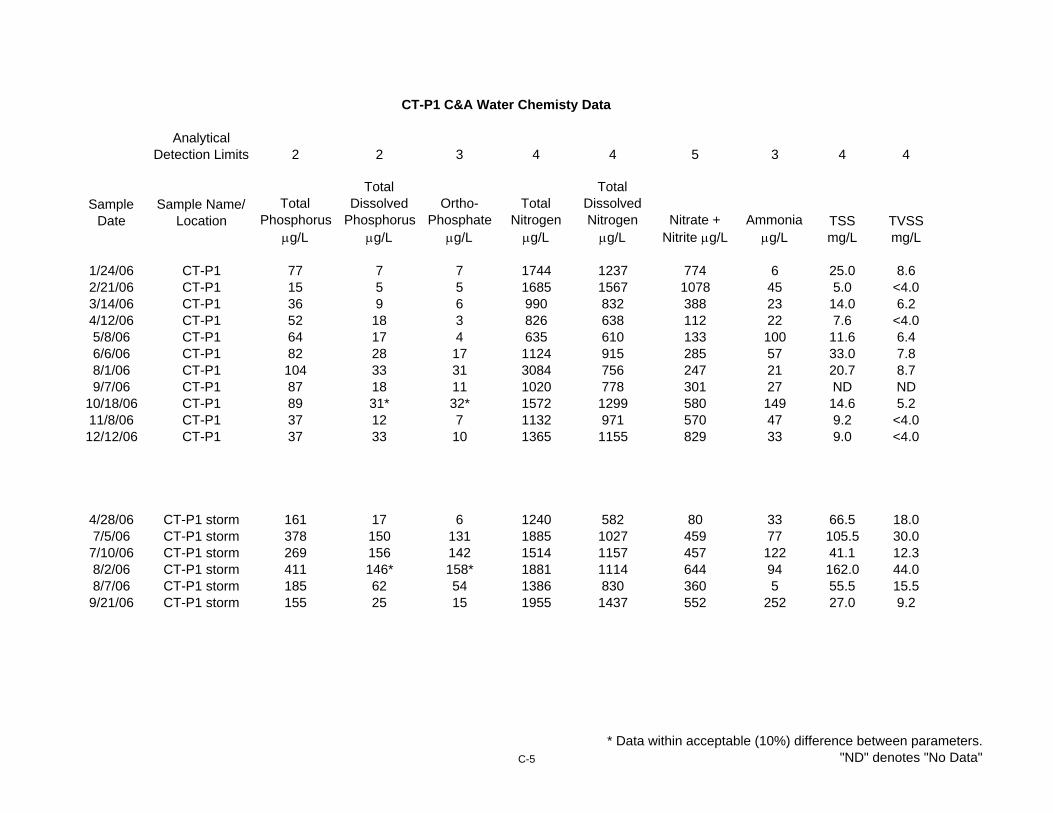
2 2 3 4 4 5 3 4 4
TSS TVSSmg/L mg/L
1/24/06 CT-P1 77 7 7 1744 1237 774 6 25.0 8.62/21/06 CT-P1 15 5 5 1685 1567 1078 45 5.0 <4.03/14/06 CT-P1 36 9 6 990 832 388 23 14.0 6.24/12/06 CT-P1 52 18 3 826 638 112 22 7.6 <4.05/8/06 CT-P1 64 17 4 635 610 133 100 11.6 6.46/6/06 CT-P1 82 28 17 1124 915 285 57 33.0 7.88/1/06 CT-P1 104 33 31 3084 756 247 21 20.7 8.79/7/06 CT-P1 87 18 11 1020 778 301 27 ND ND
10/18/06 CT-P1 89 31* 32* 1572 1299 580 149 14.6 5.211/8/06 CT-P1 37 12 7 1132 971 570 47 9.2 <4.012/12/06 CT-P1 37 33 10 1365 1155 829 33 9.0 <4.0
4/28/06 CT-P1 storm 161 17 6 1240 582 80 33 66.5 18.07/5/06 CT-P1 storm 378 150 131 1885 1027 459 77 105.5 30.0
7/10/06 CT-P1 storm 269 156 142 1514 1157 457 122 41.1 12.38/2/06 CT-P1 storm 411 146* 158* 1881 1114 644 94 162.0 44.08/7/06 CT-P1 storm 185 62 54 1386 830 360 5 55.5 15.5
9/21/06 CT-P1 storm 155 25 15 1955 1437 552 252 27.0 9.2
Ortho- Phosphate
μg/L
Total Nitrogen μg/L
Nitrate + Nitrite μg/L
Ammonia μg/L
CT-P1 C&A Water Chemisty Data
Analytical Detection Limits
Total Dissolved
Phosphorus μg/L
Total Dissolved Nitrogen μg/L
Sample Date
Sample Name/ Location
Total Phosphorus
μg/L
* Data within acceptable (10%) difference between parameters."ND" denotes "No Data"C-5

2 2 3 4 4 5 3 4 4
TSS TVSSmg/L mg/L
1/24/06 CT-P2 42 6* 7* 1826 1547 1085 7 17.0 4.62/21/06 CT-P2 20 4* 5* 1938 1805 1355 35 8.3 <4.03/14/06 CT-P2 53 8 6 1233 1055 640 13 18.2 4.24/12/06 CT-P2 61 14 3 974 776 357 13 29.0 6.25/8/06 CT-P2 64 17 7 852 820 527 72 28.2 6.66/6/06 CT-P2 34 12 2 969 809 235 26 13.4 4.08/1/06 CT-P2 80 26 25 1343 757 531 25 37.7 12.39/7/06 CT-P2 ND ND ND ND ND ND ND 24.2 5.6
10/18/06 CT-P2 84 32* 35* 1233 1074 548 154 19.2 6.211/8/06 CT-P2 51 13 9 1378 1200 839 25 19.0 4.612/12/06 CT-P2 22 7 5 1604 1418 1167 21 20.2 4.8
4/28/06 CT-P2 storm 227 51 38 1529 1046 343 268 75.5 14.57/5/06 CT-P2 storm 300 131 107 1618 986 429 63 82.5 25.5
7/10/06 CT-P2 storm 209 136 121 1323 1048 442 74 21.1 7.78/2/06 CT-P2 storm 535 119* 128* 2194 1244 794 69 332.0 60.08/7/06 CT-P2 storm 179 64* 68* 1215 776 371 6 39.0 8.5
9/21/06 CT-P2 storm 162 51 42 2026 1608 652 288 22.0 7.0
Ortho- Phosphate
μg/L
Total Nitrogen μg/L
Nitrate + Nitrite μg/L
Ammonia μg/L
CT-P2 C&A Water Chemisty Data
Analytical Detection Limits
Total Dissolved
Phosphorus μg/L
Total Dissolved Nitrogen μg/L
Sample Date
Sample Name/ Location
Total Phosphorus
μg/L
* Data within acceptable (10%) difference between parameters."ND" denotes "No Data"C-6

2 2 3 4 4 5 3 4 4
TSS TVSSmg/L mg/L
1/24/06 SC-3 40 33 30 2752 2591 2295 14 <4.0 <4.03/14/06 SC-3 30 20 17 1711 1645 1368 13 7.2 <4.04/12/06 SC-3 101 73 61 551 497 183 23 8.0 <4.05/8/06 SC-3 146 75 59 360 344 41 22 98.4 7.69/7/06 SC-3 113 92 87 391 334 <2 6 5.4 <4.0
10/18/06 SC-3 93 54 30 1698 1484 1185 22 7.0 4.011/8/06 SC-3 34 28 26 594 559 324 12 12.6 <4.0
4/28/06 SC-3 storm 295 72 63 1016 579 176 59 344.5 21.07/5/06 SC-3 storm 192 180 156 980 907 568 55 10.8 <4.0
7/10/06 SC-3 storm 174 171 154 805 765 397 11 8.0 <4.08/2/06 SC-3 storm 144 102 99 1269 1075 606 29 104.0 26.08/7/06 SC-3 storm 147 137* 144* 552 529 68 14 4.0 <4.0
9/21/06 SC-3 storm 128 83 77 2309 2079 1473 13 9.8 <4.0
Ortho- Phosphate
μg/L
Total Nitrogen μg/L
Nitrate + Nitrite μg/L
Ammonia μg/L
SC-3 C&A Water Chemisty Data
Analytical Detection Limits
Total Dissolved
Phosphorus μg/L
Total Dissolved Nitrogen μg/L
Sample Date
Sample Name/ Location
Total Phosphorus
μg/L
* Data within acceptable (10%) difference between parameters."ND" denotes "No Data"C-7

2 2 3 4 4 5 3
4/28/06 Rain Gauge 62 47 38 1781 1708 475 17638/2/06 Rain Gauge 42 32 28 1313 1142 356 10668/7/06 Rain Gauge 22 8 8 876 796 411 272
9/12/06 Rain Gauge 42 9 <2 2597 2104 1085 8079/21/06 Rain Gauge 105 71 58 3860 3265 1248 1686
Total Phosphorus
μg/L
Ortho- Phosphate
μg/LAmmonia
μg/L
Rain Gauge C&A Water Chemisty Data
Analytical Detection Limits
Sample Name/ Location
Total Nitrogen μg/L
Nitrate + Nitrite μg/L
Total Dissolved
Phosphorus μg/L
Total Dissolved Nitrogen μg/L
Sample Date
* Data within acceptable (10%) difference between parameters."ND" denotes "No Data"C-8

Appendix D
2006 Streamflow, Rainfall, Phosphorus Loading Calculations and Final Inflow and Load Data Normalized to the U.S. Army Corps of Engineers Inflow Data.

D- 1
Streamflow Determination Water levels (stage) were monitored on 15-minute intervals using ISCO Model 4220 and 6700 flowmeters, with each unit being calibrated on a monthly basis using in-situ staff gage measurements. Stage-discharge data were collected for Sites CC-10, SC-3, CT-P1, CT-P2, and CT-1 by measuring stream discharge (ft3/sec) with a Marsh McBirney Model 2000 flowmeter, and recording the water level at the staff gage and ISCO flowmeter (Table D-1). Stage-discharge data collected in 2006 were combined with data collected during previous years to adjust rating curves previously developed for each site, as long as historical data reflected no major changes to the streambed morphology, transducer, or staff gage. For example, if the transducer or staff gage was relocated or reset, then only the data collected post-change would be combined with the 2006 data. Rating curves were developed for CC-10, SC-3, CT-P1, and CT-1 by fitting a nonlinear regression model to the data (Table D-2). For sites CC-10 and SC-3 a two-stage rating curve was developed to more accurately estimate low flows at these sites. A rating curve was also developed for Site CT-P2, but was only used for quality control purposes to evaluate the multi-level weir equation for the Peoria Pond outlet structure. A multi-level weir equation was also used to estimate flows through the Perimeter Pond outlet structure. The weir equations for sites CT-P2 and Site CT-2 (Table D-2) were provided by Muller Engineering (unpublished data, 2004), designers of the outlet structures. While water levels for Cherry Creek, Shop Creek, and Cottonwood Creek are monitored on a fairly continuous basis, there were periods of time when daily mean flows were estimated due to a flow meter malfunction, dead battery, icing, or flooding. To estimate mean daily water levels for periods of missing data, stage relationships were evaluated among nearby sites, with the best-fit linear regression model being used to estimate the missing level data (Table D-3). At Site CT-2, transducer and module problems resulted in a long period of poor quality data (1 January to 11 April). During this time, the transducer probe was replaced twice before ISCO representatives could determine the exact problem with the flow meter module. In April, Teledyne Systems replaced the flow meter and transducer probe and the system worked well, except for an extreme ice buildup period in December 2006. In 2006, Site CC-10 revealed no strong relations with any of the GEI monitored stream sites. Therefore, a model was developed with the USGS Cherry Creek Gage near Parker (#393109104464500), using only data from January 2006 to March 2006, to estimate levels for CC-10 in February 2006. Site SC-3 also showed no strong relationships with any stream site; therefore, the best-fit model was used to estimate periods of missing data. Additionally, precipitation events and average flow of recorded data were considered when estimating the missing data.

D- 2
Table D-1: Stage-discharge data used to develop rating curves for sites CC-10, SC-3, CT-P1, CT-P2, and CT-1 in 2006.
Site Year Date Staff Gage Level
(ft) Transducer
Level (ft) Discharge
(cfs)
CC-10 2004 27-May-04 1.09 1.463 3.10 CC-10 2004 22-Jun-04 2.50 2.493 24.45 CC-10 2004 23-Jun-04 1.54 1.530 8.65 CC-10 2004 24-Aug-04 2.47 2.472 23.93 CC-10 2005 01-Apr-05 2.39 2.531 20.11 CC-10 2005 14-Apr-05 4.84 4.890 142.89 CC-10 2005 25-Apr-05 4.05 4.093 91.76 CC-10 2005 02-May-05 2.63 2.630 40.14 CC-10 2005 19-May-05 1.68 1.612 14.27 CC-10 2005 26-May-05 1.40 1.422 8.79 CC-10 2005 01-Jun-05 1.47 1.469 17.86 CC-10 2005 16-Aug-05 0.81 0.808 3.60 CC-10 2005 13-Oct-05 2.41 2.418 29.81 CC-10 2006 20-Apr-06 1.40 1.391 10.92 CC-10 2006 13-Jun-06 0.56 0.567 2.05 CC-10 2006 12-Jul-06 1.56 1.482 23.62 CC-10 2006 08-Aug-06 0.55 0.550 5.18 CC-10 2006 27-Dec-06 1.27 1.230 20.51 SC-3 2005 25-Apr-05 0.79 0.836 2.64 SC-3 2005 19-May-05 0.22 0.165 0.08 SC-3 2005 26-May-05 0.20 0.231 0.06 SC-3 2005 01-Jun-05 0.28 0.280 0.27 SC-3 2005 16-Aug-05 0.25 0.413 0.54 SC-3 2005 13-Oct-05 0.29 0.361 0.51 SC-3 2006 20-Apr-06 0.02 0.150 0.03 SC-3 2006 13-Jun-06 0.06 -- 0.13 CT-P1 2002 27-Jun-02 0.45 0.430 0.80 CT-P1 2002 11-Jul-02 0.60 0.580 2.43 CT-P1 2002 04-Sep-02 0.36 0.359 0.43 CT-P1 2003 04-Feb-03 0.50 0.502 1.35 CT-P1 2003 18-Jun-03 1.10 1.072 12.04 CT-P1 2003 30-Jul-03 0.72 0.726 3.18 CT-P1 2003 20-Nov-03 0.53 0.530 0.70 CT-P1 2004 09-Jan-04 0.49 0.483 0.42 CT-P1 2004 24-Feb-04 0.54 0.552 0.87 CT-P1 2004 27-May-04 0.51 0.508 0.71 CT-P1 2004 22-Jun-04 0.89 0.890 5.08 CT-P1 2004 23-Jun-04 0.69 0.677 1.99 CT-P1 2004 24-Aug-04 0.59 0.595 1.44 CT-P1 2005 01-Apr-05 0.66 0.655 1.88 CT-P1 2005 14-Apr-05 1.16 1.188 13.36 CT-P1 2005 25-Apr-05 1.39 1.369 15.62 CT-P1 2005 19-May-05 0.56 0.549 1.06 CT-P1 2005 26-May-05 0.55 0.575 0.77 CT-P1 2005 01-Jun-05 0.73 0.739 2.74 CT-P1 2005 16-Aug-05 0.96 1.120 7.40 CT-P1 2005 13-Oct-05 0.94 0.934 7.73 CT-P1 2006 20-Apr-06 0.55 0.540 0.64 CT-P1 2006 13-Jun-06 0.51 0.515 0.47 CT-P1 2006 12-Jul-06 0.66 0.631 1.57

D- 3
Site Year Date Staff Gage Level
(ft) Transducer
Level (ft) Discharge
(cfs)
CT-P1 2006 08-Aug-06 0.83 0.844 4.97 CT-P1 2006 27-Dec-06 0.76 -- 2.16 CT-P2 2004 09-Jan-04 0.32 0.327 0.79 CT-P2 2004 27-May-04 0.33 0.332 0.67 CT-P2 2004 22-Jun-04 3.25 3.257 12.00 CT-P2 2004 23-Jun-04 1.07 1.051 2.75 CT-P2 2005 01-Apr-05 1.04 1.038 2.81 CT-P2 2005 14-Apr-05 3.84 3.858 11.86 CT-P2 2005 25-Apr-05 4.13 4.153 19.02 CT-P2 2005 19-May-05 0.43 0.428 1.44 CT-P2 2005 26-May-05 0.42 0.438 1.12 CT-P2 2005 01-Jun-05 1.44 1.377 4.56 CT-P2 2005 16-Aug-05 3.40 3.417 13.90 CT-P2 2005 13-Oct-05 3.10 3.172 11.56 CT-P2 2006 20-Apr-06 0.38 0.380 1.45 CT-P2 2006 13-Jun-06 0.29 0.293 0.85 CT-P2 2006 12-Jul-06 1.22 1.260 2.79 CT-P2 2006 08-Aug-06 2.24 2.204 8.18 CT-1 2005 01-Apr-05 1.86 1.947 5.51 CT-1 2005 14-Apr-05 2.80 2.780 17.92 CT-1 2005 25-Apr-05 3.08 3.046 20.94 CT-1 2005 19-May-05 1.81 1.757 2.50 CT-1 2005 26-May-05 1.70 1.750 2.08 CT-1 2005 01-Jun-05 2.07 1.960 5.81 CT-1 2005 16-Aug-05 2.52 2.530 19.45 CT-1 2005 13-Oct-05 2.51 2.467 13.00 CT-1 2006 20-Apr-06 1.79 1.777 2.06 CT-1 2006 13-Jun-06 1.80 1.823 2.07 CT-1 2006 12-Jul-06 2.06 1.900 6.53 CT-1 2006 08-Aug-06 2.40 2.435 8.65 CT-1 2006 27-Dec-06 2.50 2.522 6.37

D- 4
Table D-2: Discharge (Q, cfs) and stage height (H, ft) relationships for all sites. Rating curves are developed for Sites CC-10, SC-3, CT-P1, and CT-1, while multi-level orifice and weir equations are used for Sites CT-P2, and CT-2.
Site Stage
Interval Discharge Equations R2
CC-10 < 2.60 Q = EXP((H+0.5613)/0.9233) 0.80
> 2.60 Q = EXP((H+6.2908)/2.1862)-23.0292 0.90
SC-3 < 0.15 Q = EXP((H-0.4814)/0.1372) 0.73
> 0.15 Q = EXP((H+0.7553)/0.9430)-2.4998 0.90 CT-P1 Q = EXP((H+0.3633)/0.5472)-4.2520 0.95
CT-P2 < 0.60 Q = (3.3)*(1)*(H)^(1.5)
0.61 - 1.09 Q = (0.60)*(0.50)*((2*32.2*(Hadj))^(0.5)
1.10 - 1.99 Q = (0.60)*(0.50)*((2*32.2*(Hadj))^(0.5))+((3.33)*(1)*(H-1.0)^(1.5)
2.00 - 2.59
Q = (0.60)*(0.50)(2*32.2*(Hadj))^(0.5)+((0.60)*(0.50)*((2*32.2*(Hadj-1.0))^(0.5))+((3.33) *(1)*(H-2.0)^(1.5)
2.60 - 2.99
Q = (0.60)*(0.50)(2*32.2*(Hadj))^(0.5)+((0.60)*(0.50)*((2*32.2*(Hadj-1.0))^(0.5))+((0.60) *(0.50)*(Hadj-2.0)^(0.5)
3.00 - 3.59
Q = (0.60)*(0.50)(2*32.2*(Hadj))^(0.5)+((0.60)*(0.50)*((2*32.2*(Hadj-1.0))^(0.5))+((0.60) *(0.50)*(Hadj-2.0)^(0.5))+((3.3)*(1)*(H-3.0)^(1.5)
3.60 - 3.99
Q = (0.60)*(0.50)(2*32.2*(Hadj))^(0.5)+((0.60)*(0.50)*((2*32.2*(Hadj-1.0))^(0.5))+((0.60) *(0.50)*(Hadj-2.0)^(0.5))+((0.60)*(0.50)*(2*32.2*(Hadj-3.0)^(0.5)
4.00 - 4.49
Q = (0.60)*(0.50)(2*32.2*(Hadj))^(0.5)+((0.60)*(0.50)*((2*32.2*(Hadj-1.0))^(0.5))+((0.60) *(0.50)*(Hadj-2.0)^(0.5))+((0.60)*(0.50)*(2*32.2*(Hadj-3.0)^(0.5))+((3.3)(1)(H-4.0))^ (1.5)
4.50 - 5.19
Q = (0.60)*(0.50)(2*32.2*(Hadj))^(0.5)+((0.60)*(0.50)*((2*32.2*(Hadj-1.0))^(0.5))+((0.60) *(0.50)*(Hadj-2.0)^(0.5))+((0.60)*(0.50)*(2*32.2*(Hadj-3.0)^(0.5))+((0.60)(0.50)(2* 32.2*Hadj-4.0))^(0.5)
5.20 - 6.80
Q = (0.60)*(0.50)(2*32.2*(Hadj))^(0.5)+((0.60)*(0.50)*((2*32.2*(Hadj-1.0))^(0.5))+((0.60) *(0.50)*(Hadj-2.0)^(0.5))+((0.60)*(0.50)*(2*32.2*(Hadj-3.0)^(0.5))+((0.60)(0.50)(2* 32.2*Hadj-4.0))^(0.5))+((3.3)(1)(H-5.2)^(1.5)
CT-1 Q = EXP((H-0.560)/0.8593)-5.1769 0.86
CT-2 < 0.95 Q = ((3.3)*(2)*(H)^(1.5))
0.95 - 1.35 Q = ((7.2)+(3.3)*(2)*(H)^(1.5))
> 1.35
Q = ((7.2)+(3.3)*(2)*(H)^(1.5))+((3.3)*(2)*(H-1.0)^(1.5))+((3.3)*(2)*(H-0.50)^(1.5))
Hadj = Mean daily level - 0.25 ft
Table D-3: Equations used to estimate missing daily mean data and percent of annual data
estimated.
Site Equations R2 Percent of Annual Data
Estimated CC-10 CC-10 Level = 0.8167(Parker Level)-0.9578 0.60 8% SC-3 SC-3 Level = (0.2583*CT-P2 Level) + 0.0096 0.13 10% CT-P1 CT-P1 Level = (CT-P2 Level + 1.4438)/3.3981 0.83 4% CT-P2 CT-P2 level = 3.3981(CT-P1 Level) - 1.4438 0.83 3% CT-1 CT-1 Level = 1.5469*(CT-P1 Level)+1.0287 0.86 12% CT-2 CT-2 Level = 0.2955*(CT-P2 Level)+0.4845 0.79 35%*
* ISCO flow meter and transducer probe problems led to an extensive period of missing data from January to April.

D- 5
Phosphorus Loading During the past year, there has been extensive dialogue with the CDPHE/WQCD regarding the partitioning of loads to the Reservoir, which has led to methodological changes in the load calculations. The USACE reports daily inflow to Cherry Creek Reservoir as a function of storage, based on changes in reservoir level. This daily inflow value incorporates information regarding measured outflow, precipitation, and evaporation. GEI monitors inflow to the Reservoir using gaging stations on Cherry Creek, Cottonwood Creek, and Shop Creek (the three main surface inflows) to provide a daily surface inflow record. Given the differences in the two methods for determining inflow, combined with the potential of unmonitored surface flows that may result in greater seepage through the adjacent wetlands during storm events, and other unmonitored surface inflows (i.e., Belleview and Quincy drainages) an exact match between USACE and GEI calculated inflows is not expected. In recent years, GEI treated the difference between the USACE inflow (minus precipitation) and GEI inflow as a residual inflow term that was identified as the alluvial component, which included both ground water inflow (alluvial flow) and seepage from the wetlands that occurs during storm events. GEI’s treatment of the adjusted inflow may have been “loosely” applied to the alluvial component, if for no other reason than using, what we believed, was the most appropriate phosphorus concentration when applying a load value to the unmonitored flow through the wetland. However, given the concerns raised by the WQCD regarding the partitioning of this load and the desire to use a consistent database for modeling and future regulatory (watershed modeling) decisions, the ground water source or “true alluvial inflow” was removed from the residual inflow term and set as a constant source of water (2000 ac-ft/yr, per WQCD) to the Reservoir. The remainder of the residual term - seepage and unmonitored inflow component - was redefined as “Redistributed Inflow” and apportioned among the two primary surface inflow streams (Cherry Creek and Cottonwood Creek). The alluvial inflow constant (2000 ac-ft/yr) still utilized phosphorus concentrations from the MW-9 to estimate associated loads, while the redistributed inflow utilizes a flow-weighted phosphorus concentration derived from loads and inflow from Sites CC-10 and CT-2, precipitation, and the alluvium. In an effort to maintain a seasonality component in phosphorus loads and exports for the Reservoir, the redistributed inflow component was calculated on a monthly basis and apportioned accordingly. Loads attributed to stream inflow, Reservoir outflow, precipitation, and the alluvium were still calculated on a daily basis, using the daily inflow records and respective concentration data, but summed to create a monthly inflow value. In the case of the alluvial inflow constant, the annual value was divided by the number of days in the year to create a daily value, and then summed to create a monthly value, with no seasonal dynamics. Once the redistributed inflow and loads are apportioned to sites CC-10 and CT-2, according to their relative stream flow contribution, the final loads are identified as “Normalized” to the

D- 6
USACE reported inflow. Notably, other sites upstream of CT-2 or on Shop Creek are not normalized. Furthermore, only raw loading data was used to evaluate the effectiveness of the PRFs on Cottonwood Creek. Tributary Streams
Once the annual flow record for each stream site was finalized, the mean daily flows were categorized as either base flow or storm flow events. If the mean daily flow was greater than the 90th percentile annual value (Table D-4), then the flow was categorized as storm flow. Flows less than the 90th percentile were categorized as base flows. For the Cherry Creek mainstem site (CC-10), the annual record was divided into two parts (Jan-Apr, and May-Dec), because there was a noticeable shift in base flow conditions (potentially due to alluvial pumping upstream), with 90th percentiles being calculated for both subsets. Table D-4: Threshold flow value used to categorize base flows and storm flows in 2006.
Site 90th Percentile (cfs)
CC-10 (Jan-Apr) 12.56 CC-10 (May-Dec) 8.27
SC-3 0.72 CT-1 7.84 CT-2 4.54
CTP-1 3.87 CTP-2 3.46
For all streams, total phosphorus concentrations were determined for base flow samples collected on a monthly basis, and for storm flow samples collected at irregular intervals throughout the year (Appendix C). For each inflow site, the monthly base flow TP concentration (Table D-5) was applied to the daily base flows during that month, while the annual median storm flow TP concentration was applied to storm flows (Equation 1). Daily loadings were then summed to obtain estimates of monthly and annual phosphorus loading for each stream site (Table D-6). EQUATION 1:
µg
lbs102.205
ft
28.3169L
day
86400secQ µg/LL
9
3inday
−×××××=
where:
Lday = pounds per day phosphorus loading,
µg/L = total phosphorus concentration of base flow or storm flow
Qin = mean daily flow in ft3/sec.

D- 7
Table D-5: Monthly base flow TP concentrations (µg/L) and median annual storm flow TP concentration (µg/L) applied to respective flows in 2006.
Month CC-O CC-10 SC-3 CT-P1 CT-P2 CT-1 CT-2
January 68 155 40 77 42 101 67 February 60 156 35 15 20 83 61 March 68 143 30 36 53 77 71 April 96 163 101 52 61 72 74 May 93 217 146 64 64 60 63 June 197 225 138 82 34 28 51 July 190 190 130 93 57 33 56 August 200 155 121 104 80 37 60 September 80 176 113 87 82 73 82 October 92 192 93 89 84 111 87 November 73 157 34 37 51 61 45 December 53 151 49 37 22 76 64 Annual storm flow median
-- 477 161 227 218 326 259
Note: Shaded cells represent interpolated data. The July base flow samples were categorized as storm flow samples (see methods for discussion)
Reservoir Outflow The USACE monitors flows through the outlets gates on a regular interval and provides GEI with estimates of daily outflow for the Reservoir. To estimate the load associated with Reservoir outflows, only the monthly base flow TP concentration, collected from Site CC-O, was applied to respective flows (Equation 1). Precipitation Precipitation data collected at Centennial Airport (KAPA), located immediately south of the Reservoir and in the Cherry Creek basin, was used to estimate phosphorus loading due to precipitation in 2006 (Appendix D), with the basic premise that precipitation generally falls evenly across the Reservoir, although rain showers in the Cherry Creek Reservoir area can be localized. Calculation of the phosphorus load into Cherry Creek Reservoir from precipitation was based on the long-term median phosphorus concentration (1987-2005) and Equation 2. EQUATION 2:
µg
lbs102.205
ft
28.3169L
L
µg
acre
43650ftA
12in
PRL
9
3
2
resprecip
−××××××=
where:
Lprecip = pounds of phosphorus from precipitation,
PR = rainfall precipitation in inches,
Ares = surface area of the reservoir (852 ac), and
µg/L = 116 µg/L, long term median TP concentration.
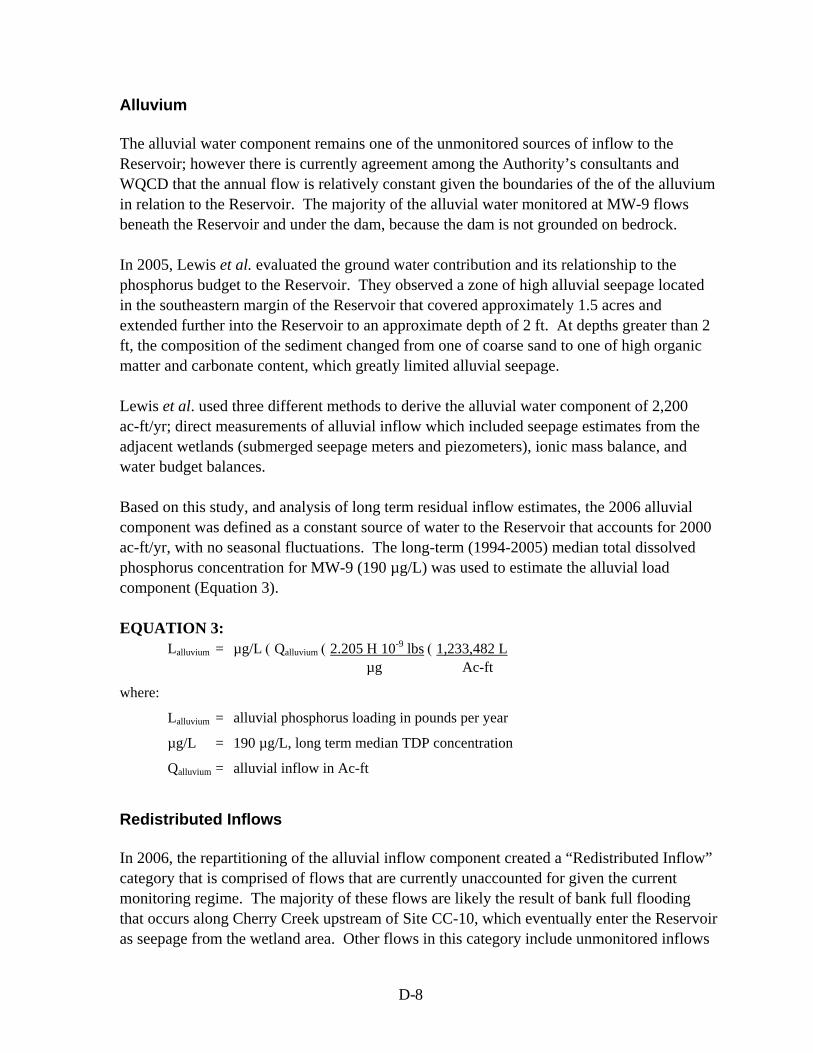
D- 8
Alluvium The alluvial water component remains one of the unmonitored sources of inflow to the Reservoir; however there is currently agreement among the Authority’s consultants and WQCD that the annual flow is relatively constant given the boundaries of the of the alluvium in relation to the Reservoir. The majority of the alluvial water monitored at MW-9 flows beneath the Reservoir and under the dam, because the dam is not grounded on bedrock. In 2005, Lewis et al. evaluated the ground water contribution and its relationship to the phosphorus budget to the Reservoir. They observed a zone of high alluvial seepage located in the southeastern margin of the Reservoir that covered approximately 1.5 acres and extended further into the Reservoir to an approximate depth of 2 ft. At depths greater than 2 ft, the composition of the sediment changed from one of coarse sand to one of high organic matter and carbonate content, which greatly limited alluvial seepage. Lewis et al. used three different methods to derive the alluvial water component of 2,200 ac-ft/yr; direct measurements of alluvial inflow which included seepage estimates from the adjacent wetlands (submerged seepage meters and piezometers), ionic mass balance, and water budget balances. Based on this study, and analysis of long term residual inflow estimates, the 2006 alluvial component was defined as a constant source of water to the Reservoir that accounts for 2000 ac-ft/yr, with no seasonal fluctuations. The long-term (1994-2005) median total dissolved phosphorus concentration for MW-9 (190 µg/L) was used to estimate the alluvial load component (Equation 3). EQUATION 3:
Lalluvium = µg/L ( Qalluvium ( 2.205 Η 10-9 lbs ( 1,233,482 L µg Ac-ft
where:
Lalluvium = alluvial phosphorus loading in pounds per year
µg/L = 190 µg/L, long term median TDP concentration
Qalluvium = alluvial inflow in Ac-ft
Redistributed Inflows In 2006, the repartitioning of the alluvial inflow component created a “Redistributed Inflow” category that is comprised of flows that are currently unaccounted for given the current monitoring regime. The majority of these flows are likely the result of bank full flooding that occurs along Cherry Creek upstream of Site CC-10, which eventually enter the Reservoir as seepage from the wetland area. Other flows in this category include unmonitored inflows

D- 9
from the Belleview and Quincy drainages, and surface inflows around the margin of the Reservoir. The monthly “Redistributed Inflow” is calculated as presented below (Equation 4, Table D-6), and can either be a positive or negative value depending on the monthly balance. EQUATION 4:
Redistributed Inflow = (USACE Inflow - Precipitation - Alluvial Inflow) - GEI Stream Inflow
If the value is positive, then the inflow or load is added proportionally to Cherry Creek and Cottonwood Creek inflows. If the value is negative, the inflow or load value is subtracted proportionally from Cherry Creek and Cottonwood Creek inflows. In the case when the redistributed inflow or load results in a negative monthly balance for a stream, the inflow or load for that stream is set to ZERO, with the remaining balance being subtracted from the other stream site. In the rare case when the redistributed inflow or load results in negative monthly balances for both streams, then the inflow or load for each stream is set to ZERO, with the remaining balance being subtracted from the monthly alluvial values. Additionally, when the redistributed inflow is greater than 1000 ac-ft/mo, the first 1000 ac-ft will be redistributed among the two streams , and the remainder will be placed into an “Ungaged Inflow” category. The reasoning behind this potentially new category is if the redistributed inflow is truly this great, then the current inflow monitoring regime should be reevaluated to address such occurrences.

D- 10
Table D-6: Unadjusted monthly flow and load data and the final normalized flow and load.
Unadjusted Flow (ac-ft/mo) Normalized Flow (ac-
ft/mo) Month
USACE Inflow
USACE Outflow
CC-10 SC-3 CT-P1 CT-P2 CT-1 CT-2 Precip Alluvium CC-10 CT-2
January 1,265 1,220 741 19 66 66 179 187 31 170 850 215 February 1,004 1,027 628 72 55 43 168 172 26 153 647 177 March 1,349 1,365 679 16 89 82 232 210 42 170 868 269 April 1,117 837 538 6 96 83 196 193 70 164 650 233 May 668 1,037 291 9 91 68 242 193 40 170 276 183 June 337 722 258 3 42 29 144 164 13 164 98 62 July 1,872 1,333 745 22 496 388 884 666 315 170 733 655 August 1,186 1,029 314 20 295 264 663 513 273 170 282 462 September 498 220 175 22 112 90 263 211 61 164 124 149 October 1,200 486 324 21 251 174 444 382 144 170 406 480 November 1,010 1,071 392 3 110 71 262 212 18 164 537 290 December 1,293 944 402 16 127 90 433 230 156 170 615 352 Annual Total 12,799 11,292 5,487 230 1,830 1,449 4,110 3,333 1,189 2,000 6,086 3,525
Unadjusted Total Phosphorus Load (lbs/mo) Normalized Load
(lbs/mo) Month
USACE Inflow
USACE Outflow (CC-O)
CC-10 SC-3 CT-P1 CT-P2 CT-1 CT-2 Precip Alluvium CC-10 CT-2
January -- 226 445 4 14 8 49 34 10 88 501 48 February -- 168 266 29 2 2 38 29 8 79 274 31 March -- 252 357 2 9 19 49 50 13 88 445 77 April -- 219 284 2 29 29 38 48 22 85 335 67 May -- 262 172 4 16 12 39 33 13 88 165 29 June -- 387 222 1 9 3 11 23 4 85 99 0 July -- 689 876 9 287 205 656 395 99 88 867 387 August -- 560 224 7 157 129 427 276 86 88 207 248 September -- 48 84 7 33 28 67 57 19 85 63 32 October -- 122 265 6 116 80 263 192 46 88 313 248 November -- 211 182 0 11 10 43 26 6 85 237 56 December -- 136 180 5 17 5 231 57 49 88 263 104 Annual Total -- 3,278 3,557 76 699 530 1,911 1,219 376 1,034 3,767 1,325
Shaded cells denotes negative load value for Site CT-2, which was set to zero and the remaining -34 lbs being subtracted from Site CC-10

D- 11
Table D-7: Calculation of the monthly redistributed inflow and load values and the apportioning of these data to Sites CC-10 and CT-2.
Month
Adjusted USACE Inflow
(USACE-Precip-
Alluvium)
GEI Inflow CC-10 +CT-2
(ac-ft/mo)
Redist-ributed Inflow
(ac-ft/mo)
Flow-weighted concentration
applied to Redistributed
Inflow (lbs/ac-ft)
Redistri-buted Load
(lbs/mo)
CC-10 % of GEI Inflow
CT-2 % of GEI Inflow
CC-10 Redistri-
buted Flow
(ac-ft/mo)
CT-2 Redistri-
buted Flow
(ac-ft/mo)
CC-10 Redistri-
buted Load
(lbs/mo)
CT-2 Redistri-
buted Load
(lbs/mo)
January 1,064 928 137 0.511 70 80% 20% 109 28 56 14 February 824 800 24 0.391 9 79% 21% 19 5 7 2
March 1,137 889 248 0.461 115 76% 24% 190 59 88 27 April 883 731 151 0.455 69 74% 26% 111 40 51 18 May 458 484 -26 0.440 -11 60% 40% -16 -10 -7 -5 June 160 422 -262 0.557 -146 61% 39% -161 -102 -89 -57 July 1,388 1,411 -23 0.770 -18 53% 47% -12 -11 -9 -8
August 744 826 -83 0.531 -44 38% 62% -31 -51 -17 -27 September 272 386 -114 0.401 -46 45% 55% -52 -62 -21 -25
October 886 707 179 0.579 104 46% 54% 82 97 48 56 November 827 604 223 0.379 85 65% 35% 145 78 55 30 December 967 632 335 0.390 130 64% 36% 213 122 83 47
Annual Total
9,611 8,821 790 -- 317 -- -- 598 192 244 73

Appendix E
Biological Data

Table E-1: 2006 Cherry Creek Reservoir Phytoplankton3/14/2006 4/12/2006 5/8/2006 5/24/2006 6/6/2006 6/20/2006 7/5/2006 7/18/2006 8/1/2006 9/7/2006 9/19/2006 10/18/2006 11/8/2006
BACILLARIOPHYTAOrder Centrales
Aulacoseira italica 125Aulacoseira italica var. tenuissima 40 8 42 690 270 8 300 1445 370Cyclotella meneghiniana 10Cyclotella ocellata 160 520Cyclotella sp. 80 7440 8 40 200Skeletonema sp. 240Stephanodiscus agassizensis 20 5Stephanodiscus hantzschii 120 2160 40Stephanodiscus niagarae 10 10 10 2 8Stephanodiscus parvus 880 5840 400 120
Order PennalesAsterionella formosa 70 205 2163 80 220 170Cymbella sp. 20Fragilaria crotonensis 40 1250 160 3530 560 30Nitzschia draveillensis 120 2Nitzschia gracilis 70 1120 40 3Nitzschia nana 1Nitzschia tubicola 20Puncticulata bodanica 40Synedra delicatissima var. angustissima 70 335Synedra rumpens var. familiaris 10 40 5 5 5Synedra rumpens var. fragilarioides 30 1
CHLOROPHYTAAnkyra judayi 80 400 10Chlamydomonas globosa 240 880 40 80 1280 1440Chlamydomonas reinhardtii 120 40Chlorella minutissima 40000 50000 31500 40000 70000 7500 1750 2500 78500 16000 500 20000 15000Chlorella sp. 20 280Chlorogonium sp. 10 160 320Chlorogonium tetragamum 320Chloromonas sp. 30Choricystis sp. 31000 500000 625 6000 5000 21000 137500 180250 1000 500 2815 2500Closterium acutum var. variabile 1 20 1Cosmarium bioculatum var. depressum 2Coelastrum microporum 30 100 26 480Coelastrum sphaericum 960 320 30Coenochloris fottii 400Crucigenia quadrata 160 320Crucigenia tetrapedia 160 4080 960 960 960Crucigeniella apiculata 310Dictyosphaerium ehrenbergianum 720Dictyosphaerium pulchellum 320 540 1280Diplochloris lunata 1920 8240 320 1760 240Elakatothrix viridis 20 20 5 4Kirchneriella dianae 560Diplochloris lunata 320Kirchneriella lunaris 1120Kirchneriella obesa 40 40 20Lagerheimia genevensis 80Micractinium pusillum 160 480Monoraphidium contortum 40 80 60Monoraphidium irregulare 6400 720 40 40 320Monoraphidium minutum 800 40 160 120Monoraphidium sp. 280Nephrocytium agardhianum 20 320 80
Organisms
E-1

3/14/2006 4/12/2006 5/8/2006 5/24/2006 6/6/2006 6/20/2006 7/5/2006 7/18/2006 8/1/2006 9/7/2006 9/19/2006 10/18/2006 11/8/2006OrganismsCHLOROPHYTA (cont.)
Oocystis borgei 720 10 2560 160Oocystis lacustris 83 1480 6 20Oocystis solitaria 20 60Pandorina smithii 46 1710Pediastrum boryanum 20 25 14 80Pediastrum duplex var. duplex 270 74 400 20 38Pediastrum simplex 40 40Pediastrum tetras 120 60 20 20Phacotus lenticularis 15 160Pseudodictyosphaerium sp. 1600 3000 4125 320 11500 1250 960Quadricoccus sp. 2000Raphidocelis contorta 320 40Raphidocelis microscopica 240 240 2500 2400 180 80Scenedesmus acuminatus 10 640 20Scenedesmus armatus 40 320 140 480Scenedesmus bicaudatus 10 40Scenedesmus communis 40 1600 100 20 40 40 20 480 800Scenedesmus ecornis 40Scenedesmus ellipticus 60 910 22 40 80Scenedesmus intermedius 120 240 640 320 440 320 160Scenedesmus obliquus 40 120 30Scenedesmus subspicatus 320 160 60 160 80 640Schroederia setigera 5 5 2Spermatozopsis exsultans 160 80 120Staurastrum chaetoceras 10 1 2 5Staurastrum sp. 1Tetraedron caudatum 5 10 20 20Tetraedron minimum 10 80 25 240 40 160 160 40 80 40Tetraspora lemmermannii 800Tetrastrum elegans 640 80Tetrastrum staurogeniaeforme 320 160 320 40 320 160
CYANOPHYTAAnabaena flos-aquae 26 18 540Anabaena sp. 340Anabaenopsis elenkinii 130 1400 445Aphanizomenon flos-aquae 16 440Aphanocapsa delicatissima 7500Aphanocapsa incerta 99500Aphanocapsa planctonica 14000 22500 9000 4960Aphanothece clathrata 250000 50000Aphanothece smithii 40000 3500 8750 45000 2000 9500Cyanobium sp. 2000Dactylococcopsis acicularis 800 600 40Dactylococcopsis sp. 1600 4520 80 840 1200 2720 20 40Geitlerinema lemmermannii 110Merismopedia tenuissima 16000 6000 8500 8000 3000Myxobaktron sp. 18560Planktolyngbya limnetica 320 10732 80Pseudanabaena limnetica 14 580 375 1760 6240 200Pseudanabaena sp. 400Synechococcus sp. 160 640
CHRYSOPHYTAChromulina sp. 125Dinobryon divergens 380 10Kephyrion sp. 2Mallomonas sp. 5Ochromonas sp. 20
E-2

3/14/2006 4/12/2006 5/8/2006 5/24/2006 6/6/2006 6/20/2006 7/5/2006 7/18/2006 8/1/2006 9/7/2006 9/19/2006 10/18/2006 11/8/2006OrganismsEUGLENOPHYTA
Euglena acus 5 10 20 1Euglena oxyuris 10Euglena polymorpha 10 10 113Euglena sp. 1 2 20 10 480 160 1Euglena viridis 10 1Phacus pleuronectes 10 1Trachelomonas hispida var. coronata 5Trachelomonas hispida var. crenulatocelis 5Trachelomonas varians 5 320Trachelomonas volvocina 20 160 160
CRYPTOPHYTACampylomonas marsonii 5 3 20 85 1 480Campylomonas reflexa 10 55 175 250 105 1 20 60 200 1840Chroomonas coerulea 880 5 10 360 240 1520 20 160 120Chroomonas nordstedtii 10 160Chroomonas sp. 40Cryptomonas erosa 40 20 83 30 430 240 60 960 120Cryptomonas ovata 8 30 140 480 280Cryptomonas rostratiformis 10 10 15 1 10 10 35 240 120Hemiselmis virescens 4Komma caudata 4080 4880 40 60 20 2800 480 4000 3000Plagioselmis sp. 240 80 1200 500 1700 640 3600 1240 800 40 20 480cyst 400
HAPTOPHYTAChrysochromulina parva 960 800 320
DINOPHYTABernardinium sp. 30 5Ceratium hirundinella 3 15 5 10 70Peridiniopsis edax 15Peridiniopsis kulczynskii 110 35 2 20Peridiniopsis polonicum 10
PRASINOPHYTANephroselmis olivacea 10 240 480Pedinomonas sp. 80Scourfieldia complanata 160 20Tetraselmis cordiformis 10 15 30 800 20 800 25 80
XANTHPHYTAGoniochloris mutica 5
TOTAL DENSITY (cells/mL) 146,910 601,915 44,557 56,298 88,465 83,621 183,784 207,900 370,127 237,666 8,889 40,652 32,983NUMBER OF TAXA 35 41 34 24 28 33 41 49 43 46 31 38 31
E-3

Table E-2: Reservoir mean phytoplankton density (cells/mL) and number of taxa in Cherry Creek Reservoir, 1984 to 2006.
Metric 1984 1985 1986 1987 1988 1989 1991 1992 1993 1994 1995 1996 1997 1998 1999 2000 2001 2002 2003 2004 2005 2006
Long term median
Blue-Green Algae
Density 71,780 66,496 99,316 168,259 155,180 273,175 307,691 77,516 15,708 10,015 18,194 16,599 19,716 44,951 15,263 164,290 148,691 941 54,114 165,677 79,154 665,696 54,114
Taxa Richness 7 7 6 18 24 24 14 16 7 3 7 9 10 11 8 19 12 3 21 27 19 19 12
Green Algae
Density 5,864 11,760 25,595 11,985 19,177 55,415 18,688 41,899 1,198 314 355 738 2,461 1,809 898 43,881 33,217 1,973 55,190 56,236 189,777 1,358,248 18,688
Taxa Richness 11 10 13 58 76 66 46 48 16 2 11 11 18 18 18 71 56 27 70 75 66 63 46
Diatoms
Density 1,776 3,863 5,428 10,677 12,880 9,311 4,160 1,243 946 194 2,189 2,354 1,109 628 838 12,019 5,256 978 2,026 1,720 3,610 32,036 2,026
Taxa Richness 6 4 7 34 30 31 21 11 15 2 15 13 8 18 16 34 22 24 22 26 24 21 21
Golden-Brown Algae
Density -- 7 125 469 56 505 821 93 158 3 63 249 227 56 -- 391 1,346 34 44 57 335 542 193
Taxa Richness -- 1 1 6 4 7 5 4 1 1 2 4 2 2 -- 14 13 3 5 5 4 5 4
Euglenoids
Density 514 135 208 251 276 108 89 23 231 196 304 409 838 698 1,252 126 91 22 308 24 39 1,549 196
Taxa Richness 2 1 1 9 9 6 3 5 2 1 2 3 3 3 1 6 4 3 9 11 8 10 3
Dinoflagellates
Density -- 13 19 19 83 28 23 54 -- 31 5 21 -- 18 45 80 157 193 20 57 60 330 45
Taxa Richness -- 1 1 2 4 3 2 2 -- 1 2 4 -- 2 2 8 6 5 3 5 6 5 3
Cryptomonads
Density 1,513 718 1,113 1,090 2,689 1,689 628 529 332 450 919 1,104 1,487 1,393 559 2,472 2,851 355 3,282 3,158 3,293 40,511 1,393
Taxa Richness 2 3 3 6 4 5 2 3 1 1 1 1 1 1 1 4 6 4 8 8 9 12 3
Miscellaneous
Density -- -- -- -- -- -- -- -- -- -- -- -- -- -- -- 1,923 5,714 15 1,294 164 2,014 4,855 1,923
Taxa Richness -- -- -- -- -- -- -- -- -- -- -- -- -- -- -- 1 1 1 3 6 6 6 3
Total Density 81,447 82,992 131,804 192,750 190,341 340,231 332,100 121,357 18,573 11,203 22,029 21,474 25,838 49,553 18,855 225,182 197,323 4,511 116,278 227,093 278,282 2,103,767 116,278
Total Taxa 28 27 32 133 151 142 93 89 42 11 40 45 42 55 46 157 120 70 141 163 142 141 89
E-4

Table E-3: Quantity and size of fish stocked in Cherry Creek Reservoir, 1985 to 2006.
Year Species Size (inches) Number 1985 Black crappie 5 7,234
Channel catfish 2-8 116,784 Rainbow trout 8-12 75,753 Walleye 0.3 2,346,000 Yellow perch 2 90,160
1986 Bluegill 1 111,968 Channel catfish 4 25,594 Cutthroat trout 6 52,228 Rainbow trout 2-18 414,136 Tiger musky 5-6 4,723 Walleye 0.3 1,734,000 Wiper 0.2 80,000 1987 Bluegill 0.2 70,000 Channel catfish 4 25,600 Largemouth bass 5 10,000 Rainbow trout 2-26 129,715 Tiger musky 7 4,000 Walleye 0.2 1,760,000 1988 Channel catfish 3 16,000 Largemouth bass 5 10,000 Rainbow trout 9-10 293,931 Tiger musky 8 4,500 Walleye 0.2 1,760,000 1989 Channel catfish 2-4 10,316 Largemouth bass 6 8,993 Rainbow trout 8-22 79,919 Walleye 0.2 1,352,000 Wiper 0.2 99,000 1990 Channel catfish 3-4 25,599 Rainbow trout 9-15 74,986 Tiger musky 8 2,001 Walleye 0.2 1,400,000 Wiper 1 8,996 1991 Channel catfish 3 13,500 Rainbow trout 9-10 79,571 Tiger musky 5-8 6,500 Walleye 0.2 1,300,000 Wiper 1 9,000 1992 Blue catfish 3 9,000 Channel catfish 4 13,500 Rainbow trout 9-10 101,656 Tiger musky 7 4,940 Walleye 0.2 2,600,000 Wiper 10 15,520 1993 Channel catfish 4 13,500 Rainbow trout 9-10 92,601 Tiger musky 9 4,500 Walleye 0.2 2,600,000 Wiper 1 9,003 1994 Blue catfish 3 21,000 Channel catfish 4 23,625
E-5

Year Species Size (inches) Number Cutthroat trout 9 9,089 Flathead catfish 1 148 Tiger musky 8 900 Walleye 0.2 2,600,000 Wiper 1-4 26,177 Rainbow trout 9-18 62,615 1995 Channel catfish 4 18,900 Rainbow trout 9-20 139,242 Tiger musky 8 4,500 Walleye 0.2 2,600,000 Wiper 1 4,500 1996 Channel catfish 3 8,100 Cutthroat trout 9-10 85,802 Tiger musky 7 3,500 Rainbow trout 4-22 163,007 Walleye 0.2 3,202,940 Wiper 1 8,938 1997 Channel catfish 3 13,500 Cutthroat trout 3-9 22,907 Rainbow trout 10-24 74,525 Tiger musky 6 4,500 Walleye 0.2 2,600,000 Wiper 1 9,000 1998 Channel catfish 4 7,425 Rainbow trout 10-12 59,560 Tiger musky 7 4,000 Walleye 1.5 40,000 Wiper 1.3 9,000 1999 Channel catfish 3.5 13,500 Rainbow trout 10-19 32,729 Tiger musky 7 3,000 Walleye 0.2 2,400,000 Wiper 1.3 9,000 2000 Channel catfish 4.1 13,500 Northern pike B 46 Rainbow trout 4.5-20.3 180,166 Rainbow/Cutthroat trout hybrid B 5,600 Tiger musky 8 4,086 Walleye 0.23 2,400,000 2001 Channel catfish 3.5 13,500 Rainbow trout 10-19 23,065 Tiger musky 7 4,000 Walleye 0.2 2,400,000 2002 Rainbow trout 10 13,900 Tiger musky 7 4,000 Walleye 0.2 2,519,660 2003 Rainbow trout 10-11 30,111 Walleye 0.25 4,136,709 Channel catfish 2-2.5 33,669 2004 Rainbow trout 10-11 43,553 Walleye 0.25 2,874,100
E-6

Year Species Size (inches) Number Channel catfish 2.5 13,500 2005 Rainbow trout 10.4 43,248 Walleye 0.25 2,579,939 Wiper 0.18 200,000 Channel catfish 2.2 13.500 2006 Rainbow trout 10.8 47,150 Snake River cutthroat 16.1 204 Rainbow × cutthroat hybrid 10.6 7,895 Walleye 0.24 2,788,825 Wiper 2.1 5,000 Channel catfish 2.8 13,500 Black crappie 2.5 300 Largemouth bass 2.1 195
E-7

Appendix F
Quality Assurance/Quality Control

Independent Laboratory QC Results Duplicate water quality samples analyzed by the University of Colorado, Center for Limnology were generally within acceptable limits (i.e., overall less than 25 percent relative difference for an analyte). While most paired analyses were generally in close agreement, the relationship between both laboratories for the total phosphorus raised concern. The slope of the relationship was 1.65, with the University of Colorado results generally less than GEI results. One possible explanation for this difference is the total phosphorus methods used by each laboratory. GEI uses an automated LACHAT method (QC 10-115-01-1-U) to analyze total phosphorus, whereas the University of Colorado calculates the total phosphorus content as the sum of total particulate phosphorus and total dissolved phosphorus, based upon manual colorimetric methods (Lagler and Hendrix, 1982, Murphey and Riley, 1962, and Valderrama 1981). While both methods use similar digestion techniques, the automated method is not necessarily more accurate than the manual method. However, the automated method is subject to less variability because it eliminates the errors associated with analyzing large batches of samples by hand. Furthermore, additional error may also be introduced by the manual methods, given the summation of two individual analyses. In an effort to evaluate the potential bias within GEI analyses, GEI re-evaluated each batch QC standard, spikes, and blanks with all samples passing the 20 percent relative difference requirement. GEI also purchased total phosphorus standards from Wibby Environmental (DMRQA Nutrient #2, TKN-TP standard, Lot# 8502-11) to compare in-house results with the known concentration. All results were within 10 percent of the known standard. Therefore, GEI elected to use their total phosphorus results rather than computing the mean value of the duplicate samples when estimating total phosphorus loads.
University of ColoradoTotal Phosphorus (µg/L)
0 20 40 60 80 100 120 140 160
GE
IT
ota
l P
ho
sph
oru
s (µ
g/L
)
0
20
40
60
80
100
120
140
1601:1 lineSlope = 1.65
R2 = 0.82
Figure F-1: Relationship between GEI total phosphorus and University of Colorado total phosphorus for 2006.
F-1

University of ColoradoTotal Dissolved Phosphorus (µg/L)
0 10 20 30 40 50 60
GE
IT
ota
l D
isso
lved
Ph
osp
ho
rus
(µg
/L)
0
10
20
30
40
50
601:1 lineSlope = 0.92
R2 =0.66
Figure F-2: Relationship between GEI total dissolved phosphorus and University of Colorado total dissolved phosphorus for 2006.
University of ColoradoSoluble Reactive Phosphorus (µg/L)
0 10 20 30 40
GE
IS
olu
ble
Rea
ctiv
e P
ho
sph
oru
s (µ
g/L
)
0
10
20
30
401:1 lineSlope = 0.77
R2 =0.78
Figure F-3: Relationship between GEI soluble reactive phosphorus and University of Colorado soluble reactive phosphorus for 2006.
F-2

University of ColoradoAmmonium Ion (µg/L)
0 20 40 60 80 100
GE
IA
mm
on
ium
Ion
(µ
g/L
)
0
20
40
60
80
1001:1 lineSlope = 0.76
R2 =0.73
Figure F-4: Relationship between GEI ammonium ion and University of Colorado ammonium ion for 2006. Reference: Lagler, C. L., and P. F. Hendrix. 1982. Evaluation of persulfate digestion method for particulate nitrogen and phosphorus. Water Res. 16: 145 l-l 454. Murphy, J. and J. Riley. 1962. A modified single solution for the determination of phosphate in natural waters. Anal. Chim. Acta v.27 p.31-36. VALDERRAMA, J. C. 198 1. Simultaneous analysis of total nitrogen and total phosphorus in natural waters. Mar. Chem. 10: 109-122.
F-3