Cheng, Xie, Yiu, Chen, Sun UV-diagram: a Voronoi Diagram for uncertain data 26th IEEE International...
29
1 Cheng, Xie, Yiu, Chen, Sun UV-diagram: a Voronoi Diagram for uncertain data 26th IEEE International Conference on Data Engineering Reynold Cheng (University of Hong Kong) Xike Xie (University of Hong Kong) Man Lung Yiu (Hong Kong Polytechnic University) Jinchuan Chen (Renmin University of China) Liwen Sun (University of Hong Kong)
-
Upload
earl-leonard -
Category
Documents
-
view
214 -
download
0
Transcript of Cheng, Xie, Yiu, Chen, Sun UV-diagram: a Voronoi Diagram for uncertain data 26th IEEE International...
1Cheng, Xie, Yiu, Chen, Sun
UV-diagram: a Voronoi Diagram
for uncertain data
26th IEEE International Conference on Data Engineering
Reynold Cheng (University of Hong Kong)Xike Xie (University of Hong Kong)Man Lung Yiu (Hong Kong Polytechnic University)Jinchuan Chen (Renmin University of China)Liwen Sun (University of Hong Kong)
2Cheng, Xie, Yiu, Chen, Sun
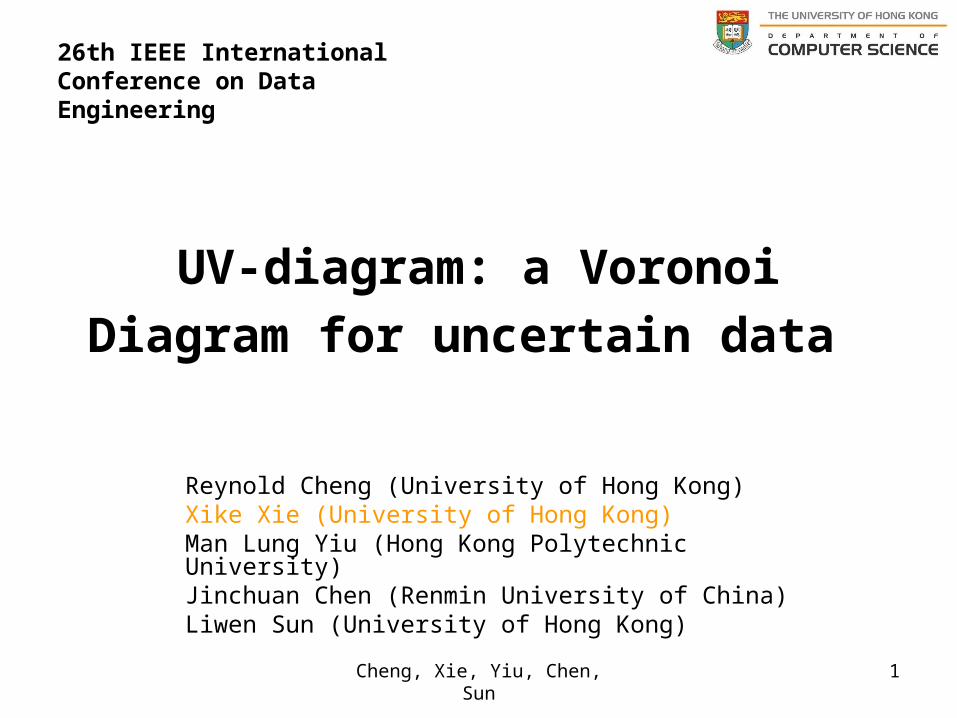
Voronoi Diagram
http://www.crowddynamics.co.uk/images/Personal%20Space.jpghttp://www.ics.uci.edu/~eppstein/vorpic.html
3Cheng, Xie, Yiu, Chen, Sun
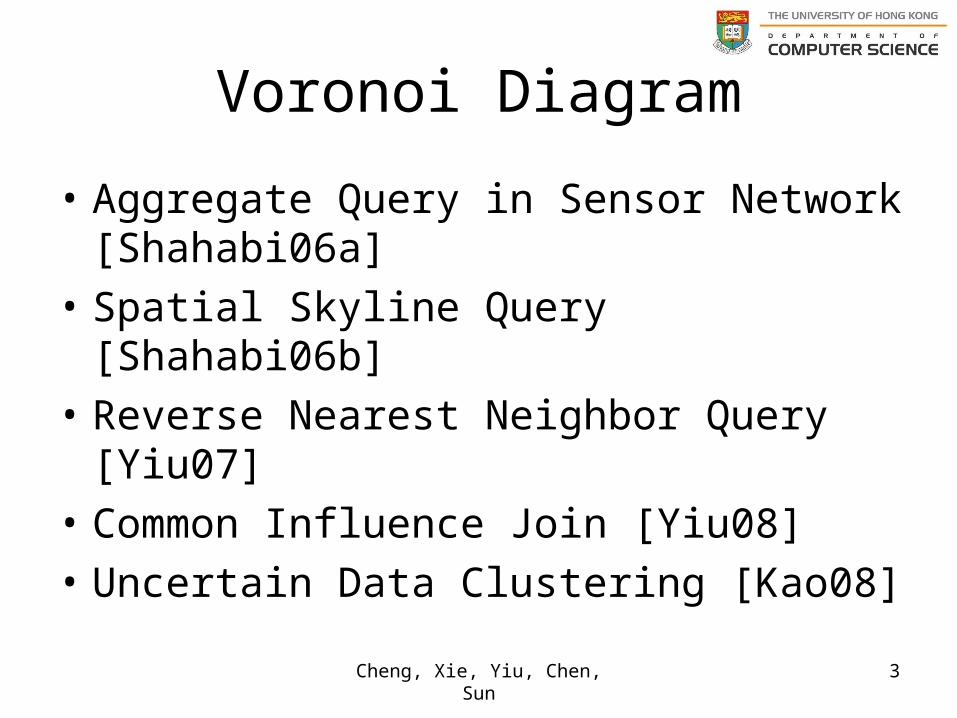
Voronoi Diagram
• Aggregate Query in Sensor Network [Shahabi06a]
• Spatial Skyline Query [Shahabi06b]
• Reverse Nearest Neighbor Query [Yiu07]
• Common Influence Join [Yiu08]
• Uncertain Data Clustering [Kao08]
4
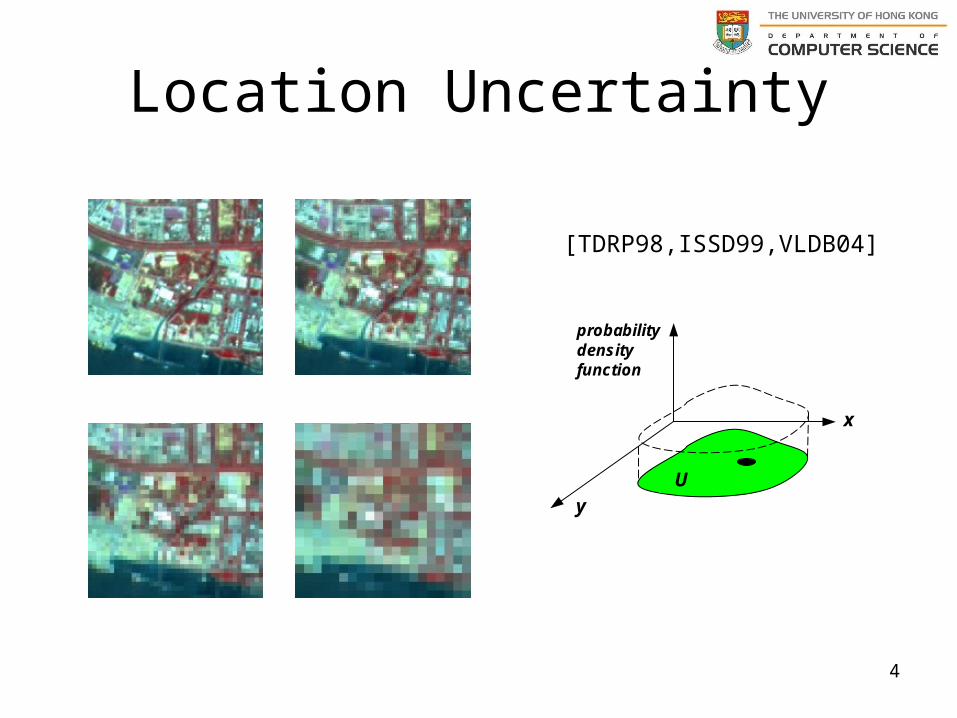
Location Uncertainty
x
y
probabilitydensity function
U
[TDRP98,ISSD99,VLDB04]
5Cheng, Xie, Yiu, Chen, Sun
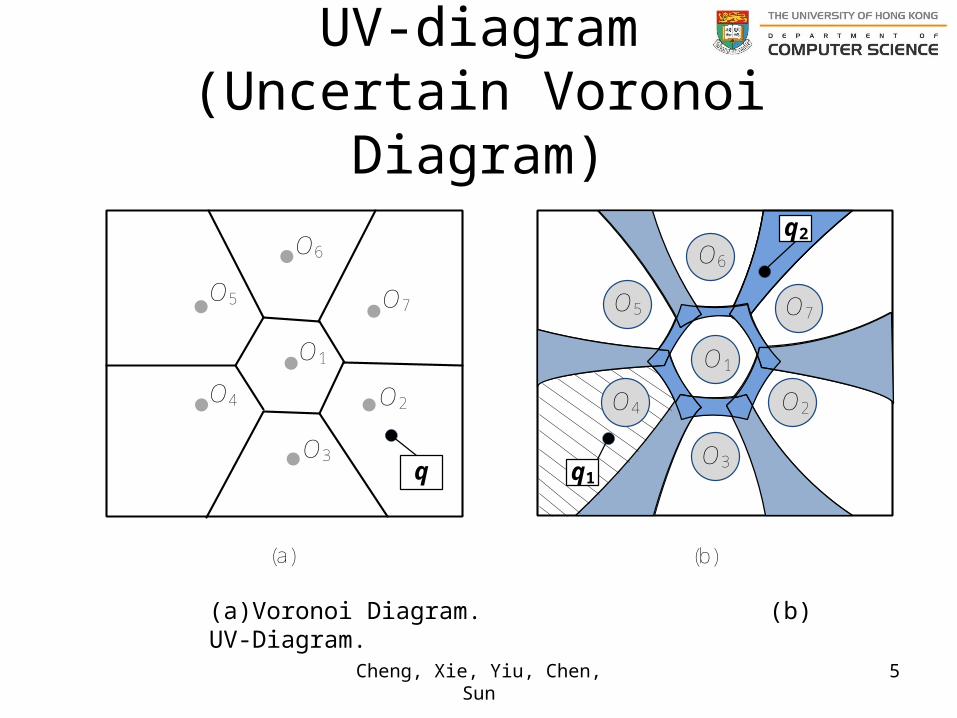
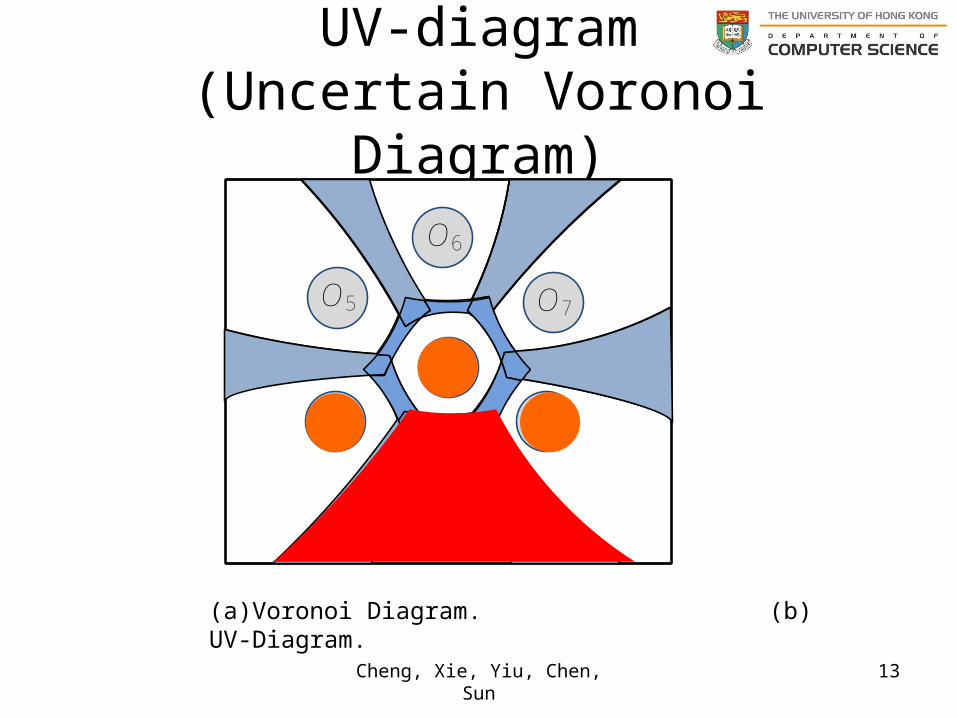
UV-diagram(Uncertain Voronoi Diagram)
O1
O3
O7
O2O4
O5
O6
(a)
q
(b)
O1
O3
O7
O2
O5
O6
q2
O4
q1
(a)Voronoi Diagram. (b) UV-Diagram.
6
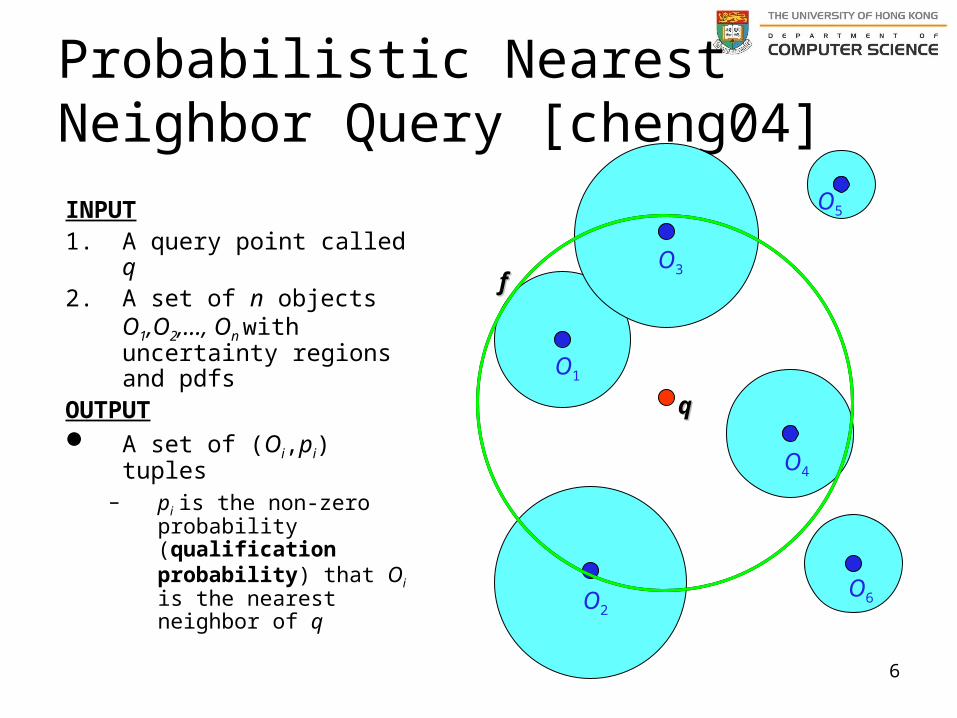
Probabilistic Nearest Neighbor Query [cheng04]
INPUT1. A query point called q2. A set of n objects
O1,O2,…, On with uncertainty regions and pdfs
OUTPUT A set of (Oi,pi) tuples
– pi is the non-zero probability (qualification probability) that Oi is the nearest neighbor of q
O2
ff
O1
O3
O4
O5
O6
7Cheng, Xie, Yiu, Chen, Sun
Agenda
• Introduction– Basic Concepts
• Voronoi Diagram in Spatial Database Management• Data Uncertainty
– Applications of UV-diagram
• UV-diagram– Basic concepts of UV-diagram
UV-edge, UV-cell, possible region, outer region…
– ConstructionInitial region construction, I- and C- level pruning, UV-index construction
– Results
• Conclusion• Future work
8Cheng, Xie, Yiu, Chen, Sun
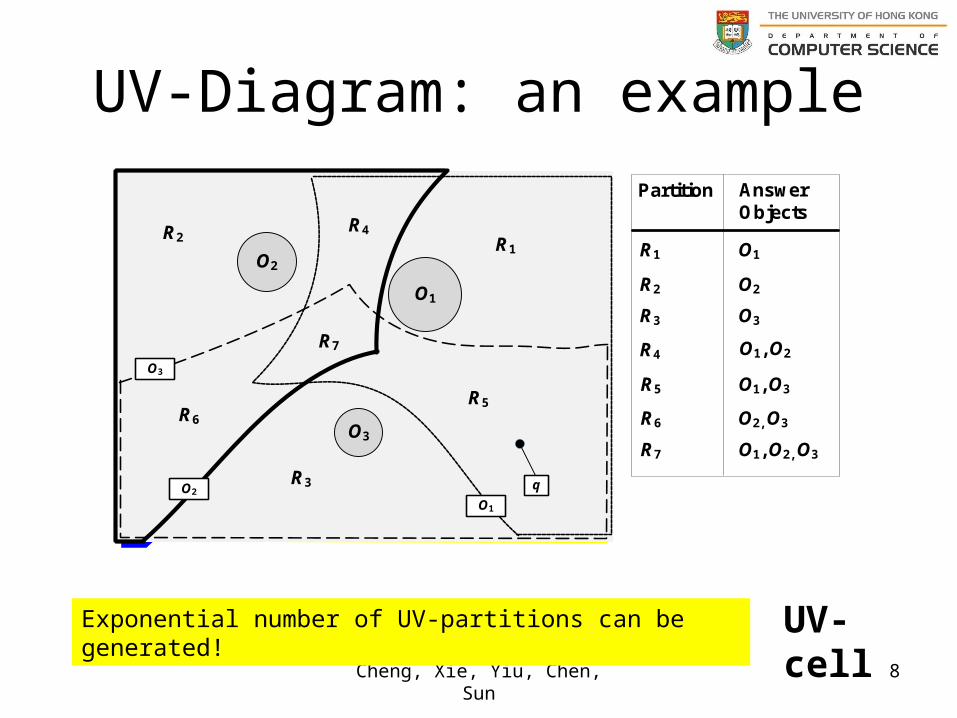
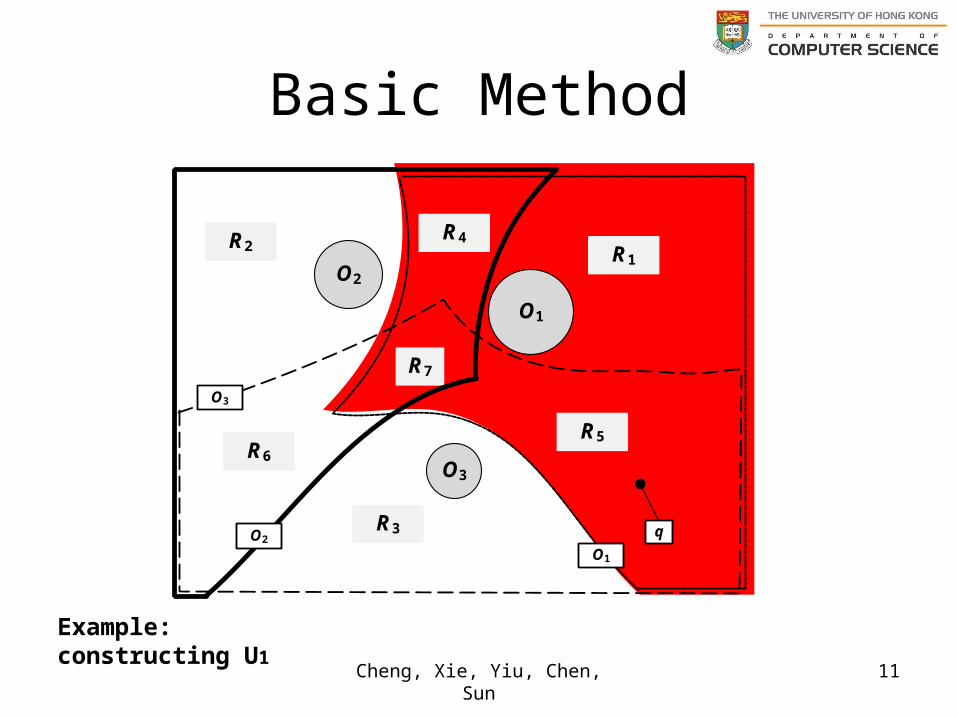
UV-Diagram: an example
Exponential number of UV-partitions can be generated! UV-cell
Partition AnswerObjects
R1 O1
R2 O2
R3 O3
R4
O1, O2, O3
O2
O1
O3
R2 R1
R3
R7
R4
R6
R5R5
R6
R7
O1, O2
O1, O3
O2, O3
O3
O2
O1
q
9Cheng, Xie, Yiu, Chen, Sun
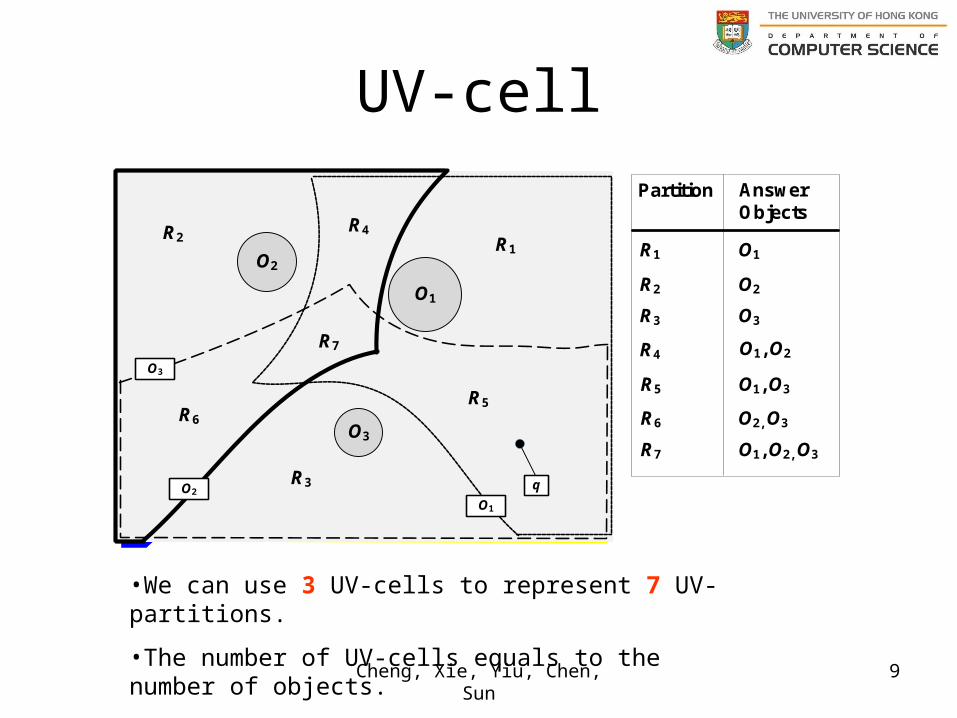
UV-cell
Partition AnswerObjects
R1 O1
R2 O2
R3 O3
R4
O1, O2, O3
O2
O1
O3
R2 R1
R3
R7
R4
R6
R5R5
R6
R7
O1, O2
O1, O3
O2, O3
O3
O2
O1
q
•We can use 3 UV-cells to represent 7 UV-partitions.
•The number of UV-cells equals to the number of objects.
10
)( jX i
Cheng, Xie, Yiu, Chen, Sun
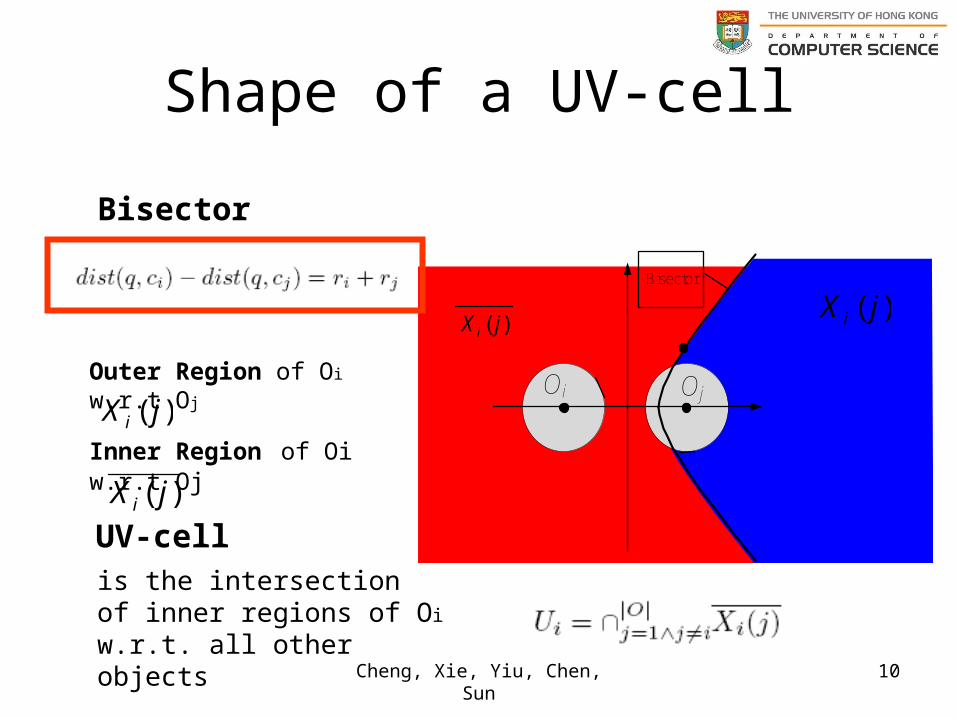
Shape of a UV-cell
Bisector
Bisector
Oi Oj
)( jX i
Outer Region of Oi w.r.t Oj
)( jX iInner Region of Oi w.r.t Oj
)( jX iUV-cell is the intersection of inner regions of Oi w.r.t. all other objects
11
O2
O1
O3
R2 R1
R3
R7
R4
R6
R5
O3
O2
O1
q
Basic Method
Example: constructing U1
Cheng, Xie, Yiu, Chen, Sun
12
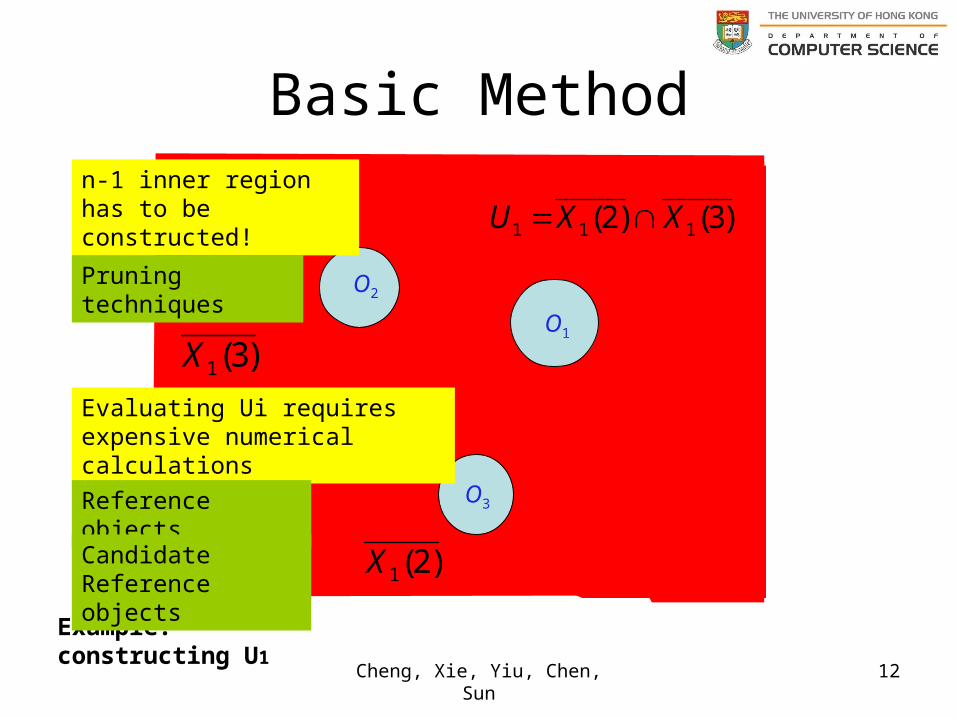
Basic Method
O1
O2
O3
)2(1X
)3(1X
)3()2( 111 XXU
Example: constructing U1
Cheng, Xie, Yiu, Chen, Sun
n-1 inner region has to be constructed!
Pruning techniques
Evaluating Ui requires expensive numerical calculations
Reference objects
Candidate Reference objects
13Cheng, Xie, Yiu, Chen, Sun
UV-diagram(Uncertain Voronoi Diagram)
(a)Voronoi Diagram. (b) UV-Diagram.
O1
O3
O7
O2
O5
O6
O4
14Cheng, Xie, Yiu, Chen, Sun
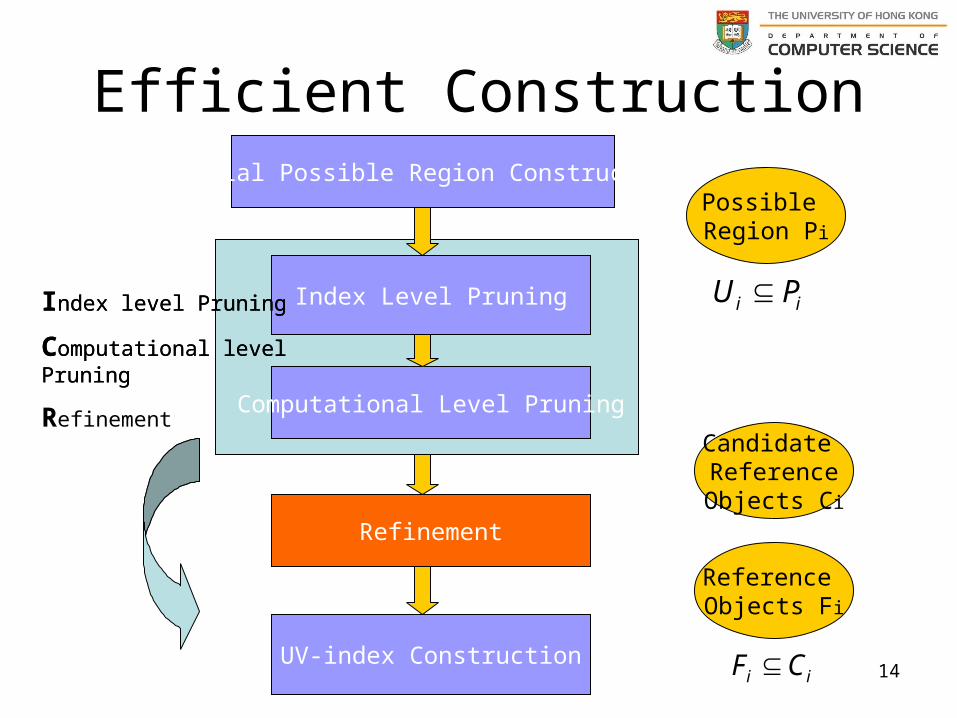
Efficient Construction
ii PU Index Level Pruning
Computational Level Pruning
Refinement
Candidate ReferenceObjects Ci
Reference Objects Fi
UV-index Construction
Initial Possible Region ConstructionPossible Region Pi
ii CF
Index level Pruning
Computational level Pruning
Refinement
Index level Pruning
Computational level Pruning
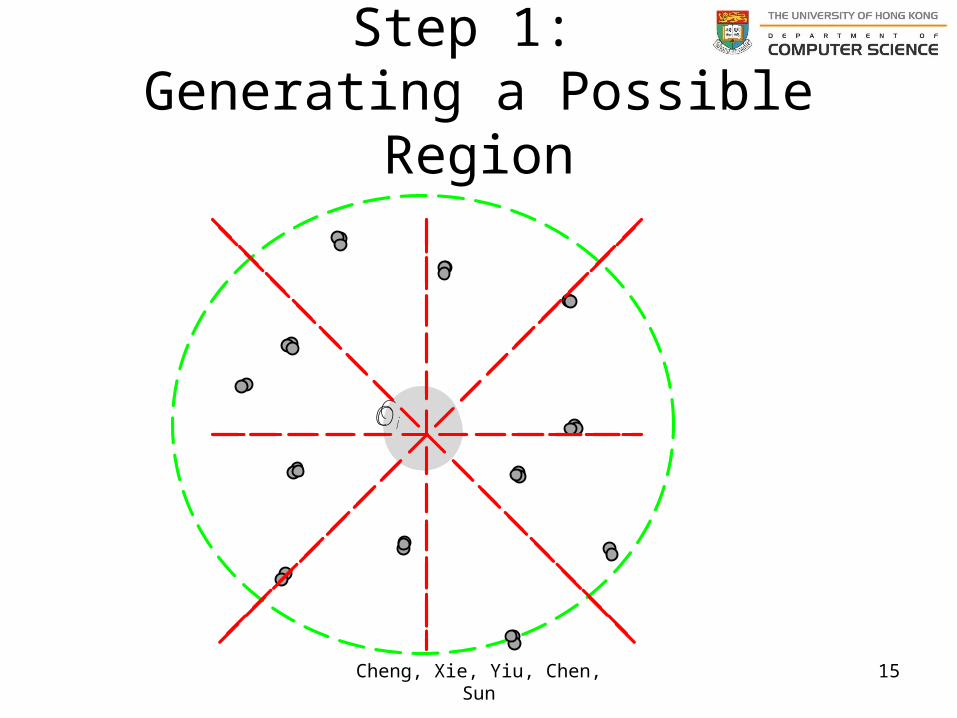
15Cheng, Xie, Yiu, Chen, Sun
Step 1: Generating a Possible Region
OiOiOi
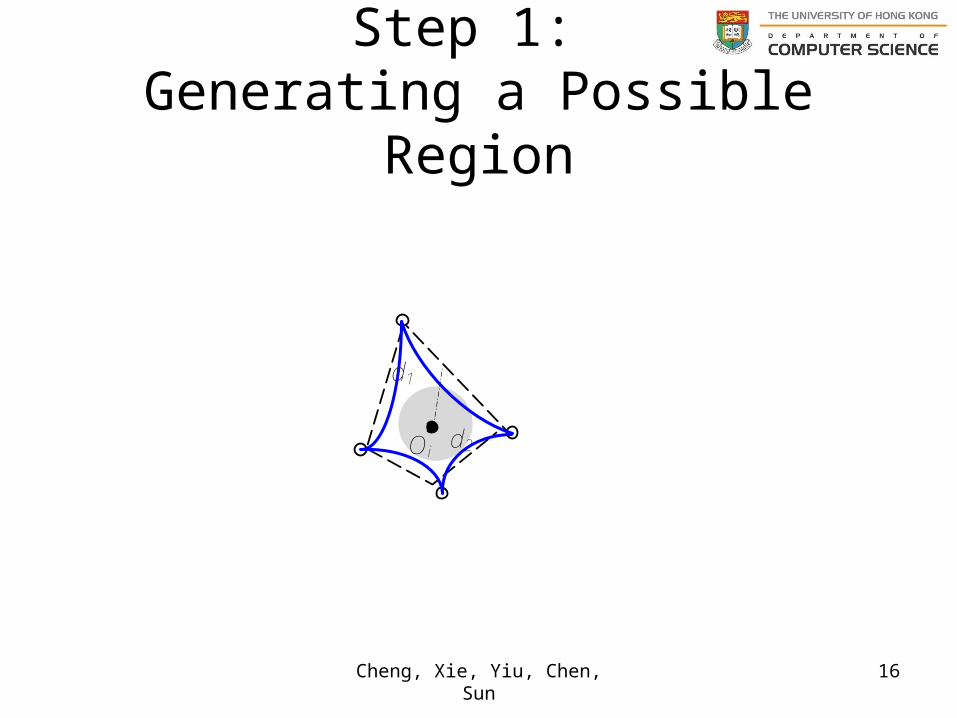
16Cheng, Xie, Yiu, Chen, Sun
Step 1: Generating a Possible Region
Oi
d1
d2
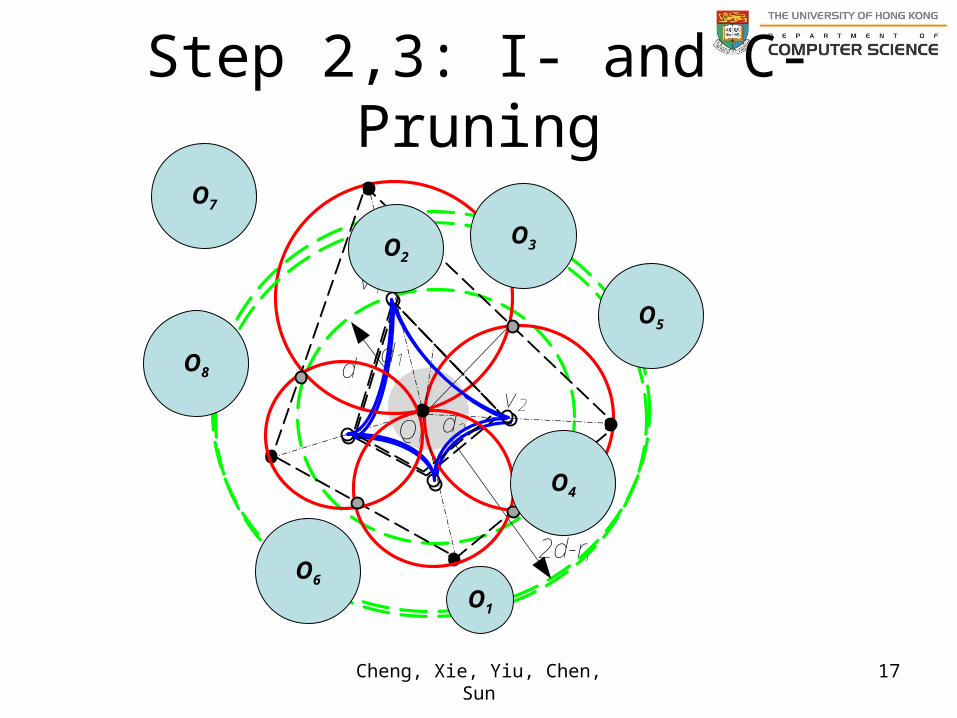
17Cheng, Xie, Yiu, Chen, Sun
Step 2,3: I- and C- Pruning
d
2d-ri
OiOi
d1
d2
v1
v2
O7
O1
O2O3
O4
O5
O8
O6
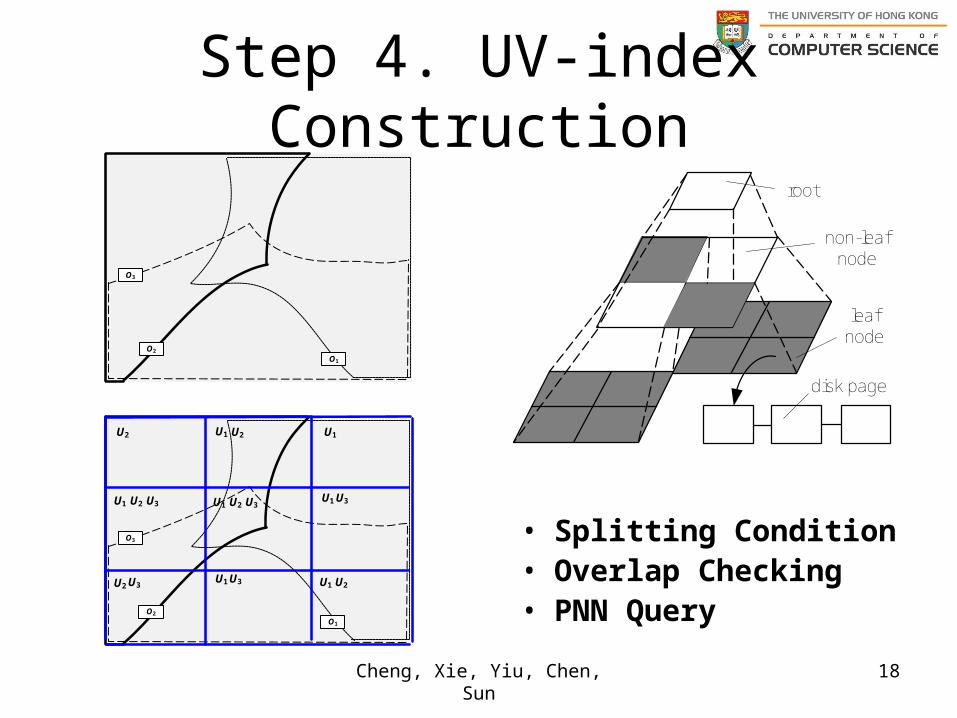
18Cheng, Xie, Yiu, Chen, Sun
Step 4. UV-index Construction
• Splitting Condition• Overlap Checking• PNN Query
disk page
leaf node
root
non-leaf node
O3
O2
O1
O3
O2
O1
U1U2 U1 U2
U3U1 U2U1
U1 U3U3U2U1 U3U2U1
U2U3
19Cheng, Xie, Yiu, Chen, Sun
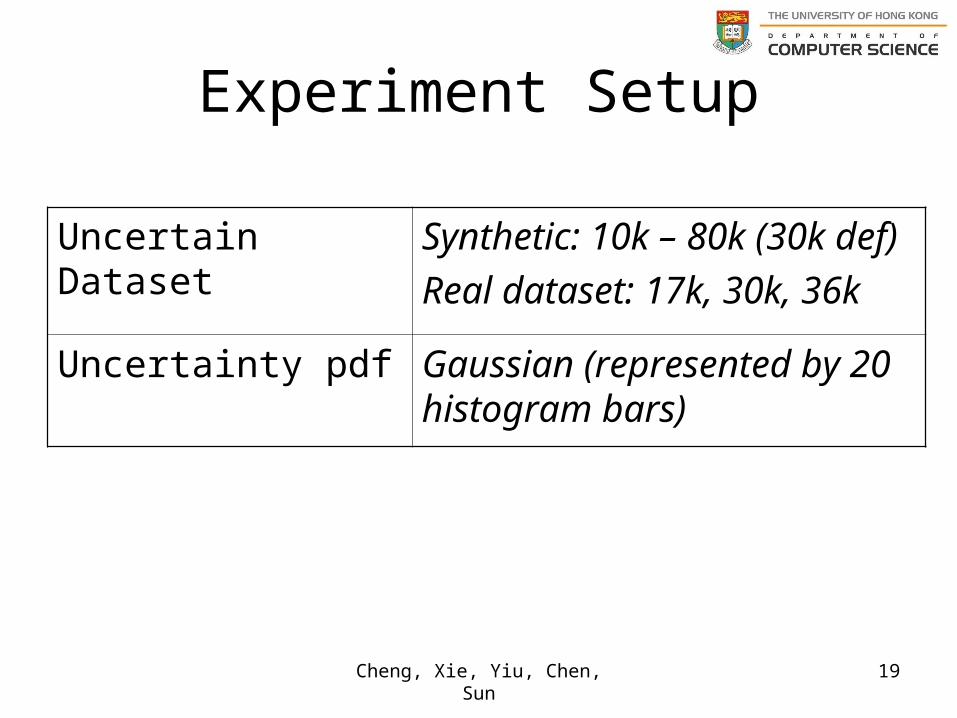
Experiment Setup
Uncertain Dataset Synthetic: 10k – 80k (30k def)
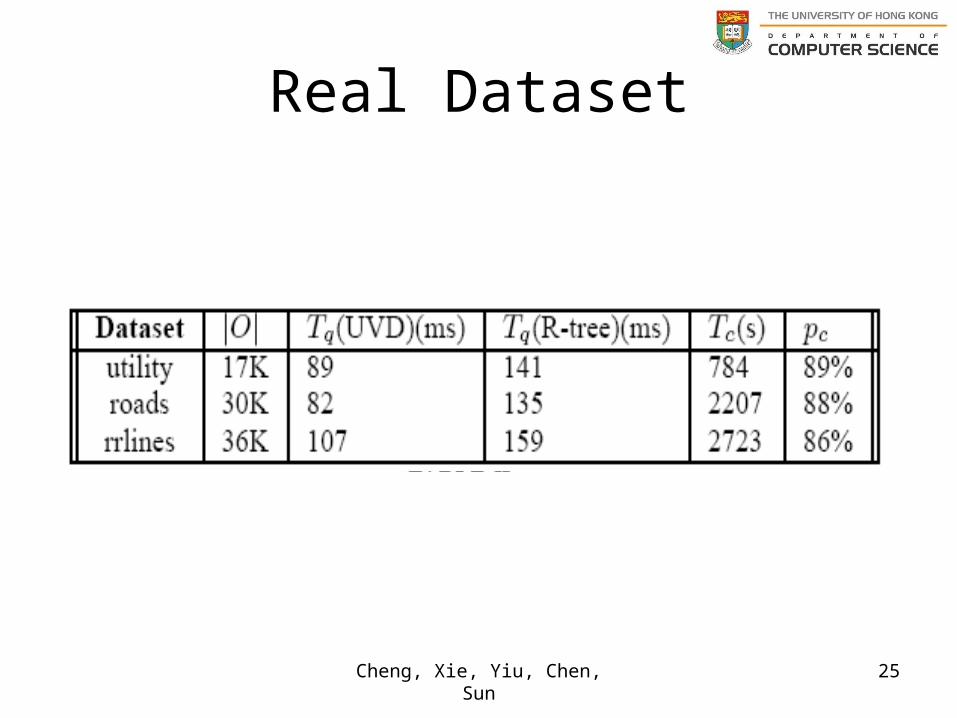
Real dataset: 17k, 30k, 36k
Uncertainty pdf Gaussian (represented by 20 histogram bars)
20Cheng, Xie, Yiu, Chen, Sun
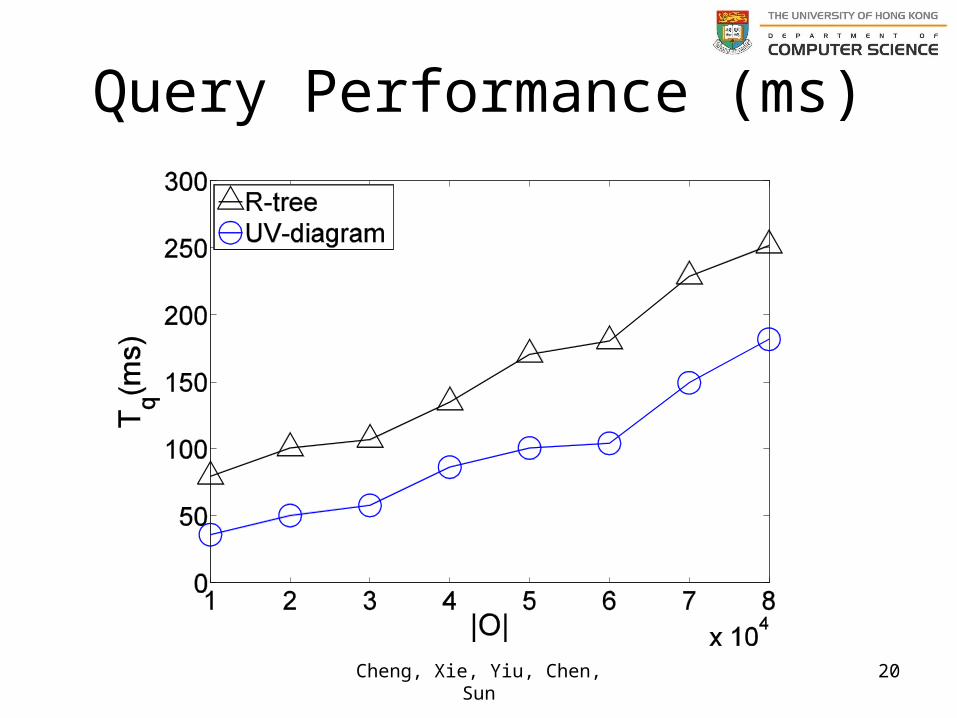
Query Performance (ms)
21Cheng, Xie, Yiu, Chen, Sun
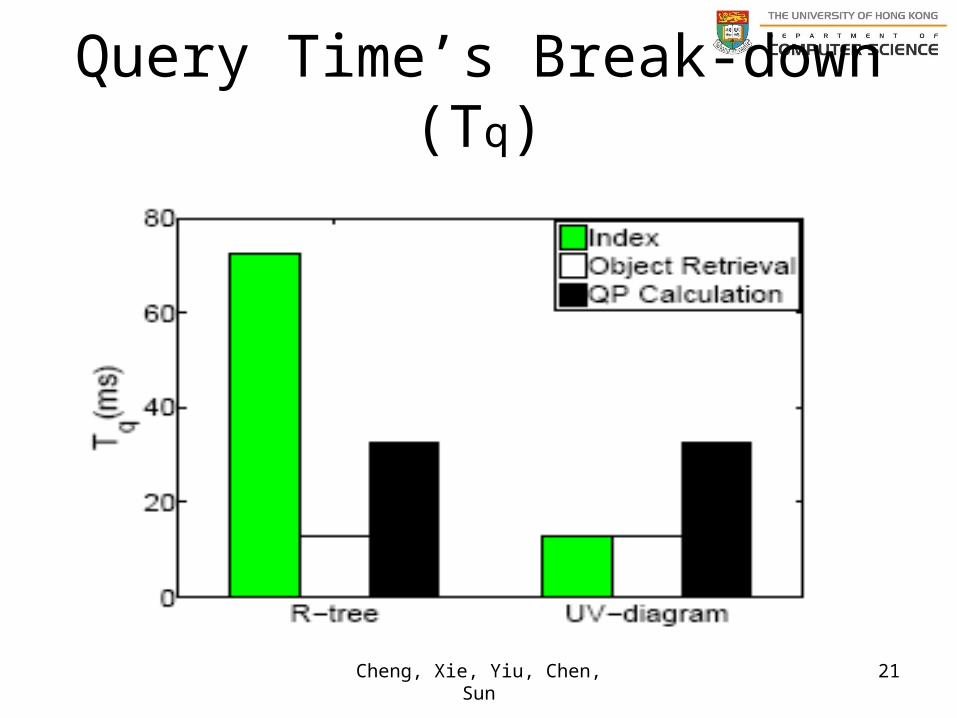
Query Time’s Break-down (Tq)
22Cheng, Xie, Yiu, Chen, Sun
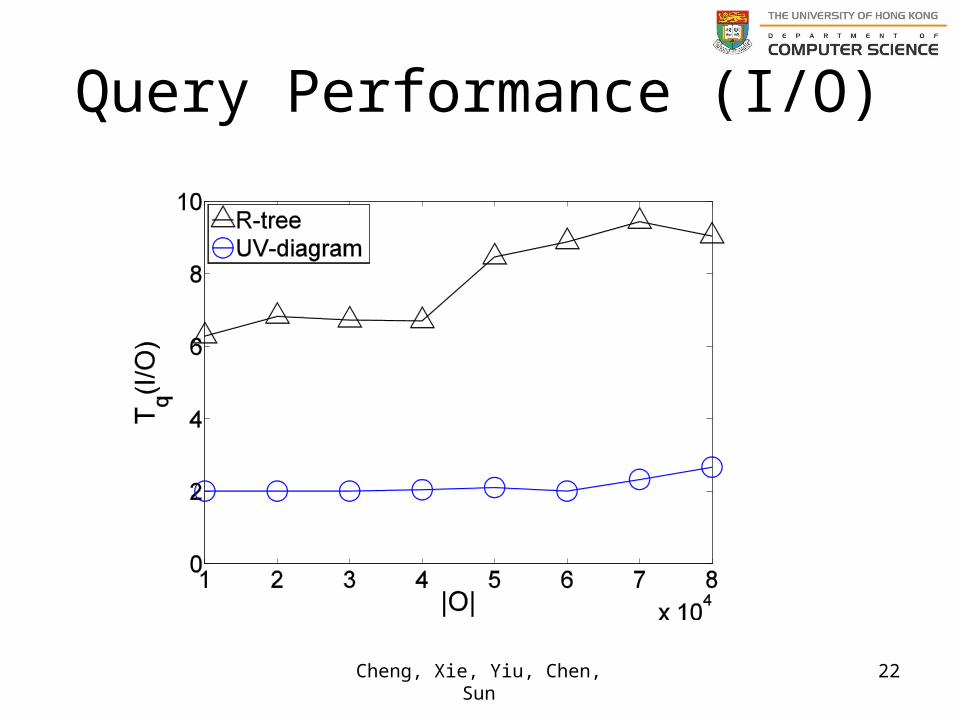
Query Performance (I/O)
23Cheng, Xie, Yiu, Chen, Sun
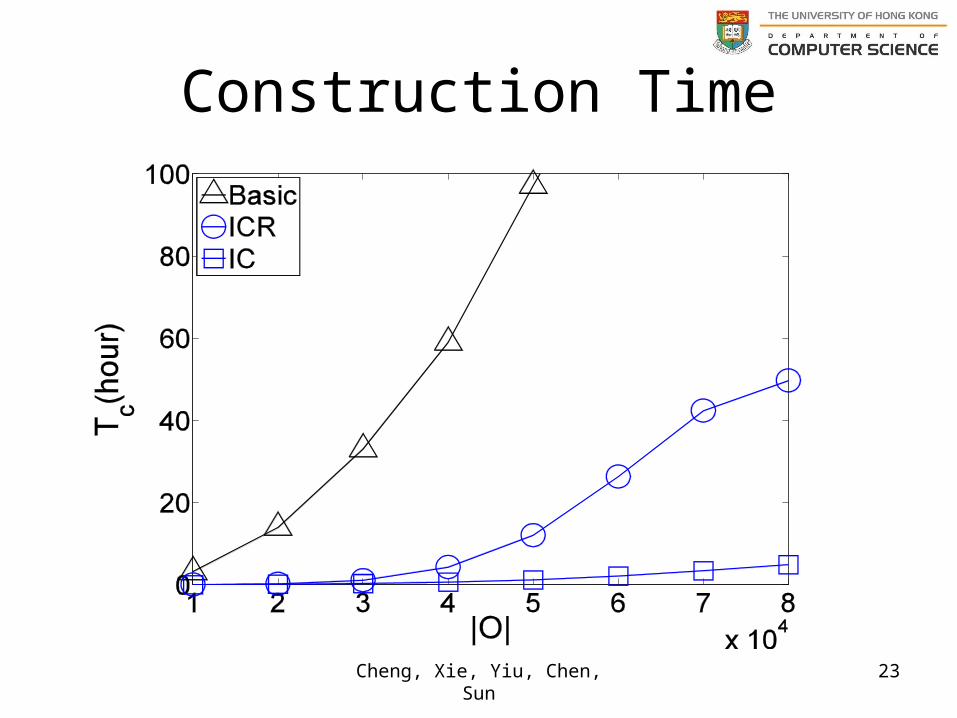
Construction Time
24Cheng, Xie, Yiu, Chen, Sun
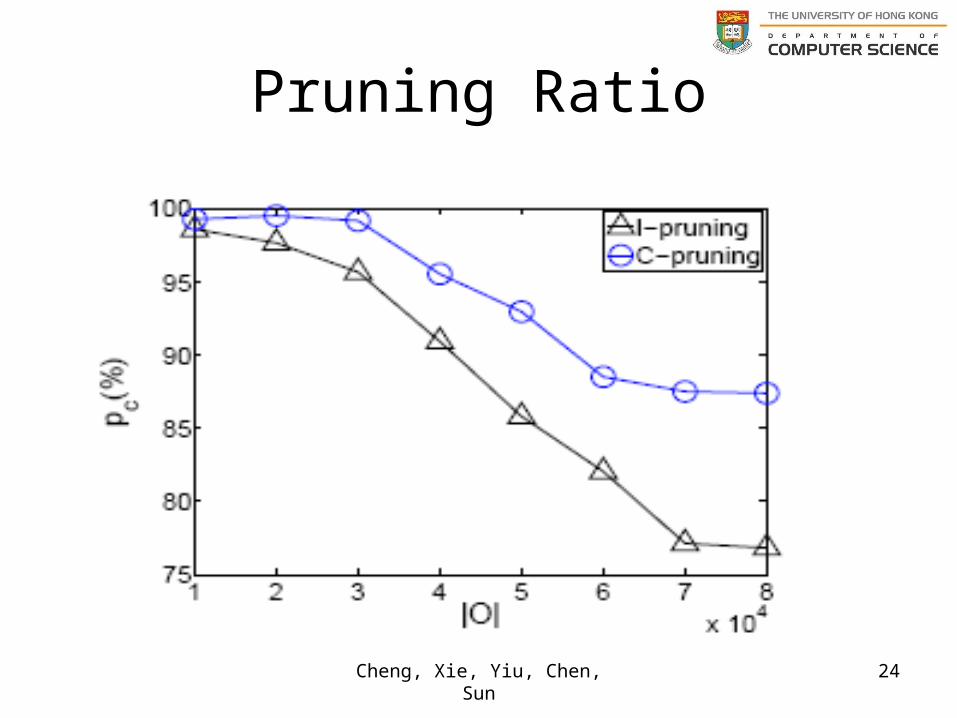
Pruning Ratio
25Cheng, Xie, Yiu, Chen, Sun
Real Dataset

26Cheng, Xie, Yiu, Chen, Sun
Conclusion
• We propose UV-diagram, which is a variant of Voronoi Diagram for uncertain data.
• We introduce the concepts of UV-cell and reference objects to efficiently construct UV-diagram.
• We also propose an adaptive index for the UV-diagram.
27Cheng, Xie, Yiu, Chen, Sun
Future Work
• Use UV-diagram to support various types of queries- Continuous query, imprecise NN query,
reverse NN query, etc.
28
2828
THANKS!
• Q & A
• More discussions are welcome in the poster session!
28
Contact: Xike Xie [email protected] of Computer ScienceThe University of Hong Kong
29Cheng, Xie, Yiu, Chen, Sun
Reference• [shahabi06a] Mehdi Sharifzadeh, Cyrus Shahabi: The Spatial Skyline Queries. VLDB 2006: 751-762• [Shahabi06b] Sharifzadeh, Mehdi and Shahabi, Cyrus: Utilizing Voronoi Cells of Location Data Streams for
Accurate Computation of Aggregate Functions in Sensor Networks. Geoinformatica. 2006• [Kao08] Clustering Uncertain Data using Voronoi Diagrams: Ben Kao; Sau Dan Lee; David Cheung; Wai-Shing
Ho; K. F. chan. ICDM 2008 • [Yiu07] Yiu, Man Lung and Mamoulis, Nikos. Reverse Nearest Neighbors Search in Ad Hoc Subspaces. TKDE
2007 • [Yiu08] M. L. Yiu, N. Mamoulis, and P. Karras. Common Influence Join: A Natural Join Operation for Spatial
Pointsets. In ICDE 2008. • [Zheng06] B. Zheng, J. Xu, W.-C. Lee, and L. Lee, “Grid-partition index: a hybrid method for nearest-neighbor
queries in wireless location-based services,” VLDB J., vol. 15, no. 1, pp. 21–39, 2006. • [cheng04] R. Cheng, D. V. Kalashnikov, and S. Prabhakar, “Querying imprecisedata in moving object
environments,” TKDE, vol. 16, no. 9, 2004.• [TDRP98] P. A. Sistla, O. Wolfson, S. Chamberlain, and S. Dao,“Querying the uncertain position of moving
objects,” in Temporal Databases: Research and Practice, 1998.• [ICDCS07] S. Ganguly, M. Garofalakis, R. Rastogi, and K. Sabnani, “Streaming algorithms for robust, real-time
detection of ddos attacks,” in ICDCS, 2007.• [VLDB04a] A. Deshpande, C. Guestrin, S. Madden, J. Hellerstein, and W. Hong, “Model-driven data acquisition in
sensor networks,” in Proc. VLDB, 2004• [Jooyandeh09] M. Jooyandeh, A. Mohades, and M. Mirzakhah, “Uncertain voronoi diagram,” Inf. Process. Lett.,
vol. 109, no. 13, pp. 709–712, 2009.• [Sember08] J. Sember and W. Evans, “Guaranteed voronoi diagrams of uncertain sites,” in CCCG, 2008.