Vinay Devadas Hakan Aydin Professor : Chen, Ya-Shu Presenter : Ho, Shu-Wei.

Chen, Shu-Ling (2010) Valuation of M&A A Case Study: BenQ’s Acquisition of Siemens Mobile Device Division. [Dissertation (University of Nottingham only)] (Unpublished)
Access from the University of Nottingham repository: http://eprints.nottingham.ac.uk/23555/2/Chen%2CShu-Ling_edissertation.pdf
Copyright and reuse:
The Nottingham ePrints service makes this work by students of the University of Nottingham available to university members under the following conditions.
This article is made available under the University of Nottingham End User licence and may be reused according to the conditions of the licence. For more details see: http://eprints.nottingham.ac.uk/end_user_agreement.pdf
For more information, please contact [email protected]

1
University of Nottingham
Valuation of M&A
A Case Study: BenQ’s Acquisition of
Siemens Mobile Device Division
SHU-LING, CHEN
MBA
2
_______________________________
Valuation of M&A
A case study: BenQ’s Acquisition of Siemens
Mobile Device Division
by
SHU-LING, CHEN
2009-2010
A Management Project presented in part consideration
for the degree of “MBA in Finance”.
_______________________________

3
Abstract
In order to retain or upgrade core competence and sustainability, companies
seek for global expansion and conglomeration. Consequently, mergers and
acquisition (M&A) has become the most highly possible route for enterprises to
pursue future growth in the fast way. Although the historical record shows a
higher failure rate, the M&A waves do not appear to exhibit a declining trend in
past decades. This paper illustrates the financial evaluation of a M&A activity. By
using the Discount Cash Flow (DCF) method and Market Multiple model, it
demonstrates and expresses the value differing from the assumptions and
conditions that are adopted in the calculation. Meanwhile, through the specific
case study of BenQ‟s failure to takeover Siemens Mobile Division in handset
industry, it brings an argument that is significant in its own right, but is also a
mixture of diverse issues involving financial evaluation, culture management in
cross-broad circumstance, shareholder value maximisation and agency problem
as well. Moreover, the objective of this paper is to stress on the evaluation on
the target company during the pre-acquisition period, which requires careful due
diligence to minimise potential risks and errors in value prediction in the
beginning. Meanwhile, it also points out that the success of post-acquisition
integration is highly relevant to the management strategy, but a failure to
conduct it could lead to synergy that is not produced as early as expected and
continuing operation expenditures that can cause a severe financial burden to
the acquirer, which will change its capital structure and undermine its
competition and business capability on the market as well. The focus on the M&A
case of BenQ merge with Siemens implicates relevant topics, including the
conflict between corporate social responsibility (CSR) and shareholder value
maximisation. In addition, the interrelation between investment bank and
enterprises involved in the M&A activities with the possible conflict against
shareholder due to the concern of agency problem results in the inappropriate
investment. Finally, it concludes that the future projection needs to be made on
the basis of every aspect in business world; financial evaluation cannot be the
singular element to accomplish successful M&A unless supported by all other
strategic fits in operation.

4
Contents
Pages
Abstract
Introduction 1
1. Methodology 5
2. Literature Review 10
2.1 M&A Theories 10
2.2 Brand Strategy of M&A 15
2.3 Financial Valuation of M&A 23
2.4 Cultural Difference of M&A 24
3. A Case of BenQ’s Acquisition of Siemens Mobile Device 26
Division
3.1 The Background of Handset Market 26
3.2 Introduction to the case 28
3.3 The Failure of BenQ acquiring Siemens Handset Business 29
4. Findings 32
4.1 Valuing Siemens Mobile Division Applying DCF Analysis 32
4.2 Market Multiple Approach 43
4.3 Comparison of Financial Evaluation 44
5. Discussion 46
5.1 The Motives of BenQ’s Acquiring Siemens Mobile Business 46
5.2 Failures to the Merger 47
Conclusions and Recommendations 50
References 54

5
Lists of Table
Pages
Table 1: Last twelve-months‟ deal activity by industry sector 17
Table 2: Announcement Period Cumulative Abnormal Return by Decade 22
Table 3: Five Dimensions of National Culture Difference 25
Table 4: Worldwide Market Share of Major Handset Suppliers 27
Table 5: Mobile Phone Market Demand Forecast 38
Table 6: Estimating Siemens Mobile Value Using DCF Analysis 38
with WACC
Panel 6-A: Base Case Pro Forma Financial Statements 38
Panel 6-B: Planning Period Cash Flow Estimates 39
Panel 6-C: Divisional Value 40
Table 7: Estimating Updated Siemens Mobile Value Using 40
DCF Analysis with WACC (Sensitivity Analysis)
Panel 7-A: Pro Forma Financial Statements 40
Panel 7-B: Cash Flow Estimate 41
Panel 7-C: Divisional Value 41
Table 8: Market Multiples 42
Panel 8-A: Equity Multiple 42
Panel 8-B: Total Capital Multiple 42
Panel 8-C: Expected Share Price of Siemens Mobile Division 42
Panel 8-D: The Final Expected Share Value of Siemens 42
Handset Division
Table 9: Geert Hofstede Culture Dimensions-Germany and Taiwan 48

6
Introduction
With information technology becoming more common, internet application and
telecommunication, international business connections have became more
complex in more recent years. At the same time, national boundaries are getting
vague resulting in the fiercely competitive and challenging environment that
companies have to face. In order to retain or upgrade core competence and
sustainability, companies seek for global expansion and conglomeration. As a
result, mergers and acquisition (M&A) has become the most highly possible
route for enterprises to pursue future growth. Moreover, due to the deregulation
of related M&A rules with the trends of privatisation and liberalisation enables
global capital flows to be utilised efficiently, which further foster the M&A
environment in the world market.
The most recent curve of M&A activity since 2004 can be attributed to
macroeconomic recovery and several drivers. First of all, many firms view M&A
as a primary means to pursue higher shareholder return when they utilise cost
cutting and operational effectiveness exhaustively to improve profitability. In
addition, retain earnings of corporations and share price appreciation in M&A
activities have supported acquirers to leverage their internal financing by
swapping target firms‟ valueless private stock. Moreover, relatively low interest
rates in historical record enable acquirers employ cost-effective financing costs
to support the M&A growth (Sherman A.J. et al., 2006). Meanwhile, 31,233
deals transactions, valued at $1.9 trillion, were announced in 2004. Many large
industries, in particular, energy and power, financial services, and
telecommunications, leading by their transaction value, have experienced a
strong consolidation, and high technology has dominated in terms of the total
number of deals (see Table 1). In Taiwan, small and medium sized enterprises
(SMEs) have played major roles in economic development. Taiwan has been a
member of the World Trade Organization (WTO) since 2002; however, this trend
causes instant shock to Taiwan-based corporations because they encounter
foreign competitors‟ abundant resources in capital and advanced technology that
may threat domestic growth. Therefore, the Taiwanese government works out
the M&A regulation to encourage domestic M&A activities in order to strengthen
business operations and to underpin economic development (Tsai H.M., 2006).
7
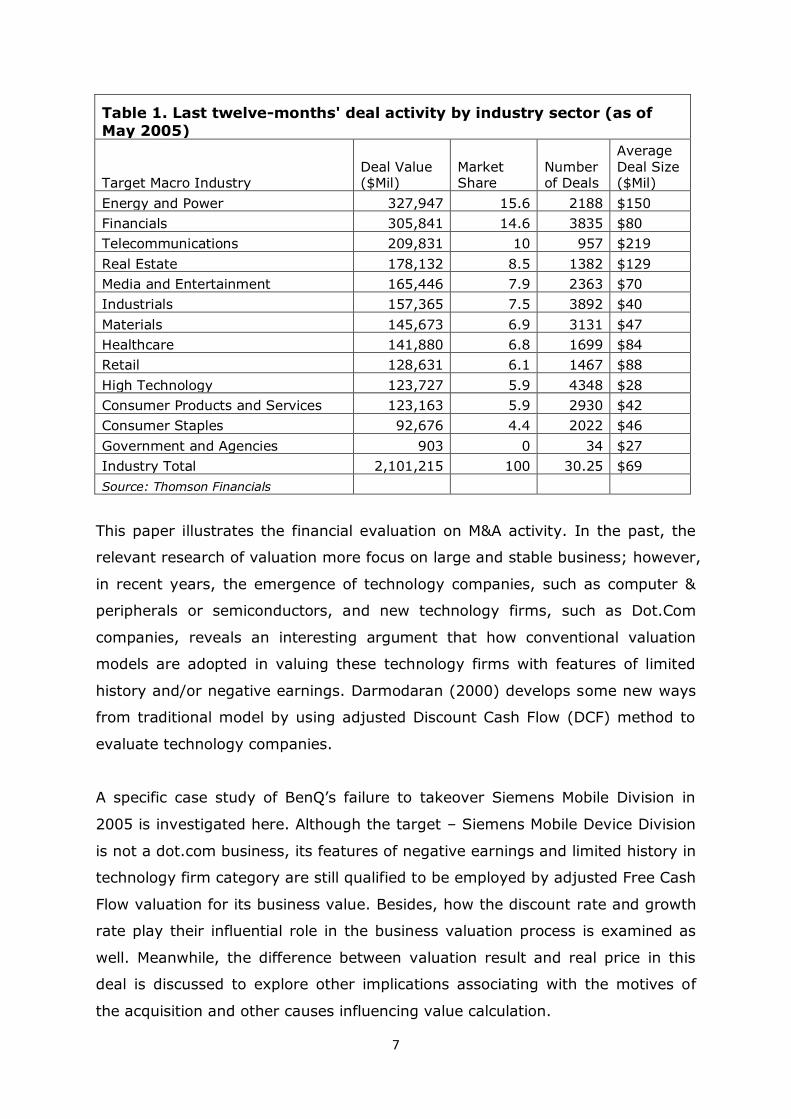
Table 1. Last twelve-months' deal activity by industry sector (as of
May 2005)
Target Macro Industry Deal Value ($Mil)
Market Share
Number of Deals
Average Deal Size ($Mil)
Energy and Power 327,947 15.6 2188 $150
Financials 305,841 14.6 3835 $80
Telecommunications 209,831 10 957 $219
Real Estate 178,132 8.5 1382 $129
Media and Entertainment 165,446 7.9 2363 $70
Industrials 157,365 7.5 3892 $40
Materials 145,673 6.9 3131 $47
Healthcare 141,880 6.8 1699 $84
Retail 128,631 6.1 1467 $88
High Technology 123,727 5.9 4348 $28
Consumer Products and Services 123,163 5.9 2930 $42
Consumer Staples 92,676 4.4 2022 $46
Government and Agencies 903 0 34 $27
Industry Total 2,101,215 100 30.25 $69
Source: Thomson Financials
This paper illustrates the financial evaluation on M&A activity. In the past, the
relevant research of valuation more focus on large and stable business; however,
in recent years, the emergence of technology companies, such as computer &
peripherals or semiconductors, and new technology firms, such as Dot.Com
companies, reveals an interesting argument that how conventional valuation
models are adopted in valuing these technology firms with features of limited
history and/or negative earnings. Darmodaran (2000) develops some new ways
from traditional model by using adjusted Discount Cash Flow (DCF) method to
evaluate technology companies.
A specific case study of BenQ‟s failure to takeover Siemens Mobile Division in
2005 is investigated here. Although the target – Siemens Mobile Device Division
is not a dot.com business, its features of negative earnings and limited history in
technology firm category are still qualified to be employed by adjusted Free Cash
Flow valuation for its business value. Besides, how the discount rate and growth
rate play their influential role in the business valuation process is examined as
well. Meanwhile, the difference between valuation result and real price in this
deal is discussed to explore other implications associating with the motives of
the acquisition and other causes influencing value calculation.

8
BenQ Corp., acting as an original electronics manufacturer (OEM) for global
brands such as Nokia and Motorola, is a well-known company in Taiwan but
lacks global branding to speed up its own brand mobile phone business. As a
result, to change in the company‟s incumbent business phase through the
buyout activity become BenQ‟s priority to expand its marketing network (Qisda
Annual Report, 2004). Siemens AG, the largest engineering conglomerate in
Europe, has three major businesses including the healthcare, industry, and
energy with 15 operation units (Siemens AG Annual Report, 2004). Yet, the high
competition and design lag in new products caused continuous price-wars to its
handset sales. Thus, Siemens AG decided to sell the loss-making handset
business (Canibol H.P., 2006). In September 2006, BenQ Mobile filed for
bankruptcy and it raised a widespread criticism against BenQ and Siemens
(Wearden G., 2007).
This case study is significant in its own right but is also a mixture of diverse
issues which involves financial evaluation, culture management in cross-broad
circumstance, shareholder value maximisation and principal-agent problem as
well. The objective of this paper is to stress on the evaluation on the target
company during the pre-acquisition period, which requires careful due diligence.
Besides, the success of post-acquisition integration is highly relevant to the
management strategy. Inefficient managerial practices not only delay the
resource transfer and experience sharing but also interrupt the conduction of
internal operational policies. The worse matter after an acquisition would be
synergy that is not be produced as expected early and continuing operation
expenditures that cause a severe financial burden to the acquirer and even
change its capital structure. Once the acquirer cannot bear the pressure
financially, it has no choice but to give up the merger even and therefore attract
criticisms for the resulting unemployment. As a result, this implicate topic in
corporate social responsibility (CSR) to go against company‟s profitability, which
represents shareholder value maximisation. Furthermore, the M&A drivers,
investment banks, play an important role to match up the transaction in the
modern era; thus, this paper also examines the interrelation between their
business motives and principal-agent problem in organisations involved in M&A.
The extended topics bring cross-border discussion and potential for more in
depth research suggested for subsequent investigations. This has both

9
theoretical and practical implications, which conclude that a single factor, such
as financial evaluation, cannot accomplish a successful acquisition; there are
other essential and crucial elements that supplement the financial valuation in a
more appropriate and objective way. All in all, the future projection is to be
made on the basis of every aspect in the business world.

10
1. Methodology
Shareholder value maximisation is regarded as a goal of an enterprise in order
to pursue sustainable growth. In spite of the challenging and competitive
environment continuing to weaken business profitability, a foresighted enterprise
can still retain or even strengthen its value and core competence through a
serious of strategic activities. The strategy of Mergers and acquisitions (M&A) is
one of highly possible routes that enable a firm to obtain economic benefits in a
relatively short-term horizon. However, the failure of M&A can not only endanger
the future growth of a company but can also cause the prompt loss in existing
business scope and its financial position. Consequently, evaluation of an
enterprise‟s value plays a significantly influential role in the decision making
process of the investment.
This study seeks to understand how an organisation is evaluated by market
multiple and discount cash flow approaches. Moreover, in seeking the possible
answers and recommendations for the questions, a case study approach is
adopted. The case is based on the secondary information which includes annual
reports, magazines, newspapers, and official announcement of firms‟ web sites
to analyse and outline the outcomes. The value estimation of the target
company will be worked out and compared with its real price of the takeover to
arrive at the analysis in depth. Furthermore, a case study is fitting because other
non-financial factors should be concerned as well in the evaluation analysis
although they are restrictedly incorporated or often ignored in the consideration
of M&A activity. The aim in this case study highlights that in keeping with the
appropriate financial valuation is a key to step in the successful opportunities of
business expansion. In the meantime, the alignment with „soft‟ considerations in
strategic policies, such as cross-broader management, integration of culture
difference, and appropriate recommendations of investment bank to the choice
of M&A activity in a changing market underpins a successful acquisition with
outstanding performance in the long run. Conversely, the acquirer may be put in
a highly risky position with exhausted resource if the takeover fails.
Although the enterprise value has various definitions, such as liquidation value,
book value, fair market value, and collateral value, and it depends on different

11
purposes to deliver meanings for specific users. In this paper, the enterprise
value reflects the market value in terms of the financial stance. Prior to the
evaluation of the target company, there are essential aspects which should be
examined as well. Firstly, the background incorporating its business vision,
management goals, product scopes, market position, competition analysis,
industrial trends, and future prospects. Moreover, to explore the historical
financial statements in terms of ratio analysis is helpful. Even though financial
statement is backward-looking, it still implicates useful clues that could be
analysed to get further comprehension with regarding to the historic policies and
management patterns in companies which are interested in M&A activities.
Meanwhile, risk analysis which includes qualitative and quantitative
determinations helps investors to well identify the real value of the target firm.
In the process of evaluation, the determinative reasons to appraise the deal of
Siemens Mobile Division taken over by the BenQ by using market multiple and
discount free cash flows approaches are as follows. Firstly, brand marketing is
the primary concern for BenQ to acquire Siemens Mobile Division. Besides,
Siemens‟s completed distribution channels in European market can underpin
BenQ to establish and expand its product position to cross Asia and move
forward. Thus, the expected revenue of Siemens Mobile Division can be
estimated and then discounted to generate its enterprise value. Secondly,
globalisation eliminates national boundaries and the merger of Siemens
handsets enables BenQ become the 6th largest marker in the world (Nystedt D.,
2005). As a result, the comparators can be selected from the major global
competitors with public financial statements and their estimates of value can be
assessed by market multiples. On the other hands, the consolidated financial
statements of Siemens group provide limited information with regard to its
mobile division. Therefore, access to two valuation methods could be
implemented under conditional assumptions associating solely to merely
Siemens handsets business. The detailed assumptions and presuppositions are
described in the next section.
Discount free cash flow (DCF) approach focuses on the generation of future cash
flows. The value of the firm equals the sum of projected cash flows for a
planning period, which pluses a terminal value and then discounts the amount

12
back to the present date. As a result, synergy is demanded to be included if the
information is sufficient to help develop reasonable perdition (Stampf et al.1992).
There are three steps of DCF analysis laid out as follows.Step1: estimate the
planning time and the amount of expected free cash flows (FCF). FCF can be
expressed as the result of formula that Profit before Interest and Tax (PBIT) +
Depreciation Expense - [Changes in Working Capital]-Net Investment in Fixed
Assets –Tax. The FCF comes from the initial planning periods and the end of
projected period. In general, market multiple and perpetuity assumption with
appropriate discount rate are two ways to capitalise the expected earnings.
Step2: find out the risk discount rate. To an investor, it is an expected rate of
return or the required cost of capital. Weighted Average Cost of Capital (WACC)
is adopted here to evaluate the risk. However, the inherent limitation probably
provides insufficient information. This is because the method merely discounts
the cash flow by a singular expected return rate that may reflect restrictively all
the cost and benefits if the original capital structure is changed. Step3: calculate
the enterprise value (EV), the present value of the expected cash flows, and
share value comes out after the EV is divided by the share numbers. Although to
project future earnings is difficult, to develop varied business operations and to
consider historical operation performance is necessary to narrow down the
possible errors and distortions.
Furthermore, a market comparison approach is applied in the analysis as well.
How much a company worth, which is trusted by investors, is worth within the
market and what a picture that market multiple would like to indicate.
Accounting principles and disclosure requirements that vary in different countries
may affect results and the ideal comparable company that are similar to the
target company is unlikely to be found in every aspect (Stampf et al.1992).
Moreover, the well-functioning market is not the proposition; thus, the share
price may be affected by subjective factors. Meanwhile, the future growth value
is probably underestimated. In spite of the possible drawbacks and limitations
for this method, the major purpose of DCF method adoption is to complement
with each other and to make the evaluation more reliable. Therefore, in the
market multiple analysis, the differences of accounting and related principles in
these comparable firms are ignored, and the inflation expectations, general

13
economic and political risks in this analysis are supposed to be same as well in
the market multiple approach.
In this selective case study of Siemens Mobile Division acquired by BenQ, its
final result failed and the period of acquisition merely lasted one year after the
official announcement. Hence, possible factors which are hidden behind this
failed case are worthwhile enough to be examined, except for the company
valuation in pre-acquisition. As for what is mentioned in the previous section,
resource integration of two different firms bears relatively high risk. If the
expected cash flow does not take this aspect into account, overestimated return
and underestimated threats can occur. The connection between financial and
non-financial considerations before and after the M&A forces the synergy to be
generated in different degrees. Moreover, there is no exactly accurate evaluation
of an acquisition but how it closes to a real situation in the business world.
Different buyers might interpret a same target firm in various values because
they aim at creating different synergy from business viewpoints.
Although outcomes of M&A performed relatively high failure according to the
historic records, the trend does not be ceased or decreased. In many cases,
investment bankers who bring financial expertise and capabilities play an
intermediary role in bridging sellers and buyers. Through channels provided by
investment banks, the transactions of M&A may not be time-consuming and
consist of costly activities because buyers who express an interest in acquiring
can find out the target quicker than they process by themselves and vice versa.
The abundant resources and information that investment banks have, offer
acquirers access to the expertise in valuation and negotiation (Sherman A.J. and
Hart M.A. 2006, P38). However, M&A business in investment banks generate
their major revenue with relatively lower expenses compared to other business
lines. High commission base, at least 1% of the transaction deal, drives advisers
to match up the M&A (Mergers & Acquisitions, 2009). Under this condition,
would the role of investment banks in the negotiating process of M&A strengthen
principle-agent problem in acquiring or target firms? In particular, if managers
with a hubris tendency (Roll, 1986) pursue growth maximisation complying with
an adviser‟s attractive packaging on the „commodity‟, would it enables the

14
acquirer overlook potential risk and make wrong decisions? This is another issue
that will be explored in this study.

15
2. Literature Review
2.1 M&A Theories
Mergers and acquisitions (M&A) involves a complicated and challenging
processes not only to corporate and financial strategies but also to the
management science of buying, selling, and the integration of different
companies. “Mergers” and “acquisition” are different in their definitions. In a
merger, a new organisation comes out after the combination of two individual
firms and both forms end to exist. This pattern, known as “consolidation” as well,
produces a new company name and complies with a new branding. Acquisition,
which is known as “buyout” or “takeover” synonymously, implies that the power
of ownership and management is transferred to the acquiring companies for
business operation. There are two basic types in payment implicated here. One
is the acquisition of shares. The board of acquirer raises the offer for the voting
shares of another company. The target of this offer can be the board of the
acquired firm or a tender offer to the public. Another type is the acquisition of
asset. Part or all of the assets of the target company involves the title transfer to
the acquiring firm (Muller D.C., 1969).
Turning to Buckley P.J.(2002), one finds out that mergers and acquisitions can
be conventionally classified in terms of economic effects as well. Firstly,
horizontal merger means that two firms produce similar products in the same
sector and the combination can enlarge the scale of economic to reduce
production cost, expand the market share with better pricing power, increase
debt capability and possible tax benefits, and reduce redundant expenditures in
R&D, equipments, and related management cost. In addition, vertical merger
indicates that two companies in the same industry have business correlation.
Forward integration and backward integration are two patterns of this merger.
The advantages include reducing transaction cost, stabilizing material supply and
quality assurance, completing distribution channels and flexible inventory
management, and enhancing technology innovation. Furthermore, two
companies that operate different business lines in the same industry are defined
as congeneric merger. Finally, two organisations which operate in different
sectors without business correlations and are integrated to generate benefits,

16
such as decreasing financial risk and increasing management efficiency, are
called conglomerate merger. To further decompose this merger, incorporating
market extension, product extension, and pure conglomerate mergers are three
patterns (Kitching J.1967).
A study by Frank J.R et al.(1988) show that M&A can be classified in terms of
payment. First of all, cash payment to the target firm is the first way; yet, the
acquiring company may bear higher risk in cash capability and interest expense.
In the mean time, shareholders of the target company may be required taxation
payments of capital gains. Another method is share swap. When ordinary
common stock of the acquiring company is swapped, the ownership would be
decentralised. The new issuing of common stock would probably dilute the
acquirer‟s share price; whereas, for target firms, remaining as shareholders in
the acquiring firm can make the merger succeed more easily. Preferred shares
swap could be an alternative to retain the bidder‟s ownership and provide
attractive motives for shareholders of the target company with priority over
shareholders of common stock in the payment of dividends. Meanwhile, Brigham
E.F. and Gapenski L.C. (1994) classify the M&A as a financial merger and
operation merger. The acquiring and acquired companies seek lower operation
risk which is the motive of a financial merger. Moreover, the combination of two
companies in a related industry is expected to produce operating synergy which
enlarges business scales and increases the market share.
Since the 19th century, the world has experienced five waves of M&A,
accompanying diverse motives. In particular, many researches discover that
M&A often appears to have a multitude of motives rather than single one.
Schmidt and Fowler (1990) examine the motives of M&A in terms of value and
non-value maximisation. Value maximisation includes the “Efficiency Theory”
and the “Information and Signalling Theory”, as well as the “Market Power
Hypothesis”. Non-value maximisation incorporates the “Principle-Agent Problem”
and “Managerialism”, the “Cash Flow Hypothesis”, and the “Value Re-distribution
Theory”. Brief descriptions are listed in the following paragraphs.

17
A. Value maximisation
1. The Efficiency Theory indicates that the expected cash inflows of post M&A
exceed individual firms‟ performance. In other words, VT >(VA + VB), the total
market value of the combined firm generates more synergy than the individual
market value of firm A and firm B. Three other theories are derived from this
theory.
1.1 Operating Synergy Theory
This theory illustrates that synergy comes from the scale of economics,
transaction cost, and management differentiated efficiency to uplift the
production and organisation efficiency (Schmidt&Fowler,1990).
1.1.1 Scale of Economics: A horizontal merger reduces overlapped investments,
which enhance production efficiency by the reallocation of production resources.
Vertical mergers can help firms decline communication costs and bargaining
costs. Conglomerate mergers utilise complementary resources to produce
synergy.
1.1.2 Transactional Cost Economics: Williamson (1983) highlights that if a firm
engages in a diversified conglomerate merger, the business operation of each
division can be well understood and can enable managers to make efficient
decisions in resource allocation.
1.1.3 Efficiency of Managerial Difference: Copel and Weston (1979) clarify that a
better performing acquirer can manage and improve a target company‟s
operation efficiency.
1.2 Financial Synergy Theory
Diversification of post-M&A can produce a coinsurance effect which enables
companies to have opportunities to lower their debt costs. Amit and Joshua
(1988) suggest that enterprise should aim at diversification of business
operations. Seth (1990) believes that diversified businesses can help to stabilise
a company‟s cash flow, and hence lower the operation risk. However, Sarnat and
Levy (1970) explain that in a well functioning market, shareholders can diversify
corporate risk through purchasing investment portfolio with lower cost in the
market. Therefore, takeover would not be a better alternative to fulfil
shareholder‟s expectations. Lewellen (1971) insists that in a well functioning
bond market, the combination of cash flows from acquiring and acquirer firms

18
create co-insurance function to lower debtors‟ liquidation risk for creditor to
provide more capitals.
1.3 Market Power Hypothesis
Shepherd (1970) indicates that to weaken competitors‟ competence and to
decline the numbers of competitor by takeover could strengthen the firm‟s
market power. Meanwhile, suppliers can obtain abnormal profits in terms of
monopoly and oligopoly power. Singh and Montgomery (1987) examines that
the higher market power increases a firm‟s influence on pricing, quantities, and
characteristics of products and then synergise the margins.
1.4 Information and Signalling Theory
The information disclosed during the process of M&A enables investors to re-
evaluate a company‟s value and the acquired firm could enjoy increased share
price. In other words, the empirical evidence points out shareholders in the
target company benefits at the expense of shareholders in the acquiring
company.
1.4.1 Kick-In-the Pants Hypothesis
The arrival of share purchase agreements for the target company drive its
managers to carry out more efficient operation strategies and ensure the value
of the acquired firm.
1.4.2 Sitting-On-A-Gold-Mine Hypothesis
The message with regard to the target company‟s undervalued share price would
be released during M&A activity and it enables market investor‟s to re-evaluate
its share price.
B. Non-Value Maximisation
1. Principle-Agency Problem & Managerialism
Jensen et al. (1976) suggests that managers may have different interests to run
the business as what owners wish. Therefore, agent cost is produced to monitor
manager‟s activity and to avoid potential conflict in an organisation.
1.1 Takeover reduce principle-agent problem
Fama and Jenson (1983) claim that in case of the separation of ownership and
management in an organisation, internal mechanisms can be adopted in order to

19
control and evaluate the decisions making process. Manne (1965) suggests that
if managers do not perform well and cause share prices to decrease, shares of
the company may encounter the risk of being taken over.
1.2 Managerialism
Managers pursue personal interest and decision-making policy of non-value
maximisation which scarify shareholders‟ benefits.
1.2.1 Growth Maximization Hypothesis
Muller(1969) believes that rewards of managers are positive co-relation with
scales of companies. Thus, managers prefer to expand the scale by M&A but
potential risk of lower expected return may be ignored.
1.2.2 Free Cash Hypothesis
Jensen (1984) claims that if excessive cash, free cash flow, is retained in a
company, managers probably invest in unprofitable or lower return projects,
such as M&A activity. It is the major conflict between managers and
shareholders in an organisation.
1.2.3 Diversification of Management‟s Personal Portfolio Hypothesis
Amihud & Lev (1981) suggest that managers‟ worry about losing their jobs if a
firm fails to achieve business or confront the bankruptcy risk. Consequently,
takeover activity becomes a good strategy to reduce risks of companies by
diversification. Yet, Lewellen & Hunstsman (1970) discovered that the rewards of
managers are highly correlated with profitability rather than company scale.
1.2.4 Hubris Hypothesis
Roll (1986) suggests that managers fail to evaluate favourable takeovers due to
their overconfidence and over-optimistic attitudes, which underestimate the risks.
As a result, the acquisitions not only generate no synergy gains but also damage
shareholders returns.
1.2.5 Free Cash Flow Hypothesis
Jensen (1986) thinks that the major reason to carry out takeovers is because of
the use of free cash flow leads to conflicts between managers and shareholders.
On the other hand, this theory claims that free cash flow should be returned to
shareholders in terms of dividends or share repurchase plans. Furthermore,
managers should invest in projects by debt borrowing and agency costs can be
lowered through monitoring by creditors. In other words, increase the ratio of
debt to equity to minimise the agent problem is supported under this theory.
20
Moreover, the research of Kitching (1967) suggests that financial synergy
performs better than production and technology synergy, followed by marketing
synergy. Ansoff (1971) finds out that in the manufacturing industry, the synergy
of distribution channel, sales and marketing, and technology development are
highly generated by M&A. Weston & Mansinghka (1971) states that a
conglomerate merger enables the company to create higher market value and
growth rate. Hoshino (1982) indicates that in the post-M&A, the liquidity of the
firm can be improved with decreasing profitability and ratio of debt to equity.
Mueller (1985) discovers that acquired firms under conglomerate mergers or
horizontal mergers, caused the market share to decline rather than increase to
what is expected. Fowler & Schmidt (1989) implies that acquisition does not
improve operation performance but also produces negative influence. Healy,
Palepu and Ruback (1992) conclude that when an acquirer and a target company
are in a related industry, the return on operating cash would be significantly
increased. Banerjee& Eckard (1998) investigate that M&A activity enhances a
company‟s market value by 12%-18% as a result of the better operating
efficiency rather than gains on monopoly power.
2.2 Financial Valuation of M&A
2.2.1 Defining Values
To investigate potential value, Reilly (1990) suggests that there are
preconditions of enterprise value which required clarification before the
evaluation. According to Reilly, there are seven definitions of value.
A. Fair Market Value
It is an estimate of the market value of market value of a good, service, and
assets.
B. Fair Value
It is identified as an unprejudiced and rational estimate of market prices of a
property.
C. Investment Value
It is defined as “the specific value of an investment to a particular investor or
class of investors based on individual requirements; whereas, market value is
“the value of the marketplace” and it is impersonal.
D. Intrinsic or Fundamental Value

21
It stands for “an analytical judgement of value based on the perceived
characteristics inherent in the investment, not tempered by characteristics
peculiar to any one investor, but rather tempered by how these perceived
characteristics ate interpreted by one analyst versus another”.
E. Going –Concern Value
It represents value in continued use, as a going-concern business entity, and as
a grouping of income producing assets, such as intangible assets, goodwill, and
talented workers.
F. Liquidation Value
It shows value in exchange, as part of a forced liquidation; this foundation
reflects that the business enterprise‟s assets will be sold individually
G. Book Value
This is the value of an asset shown on the balance sheet in accounting. In
traditional term, book value of a firm is its total asset less liability and intangible
assets.
2.2.2 Approach of Business valuation
According to Pratt S.P et. al.(2000), there are four major methods of business
valuation.
A. Asset-Based Approach
This approach is developed on the basis of a firm‟s asset cost (Gordon V. Smith,
1987; Robert Reilly, 1992).The net asset value of a target company and the
value of equity can be evaluated by subtracting value of liability from the value
of assets. When the M&A activity involved in the acquisition of the assets, this
approach is the common way to estimate the value on the basis of financial
statements. However, the limitation of intangible asset appraisal is its weakness
and the various accounting systems probably affect results. In the meantime,
this approach consists of book value, liquidation value, and replacement value
elements.
(A-1) Book Value Method
The book value of a firm is the historical cost of the firm‟s total assets less the
recorded liability. Meanwhile, it can be also calculated as the sum of the owner‟s
equity investments in the organisation plus the accumulative amount of the
firm‟s retained earnings. However, book value dose not equal economic value
22
and the cost-based balance sheet ignores intangible assets and contingent
liabilities.
(A-2) Liquidation Value Method
The asset value of a company equals the outcome that liquidation value of asset
minus liquidation value of liability. This approach ignores a firm‟s profitability
and going-concerned value. Meanwhile, when a company is going bankruptcy or
attempting to close business operation, this method may be implemented for
further reference.
(A-3) Replacement Value Method
Replacement value is to estimate the cost of replacing the property to be valued
with a similar property on the basis of existing price level. Yet, the replacement
value of asset is not easy to be calculated accurately and it does not consider
going–concerned value of a firm as well. Therefore, this approach could be
applied when the target firm with replacement value of asset which greater than
that of profitability in the merger process.
B. Profitability Evaluation
Wiese (1930) suggests that to discount expected future cash flows is the
appropriate value of security and should be implemented in a firm‟s valuation. It
emphasises that a firm is a “going-concern entity”. O‟Bryne (1996) points out
growth value of a company may accounts for 70% or above of its market value.
The disadvantage of this valuation is the ignorance of a target company‟s asset
value and results may be distorted by financial projections, whereas this
valuation is commonly recognised as a more suited approach to assess a
company because it takes account of profitability, growth value, and business
risk. This valuation comprises four major methods.
(B-1)Dividend Discount Valuation
It demonstrates that the value of a share is the present value of expected
dividends through infinity.
Value per share of stock= 𝐸(𝐷𝑃𝑆𝑡 )
(1+𝐾𝑒)𝑡𝑛=∞𝑡=1
Where DPSt= Expected dividends per share; Ke= Cost of equity

23
Nevertheless, to project accurate expected dividends is challenging. A dividend
policy belongs to a man-made decision which could not fully represent a firm‟s
value. Furthermore, issuing dividends could not enable a promotion of a
company‟s value because the company may have insufficient working capital to
invest, therefore, barriers of the company growth is probably produced.
(B-2)Accounting-Based Discount Valuation Method
This approach substitutes dividends for net profit after taxes as the major source
of profitability. In particular, retaining earnings remained in the company would
create more cash flows to increase enterprise value. But accounting principles
and rules affect results easily and the inflection is not taken into account.
P0= 𝑋𝑡
1+𝑟 𝑡 ∞
𝑖=1
Where P0 = Payoff; Xt =net payments to equity holders;
r = cost of equity; n=the number of period
(B-3) Discount Free Cash Flow Method
It is forward-looking and is not tied to historical accounting values. It focuses on
cash flow rather than profits and reflects investment inflows and outflows. It
recognises the time value of money. Meanwhile, it could evaluate intangible
assets better than other approaches (Bruner R.F. 2004). Conversely, the
complexity of getting detailed information to accomplish complete analysis is its
weakness.
P0= 𝐶𝐹𝑡
1+𝑟 𝑡 ∞
𝑖=1
Where P0 = Payoff; CFt =cash flow in the n period;
r =required rate of return; n=the number of period
(B-4)Adjusted Present Value Method
To determine enterprise value, discount free cash flow at the unlevered cost of
capital firstly and then add the present value of financing side effects, such as
the interest tax shield, to arrive at the result. Moreover, this method can be
implemented when the company encounters a change in its capital structure.

24
C. Market Comparative Appraisal Approach
According to market efficiency theory, in the long run, market value could be the
most valuable signal which reflects a real value of a company. This valuation of a
target company in the M&A involves finding out similar companies that are
comparable to the acquired firms and then to compare their financial
performance and associating linkage of market value. When the comparator and
the target firm perform similar features in business operation and explore
potential risks in the future, the estimation of the firm‟s value would be more
reliable. The analysis includes various multipliers, such as price/earnings,
price/book value, and price/cash flow.
VI =𝑉
𝑓 × F
Where VI = the value of the target firm; 𝑉
𝑓 = market multiplier of the similar
company; F = financial variables of the target enterprise
(C-1)Price/Earnings Ratios: This calculation is an easy and common way to
reflect a firm‟s status in the business market. P/E rises when a firm is expected
to have good prospect, and vice versa. Yet, projection with errors could cause
the share price evaluated inaccurately. Meanwhile, it is meaningless when the
EPS of a company is negative and the accounting rules are varied. On the other
hand, this model has positive interrelation with the dividend issuing ratio.
(C-2)Price/Book Value Ratios: This model can be adapted when a firm performs
negative profits and it provides relatively stable tool to be compared with market
price. On the country, book value is influenced easily by depreciation and an
enterprise could manipulate ROE to raise this ratio which mislead investors in
the market. Moreover, book value of equity would be negative probably if the
firm remains a loss profit in the long run.
(C-3)Price/Sales Ratios: Sales is not tied to the accounting rules, and this ratio
possesses smaller variation than prior two ratios. Besides, it can be employed by
a firm that encounter difficulties; thus, this ratio is relatively reliable. However, if
a firm has the problem of cost control which could not be sort out by this ratio,
the valuation may be misguided as well.

25
D. Real-Options-Based Evaluation
Shareholders have residual rights over the cash flows of the company after the
enterprise value is deducted by existing rights of creditors in debt contracts.
Therefore, the nature of equity and debt in an option pricing mechanism is worth
to be considered. Shareholder equity could be viewed as a call option and the
shareholders are the holders of call options, which are under the condition that
the value of the call option is defined by market value; subsequently, if the
enterprise value does not exceed the exercise price of a call option, the
shareholders will not exercise the option, because shareholders do not get any
payoff. In contrast, when the enterprise value exceeds the borrowing cost
including paying the interest and repaying the debt, the option will be exercised
by shareholders and the shareholders obtain the payoff that the borrowing cost
is removed from enterprise value. The major advantage of this valuation is
capturing the managerial flexibility of a project that may be ignored by
traditional NPV analysis. It helps decision maker to consider whether or not to
invest in a new project at present or in the near future, or to contract, expand,
or give up an ongoing investment. In other words, managers could be capable of
adjusting their investment project under various market situations to further
pursue profit maximisation for their organisations. Black–Scholes (1973)
suggests the following model to value share price.
S=V × 𝑁 𝑑1 − 𝐵 × 𝑁(𝑑2) × 𝑒−𝑅𝑓𝑇
2.2.3 Valuation Process of Business
Copeland, Koller, and Murrin(1994) suggest five steps required.
A. Analyse historical performance
(A-1) Calculate NOPLAT and capital investment
(A-2) Work out value drivers
(A-3)Build-up a historical prospect as a whole
(A-4)Analyse fundamental finance structure
B. Project free cash flow
(B-1)Differentiate sources of FCF
(B-2)Develop scenarios of performance
(B-3)Decide assumptions of forecast
(B-4)Examine rationality of the prediction

26
C. Estimate cost of capital
(C-1)Decide the weight of value of the target
(C-2)Calculate cost of capital of non-equity securities
(C-3)Calculate cost of capital of equity securities
D. Approximate going-concern value
(D-1)Choose adequate instrument
(D-2)Decide forecast periods
(D-3)Calculate parameters and prioritise their importance
(D-4)Discount the value
E. Work out the outcome and give explanation
(E-1) Calculate and examine the result
(E-2) Based on the result to clarify the implications
In the last two decades, the discount cash flow approach is the most popular
valuation in the share price of the target company. Yet, in the study of Caugh &
Meador (1984), it indicates that the variables of prospect of the industry,
expected EPS, and economic environment, and are the most important signals to
evaluate short-term of share prices. In the long-run, expected EPS, expected
return on equity, and prospect of the industry are crucial accesses to more
accurate analysis. Lippitt & Astracchio (1993) conclude that the discounted cash
flow (DCF) method and earning capital model are suitable for small and medium
size enterprises (SMEs).The earning capital model is based on historical data to
project future earnings and it appears lower uncertainty compared to the DCF
approach. As Pratt (1989) states the results can be equivalent to the present
value of future earnings by adjustment of past earning records, such as inflation,
depreciation, and replacement assets.
On the other hand, according to the research of Hickman & Perty (1990), while
the target firm is not a publicly trading business, Market Multiple and Dividend
Discount methods are appropriate for the valuation. In particular, Price/EPS
helps predict more accurate share price than Dividend Discount analysis due to
the errors in discount rate that is estimated by CAPM formula. A study by Guatri
L.(1994) shows that market value of equity is differ from book value in three
aspects. Firstly, the performance of financial activities, sales and marketing
management, and innovative capability in research and development are

27
observed from shareholders‟ equity on the balance sheet of a company. In
addition, in pursuit of shareholder value maximisation is a fundamental objective
of the organisation. In other words, to optimize the market value of equity in
terms of the net income that a firm produces is what investors concern.
Although varied financial evaluation approaches enable the acquirers‟ access to
relatively reliable value of target companies, the high uncertainty and risk still
cause over half of underperformance or failed rate of M&A activities in the
historical records. Moreover, Table 2 reveals the announcement period of
abnormal return in 1980s and 1990s.It is obvious that the acquirers‟ share price
shows a decreasing trend after the takeover is announced, but acquired
companies are in a reversed pattern which increases in its value. In other words,
the investors in the market show low confidence to acquirers relating to the
creation of additional value by acquisition.
Table2. Announcement Period Cumulative Abnormal Return by Decade
1980-89 1990-99
Target
[-1,+1] 16.0% 15.9%
[-20,close] 23.9% 23.3%
Acquirer
[-1,+1] -0.4% -1.0%
[-20,close] -3.1% -3.9%
Resource: Andrade G., Mitchell M., and Stafford E. "New Evidence and Perspectives in Mergers"
Journal of Economic: Perspectives, Vol.15, No.2, Spring 2001, pp.103-120.
Goold and Campbell (1999) also suggest that the four main reasons which cause
the failures of M&A are: the overestimations of synergies, the confidence that
synergy can be emerged by strengthening cooperation, underestimation of the
difficulties in resource integration, as well as the ignorance of risky probability in
synergic production. Haspeslaugh and Jemison (1991) classify activities of M&A
as four theories which are illustrated as follows.
1. Capital Market Theory
This theory believes that M&A can create wealth for shareholders and social
economy. CAPM, Cash Flow, Efficiency Market, and Agent theories are embodied;
28
while, they provide limited explanation relating to the underperformance of M&A
activities in the world.
2. Strategic Management Theory
It centres on how to generate synergy and reduce conflicts in an organisation by
fitting in adjusted strategy after the acquisitions. Fowler and Schmidt (1989) and
Kitching (1967) think that market share and market scale are the most possible
factors driving the outstanding post-M&A performance.
3. Organisation Behaviour Theory
This theory focuses on the implementation of efficient management which deals
with risk, human resource and cultural aspects. In particular, Jenson (1998) and
Nahavandi and Malekazadeh (1988) examine the cultural differences between
two organisations which may enable the managerial barriers to become enlarged,
whereas the successful cultural integration and the efficient interaction of
individual strengths within the firm in the post-acquisition that brings positive
changes of behaviours are dramatically important.
4. Procedure Theory
This concept integrates theories of strategic management and organisational
behaviours. It not only reveals the possible factors which affect the results of
acquisitions from the viewpoints of procedure but also provides how the final
outcome of takeover is caused by the process of strategic decision-making and
integration. Therefore, the efficiently managerial capabilities drive the potentials
of synergic creations in post-M&A (Greenwood et al.1994).
2.3 Brand Strategy of M&A
With the development of the global market, brand marketing has become an
unavoidable trend to drive higher market share of products and service.
Therefore, building up a global strong brand is the most powerful weapon to
create a new market. Doyle (1990) highlights that there are two methods for a
company to create its brand name; one is building brands and another is buying
brands. When an enterprise with strong marketing competence and research
capability in a significantly growing market, adopts a “building brand” strategy,
this is a good opportunity to foster its branding. However, if a firm does not
have advantages in marketing and technological innovation, to acquire a brand
by relatively lower costs as an alternative.
29
Brand formation is a long-term process with the accumulation of experience,
knowledge, and competitive resources. The completed international marketing
strategy and practical operation with good quality and specific features of
products require expensive marketing expenditures. It may become a company‟s
financial burden. Through M&A activity, a firm can shorten its learning curve
whilst building a brand and obtain an existing market share of a target company.
Furthermore, Aaker and Joachimsthaler (2002) mentioned that acquiring brand,
acquired brand, and co-brand are three patterns of brands. In particular,
consumers in developed countries have higher confidence and preference in their
domestic brand. Under this condition, if the target company is located in
developed countries, implementing strategies of acquired brand or co-branding,
will create influential power.
Biel (1992) argues that brand equity can be viewed as the excessive cash flow,
which is generated after products and services are combined with branding.
Simon and Sullivan (1993) suggest that brand equity should be defined as the
difference of cash flows between products with brands and non-branded
products. Brasco (1988) concludes that brand equity is the total present value of
current and future earnings and the brand value should be considered as the
intangible asset of a company‟s financial statement. On the other hand, Stobert
(1989) thinks that brand equity is a replacement cost. Brasco and Stobart (1988)
define it as liquidation value or synergy which should be taken into account for
M&A evaluation. The Marketing Science Institute brand equity is the additional
value of a brand name, and it enables companies to obtain more market share
and better profitability. Meanwhile, brand equity is a set of customers, channels,
and an awareness of branding advantages.
2.4 Cultural Difference of M&A
Hofstede (1994) identifies national cultural differences to five dimensions (see
Table 3).
1. Power distance
It is the level which individuals with less power in organisations or institutions
accept and desire that the power can be released unequally.

30
2. Individualism vs. Collectivism
It is the degree to which members are willing to be incorporated in the same
groups and pursue success of a team rather than individual achievement.
3. Masculinity vs. Femininity
It indicates the distribution of roles between sexes which is expected to be
performed in terms of conventional viewpoints.
4. Uncertainty Avoidance
This implicates the tolerance of a society toward uncertainty, ambiguity, and
failure. Besides, it is the extent to which an individual pursues the truth and
rejects the unstructured conditions.
5. Long Term vs. Short Term Orientation
It stresses the pursuit of a virtue rather than the truth. Values of long term
orientation are thrift and perseverance. Values of short term orientation are
giving “face” to someone, fulfilling social responsibilities, and respecting tradition.
In this study, theories of capital market and organisation behaviour, in particular,
the cultural issues in the cross broad M&A are stressed in terms of a case
research. Consequently, it involves not only the financial valuation that helps
firms to evaluate future cash flow and potential financial benefits from branding
equity and marketing expansion, but also the integration of national culture,
which accounts for fundamental factors to affect related decision-making
processes and strategic management. Not all of the risks and problems would be
expected to be discovered before the takeover, therefore careful examinations in
possible conditions and solutions should be considered and an attempt should be
made to find out the correlation between managerial capability and synergy
desired after the M&A activities. Finally, the success rate of a M&A may be
improved with higher returns that than what are expected.
Table 3: Five Dimensions of National Culture Difference (Hofstede, 1994)
Dimensions Small Power Distance
Societies
Large Power Distance Societies
PDI Hierarchy means an inequality of roles, established for
convenience
Subordinates expect to be consulted
Ideal Boss is resourceful
Hierarchy means existential inequity
Subordinates expect to be told
what to do Ideal boss is benevolent autocrat

31
democrat
Collectivist Societies Individualist Societies
Individualism
vs.
Collectivism
Value standards differ for in-
group and out-group:
particularism
Other people are seen as members of their group
Relationship prevails over
task Moral model of employer-
employee relationship
Same value standards apply to
all: universalism
Other people seen as potential
resources Task prevails over relationship
Calculative model of employer-
employee relationship
Feminine Societies Masculine Societies
Masculinity vs.
Femininity
Assertiveness ridiculed Undersell yourself
Stress on life quality
Intuition
Assertiveness appreciated Oversell yourself
Stress on careers
Decisiveness
Weak uncertainty avoidance societies
Strong uncertainty avoidance societies
Uncertainty
avoidance
Dislike of rules- written or
unwritten Less formulisation and
standardisation
Emotional need for rules-written
and unwritten More formulisation and
standardisation
Long-term orientation Short-term orientation
Long term
vs. short
term
orientation
Value of thrift and
perseverance
Value of the respect for tradition
Fulfilling social obligation
Protecting one‟s “face”
3. M&A Case Study of BenQ and Siemens Mobile Division
3.1 Background of Handset Market
According to the research of Wireless Device Strategies (WDS) service, the
potential demand of global mobile phone market is expected to grow from 772
million in 2005 to 1,129 million handsets in 2010.The global sales of mobile
phones would expand with average growth rate of 8% year-on-year, but the
wholesale average selling price (ASP) is predicted to decline 11% each year. The
intensive price competition lowers suppliers‟ profits. On the other hand,
expensive research and development expenditures in either low-cost cellular
phone or highly integrated handsets increase suppliers‟ operation risk in the
following years. 3G and WCDMA devices with multi-gigabyte memories, stereo
sound, VHS resolution video and WLAN functions become the major trend. In the
near future, those multimedia handsets called smartphones with an open
32
operating system which can download related applications, such as advanced
imaging, web browsing, music, and email onto the device and run for it.
Moreover, as the cost of memory and processing power continue to decrease, it
is strongly believed that smartphones will drives the glowing demand and even
low cost phones would be added simple applications. Consequently, smartphones
which belong to a niche high-end market in 2005 would no longer exist in the
following years. It is the reason why holding high-end technology not only in
software service but attractive hardware device is the key to win the market and
to threaten competitors and new entrants. IDC survey shows that although the
global shipments of smartphones merely reveal 5%, the prediction in 2010 and
thereafter will over 15%.
According to an investigation by IDC and ITU, in the global market Asia with the
largest population and strong demand in the world has become the most
powerful market in either growth rate or potential size. In particular, China and
India account for 30% and 60% respectively by forecast of shipments growth in
2006. Likewise, the mobile phone market in the Middle East and Africa has
expended rapidly; North America complying with 17% growth rate, whilst
Western Europe‟s remaining 18% potential in 2006 is mainly driven by the
replacement market.
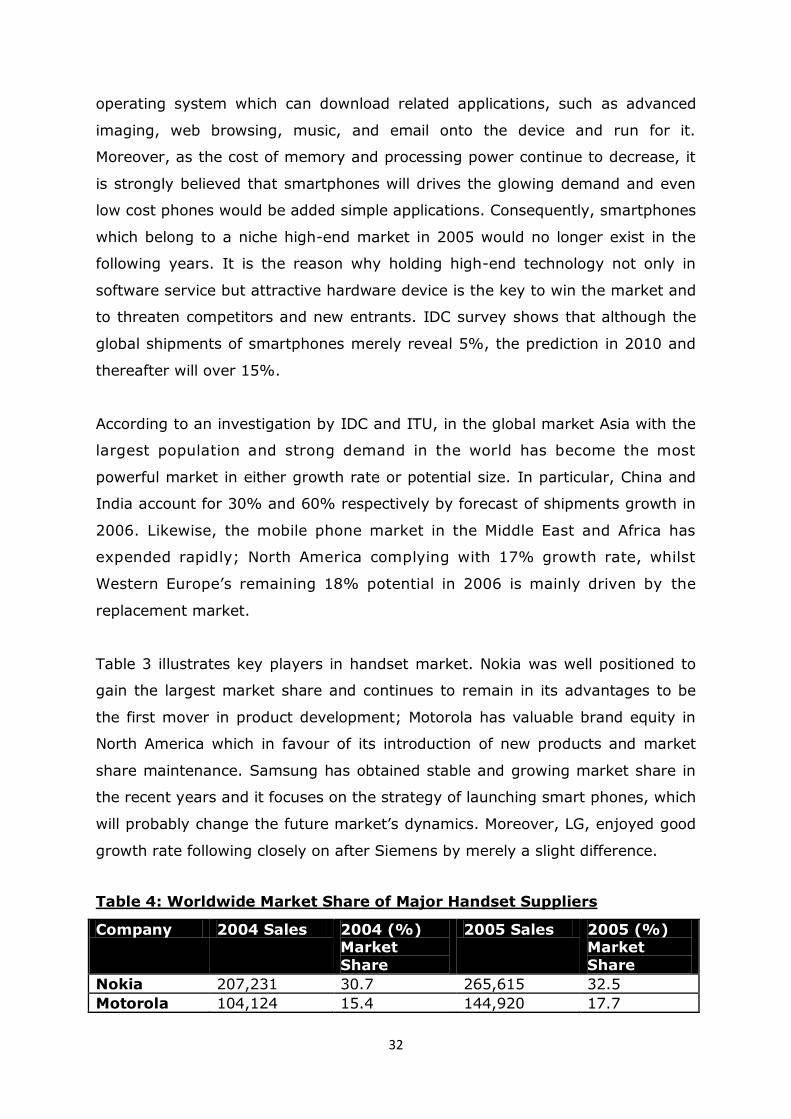
Table 3 illustrates key players in handset market. Nokia was well positioned to
gain the largest market share and continues to remain in its advantages to be
the first mover in product development; Motorola has valuable brand equity in
North America which in favour of its introduction of new products and market
share maintenance. Samsung has obtained stable and growing market share in
the recent years and it focuses on the strategy of launching smart phones, which
will probably change the future market‟s dynamics. Moreover, LG, enjoyed good
growth rate following closely on after Siemens by merely a slight difference.
Table 4: Worldwide Market Share of Major Handset Suppliers
Company 2004 Sales 2004 (%) Market
Share
2005 Sales 2005 (%) Market
Share
Nokia 207,231 30.7 265,615 32.5
Motorola 104,124 15.4 144,920 17.7

33
Samsung 85,238 12.6 54,924 12.8
Siemens 48,455 7.2 54,710 6.7
LG 42,277 6.3 51,774 6.3
Sony Ericsson
42,031 6.2 28,580 3.5
Others 144,644 21.6 166,985 20.5
Total 674,000 100 816,563 100
Source: http://gsmserver.com/articles/mobile_sales_in_2005.php
3.2 Introduction to case
Siemens AG, the largest electronic and engineering conglomerate in Europe,
consists of six major business areas with 15 business units, which generated
€75,445 million revenue in 2005. Siemens has already produced high-end
quality mobile phones since the 1990‟s. However, the fiercely competitive and
highly innovative handset industry drove new players to step forward and any
careless delays on the part of the linchpin may result in unavoidable profit loss.
The handset business contributes to approximately €4,527 million, 6% of
Siemens AG revenue in total (Siemens AG Annual Report, 2004). In contrast,
the mobile device division continuously posted sales losses, from €152 million in
2004 to €135 million in the first quarter of 2005. This predicament forced Klaus
Kleinfeld, the CEO of Siemens, to carry out the organisational reconstructing
plan, which included looking for a buyer to take over the mobile device business
(Canibol H.P. 2006).
BenQ, a Taiwanese electronics and computer peripherals manufacturer with
approximate annual sales of €4,064 million, is a major original equipment/design
manufacturer (OEM/ODM) for global brand customers, such as Motorola and
Nokia. It is headquartered in Taipei with factories in China, Taiwan, Brazil, and
the Czech Republic, and with over 15,000 employees in the world. BenQ has five
main business units, including a Display& Imaging Business Group (DIG),
Networking & Communications Business Group (NCG), Digital Media Business
Group (DMG), and Storage Business Unit (SBU). In particular, DIG is BenQ‟s
core business, focusing on LDC monitors and generating 45% of overall revenue,
followed by SBU, 28%, NCG, 16%, and DMG, 10%. NCG‟s major business is
mobile devices sales; although its revenue had reached €660 million with
increasing shipment of 15.5 million units, in 2004, the majority of those
34
shipments are not sold under the “BENQ” brand name (Qisda Annual Report,
2004). BenQ realised that failing to foster strong brand awareness among the
market and consumers would restrict its business scenarios and scopes and
hinder diversified developments. Besides, with an absence of the accumulation
of customer loyalty due to the brand awareness, the company would be easily
stuck in a dilemma relating to new customer creation or relationship
maintenance of second-buy consumers. In the mean time, with no well-
established mutual interaction with the market and consumers, the company
may be insensitive to the fast-changing tempo in product innovation. This is
believed to be the major concern for BenQ‟s business operation.
While the brand „BenQ‟ was evaluated as one of the top five brands in Taiwan,
the value was is estimated to be worth €268 million which was far behind other
global brands, such as Samsung. The brand value of Samsung was 40 times that
of BenQ‟s in 2005. BenQ was ambitious in expanding its business and to build up
a valuable brand, although its mobile phones sold under the „BenQ‟ brand merely
accounted for the minority of its overall shipments. However, the lack of a
potential global demand market to underpin its value creation resulted in
difficulties in extending BenQ‟s global marketing coverage. Consequently, M&A
turned out to be the most efficient and fastest alternative to strengthen BenQ‟s
global platform (Invest in Taiwan, 2005).
3.3 The Failure of BenQ acquiring Siemens Handset Business
In October 2005, BenQ acquired Siemens‟s loss-making mobile device division
and became the 6th largest handset marker in the world. Meanwhile, the revenue
generation by mobile phone outputs would be raised from the original 16% to
over 60% in BenQ. With this acquisition, the mobile device division is renamed
as BenQ Mobile, which includes R&D design centres in Germany, Denmark, and
China as well as manufacturing factories in Germany and Brazil. According to the
acquisition agreement, BenQ Mobile obtains the right to sell the Siemens brand
handset for 18 months and co-branded mobile phones (BenQ-Siemens) for five
years. Moreover, Siemens would offer 250 million in cash to compensate BenQ
with over a thousand patents granted as well; it looked like a good free deal to
BenQ. On the other hand, the formal announcement of this acquisition caused

35
BenQ‟s share price decline over 2.7% on the subsequent day at the Taiwan
Stock Exchange Market, while the increased share price of Siemens by over
2.5% reflected investors‟ reversed expectations toward this event. This
phenomenon accords with the “information and signalling theory” mentioned in
the earlier session (The Financial Express, 2005).
Unfortunately, in September 2006, BenQ Mobile filed for bankruptcy protection
after it suffered a huge loss of approximately €840 million within one year
(Wearden G., 2007). Although this action directly caused 3,000 German
employees to lose their jobs, BenQ, the parent company, had no choice but to
stop the money loss which probably endanger its existing operations. On the
other hand, although better profitability was gained and it was reflected on the
increasing share price after Siemens AG carried out its restructuring programme,
the development of mobile phone and periphery industries in Germany faced the
breakdown. Why was the outcome beyond all expectations? Was it a definite
wrong decision for BenQ to acquire Siemens‟s mobile division? Or Should
Siemens insist on the sale of its mobile division in the beginning (Canibol H.P.,
2006)?
There were lots of reasons attributed for the failure of this merger. First of all,
BenQ‟s huge loss of approximately €840 million in this acquisition already
surpassed its share capital which was merely €630 million. Meanwhile, a sharp
increase in debt, €408 million, already reduced BenQ‟s book value per share to
NTD14. According to Taiwan Securities and Exchange law, if book value per
share of a company lowers than NTD10, margin trading and securities lending of
the firm in the open market would not be allowed. Therefore, to keep book value
per share over NTD10 became BenQ‟s priority; otherwise, it will also offer
competitors a good opportunity to largely acquire BenQ‟s shares with low price
and further dominate this firm and its subsidiaries. In addition, it is crucial that
the acquirer operates healthy financial operation before the merger is
implemented; in particular, the acquiring firm is smaller than the target
company. BenQ‟s sales already appeared slightly loss in the last two quarters
prior to the acquisition; meanwhile, BenQ had to report a tremendous loss
around €215 million quarterly from Siemens Mobile Division after the merger.
Both unhealthy business and financial conditions strongly weaken the probability

36
of success of this acquisition. Next, many financial figures of BenQ Mobile
predicted in this merger, was based on the market share that would be remained
the same as year 2005, approximately 5.2%. However, the market share of
Siemens mobile business faced sharply decrease from 5.5% in 2005 to 4.5% in
2006 after Siemens handset business was integrated with BenQ. Two main
factors that were considered cause the loss of market share. One reason was
that BenQ overestimated Siemens‟s intellectual property of GSM, GPRS and 3G
in the mobile communication field could shorten product development schedule
and enhance product functions, because there were merely 7-8 items of
thousands patents obtained in this acquisition useful. In reality, Siemens was not
well developed in 3G and multimedia mobile handsets as a result of weak
software technology and it was a low-price rather than a high-end mobile phone
provider in European market. Furthermore, Siemens‟s fragile sensitivity of
consumer market also reflects on its delayed product innovation. This
phenomenon soared BenQ Mobile‟s research expense significantly and destabilise
its finance. Finally, culture difference undermined managerial efficiency and
slowed down restructuring plan during integration period. Besides, BenQ was
over-confident that their successful business experience in computer market
development could help their market extension in mobile phone market,
although BenQ was less familiar with mobile phone field in operation mode and
managerial strategy; but challenging market condition and strong intervention of
Siemens labour union in integration progress affected BenQ‟s cost-saving and
expenditure-cutting in the financial burden.

37
4. Findings
4.1 Valuing Siemens Mobile Division Applying DCF Analysis with WACC
Due to the restricted information with regard to the financial data of mobile
division in and prior to 2004 annual report of Siemens AG, the DCF analysis will
depends on the financial statements that are built on the basis of existing figures
with numerous assumptions and conditions to arrive at the final result. Table 6
details the analysis of the DCF evaluation of business value of Siemens Mobile
Division (hereafter „SMD‟) with the assumption that the division‟s operation is a
„going concern entity‟ in the future. This analysis is divided by three steps
(Brealey R.H. et al., 2006).
Step1: estimate the timing and amount of expected cash flows. Panel A and B of
Table 6 shows the pro forma financial statements and cash flow forecasts for
SMD which is demanded to accomplish Step 1 of the DCF analysis (Titman S.
and Martin J.D., 2008). Because the effective date of this acquisition by BenQ
was on October 1, 2005, the expected incremental operating cash flow
projections comprise planning period from 2006 to 2010 and terminal value
which is based on the cash flow for 2011 and afterward. Terminal value is an
estimate that encompassed any possible financial value in terminal period and it
can be viewed as perpetuity. Moreover, the figures of Panel A are created by the
assumptions described as follows.
●The revenue forecast (see Panel 6-A) reflects an assumed rate that BenQ
Siemens could remain its market share after the merger at 5.5% between 2006
and 2007 and then followed by the increasing market share, 6.5%, from 2007 to
2008, then followed by 7% in the following periods. Average selling price (ASP)
of handsets is kept unchanged, at €97.44. Meanwhile, these figures are based
on the 5.8% average growth rate in the worldwide market that is showed in
2005 annual report of BenQ (see Table 5).
●The average production cost of Siemens pre-acquisition is €89 per handset and
the cost of goods sold is assumed from 97% of ASP in 2006 to 95% of ASP in
2009 and 2010 gradually.
●BenQ plans to decline material costs of SMD by 10% and this activity is
expected to be achieved by 2008.
●The expense of research and development accounts for 4% of revenue.
38
●Marketing expenditure and after-sales service expense, over €2.5 million, is the
majority of selling, general, and administrative expense of SMD before the
acquisition. BenQ Mobile intends to strengthen the cost saving on this portion in
the following years.
●Tax benefits are assumed to be nil when the income loss comes out and tax
rate is supposed to be in line with the standard rate of corporate tax in Taiwan,
which is 25%.
In addition, the asset level listed in the pro forma balance sheets in Panel B
reveals the assets that BenQ Mobile has to support the predicted sales. The
assumptions and conditions which build up the balance sheet are described as
follows.
●The basic pro-acquisition balance sheet of the mobile division is founded on
Siemens 2005 annual report P.155 and 156.
●The straight line depreciation method is adopted and the useful life of property,
plant, and equipment are assumed to be a five-year term without scrap value.
●Siemens AG recognised the €133 million exit related charge and that the
commission of investment bank is included (Siemens 2005 annual report,
P.155).Therefore, this charge would be ignored in BenQ Mobile financing
calculation.
●BenQ plans to turnaround BenQ Mobile business from sales loss to profitability
in two years, therefore the capital of approximately €760 million with
assumption of 47.36% in bank loan and 46.36% in equity for its mobile
subsidiary business to restructure. Therefore, BenQ‟s debt increases from the
original level of €1.05 million up to €360 million. On Taiwan stock market share
price of September 30, 2006, the market capitalisation of BenQ‟s equity was
€353.4 million after the merger. Consequently, the capital structure weights of
BenQ are 50.46% debt and 49.54% equity in market value.
●Moreover, Siemens AG would provide €250 million cash and service which is
supposed to be released in 2005 and 2006.
●Intangible assets of BenQ Mobile comprising brand name, goodwill, and patents
are presupposed to be 6% of Siemens 2005 intangible assets which is aligned
with the percentage of mobile division revenue to Siemens consolidated sales.
●The current asset in 2005 is supposed to be 5% of sales and its future value of
inventory and account receivables are also projected with sales growth at the
same rate.

39
●The current liability is assumed to be 6% of annual sales projections.
Step 2: estimate the risk discount rate. The CAPM formula is suitable here to
generate required return and then put it into WACC formula which produces risk
discount rate, the return that BenQ expect to earn by the investment finally.
First of all, risk free rate is assumed to be the interest rate of Taiwan Bank‟s one
year fixed deposit, 2%. Market expected return is assumed to be the return on
average weighted price index of Taiwan Stock Exchange between 1996 and 2007,
9.37%(Bloomberg,2007/12/31).The Bata value, 1.5, is taken from a mobile
phone competitor-Motorola as a comparator to evaluate the beta value of
Siemens mobile division and it comes from the equity coefficient unlevered to
get a beta estimate (ßu) with removing Motorola‟s particular capital structure.
Although Motorola and Siemens are in the same handset industry with similar
business risk, their capital structures are varied which influences beta
coefficients. Furthermore, to reflect BenQ‟s det/equity capitalisation ratio and the
corporate tax rate by re-levering the unlevered equity beta (ßd) is required, and
then a levered beta estimate (ßd) of the BenQ Mobile is produced. The last step,
WACC, helps to arrive on to the discount rate (Titman S. and Martin J.D., 2008).
ßu formula = ßd/[1+(1-t)Debt/Equity]
ßu = 1.5/[1+(1-0.25)25.5%/74.5%]=1.19
BenQ Mobile ßd=1.19*[1+(1-0.25)*1.0185]=2.099
CAPM formula: E(ri)= rf+ ßi[E(Rm)-rf]
E(ri)=2%+2.099[9.37%-2%]=17.47%
WACC formula: Ke* We + Kd(1-t)*Wd
WACC=17.47%*49.54%+5% (1-0.25)*50.46%=10.55%
* ßu stands for Beta value without debt
ßd represents Beta value with debt
Moreover, the accomplishment of cash flows during the five year period (see
Table 6-B) is followed by terminal value expectation. The „Gordon Growth Model‟
is implemented here to calculate the present value of free cash flow which
begins in 2011 and continues infinitely. Suppose the cash flow for the year 2011
and thereafter will grow at a constant rate, 5%, and then annually in perpetuity.

40
Moreover, the cash flow is assumed to be produced after the end of each
planning period (Titman S. and Martin J.D., 2008).
Terminal value = FCF2010*[(1+growth rate) / (Cost of capital – growth rate)]
= FCF2010*Gordon Growth Model Multiple
BenQ Mobile Terminal value =60.4(1+5%) / (10.55%-5%) =1143
Step 3: work out the present value of the Siemens Mobile Device business
(renamed as BenQ Mobile after the acquisition).Table 6-C shows that Siemens
Mobile Division value which employs free cash flow valuation and then discounts
it by cost of capital (WACC), 10.55%. Based on the DCF analysis, this acquisition
is a positive-NPV investment, 137 million euro. The result seems to show an
attractive business by NPV which could be expected in the future. However, the
required injection of 760 million euro capital by BenQ will still make this
takeover a loss business by 623 million euro.
Moreover, to evaluate merely the cash flows that is showed on Panel 6-C may
not be sufficient to cover the market changes because many assumptions which
contributed this outcome are based on the varied constant rate to project the
demand. There are many uncertainties in the dynamic market, which may
distort the original evaluation in cash flow projection. Therefore, as BenQ‟s
managers, to consider some possible variations in projected revenue which helps
company to develop vary feasible operating strategies during the decision-
making process of acquisition is demanded. This activity would be necessary to
enable the firm generate more considerations for potential risks declining when
the investment is implemented.
To arrive at this purpose, „Sensitivity Analysis‟ could be performed as a tool to
evaluate key drivers that cause influences on the cash flows and help company
to find out possible variables in specific industry. There should be three
important value drivers with regards to the Siemens Mobile Division acquisition.
These drives are investigated here and then compared with the real situation of
BenQ‟s acquisition. First one is the estimated sales growth rate in the cash flows
of Siemens Mobile business. The terminal value, another key driver, depends on
the end of planning period cash flows that is calculated associating with post-

41
planning period returns. Moreover, the cost of capital plays a crucial role in cash
flows amount as well (Titman S. and Martin J.D., 2008, P.290).
1. Sensitivity Analysis - Sales Growth Rate
In Table 5, the revenue forecast is built by the increasing market share
projection of BenQ Siemens, from 5.2% to 6% during the periods to estimate
the sales growth along with unchanged selling price assumption. However, when
the firm faces fierce competitive business environment, to keep selling price
fixed could decrease market share rather than remain market share in the same
pace of global growth. Furthermore, to steadily reduce the COGS from 97% to
95% of the selling price in the projected periods also shows an unrealistic way.
If a firm could not implement efficient managerial strategy, the cost of goods
sold could account for the higher percentage to the sales, which might erodes
profits; therefore, these assumptions are still optimistic, and cause positive NPV
which probably misguide the evaluation result, then result in investment loss; in
particular, if the decision marker believe that their managerial ability is capable
of achieving challenging goals without careful consideration, the failure of M& A
could be caused. BenQ‟s merger may be an example for this condition.
In 2005, Siemens already experienced a drop in its market share which only
accounted for 5% around of worldwide market share. When this trend is adopted
into the calculation, a reversed outcome is generated. 5% market share is
assumed to be the same during the projected periods with steady reducing
selling price ratio per year, 2%; additionally, BenQ failed to employ restructure
plan to achieve cost-cutting strategy in Siemens handset business, so COGS
should be remained at 97% 0f ASP rather than gradually decreases as the earlier
supposition. Therefore, to re-evaluate above realistic conditions, negative NPV,
-790 million euros, is produced (see Panel 7-C).This number excludes terminal
value due to the negative return continues the whole projected period. Thus to
calculate the terminal value is meaningless because the investment appears a
loss business definitely. This result seems more close to the real situation that
BenQ Siemens faced in 2006 rather than the earlier calculation result of positive
NPV, 137 million euro.

42
2. Sensitivity Analysis – Terminal Value
The terminal value of Siemens Mobile Division in 2011 and thereafter is
appraised by the Golden Growth Model multiple (g=5%). In the earlier analysis
at Panel 6-C, the Golden Growth Model multiple, 18.9, is used to estimate the
€1143 million cash inflows. However, if the growth rate is 0, the growth multiple
is calculated by 18, the terminal value would be declined by €55 million.
Likewise, this analysis is assumed to hold everything constant except for the
Golden Growth Model multiple. While BenQ Siemens‟s real state is considered
with finite timeline (no terminal value), the loss would be diminished by €44
million. It means cash flow of the last year in the projected period could be a
major role to contribute the value which influents the valuation estimate.
3. Sensitivity Analysis – Cost of Capital
If BenQ acquires Siemens Mobile business, to pursue a growth strategy is
required for future development of company. Likewise, higher return is desirable
for shareholders due to the existence of higher risks on the market. Internal
Rate of Return (IRR), the simple method as the baseline to measure whether or
not the discount rate is required to be higher. The IRR for this acquisition is
calculated as follows based on the cash flow that are listed in Panel 6-C and
€760 million in investment capital. Those conditions provide the answer that the
investment has IRR, 1%, which is lower than appropriate discount rate (WACC),
10.55%. In other words, according to IRR decision rule, this acquisition should
not be undertaken because it accompanies higher cost of capital without
profitability in the future.
NPV=-760+[-436/(1+IRR)]+[-171.6/(1+IRR)^2]-71.6/(1+IRR)^3
-6.6/(1+IRR)^4 +1203.4/(1+IRR)^5
IRR=1%

43
Table 5: Mobile Phone Market Demand Forecast
Mobile Phone Market Demand Forecast
unit: m handsets 2005 2006 2007 2008 2009 2010
Worldwide Market potential 772 817 864 914 967 1023
BenQ Siemens Market Share 42.46 44.92 56.17 59.43 67.71 71.64
Remark:
1.Worldwide market potential is assumed to increase at 5.8% average growth rate ;
2.BenQ Siemens market share is assumed to be 5.5% between 2005 and 2006 ;
6.5% market share is expected to be achieved from 2007 to 2010 Source: Nokia/BenQ 2005 annual report
Table 6: Estimating Siemens Mobile Division Value Using DCF Analysis with WACC Estimate the Amount and Timing of the Planning Period Future Cash Flows
Panel 6-A: Pro Forma Financial Statements
Pre-Acquisition
Post-Acquisition Pro Forma Income Statement
Unit: m€ 2005 2005 2006 2007 2008 2009 2010
Revenue 4137 4137 4377 5473 5791 6598 6981
Cost of Goods Sold 4013 4013 4246 5254 5501 6268 6562
Gross Profit 124 124 131 219 290 330 419
Research and Development 165 165 175 219 203 231 244
Selling, General and Administrative 250 250 200 180 150 100 100
Other income 0 0 0 0 0 0 0
EBIT -291 -291 -384 -191 -63 -1 75
Interest Expense 0 0 9 7 5 4 4
Tax @ 25% (2005) 0 0 0 0 0 15 20
Net(loss) Income -291 -291 -210 -198 -68 -20 51

44
Panel 6-B: Cash Flow Estimate
Unit:m € 2005 2006 2007 2008 2009 2010
Net Operating Income -291 -384 -191 -63 -1 75
Less:Taxes @ 25% 0 0 0 0 0 18
NOPAT -291 -384 -191 -63 -1 57
Plus: Depreciation 0 0 10.4 10.4 10.4 10.4
Operating Cash Flow -291 -384 -180.6 -52.6 9.4 67.4
Less:Changes in Net Working Capital 0 52 -9 19 16 7
Less:Capital Expenditure in fixed assets 0 0 0 0 0 0
Free Cash Flow -291 -436 -171.6 -71.6 -6.6 60.4
(continued) Pre-Acquisition
Post-Acquisition Base Line Pro Forma Balance Sheet
Unit: m € 2005 2005 2006 2007 2008 2009 2010
Current Assets Cash and Cash Equivalent
58 58 58 58 58
Inventory 104 104 107 128 107 143 140
Account Receivable 89 89 100 125 130 140 160
Fixed Assets Property, Plant and Equipment 52 52 52 41.6 31.2 20.8 10.4
Depreciation
10.4 10.4 10.4 10.4 10.4
Net Property, Plant, and Equipment 52 52 41.6 31.2 20.8 10.4 0
Intangible Assets 200 200 200 200 200 200 200
Total Assets 445 445 507 542 516 551 558
Current Liability 228 228 248 303 320 350 360
Long-Term Liability
Bank Loan@ 6% 0 0 150 120 85 70 65
Other liability 61 61 59 69 61 81 83
Total Liabilities 289 289 457 492 466 501 508
Equity 0 50 50 50 50 50 50
Total Liabilities and Equity 289 339 507 542 516 551 558

45
Panel 6-C: Divisional Value
Updated Value
2005 2006 2007 2008 2009 2010 (in millions of euro)
Free Cash Flow of Assets
-436 -171.6 -71.6 -6.6 60.4
Terminal Value of Assets
1143
Discount @10.55% for P.V. 0 -347.4 -156.3 -47.6 -0.7 905
PV Value (Total) 137
Table 7: Estimating Siemens Mobile Division Value Using DCF Analysis with WACC(Sensitivity Analysis)
Panel 7-A: Pro Forma Financial Statements
Pre-Acquisition Post-Acquisition Pro Forma Income Statement
Unit: m€ 2005 2005 2006 2007 2008 2009 2010
Revenue 3761 3761 3941 4127 4321 4526 4743
Cost of Goods Sold 3648 3648 3823 4003 4192 4345 4554
Gross Profit 113 113 118 124 130 181 190
Research and Development 150 150 158 165 151 158 166
Selling, General and Administrative 250 250 200 180 150 100 100
Other income 0 0 0 0 0 0 0
EBIT -288 -288 -384 -191 -172 -77 -76
Interest Expense 0 0 9 7 5 4 0
Tax @ 25% (2005) 0 0 0 0 0 0 0
Net(loss) Income -288 -288 -210 -198 -177 -82 -76
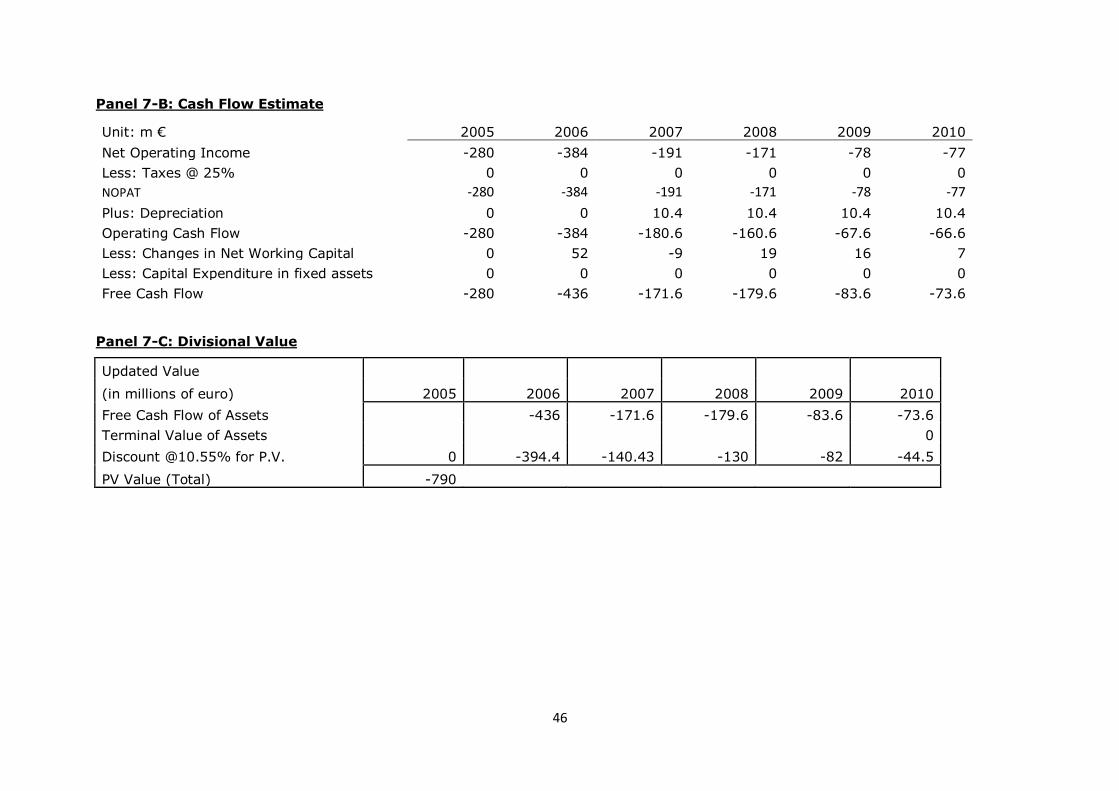
46
Panel 7-B: Cash Flow Estimate
Unit: m € 2005 2006 2007 2008 2009 2010
Net Operating Income -280 -384 -191 -171 -78 -77
Less: Taxes @ 25% 0 0 0 0 0 0
NOPAT -280 -384 -191 -171 -78 -77
Plus: Depreciation 0 0 10.4 10.4 10.4 10.4
Operating Cash Flow -280 -384 -180.6 -160.6 -67.6 -66.6
Less: Changes in Net Working Capital 0 52 -9 19 16 7
Less: Capital Expenditure in fixed assets 0 0 0 0 0 0
Free Cash Flow -280 -436 -171.6 -179.6 -83.6 -73.6
Panel 7-C: Divisional Value
Updated Value
2005 2006 2007 2008 2009 2010 (in millions of euro)
Free Cash Flow of Assets
-436 -171.6 -179.6 -83.6 -73.6
Terminal Value of Assets
0
Discount @10.55% for P.V. 0 -394.4 -140.43 -130 -82 -44.5
PV Value (Total) -790
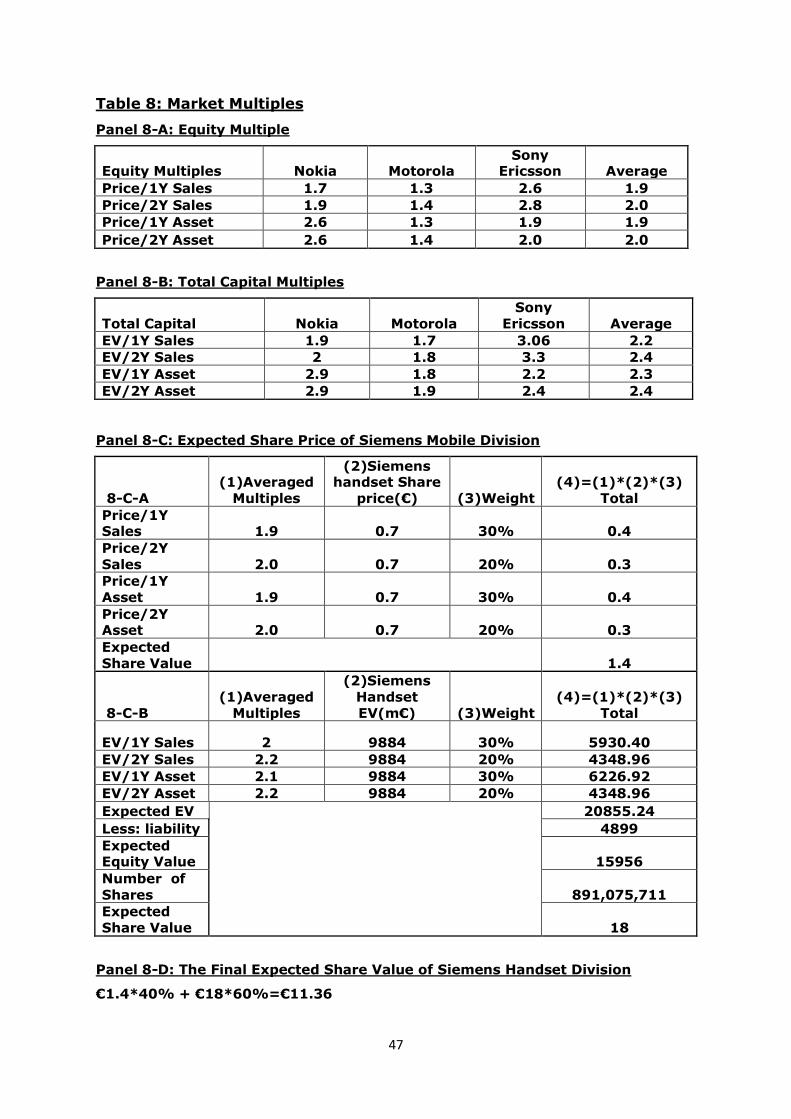
47
Table 8: Market Multiples
Panel 8-A: Equity Multiple
Equity Multiples Nokia Motorola Sony
Ericsson Average
Price/1Y Sales 1.7 1.3 2.6 1.9
Price/2Y Sales 1.9 1.4 2.8 2.0
Price/1Y Asset 2.6 1.3 1.9 1.9
Price/2Y Asset 2.6 1.4 2.0 2.0
Panel 8-B: Total Capital Multiples
Total Capital Nokia Motorola Sony
Ericsson Average
EV/1Y Sales 1.9 1.7 3.06 2.2
EV/2Y Sales 2 1.8 3.3 2.4
EV/1Y Asset 2.9 1.8 2.2 2.3
EV/2Y Asset 2.9 1.9 2.4 2.4
Panel 8-C: Expected Share Price of Siemens Mobile Division
8-C-A (1)Averaged
Multiples
(2)Siemens handset Share
price(€) (3)Weight (4)=(1)*(2)*(3)
Total
Price/1Y Sales 1.9 0.7 30% 0.4
Price/2Y Sales 2.0 0.7 20% 0.3
Price/1Y Asset 1.9 0.7 30% 0.4
Price/2Y Asset 2.0 0.7 20% 0.3
Expected Share Value 1.4
8-C-B (1)Averaged
Multiples
(2)Siemens Handset EV(m€) (3)Weight
(4)=(1)*(2)*(3) Total
EV/1Y Sales 2 9884 30% 5930.40
EV/2Y Sales 2.2 9884 20% 4348.96
EV/1Y Asset 2.1 9884 30% 6226.92
EV/2Y Asset 2.2 9884 20% 4348.96
Expected EV
20855.24
Less: liability 4899
Expected Equity Value 15956
Number of
Shares 891,075,711
Expected Share Value 18
Panel 8-D: The Final Expected Share Value of Siemens Handset Division
€1.4*40% + €18*60%=€11.36

48
4.2 Market Multiple Approach
There are two multiples applied in the calculation. The first one is the equity
multiple. It equals the figure that common share price divided by specific
numbers on the financial statement, such as price/EPS, price/sales, and
price/assets. The other is the total capital multiple. It can be used to decrease
the distortion of these companies if their capitals structures appear varied
patterns. This multiple is produced by enterprise value divided by sales and
assets (Stampf et al.1992). However, because mobile division is a loss-making
business which brings negative impact to Siemens AG group‟s EPS; therefore,
the PE ratio is not adopted here. Due to the lack of detailed financial statement
of Siemens mobile division, its related financial figures, such as asset value
which is calculated here, are assumed to be proportionately equal to the weight
of its divisional sales to Siemens AG revenue in total, 6%, in this analysis.
On the other hand, Nokia, Motorola, and Sony Ericsson are selected as the
comparable firms to Siemens mobile division. In these three comparables, Nokia
and Motorola are profitable company; however, Sony Ericsson seems to have a
more similar background with BenQ-Siemens. Ericsson, the Swedish telecoms
equipment maker, desired a merger to save its loss-making handset division.
Meanwhile, Sony, was a marginal handset supplier. A merger from joint venture
was formed in 2001(Dominic W., 2001). Moreover, a new firm “Sony Ericsson”
also experienced a business loss period after the merger. In 2004, Sony Ericsson
finally turned around to be a profitable company (Foo F.,2001).
In the Panel 8-A, Price/1Y Sales represents the 2004 market price divided by
2004 sales; Price/2Y Sales depicts 2004 market price divided by the averaged
sales of 2004 and 2003. Likewise, the following columns of Price/Asset ratios are
listed and calculated in the same way. The averages are produced and then
given weights which represent the importance in various levels. The year which
closes to the date of acquisition, 2005, is considered as priority to be assigned
higher weights. In other words, the ratios of 2004 would be given higher weight
than the average ratio of 2004 and 2003. Moreover, the weight of sales directly
links with profitability performance which would be also offered more weights
than the asset ratio. These rules are applied to Panel 8-B as well. Furthermore,
in Panel 8-B, enterprise value (EV) is the sum of debt and all equity at market

49
value lessen cash and cash equivalent. Moreover, EV here stands for the mobile
division value.
Panel 8-C lists the calculation which is composed by four parts. The first element
is the averaged multiples of comparable firms. The second element is the
Siemens handset division share price and divisional value (EV) separately. This
column assumes that mobile division‟s contribution to the share price is as same
as the ratio of divisional revenue to Siemens group (see 8-C-A). Moreover, in the
8-C-B, EV of handset division is calculated at certain percentage of Siemens
Group EV, which is assumed to be as same as the ratio of divisional revenue to
Siemens group. Then the fourth element is multiplied by averaged multipliers,
different weights and the handset divisional value. Then the expected total EV
deducts liability to generate the expected equity value. The outcome of expected
share price is produced by expected equity value divided by the number of
outstanding shares. The weights here are also assigned according to the same
rule in Panel 8-A and 8-B. The results disclose the expected share price of
Siemens mobile division in terms of equity multiple and total capital multiples
individually. As a result, as what Panel 8-D demonstrates, the expected share
price in equity multiples would be multiplied by 40% weight in equity multiple
and 60% weight in capital individually. After that, the expected share value of
Siemens mobile division is generated at €11.36 in total. The reason to give 40%
and 60% weights individually is because the comparable firms are in debt; under
this condition, the capital multiple is considered to be an evaluation tool which is
less influenced by debt than the equity multiple. Therefore, the total capital
multiple is assigned with more weights than the equity multiple at this
evaluation.
4.3 Comparison of Financial Evaluation
It is obvious that DCF analysis as well as a valuation which employ
comparables-based multiples are implemented here to supplement each other.
When the analysis comes out the figures, it still left with problems of how to
select these estimates with utilising certain judgement to arrive at the final
investment conclusion. The judgement is achieved by the quality of available
information and the evaluation purpose- does this investment is worth for BenQ

50
to acquire a loss-making business, although Siemens is an attractive brand
name to consumer product market?
In the late 2006, BenQ-Siemens already suffered a huge lose around 840 million
euros in the first year of post-merger. If we compare outcomes of DCF and
comparable multiples methodologies with BenQ‟s real situation, the differences
are showed apparently.
The reality is that using DCF requires rough estimate of future free cash flow and
discount rate. An optimistic projection to future business indeed influences
investment value a lot. A fixed selling price, fixed cost of goods sold, and even
projected market share which brings an attractive investment with high NPV
showed a strong contrast to BenQ-Siemens‟s post-merger real situation. When
the market share did not remain in the same position or even decline than
before, selling price fall down, and cost-cutting policy in an organisation did not
implement well, an valuable investment which was earlier expected became a
serious damage to the acquirer finally.
Utilising valuations ratios to appraise investment value can avoid dramatic
projections; in particular, these projections of cash flow and discount rate are
not easy to be accurate all the time. However, to identify comparable transitions
or comparable firms are challenging. Because each investment in different
timeline has its unique value which is difficult to be quantified completely. BenQ
is a relatively smaller company to Siemens AG group, but it chose to take over
Siemens handset division. It is a rare case in the M&A historical record. On the
other hand, to select a set of comparable companies for BenQ in the same field
might be not difficult, but to acquire a bigger business than BenQ‟s own scale
with specific enterprise purpose is not easy to search comparables. Moreover, a
loss-making Siemens handset business is hard to find similar comparable,
because Noika and Motorola are profitable companies; although Ericsson was a
loss-making firm before the merger with Sony, these two firms‟ scales are
relatively equivalent than the scale difference between BenQ and Siemens. This
is also the reason why to apply the average value of Nokia, Motorola, and Sony
Ericsson together in the ratio valuation. Because to search a perfect comparable
51
in every aspect is approximately impossible, the selection is likely to comprise a
subjective element to some extent.
Panel 8-D demonstrates BenQ-Siemens share value which is a positive sign as
well to this merger. But real share value to BenQ in the post-merger did not
perform a good trend. BenQ‟s own financial structure with unexpected mobile
market reversal also contributed the falling share value. In other words, to select
an appropriate metric to assess an investment also depends on the supposition
that a scaled value of the metric where the investment attributes is the scaling
variables. BenQ‟s financial position is relatively weak to support this merger to
be successful because it is a small business to acquire a big one. We might
explain that in reality, the metric value is impossible completely equal the
investment attributes and then contribute to BenQ‟s evaluation toward Siemens
handset division in the beginning. This is also the reason why the weights are
given during the calculation process of market comparable method. It might be
subjective but necessary.
5. Discussion
5.1 The Motives of BenQ’s Acquiring Siemens Mobile Business
In reality, handset suppliers seeking for collaboration in terms of efficient
resource utilisation and co-branding benefit is not uncommon; but the actual
effect is probably disputable. Take the acquisition of Sony and Ericsson as an
example. The integration of these two companies‟ handset business initially
brought a significant sales loss of 28%, registering a mere 6 million shipment
volume, which undermined its previously projected economic benefits on the
market (Foo F., 2001). This acquisition took several years for the new company,
Sony Ericsson, to be directed on the right track. In particular, this event was not
a case of the small firm taking over a larger one but a combination of two
entities with an equivalent business scale. To some extent, mergers and
acquisitions incorporate diverse challenges and uncertainties on a case by case
basis. The motives for BenQ in completing this merger were as follows:
First of all, building and developing a global brand. This is the most crucial driver
in this M&A. In the previous three years, marketing expenditures cost BenQ

52
roughly €70 million. As a general rule, to obtain one company‟s brand for
marketing, 2% of its sales has to be paid as the royalties. If BenQ has to pay for
“BenQ-Siemens” for 5 years, the license fee would be 450 million. From this
stance, the acquisition seems valuable to BenQ, which strongly desired a
powerful brand name. In addition, to acquire key technology contains patents
and experienced R&D teams. BenQ believed that Siemens‟s core patents, such
as 3G, GPRS, and GSM, and its focus on technology development is not only
significantly helpful to future development of new products, but also improve
BenQ‟s innovation technology. Thirdly, the aim was in expanding geographical
markets and increasing market share. Asia is BenQ‟s chief marketplace while
Siemens hold stronger sales channels in Europe and Latin America. Therefore,
the integration of these two firms can be completed to reinforce the global
platform. At the same time, the total outputs that under the mark of “BenQ-
Siemens” extended BenQ‟s brand awareness to more consumers (Wei L.Y.,
2005).
Finally, the merger was to enhance BenQ‟s scale of economics. BenQ aims at
becoming a well-known global brand since the brand‟s early days in 2001.
However, the huge amount of marketing expenditure and relatively short-term
brand cultivation cannot afford to cope with competition coming from other
powerful brand equities. As the shipment of BenQ‟s own brand of handsets was
extraordinarily small, it did not bring sufficient visibility to consumers given the
relevant marketing expenditure. But, when the quantities are combined with
shipments of Siemens mobile division, projected to be 40 million to 50 million
units, the brand visibility will be highly intensified.
5.2 Failures to the Merger
Conversely, the exit from this M&A by BenQ in 2006 caused controversial
discussion not only in Taiwan but in Germany. Taiwan market was concerned
that if local manufacturing suppliers cannot break the current destiny of OEM
and ODM business models to pursue establishment of brand equity
establishment successfully in the global marketplace. In contrast, Siemens and
the German society protested against this behaviour because it damaged
employees‟ rights for jobs, and the Siemens AG group was also blamed for
dealing with its handset business, which was tough to be salvage, in wrong and

53
unfair way (Wearden G., 2007). To examine the failure of this case, many aspects
of considerations have to be covered to discover implicated clues and causes.
First of all, the decrease of its own business destabilised BenQ‟s finance situation.
Before the formal acquisition, BenQ‟s own business had experienced a €22
million sales loss in the earlier three quarters, and this performance had already
destabilised its original financial position in 2005. Likewise, this misfortune had
continued to spread in 2006, with the handset market share, regardless whether
they are sold under the BenQ or BenQ-Siemens brand, shrinking by 3% in total
as compared to pre-acquisition figures. Moreover, its own business of handset
OEM manufacturing seemed to be affected due to its intention to cultivate a
brand for the mobile devices. In all probability, BenQ might have already been
viewed as a potential competitor by its original OEM customers such as Motorola,
and this phenomenon could be observed from the reduction in its orders, which
prompted BenQ to look for other cooperative partners (Wei L.Y., 2005).
According to the definition of M&A by Buckley P.J. (2002), this case fits in not
only under horizontal but also vertical merger classification, because BenQ and
Siemens sold similar products in the same field. Although Siemens was not
BenQ‟s original OEM customer, BenQ‟s manufacturing ability along with
Siemens‟s existing marketing platform apparently threatened BenQ‟s OEM
mobile phone customers, who did not undertake production but were Siemens
competitors. This influence, I believed, should be incorporated as a form of
vertical forward merger. Meanwhile, it could be found that when horizontal and
vertical merger co-exist, conflict may come before synergy; in particular, if the
company run specific business patterns on the market.
In addition, the culture difference caused the difficulty in integration (Wei L.Y.,
2005). As Table 9 shows, Germany has a lower score in power distance and long
term orientation but quite a high and masculinity compared with Taiwan.
Meanwhile, both countries appear to the same degree in uncertainty avoidance.
The above summary points out the roots of cultural differences. In other words,
German believes that hierarchy is designed for convenience with the tendency of
tasks prevailing over relationships. They respect traditional values and take
social obligation seriously, with the characteristics of assertiveness and
decisiveness, shown to be a little bit higher tendency than Taiwan figures.

54
Conversely, Taiwanese have a higher intention to be a follower rather than a
creator, and is concerned more with relationship maintenance rather than task
achievement. Meanwhile, the people in Taiwan stress on the future orientation of
perseverance and thrift. Besides, the gap between man‟s values and woman‟s
values is smaller in Taiwan than in Germany. Therefore, the management
activity in one country is culturally dependent, which means what works in one
country may be not fit in another; in particular, when the obvious difference
exists in the eastern and western countries. In order to keep talented people in
the mobile division and show respect for autonomy, BenQ appointed its former
executive – Chemens Joos as the new executive who was in charge of the
business operations in the new subsidiary, BenQ Mobile. The purpose conducting
this management practice, in terms of keeping original middle and top managers,
also includes retaining good communication with union organisation. However,
this management pattern did not bring any interaction between the parent
company and its subsidiary and instead enlarged the detrimental gap.
Assertiveness was probably another problem associated with compromise
regardless of product design or business goal. Besides, the Taiwanese follows a
hierarchy and feedback system, which goes along with each layer; but a German
with high confidence has gotten used to breaking the line, which often makes
other members lose faces and worsen the relationship and cooperation on both
side.
Table 9: Geert Hofstede Culture Dimensions-Germany and Taiwan
Resource: http://www.geert-hofstede.com/hofstede_germany.shtml Resource: http://www.geert-hofstede.com/hofstede_taiwan.shtml

55
Moreover, delay in production development weakens the result of integration.
Handset technology involves the development of both hardware and software,
whereas the design of software cannot fit in the mobile phone as what BenQ
expected in the beginning and after it passed the test condition which resulted in
the order loss in retailer market. Meanwhile, the tempo of changing market
cannot accept an extremely complex design which is out of date and test
procedures without any flexibility and compromise which protracted time to
market. Thus, there were merely two models which are being mass production.
Conversely, failed projects were extremely costly but gained nothing.
Conclusion and Recommendations
This was a rare case in the record of M&A activities because BenQ, a small entity,
took over Siemens Mobile Device Division, a larger business unit. According to
Y.H. Yeh (2005), “Growing strong must come before growing big. A huge
amount of money is required to deal with future uncertainties.” In other words,
BenQ must be strong in its financial operation with quite healthy and stable
business growth.
The motives of this acquisition displayed the different stances of Siemens and
BenQ. First of all, Klaus Kleinfeld, the CEO of Siemens AG, took over this position
in 2005 and aggressively enforced the restructuring plan in order to bring
Siemens AG back into profits. Therefore, addressing the concern with regard to
sectors that fail to achieve business goals and undermining business risk through
top managers is an essential motive (Amihud et al. 1981) for this M&A.
Furthermore, top managers‟ held over-optimistic manners with respect of
Siemens AG, in believing that BenQ can afford to turn the loss-making mobile
division around where Siemens AG failed; at the same time, BenQ‟s managers
overestimated their capability to deal with complicated cross-board business
operation and managerial issues during the integration of two firms; this
situation is called “hubris Hypothesis” (Roll, 1986). BenQ would like to pursue
fast sales growth with a strong brand, accompanying managers‟ belief of their
rewards co-related with sales to some extent, and it is believed a case of the
“Growth Maximisation Hypothesis” mentioned by Muller (1969).

56
The behaviour of suspending obligatory capital injection in this takeover by BenQ
raised another surmise in the market. Since BenQ acquired the Siemens mobile
division, the average loss per day was 2.3 million complying with its share price
falling from NTD 35 to NTD17 in the end. The shrink of BenQ‟s shrinking market
value endangered its position because the low price shares were at risk to be
acquired unfriendly in a hostile manner by other competitors. If this situation
happens, BenQ would not only lose its own business along with difficulties in
liquidation but also jeopardize its ownership in other subsidiaries. Some theories
suggested that M&A activity can weaken the principle-agency problem because
managers would perform better to avoid being acquired. However, if the
acquirer does not select and evaluate the target company well, it may become
other competitors‟ prey as well. Consequently, the principle-agency problem is
reinforced in the organisation due to the wrong investment decision. Likewise, as
Jenson (1986) highlighted that wrong utilisation of free cash flow in a takeover
may lead to another conflict between managers and shareholders.
Management model affects the successful integration in the post merger. It is
difficult to judge whether the acquisition is a good investment or not at that
moment, but to manage it in an appropriate manner is an alternative that can be
chosen afterward.“The underlying belief is that, the sooner the integration effort
comes to an end, the sooner the business can proceed with „business as usual‟.
Alternatively stated, speedy integration is risky to operations and can lead to
untagged synergy potential due to the limited knowledge merger parties have
with regarded each other‟s operations.” (Papathanassis A.2004, P.26)
As has been mentioned in the earlier pages, BenQ‟s parent company
implemented a gradual revolutionary style in cross-board management. BenQ
mobile (Siemens Mobile Division renamed in the post acquisition) enjoyed a high
degree of autonomy in terms of management, practices, and culture. Yet, the
company‟s operation efficiency was extremely minimised and it went along with
financial destabilisation. In reality, to appoint the same group of managers who
came from a former loss-making division and to ask them to turn the business
around by bringing efficient changes to the organisation was a big mistake by
BenQ, which incorrectly weighed in its managerial strategy. At the same time,
BenQ itself lacked sufficient information associating with Siemens union which
57
possess strong power to intervene in the decision-making process. To
underestimate the union organisation in Germany is another fault. It caused the
related revolutionary policies that were beneficial to BenQ business being
hindered. A slow integrated process accompanies inherent strains because
mutual intentions relating to the acceptance of each other‟s best practices and
underperforming activities required to be adjusted. Thus, to demand a fully
consolidated culture and operation takes lots of time and is definitely a dilemma.
Losing in timing equals losing the market. Most important of all, the adoption of
management patterns significantly affects the outcome of complex challenges
encountered.
However, how to choose managerial practice to speed up the integration in
terms of resource transfer and declining exposure to the negative effects
depends on the thorough understanding of the target company that the acquirer
intends to buy. “Due diligence” is the best tool to provide related information
which supports the evaluation. As a result, the acquirer has its responsibility to
examine the accuracy in the acquisition agreement and fulfil investors‟
requirements and concerns. After all, the incompleteness of due diligence not
only wrongly connect with performance of post-acquisition which provides
incorrect financial projections to evaluation in pre-acquisition but also
underestimate business risks. Under this circumstance, it will contribute to the
failure of the merger and diminish shareholders‟ profits ultimately.
There is no single element that can accomplish a perfect investigation associated
with the value of an acquisition. The financial evaluation of DCF approach in
terms of WACC requires many presuppositions to work out the result which
demands as much objective information as possible to overcome subject factors.
Likewise, the use of the Market Multiple approach also requires detailed
information of market competition with similar comparators and relatively
rational reflections of market and investors for decreasing errors possibly
occurred in the findings.
On the other hand, regardless of the high risk and failure rate in the M&A waves,
there are still many companies seeking powerful growth through acquisitions.
The major driver, I personally believe, are investment banks which play key
roles to dominate the M&A market. The emergence of investment bank

58
accelerates the transaction of M&A. In many cases, sellers hire advisors to
search for the buyers. Through the successful match up, the intermediaries
obtain at least 1% of transaction amount and it is quite a profitable business
scope in banking field (Mergers & Acquisitions, 2009). Although buyers can also
save time and money to acquire representation of the target firm through
investment banks, to those intermediaries, to some extent, target firms are their
products with attractive packaging for promotion. The professional consultancy
on negotiation and valuation is the existential value of those advisors. Similarly,
screening exactly useful analysis and ignore dissembling information demand the
managers of companies to express interests in acquisition to conduct well.
Meanwhile, any possibility that managers and intermediaries both pursue the
same interests and then put their mutual interests at the expense of
shareholders‟ value creation to worsen principle-agency problem is a crucial
topic for further investigation. Moreover, to some extent, M&A activity involves
an opposite stance against corporate social responsibility (CSR). When the firm
faces fierce competition on the market and has no choice but implements cost-
cutting measurement for restructuring, should the social obligation fulfilment
over a firm‟s profitability? The controversial issue can also bring in the
impressive implication and deepen the discussion as well.
59
Reference
Amit R.and Joshua L.(1988) „Diversification Strategies, Business Cycle and
Economic Performance‟, Strategic Management Journal, 9, pp.99-100.
Amihud Y. and Lev B. (1981) „Reduction as A Managerial Motive for
Conglomerate Mergers‟, Bell Journal of Economics, 12, pp.605-617
Ansoff H.I., Richard G.B., Fred E.P., and Raymond R.(1971) „Acquisition
Behaviour of U.S. Manufacturing Firms‟, Vanclerbilit University Press, pp. 1946-
1965
Buckley P.J. and Ghauri P.N.(eds)(2002) International Mergers and Acquisitions:
a reader. London: Thomas.
Brigham E.F. and Gapenski L.C.(1994) Financial Management: Theory and
Practice (7th edition) Chicago: Dryden Press
Banerjee A. and Eckard E.W.(1998) „Are Mega-Mergers Anticompetitive?
Evidence from the First Great Merger Wave‟, Rand Journal of Economics, 29,
pp.8
Biel A.L.(1992) „How Brand Image Drives Brand Equity‟, Journal of Advertising
Research, Vol.32, pp.6-12
Brasco T.C (1988) How Brand Names are valued for Acquisitions .Massachusetts:
Marketing Science Institute
Bruner R.F (2004) Applied Mergers and Acquisitions. New Jersey: John Wiley &
Sons Inc.
Canibol H.P. (2006) Siemens Hit With Bad Publicity. CEO Klaus Kleinfeld takes
a few blows [Online]. Available at:
http://www.atlantic-times.com/archive_detail.php?recordID=693[Accessed 30
July 2009]

60
Copeland E.T. and Weston J.F.(1979) Financial Theory and Corporate Policy (2nd)
Addison-Wesley Publishing Company, Inc.
Chugh L.C. and Meador J.W (1984) „The Stock Valuation Process: The Analysis‟
View‟ Financial Analysis Journal, Nov./Dec.,pp.41-48
Doyle P.(1990) „Building Successful brands: The Strategic Opinions.‟, Journal of
Consumer Marketing, Vol.7, No.2
Dominic W.( 2001) Ericsson and Ericsson in mobile merger talks?[Online]
Available at:
http://www.telegraph.co.uk/finance/4489822/Ericsson-and-Sony-in-mobile-
merger-talks.html[Accessed 30 July 2009]
Damodaram, A (2000). The dark side of valuation: Firms with no Earning, no
History and no Comparables. Unpublished Working Paper New York University
E.F. Fama and Jensen M.C.(1983) „Separation of Ownership and Control‟ Journal
of Law and Economics, 26, pp.301-325.
Franks, J.R., Harris, R.S., Mayer, C. (1988), "Means of payment in takeovers:
results for the United Kingdom and the United States", in Auerbach, A. (Eds),
Corporate Takeovers, Causes and Consequences, University of Chicago Press,
Chicago, IL,
Foo F. (2001) Sony, Ericsson unveil US$500m merger [Online]. Available at:
http://www.zdnetasia.com/news/communications/0,39044192,38008998,00.ht
m [Accessed 30 July 2009]
Fowler K.L. and Schmidt D.R. (1989) „Tender offers, Acquisition and Subsequent
Performance in Manufacturing Firms.‟, Academy of Management Journal, 31, pp.
297-317
Guatri L. (1994) The valuation of firms. Cambridge: Blackwell

61
Goold M. and Campbell A. (1999) The Collaborative Enterprise-Why Links
Between Units Often Fail-And How to Make Them Work New York, NY: Basic
Book
Hoshino Y. (1982) „The Performance of Corporate Mergers in Japan‟, Journal of
Business Finance and Accounting, 9, pp.153-165
Hickman K. and Perty G,H. (1990) „A Comparison of Stock Price Predictions
Using Court Accepted Formulas, Dividend Discount, and P/E Models.‟ Financial
Management, Vol.19, pp.76-87
Haspeslagh P.C and Jemison D.B. (1991) Managing Acquisition Creating Value
through Corporate Renewal, New York: Free Press
Hofstede G.(1994) „The business of International Business is Culture.‟
International business Review, Vol.3, No.1, pp.1-14, 1994
Invest in Taiwan (2005) Value of Taiwan's top ten brands up 11.5% to NTD 4.6
billion [Online]. Available at:
http://investintaiwan.nat.gov.tw/en/news/200510/2005102501.html [Accessed
30 July 2009]
Jensen M.C and Ruback R. (1976) „Market for Corporate Control: The Scientific
Evidence‟, Journal of Economics, pp.5-50
Kitching J.(1967), „Why do mergers miscarry?‟, Harvard Business Review, Vol.
November–December pp.84 - 101.
Levy H.& Sarnat M. (1970) „Diversification, Portfolio Analysis and the Uneasy
Case for Conglomerate Mergers.‟ Journal of Finance, vol. 25, no.4, pp.75-802
Lewellen G.W.(1971) „A Pure Financial Rationale for the Conglomerate Merger‟
Journal of Political Economy, 73, pp.110-120.

62
Lippitt J.W. and Mastracchio N.J. (1993) „Valuing Small Business: Discount Cash
Flow, Earning Capitalisation, and The Cost of Replacing Capital Assets.‟ Journal
of Small Business Management July 193, Vol.31, pp.52-61
Lewellen W.G. and Huntsman B.(1970) „Managerial Pay and Corporate
Performance‟ American Economic Review, 60, pp.710-720.
Luehrman T.A.(1997) „Using APV: A Better Tool for Valuing Operations‟ Harvard
Business Review
Manne G.H (1965) „Mergers and Market for Corporate Control‟ Journal of Political
Economy, 73, pp.110-120
Mueller D.C. (1969) „A Theory of Conglomerate Mergers.‟, Quarterly Journal of
Economics pp.643-660.
Mergers & Acquisitions (2009) Why Investment Bankers Make So Much Money
[Online]
http://www.mergersandinquisitions.com/investment-bankers-make-money/
[Access to 30 July 2009]
Muller D.C. (1969) „A Theory of Conglomerate Mergers‟ Quarterly Journal of
Economics, pp.643-660
Muller D.C. (1985) „Mergers and Market Share‟, The Review of Economics and
Statistics, 67, pp.259-267
Nahavandi, A. and Malekazadeh A. (1988) 'Acculturation in mergers and
acquisitions,' Academy of Management Review, 13, pp. 79-90
Nystedt D. (2005) New BenQ, Siemens Mobile Phone Company Opens [Online].
Available at:
http://www.infoworld.com/t/networking/new-benq-siemens-mobile-phone-
company-opens-419 [Access to 25 July 2009]

63
Papathanassis A. (2004) Post-Merger Integration and The management of
Information and Communication- An analytical framework and its application in
tourism Wiesbaden: Deutscher University
Qisda Corporation Website (2009)[Online]. Available at:
http://www.qisda.com/UserFiles/2004_Annual_Report.pdf [Accessed 30 June
2009]
Roll R. (1986) „The Hubris Hypothesis of Corporate Takeovers‟, Journal of
Business, pp. 197-216
Reilly R.F.(1990) „The Evaluation of a Medical Practice‟ Health Care Management
Review, Nov/Dec 1995, Vol. 30
Seth A.(1990) „Value Creation in Acquisition: A Re-examination of Performance
Issues‟ Strategic Management Journal, 11, pp.99-115.
Simon C.J and Sullivan M.V. (1993) The Measurement and Determinants of
Brand Equity: A Financial Approach, Marketing Science Institute, pp.88-104
Shepherd W.G. (1979) The Economics of Industrial Organization. Englewood
Cliffs, N.J: Prentice-Hall Inc
Singh H.& Montgomery C.A. (1987) „Corporate Acquisition Strategies and
Economic Performances‟, Strategic Management Journal, 8, pp.377-386.
Schmidt, D. R. and Fowler K. L.(1990) „Post-acquisition Financial Performance
and Executive Compensation.‟ Strategic Management Journal 11: 559-570
Stampf, Steven J.,Toso, and Beth C. „Valuing European Target Companies‟ The
Journal of European Business New York: May/Jun 192. Vol.3, lss. 5; pg.20, 6 pgs
Sherman A.J. and Hart M.A. (2006) Mergers & Acquisition from A to Z (2nd
edition) NY: AMACOM

64
Stobart P. (1989) „Alternative methods of brand valuation‟ in: Murphy J(ed),
brand valuation: Establishing a true and fair view. London: The interbrand group.
Siemens AG Website (2009)[Online]. Available at:
http://w1.siemens.com/pool/en/investor_relations/financial_publications/annual
_reports/E04_00_GB2004_1230305.PDF [Accessed 30 June 2009]
The Financial Express (2005)BenQ to trim its mobile portfolio [Online].
Available at:
http://www.financialexpress.com/news/benq-to-trim-its-mobile-portfolio/
142277/1 [Accessed 30 July 2009]
Titman S. and Martin J.D. (2008) Valuation: the art and science of corporate
investment decisions. Boston: Pearson Education Inc.
Tsai H.M. (2006) The Trend of Globalisation and the Impact [Online]. Available
at:
http://www.cnfi.org.tw/kmportal/front/bin/ptdetail.phtml?Part=magazine9504-
433-14 [Accessed 30 July 2009]
Williamson D.E. (1983) „The Modern Corporation: Origins, Evolution, Attributes‟
Journal of Economics 14, pp.1537-1568.
Weston J. F. and Mansinghka S.K. (1971) „Test of the Efficiency Performance of
Conglomerate‟ Journal of Finance, 26, pp.919-939
Wearden G. (2007) BenQ Mobile faces liquidation [Online]. Available at:
http://www.zdnetasia.com/news/business/0,39044229,61979021,00.htm
[Accessed 30 July 2009]
Wei L.Y.(2005) BenQ Acquired Siemens Mobile Phones – A Turning Point of KY
Lee and Corporate Taiwan in 21th Century ?[Online] Available at:
http://www.tcoc.org.tw/IS/Dotnet/ShowArticle.aspx?ID=11274 [Accessed 30
July 2009]

65
Pratt S.P., Reilly R.F., Schweihs R.P. (2000) Valuing a business: the analysis and
a appraisal of closely hold company (4th edition) USA: McGraw-Hill