
Chemoenzymatic synthesis, structural study and biological ... file1 Supplementary material...
53
1 Supplementary material Chemoenzymatic synthesis, structural study and biological activity of novel indolizidine and quinolizidine iminocyclitols Livia Gómez a , Xavier Garrabou a , Jesús Joglar a , Jordi Bujons a , Teodor Parella b , Cristina Vilaplana c , Pere Joan Cardona c , Pere Clapés a * a Dept Biological Chemistry and Molecular Modeling. Instituto de Química Avanzada de Cataluña, IQAC-CSIC. Jordi Girona 18-26, 08034 Barcelona, Spain. b Servei de Ressonància Magnètica Nuclear, Departament de Química. Universitat Autònoma de Barcelona, Bellaterra, Spain. c Unitat de Tuberculosi Experimental. Fundació Institut d'Investigació en Ciències de la Salut Germans Trias i Pujol. Edifici Laboratoris de Recerca. Crtra. de Can Ruti, Camí de les Escoles, s/n, 08916, Badalona (Spain) Electronic Supplementary Material (ESI) for Organic & Biomolecular Chemistry This journal is © The Royal Society of Chemistry 2012
Transcript of Chemoenzymatic synthesis, structural study and biological ... file1 Supplementary material...

1
Supplementary material
Chemoenzymatic synthesis, structural study and biological activity of
novel indolizidine and quinolizidine iminocyclitols
Livia Gómeza, Xavier Garraboua, Jesús Joglara, Jordi Bujonsa, Teodor Parellab, Cristina
Vilaplanac, Pere Joan Cardonac, Pere Clapésa*
aDept Biological Chemistry and Molecular Modeling. Instituto de Química Avanzada
de Cataluña, IQAC-CSIC. Jordi Girona 18-26, 08034 Barcelona, Spain. bServei de Ressonància Magnètica Nuclear, Departament de Química. Universitat
Autònoma de Barcelona, Bellaterra, Spain. cUnitat de Tuberculosi Experimental. Fundació Institut d'Investigació en Ciències de la
Salut Germans Trias i Pujol. Edifici Laboratoris de Recerca. Crtra. de Can Ruti, Camí
de les Escoles, s/n, 08916, Badalona (Spain)
Electronic Supplementary Material (ESI) for Organic & Biomolecular ChemistryThis journal is © The Royal Society of Chemistry 2012

2
Enzymatic inhibition assays against commercial glycosidases
Commercial glycosidase solutions were prepared with the appropriate buffer and
incubated in 96-well plates at 37ºC without (control) or with inhibitor (1.6 mM to 4.2
nM) during 3 min for -D-glucosidase, -D-glucosidase, -D-mannosidase, -L-
rhamnosidase, -L-fucosidase and 5 min for -D-galactosidase. After addition of the
corresponding substrate solution, incubations were prolonged during different time
periods: 10 min for -D-glucosidase, 3 min for -D-glucosidase, 6 min for-D-
mannosidase, 5 min for -L-rhamnosidase, 7 min for -L-fucosidase and 16 min for -
D-galactosidase and stopped by addition of Tris solution (50 L, 1 M) or glycine buffer
(180 L, 100 mM, pH 10), depending on the enzymatic inhibition assay. The amount of
p-nitrophenol formed was determined at 405 nm with UV/VIS Spectramax Plus
(Molecular Devices Corporation) spectrophotometer. -D-Glucosidase from rice
activity was determined with p-nitrophenyl--D-glucopyranoside (1 mM) in sodium
acetate buffer (50 mM, pH 5.0). -D-Glucosidase activity was determined with p-
nitrophenyl--D-glucopyranoside (1 mM) in sodium acetate buffer (100 mM, pH 5.0). -
D-Galactosidase activity was determined with p-nitrophenyl--D-galactopyranoside (1
mM) in sodium phosphate buffer (100 mM, 0.1 mM MgCl2, pH 7.2). -D-Mannosidase
activity was determined with p-nitrophenyl--D-mannopyranoside (1 mM) in sodium
acetate buffer (50 mM, pH 5.0). -L-Rhamnosidase activity was determined with p-
nitrophenyl--D-rhamnopyranoside (1 mM) in sodium acetate buffer (50 mM, pH 5.0).
-L-Fucosidase activity was determined with p-nitrophenyl--D-fucopyranoside (0.15
mM) in sodium acetate buffer (50 mM, pH 5.0). The commercial glycosidase solutions
were prepared as follows: -D-glucosidase (NH4)2SO4 suspension (100 L) in buffer (5
mL);-D-glucosidase: (0.1 mg mL–1 buffer), -D-galactosidase from Aspergillus oryzae
(0.5 mg mL–1 buffer), -L-rhamnosidase (naringinase) (0.3 mg mL–1 buffer); -D-
mannosidase (NH4)2SO4 suspension (25 L) in buffer (10 mL); -D-galactosidase from
bovine liver (0.1 mg mL–1 buffer), and -L-fucosidase (NH4)2SO4 suspension (33 L) in
buffer (10 mL).
Kinetics of inhibition. The nature of the inhibition against enzymes and the Ki values
were determined from the Lineweaver-Burk plots.
Electronic Supplementary Material (ESI) for Organic & Biomolecular ChemistryThis journal is © The Royal Society of Chemistry 2012

3
Inhibition assays against rat intestinal disaccharidases. Animals. Adult male
Sprague-Dawley rats weighing 200 g (n=2) (Harlan Ibèrica, Barcelona, Spain) were
housed in cages (n=2/cage) under controlled conditions of a 12 hours light:dark cycle,
with a temperature of 22 ± 3 ºC and a relative humidity of 40-70%. Rats were fed on a
standard diet (Panlab A04, Panlab, Barcelona, Spain) and water ad libitum. Handling
and sacrificing of the animals were in full accordance with the European Community
guidelines for the care and management of laboratory animals and the pertinent
permission was obtained from the CSIC Subcommittee of Bioethical issues (permit
number: CTQ2009-07359). Rats were fasted overnight and then anesthetized by
intramuscular injection of ketamine chlorhydrate (0.1 % v/weight of rat, (90 mg/kg
body wt ip) and xylacine (0.01 % v/weight of rat, 10 mg/kg body wt ip).
Preparation of gut mucosal suspension. Small intestine was removed, and carefully
divided into duodenum, jejunum and ileum. The jejunum was washed with ice-cold
isotonic saline, opened lengthwise and the mucosa scraped off with a microscope slide.
The jejunum mucosa was stored at –80ºC. The samples were diluted with ice-cold
isotonic saline (50 mg mucosa mL–1) and homogenized with a 2 mL glass homogenizer
(T10 basic Ultra-Turrax , IKA, Staufen, Germany).
Assay of disaccharidase activity. Disaccharidase activities, i.e. sucrase, lactase, maltase
and trehalase, in the homogenized jejunum mucosa were determined by the method of
Dahlqvist.1 Enzyme activity (µmol of substrate hydrolyzed per hour) were normalized
to protein content evaluated by the method of Bradford.2 The disaccharide substrates,
sucrose, lactose, maltose and trehalose, were purchased at the highest purity available
(Sigma Chemical Co.) Substrates and inhibitors were prepared in distilled water. The
concentrations used in the assay were 0.02 M for disaccharides, and a range from 2 mM
down for inhibitors. The homogenized mucosa was diluted four times for the sucrose
and trehalase assays; one time for the lactase assay and 25 times for the maltase activity
and protein determination assays. Inhibitors and suitably diluted homogenized mucosa
were pre incubated for 30 minutes at 37 ºC. Then, the reaction was carried out by the
addition of the substrate in phosphate buffer pH 6.8. Substrate, inhibitor and
homogenized mucosa were incubated together for 30 min at 37 ºC and agitation (250
r.p.m.). The reaction was terminated by the addition of Tris-glucose oxidase-peroxidase
reagent: Tris 0.5 M; 4-hydroxybenzoic acid 10 mM; 4-aminoantipyrine 0.4 mM; glucose
oxidase 1480 U L–1, peroxidase 250 U L–1, pH 7.3. Glucose is transformed in gluconic
Electronic Supplementary Material (ESI) for Organic & Biomolecular ChemistryThis journal is © The Royal Society of Chemistry 2012

4
acid and hydrogen peroxide by glucose oxidase. Peroxidase catalyses the combination
of hydrogen peroxide with 4-aminoantipiryne generating a stable and colored
compound. After a further incubation of 2 hours this product was measured
spectrophotometrically at 505 nm.
Electronic Supplementary Material (ESI) for Organic & Biomolecular ChemistryThis journal is © The Royal Society of Chemistry 2012
5
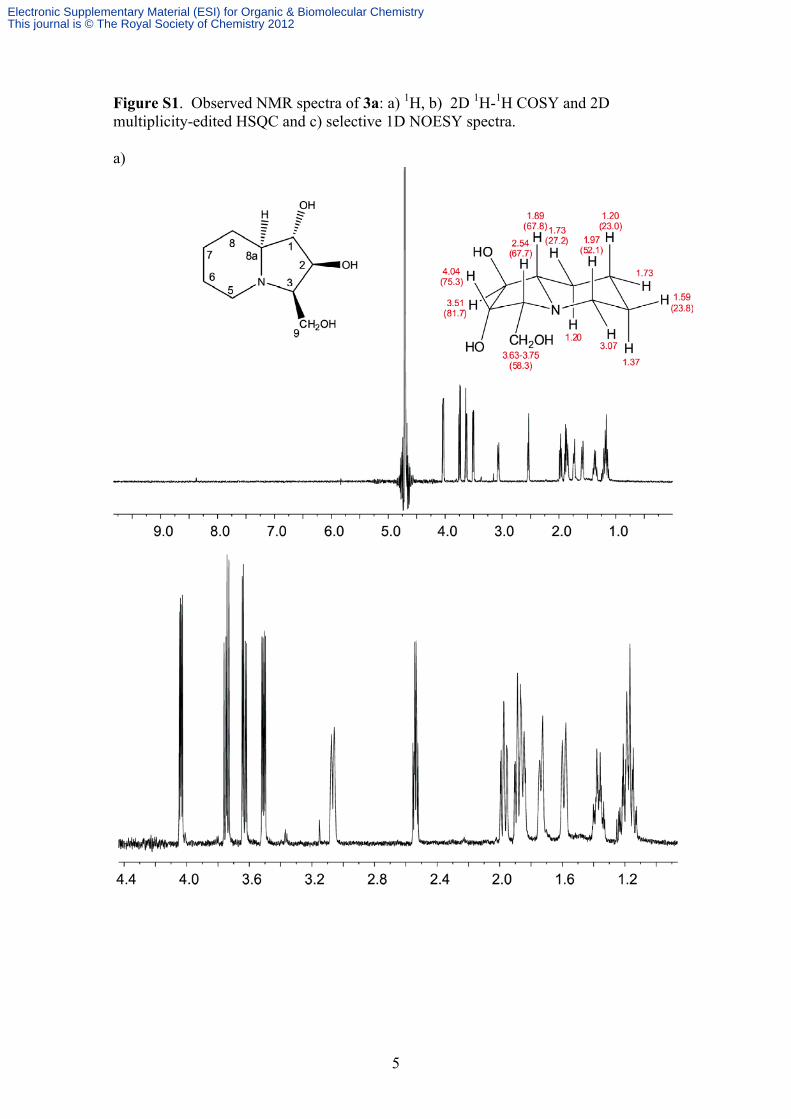
Figure S1. Observed NMR spectra of 3a: a) 1H, b) 2D 1H-1H COSY and 2D multiplicity-edited HSQC and c) selective 1D NOESY spectra. a)
Electronic Supplementary Material (ESI) for Organic & Biomolecular ChemistryThis journal is © The Royal Society of Chemistry 2012

6
b)
Electronic Supplementary Material (ESI) for Organic & Biomolecular ChemistryThis journal is © The Royal Society of Chemistry 2012

7
c)
Electronic Supplementary Material (ESI) for Organic & Biomolecular ChemistryThis journal is © The Royal Society of Chemistry 2012
8
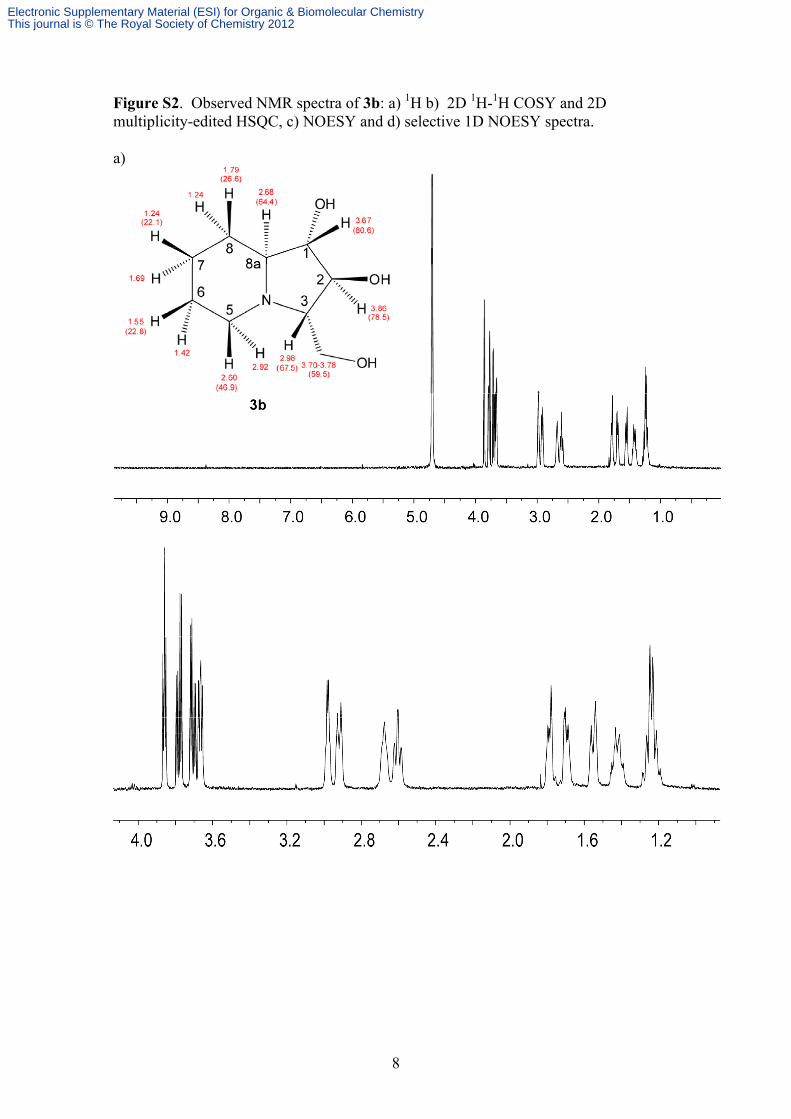
Figure S2. Observed NMR spectra of 3b: a) 1H b) 2D 1H-1H COSY and 2D multiplicity-edited HSQC, c) NOESY and d) selective 1D NOESY spectra. a)
Electronic Supplementary Material (ESI) for Organic & Biomolecular ChemistryThis journal is © The Royal Society of Chemistry 2012

9
b)
Electronic Supplementary Material (ESI) for Organic & Biomolecular ChemistryThis journal is © The Royal Society of Chemistry 2012

10
c)
3.86(78.5)
3.67(80.6)
2.68(64.4)
1.79(26.6)
1.24
2.60(46.9)
1.24(22.1)
1.55(22.8)
1.69
1.42
2.92
N
OH
OH
H
OH
1
2
35
6
78
8a
H
H
H
H
H
H
HH H
H
H
3.70-3.78(59.5)
2.98(67.5)
1.01.41.82.22.63.03.43.84.2
0.5
1.0
1.5
2.0
2.5
3.0
3.5
4.0
4.5
Electronic Supplementary Material (ESI) for Organic & Biomolecular ChemistryThis journal is © The Royal Society of Chemistry 2012

11
d)
Electronic Supplementary Material (ESI) for Organic & Biomolecular ChemistryThis journal is © The Royal Society of Chemistry 2012

12
Figure S3. Observed NMR spectra of 3c: a) 1H b) 2D 1H-1H COSY and 2D multiplicity-edited HSQC and c) 2D NOESY spectra. a)
Electronic Supplementary Material (ESI) for Organic & Biomolecular ChemistryThis journal is © The Royal Society of Chemistry 2012

13
b)
Electronic Supplementary Material (ESI) for Organic & Biomolecular ChemistryThis journal is © The Royal Society of Chemistry 2012

14
c)
Electronic Supplementary Material (ESI) for Organic & Biomolecular ChemistryThis journal is © The Royal Society of Chemistry 2012

15
Figure S4. Observed NMR spectra of 3d: a) 1H, b) 2D 1H-1H COSY and 2D multiplicity-edited HSQC, c) 2D NOESY and d) selective 1D NOESY spectra. a)
Electronic Supplementary Material (ESI) for Organic & Biomolecular ChemistryThis journal is © The Royal Society of Chemistry 2012

16
b)
1.21.62.02.42.83.23.64.0
1.0
1.5
2.0
2.5
3.0
3.5
4.0
1.21.62.02.42.83.23.64.0
10
20
30
40
50
60
70
80
Electronic Supplementary Material (ESI) for Organic & Biomolecular ChemistryThis journal is © The Royal Society of Chemistry 2012

17
c)
1.01.52.02.53.03.54.0
1
2
3
4
5
Electronic Supplementary Material (ESI) for Organic & Biomolecular ChemistryThis journal is © The Royal Society of Chemistry 2012

18
d)
Electronic Supplementary Material (ESI) for Organic & Biomolecular ChemistryThis journal is © The Royal Society of Chemistry 2012
19
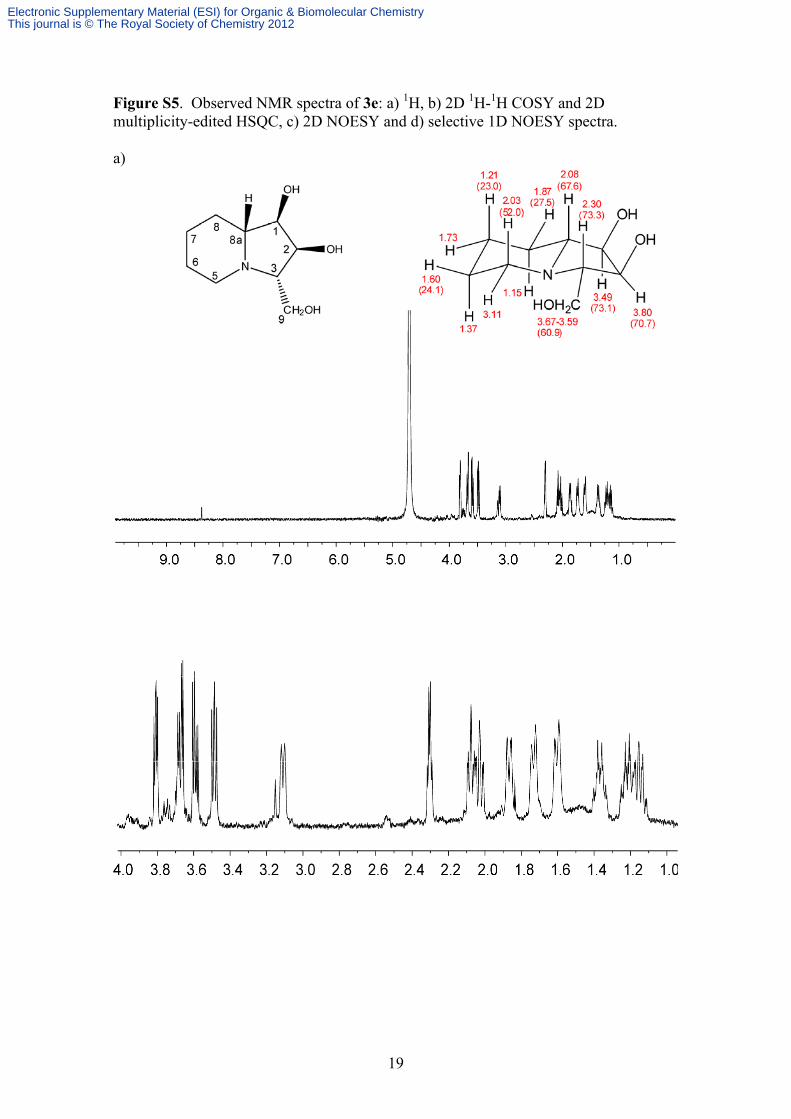
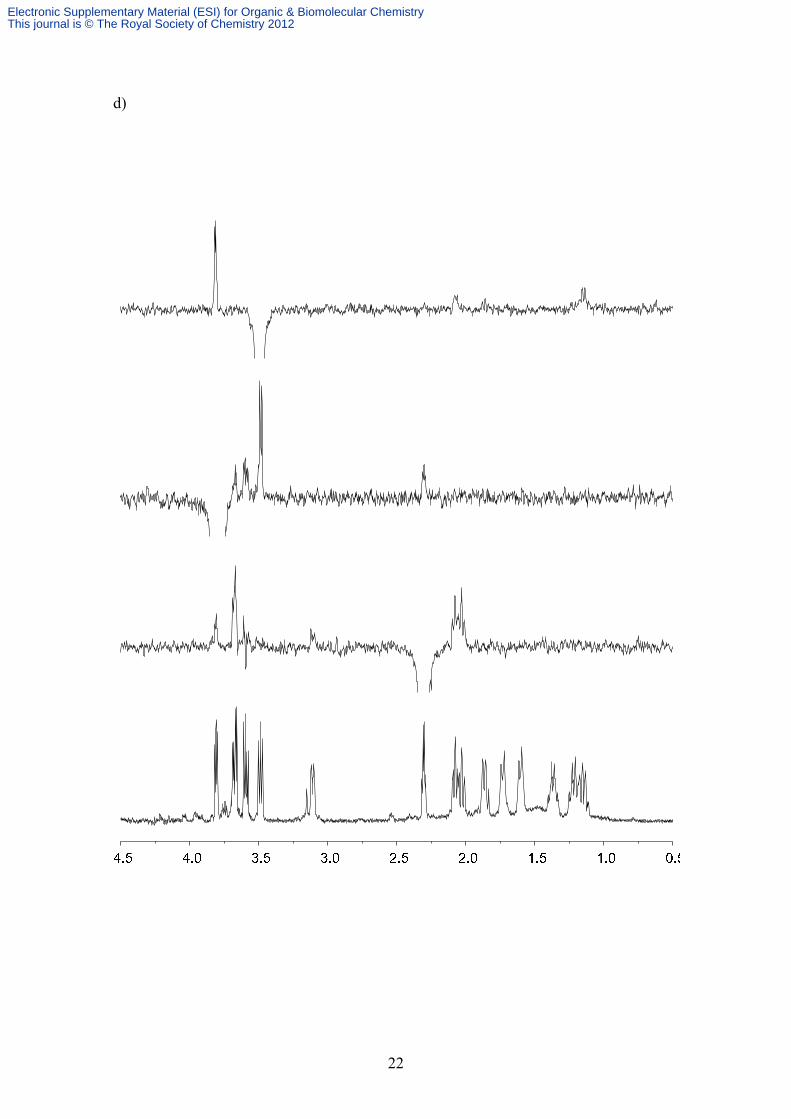
Figure S5. Observed NMR spectra of 3e: a) 1H, b) 2D 1H-1H COSY and 2D multiplicity-edited HSQC, c) 2D NOESY and d) selective 1D NOESY spectra. a)
Electronic Supplementary Material (ESI) for Organic & Biomolecular ChemistryThis journal is © The Royal Society of Chemistry 2012

20
b)
Electronic Supplementary Material (ESI) for Organic & Biomolecular ChemistryThis journal is © The Royal Society of Chemistry 2012

21
c)
Electronic Supplementary Material (ESI) for Organic & Biomolecular ChemistryThis journal is © The Royal Society of Chemistry 2012
22
d)
Electronic Supplementary Material (ESI) for Organic & Biomolecular ChemistryThis journal is © The Royal Society of Chemistry 2012
23
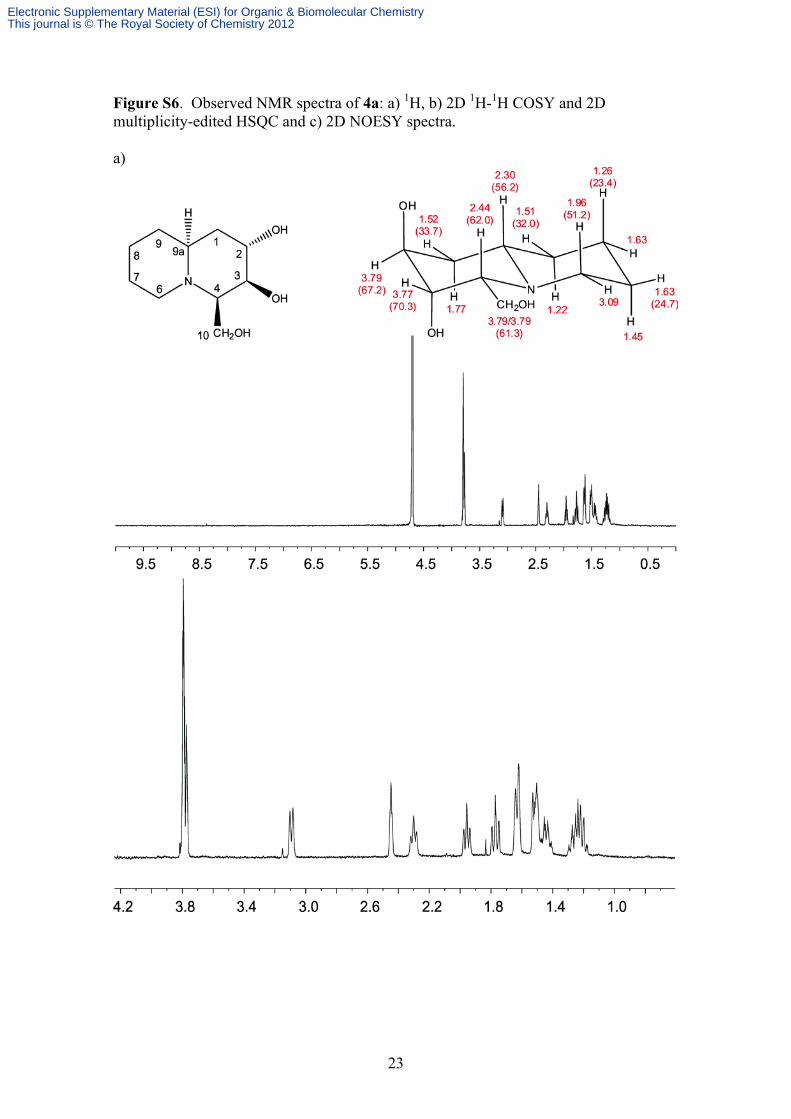
Figure S6. Observed NMR spectra of 4a: a) 1H, b) 2D 1H-1H COSY and 2D multiplicity-edited HSQC and c) 2D NOESY spectra. a)
Electronic Supplementary Material (ESI) for Organic & Biomolecular ChemistryThis journal is © The Royal Society of Chemistry 2012

24
b)
Electronic Supplementary Material (ESI) for Organic & Biomolecular ChemistryThis journal is © The Royal Society of Chemistry 2012

25
c)
Electronic Supplementary Material (ESI) for Organic & Biomolecular ChemistryThis journal is © The Royal Society of Chemistry 2012

26
Figure S7. Observed NMR spectra of 4b as mixture with compounds 4c and 4f: a) 1H, b) 2D 1H-1H COSY and 2D multiplicity-edited HSQC and c) selective 1D NOESY spectra. a)
Electronic Supplementary Material (ESI) for Organic & Biomolecular ChemistryThis journal is © The Royal Society of Chemistry 2012

27
b)
Electronic Supplementary Material (ESI) for Organic & Biomolecular ChemistryThis journal is © The Royal Society of Chemistry 2012

28
nOe’s relations deduced from the NOESY spectra of Figure 8 (spectra mixture of compounds 4c and 4b.
Electronic Supplementary Material (ESI) for Organic & Biomolecular ChemistryThis journal is © The Royal Society of Chemistry 2012

29
Figure S8. Observed NMR spectra of 4c as a mixture with compound 4b: a) 1H, b) 2D 1H-1H COSY and 2D multiplicity-edited HSQC, c) 2D NOESY and d) selective 1D NOESY spectra. a)
Electronic Supplementary Material (ESI) for Organic & Biomolecular ChemistryThis journal is © The Royal Society of Chemistry 2012

30
b)
1.21.62.02.42.83.23.64.0
1.0
1.5
2.0
2.5
3.0
3.5
4.0
1.41.82.22.63.03.43.84.2
20
30
40
50
60
70
80
Electronic Supplementary Material (ESI) for Organic & Biomolecular ChemistryThis journal is © The Royal Society of Chemistry 2012

31
c)
N
H
OH
OH
1.44(24.1)
1.37(24.5)
1.54(18.4)
1.60(34.9)
3.36(71.8)
1.80
1.77
1.32
1.70
3.19
3.72(68.6)
1
2
4
10
6
7
8 9a
9
3
H
HH
H
H
HH
H
HH
H
H
H
OH3.86-3.86(57.1)
2.97(58.6)2.72
(49.1)
3.08(56.1)
Electronic Supplementary Material (ESI) for Organic & Biomolecular ChemistryThis journal is © The Royal Society of Chemistry 2012

32
d)
Electronic Supplementary Material (ESI) for Organic & Biomolecular ChemistryThis journal is © The Royal Society of Chemistry 2012

33
Figure S9. Observed NMR spectra of 4d: a) 1H, b) 2D 1H-1H COSY and 2D multiplicity-edited HSQC, c) selective 1D NOESY spectra. a)
Electronic Supplementary Material (ESI) for Organic & Biomolecular ChemistryThis journal is © The Royal Society of Chemistry 2012

34
b)
Electronic Supplementary Material (ESI) for Organic & Biomolecular ChemistryThis journal is © The Royal Society of Chemistry 2012

35
c)
Electronic Supplementary Material (ESI) for Organic & Biomolecular ChemistryThis journal is © The Royal Society of Chemistry 2012

36
Figure S10. Observed NMR spectra of 4e: a) 1H, It was assigned using the NMR
spectra of the mixture of 4e and 4f (see Figure 11).
Electronic Supplementary Material (ESI) for Organic & Biomolecular ChemistryThis journal is © The Royal Society of Chemistry 2012

37
Figure S11. Observed NMR spectra of 4f containing 4e (1:1): a) 1H, b) 2D 1H-1H COSY and 2D multiplicity-edited HSQC, c) selective 1D NOESY spectra. a)
Electronic Supplementary Material (ESI) for Organic & Biomolecular ChemistryThis journal is © The Royal Society of Chemistry 2012

38
b)
Electronic Supplementary Material (ESI) for Organic & Biomolecular ChemistryThis journal is © The Royal Society of Chemistry 2012

39
c)
Electronic Supplementary Material (ESI) for Organic & Biomolecular ChemistryThis journal is © The Royal Society of Chemistry 2012

40
Figure S12. Observed 1H NMR spectra of pure 4f. The characterization was carried out on the spectra of Figure 11.
Electronic Supplementary Material (ESI) for Organic & Biomolecular ChemistryThis journal is © The Royal Society of Chemistry 2012

41
Table S1. Relevant NMR chemical shift values for indolizidine derivatives 3a-e in
D2O.
Compound (H8a) (H3) (H5/H5’) (C5) (C1) (C2) (C9)
3a 1.89 2.54 3.07/1.97 52.1 81.7 75.3 58.3
3b 2.68 2.98 2.92/2.60 46.9 80.6 78.5 59.5
3c 2.96 3.41 3.02/2.82 47.1 73.6 69.7 57.8
3d 2.31 2.25 3.18/2.07 52.5 77.8 79.5 60.9
3e 2.08 2.30 3.11/2.03 52.0 73.1 70.7 60.9
Table S2. Relevant NMR parameters for quinolizidine derivatives 4a-f in D2O.
Compound (H9a) (H4) (H6/H6’) (C6) (C9) (C10)
4a 2.30 2.44 3.09/1.96 51.2 32.0 61.3
4b 2.23 2.35 3.17/2.05 51.3 31.7 61.0
4c 3.08 2.97 3.19/2.72 49.1 24.5 57.1
4d 2.03 1.85 3.16/1.85 51.2 32.1 58.2
4e 2.74 2.92 2.67/2.67 ~51.4 ~31.7 55.9
4f 2.36 2.30 3.26/2.02 51.0 31.7 57.8
Electronic Supplementary Material (ESI) for Organic & Biomolecular ChemistryThis journal is © The Royal Society of Chemistry 2012

42
Figure S13. Lineweaver-Burk double reciprocal plots of 3a-e, 4e and 4f inhibitions of
-L-rhamnosidase from Penicillium decumbens.
Electronic Supplementary Material (ESI) for Organic & Biomolecular ChemistryThis journal is © The Royal Society of Chemistry 2012

43
Figure S14. Lineweaver-Burk double reciprocal plots of 3c inhibitions of -L-
fucosidase from bovine and -L-mannosidase from jack beans, and 3b inhibition of -
D-glucosidase from rice.
Electronic Supplementary Material (ESI) for Organic & Biomolecular ChemistryThis journal is © The Royal Society of Chemistry 2012

44
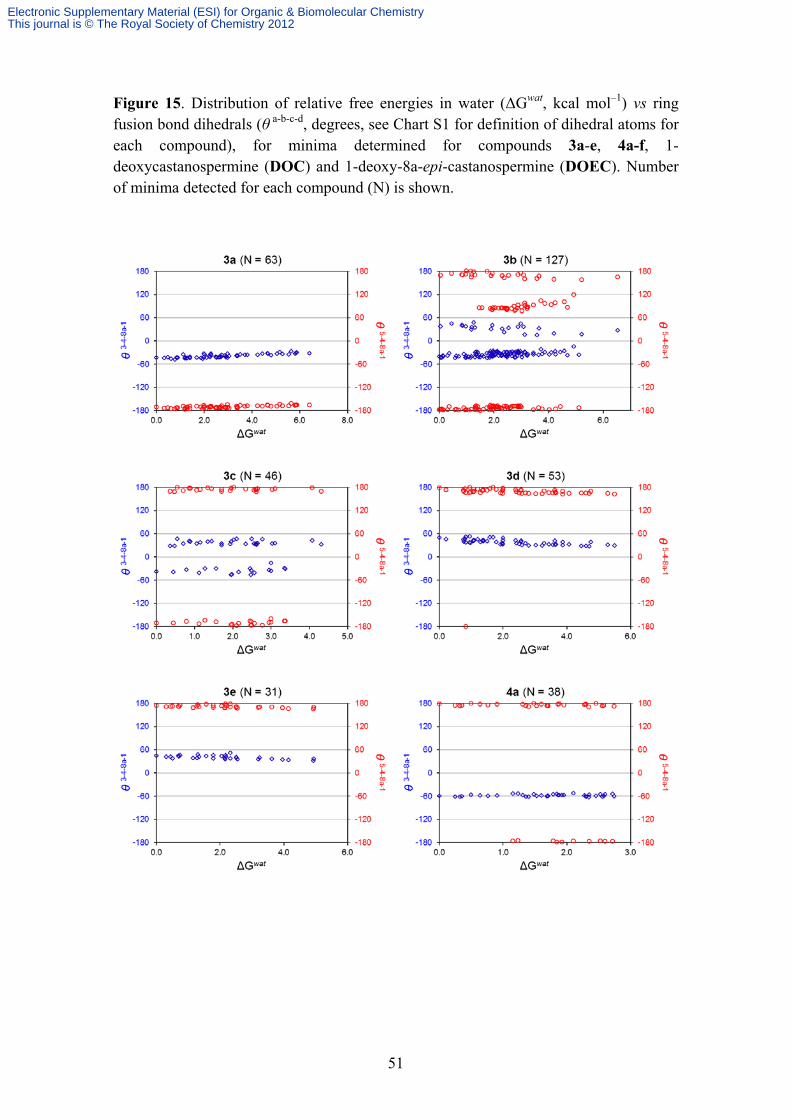
In silico conformational analysis
An in silico conformational analysis of compounds 3a-e and 4a-f was carried out by
using density functional theory (DFT) calculations. For this purpose, an initial
molecular mechanics conformational search was performed. Then, all the minima
located for each compound were reminimized at the B3LYP/6-31G** level with
implicit water solvation conditions and, finally, the energies in solution of all the new
minima were recalculated using the larger basis set cc-pVTZ(-f). The same protocol was
applied to two additional model compounds, 1-deoxycastanospermine (DOC) and 1-
deoxy-8a-epi-castanospermine (DOEC), which have been reported to adopt 8C5 and 5C8
structures, respectively, in solution.3
Thus, the conformational analysis of DOC yielded 25 stereoisomers within 2.0 kcal
mol-1 from the lowest energy minimum (Figure 15), which differed mainly in the
orientation of the three equatorial hydroxyl groups, showing in all cases a trans ring
fusion 4 and a 8C5 chair conformation for the polyhydroxylated ring (Chart 1), in good
agreement with the experimental observations.3 On the other hand, DOEC yielded 33
structures within 5.0 kcal mol-1 from the lowest energy minimum (Figure 13). Among
these, the most stable stereoisomer adopted a trans-5C8 disposition with three axial
hydroxyl groups, while cis-8C5 conformations, appearing by inversion of the chair and
the nitrogen atom and with the three hydroxyl groups in equatorial, were also detected
at >1.0 kcal mol–1 above the lowest energy minimum (Chart 1, Figure 15 and Table 1).
According to the relative free energies in solution of the whole set of DOEC
stereoisomers, an 81:19 population ratio of trans-5C8 to cis-8C5 stereosiomers in water
solution could be estimated, which also agrees fairly well with the experimental
observations.3
Electronic Supplementary Material (ESI) for Organic & Biomolecular ChemistryThis journal is © The Royal Society of Chemistry 2012

45
The most stable structure of compound 3a shows a trans ring fusion (i.e. inversion of
nitrogen configuration) and a chair-envelope (8C5-E8a) conformation for the 6- and 5-
membered rings (Chart 1). In agreement with the NMR data, the trans ring fusion and
the chair conformation for the 6-membered ring are maintained in all structures detected
up to about 7 kcal mol–1, although alternative envelope conformations for the 5-
membered ring appear at the higher energies. Similarly, the most stable stereoisomer of
compound 3b is trans-8C5-E8a. However, a cis-8C5-E4 stereoisomer with almost the
same free energy and a cis-5C8-E8a conformer at ~1.5 kcal mol–1 are also detected (Chart
1, Table 1). Taking into account all the structures detected up to about 6.0 kcal mol–1
above the lowest energy minimum, a 74:26 trans-cis population ratio could be estimated
for 3b in water solution (Figure 13), which agrees with the NMR results. Moreover, the
lowest energy minimum detected for compound 3c shows a cis-5C8-E8a stereochemistry
that coexists with a trans-5C8-3E appearing at about 0.4 kcal mol–1 (Chart 1, Table 1),
which also agrees with the NMR results. Both structures are stabilized by
intramolecular hydrogen-bonds between the hydroxymethyl and one of the hydroxyl
groups (Chart 1). The estimated trans-cis population ratio is in this case 57:43 (Figure
15). Finally, in the indolizidine series, compounds 3d and 3e show trans-5C8-8aE
structures as the most stable ones, and all the stereoisomers detected up to about 6.0
kcal mol–1 maintain the trans ring fusion and the 5C8 chair, consistent with the NMR
data.
In the quinolizidine series, compounds 4a and 4b show the lowest energy minima with
trans-9C6-1C4 geometry stabilized by intramolecular hydrogen bonds between the 4-
hydroxymethyl and the 3-hydroxyl groups (Chart 1). This trans-9C6-1C4 arrangement is
maintained in all structures detected up to about 3 kcal mol–1 (Figure 15). Similarly,
compounds 4d and 4f show a trans-6C9-4C1 disposition for their global energy minima,
Electronic Supplementary Material (ESI) for Organic & Biomolecular ChemistryThis journal is © The Royal Society of Chemistry 2012

46
and this type of arrangement is also common to all their minima detected up to 3.0 kcal
mol–1 (Figure 15). On the other hand, compounds 4c and 4e show lowest energy
minima with trans-9C6-1C4 and trans-6C9-
4C1 geometry, respectively. However, both of
them yielded cis stereoisomers that contribute at higher energies, resulting on estimated
trans-cis population ratios of 52:48 for 4c and 96:4 for 4e (Figure 15).
Electronic Supplementary Material (ESI) for Organic & Biomolecular ChemistryThis journal is © The Royal Society of Chemistry 2012
47
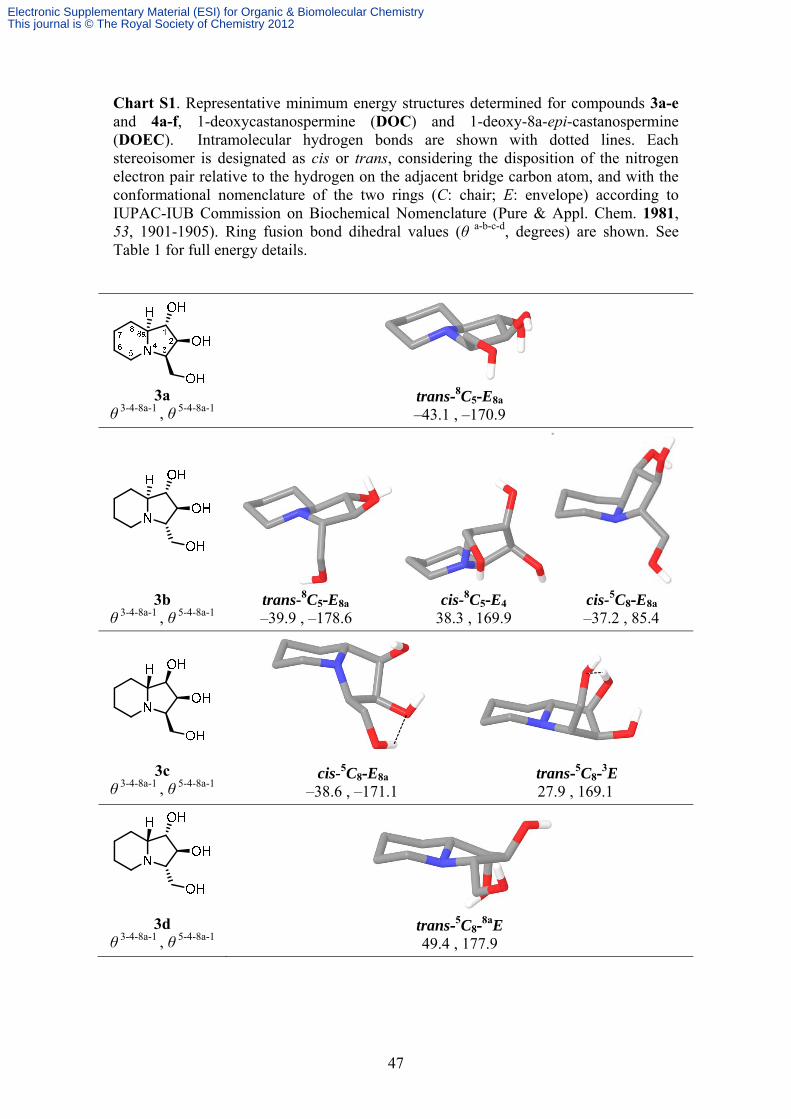
Chart S1. Representative minimum energy structures determined for compounds 3a-e and 4a-f, 1-deoxycastanospermine (DOC) and 1-deoxy-8a-epi-castanospermine (DOEC). Intramolecular hydrogen bonds are shown with dotted lines. Each stereoisomer is designated as cis or trans, considering the disposition of the nitrogen electron pair relative to the hydrogen on the adjacent bridge carbon atom, and with the conformational nomenclature of the two rings (C: chair; E: envelope) according to IUPAC-IUB Commission on Biochemical Nomenclature (Pure & Appl. Chem. 1981, 53, 1901-1905). Ring fusion bond dihedral values (θ a-b-c-d, degrees) are shown. See Table 1 for full energy details.
3a
θ 3-4-8a-1 , θ 5-4-8a-1
trans-8C5-E8a –43.1 , –170.9
3b θ 3-4-8a-1 , θ 5-4-8a-1
trans-8C5-E8a cis-8C5-E4 cis-5C8-E8a –39.9 , –178.6 38.3 , 169.9 –37.2 , 85.4
3c θ 3-4-8a-1 , θ 5-4-8a-1
cis-5C8-E8a trans-5C8-3E
–38.6 , –171.1 27.9 , 169.1
3d θ 3-4-8a-1 , θ 5-4-8a-1
trans-5C8-
8aE 49.4 , 177.9
Electronic Supplementary Material (ESI) for Organic & Biomolecular ChemistryThis journal is © The Royal Society of Chemistry 2012

48
3e θ 3-4-8a-1 , θ 5-4-8a-1
trans-5C8-
8aE 44.3 , 174.4
4a θ 4-5-9a-1 , θ 6-5-9a-1
trans-9C6-1C4
–59.9 , 175.4
4b
θ 4-5-9a-1 , θ 6-5-9a-1
trans-9C6-
1C4
–57.4 , 178.4
4c θ 4-5-9a-1 , θ 6-5-9a-1
trans-9C6-1C4 cis-9C6-
4C1 cis-6C9-1C4
–52.7 , 177.0 56.4 , –172.9 –55.7, 77.5
4d
θ 4-5-9a-1 , θ 6-5-9a-1
trans-6C9-4C1
56.4 , –177.2
4e θ 4-5-9a-1 , θ 6-5-9a-1
trans-6C9-4C1 cis-9C6-
4C1
56.4 , –173.4 54.8 , -75.7
Electronic Supplementary Material (ESI) for Organic & Biomolecular ChemistryThis journal is © The Royal Society of Chemistry 2012

49
4f θ 4-5-9a-1 , θ 6-5-9a-1
trans-6C9-4C1
48.5 , 174.6
DOC*
θ 5-4-8a-8 , θ 3-4-8a-8
trans-4E-8C5 64.1 , –166.3
DOEC* θ 5-4-8a-8 , θ 3-4-8a-8
trans-E4-
5C8 cis- E4-8C5
–65.1 , 166.8 53.3 , 173.6 * Numbering of fused ring system according to Patil et al.3
Electronic Supplementary Material (ESI) for Organic & Biomolecular ChemistryThis journal is © The Royal Society of Chemistry 2012

50
Table S3. Gas phase energy (Egp, hartrees), zero point energy (ZPE, kcal mol–1), enthalpic (ΔH, kcal mol–1) and entropic (ΔS, cal mol–1) corrections at 298.15 K, solvation energy (Esol, kcal mol–1) and relative Gibbs free energies in water solution
(Gwat, kcal mol–1), determined through density functional theory calculations at B3LYP/cc-pVTZ(-f) level, for the representative minimum energy structures of compounds 3a-e, 4a-f, 1-deoxycastanospermine (DOC) and 1-deoxy-8a-epi-castanospermine (DOEC) shown in Chart 1.
Compound and conformation
Egp ZPE ΔH ΔS Esol ΔGwat
3a trans-8C5-E8a -633.812764 170.94 8.08 105.48 -18.49 0.00
3b trans-8C5-E8a
cis-8C5-E4
cis-5C8-E8a
-633.809017 -633.806935 -633.801656
170.91 170.89 170.80
8.16 8.12 8.15
106.55 106.16 106.44
-18.02 -19.32 -21.10
0.00 0.07 1.45
3c cis-5C8-E8a
trans-5C8-3E
-633.815424 -633.815691
171.08 171.20
8.00 7.93
104.61 103.85
-14.51 -14.24
0.00 0.38
3d trans-5C8-8aE -633.812316 170.86 8.16 106.38 -18.15 0.00
3e trans-5C8-8aE -633.812863 170.99 8.10 105.98 -18.82 0.00
4a trans-9C6-1C4 -673.138649 189.36 8.72 109.87 -19.02 0.00
4b trans-9C6-1C4 -673.143543 189.47 8.70 109.55 -17.01 0.00
4c trans-9C6-1C4
cis-9C6-4C1
cis-6C9-1C4
-673.137109 -673.140209 -673.136600
189.50 189.40 189.34
8.67 8.79 8.79
109.30 110.45 110.67
-19.10 -16.49 -15.90
0.00 0.35 3.08
4d trans-6C9-4C1 -673.142973 189.40 8.82 110.87 -17.16 0.00
4e trans-6C9-4C1
cis-9C6-4C1
-673.143307 -673.140140
189.60 189.55
8.71 8.70
109.82 109.72
-16.62 -16.68
0.00 1.90
4f trans-6C9-4C1 -673.145062 189.68 8.68 109.55 -15.70 0.00
DOC trans-4E-8C5 -594.492000 152.54 7.29 99.11 -17.05 0.00
DOEC trans-E4-5C8
cis-E4-8C5
-594.488048 -594.483351
152.46 152.55
7.28 7.29
99.00 99.14
-16.62 -18.59
0.00 1.04
Electronic Supplementary Material (ESI) for Organic & Biomolecular ChemistryThis journal is © The Royal Society of Chemistry 2012
51
Figure 15. Distribution of relative free energies in water (ΔGwat, kcal mol–1) vs ring fusion bond dihedrals (θ a-b-c-d, degrees, see Chart S1 for definition of dihedral atoms for each compound), for minima determined for compounds 3a-e, 4a-f, 1-deoxycastanospermine (DOC) and 1-deoxy-8a-epi-castanospermine (DOEC). Number of minima detected for each compound (N) is shown.
Electronic Supplementary Material (ESI) for Organic & Biomolecular ChemistryThis journal is © The Royal Society of Chemistry 2012

52
Electronic Supplementary Material (ESI) for Organic & Biomolecular ChemistryThis journal is © The Royal Society of Chemistry 2012

53
References
1. A. Dahlqvist, Anal. Biochem., 1964, 7, 18-25. 2. M. M. Bradford, Anal. Biochem., 1976, 72, 248-254. 3. N. T. Patil, J. N. Tilekar and D. D. Dhavale, Tetrahedron Lett., 2001, 42, 747-749; N. T. Patil, J. N. Tilekar and D. D. Dhavale, J. Org. Chem., 2001, 66, 1065-1074. 4. Cis/trans ring fusion can arise from inversion of the configuration of the bridgehead nitrogen, which normally is associated with a confomational change on one or both rings of the indolizidine or quinolizidine.
Electronic Supplementary Material (ESI) for Organic & Biomolecular ChemistryThis journal is © The Royal Society of Chemistry 2012


![Steviamine, a new class of indolizidine alkaloid [(1R,2S ... · methyl-5-methyloctahydroindolizine-1,2-diol hydrobromide] ... recently isolated from the leaves of Stevia ... Isolation](https://static.fdocuments.in/doc/165x107/5b07411b7f8b9abf568e35b3/steviamine-a-new-class-of-indolizidine-alkaloid-1r2s-2-diol-hydrobromide.jpg)


![Chemoenzymatic and enantiodivergent routes to 1,2-ring ... · S1 Supporting Information for: Chemoenzymatic and enantiodivergent routes to 1,2-ring-fused bicyclo[2.2.2]octane and](https://static.fdocuments.in/doc/165x107/5d5f6e2d88c99370518b8355/chemoenzymatic-and-enantiodivergent-routes-to-12-ring-s1-supporting-information.jpg)
