Chemistry Lab CHP1L, PEET 3, WS 07/08 Oertel / Iwaneczko ... englisch WS 07-08.pdf · CHP1L_03...
16
Chemistry Lab CHP1L, PEET 3, WS 07/08 Oertel / Iwaneczko L207, Tuesdays, 13:45 – 17:00 1 CHP1L_01 Errors in Quantitative Chemical Analysis (pipetting practice) CHP1L_02 Determination of Solubility of Salts CHP1L_03 Preparation, Standardization und Titer Determination of a Standard Solution (0.1M NaOH) CHP1L_04 Argentometric Determination of Chloride (Chloride according to Fajans) CHP1L_05 Acid Content Determination of Vinegar (Potentiometry)
Transcript of Chemistry Lab CHP1L, PEET 3, WS 07/08 Oertel / Iwaneczko ... englisch WS 07-08.pdf · CHP1L_03...

Chemistry Lab CHP1L, PEET 3, WS 07/08
Oertel / Iwaneczko
L207, Tuesdays, 13:45 – 17:00
1
CHP1L_01 Errors in Quantitative Chemical Analysis (pipetting practice)
CHP1L_02 Determination of Solubility of Salts
CHP1L_03 Preparation, Standardization und Titer Determination of a Standard Solution (0.1M NaOH)
CHP1L_04 Argentometric Determination of Chloride (Chloride according to Fajans)
CHP1L_05 Acid Content Determination of Vinegar (Potentiometry)

2
General Information about the Chemistry Lab (PEET3) WS 07/08
The lab rooms are located in building L, rooms No. 207 and 208. The lab is supervised by Dr. Oertel and Mr. Peter Iwaneczko. Prior to the lab a safety briefing will take place. Participation is obligatory.
You need
• a long-slieve lab coat (100 % cotton or cotton-blended fabric, non-inflammable),
• paper, ruler, pocket calculator, plotting paper,
• a water-resistant marker (EDDING 400)
• a pair of protective gloves.
For operating the experiments we provide a collection of instructions including the safety instructions. At least for safety reasons it’s required that you inform yourself about the following details when you prepare the lab at home:
• Which experiment has to be done,
• Understand the procedure (it’s easier to read twice than to do the experiment twice),
• How do the (glass) instruments that are mentioned in the instructions look like, as well: which is the size of beakers and flasks,
• Which safety instructions have to be observed,
• How to deal with waste chemicals and waste solvents,
If lab supervisors feel that you did not attend to your information duties, you are excluded from the lab !
You are allocated a workplace by the lab supervisors. Workplace and used instruments have to be handed over cleanly at the end of the lab day. Operations with toxic or strongly smelling agents as well as operations at elevated pressure or at vacuum must be executed under the fume cupboard.
Get used to an absolutely clean working method. This will facilitate doing the experiments successfully. Tabletops and lab balances are to be consigned clean! Generally avoid unnecessary contact of any items with chemicals. For that reason put down spatulas, pipets etc. in a beaker or other appropriate containers. Soiled work spaces must be cleaned immediately. Avoid blocking of sinks with cloths or paper towels. If a sink is blocked, inform the supervisors. Storage of chemicals is only allowed closed, labeled containers!
For protection against contact with harmful agents (e.g. occurs when handling chemicals) protective gloves have to be worn. Inhaling of harmful dusts and vapors has to be avoided by operating under the fume cupboard. If you are pregnant, inform your supervisor.
It’s obligatory to wear lab coats and safety goggles (holds for students with spectacles, too). Do not wear contact lenses.
The practical part in the lab is completed with a data report. The data report contains
• Name, student’s ID, date of experiment,
• all measuring parameters,

3
• calculations,
• general observations,
• modifications with respect to the instructions,
• physical data that are measured during the lab; in short: everything you want to revert to in case of doubt.
The data reports are signed and ackowledged by the supervisors. Only acknowledged data reports are valid.
The lab work is documented in a lab report, one for each experiment. You will not be allowed to start a new experiment without submitting the previous report.
A lab report has to comprise the following topics:
1. instruction sheets with name, course, date of the experiment,
2. acknowledged data report
3. evaluation, equations and tables used for calculations, results, eventually diagrams ,
4. discussion of the results, error discussion, answers to the questions.

4
Calculation of Analytical Results
The point in quantitative analysis is to determine a sample’s content of a compound (e.g. chloride, acid, Fe2+). For that reason chemical quantities, or “concentration” measures, are required. An analytical result can be given in all quantities or concentration measures that are listed in the table below.
Quantity Symbol Unit Definition Mass m g Base unit Amount of substance n mol Base unit,
n(X) = m(X)/M(X) Volume V L derived unit Density ρ g/cm³ ρ = m(solution)/V(solution) Relative molar mass M g/mol M(X) = m(X)/n(X)
m: mass X; n(X): number of moles of substance X
Mole fraction x mol/mol x(X) = n(X)/(n(X) + n(Y)) n(X): number of moles of component X n(Y): number of moles of component Y
Mass fraction w g/g w(X) = m(X)/m(Mi) m(Mi): mass of the mixture
Volume fraction ϕ L/L; mL/mL
ϕ(X) = V(X)/(V(X) + V(Y)) V(X): volume of component X
Molar concentration, molarity
c mol/L c(x) = n(X)/V(Mi)
Mass concentration β g/L β = m(X)/V(Mi) Molality b mol/kg
solvent b(X) = n(X)/m(LM) m(LM): mass of solvent
Titer t 1 t = c(ist)(X)/c(soll)(X)
Table 1: Chemical quantities
Literature:
1. E. Schmittel, G. Bouchée, W.-R. Less: Labortechnische Grundoperationen, Bd. 1; 2. T. Gübitz, G. Haubold, C. Stoll: Analytisches Praktikum - Quantitative Analyse, Bd. 2;
beide in der Reihe: Die Praxis der Labor- und Produktionsberufe (Hrsg.: U. Gruber und W. Klein), VCH Verlagsgesellschaft, Weinheim 1989.
3. All General Chemistry textbooks
5
Accuracy and Precision of Measurement Every measuring result shows inaccuracies for various reasons. Up to a certain fault tolerance limit they can and must (!) be accepted. It has to be verified, which kinds of errors occur and if they can be reduced or can be avoided.
Accuracy: The closeness of agreement between a measured value and the defined or concerted reference value, whereas the reference value can be the true, the accurate or the expected value. In accuracy the parameters trueness and precision are combined. Those are the most important terms to characterize the reliability of measurements.
Trueness: If multiple values have been aquired at a measurement, the arithmetic mean can be generated from them. The mean x is the ratio of the sum of all single results of determination xi and the number of measurements n:
n
ixx
∑=
Gl. 1 The trueness of a measurement is dependent on the difference between the given refence value µ0 and the arithmetic mean. It is a measure for the deviation of the measuring results from the refence value. The relative deviation in % is defined as follows:
%100)x(
R0
0 ⋅µµ−
=
Gl. 2 Using the parameter trueness, deviations from the reference value can be identified as systematic errors. On pipets the trueness is stated by tolerance indications, i.e. the tolerable deviations from the reference value.
Precision (inferior: reproducibility): When obtaining measuring results which show a vigorous statistical spread around the mean value, the parameter precision or reproducibility is applied. The less the statistical spread is, the better is the reproducibility of the results.
As a measure for the statistical spread of measuring results around a mean value x the standard deviation s is used. It is defined as:
1n)xx(
s2
i
−
−= ∑
Gl. 3 Types of error Errors can occur in measurements and analyses anywhere. They can be caused by lack of knowledge or unskillfullness of the respective person or by outside effects (temperature, dust, solar radiation) on the analytical instruments or they can directly occur during the analytical method itself. Everyone who performs measurements is anxious to verify trueness and precision of an analytical result and to identify and avoid possible errors.
6
We distinguish between
• systematic errors
• random errors
• gross errors
These three types of errors are well comparable to strike points on a target.
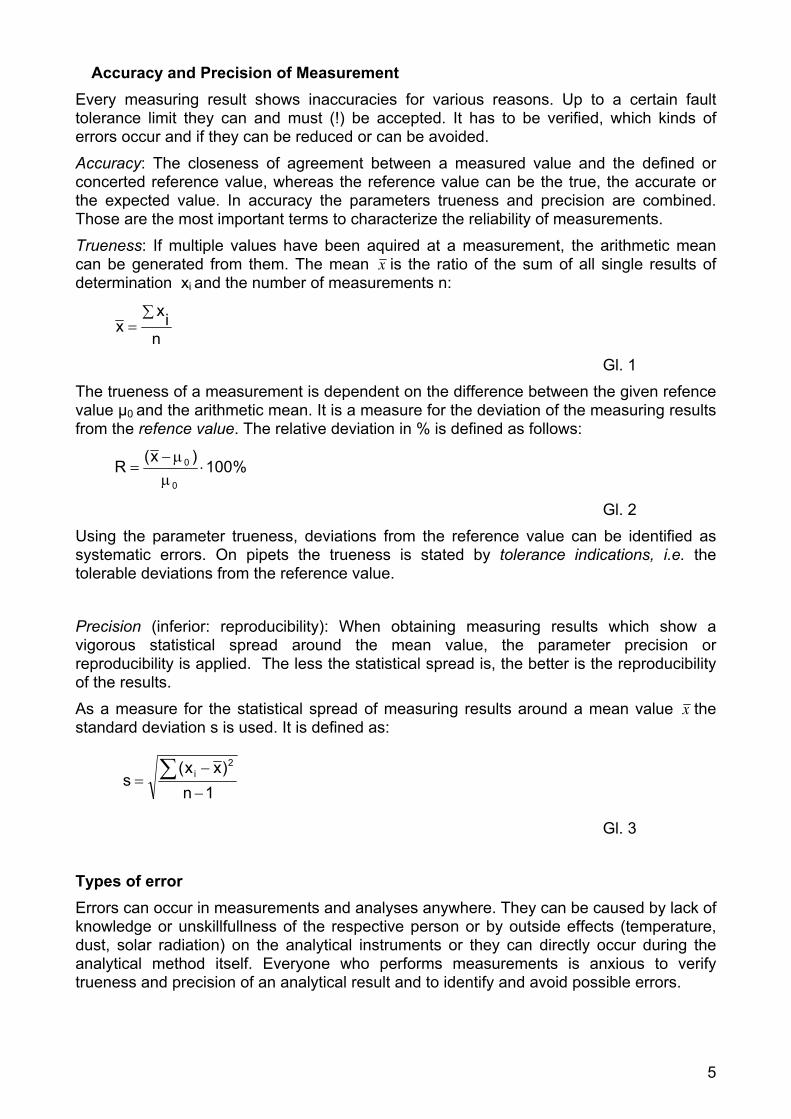
In Figure 1 all strike points with a tolerable deviation are located in
the inner circle. The central point matchs the reference value of the
measurement. The result is optimal. Precision and trueness have a
still tolerable fault tolerance.
Figure 1 Measurement with a tolerable fault tolerance
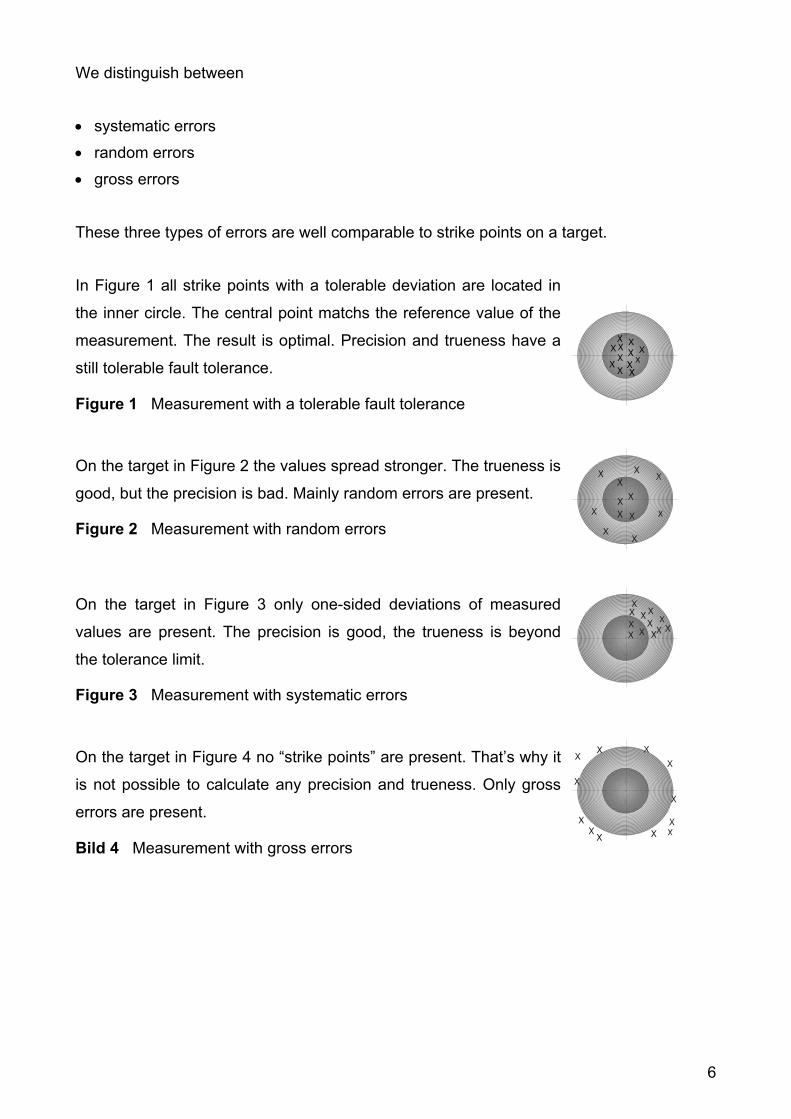
On the target in Figure 2 the values spread stronger. The trueness is
good, but the precision is bad. Mainly random errors are present.
Figure 2 Measurement with random errors
On the target in Figure 3 only one-sided deviations of measured
values are present. The precision is good, the trueness is beyond
the tolerance limit.
Figure 3 Measurement with systematic errors
On the target in Figure 4 no “strike points” are present. That’s why it
is not possible to calculate any precision and trueness. Only gross
errors are present.
Bild 4 Measurement with gross errors

7
Median
The determination of a median from a list of measuring results is an alternative method for the calculation of the arithmetic mean. This method is suited especially for automatic evaluation of large lists by means of spread sheet analysis (e.g. Excel or Lotus 123). First of all, the measuring values are sorted in ascending or descending order. If the number of single values is odd numbered the median is the value in the middle of the list, if it is even-numbered the median is calculated as mean of both central values. Advantageous is, that gross errors or “outliers” are not incorporated and can not falsifate the final measuring result, as it is in case of the arithmetic mean. They can easily be identified because they appear at the beginning or end of the list due to the sorting.
Quartile The quartile (Upper Quartile, UQ-value and Lower Quartile, LQ-value) characterizes the statistical spread of the measured values and can substitute the standard deviation. The difference between UQ and LQ (IQR, Interquartile Range) stands for the scatter. The quartile-values are located in the centre between median and the first, respectivly the last value in the list. The advantage of characterizing the spread by the quartile is again that outliers are disregarded in general.
What is more ? If a reference value is known, the measured value is indicated with % deviation from reference value. If the deviation is significant, i.e., the reference value is beyond the range of dispersion, the deviations and their potential causes must be outlined in the discussion.
8
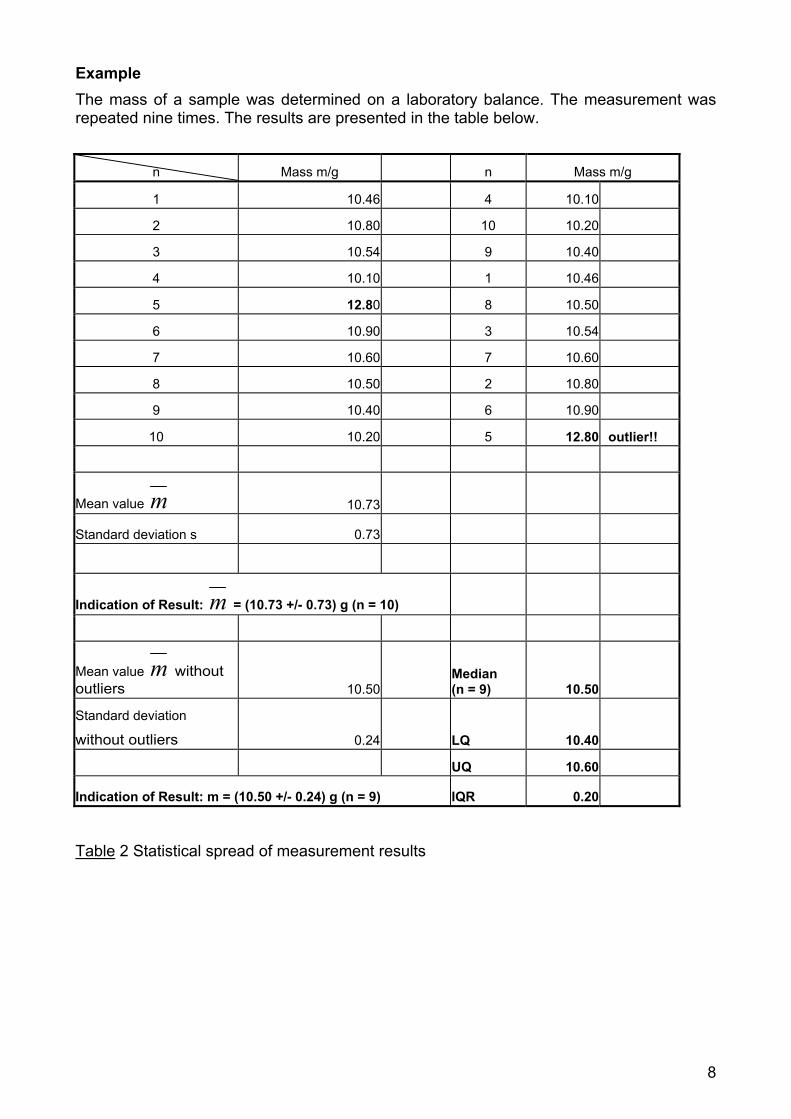
Example The mass of a sample was determined on a laboratory balance. The measurement was repeated nine times. The results are presented in the table below.
n Mass m/g n Mass m/g
1 10.46 4 10.10 2 10.80 10 10.20 3 10.54 9 10.40 4 10.10 1 10.46
5 12.80 8 10.50 6 10.90 3 10.54 7 10.60 7 10.60 8 10.50 2 10.80 9 10.40 6 10.90
10 10.20 5 12.80 outlier!!
Mean value m 10.73
Standard deviation s 0.73
Indication of Result: m = (10.73 +/- 0.73) g (n = 10)
Mean value m without outliers 10.50
Median (n = 9) 10.50
Standard deviation
without outliers 0.24 LQ 10.40 UQ 10.60
Indication of Result: m = (10.50 +/- 0.24) g (n = 9) IQR 0.20
Table 2 Statistical spread of measurement results

9
Indicator Substance Transition Interval (pH) Indicator-Solution Color
acidic Color basic
Thymol blue 1,2 - 2,8 1 g + 21,5 mL c(NaOH) = 0,1 mol/L fill up to 1L with H2O
red yellow
2,4 - Dinitrophenol 2,4 - 4,0 colorless yellow
Kongo red 3,0 - 5,2 blue red
Methyl orange 3,1 - 4,4 0,5 g in 1 L water red orange
Methyl red 4,4 - 6,2 1 g in 1 L Ethanol w(C2H5OH) = 60% red yellow
Litmus 4,4 - 6,6 red blue
Tashiro (mixed indicator: methyl red + methylene blue)
5,6 - 7,0
2 g methyl red + 1 g methylene blue in 1 L ethanol w(C2H5OH) = 96%
violet (via grey) green
Phenol red 6,8 - 8,0 1 g in 1 L ethanol w(C2H5OH) = 20% yellow red
Phenolphthalein 8,2 - 10,0 10 g in 1 L ethanol w(C2H5OH) = 90% colorless red
Thymolphthalein 9,3 - 10,5 2 g in 1 L ethanol w(C2H5OH) = 90% colorless blue
Table 3 Color change pH regions of some acid-base-indicators

10
Errors in Quantitative Chemical Analysis (pipeting practice)
CHE1L_01
Gruppe Name, Vorname, Matrikelnr. Versuchsdatum
Keywords: mean value, standard deviation, trueness, precision, systematic error, random error and gross error
Instruments: 5 - mL - volumetric pipet, 5 - mL – graduated pipet, beaker, laboratory balance
Chemicals: deionized water
Procedure:
Note down the information with regard to precision that are given on the pipets !
With each pipet 5 mL of deion. water are pipeted into a beaker on the laboratory balance and weighed every time (repeat 9 times) .
Evaluation:
The individual results are plotted in a result table and converted into volume values. The mean values and the standard deviations are calculated for each pipet. In addition, the median and the quartile (LQ, UQ, IQR) are determined.
General information for calculation:
T/°C 15,0 18,0 20,0 25,0
ρ(H2O)/g cm - 3 0,99913 0,99862 0,99823 0,99707
Table 1.1 density ρ of water against temperature T
Questions (to answer in the discussion):
1. What is revealed about the trueness of pipeting ? Compare the results for the two pipets with the readings on the pipets ?
2. Which systematic errors are possible in this experiment ?
3. What is revealed about the precision of pipeting ?
4. What can be the cause for random errors ?
5. What can be realized as gross errors ?

11
Bild 1 solubility diagram
Determination of Solubility of Salts CHE1L_02
Gruppe Name, Vorname, Matrikelnr. Versuchsdatum
The solubility of a salt in water depends on temperatur. A solubility diagram from which the solubility of a salt at a certain temperature can be picked is vitally important for a process engineer who has to design a cristallizing plant, but as well for an operator of technical equipment who has to prevent a heat exchanger from incrustation.
Keywords: quantitative measures, solubility, saturated solution.
Instruments: 100 - mL - beaker, tripod, wire gauze, burner with hose, glass rod, thermometer, small test tubes, aluminium dishes, precision balance.
Chemicals: sodium chloride (NaCl), potassium nitrate (KNO3), sodium nitrate (NaNO3).
Procedure: Approx. 50 mL of deionized water are heated to 80°C in a 100 - mL – beaker. At this temperature the respective salt is added under stirring until a saturated solution has formed, i.e. until a sediment has formed. The temperature of the solution has to be constant. From the transparent solution above the sediment a sample is taken with a weighed small test tube, which is placed in an previously weighed aluminium dish. Both together is weighed on a precision balance whereupon the water is evaporated in a drying cupboard.
The residual mainpart of the solution is cooled down to 70°C. At this temperature another sample is taken for the dry content determination. In an analogous manner sampling proceeds at 60 and 50°C .
Evaluation:
From the mass values of the evaporated solvent and the corresponding dry mass the solubility L of the salts in g/100g solvent at the various temperatures is calculated and plotted in tabular form. The solubility is plotted against the temperature in a solubility diagram. Discuss the results. Error review!
Questions (to answer in the discussion):
The solubilities of CaCO3 and MgCO3 (calcium carbonate and magnesium carbonate) decrease with rising temperature !!! Both salts are responsible for water hardness. What are the consequences from this behaviour for water-operated heat exchangers (water coolers, continuous-flow heaters, washing machines etc.)? What corrective measures do you know ?
12
Preparation, Standardization und Titer Determination of a Standard Solution (0.1M NaOH)
CHE1L_03
Gruppe Name, Vorname, Matrikelnr. Versuchsdatum
Theory: Acid - Base - Titration
Reaction equation : NaOH(s) + H2O NaOH(aq) = Na+ + OH - Dissociation
HCl(g) + H2O HCl(aq) = H+ + Cl -
NaOH(aq) + HCl(aq) NaCl(aq) + H2O Neutralization (Acid - Base - Reaction)
Keywords: quantitative measures ("concentration measures"), titer, acids and bases, indicator, standard solution, neutralisation.
Instruments: 500 - mL – volumetric flask, vaulted glass bowl, medium-sized funnel, precision balance, squeeze bottle, 25 - mL - volumetric pipet, 250 - mL - Erlenmeyer flask, 100 - mL - graduated cylinder, buret, small-sized funnel.
Chemicals: sodium hydroxide (NaOH, caustic soda), Tashiro - solution (mixed indicator consisting of methylene blue and methyl red, w(methylene blue) = 0,05 %, w(methylred) = 0,3 % in aqueous ethanol, ϕ (ethanol) = 65 %), hydrochloric acid c(HCl) = 0,1000 mol L - 1
Information concerning operational safety
Higher concentrated bases and acids may never have contact with skin. Especially eyes must be protected by safety goggles. Whenever possible, working under the fume cupboard is preferred. In the event of acid or base splash to skin treat the contact area with neutralizing agent and flush thoroughly with running water. In case of eye injuries the consultation of a doctor is mandatory.
Durchführung
1. Preparation of a NaOH – standard solution: 500 mL of a standard solution with the molar concentration c(NaOH) = 0,1000 mol L – 1 are to be prepared. For that purpose 0,055 mol (= ??? g) sodium hydroxide are weighed out in a vaulted glass bowl on the precision balance. The sodium hydroxide then is transferred into a 500 - mL – volumetric flask over a medium-sized funnel using deionized water from a squeeze bottle. After dissolving the sodium hydroxide pellets and cooling down the solution (! Why ?!) the flask is filled with water to the mark. The solution is mixed thoroughly.
2. Standardization of the NaOH - standard solution: 500 mL of a standard solution with the aspired equivalent concentration c(1/1 NaOH) = 0,1000 mol L – 1 are to be standardized. For that purpose 25,00 mL of the sodium hydroxide solution c(1/1 NaOH) = 0,1 mol L - 1 are measured with a volumetric pipet and given into a 250 - mL - Erlenmeyer flask. After diluting with approx. 100 ml water and adding 3 to 5 drops of Tashiro-indicator hydrochloric

13
acid c(HCl) = 0,1000 mol L – 1 is added dropwise from a buret until the indicator’s color changes. The titration is performed three times.
The quantity of water (in mL) which is required in addition to prepare the desired sodium hydroxide solution c(NaOH) = 0,1 mol L–1 is calculated from the mean value of hydrochloric acid-consumption. The calculated volume of water is measured with a graduated cylinder and added to the sodium hydroxide solution that’s left in the volumetric flask.
3. Titer Determination of the NaOH-standard solution: The titer specification of a standard solution with the aspired equivalent concentration c(1/1 NaOH) = 0,1000 mol L – 1 is to be determined. For that purpose 25,00 mL of the standardized sodium hydroxide solution c(1/1 NaOH) = 0,1 mol L - 1 are measured with a volumetric pipet, given into a 250 - mL - Erlenmeyer flask, diluted with approx. 100 ml water, spiked with 3 to 5 drops of Tashiro-indicator and titrated with hydrochloric acid c(HCl) = 0,1000 mol L – 1 until color change occurs. The titration is performed three times. The titer of the standard solution has to be calculated.
Evaluation: Calculate a) the molar concentration of the sodium hydroxide solution(NaOH)/mol L-1, prepared by you, b) the required quantity of water V(H2O)/mL to add and c) the molar concentration and the titer t of the adjusted sodium hydroxide solution.
14
Argentometric Determination of Chloride Chloride according to Fajans
CHE1L_04
Gruppe Name, Vorname, Matrikelnr. Versuchsdatum
Theory: precipitation titration, argentometry Reaction equation: Sodiumchloride reacts with silvernitrate according to the following precipitation equation: NaCl(aq) + AgNO3(aq) AgCl(s) + NaNO3(aq)
An argentometric precipitation titration holds the problem of the end-point determination.
The Fajans Method solves this problem by the use of an adsorption indicator, fluorescein in this case.
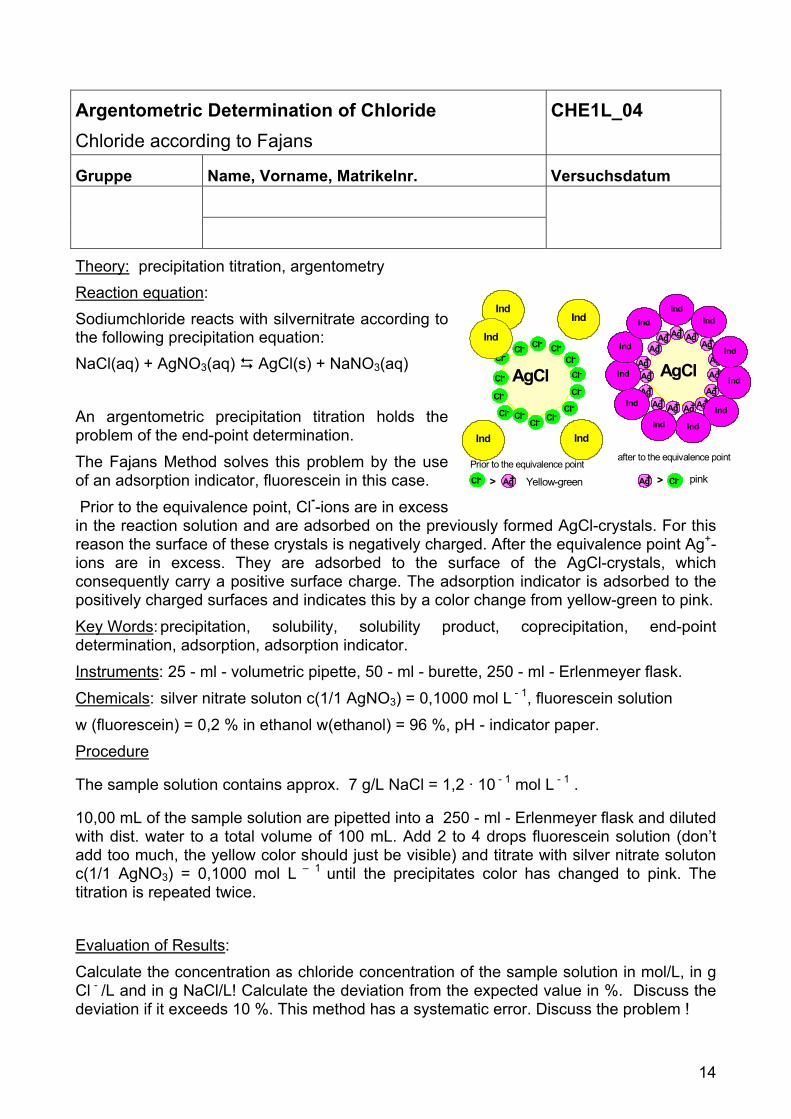
Prior to the equivalence point, Cl--ions are in excess in the reaction solution and are adsorbed on the previously formed AgCl-crystals. For this reason the surface of these crystals is negatively charged. After the equivalence point Ag+-ions are in excess. They are adsorbed to the surface of the AgCl-crystals, which consequently carry a positive surface charge. The adsorption indicator is adsorbed to the positively charged surfaces and indicates this by a color change from yellow-green to pink.
Key Words: precipitation, solubility, solubility product, coprecipitation, end-point determination, adsorption, adsorption indicator.
Instruments: 25 - ml - volumetric pipette, 50 - ml - burette, 250 - ml - Erlenmeyer flask.
Chemicals: silver nitrate soluton c(1/1 AgNO3) = 0,1000 mol L - 1, fluorescein solution
w (fluorescein) = 0,2 % in ethanol w(ethanol) = 96 %, pH - indicator paper.
Procedure
The sample solution contains approx. 7 g/L NaCl = 1,2 · 10 - 1 mol L - 1 .
10,00 mL of the sample solution are pipetted into a 250 - ml - Erlenmeyer flask and diluted with dist. water to a total volume of 100 mL. Add 2 to 4 drops fluorescein solution (don’t add too much, the yellow color should just be visible) and titrate with silver nitrate soluton c(1/1 AgNO3) = 0,1000 mol L – 1 until the precipitates color has changed to pink. The titration is repeated twice.
Evaluation of Results:
Calculate the concentration as chloride concentration of the sample solution in mol/L, in g Cl - /L and in g NaCl/L! Calculate the deviation from the expected value in %. Discuss the deviation if it exceeds 10 %. This method has a systematic error. Discuss the problem !
Ag+
Ag+
Ag+Ag+
Ag+
Ag +
Ag+Ag+
Ag+Ag+Ag+Ag+Ag + Ag +
Ag+Cl-
Cl- Cl- Cl- Cl -
Cl -
Cl -
Cl - Cl-Cl-
Cl-Cl-Cl-
Cl-
Ind Ind
Ind
Ind
Ind Ind
Ind
Ind
Ind
Ind
IndInd
Ind
Ind
Ind
Ind
Prior to the equivalence point Cl- Cl-Ag+ Ag +
after to the equivalence point
> > Yellow-green pink
AgCl AgCl

15
Acid Content Determination of Vinegar Potentiometry
CHE1L_05
Gruppe Name, Vorname, Matrikelnr. Versuchsdatum
Theory: weak acid and bases, pH-measurement Reaction: The weak acid acetic acid reacts with sodium hydroxide according to the neutralisation equation: CH3COOH + NaOH CH3COONa + H2O When determining acetic acid with the strong base sodium hydroxide the emerging acetate hydrolyses and shifts the stoichiometric point to the basic range (s. fig. 5-1). For this reason only indicators are applicable, which change their color at the stoichiometric point and not at the neutral point. The stoichiometric point is not provided at a hydrogen ion concentration of 10-7 but at 10-8.9 mol/L, thus in the alkaline range (pH = 8,9). Phenolphthalein changes its color at a pH-range from 8,2 to 10,0 and hence is applicable for this determination. The glass electrode has to be handled with care. Prior to use it must be calibrated with two buffer solutions. Instruments: 250-mL-volumetric flask, 25-mL-volumetric pipet, 50-mL-buret, 250-mL-Erlenmeyer flask, 250-mL-beaker (tall form), pH-glass electrode, potentiometer (pH-meter) Chemicals: sodium hydroxide solution, c(NaOH)=0,100 mol/L, phenolphthalein solution, w(phenolphthalein) = 1 %.
Procedure: Vinegar has a mass concentration w(CH3COOH) > 5 % and must be diluted und in a ratio of 1:10. For that purpose 25,00 mL of vinegar are pipetted into a 250 - ml - volumetric flask and filled to the mark with dist. water 1. Titration with pH-indicator: 25,00 mL of the prepared analyte solution are pipetted into a 250 - ml - Erlenmeyer flask with a volumetric pipet and diluted with deionized water to a total volume of 100 mL. After addition of 4 to 6 drops phenolphthalein solution titrate with
fig. 5-1. Titration curve of hydrochloric acid c(HCI) = 0,1 mol/L with sodium hydroxide solution c(NaOH) = 0,1 mol/L. Transition intervals of phenolphthalein and methyl red are marked.
fig. 5-2. Titration curve of acetic acid(CH3COOH) = 0,1 mol/L, with sodium hydroxide solution c(NaOH) = 0,1 mol/L.
16
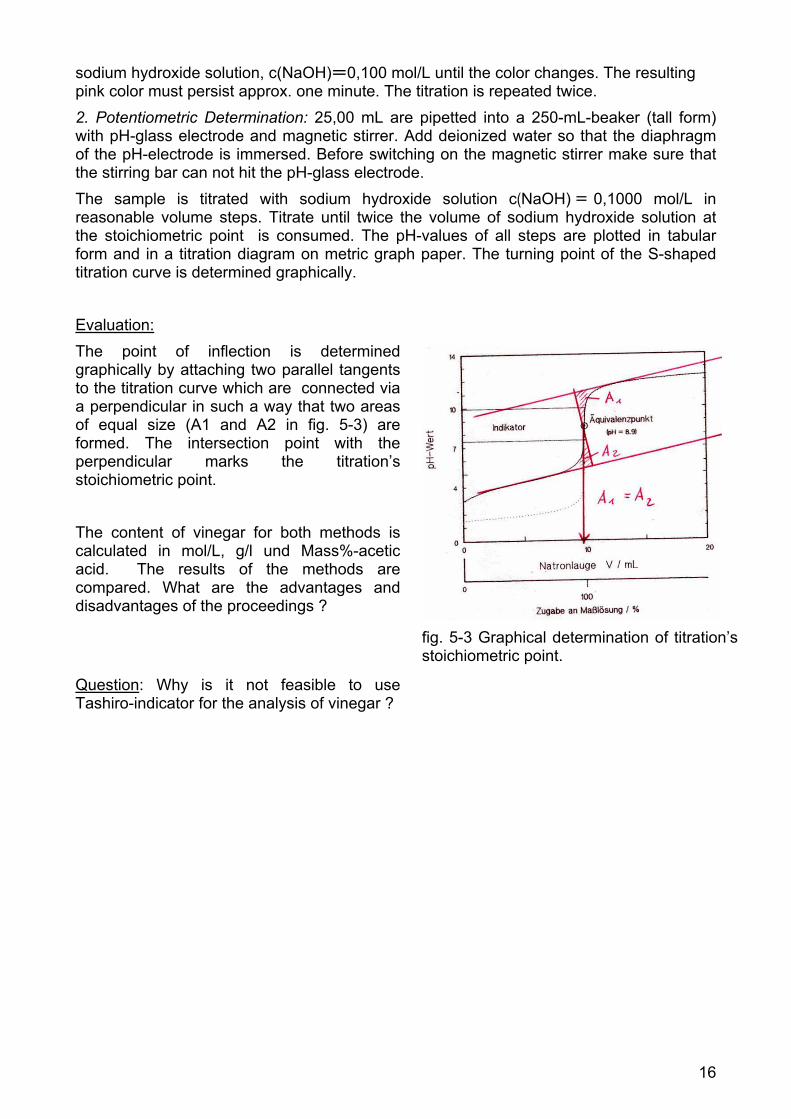
sodium hydroxide solution, c(NaOH)=0,100 mol/L until the color changes. The resulting pink color must persist approx. one minute. The titration is repeated twice. 2. Potentiometric Determination: 25,00 mL are pipetted into a 250-mL-beaker (tall form) with pH-glass electrode and magnetic stirrer. Add deionized water so that the diaphragm of the pH-electrode is immersed. Before switching on the magnetic stirrer make sure that the stirring bar can not hit the pH-glass electrode. The sample is titrated with sodium hydroxide solution c(NaOH) = 0,1000 mol/L in reasonable volume steps. Titrate until twice the volume of sodium hydroxide solution at the stoichiometric point is consumed. The pH-values of all steps are plotted in tabular form and in a titration diagram on metric graph paper. The turning point of the S-shaped titration curve is determined graphically. Evaluation: The point of inflection is determined graphically by attaching two parallel tangents to the titration curve which are connected via a perpendicular in such a way that two areas of equal size (A1 and A2 in fig. 5-3) are formed. The intersection point with the perpendicular marks the titration’s stoichiometric point. The content of vinegar for both methods is calculated in mol/L, g/l und Mass%-acetic acid. The results of the methods are compared. What are the advantages and disadvantages of the proceedings ? Question: Why is it not feasible to use Tashiro-indicator for the analysis of vinegar ?
fig. 5-3 Graphical determination of titration’s stoichiometric point.