Chemicals - BASF · diates. Its portfolio ranges from solvents, plasticizers and high-volume...
252
BASF Report 2013 Economic, environmental and social performance The cover photo shows two BASF engineers with a plastic part created for the automotive industry using our Ultrasim ® simulation method. Lightweight components like this one help reduce weight in vehicles, lowering both fuel consumption and carbon emissions.
Transcript of Chemicals - BASF · diates. Its portfolio ranges from solvents, plasticizers and high-volume...

BASF Report 2013Economic, environmental andsocial performance
The cover photo shows two BASF engineers with a plastic part created for the automotive industry using our Ultrasim® simulation method. Lightweight components like this one help reduce weight in vehicles, lowering both fuel consumption and carbon emissions.
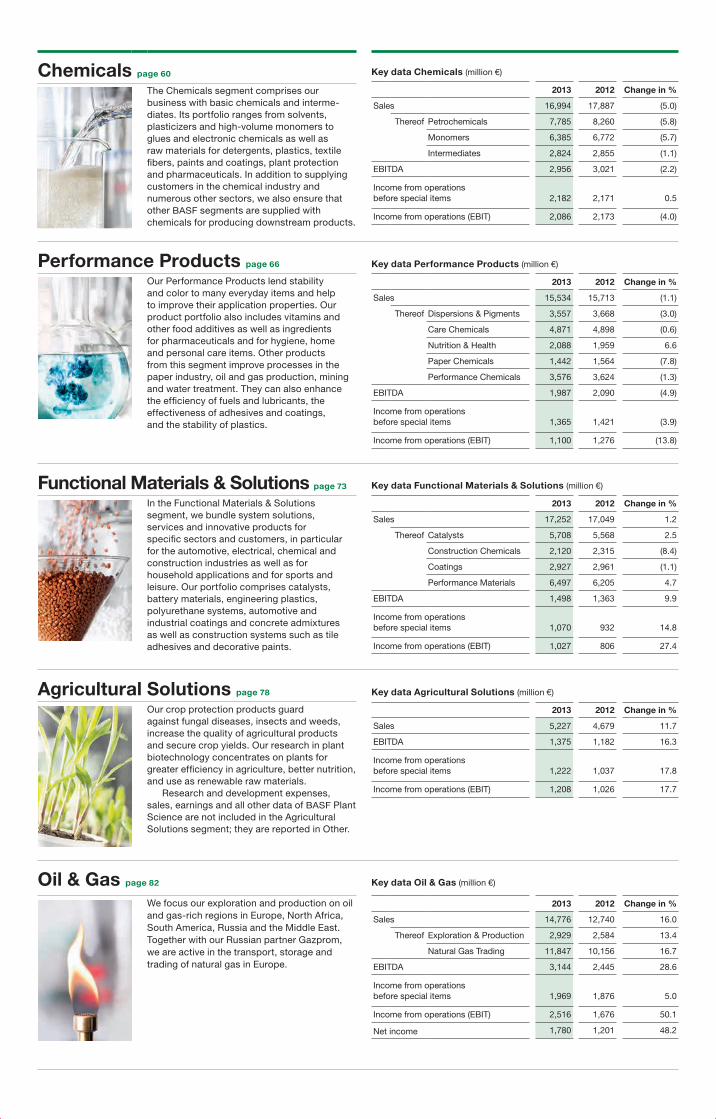
Chemicals page 60
The Chemicals segment comprises our business with basic chemicals and interme-diates. Its portfolio ranges from solvents, plasticizers and high-volume monomers to glues and electronic chemicals as well as raw materials for detergents, plastics, textile fibers, paints and coatings, plant protection and pharmaceuticals. In addition to supplying customers in the chemical industry and numerous other sectors, we also ensure that other BASF segments are supplied with chemicals for producing downstream products.
Performance Products page 66
Our Performance Products lend stability and color to many everyday items and help to improve their application properties. Our product portfolio also includes vitamins and other food additives as well as ingredients for pharmaceuticals and for hygiene, home and personal care items. Other products from this segment improve processes in the paper indus try, oil and gas production, mining and water treatment. They can also enhance the effi ciency of fuels and lubricants, the effectiveness of adhesives and coatings, and the stability of plastics.
Functional Materials & Solutions page 73
In the Functional Materials & Solutions segment, we bundle system solutions, services and innovative products for specific sectors and customers, in particular for the automotive, electrical, chemical and construction industries as well as for household applications and for sports and leisure. Our portfolio comprises catalysts, battery materials, engineering plastics, polyurethane systems, automotive and industrial coatings and concrete admixtures as well as construction systems such as tile adhesives and decorative paints.
Agricultural Solutions page 78
Our crop protection products guard against fungal diseases, insects and weeds, increase the quality of agricultural products and secure crop yields. Our research in plant biotechnology concentrates on plants for greater efficiency in agriculture, better nutrition, and use as renewable raw materials. Research and development expenses, sales, earnings and all other data of BASF Plant Science are not included in the Agricultural Solutions segment; they are reported in Other.
Oil & Gas page 82
We focus our exploration and production on oil and gas-rich regions in Europe, North Africa, South America, Russia and the Middle East.Together with our Russian partner Gazprom, we are active in the transport, storage and trading of natural gas in Europe.
Key data Chemicals (million €)
2013 2012 Change in %
Sales 16,994 17,887 (5.0)
Thereof Petrochemicals 7,785 8,260 (5.8)
Monomers 6,385 6,772 (5.7)
Intermediates 2,824 2,855 (1.1)
EBITDA 2,956 3,021 (2.2)
Income from operations before special items 2,182 2,171 0.5
Income from operations (EBIT) 2,086 2,173 (4.0)
Key data Performance Products (million €)
2013 2012 Change in %
Sales 15,534 15,713 (1.1)
Thereof Dispersions & Pigments 3,557 3,668 (3.0)
Care Chemicals 4,871 4,898 (0.6)
Nutrition & Health 2,088 1,959 6.6
Paper Chemicals 1,442 1,564 (7.8)
Performance Chemicals 3,576 3,624 (1.3)
EBITDA 1,987 2,090 (4.9)
Income from operations before special items 1,365 1,421 (3.9)
Income from operations (EBIT) 1,100 1,276 (13.8)
Key data Functional Materials & Solutions (million €)
2013 2012 Change in %
Sales 17,252 17,049 1.2
Thereof Catalysts 5,708 5,568 2.5
Construction Chemicals 2,120 2,315 (8.4)
Coatings 2,927 2,961 (1.1)
Performance Materials 6,497 6,205 4.7
EBITDA 1,498 1,363 9.9
Income from operations before special items 1,070 932 14.8
Income from operations (EBIT) 1,027 806 27.4
Key data Agricultural Solutions (million €)
2013 2012 Change in %
Sales 5,227 4,679 11.7
EBITDA 1,375 1,182 16.3
Income from operations before special items 1,222 1,037 17.8
Income from operations (EBIT) 1,208 1,026 17.7
Key data Oil & Gas (million €)
2013 2012 Change in %
Sales 14,776 12,740 16.0
Thereof Exploration & Production 2,929 2,584 13.4
Natural Gas Trading 11,847 10,156 16.7
EBITDA 3,144 2,445 28.6
Income from operations before special items 1,969 1,876 5.0
Income from operations (EBIT) 2,516 1,676 50.1
Net income 1,780 1,201 48.2

Innovation
2013 2012 Change in %
Research and development expenses million € 1,835 1,732 5.9
Number of employees in research and development at year-end 10,631 10,456 1.7
BASF Group 2013 at a glance
1.
2.
3.
4.
Creation of value added (Million €, previous year’s figures in parentheses)
Business performance
75,868 (74,067)
Value added 20133
1. Value added
17,028 (15,994)
2. Amortization and depreciation
3,154 (3,267)
3. Service purchased, energy costs and other expenses
12,562 (12,856)
4. Cost of raw materials and merchandise
43,124 (41,950)
Use of value added(Previous year’s figures in parentheses)
Employees
54.6% (56.0%)
Government
11.0% (7.8%)
Creditors
4.0% (4.5%)
Minority interests
1.9% (1.6%)
Shareholders(Dividend and retention)
28.5% (30.1%)
Value added 20133
3 Value added results from the company’s performance minus goods and services purchased, depreciation and amortization. It shows the BASF Group’s contribution to both private and public income as well as the distribution of this contribution among all stakeholders.
Economic data
2013 2012 Change in %
Sales million € 73,973 72,129 2.6
Income from operations before depreciation and amortization (EBITDA) million € 10,427 10,009 4.2
Income from operations (EBIT) before special items million € 7,190 6,647 8.2
Income from operations (EBIT) million € 7,273 6,742 7.9
Income from operations (EBIT) after cost of capital million € 1,872 1,164 60.8
Income before taxes and minority interests million € 6,713 5,977 12.3
Net income million € 4,842 4,819 0.5
Earnings per share € 5.27 5.25 0.4
Adjusted earnings per share1 € 5.37 5.64 (4.8)
Dividend per share € 2.70 2.60 3.8
Cash provided by operating activities million € 7,870 6,602 19.2
Additions to noncurrent assets2 million € 7,513 5,263 42.8
Depreciation and amortization2 million € 3,154 3,267 (3.5)
Return on assets % 11.6 11.0 –
Return on equity after tax % 19.4 19.9 –
1 For more information, see page 52.2 Including acquisitions

Employees and society
2013 2012 Change in %
Employees at year-end 112,206 110,782 1.3
Apprentices at year-end 3,060 2,809 8.9
Personnel expenses million € 9,285 8,963 3.6
Annual bonus % of Group companies 98.9 97.9 1.0
Donations and sponsorship million € 49.2 49.0 0.4
Supply chain management and Responsible Care
2013 2012 Change in %
Number of on-site sustainability audits of raw material suppliers4 155 210 (26.0)
Number of environmental and safety audits 132 112 17.9
Number of occupational medicine and health protection audits 44 42 4.8
4 In 2013, we updated our approach for evaluating suppliers. In addition to on-site audits, we initiated 550 sustainability evaluations online through external service providers. For more information, see page 90.
Safety and health
2013 2012 Change in %
Transportation accidents per 10,000 shipments 0.22 0.24 (8)
Product spillages during transportation per 10,000 shipments 0.23 0.25 (8)
Lost time injuries per million working hours 1.4 1.7 (18)
Health Performance Index5 0.89 0.89 0.4
5 For more information, see page 95.
Environment
2013 2012 Change in %
Primary energy usage6 million MWh 59.2 57.4 3.1
Energy efficiency in production processes metric tons of sales product/MWh 0.592 0.602 (1.7)
Total water withdrawal million cubic meters 1,781 1,999 (10.9)
Withdrawal of drinking water million cubic meters 22.6 23.2 (2.5)
Emissions of organic substances to water7 thousand metric tons 19.7 21.2 (7.5)
Emissions of nitrogen to water7 thousand metric tons 2.9 2.8 4.7
Emissions of heavy metals to water7 metric tons 21.9 26.2 (16.7)
Emissions of greenhouse gases million metric tons of CO2 equivalents 23.0 22.8 0.8
Emissions to air (air pollutants)7 thousand metric tons 32.4 30.6 5.9
Waste million metric tons 2.5 2.2 11.8
Operating costs for environmental protection facilities million € 893 901 (0.9)
Investments in environmental protection million € 325 268 21.3
6 Primary energy used in BASF’s plants as well as in the plants of our energy suppliers to cover energy demand for production processes7 Excluding emissions from oil and gas production
B
AS
F G
rou
p 2
013
at a
gla
nce

Welcome to BASF
BASF is the world’s leading chemical company. We combine economic success with environmental protection and social responsibility. Through research and innovation, we support our customers in nearly every industry in meeting the current and future needs of society. We have summed up this contribution in our corporate purpose: We create chemistry for a sustainable future.
We identify relevant sustainability issues by means of a materiality analysis. One material aspect of sustainability is “energy and climate,” for example. One of our goals is to, by 2020, reduce specific greenhouse gas emissions per metric ton of sales product by 40% compared with baseline 2002. Other goals include further increasing our energy efficiency and contributing to climate protection. We are shrinking our carbon footprint through, for example, intelligent energy strategies in our production processes and product innovations for our customers.
The following pages provide a variety of examples illustrating our responsible approach to energy and climate with respect to our suppliers, transportation, production, and our customers. To this end, we examine our products’ life cycles and identify key factors that can be adjusted to reduce emissions even further along the entire value chain.
For more on the materiality analysis and the material aspects identified, see page 28 onward
Suppliers Transport Production Transport Customers

BASF Report 2013 2
We have high standards – and demand the same of our suppliersOur value chain begins with the use of raw materials – and with our suppliers. As we work with them around the world, it is important that our partners also adhere to environmental, social, and corporate governance standards. A Supplier Code of Conduct outlines our expectations, which include compliance with human rights and labor and social standards as well as with antidiscrimination and anticorruption policies. The Code also covers behavior for environmental protection, such as the application of energy-efficient technologies and the sparing use of raw materials. We employ renewable resources for selected processes in our own production.
How sugar can become a swimsuitIn photosynthesis, plants use the sun’s energy to transform carbon dioxide and water into sugar compounds. This is how the polysaccharide cellulose is produced, for example. As the main component in plant cell walls, cellulose is the largest organic raw material source on Earth. And yet obtaining sugar components from cellulose for use as raw materials involves costly processes. This is why BASF is testing a multiple-step method with the American company Renmatix Inc. to break down the cellulose from inedible biomass into various industrial sugars. These can serve as important feedstock for many basic and intermediate chemical products – for example, for the intermediate 1,4-butanediol. Following a method of the American company Genomatica Inc., BASF produced the first commercial volumes of butanediol from renewable resources. 1,4-butanediol is already used as a raw material for many of the everyday products we use today – such as plastics for skateboard wheels and elastic fibers for textiles. This means even a swimsuit could be based on renewable raw materials in the future.
For more on renewable raw materials, see page 91 onward
Suppliers Transport Production Transport Customers
BASF Report 2013 3
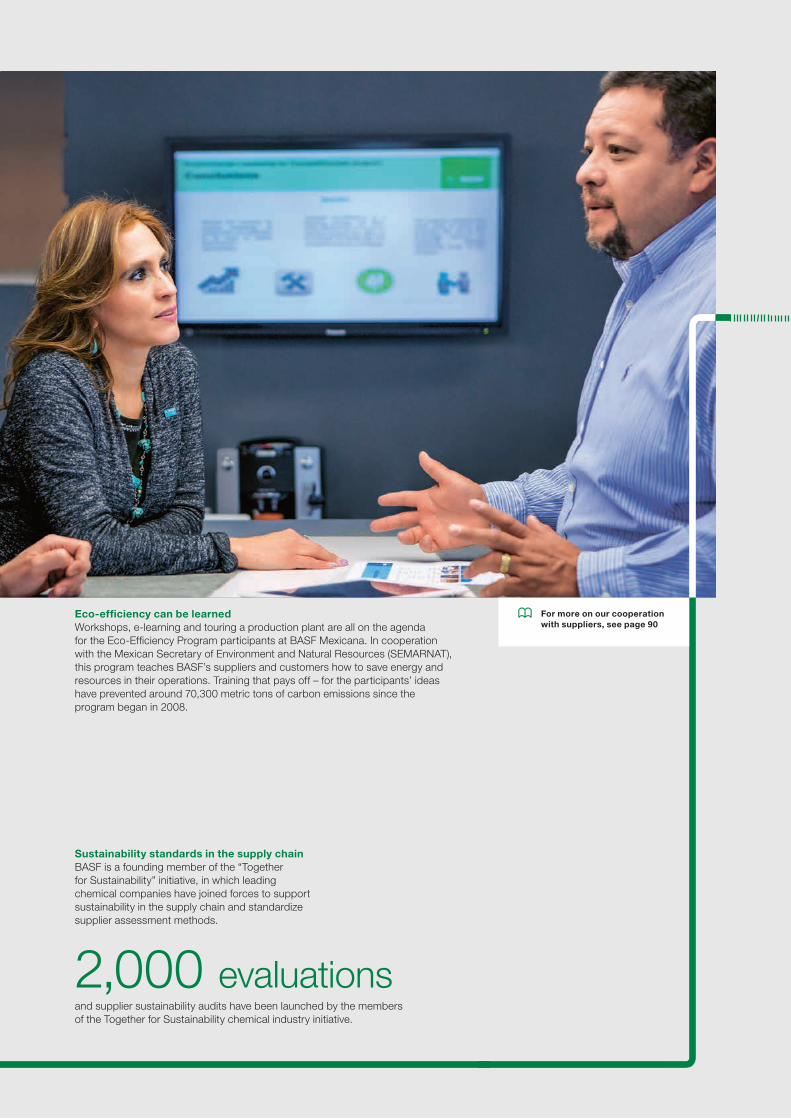
Eco-efficiency can be learnedWorkshops, e-learning and touring a production plant are all on the agenda for the Eco-Efficiency Program participants at BASF Mexicana. In cooperation with the Mexican Secretary of Environment and Natural Resources (SEMARNAT), this program teaches BASF’s suppliers and customers how to save energy and resources in their operations. Training that pays off – for the participants’ ideas have prevented around 70,300 metric tons of carbon emissions since the program began in 2008.
For more on our cooperation with suppliers, see page 90
2,000 evaluationsand supplier sustainability audits have been launched by the members of the Together for Sustainability chemical industry initiative.
Sustainability standards in the supply chainBASF is a founding member of the “Together for Sustainability” initiative, in which leading chemical companies have joined forces to support sustainability in the supply chain and standardize supplier assessment methods.

BASF Report 2013 4
Intelligent logistics spare the environmentWith an area of 50,000 square meters and the most modern technology, our centrally located logistics center in Ludwigshafen optimizes inventory storage and dispatch. Its direct connection to the highway relieves nearby towns of around 25,000 trucks passing through each year.
Our goods are transported around the world – with as little environmental impact as possible
Whether by truck, train or ship, our goods are carried from A to B through various means of transportation. In addition to high safety standards and careful, punctual processing, our logistical decision-making always involves acting in a responsible manner in terms of environmental and climate protection. When selecting a means of transportation, we keep a constant eye on the fact that transporting goods by train can reduce carbon emissions by up to 65% compared with trucks.
Suppliers Transport Production Transport Customers
of carbon emissions are prevented in Ludwigshafen each year by the intermodal transportation terminal.
60,000 metric tons

BASF Report 2013 5
From road to railA significant portion of worldwide carbon emissions is generated by fuel use in traffic – for example, by trucks transporting goods. That’s why BASF uses combined freight methods. Intermodal transportation terminals at the sites in Ludwigshafen and Schwarzheide, Germany, and in Antwerp, Belgium, ensure that things run smoothly: A truck picks up goods from the plant and takes them to the intermodal transportation terminal. Here, a crane loads them directly onto a train. The combination of both forms of transportation is cost-efficient and environmentally friendly.
For more on transportation and storage at BASF, see page 94

BASF Report 2013 6
.
GeismarEstablished: 1958Production facilities: 22Area: 9.27 km²Pipelines: 1,139 km
Power plants for the Energy VerbundHow are electricity and steam produced and used? This was the question schoolchildren explored in the “Power4School” project of the Wissensfabrik (Knowledge Factory). A class of students visited our Verbund site in Ludwigs-hafen and discovered: Combined heat and power plants are responsible for a large portion of BASF’s energy supply. These are plants that use natural gas to produce not only electricity, but also steam. Instead of being lost, the heat is fed into our other production facilities over a steam network. The benefit for climate protection is obvious: Carbon emissions can be avoided thanks to this interconnected production. Furthermore, the utilization rate of natural gas as a fuel can reach up to 90% – so that nearly all the heat is converted into energy. Conventional power plants are only around half as efficient.
70% of our energy needs worldwide are covered by gas-based combined heat and power plants.
FreeportEstablished: 1958Production facilities: 24Area: 1.64 km²Pipelines: 290 km
Verbund principleThe Verbund system is one of BASF’s great strengths. With six large Verbund sites and 376 other production sites, we are represented in almost every country in the world. Verbund – this means intelligently linking our sites and creating value as one company. This idea is reflected everywhere in BASF and extends beyond production, as we also combine our expertise and technologies to develop innovative products and solutions for our customers all around the world.
6.1 million metric tons For more on our production,
see page 19 onward and page 95 onward
of carbon emissions are prevented each year through the highly efficient generation and use of power and steam in our Energy Verbund.
We aim to prevent emissions and protect the climate in our production processes, especially through the use of energy-efficient plants. Our Verbund system helps us accomplish this through the synergetic interconnection of facilities, logistics, infrastructure and the flow of energy. By the end of 2015, we also intend to have the energy management at our German sites certified in accordance with DIN EN ISO 50001. We have already examined BASF SE’s most energy-intensive production processes.
Production in the Verbund: using energy efficiently and conserving resources
Suppliers Transport Production Transport Customers

BASF Report 2013 7
.
AntwerpSecond-largest BASF Verbund site Established: 1964Production facilities: around 50Area: 6 km²Pipelines: 290 km
NanjingEstablished: 2005Production facilities: 16Area: 2.2 km²Pipelines: 708 km
KuantanEstablished: 1997Production facilities: 13Area: 1.5 km²Pipelines: 450 km
BASF’s lifelinesEvery day, steam, air and water flow through the pipelines connecting the plants and facilities of our large sites. In the Production Verbund, we use this infrastructure to create efficient value chains. For example, by-products from one plant can serve as raw materials in the manufacture of another product.
LudwigshafenLargest chemical complex in the world and largest BASF Verbund siteEstablished: 1865Production facilities: around 160Area: 10 km²Pipelines: 2,750 km

BASF Report 2013 8
We invest in research – including for innovative climate protection productsWhat do electric cars and wind turbines have in common? Both can be made more efficient by BASF’s products. As a global chemical company, we serve diverse industries and help prevent carbon emissions in many areas of life. We invest around a third of our annual research spending in solutions and products that help prevent greenhouse gas emissions and increase energy efficiency. The diversity of our sustainable development projects is illustrated through selected examples.
Suppliers Transport Production Transport Customers
Assessing sustainability in agricultureBrazil, France, India – around the globe, AgBalance® helps farmers improve their sustainability profile and, through energy-efficient production methods, contribute to climate protection. Developed by BASF’s experts, these methods evaluate farms in terms of ecological, economic and social indicators and identify potential for improvement. Emissions and energy use also play a major role, as do considerations of cost, future generations and consumers. For example, the optimized application of nitrogen fertilizers can contribute to climate protection. We launched AgBalance® in India in 2013: Farmers participating in BASF’s “Samruddhi” initiative can create a comprehensive sustainability profile. “Samruddhi” means “success” in the ancient Indian language Sanskrit. Since 2006, smallholder farmers have discovered how they can effectively guard their crops against pests and diseases in fluctuating climatic conditions and secure reliable yields. Over 230,000 farmers are taking part in the initiative.

BASF Report 2013 9
Efficient heat insulation protects both climate and walletAt the end of the nineties, BASF’s Neopor® insulation material was fresh on the market when it was used in the renovation of Ludwigshafen’s Brunck Quarter. A long-term study shows: insulation pays off across the board. These “3, 5 and 7-liter houses” save a total of 387,000 liters of heating oil each year. Primarily on account of this, carbon emissions for the entire Brunck Quarter fell by 8,300 metric tons over a period of ten years. A survey revealed that over 90% of residents felt “happy” or “very happy” in their energy-saving apartments.
246 million metric tonsof CO2 equivalents are being prevented in the construction and housing sector thanks to products sold by BASF worldwide in 2013.
For more on our climate protection products, see page 102
Climate protection also pays off within your own four wallsAn uninsulated single-family home in Germany is kept at a constant 19C indoor temperature, all year round, for 40 years. What is the difference between this and a house insulated with Neopor®? It is the 145 metric tons of carbon emissions avoided by the insulated house’s lower heating requirements. This is the result of a study conducted by BASF using the Eco-Efficiency Analysis, a method which assesses the ecological and economic impact of a product over its entire life cycle. The calculation of the environmental impact is based on six categories: energy consumption, emissions, land use, risk potential, raw material consumption and toxicity potential.
For more on the study, see basf.com/insulationstudy
Carbon emissions of a single-family home with and without wall insulation over a period of 40 years
282 metric tons of carbon emissions
137 metric tons of carbon emissions
Difference of145 metric tons of carbon emissions
Single-family house without wall insulation
Single-family house with Neopor® insulation

BASF Report 2013 2
Letter from the Chairman of the Board of Executive Directors 8
The Board of Executive Directors of BASF SE 10
BASF on the capital market 12
The BASF Group 18
Our strategy 21
Corporate strategy 21
Goals 24
Value-based management 26
Sustainability 27
Innovation 30
Investments and acquisitions 36
Business models and customer relations 38
Working at BASF 39
Social commitment 45
The business year at BASF 46
Economic environment 46
Results of operations 49
Net assets 54
Financial position 55
Business review by segment 58
Chemicals 60
Performance Products 66
Functional Materials & Solutions 73
Agricultural Solutions 78
Oil & Gas 82
Regional results 88
Responsibility along the value chain 90
Supply chain management 90
Raw materials 91
Responsible Care Management System 93
Safety, security and health 94
Transportation and storage 94
Production 95
Products 97
Environment 99
Energy and climate protection 99
Water 103
Air and soil 105
Forecast 106
Opportunities and risks report 106
Economic environment in 2014 115
Outlook 2014 118
Contents
Management’s Report
To Our Shareholders
BASF Report 2013 3
Corporate Governance
Consolidated Financial Statements
Overviews
Supplementary Information on the Oil & Gas Segment
www.basf.com/reportBASF Report 2013 Online
This report is also available in HTML format and as a PDF download on our website. Interactive tools enable individual compilation of texts, tables and diagrams, and quick selection according to subject. The BASF Report 2013 is also available in an e-paper version at basf.com/report2013_e-paper
Ten-year summary 226
GRI and Global Compact Index 228
GRI Statement 230
Selected prizes and awards 231
Registered trademarks 232
Glossary 233
Index 238
Corporate governance report 122
Compliance 127
Management and Supervisory Boards 129
Compensation report 131
Report of the Supervisory Board 136
Declaration of Conformity 140
Supplementary information on the Oil & Gas segment 216
Statement by the Board of Executive Directors 142
Auditor’s report 143
Statement of income 144
Statement of income and expense recognized in equity 145
Balance sheet 146
Statement of cash flows 147
Statement of equity 148
Notes 149

About this report
BASF Report 2013 4
About this report
Integrated reportingThis integrated report documents BASF’s economic, environ-mental and social performance in 2013. Using specific examples, we illustrate how sustainability contributes to BASF’s success and how we as a company create value for our employees, shareholders, business partners, neighbors and the public.
Sustainability is the even balance between economy, environment and society
Economy
Society Environment
Content and structureThe BASF Report combines our financial and sustainability reporting and is addressed to readers interested in both areas. In addition to our integrated corporate report, we publish further information about sustainability issues online. Links to this supplementary information are provided in each chapter. Our sustainability reporting has been oriented toward the Global Reporting Initiative (GRI) framework since 2003. The information in the BASF Report 2013 also serves as a progress report on BASF’s implementation of the ten principles of the United Nations Global Compact and takes into consid-eration the Blueprint for Corporate Sustainability Leadership – an action plan initiated as part of the Global Compact LEAD platform. The symbol indicates information on the implemen-tation of the ten principles and the Blueprint for Corporate Sustainability Leadership. If the symbol appears at the end of a chapter, the entire content of the chapter is relevant. The GRI and Global Compact Index from page 228 onward provides information on GRI indicators for topics relevant to the Global Compact principles. An expanded overview is available online.
The 2013 online report can be found at basf.com/report
For more on sustainability, see basf.com/sustainability
For more on the Global Compact, the implementation of the Global Compact principles, Global Compact LEAD and Blueprint for Corporate Sustainability Leadership, see basf.com/globalcompact_e, www.globalcompact.org and basf.com/gclead_e
A short GRI and Global Compact index can be found on pages 228 and 229; for a more comprehensive version, see basf.com/gri_gc_e
Overview
− BASF Report 2013 integrates financial and sustainability reporting − HTML version of the BASF Report available online, with additional information and services − Further information on sustainability issues online − Report serves as progress report in terms of U.N. Global Compact

About this report
BASF Report 2013 5
Topics
− Financial reporting based on requirements of International Financial Reporting Standards, German Commercial Code and German Accounting Standards − Sustainability reporting follows guidelines of the Global Reporting Initiative (G3.1) − Dialog with stakeholders on relevant topics
Data
− International Financial Reporting Standards (IFRSs) 10 and 11 and International Accounting Standard (IAS) 19 (revised) applied since January 1, 2013; figures for 2012 restated accordingly − Relevant information included up to editorial deadline of February 19, 2014
Requirements and topicsThe information on the financial position and performance of the BASF Group is based on the requirements of International Financial Reporting Standards (IFRS), and, where applicable, the German Commercial Code as well as the German Account-ing Standards (GAS). Internal control mechanisms ensure the reliability of the information presented in this report. BASF’s management confirmed the effectiveness of the inter-nal control measures and compliance with the regulations for financial reporting. Our sustainability reporting is aligned with the international guidelines (G3.1) of the Global Reporting Initiative (GRI) as well as with the principles of the U.N. Global Compact and the Blueprint for Corporate Sustainability Leadership. We want to identify and evaluate sustainability issues relevant for BASF at an early stage and engage in constant dialog with our stake-holders. Together with experts, we evaluate and analyze sustainability issues in our materiality analysis. Based on the results, we identified 38 material issues and grouped them into eight overarching material sustainability aspects. The goal here is to develop strategies well in advance for dealing with poten-tial opportunities and risks.
For more on the Global Reporting Initiative, see www.globalreporting.org
For more on our selection of sustainability topics, see page 27 onward and basf.com/materiality
DataAll information and bases for calculation in this report are based on national and international standards for financial and sustaina bility reporting. All of the data and information for the reporting period were sourced from the responsible units using representative methods. The reporting period was the financial year 2013. We have applied International Financial Reporting Standards (IFRSs) 10 and 11 and International Accounting Standard (IAS) 19 (revised) since January 1, 2013. We have
adjusted the figures for the 2012 business year accordingly in order to ensure comparability. These restated prior -year figures also take into account the new segment structure as of Janu-ary 1, 2013. BASF Group’s scope of consolidation for its financial reporting comprises BASF SE, with its headquarters in Ludwigs-hafen, Germany, as well as all of its fully consolidated material subsidiaries. Joint operations are proportionally consolidated. Following the application of IFRSs 10 and 11, four companies which had previously been fully consolidated, along with 14 which had been proportionally consolidated, are accounted for in the BASF Group Financial Statements using the equity method. This resulted in lower reported 2012 sales and income from operations for the BASF Group, especially in the Oil & Gas segment. IAS 19 (revised) describes accounting for employee benefits. Through the application of IAS 19 (revised), net income was slightly reduced for 2012. The chapter “Working at BASF” shows employees within the BASF Group scope of consolidation as of December 31, 2013. Our data collection methods for environmental protection and occupational safety are based on the recommendations of the European Chemical Industry Council (CEFIC). In the “Environment” chapter, with its subsections on Energy and Climate Protection, Water, and Air and Soil, we align our report-ing with the accounting standards IFRSs 10 and 11, effective January 1, 2013. We report on all emissions and waste from our fully consolidated companies’ production sites worldwide. The emissions, waste, energy and water use of consolidated joint operations are included pro rata, based on our stake. To ensure comparability between reporting years, we have restated the figures for the 2012 business year. We compile information on work-related accidents at all Group company sites worldwide. Accidents at joint venture sites are also compiled and reported in full. Further data on social responsibility and transportation safety apply to all consolidated Group companies, unless otherwise indicated.

About this report
BASF Report 2013 6
To make this report as current as possible, we have included relevant information available up to the editorial deadline of February 19, 2014. The report is published each year in English and German.
For more on IFRSs 10 and 11 and IAS 19 (revised), see the Notes from page 149 onward
For more on the new segment structure, see page 18 onward
For more on emissions, see page 25 and page 99 onward
The Consolidated Financial Statements begin on page 141
External audit and evaluationOur reporting is audited by a third party. KPMG AG Wirtschafts-prüfungsgesellschaft has audited the BASF Group Consolidated Financial Statements and the Management’s Report and has approved them free of qualification. The audit of the Consoli-dated Financial Statements including the Notes is based on the likewise audited financial statements of the BASF Group companies. The audit covers financial information as well as statements and figures pertaining to sustainability, and was conducted in accordance with relevant auditing standards for assuring sus-tainability information: the International Standard of Assurance Engagements 3000 and the International Standard of Assur-ance Engagements 3410. The additional content provided on the BASF internet sites indicated in this report is not part of the information audited by KPMG. For the BASF Report 2013, the GRI confirmed that the BASF Group’s sustainability reporting fulfills the GRI guideline 3.1 with the highest application level, A+. We thus also comply with the German Sustainability Code.
The Auditor’s Report can be found on page 143
The GRI Statement can be found on page 230
The Assurance Report on sustainability information in the BASF Report 2013 can be found at basf.com/sustainability_information
Forward-looking statementsThis report contains forward-looking statements. These state-ments are based on current estimates and projections of BASF management and currently available information. They are not guarantees of future performance, involve certain risks and uncertainties that are difficult to predict and are based upon assumptions as to future events that may not prove to be accu-rate. Many factors could cause the actual results, performance or achievements of BASF to be materially different from those that may be expressed or implied by such statements. Such factors include those discussed in the Opportunities and Risks Report from pages 106 to 114. We do not assume any obligation to update the forward-looking statements contained in this report.
External audit and evaluation
− Financial information as well as figures and statements regarding sustainability in Consolidated Financial Statements and Management’s Report audited by KPMG AG Wirtschaftsprüfungsgesellschaft − Audit also in accordance with pertinent assurance standards for sustainability reporting − Level A+ in sustainability reporting confirmed by Global Reporting Initiative (G 3.1)

1 To O
ur
Sh
areh
old
ers
To Our Shareholders
Letter from the Chairman of the Board of Executive Directors 8
The Board of Executive Directors of BASF SE 10
BASF on the capital market 12

BASF Report 2013To Our Shareholders8
Letter from the Chairman of the Board of Executive Directors
Dear Shareholder,
I am occasionally asked: Can a chemical company really be sustainable? It often comes out in the course of the conversation that many people equate “sustainable” with “environmentally friendly.” In fact, this is only one part of sustainability. Sustainability also encompasses economic and social aspects, making it much more complex. In this report, you can follow BASF’s progress in the area of sustainability.
First, let’s take a look at the economic figures: In 2013, we were able to increase sales and earn-ings compared with the previous year, thus attaining our goal. It was a demanding year, with a lot of headwind for the industry. This was compounded by considerably negative currency effects in numerous emerging markets and in Japan. Nevertheless, we sold more, worked more closely together with our customers and enhanced our portfolio. This is the accomplishment of our team, our employees, for which I offer my heartfelt thanks – both from myself and on behalf of my colleagues on the Board of Executive Directors.
The price of BASF shares grew by 9%, reaching €77.49 at the end of 2013. We once again pro-pose a dividend increase, raising it by €0.10 to €2.70. This represents a dividend yield of 3.48%.
How does chemistry help people and the environment?With our corporate purpose, “We create chemistry for a sustainable future,” we express what BASF stands for. Both with and for our customers, we develop and produce new products and solutions for a growing world population while conserving our resources as much as possible. Science, research and development are needed – and chemistry has to take on this responsi-bility, as it supplies almost all sectors of industry.
BASF has been occupied with getting more out of existing resources since its founding in 1865. The entrepreneur Friedrich Engelhorn used coal tar, a waste product, to produce aniline and a red dye called fuchsine. Using a by-product as a raw material for something else – this was the idea that eventually led to large, highly efficient chemical production sites in Europe, Asia, and North and South America over the course of our nearly 150-year history. We are working to further increase the sustainability of our processes everywhere. For example, in 2013 we strengthened our position in the field of enzymes. As biocatalysts, enzymes either start or accelerate chemical processes. This saves energy and costs.
Letter from the Chairman of
the Board of Executive Directors

To Our ShareholdersBASF Report 2013 9
“We will concentrate on what we do best: researching, developing and offering our customers attractive solutions.”
We are also already producing products from renewable resources, although with a discerning eye: Not everything that regrows is also sustainable. We want to increase the proportion of renewable raw materials, where feasible. This means developing new methods and then taking them from the laboratory to production. One example is a technology from the American company, Renmatix, for producing industrial sugar from wood, agricultural waste or straw. We are working closely together to continue developing this method.
And yet renewable raw materials will not be able to replace fossil ones. Natural gas and crude oil will remain the dominant energy sources and raw materials worldwide. More people in the world need more energy. This is why we are refocusing and constantly expanding our oil and gas business. We consider it important to utilize new sources and produce oil and gas. Our gas trading and storage business will be taken over by our long-time partner, Gazprom. We signed the contract in December. In return, we are receiving shares in natural gas and condensate fields in Western Siberia. We also increased our production in Norway through the acquisition of assets from Statoil. This had a positive effect on our earnings and cash flow.
Inventiveness, a passion for innovation, customer orientation, awareness of costs, and drive – these are all critical factors for our success. And yet competitive raw material and energy costs are also essential.
A few years ago, there was a fear that fossil fuels would become globally scarce and increas-ingly costly. Neither has occurred. On the contrary: The United States relies on economical shale gas, and China on inexpensive coal. Only in Europe – and especially in Germany – are energy costs on the rise, due mainly to regulatory intervention. This poses an increasing problem for energy-intensive industries. No customer will pay a higher price for a standard product on the worldwide market just because energy is expensive in Europe. You can read about the results of these developments in this report: In the next five years, BASF will invest proportionally less in Europe, reducing its stake to under 50%. This shows how attractive Asia has become – and the United States, as well – for our basic products, and that Europe’s competitiveness is declining.
Where does the road lead in 2014?We do not expect strong tailwinds this year, either. Nevertheless, we are cautiously optimistic with regard to economic development. Our goal is to once again increase our earnings. To do so, we will concentrate on what we do best: researching, developing and offering our custom-ers attractive solutions. In turn, we aim to raise our expenditures for research and development. We spent €1.8 billion in 2013. In absolute terms, this puts us at the top of the chemical industry.
Furthermore, we contribute our expertise to advance sustainable development: We are working together with United Nations, for example, on their Post-2015 Development Agenda. BASF has already been a part of the U.N. Global Compact network since 2000, which consists of compa-nies, nongovernmental organizations, science and politics. In the past year, we established a committee to accompany us on our way toward more sustainability: Comprising experts from science and society, it advises BASF’s Board of Executive Directors on how to weave sustainability even more tightly into our operations.
Through this, we aim to continue generating even more attractive returns for you, our share- holders. The entire BASF team stands behind this goal.
Dr. Kurt Bock
Letter from the Chairman of
the Board of Executive Directors

Dr. Harald Schwager“We advocate long-term supply security, and place great value on the safe, efficient and environmentally friendly production of oil and gas.”
Michael Heinz“We are continually developing higher-performance superabsorbents that, for example, enable the production of increasingly thinner baby diapers – thus saving energy and other resources.”
Dr. Martin BrudermüllerVice Chairman of the Board of Executive Directors“Progress involves engaging in thought experiments and coming up with new product ideas: We’ve designed a modern-day velocipede made almost entirely out of plastic instead of metal.”
Dr. Hans-Ulrich EngelChief Financial Officer“We are continuously improving our mobile emissions catalysts, and offer our customers innovative technologies to reduce harmful emissions.”
BASF Report 2013
The Board of Executive Directors of BASF SE
10 The Board of Executive Directors of BASF SE
To Our Shareholders

Dr. Kurt BockChairman of the Board of Executive Directors“We create growth by developing new solutions for the challenges of the future. We are already conducting research today on the electromobility of tomorrow and working on high-performance battery materials.”
Margret Suckale“In our Know-How Verbund, we pool expertise from various fields. Scientists and engineers work hand-in-hand to improve our production plants and methods.”
Wayne T. Smith“We enhance conventional processes and make it possible to manufacture sophisticated metal and ceramic parts with injection molding.”
Dr. Andreas KreimeyerResearch Executive Director “Our crop protection solutions help farmers optimize their production, ensuring enough food for a growing world population.”
BASF Report 2013 11The Board of Executive Directors of BASF SE
To Our Shareholders

BASF on the capital market
BASF Report 2013To Our Shareholders12
BASF on the capital market
The stock markets were characterized by economic and political uncertainty in 2013. Investors were unsettled by the continuing debt crisis in the eurozone, the budget and debt debates in the United States and speculation as to the potential end of the U.S. Federal Reserve’s expansive fiscal policy. The BASF share rose by 8.9% in this difficult environment, trading at €77.49 at the end of 2013. We stand by our ambitious dividend policy and will propose a dividend of €2.70 per share at the Annual Shareholders’ Meeting – an increase of 3.8% compared with the previous year. BASF has solid financing and good credit ratings.
BASF share performancesAfter a positive start to the year, stock market sentiment repeat-edly turned negative in the first half of 2013. Contributing to this was regional political tension, along with speculation on the possible end of the United States’ expansive fiscal policy.
The second half of the year was initially unsteady, as well, as the U.S. budget conflict and the governmental crisis in Italy put a strain on stock market development. Yet the mood improved over the course of October, and several important indexes – such as the Dow Jones and DAX 30 – reached new record highs. The upward trend was boosted by indications of the U.S. Fed-eral Reserve’s continuing loose fiscal policy as well as by the European Central Bank’s unexpected reduction of interest rates. The BASF share reached an all-time high of €78.97 on December 2, 2013. BASF shares traded at €77.49 at the end of 2013, 8.9% above the previous year’s closing price. Assuming that dividends were reinvested, BASF shares gained 12.9% in value in 2013. This did not match the very good performance of the German and European stock markets, whose benchmark indexes DAX 30 and DJ EURO STOXX 50 respectively gained 25.5% and 21.6% over the same period. In 2013, the global industry indexes DJ Chemicals and MSCI World Chemicals rose by 18.2% and 20.5%, respectively.
Change in value of an investment in BASF shares 2013(with dividends reinvested, indexed)
BASF share 12.9% DAX 30 25.5% MSCI World Chemicals 20.5%
DecNovOctSepAugJulJunMayAprMarFebJan90
100
110
120
130
140
90
110
100
120
130
140
90
110
100
120
130
140
BASF on the capital market
− Stock market development marked by economic and political uncertainty; unsteady development followed by upward trend in fourth quarter − BASF share gains 8.9% in 2013
− Proposed dividend of €2.70 per share; increase of 3.8% compared with previous year
Dividend per share1 (€ per share)
20132011 20122009 201020082007200620052004
1.951.951.70
2.20
2.60 2.702.50
0.851.00
1.50
1 Adjusted for two-for-one stock split conducted in 2008
BASF on the capital market
To Our ShareholdersBASF Report 2013 13
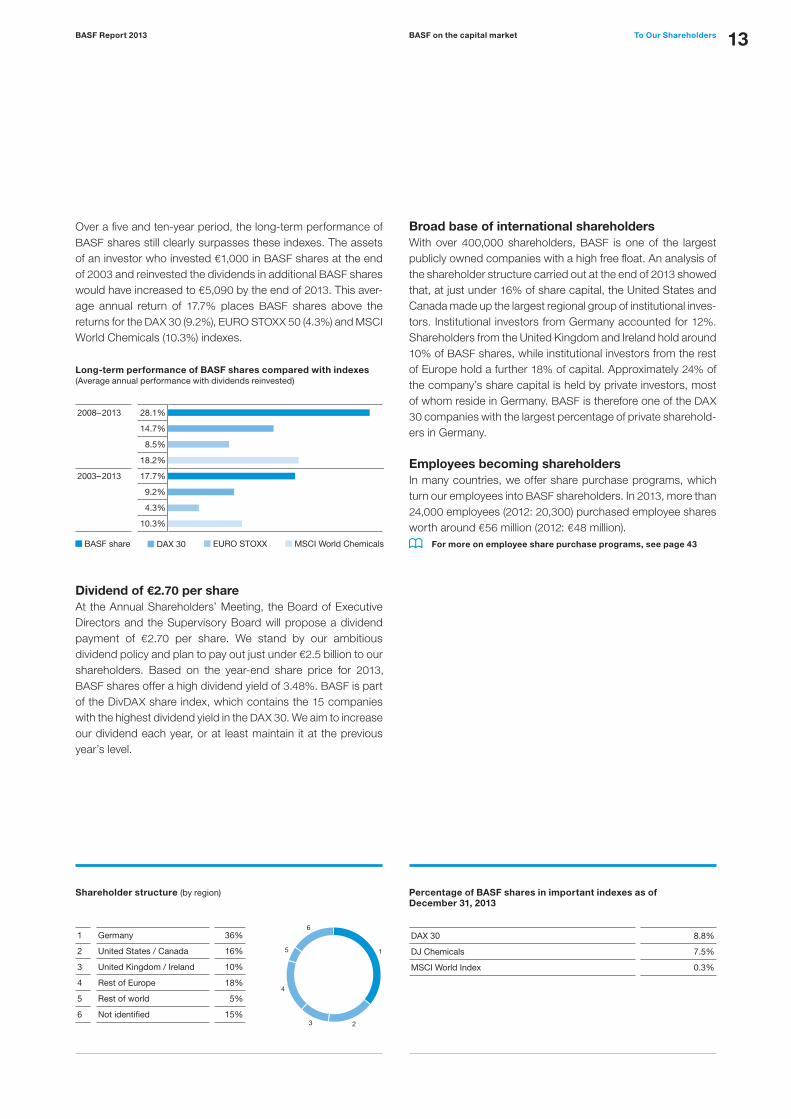
Over a five and ten-year period, the long-term performance of BASF shares still clearly surpasses these indexes. The assets of an investor who invested €1,000 in BASF shares at the end of 2003 and reinvested the dividends in additional BASF shares would have increased to €5,090 by the end of 2013. This aver-age annual return of 17.7% places BASF shares above the returns for the DAX 30 (9.2%), EURO STOXX 50 (4.3%) and MSCI World Chemicals (10.3%) indexes.
Long-term performance of BASF shares compared with indexes (Average annual performance with dividends reinvested)
2008– 2013 28.1%
14.7%
8.5%
18.2%
2003– 2013 17.7%
9.2%
4.3%
10.3%
BASF share EURO STOXX MSCI World ChemicalsDAX 30
Dividend of €2.70 per shareAt the Annual Shareholders’ Meeting, the Board of Executive Directors and the Supervisory Board will propose a dividend payment of €2.70 per share. We stand by our ambitious dividend policy and plan to pay out just under €2.5 billion to our shareholders. Based on the year-end share price for 2013, BASF shares offer a high dividend yield of 3.48%. BASF is part of the DivDAX share index, which contains the 15 companies with the highest dividend yield in the DAX 30. We aim to increase our dividend each year, or at least maintain it at the previous year’s level.
Broad base of international shareholdersWith over 400,000 shareholders, BASF is one of the largest publicly owned companies with a high free float. An analysis of the shareholder structure carried out at the end of 2013 showed that, at just under 16% of share capital, the United States and Canada made up the largest regional group of institutional inves-tors. Institutional investors from Germany accounted for 12%. Shareholders from the United Kingdom and Ireland hold around 10% of BASF shares, while institutional investors from the rest of Europe hold a further 18% of capital. Approximately 24% of the company’s share capital is held by private investors, most of whom reside in Germany. BASF is therefore one of the DAX 30 companies with the largest percentage of private sharehold-ers in Germany.
Employees becoming shareholdersIn many countries, we offer share purchase programs, which turn our employees into BASF shareholders. In 2013, more than 24,000 employees (2012: 20,300) purchased employee shares worth around €56 million (2012: €48 million).
For more on employee share purchase programs, see page 43
Shareholder structure (by region)
1 Germany 36%
2 United States / Canada 16%
3 United Kingdom / Ireland 10%
4 Rest of Europe 18%
5 Rest of world 5%
6 Not identified 15%
Percentage of BASF shares in important indexes as of December 31, 2013
DAX 30 8.8%
DJ Chemicals 7.5%
MSCI World Index 0.3%
1
23
4
5
6

BASF on the capital market
BASF Report 2013To Our Shareholders14
BASF in key sustainability indexesThe BASF share has been included in the Dow Jones Sus taina-bility World Index (DJSI World) for the thirteenth year in succes-sion. The analysts particularly recognized our commitment in the areas of risk and crisis management, human capital develop ment, and plant biotechnology. As one of the most well-known sustainability indexes, the DJSI World represents the top 10% of the 2,500 largest companies in the Dow Jones Global Index based on economic, environmental and social criteria. According to the non-profit organization CDP, BASF is among the ten leading companies in the world in reporting on climate protection. The CDP represents 722 institutional inves-tors, with around $87 trillion in assets under management. We were once again included in the CDP Global 500 Climate Disclosure Leadership Index (CDLI) in 2013, already making a total of nine times. The CDLI contains 60 companies that disclose their climate protection data in a particularly transpar-ent and comprehensive manner. As in previous years, we were the top scorer in the Materials sector.
For more on the key sustainability indexes, see basf.com/sustainabilityindexes
Good credit ratings and solid financingWith “A+/A-1/outlook stable” from rating agency Standard & Poor’s and “A1/P-1/outlook stable” from Moody’s, BASF has good credit ratings, especially in comparison with competitors in the chemical industry. At the end of 2013, the financial indebtedness of the BASF Group was €14.4 billion with liquid funds of €1.8 billion. The average maturity of our financial indebtedness was 5.5 years. The company’s medium to long-term debt financing is predominantly based on corporate bonds with a balanced maturity profile. For short-term debt financing, BASF has a commercial paper program with an issuing volume of up to $12.5 billion. As backup for the commercial paper program, there are committed, broadly syndicated credit lines of €6 billion available; these are not being used at this time.
For more on financial indebtedness and maturities, see the Notes from page 197 onward
Analysts’ recommendationsAround 30 financial analysts regularly publish studies on BASF. At the end of 2013, 45% of these analysts had a buy rating for our shares (end of 2012: 58%) while 45% of analysts recommended holding our shares (end of 2012: 42%) and 10% had a sell rating (end of 2012: 0%). On December 31, 2013, the average target share price according to analyst consensus estimates was €77.69.
Continuously updated consensus estimates on BASF are available online at basf.com/share
BASF in sustainability indices
− DJSI World: particular recognition for risk and crisis management, human capital development and plant biotechnology − CDLI: repeated inclusion verifies transparency of BASF’s reporting; top score once again in Materials sector
Solid financing
− Financial indebtedness of BASF Group €14.4 billion at year-end 2013; average maturity of 5.5 years − Commercial paper program with issuing volume of up to $12.5 billion − Committed but unused backup lines of €6 billion
BASF on the capital market
To Our ShareholdersBASF Report 2013 15
Close dialog with the capital marketOur corporate strategy aims to create long-term value. We support this strategy through regular and open communication with all capital market participants. To keep institutional investors and rating agencies informed, we host numerous one-on-one meetings and roadshows worldwide. We also hold information events to give private investors insight into BASF. In March, we explained how the new accounting and reporting standards IFRS 10, IFRS 11 and IAS 19 (revised) affected our accounting methods and the reported figures for 2012, as well as how they implacted BASF’s financial goals. We also presented further details on the new segment structure in-troduced at the beginning of the year. At the beginning of June, we held an “Investor Day Asia Pacific” for analysts and investors from around the globe. The focus here was on the implementation of the “We create chemistry” strategy in the Asia Pacific region: our “Grow Smartly” strategy. We explained how expanding existing sites and strengthening research and development activities in the region will help us achieve our ambitious growth targets. Participants also had the opportunity to tour our Verbund site in Nanjing, China, and the new regional innovation campus in Shanghai, China.
For more on our “We create chemistry” strategy, see page 21 onward
In 2013, we once again put on roadshows geared specifically toward investors who base their investment decisions on sustainability criteria. There, we particularly outlined our measures for climate protection and energy efficiency. In addition, as in previous years, we conducted several special creditor relations roadshows presenting our business and our financing strategy to credit analysts and creditors. Investors can find comprehensive information about BASF and BASF shares on our website. We have also been providing interested users with current information on the BASF share via social media platforms like Twitter and Facebook for several years. This resource is being accessed at an ever-increasing rate. Analysts and investors have confirmed the quality of our communication work: In the annual survey of European financial analysts and investors conducted by Britain’s IR Magazine, we received the Grand Prix for Best Overall Investor Relations and took several first prizes, including in the categories for Best Investor Relations by Country (Germany) and in the Chemicals/Specialty Chemicals sector. We were further honored for our corporate report and the effective use of modern communication channels in financial communication. In the Global Top 50 Awards, also conducted by IR Magazine and covering all regions and industries, BASF took the Gold Award for the best investor relations worldwide. Our capital market communications also received high honors in the IR Global Rankings.
Dialog with the capital markets
− Worldwide roadshows and individual meetings provide information to institutional investors and ratings agencies − In-depth exploration of topics at investor days − Special roadshows for credit analysts and creditors as well as for investors focused on sustainability criteria − Information events for retail investors − Numerous awards for BASF Investor Relations
Investor Relations
Can be contacted at − Phone: +49 621 60-48230
− Email: [email protected] − Online: basf.com/share
The Investor Relations team’s newsletter keeps you informed about current BASF topics and acts as a useful reminder for important BASF dates. Subscribe at: basf.com/share/newsletter

BASF on the capital market
BASF Report 2013To Our Shareholders16
Further information
Securities code numbers
Germany BASF11
Great Britain 0083142
Switzerland 323600
United States (CUSIP Number) 055262505
ISIN International Securities Identification Number DE000BASF111
International ticker symbol
Deutsche Börse BAS
London Stock Exchange BFA
Swiss Exchange AN
Key BASF share data1
2009 2010 2011 2012 2013
Year-end price € 43.46 59.70 53.89 71.15 77.49
Year high € 43.95 61.73 69.40 73.09 78.97
Year low € 20.71 39.43 43.66 51.89 64.79
Year average € 31.62 46.97 57.02 62.17 71.96
Daily trade in shares2
million € 157.4 197.5 265.7 205.6 200.8
million shares 5.0 4.2 4.7 3.3 2.8
Number of shares December 313 million shares 918.5 918.5 918.5 918.5 918.5
Market capitalization December 31 billion € 39.9 54.8 49.5 65.4 71.2
Earnings per share € 1.54 4.96 6.74 5.25 5.27
Adjusted earnings per share € 3.01 5.73 6.26 5.64 5.37
Dividend per share € 1.70 2.20 2.50 2.60 2.70
Dividend yield4 % 3.91 3.69 4.64 3.65 3.48
Payout ratio % 111 44 37 50 51
Price-earnings ratio (P/E ratio)4 28.2 12.0 8.0 13.6 14.7
1 The figures for the 2011 business year and earlier were not restated according to the new accounting and reporting standards IFRS 10 and 112 Average, Xetra trading3 After deduction of shares earmarked for cancellation4 Based on year-end share price

2 Man
agem
ent’s
Rep
ort
Management’s Report
The BASF Group 18
Our strategy 21
Corporate strategy 21
Goals 24
Value-based management 26
Sustainability 27
Innovation 30
Investments and acquisitions 36
Business models and customer relations 38
Working at BASF 39
Social commitment 45
The business year at BASF 46
Economic environment 46
Results of operations 49
Net assets 54
Financial position 55
Business review by segment 58
Chemicals 60
Performance Products 66
Functional Materials & Solutions 73
Agricultural Solutions 78
Oil & Gas 82
Regional results 88
Responsibility along the value chain 90
Supply chain management 90
Raw materials 91
Responsible Care Management System 93
Safety, security and health 94
Transportation and storage 94
Production 95
Products 97
Environment 99
Energy and climate protection 99
Water 103
Air and soil 105
Forecast 106
Opportunities and risks report 106
Economic environment in 2014 115
Outlook 2014 118

The BASF Group
BASF Report 2013Management’s Report18
The BASF Group
We are the world’s leading chemical company – The Chemical Company. In the BASF Group, around 112,000 employees work on contributing to the success of our customers in nearly all sectors and almost every coun-try in the world. Our broad portfolio is arranged into five segments: Chemicals, Performance Products, Func-tional Materials & Solutions, Agricultural Solutions and Oil & Gas.
Organization of the BASF GroupArranged into five segments, 14 divisions bear operational responsibility and manage our 66 global and regional business units. The divisions develop strategies for our 86 strategic busi-ness units and are organized according to sectors or products. The regional divisions contribute to the local development of our business and help to exploit market potential. They are also responsible for optimizing the infrastructure for our busi-ness. For financial reporting purposes, our divisions are grouped
into the following four regions: Europe; North America; Asia Pacific; and South America, Africa, Middle East. Three central divisions, six corporate departments and eleven competence centers provide services for the BASF Group in areas such as finance, investor relations, communica-tions, human resources, research, engineering, site manage-ment, and environment, health and safety. In line with our “We create chemistry” strategy, we opti-mized our segment structure as of January 1, 2013, in order to better serve customer industries and further increase our operational and technological excellence. By combining busi-nesses that share the same business model, we can sharpen our focus on the respective success factors. The Plastics segment was dissolved. Those businesses now belong to the Chemicals and the Functional Materials & Solutions (formerly Functional Solutions) segments. Our inno-vative plastics, which we develop for key customer industries such as the automotive, construction, electrical and electronics
Organization of the BASF Group
− Five segments contain 14 divisions that manage our global and regional business units − Regional divisions optimize infrastructure and support operations − Corporate divisions and departments as well as competence centers provide Group-wide services
Optimization of segment structure
− Sharper focus on customer industries and operational and technological excellence; grouping together businesses that share the same business model − Plastics segment dissolved − Creation of new Performance Materials division in Functional Materials & Solutions segment − Closer alignment of Chemicals segment’s three divisions along value chains
BASF structure as of January 1, 2013Percentage of total sales1 in 2013
Segments
Chemicals Performance Products Functional Materials & Solutions
Agricultural Solutions
Oil & Gas
Divisions
– Petrochemicals– Monomers– Intermediates
– Dispersions & Pigments– Care Chemicals– Nutrition & Health– Paper Chemicals– Performance Chemicals
– Catalysts– Construction Chemicals– Coatings– Performance Materials
– Crop Protection – Oil & Gas (Exploration & Production and Natural Gas Trading)
1 The 6% of sales not shown belonged to Other.
23% 21% 23% 7% 20%

The BASF Group
Management’s ReportBASF Report 2013 19
sectors, are grouped into the new Performance Materials division. In the Chemicals segment, we will continue to concentrate on the profitable development of BASF’s Production Verbund. We have aligned the segment’s divisions even more closely along the value chains. We have expanded the Petrochemicals division to include propylene oxide, thus bringing all important propylene derivatives together with other steam cracker deriv-atives. In the new Monomers division, we have grouped together most of the product lines from the previous Inorganics division, along with many of the high-volume monomers and basic poly-
mers from the former Plastics segment, such as MDI and TDI. In the Intermediates division, we primarily concentrate on the C1 (methane) value chain. The other segments remain unchanged.
Markets and sitesBASF has companies in more than eighty countries and supplies products to a large number of business partners in nearly every part of the world. In 2013, we achieved 56% of our sales with customers in Europe, of which 35 percentage points were in the Oil & Gas segment. North America accounted for
Markets and sites
− BASF with companies in more than eighty countries − Six Verbund sites and 376 other production sites worldwide; around 112,000 employees − Largest BASF Verbund site located in Ludwigshafen, where Verbund concept was created
Most important research sites
− Europe: Ludwigshafen, Basel, Düsseldorf − North America: Raleigh, Iselin, Tarrytown − Asia Pacific: Shanghai, Singapore, Mumbai − South America: Guaratinguetá
BASF sites
FreeportGeismar
Antwerp
Florham Park
São Paulo
Singapore
Hong Kong
Ludwigshafen
Nanjing
Regional centers Verbund sitesSelected production sites
Kuantan
Selected research sites

The BASF Group
BASF Report 2013Management’s Report20
Verbund
− Intelligent plant networking in the Production Verbund − Efficient use of resources results translates into low emissions and logistics costs − Technology and Know-how Verbund
Corporate legal structure
− BASF SE as the publicly traded parent company of the BASF Group − 301 companies consolidated in the Consolidated Financial Statements − 8 joint operations proportionally considered − 34 additional enterprises recorded according to equity method
19% of sales; Asia Pacific, 17%; and 8% of sales were gener-ated in South America, Africa, Middle East. We operate six Verbund sites as well as 376 additional pro-duction sites worldwide. Our Verbund site in Ludwigshafen is the largest integrated chemical complex in the world. This was where the Verbund concept was developed and continuously optimized before it was applied to other sites around the world.
VerbundThe Verbund system is one of BASF’s great strengths. Here, we add value as one company by using our resources efficiently. The Production Verbund, for example, intelligently links production units and energy demand so that heat released by production processes can be used as energy in other plants. Furthermore, by-products of one plant can serve as feedstock elsewhere. In this system, chemical processes run with lower energy use and higher product yield. This not only saves us raw materials and energy, it also minimizes emissions, lowers logis-tics costs and makes use of synergies. Another important part of the Verbund concept is the Technology and Know-How Verbund. Expert knowledge is pooled in our central research areas.
For more on the Verbund concept, see basf.com/verbund_e
Competitive environmentBASF occupies one of the top three market positions in around 75% of the business areas in which it is active. Our most impor-tant competitors include Akzo Nobel, Bayer, Clariant, Dow Chemical, DuPont, Evonik, Lanxess, Reliance, Sabic, Sinopec, Solvay and many hundreds of local and regional competitors. We expect competitors from emerging markets to become increasingly significant in the years ahead.
Corporate legal structureAs the publicly traded parent company, BASF SE takes a central position: Directly or indirectly, it holds the shares in the companies belonging to the BASF Group, and is also the largest operating company. The majority of Group companies cover a broad spectrum of our business. Some concentrate on specific business areas: the Wintershall Group companies, for example, focus on oil and gas activities. In the BASF Group Consolidated Financial Statements, 301 companies including BASF SE are fully consolidated. We consolidate 8 joint opera-tions on a proportional basis, and 34 companies are accounted for using the equity method.
For more, see the Notes to the Consolidated Financial Statements from page 163 onward
Compensation report and disclosures in accordance with Section 315(4) of the German Commercial Code
The compensation report can be found from page 131 onward, and the disclosures required by takeover law in accordance with Section 315(4) of the German Commercial Code from page 125 onward. They form part of the Management’s Report audited by the external auditor

Our strategy
Corporate strategy
Management’s ReportBASF Report 2013 21
Our strategyCorporate strategy
With the “We create chemistry” strategy, BASF has set itself ambitious goals in order to strengthen its position as the world’s leading chemical company. We want to contribute to a sustainable future, and have embedded this into our corporate purpose: “We create chemistry for a sustainable future.”
In 2050, around nine billion people will live on this planet. While the world population and its demands will keep growing, the planet’s resources are finite. On the one hand, population growth is associated with huge global challenges; and yet we also see many opportunities, especially for the chemical industry.
Our purposeWe create chemistry for a sustainable future
Through research and innovation, we support our customers in nearly every industry in meeting the current and future needs of society. Our products and solutions contribute to conserving resources, ensuring good nutrition and improving quality of life. Innovations based on chemistry will play a key role in three areas in particular:
− Resources, environment and climate− Food and nutrition− Quality of life
Our leading position as an integrated global chemical company opens up opportunities for us in all three of these areas. In pur-suing them, we act in accordance with four strategic principles.
Our strategic principles
We add value as one company
We innovate to make our customersmore successful
We drive sustainable solutions
We form the best team
We add value as one company. Our Verbund concept is unique in the industry. We plan to strengthen this sophisticated and profitable system even further. It extends from the Produc-tion Verbund and Technology Verbund to the Know-How Verbund, and provides access to all relevant customer indus-tries worldwide. In this way, we combine our strengths and add value as one company.
We innovate to make our customers more successful. We want to align our business even more closely with our custom-ers’ needs and contribute to their success with innovative and sustainable solutions. Through close partnerships with custom-ers and research institutes, we link expertise in chemistry, bio-logy, physics, materials sciences and engineering to jointly develop customized products as well as functional materials and system solutions.
“We create chemistry” strategy
− Our purpose: We create chemistry for a sustainable future − Innovations based on chemistry will play a key role in three areas in particular: resources, environment and climate; food and nutrition; quality of life − Our strategic principles: We add value as one company – We innovate to make our customers more successful – We drive sustainable solutions – We form the best team

Our strategy
Corporate strategy
BASF Report 2013Management’s Report22
We drive sustainable solutions. In the future, sustainability will serve more than ever before as a starting point for new business opportunities. We therefore value sustainability and innovation as important drivers for profitable growth.
We form the best team. Committed and qualified employees around the world are the key to making our contribution to a sustainable future. That is why we will continue to pursue our goal of building the best team. We offer excellent working con-ditions and an open leadership culture that fosters mutual trust and respect and encourages high motivation.
For more on innovation, see page 30 onward
For more on business opportunities with sustainability, see page 27 onward
For more on the Best Team Strategy, see page 39 onward
Our valuesHow we act is critical for the successful implementation of our strategy: This is what our values represent. They guide how we interact with society, our partners and with each other.
CreativeIn order to find innovative and sustainable solutions, we have the courage to pursue bold ideas. We join our areas of exper-tise from many different fields and build partnerships to develop creative, value-adding solutions. We constantly improve our products, services and solutions.
Open We value diversity – in people, opinions and experience. That is why we foster dialog based on honesty, respect and mutual trust. We explore our talents and capabilities.
ResponsibleWe act responsibly as an integral part of society. In doing so, we strictly adhere to our compliance standards. And in every-thing we do, we never compromise on safety.
Entrepreneurial All employees contribute to BASF’s success – as individuals and as a team. We turn market needs into customer solutions. We succeed in this because we take ownership and embrace accountability for our work.
Strategic focus areasWe have defined strategic focus areas within our company: In order to achieve our goals, we are concentrating on the areas of sustainability, innovation, sector orientation, employees, technological and operational excellence. To maximize our potential, we combine our strengths and act as one company to even better use the full range of competencies that make us unique in our industry. We will tap new growth markets by linking our research and development expertise, our operational excellence, our market knowledge and our customer relation-ships even more closely together. In this way, we promote the long-term success of both BASF and of our customers with our products and solutions. Our employees are fundamental to achieving the goals of our “We create chemistry” strategy.
Global standardsOur standards are aligned with internationally recognized prin-ciples and fulfill or exceed existing laws and regulations. We respect and promote
– The 10 principles of the United Nations Global Compact, – The Universal Declaration of Human Rights and both United Nations covenants on human rights,
Our values
− Creative − Open − Responsible − Entrepreneurial
Focus areas
− Sustainability − Innovation − Industry orientation − Employees − Technology and operational excellence

Our strategy
Corporate strategy
Management’s ReportBASF Report 2013 23
– The ILO’s core labor standards and Tripartite Declaration of Principles concerning Multinational Enterprises and Social Policy (MNE Declaration),
– The OECD Guidelines for Multinational Enterprises, – The Responsible Care Global Charter, and – The German Corporate Governance Code.
We stipulate rules for our employees with standards that apply Group-wide. We set ourselves ambitious goals with voluntary commitments and review our environmental, health and safety performance using our Responsible Care Management System. Regular audits and a three-pronged monitoring system ensure our compliance with labor and social standards. This system comprises the following instruments:
– External compliance hotlines, – The annual survey of our Group companies to inspect the prevailing working conditions, and
– Close dialog with our stakeholders, such as employee repre-sentatives and international organizations.
Our business partners are expected to align their actions with internationally recognized principles. We have established moni-toring systems to ensure this.
For more on labor and social standards, see page 44
For more on Responsible Care Management, see page 93
For more on corporate governance, see page 121 onward
For more on compliance, see page 127 onward
Innovations for a sustainable futureInnovations in chemistry are necessary to meet the needs of the growing world population on a long-term basis. The develop-ment of innovative products and solutions is, therefore, of vital significance for BASF’s success. In 2020, we aim to generate around €30 billion of our sales and €7 billion of our EBITDA with the help of innovative products that will have been on the mar-ket for less than 10 years. This means effective and efficient
research is becoming increasingly important. We defined tech-nology and growth fields with which we can make a decisive contribution to innovative solutions for global challenges and contribute to sustainable development. We are continuing to expand our research and development activities in Asia as well as in North and South America in order to participate in regional innovation processes and gain access to local talent. By 2020, we aim to conduct half of our research and development activi-ties outside of Europe. For more on innovation, see page 30 onward
Business expansion in emerging marketsIn the years ahead, we want to grow even more robustly within the emerging economies and expand our leading position there. Today’s emerging markets are expected to account for around 60% of global chemical production in 2020. We aim to benefit from the significant growth in these regions and therefore plan to invest more than a third of our additions to property, plant and equipment there between 2011 and 2020. In 2013, emerging markets saw substantially higher growth rates than the industrialized countries; however, this increase was not as high as in the previous year. This was largely due to the weak global economy, which dampened export demand. Furthermore, currency appreciation in many emerging markets led to higher import prices. Capital outflow also had a negative impact on investment activity there. Nevertheless, our business in emerging markets grew once again in 2013: Compared with 2012, we were able to increase the sales of our companies headquartered in these countries by 1% to €16,294 million. Based on customer location, we increased sales (excluding Oil & Gas) in emerging markets year-on-year by 1% to €19,757 million; sales to customers in emerg-ing markets therefore amounted to around 33% of total sales (excluding Oil & Gas) in 2013. By 2020, we aim to expand this proportion to 45%.
Global standards
− We act according to clearly defined values and standards of conduct that fulfill or go beyond laws and regulations − We review our performance with regular audits and a three-pronged monitoring system
Sales1 in emerging markets
2020 45% 55%
2013 33% 67%
2003 24% 76%
Industrialized countries2Emerging markets
1 Percentage of BASF Group sales (excluding Oil & Gas) by location of customer2 Comprises EU15, Norway, Switzerland, North America, Japan, Australia,
New Zealand

Our strategy
Goals
BASF Report 2013Management’s Report24
Goals
Growth and profitability
Annual goals 2015 Goals 2020 Goals Status at year-end 2013
Sales Approx. €80 billion Approx. €110 billion €74.0 billion
Premium on cost of capital At least €2.0 billion on average each year €1.9 billion
EBITDA Approx. €14 billion Approx. €22 billion €10.4 billion
Earnings per share Around €7.50 €5.27
EBITDA (billion €) Senior executives Proportion of senior executives with international experience (Goal: over 80%)
81.6%2013 2020 Goal
10.4 22
Employees
Long-term goals Status at year-end 2013 More on
International proportion of senior executives Increase in the proportion of non-German senior executives (baseline 2003: 30%) 35.0% Page 42
Senior executives with international experience Proportion of senior executives with international experience over 80% 81.6% Page 42
Women in executive positions Increase in the proportion of female executives worldwide 18.5% Page 41
Employee development
Establishment of employee development as a responsibility shared by employees and leaders based on relevant processes and tools
The project has been implemented for around
40,000 employees worlwide
Page 40
In 2011, we set ourselves sales and earnings goals for 2015 and 2020 as part of the “We create chemistry” strategy. The appli-cation of International Financial Reporting Standards 10 and 11 as of January 1, 2013, translates into lower reported sales and income from operations for the BASF Group. We have therefore adjusted our sales goals for 2015 and 2020 by €5 billion each and our EBITDA goals by €1 billion each. We reduced the yearly goal for the premium on our cost of capital from €2.5 billion to €2 billion. The goal for earnings per share in 2015 remained unchanged. Adjustments do not yet include the asset swap with Gazprom that will be completed in 2014 with retroactive finan-
cial effect as of April 1, 2013. The transaction comprises the divestiture of the gas trading and storage business as well as shares in production activities in the North Sea. In 2012, these activities contributed around €10 billion to sales and around €500 million to the EBITDA of the BASF Group. In return, we will receive 25% plus a share in two additional Achimov Formation blocks in Western Siberia. Our goals are based on the assumption that global gross domestic product will grow by an annual average of 3% from 2010 to 2020 and worldwide chemical production by 4% each year. We aim to grow two percentage points faster than global chemical production every year.

Our strategy
Goals
Management’s ReportBASF Report 2013 25
Transportation safetyTransportation accidents per 10,000 shipments, baseline 2003 (2020 goal: –70%)
WaterIntroduction of sustainable water management at production sites in water stress areas (2020 goal: 100%)
–61% 11.1%
Safety, security and health
2020 Goals Status at year-end 2013 More on
Transportation
Transportation accidents per 10,000 shipments (baseline 2003) –70% –61% Page 94
Production
Lost time injuries per million working hours (baseline 2002) –80% –58% Page 95
Health Performance Index (annual goal) >0.9 0.89 Page 95
Products
Risk assessment for all products sold worldwide by BASFin quantities of more than one metric ton per year >99% 56% Page 97
Environment
2020 Goals Status at year-end 2013 More on
Energy and climate protection
Improvement of energy efficiency in production processes1 (baseline 2002) +35% +19.8% Page 100
Greenhouse gas emissions per metric ton of sales product1 (baseline 2002) –40% –34.0% Page 100
Stop flaring of associated gas released during Wintershall’s production of crude oil(2012 goal) 100% 100% Page 100
Greenhouse gas emissions per amount and distance of transported gas (baseline 2010) –10% –9.0% Page 100
Water
Emission of organic substances to water1 (baseline 2002) –80% –78.5% Page 103
Emission of nitrogen to water1 (baseline 2002) –80% –86.8% Page 103
Emission of heavy metals to water1 (baseline 2002) –60% –64.2% Page 103
Withdrawal of drinking water for production (baseline 2010) –50% –25.3% Page 103
Introduction of sustainable water management at production sites in water stress areas 100% 11.1% Page 103
Air
Emission of air pollutants1 (baseline 2002) –70% –62.2% Page 105
1 Excluding oil and gas production

Our strategy
Value-based management
BASF Report 2013Management’s Report26
Value-based management
“We add value as one company” is one of the four principles of our “We create chemistry” strategy. To create value in the long term, a company’s earnings must exceed the cost of stockholders’ equity and borrowing costs. This is why we strive to earn a premium on our cost of capital of at least €2 billion on average each year. To ensure BASF’s long-term success, we encourage all employees to think and act entre preneurially along the lines of our value-based management concept. Our goal: to create awareness as to how each and every employee can find value-oriented solutions in the company’s day-to-day operations and implement these in an effective and efficient manner.
EBIT after cost of capitalEarnings before interest and taxes (EBIT) after cost of capital is a key performance and management indicator for the BASF Group and its operating divisions and business units. This figure combines the company’s economic situation as summa-rized in EBIT with the costs for the capital made available to us by shareholders and creditors. When we earn a premium on our cost of capital, we exceed the return expected by our shareholders.
Calculation of the cost of capital percentage The cost of capital percentage (weighted average cost of capital, WACC) is determined using the weighted cost of equity and borrowing costs. The cost of equity is ascertained using the Capital Asset Pricing Model. Borrowing costs are deter-mined based on the financing costs of the BASF Group. EBIT after cost of capital, which we use as a steering parameter, is a pretax figure. Therefore, we use the current average tax rate to derive the pretax cost of capital percentage from the WACC. In 2013, this cost of capital percentage was 11%; it will be at the same level in 2014. Based on this, an EBIT threshold is determined which must then be reached by all the BASF Group’s operating units put together in order to earn the cost of capital.
Value-based management throughout the companyFor us, value-based management means the daily focus placed on value by all of our employees. To this end, we have identified value drivers that show how each and every unit in the company can create value. We develop performance indicators for the individual value drivers that help us to plan and pursue changes. An important factor in ensuring the successful implemen-tation of value-based management is linking the goals of BASF to the individual target agreements of employees. In the operating units, the most important performance indicators are the achievement of a positive EBIT after cost of capital and a competitive return. By contrast, the value contribution of the functional units is evaluated on the basis of effectiveness and efficiency. All this forms a comprehensive system of value drivers and key indicators for the individual levels and functions at BASF. In addition to EBIT after cost of capital, EBIT and EBIT before special items are the most significant performance indicators for measuring economic success as well as for steering the BASF Group and its operating units. We primarily comment on EBIT before special items on a segment and division level in our financial reporting because this figure is adjusted for influences not associated with typical business operations. This makes it particularly suitable for describing economic development over time. In addition to EBIT before special items, we also report on sales as another main driver for EBIT after cost of capital. BASF’s nonfinancial targets are focused more on the long term, and are not used for short-term steering. According to our value-based management concept, all employees can make a contribution in their areas of business to help ensure that we earn the targeted premium on our cost of capital. We pass this value-based management concept on to our team around the world through seminars and training events, thereby promoting entrepreneurial thinking at all levels within BASF.
EBIT after cost of capital1 (million €) Five-year summary
2013 1,872
2012 (restated) 1,164
2012 1,534
2011 2,551
2010 3,500
2009 (226)
Calculation of EBIT after cost of capital (million €)
2013 2012
EBIT BASF Group 7,273 6,742
– Less EBIT for activities not assigned to the segments2 (664) (215)
– Less cost of capital3 6,065 5,793
EBIT after cost of capital 1,872 1,164
1 The figures for 2009 to 2011 were not restated according to IFRS 10 and 11 (see page 5). The figures for 2012 are shown before and after the restatement.
2 The projected net expense is already provided for by an increase in the cost of capital percentage.
3 In 2012 and 2013, the cost of capital percentage was 11%.

Sustainability
Management’s ReportBASF Report 2013 27
Sustainability
Sustainability is firmly embedded into our strategy and organization. Sustainability management supports our strategic principle “We drive sustainable solutions” and follows our corporate purpose – “We create chemistry for a sustainable future.”
StrategyBASF defines sustainability as balancing economic success with social and environmental responsibility. The conflicts of interest involved here challenge us to weigh varying concerns and find the best possible solutions. We have strategically embedded sustainability into our company as a significant driver for growth. Our sustainability management has three responsibilities: Minimizing risks, taking advantage of business opportunities and establishing relation-ships with our stakeholders based on trust. We minimize risks by using our materiality analysis to identify relevant issues early on, and through operational excellence in our business proces ses. We set ourselves globally uniform standards for the environ ment, safety, security, health protection, product stew-ardship and compliance, as well as labor and social standards. We conduct internal audits on process and occupational safety as well as environmental and health protection. We review labor and social standards within the framework of a monitoring system. Ecological and social criteria are also relevant for us in the selec tion of our suppliers. We take advantage of business opportunities by offering our customers innovative products and solutions that contrib-ute to sustainable development. Our acclaimed instruments for sustainability evaluation are among the methods we employ. For example, we review our product portfolio to identify those prod-ucts and solutions that contribute to sustainable development. In addition, we ensure that sustainability is integrated into the development and implementation of our business units’ strate-gies and research projects. Furthermore, we have integrated sustainability criteria into our processes for making investment
decisions. We systematically evaluate the contribution to sustain-ability made by expenditures for property, plant and equipment as well as by investments in financial assets on a case-by-case basis.
For more on the organization of our sustainability management, see basf.com/sustainabilitymanagement
For more on our Responsible Care Management System, see page 93
For more on monitoring labor and social standards, see page 22 onward and basf.com/labor_social_standards
Creating value for customersWith our Eco-Efficiency Analysis, we identify critical parameters for improving the ecological and economic balance of our prod-ucts and processes along the value chain. Our Socio- Eco-Efficiency Analysis, SEEBALANCE®, is applied in order to additionally consider social aspects. Our AgBalance® method analyzes and evaluates sustainability specifically in agricultural production. With SET – applied sustainability™, our customer-specific sustainability initiative for the food and feed industry, we have supported, for example, partners from the American beef industry since 2013. We are helping improve sustainability in meat production – from growing feed to disposing of packag-ing by the end user. In 2013, BASF and TÜV SÜD developed the “mass balance method” for the use of renewable feedstock, which allows conventional fossil resources in the current Production Verbund to be replaced by renewable resources. This must take place without changing the formulation or quality of each end product. Depending on the customer’s specifications, up to 100% of fossil resources can be replaced for an end product. During its development, we discussed the opportunities offered by this method with customers, associations and authorities in order to involve our stakeholders from an early stage. For more on the mass balance method, see page 91
Responsibilities and standards
− BASF defines sustainability as balancing economic success with social and environmental responsibility, both today and in the future − Strategic responsibilities: minimizing risks, taking advantage of business opportunities, establishing trust-based relationships with our stakeholders
Sustainability evaluation tools
− Using our Eco-Efficiency Analysis, we help customers increase their contribution to sustainable development along the value chain − “Mass balance method” developed in 2013 allows up to 100% of fossil resources in end products to be replaced by renewable resources, depending on customer specifications
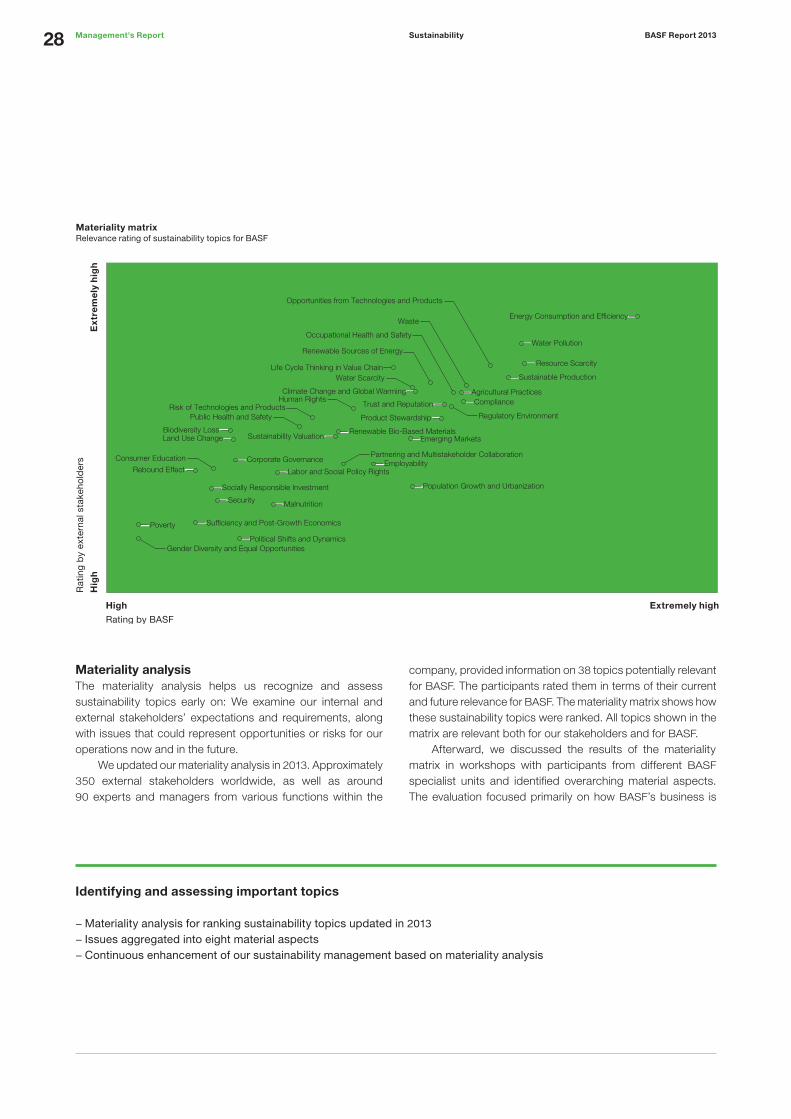
Sustainability
BASF Report 2013Management’s Report28
Materiality analysis The materiality analysis helps us recognize and assess sustainability topics early on: We examine our internal and external stakeholders’ expectations and requirements, along with issues that could represent opportunities or risks for our operations now and in the future. We updated our materiality analysis in 2013. Approximately 350 external stakeholders worldwide, as well as around 90 experts and managers from various functions within the
company, provided information on 38 topics potentially relevant for BASF. The participants rated them in terms of their current and future relevance for BASF. The materiality matrix shows how these sustainability topics were ranked. All topics shown in the matrix are relevant both for our stakeholders and for BASF. Afterward, we discussed the results of the materiality matrix in workshops with participants from different BASF specialist units and identified overarching material aspects. The evaluation focused primarily on how BASF’s business is
Identifying and assessing important topics
− Materiality analysis for ranking sustainability topics updated in 2013
− Issues aggregated into eight material aspects − Continuous enhancement of our sustainability management based on materiality analysis
Materiality matrixRelevance rating of sustainability topics for BASF
Extremely high
Ext
rem
ely
hig
h
High
Hig
h
Materiality matrixRelevance rating of sustainability issues for BASF
Rating by BASF
Emerging Markets
Regulatory Environment
Water Pollution
Opportunities from Technologies and Products
Sustainability ValuationRenewable Bio-Based Materials
Sustainable Production
Waste
Trust and Reputation
Water Scarcity
Agricultural PracticesCompliance
Population Growth and UrbanizationSocially Responsible Investment
Labor and Social Policy RightsRebound Effect
Land Use ChangeBiodiversity Loss
Public Health and SafetyRisk of Technologies and Products
Life Cycle Thinking in Value Chain
Renewable Sources of Energy
Climate Change and Global WarmingHuman Rights
Product Stewardship
Consumer Education Corporate Governance
Resource Scarcity
Malnutrition
Energy Consumption and Efficiency
Employability
Poverty
Security
Gender Diversity and Equal OpportunitiesPolitical Shifts and Dynamics
Sufficiency and Post-Growth Economics
Partnering and Multistakeholder Collaboration
Rat
ing
by
exte
rnal
sta
keho
lder
s
Occupational Health and Safety

Sustainability
Management’s ReportBASF Report 2013 29
Material aspectsEight material aspects have been identified for BASF based on the results of the stakeholder survey and internal workshops
WaterEmployment and
EmployabilityEnergy and
Climate FoodOperationalExcellence
ResponsiblePartnering
Products andSolutions
Resources andEcosystems
impacted by these topics. Material aspects were identified as: employment and employability, energy and climate, food, operational excellence, responsible partnering, products and solutions, resources and ecosystems, and water. We are continuing to identify BASF’s influence on these material aspects. We use the materiality analysis to constantly enhance our sustainability management.
For more, see basf.com/materiality
Stakeholder engagementA fixed component of our sustainability management is continuous exchange with our stakeholders. These include our employees, customers, suppliers and shareholders, as well as experts in science, industry, politics, society and media. We provide transparent communication about our activities and take on critical questions. We have a particular responsibility toward our production sites’ neighbors, and discuss current issues with them in 84 community advisory panels. In keeping with our corporate strategy, we integrate sustainability into our day-to-day business and help our employees make their contribution to a sustainable future. We conducted information sessions, online courses, workshops and discussions on sustainability in 2013. In order to even more closely involve our stakeholders, we established a Stakeholder Advisory Council in 2013 with various international experts from science and society together with BASF’s Board of Executive Directors. This regular meeting aims to enhance BASF’s approach to sustainability through continuous dialog. An open exchange with consumers, nongovernmental organizations, policy makers and the public is crucial for the successful introduction of products that are based on new tech-nologies. For example, in 2013 we discussed the results of our
Nano Dialog Forum on transparent communication about nano-materials with selected political representatives in Brussels, together with delegates from participating environmental and consumer groups, unions and companies. Furthermore, we presented the research results of the NanoGEM project on the safety of nanoparticles and nanocomposite materials to the public in Berlin. We make information on our social standards and our conditions for production available to our customers via special online platforms. BASF takes an active part in the United Nations Global Compact: BASF’s Chairman of the Board of Executive Directors is a member of the United Nations Global Compact Board. In the worldwide network of Global Compact LEAD, we are involved in the creation of the Post-2015 Development Agenda and discussing possible global sustainability goals together with the other participants. BASF is also active in numerous local Global Compact networks. We joined the local Global Compact network in Kenya in 2013. BASF does not support political parties. In the United States, our employees have established the BASF Corporation Employees Political Action Committee. It is an independent, federally registered association of employees which collects donations for political purposes and independently decides how these are used.
For more on stakeholder dialog, see basf.com/dialog_e
For more on supplier management, see page 90
For more on nanotechnology, see page 98
Innovation
BASF Report 2013Management’s Report30
Innovation
Innovations based on effective and efficient research and development are an important growth engine for BASF. Our employees work in interdisciplinary teams on innovative processes and products for a sustainable future. This is how we ensure our long-term business success with chemistry-based solutions for almost all sectors of industry.
A growing need for energy, food and clean water, limited resour ces and a booming world population – reconciling all these factors is the greatest challenge of our time. Innovations based on chemistry play a key role here, for they provide a critical contribution beyond known solutions. Our innovative strength lies in our global team of highly quali fied employees with various specializations. In 2013, the number of employees involved in research and development rose to around 10,650 (2012: 10,450). The central research areas Advanced Materials & Systems Research, Biological & Effect Systems Research, Process Research & Chemical Engineering, and BASF Plant Science are our knowledge and competence centers. Together with the development units in our operating divisions as well as BASF New Business and BASF Venture Capi tal, they form the core of our global Know-How Verbund. Our global network with more than 600 excellent universi-ties, research institutes and companies is also an important component of this Know-How Verbund. We cooperate with them in many different disciplines in order to achieve our ambi-tious growth targets. In 2013, we launched the North American Center for Research on Advanced Materials initiative. Together with departments of Harvard University, the Massachusetts Institute of Technology (MIT) and the University of Massachu-setts (UMass) Amherst, we aim to develop new materials for the auto motive, building and construction, and energy industries. Our research pipeline included approximately 3,000 proj-ects in 2013. We increased our spending on research and development by €103 million to €1,835 million (2012: €1,732 mil-lion). The opera ting divisions were responsible for 79% of total research and develop ment expenditures; the remaining 21%
was allocated to cross-divisional corporate research, which works on the growth and technology fields. Around one-third of our research and develop ment expenditure is invested in proj-ects for increased energy efficiency and climate protection. Innovations based on chemistry require market-focused research and development that is sharply focused on the needs of our customers. In order to bring promising research ideas even faster to market, we regularly assess our projects accord-ing to a multistep innovation chain process. Software-supported project management as well as continuous exchange of knowl-edge between customers and the project coordinators within the research and development units are crucial for the efficient development of our project portfolio. BASF New Business plays a particular role in the search for new business areas. It identi-fies trends and future markets at an early stage, turning attrac-tive topics beyond existing business activities into growth fields. Another vital factor for our success is a global research and development presence. In 2013, we continued to expand our activities in North America and Asia. In Raleigh, North Carolina, we enlarged our research facilities for crop protection and plant biotechnology. We are exploring electrolytes and electrode materials for high-performance batteries in a new laboratory for battery materials in Amagasaki, Japan. In an affiliated center for application technology, we are developing customer-oriented solutions for battery companies on the Asian market. The number and quality of our patents attest to our power of innovation and long-term competitiveness. We filed around 1,300 new patents worldwide in 2013. For the fifth time in succession, we headed the rankings in the Patent Asset Index in 2013 – a method which compares patent portfolios industry-wide. This once again underscores BASF’s power of innovation.
For a multiyear overview of research and development expenditures, see the Ten-Year Summary from page 226 onward
Innovation
− Approximately 10,650 employees worldwide in research and development − Research pipeline with around 3,000 projects − €1,835 million in research and development expenditures in 2013
Strategic focus
− Strong customer and market orientation − Forward-looking project portfolio − Worldwide expansion of research and development centers, especially in Asia and North America − More efficient innovation management

Innovation
Management’s ReportBASF Report 2013 31
Research focus areasIn order to develop future business areas for BASF, we have defined growth and technology fields for which we expect high sales potential in 2020. The focus of our research is derived from three major areas in which chemistry-based innovations will play a key role in the future: “resources, environment and climate,” “food and nutrition” and “quality of life.” We regularly review the attractiveness of these growth and technology fields for BASF and adjust our portfolio as necessary.
Growth fieldsIn the Enzymes growth field, we conduct research on, for example, enzymes for human and animal nutrition as well as for deter gents and cleaners. Enzymes are proteins that act as cata-lysts to enable or accelerate biological and chemical processes. In 2013, we expanded our technological basis in industrial enzyme technology: With the purchase of the enzyme technol-ogy for detergents and cleaners of Henkel AG & Co. KGaA, we
Worldwide expansion of research and development
− Expansion of research facilities for crop protection and plant biotechnology in Research Triangle Park, Raleigh, North Carolina − New laboratory for exploring electrolytes and electrode materials for high-performance batteries, plus center for application technology in Amagasaki, Japan
Global network in science and industry
− Network with around 600 excellent universities, research institutes and companies − North American Center for Research on Advanced Materials initiative launched with three top American universities − Research collaboration with Linde Group and ThyssenKrupp for environmentally friendly production of syngas from carbon dioxide and hydrogen
Growth fields
E-Power Management
Plant Biotechnology
Lightweight Composites
Batteries for Mobility
Wind Energy
Water Solutions
Functional Crop Care
Enzymes
Heat Management for Construction
Organic Electronics
...
Technology fields
Materials, Systems &
Nanotechnology
Raw Material Change
White Biotechnology
Customer industries
Consumer Goods
Health and Nutrition
Electronics
Construction
Energy and Resources
Transportation
Agriculture
Resources, Environment and Climate
Food and Nutrition
Quality of Life
Global needs
Research focus areas: growth and technology fields

Innovation
BASF Report 2013Management’s Report32
aim to strengthen BASF’s position in these markets. In addition, we entered into a research and licensing agreement with the biotechnology company Dyadic International Inc., through which we can use a technology developed by Dyadic for the enhance-ment and production of enzymes and other proteins. Further-more, we are developing a highly effective protease for animal nutrition together with Direvo Industrial Biotechnology GmbH. This enzyme helps animals to better absorb and make use of the nutrients in their diet. Moreover, the acquisition of Verenium Corporation has afforded us access to an enzyme technology platform for human and animal nutrition. The growing demand for energy around the world requires innovative concepts for the resource-saving and efficient generation, transmission, storage and use of electricity. In our E-Power Management growth field, we conduct research on, for example, an innovative method for manufacturing high- temperature superconductors. They transmit electric currents with almost no loss, opening up considerable savings potential. With the acquisition of the technology company Deutsche Nanoschicht GmbH, BASF now has access to a technology that makes the production of high- temperature superconductors sig-nificantly more efficient while using far fewer resources. We are working to get this innovative technology ready for the market. The Wind Energy growth field centers on wind power as an alternative energy source. The wind turbines of the future must be manufactured and operated particularly efficiently as well as provide higher maximum power. An interdisciplinary team of researchers, developers and market experts are therefore working on projects such as new and improved materials for rotor blades. At the same time, our attention is focused on systems that combine different materials so skillfully as to create advantages in the design, manufacture and operation of the fans.
Technology fieldsVarious cross-sectional technologies provide the technological basis for developing the growth fields. We have grouped these into three technology fields: Materials, Systems & Nanotechnol-ogy, Raw Material Change and White Biotechnology. The challenges of the future require intelligent solutions based on new systems and functional materials, which means that formulation and application expertise are gaining signifi-cance. In the Materials, Systems & Nanotechnology technol-ogy field, for example, BASF researchers have developed a high-performance insulation panel based on polyurethane that requires only half as much space to do the same job as con-ventional materials. SLENTITE™ thus offers more freedom of design – for example, in interior insulation. Thanks to its tiny, only 50 to 100-nanometer-sized pores which transfer hardly any heat, SLENTITE™ provides especially efficient insulation and a pleasant interior temperature. In the Raw Material Change technology field, we are searching for alternatives and supplements to crude oil as a raw material for the chemical industry. With natural gas, carbon dioxide and renewable resources, we aim to expand the raw material basis of our value chains in the long term. For example, we began a research collaboration in 2013 with the Linde Group and ThyssenKrupp, subsidized by the German Federal Ministry of Education and Research, in order to develop innovative tech-nology for the environmentally friendly production of syngas from carbon dioxide and hydrogen. First, a new high-temperature technology will be used to obtain hydrogen and carbon from natural gas in an especially cost-efficient and environmentally friendly manner. The second step involves using CO2 – from other industrial processes, as well – and hydrogen to make syngas. Syngas is an important basic product for the chemical industry. In the technology field White Biotechnology, we are researching methods and processes for the efficient and resource-saving production of chemical and biochemical products. Fermentation and biocatalysis increasingly represent
Research focus areas
− Growth fields with attractive sales potential in 2020, for example Enzymes, E-Power Management and Wind Energy − Technology fields provide technological foundation: Materials, Systems & Nanotechnology: development of new systems and functional materials, as well as nanotechnology; Raw Material Change: alternatives and supplements to crude oil as a raw material; White Biotechnology: methods and processes for efficient and resource-saving production of chemical and biochemical products

Innovation
Management’s ReportBASF Report 2013 33
competitive alternatives to chemical processes. For example, our researchers are working on the large-scale synthesis of acrylamide from acrylonitrile using a naturally occurring soil bacterium. Acrylamide is the precursor for polyacrylamide, which is used for applications such as water treatment floccu-lants. Thanks to lower costs, this biocatalytic process is expected to secure our future competitiveness in this field. For more on research and development, see basf.com/innovations
Innovations in the segments – examplesInnovations are an important success factor for BASF’s long-term growth. In developing new products, we look at the needs of our customers as well as at market trends, and take advan-tage of the opportunities arising from value chains in the BASF Verbund. We want to become even more competitive through innovative production methods. We never stop improving our existing products, applications and processes. We view sus-tainability as an opportunity, since we use chemistry to create value for customers and society. In 2015, we aim to achieve sales of around €10 billion and an EBITDA of around €2.5 billion with new and improved prod-ucts or applications that will have been on the market for less than five years. In 2020, we aim to increase our sales to around €30 billion and EBITDA to around €7 billion with innovations that will have been on the market for no longer than 10 years. Chemicals: Thanks to a newly developed catalyst and to improvements in the production process, we are now able to save significantly more resources in the production of toluylen-diamine. Toluylendiamine is an important intermediate for TDI, which is used in an array of polyurethane-based products such as car seats, upholstered furniture and mattresses. In addition, we are working on a new method for obtaining short-chain olefins from natural gas. Compared with prior synthesis methods based on natural gas, the new process promi ses higher energy efficiency and therefore lower carbon
emissions. Olefins are used as a basic chemical in the produc-tion of numerous products such as solvents or surfactants. We are constantly developing new application possibilities for our products. For example, we successfully introduced MDI in North America as a binder component for wood-based pan-els. In comparison with conventional binders, MDI accelerates the production process, decreases emissions and protects the panels from moisture. Our experienced team assists custom-ers in the new binder’s introduction and safe handling. Performance Products: We fulfill the varying design require ments of our customers with our unique portfolio of high-quality color and effect pigments for the coatings industry. LuminaTM Royal Blue is the first in a new family of pigments based on a mica substrate and offering the ultimate color intensity and brilliance with its optimized form and particle distribution. In addi tion to new design options, LuminaTM Royal Blue allows our customers greater flexibility in their formulations. With Plantaquat® NC, we have developed a new solution for hair conditioning products in the dynamic market for natu-ral cosmetics. Plantaquat® NC is a balanced combination of emulsifiers, stabilizers and conditioning agents, effectively pro-tecting hair from breakage, reducing split ends and providing excep tional sensory properties. The product consists entirely of renewable and biodegradable raw materials. Kollicoat® Smartseal 30 D tablet coatings mask unpleas-ant-tasting ingredients under a protective layer, making medi-cations easier to take. At the same time, the water-repellant polymer film effectively guards the tablet’s contents against moisture. Medications not only retain a longer shelf life, they can also be stored more easily. As opposed to products treated with solvents, Kollicoat® Smartseal 30 D is a water-based solution, thus making a contribution to the reduction of emissions.
Goals for sales and EBITDA with innovations (billion €)
Sales20201 30
20152 10
EBITDA20201 7
20152 2.5
Chemicals – Innovations
− Saving even more resources in production of toluylendiamine − Development of new production method for short-chain olefins from natural gas − As a binder component for wood-based panels, MDI accelerates production, decreases emissions and protects panels from moisture
1 Pertains to innovations then on the market for less than ten years2 Pertains to innovations then on the market for less than five years

Innovation
BASF Report 2013Management’s Report34
In collaboration with the paper manufacturer Sappi, we have developed new paper qualities for flexible packaging. A polymer dispersion-based layer keeps mineral oil and other undesirable substances from migrating from recycled-paper packaging into food. This makes the new types of paper suitable for applica-tions such as packaging for sweets, tea and other dried foods. In addition, we offer extrusion polymers such as Ultramid® and ecovio® as migration barriers. The German Packaging Award 2013 was granted to the Belgian company Van Genechten for its folding carton with Ultramid® as a mineral oil barrier. Compared with conventional mineral oil-based lubricants, Emgard® drive axle lubricants extend drain intervals, enhance fuel efficiency and provide better protection against wear and tear. The secret is in this lubricant’s high viscosity index: Its visco sity remains constant over a broad temperature spectrum. Emgard® drive axle lubricants are formulated with antiwear addi tives as well as oxidation and corrosion inhibitors that ensure protection of gears and bearings under a wide range of load conditions. Functional Materials & Solutions: In the Catalysts divi-sion, our focus is on the development of solutions and materials which save resources and can fulfill increasingly strict exhaust regulations. With the innovative FWC™ four-way conversion catalyst for gasoline engines, we have developed a single-component technology that removes particulate matter as well as carbon monoxide, hydrocarbons and nitrogen oxides from engine exhaust. This helps automobile manufacturers meet stricter emissions regulations, such as Euro 6c. Conventional three- way conversion catalysts require the installation of a sepa-rate gasoline particulate filter, which can increase back pressure and takes up more space. Construction Chemicals aligns its research and develop-ment activities with local customers’ needs and construction industry trends. MasterPolyheed® brand concrete admixtures allow for the excellent processability of concrete with varying
raw material quality. This makes MasterPolyheed® especially suitable for customers in emerging regions like the Middle East and India. Thanks to our innovative concrete admixture technol-ogy based on novel polymers, MasterPolyheed® is particularly reliable in the most diverse conditions. In the Coatings division, we work on developing inno vative coating systems and intelligent solutions in order to contribute to our customers’ success. Body shops that use the new Glasurit® 285-270 Primer Filler Pro, for example, save them-selves a layer of coating when refinishing a vehicle. The filler can be applied directly without a prior base coat, taking on the base coat’s role as a corrosion protection layer. Painters and body shops therefore save not only an entire step, but also material and nozzle cleaning after applying the base coat. Among the innovative products and system solutions the Performance Materials division launched on the market in 2013 is Infinergy®, the world’s first expanded thermoplastic poly urethane (E TPU). Infinergy® provides adidas Boost™ running shoes with unique cushioning and shock absorption properties, helping athletes improve their performance. We also develop inno vative solutions for the automotive industry, such as Ultracom™. The central component is a fiber material coated with our Ultramid® plastic. With an additional plastic for spray-ing and a comprehensive service offer from BASF’s application development, Ultracom™ provides the best possible combina-tion of weight savings, cost-effectiveness and performance in components for bodywork and chassis. Agricultural Solutions: Our innovation strategy focuses on developing integrated solutions that help farmers secure and increase their yields. We constantly invest in our development pipeline in order to expand our portfolio both in and beyond con-ventional crop protection. In 2013, we spent €469 million on research and development in the Crop Protection division, representing around 9% of sales for the segment.
Performance Products – Innovations
− Lumina™ Royal Blue pigments for ultimate color intensity − Plantaquat® NC for hair conditioners protects against breakage and reduces splitting − Kollicoat® Smartseal 30 D tablet coatings allow for easier ingestion and protect against moisture − New paper qualities for flexible packaging − Emgard® drive axle lubricants: better fuel efficiency and increased protection from wear and tear
Functional Materials & Solutions – Innovations
− FWC™ four-way conversion catalyst also removes particulate matter from gasoline engine exhaust − MasterPolyheed® concrete admixtures: highly processable concrete with raw materials of mixed quality − New Glasurit® primer filler saves a coating layer in automotive refinishing − Infinergy® provides adidas Boost™ running shoes with unique cushioning and shock absorption

Innovation
Management’s ReportBASF Report 2013 35
Agricultural Solutions – Innovations
− €469 million in research and development spending in 2013 (9% of sales) − Crop protection pipeline with peak sales potential of €2,100 million − Successful product launches in all indications − BASF Plant Science: introduction of Genuity® DroughtGard® drought-tolerant corn in the United States
Oil & Gas – Innovations
− Focus on risk reduction in exploration activities, increasing recovery factor from reservoirs and developing technologies for reservoirs with challenging conditions − Innovative technologies enable profitable production of natural gas even with high concentrations of hydrogen sulfide
Our innovation pipeline continued to increase in value in 2013. For products launched between 2010 and 2020, we now fore-see a peak sales potential of €2,100 million – an increase of €400 million compared with the previous year. This higher amount will be supported by successful product launches in all indications. We increased the peak sales potential for our fungi-cide Xemium® by €200 million to more than €600 million. In addi-tion to Xemium®, other new fungicides, insecticides, herbicides and herbicide-tolerant solutions as well as products from the new Functional Crop Care business unit will also con trib ute sig-ni ficantly. We predict a more than €100 million increase in the peak sales potential for our herbicide Kixor® and now expect more than €300 million. In the Functional Crop Care business area, we have identified a potential of €100 million beyond that afforded by the acquired businesses from Becker Underwood. BASF Plant Science: We work together with multiple bio-technology companies, research institutes and universities worldwide. Together with Monsanto, we develop higher-yield-ing, more stress-tolerant crops. In 2013, Genuity® DroughtGard® hybrid corn, the first product of this collaboration, was commer-cially launched on the U.S. market. This drought-tolerant corn is based on corn lines optimized through plant breeding com-bined with the first approved drought tolerance gene transferred using plant biotechnology. Genuity® DroughtGard® hybrid corn thus contributes to sustainable agriculture in the corn-growing areas of the United States where limited water resources often lead to lower yields. Oil & Gas: Our research and development activities focus on reducing risks in exploration activities and developing technologies for reservoirs with challenging development and production conditions, as well as increasing the recovery factor from reservoirs.
High concentrations of hydrogen sulfide in natural gas have often hindered profitable production in the Middle East. For the first time, we are now able to contribute our decades of experience in sour gas production in Germany to this region as we conduct a technical assessment of the Shuweihat sour gas and conden-sate field in Abu Dhabi together with partners. This is made possible by our innovative and efficient technologies for sepa-rating natural gas from acidic components such as hydrogen sulfide or carbon dioxide.
Expenditure on research and development by segment
1 Chemicals 10%
2 Performance Products 20%
3Functional Materials & Solutions 20%
4 Agricultural Solutions 26%
5 Oil & Gas 3%
6 Corporate research, Other 21%
OutlookWe constantly evaluate promising new technology and growth fields for future innovations. We aim to keep strengthening our research and development activities in Asia as well as in North and South America. By 2020, we plan to conduct half of our research and development activities outside of Europe in order to gain on-location access to customers and their market knowl-edge, as well as to talent and innovation centers.
1
2
34
6
5 €1,835million
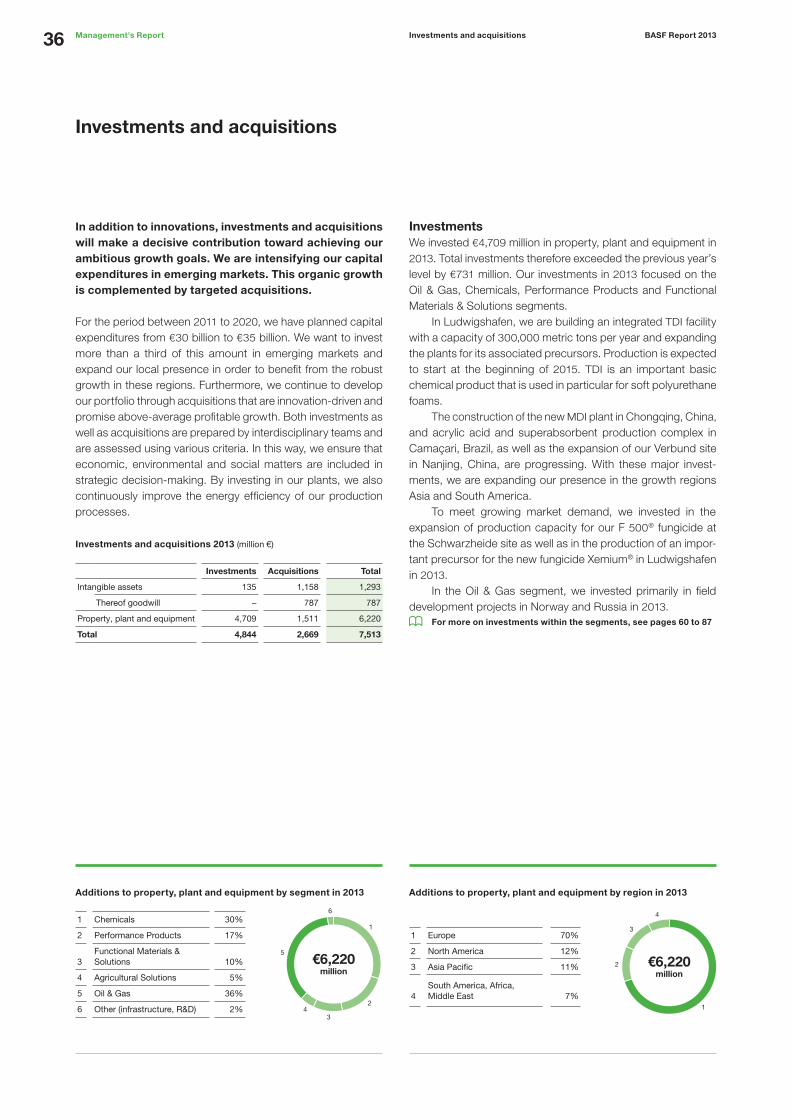
Investments and acquisitions
BASF Report 2013Management’s Report36
Investments and acquisitions
In addition to innovations, investments and acquisitions will make a decisive contribution toward achieving our ambitious growth goals. We are intensifying our capital expenditures in emerging markets. This organic growth is complemented by targeted acquisitions.
For the period between 2011 to 2020, we have planned capital expenditures from €30 billion to €35 billion. We want to invest more than a third of this amount in emerging markets and expand our local presence in order to benefit from the robust growth in these regions. Furthermore, we continue to develop our portfolio through acquisitions that are innovation-driven and promise above-average profitable growth. Both investments as well as acquisitions are prepared by interdisciplinary teams and are assessed using various criteria. In this way, we ensure that economic, environmental and social matters are included in strategic decision-making. By investing in our plants, we also continuously improve the energy efficiency of our production processes.
Investments and acquisitions 2013 (million €)
Investments Acquisitions Total
Intangible assets 135 1,158 1,293
Thereof goodwill – 787 787
Property, plant and equipment 4,709 1,511 6,220
Total 4,844 2,669 7,513
InvestmentsWe invested €4,709 million in property, plant and equipment in 2013. Total investments therefore exceeded the previous year’s level by €731 million. Our investments in 2013 focused on the Oil & Gas, Chemicals, Performance Products and Functional Materials & Solutions segments. In Ludwigshafen, we are building an integrated TDI facility with a capacity of 300,000 metric tons per year and expanding the plants for its associated precursors. Production is expected to start at the beginning of 2015. TDI is an important basic chemi cal product that is used in particular for soft polyurethane foams. The construction of the new MDI plant in Chongqing, China, and acrylic acid and superabsorbent production complex in Cama çari, Brazil, as well as the expansion of our Verbund site in Nanjing, China, are progressing. With these major invest-ments, we are expanding our presence in the growth regions Asia and South America. To meet growing market demand, we invested in the expansion of production capacity for our F 500® fungicide at the Schwarzheide site as well as in the production of an impor-tant precursor for the new fungicide Xemium® in Ludwigshafen in 2013. In the Oil & Gas segment, we invested primarily in field devel op ment projects in Norway and Russia in 2013.
For more on investments within the segments, see pages 60 to 87
Additions to property, plant and equipment by segment in 2013
1 Chemicals 30%
2 Performance Products 17%
3Functional Materials & Solutions 10%
4 Agricultural Solutions 5%
5 Oil & Gas 36%
6 Other (infrastructure, R&D) 2%
Additions to property, plant and equipment by region in 2013
1 Europe 70%
2 North America 12%
3 Asia Pacific 11%
4South America, Africa,Middle East 7%
1
2
34
5
6
€6,220million
1
2
3
4
€6,220million

Investments and acquisitions
Management’s ReportBASF Report 2013 37
AcquisitionsIn 2013, we received €1,511 million worth of tangible fixed assets through acquisitions. Additions to intangible assets including goodwill amounted to €1,158 million. We boosted our presence in the growth market for enzymes in 2013 through two acquisitions in particular. To strengthen BASF’s position as a supplier of important ingre dients for the detergents and cleaners industry, we purchased the enzyme technology for detergents and cleaners from Henkel AG & Co. KGaA. The transaction comprised production hosts, various deter gent enzymes, and the corresponding intellectual prop-erty. Enzymes are essential components in modern detergent and cleaner formulations. The activities have been integrated into the Care Chemicals division. In addition, we acquired all shares in the San Diego, Cali-fornia-based Verenium Corporation. Verenium Corporation deve lops and markets high-quality enzymes which, as catalysts, enable and accelerate biological and chemical processes. The business has been allocated to the Performance Products segment as well as to Other. In addition, we concluded a series of transactions in 2013 that had been announced in the previous year. In January 2013, we acquired Pronova BioPharma ASA, a company head-quartered in Lysaker, Norway, which researches, develops and produces highly concentrated omega-3 fatty acids. The pur-chase price amounted to €526 million. With this acquisition, we aim to take a leading position in the global market for omega-3 fatty acids. Pronova BioPharma’s business has been grouped into a global business unit of the Nutrition & Health division, together with our previous activities in this field. We now offer our customers the complete range of omega -3 fatty acids in various concentrations.
In March 2013, we completed the acquisition of parts of Ciech Group’s TDI business. The acquisition largely comprised intellectual property rights and the customer list. TDI is used primarily in furniture and automotive industry applications. The acquired business has been integrated into the Monomers division. We concluded the acquisition of assets from Statoil ASA, headquartered in Stavanger, Norway, in July 2013. The trans-action included the acquisition of shares in the Brage (32.7%), Vega (30%) and Gjøa (15%) fields. The daily production of Winters hall in Norway thus increased from around 3,000 bar-rels of oil equivalent (BOE) to just under 40,000 BOE. As part of the transaction, Statoil is receiving a 15% share in the Edvard Grieg development project from Wintershall as well as a finan-cial consideration. The transaction was concluded with retroactive commercial effect as of January 1, 2013. The purchase price amounted to €853 million; the net payment was €588 million.
For more information on acquisitions, see the Notes to the Consolidated Financial Statements from page 166 onward
For information on divestitures, see the Notes to the Consolidated Financial Statements from page 169 onward
Investments
− Increase in total investments compared with 2012
− Intensified investments in emerging markets
Acquisitions
− Two acquisitions strengthen our presence in growth market for enzymes − Acquisition of Pronova BioPharma ASA concluded − Assets acquired from Statoil ASA

Business models and customer relations
BASF Report 2013Management’s Report38
Business models and customer relations
BASF’s customer portfolio ranges from major global customers and medium-sized regional businesses to local workshops. We align our business models and sales channels with the respective customer groups and market segments. In line with our strategic principle, “We add value as one company,” we have optimized our orga ni za tional structure and more tightly bundled our products and services. This enables us to even better address the needs of customers from different sectors.
For more on our organizational structure, see page 18 onward
In the classical chemicals business, we mostly sell the chemi-cals produced in our Verbund in bulk. These comprise basic products from the Chemicals segment, such as steam cracker products, sulfuric acid, plasticizers, caprolactam and TDI. For these basic chemicals, our priority is on supplying customers reliably and cost-effectively. Marketing is carried out partly via e-commerce. We manufacture a broad range of customized products, particularly in the Performance Products segment – from vita-mins, personal care ingredients and color pigments to paper chemicals and plastic additives. In joint projects, we work closely together with customers from an early stage in order to develop new products or formulations for a specific industry. A world-wide network of development laboratories allows us to quickly adapt our products to local needs. We offer functionalized materials and solutions tailored to customers’ requirements, particularly in the Functional Mate rials & Solutions and Agricultural Solutions segments. These include, for example, engineering plastics, concrete addi-tives, coatings and crop protection products. We enter into close partnerships with customers to develop innovations together which help them optimize their processes and applications. Our under standing of the entire value chain as well as our global setup and market knowledge are key success factors here.
For information on customer relations in the Oil & Gas segment, see page 82 onward
Industry orientationWe serve customers from many different sectors with a broad portfolio of diverse competencies, processes, technologies and products. Around half of our business units are geared toward specific industries. By combining expertise and resources, we position ourselves as a solution-oriented system provider for our customers. Not all business units can be arranged purely according to industry, however. That is why BASF creates sector-specific “industry teams,” such as those for key customer sectors like the automotive, pharmaceutical and packaging industries, or for growth fields like wind energy. They pool expertise, knowl-edge and contacts across different units, sharpen our under-standing of the value chains in customer industries and work on industry-specific solutions that often could not be developed within one operating division alone. For example, as the largest supplier to the furniture industry, BASF has an industry team for furniture. This is where we work together with customers on solutions for more resistant coatings, innovative surfacing mate-rials and new foams for cushions. The close alignment of our business with our customers’ needs is an important component of our “We create chemistry” strategy. We therefore aim to keep systematically and structur-ally enhancing our industry orientation in the future.
Customer relations
− Classical chemicals business: reliable and cost-effective supply − Customized products: joint projects to develop products or formulations for a specific industry − Functionalized materials and solutions: close partnerships to jointly improve customer processes and applications through innovations
Industry orientation
− Around half of business units geared toward specific indus tries − Industry teams pool cross-unit expertise, knowledge and contacts − Systematic, structured development of our industry orientation as important part of “We create chemistry” strategy

Working at BASF
Management’s ReportBASF Report 2013 39
Best Team Strategy
− Excellent people: We attract the right people and create space for their performance and personal development − Excellent place to work: We cultivate a working environment that inspires and connects people − Excellent leaders: We foster an inclusive leadership culture with mutual trust, respect and dedication to top performance
Overview
− 112,206 employees worldwide − Various awards received worldwide for attractiveness as an employer
2 At BASF, the apprenticeship program trains students for technical, scientific and business vocations as well as trade and craft professions.
Our employees are fundamental to achieving the goals of our “We create chemistry” strategy. We want to attract talented people, retain them in the company, and sup-port them in their development. To do so, we cultivate a working environment that inspires and connects people. It is founded on inclusive leadership based on mutual trust, respect and dedication to top performance. Strategy Our Best Team Strategy is derived from our corporate strategy and simultaneously contributes to its implementation. We want to form the best team. To achieve this, we put focus on three strategic directions: excellent people, excellent place to work and excellent leaders. We concentrate on increasing our attrac-tiveness in worldwide labor markets, sharpening our focus on career develop ment, and life-long learning in all regions, as well as supporting and developing our leaders. BASF Group employees by region(Total: 112,206, thereof 24.5% women, as of December 31, 2013)
1 Germany: 52,523 (46.8%), thereof women: 23.8% BASF SE: 35,411 (31.6%), thereof women: 21.4%
North America:16,996(15.1%)
1 Germany, XX,XXX (XX.X%), thereof female: XX.X% BASF SE, XX,XXX (XX.X%), thereof female: XX.X%
76.9% 23.1% 76.1% 23.9%
74.2% 25.8% 72.4% 27.6%
Europe1:70,977(63.3%)
South America,Africa,Middle East:7,525(6.7%)
Asia Pacific:16,708(14.9 %)
At the end of 2013, BASF had 112,206 employees (2012: 110,782); of these, 3,060 were apprentices2 (2012: 2,809). The acquisition of Pronova BioPharma ASA and of businesses from Statoil ASA in Norway, as well as of Verenium Corporation in the United States, added to our headcount. Reductions in head-count resulted from, for example, the divestiture of Industrial Water Management France SAS, headquartered in France, and of CONICA Sports Flooring in Switzerland.
New hires BASF Group 2013 (as of December 31, 2013)
Europe 3,750 70.8% 29.2%
North America 1,768 73.0% 27.0%
Asia Pacific 1,953 74.0% 26.0%
South America, Africa, Middle East 848 60.5% 39.5%
Total 8,319 71.0% 29.0%
■ Men ■ Women
Competition for talentIn the worldwide competition for the best employees and leaders, we want to recruit qualified talent in order to achieve our ambitious growth targets. For example, we offer various internships both locally and abroad. Targeted online activities, such as recruiting videos and direct communication on social networks, help us expand our contact network. For its activities in helping new graduates and entry-level employees get started on their careers, BASF was selected by engineering students as one of the 50 most attractive employ-ers in the world in a 2013 study conducted by Universum. We were also recognized in Brazil and Chile as an appealing employer for starting a career, in addition to other categories. BASF once again received China’s Top Employers certificate, recognizing us as one of the leading employers in the country. The award particularly highlighted working conditions and career development for our employees.
Working at BASF

Working at BASF
BASF Report 2013Management’s Report40
Vocational training
− 3,060 apprentices in 60 occupations worldwide − Around €93 million spent on vocational training
Learning and development
− Measures for career development discussed and decided on in development dialogs − Around €106 million spent on further training
In 2013, we educated 50 talented employees in fields such as marketing, research, development, engineering and production with our Grow Graduate program, established in China in 2007. This two-year program offers young people the chance to become familiar with diverse positions in the company after their studies and prepare themselves for their desired careers. Worldwide, the percentage of employees who left the company voluntarily during their first three years of employment was 1.3% on average. This rate of employee turnover was 0.6% in Europe, 1.5% in North America, 3.6% in Asia Pacific and 1.9% in South America, Africa, Middle East.
Vocational trainingAs of December 31, 2013, BASF was training 3,060 people in around 60 occupations in 20 countries worldwide. We spent a total of around €93 million on vocational training in 2013 as well as approximately €19 million on the BASF Training Verbund as part of our social commitment. In 2013, 988 apprentices started their vocational training at BASF SE and German Group companies. We once again strengthened our commitment to vocational training at the Ludwigshafen site and in the BASF Training Verbund in 2013: In total, 1,000 people began their careers, 250 of which as part of the Start in den Beruf and Anlauf zur Ausbil-dung career-start programs in cooperation with partners in the region. These programs aim to prepare participants for a sub-sequent apprenticeship within one year. This comprehensive and individual approach comprises theoretical as well as practical program elements. Examples include support in choosing a pro-fession, and gaining experience in the BASF Training Verbund’s partner companies. In this way, the programs contribute to ensuring a sufficient supply of qualified employees for BASF and the Rhine-Neckar Metropolitan Region.
In 2013, 20 Spanish apprentices began their vocational training in Tarragona, Spain, based on the German vocational training model. The theoretical and practical phases will take place in Tarragona and in Ludwigshafen. After the successful completion of their training, we plan to employ these apprentices in produc-tion plants at the Ludwigshafen site in 2016.
For more information, see basf.com/apprenticeship
BASF Group employees by contract type (total: 112,206)
December 31, 2013 Thereof women %
Permanent staff 106,769 23.8
Apprentices 3,060 30.7
Temporary staff 2,377 45.2
Learning and developmentOur employees’ individual development is important to us. We want to recognize and promote talent early on, and our life-long learning concept provides the basis for remaining the best team and meeting the various challenges of the market. In develop-ment dialogs, our employees and leaders outline the prospects together for individual professional development and determine concrete measures for further training and development. This new format was initiated for around 40,000 employees by the end of 2013. We aim to have all employees familiar with it by 2017. These development dialogs supplement the annual employee dialogs conducted in 99% of BASF Group compa-nies worldwide, which include performance reviews. Life-long learning and further training are important com-ponents of our employee development. We spent around €106 million for this purpose in 2013 (2012: €95 million). Our measures for further training are based on the specific learning needs of our employees. Local and international seminars and

Working at BASF
Management’s ReportBASF Report 2013 41
Maintaining employability
− Supporting employability and ensuring availability of qualified employees with workshops, health and sports programs, workplace optimization and demographic analyses
Diversity
− Top 50 Company for Diversity award received in North America − 18.5% of executive positions worldwide held by women − Proportion of senior executives with international experience over 80%
1 Revised calculation for 2013: average days spent on further training per employee (2012: average days spent on further training per participant)
workshops enable the acquisition and exchange of knowledge and promote networking. Each employee spent an average of three days on further training in 20131. A total of more than 107,000 seminar days took place at BASF SE, including at the Learning Center, in 2013. Trained internal specialists have fostered the career development of BASF SE employees through career orientation since 2012. Since 2013, we have been providing targeted support for selected employees in their part-time studies toward a Bachelor’s or Master’s degree, counseling them on various career develop ment possibilities. In addition, we have strengthened our in-plant qualification with shift trainers who promote the continuous professional develop ment of employees in production and technology through individual learning assignments. By establishing the Learning Campus, we have created a global platform that will provide our employees with a globally consistent network and further training through special programs in the future. This includes, for example, a worldwide program for newly appointed leaders. Furthermore, we offer a wide and global range of opportunities for self-directed learning via electronic media, independent of time and place.
Managing demographic changesIn order to address the impact of demographic change, we create conditions which help to maintain the employability of our personnel at all stages of life and secure the availability of quali fied employees. We support our employees and leaders with workshops, health and sports programs, age-appropriate shaping of the workplace and demographic analyses. In 2013, for example, we included the topic “leadership in times of demographic change” in our basic skill enhancement for new leaders.
For more information, see basf.com/demographic_change
BASF Group employee age structure (Total: 112,206, thereof 24.5% women, as of December 31, 2013)
■ Men ■ Women
Inclusion of diversity In order to address the various needs of our customers and mar-kets, we rely on the best team in all areas and functions around the globe. The inclusion of diversity is an important component of our strategic human resources management. It helps us to continuously improve our team’s performance and power of inno vation, and increases creativity, motivation and identifica-tion with the company. This is why we are developing measures to further promote the appreciation of diversity and its inclusion. Leaders play an important role here. We support them in strengthening diversity and integrating it into day-to-day busi-ness. For example, specific goals and measures are developed together with leaders – such as for recognizing and encourag-ing different kinds of talent. Employees around the world are active as ambassadors of diversity within the company, contrib-uting significantly to an open and appreciative company culture. For its particular commitment to social diversity, BASF received the Top 50 Company for Diversity award in North America from the organization DiversityInc in 2013. At the end of 2013, the percentage of executive positions in the BASF Group held by women was 18.5% (2012: 17.2%). In a joint initiative with all 30 DAX-listed companies, BASF signed a voluntary commitment in 2011: In Germany, we aim to raise
8,515 37,305 51,022 15,364
Male Female
Up to and including25 years
(30.9% women)
Between 26and 39 years
(31.2% women)
Between 40and 54 years
(21.0% women)
55 years and up(16.1% women)

Working at BASF
BASF Report 2013Management’s Report42
Work-life balance (BASF SE employees: 35,411, thereof 21.4% women, as of December 31, 2013)
■ Men ■ Women
Leadership development
− Our leaders are seen as role models in implementing our strategy and our Code of Conduct − Global competency model for employees and leaders − Various offers for new and experienced leaders
1 The term “senior executives” refers to leadership levels 1 to 4, whereas level 1 denotes the Board of Executive Directors. In addition, individual employees can attain senior executive status by virtue of special expertise.
2 Parental leave including “partner months”
548 694
Male Female
Employees on parental leave2
(women 88.5%)
Returnees from parental leave2
(women 37.3%)
the percentage of women in executive positions from 9.8% (baseline 2010) to 15% by the end of 2020. At the end of 2013, the percentage of executive positions held by women in Germany was 13.0%. Continuing internationalization led us to update our goal for the proportion of senior executives¹ with inter national experience to over 80% in 2012. In 2013, 35% of our senior executives were non-German and 81.6% had inter-national experience.
For more information, see basf.com/diversity
Work-life balancePart of what creates a good working environment is our devel-opment and expansion of a wide range of programs worldwide to help employees better combine professional and personal life. To compete for qualified employees, we respond to their dif-fering needs and life stages. We offer, for example, diverse working models – such as flexible working hours, part-time employ ment and mobile working. In 2013, 10.9% of BASF SE employees held part-time positions, 68.9% of which were women. Numerous BASF SE employees also made use of their legal right to parental leave, including increasingly more men. Employees with dependents who require home care receive counseling on how to balance care and career, covering topics such as reducing work load, switching temporarily to part time, or long-term care insurance. Our regional initiatives address the needs of our employ-ees at a local level. In Ludwigshafen, for example, we opened the Work-Life Management center for our employees in 2013, comprising numerous offers for sports and health promotion, employee assistance, and career and family. Starting at the end of 2013, we have expanded the capacity of company childcare at our site in Ludwigshafen from 70 to 250 children between the ages of six months and three years. Our childcare capacity in Münster is being raised to 50 children and in Kassel, we offer space for 140 children from six months to ten years of age.
For more information, see basf.com/worklife_balance
What we expect from our leadersOur leaders are seen as role models in implementing our strategy in their day-to-day business. Our leadership culture is based on the principles and values of BASF. Even the standards of conduct set forth in our compliance program are basically the same around the world, and are derived from a global Code of Conduct that our leaders, as role models, are expected to fol-low to an especially high degree. The global competency model introduced in 2013 likewise applies for all employees. It also forms the foundation of our employee and leadership develop-ment. We equip our leaders with a solid foundation in basic skills by means of a mandatory modular development program. Experi enced leaders are supported by individual training in strengthening life-long competencies. In addition to our regional programs, we will also offer programs on an increasingly global level starting in 2014 to further intensify networking and exchange among leadership.
Leadership responsibility in the BASF Group
December 31, 2013
Thereof women %
Professionals3 33,313 29.3
(Senior) executives4 7,655 18.5
3 Specialists and experts without disciplinary leadership responsibilities4 Employees with disciplinary leadership responsibilities
Global Employee SurveyThe Global Employee Survey, including its follow-up process, has been established for the entire BASF Group since the first global survey in 2008. We conducted the second Global Employee Survey in 2012. Employees and leaders have been discussing the results and determining measures for improve-ment together in all regions since the end of 2012. This relates to, for example, supporting employees in their career develop-ment, work-life balance and dealing with change. We conduct this survey on a regular basis.

Working at BASF
Management’s ReportBASF Report 2013 43
Compensation
− Compensation worldwide based on objective criteria and comprises fixed and variable components as well as additional benefits − Variable components based on success of BASF Group and individual employee performance
Long-term participation in company’s success
− BASF share program “plus” encourages employees to make long-term investments through incentive shares − Long-term incentive program ties portion of senior executives’ compensation to long-term performance of BASF share
Personnel expenses, compensation and additional benefitsIn addition to market-oriented pay, BASF’s total offer also com-prises benefits, individual opportunities for development and a good working environment. Compensation for our employees worldwide is based on objective criteria. Compensation includes remuneration with fixed and variable components as well as addi tional benefits that often exceed the legal requirements. In many countries, these include company pension benefits, sup-plementary health insurance and share programs, to name a few. In 2013, the BASF Group spent €9,285 million on wages and salaries, social security contributions and expenses for pensions and assistance (2012: €8,963 million). Personnel expen ses rose by 3.6%, particularly as a result of higher expen-ses for pensions, wage and salary increases, and the higher number of employees.
BASF Group personnel expenses (million €)
2013 2012Change
in %
Wages and salaries 7,455 7,269 2.6
Social security contributions andexpenses for pensions and assistance 1,830 1,694 8.0
Thereof for pension benefits 579 408 41.9
Total personnel expenses 9,285 8,963 3.6
An analysis at our site in Ludwigshafen of all employees exempt from collective agreements has shown that there is no system-atic difference in the compensation of women and men, pro-vided the jobs and qualifications are comparable. The difference in income was found to be less than 1%.
Employees share in the company’s successWith variable compensation components, the company’s suc-cess is shared with our employees and they are rewarded for their individual performance. The same basic principles apply
to all employees. The variable component is determined by the economic success of the BASF Group – measured by the return on assets – and the employee’s individual performance. The annual bonus for 2013 will once again reach a high level. In numerous Group companies, employees are able to pur-chase shares. The BASF share program “plus” promotes the long-term participation of our employees in the company through incentive shares, allowing them to invest part of their compen-sation in BASF shares. In 2013, 23,957 employees around the world purchased 798,590 shares under the “plus” program. Since 1999, BASF has offered its senior execu tives the oppor-tunity to participate in a share-price-based compensation pro-gram. This long-term incentive (LTI) program ties a portion of their compensation to the long-term performance of the BASF share. In 2013, 94% of the approximately 1,200 senior execu-tives eligible worldwide participated in the LTI program, invest-ing up to 30% of their variable compensation in BASF shares.
For more information, see the Notes to the Consolidated Financial Statements from page 210 onward
Dialog with employee representativesOpen dialog with employee representatives is an important com-ponent of our company’s actions. If restructuring leads to staff downsizing, we work with employee representatives to develop socially responsible implementation measures. This is done in accordance with the respective legal regulations and agree-ments reached. For cross-border matters, the BASF Europa Betriebsrat (Euro pean Works Council) has been responsible for employees in Europe since 2008. We once again met with our German employee representatives in 2013 in the “Wittenberg Dialogs” to discuss the Code of Responsible Conduct for Business, which focuses on strengthening the social market economy and encouraging responsible corporate action.
For more information, see basf.com/employeerepresentation

Working at BASF
BASF Report 2013Management’s Report44
Labor and social standards
− National law and International Labor Organization’s core labor standards as minimum standard − Evaluation of adherence to voluntary commitments through a Group-wide monitoring system − We strive to ensure that our working conditions comply with ILO standards, OECD Guidelines for Multinational Enterprises and local requirements
Survey of ILO core labor standards / human rights 20131
Process implemented Effectiveness of the process
Prevention of child labor 100% Verification of age of employee when hired 100% Employees are over 15 years of age when hired
Prevention of forced labor 100% Employment contract based on employee’s voluntary agreement
100% Employees have a right to unilateral termination of the employment contract
Prevention of discrimination 100% Personnel policies based on objective criteria
In 2013, we received 18 calls. Misconduct was identified in 2 cases and countermeasures were taken.
Employees’ right to freedom of association 100%2 No company measures to fundamentally restrict freedom
93% Employees are working at a company in which employee representation exists
Employees’ right to collective bargaining 100%2 No company measures to fundamentally restrict freedom of collective bargaining
89% Employees are working at a company in which working conditions are based on a collective contract and employee representation exists
1 Data does not include Verenium Corporation, headquartered in San Diego, California. This company was newly acquired on November 1, 2013.2 Some of our employees are working in countries that have national legal restrictions with respect to freedom of association and collective bargaining.
Global labor and social standardsCompliance with national law and the core labor standards of the International Labor Organization (ILO) forms the basis of our social responsibility. Moreover, we aim to harmonize our work-ing conditions worldwide with our voluntary commitments, the relevant ILO conventions, and OECD Guidelines for Multi-national Enterprises, as well as with local requirements such as indus try standards. In countries where national laws, rules and customs deviate from international standards, we are challenged with finding appropriate solutions by engaging in dialog with the relevant stakeholders. We evaluate our adherence to our voluntary commitments using a three-pronged monitoring system implemented Group-wide. In 2013, our external compliance hotlines received 80 calls relating to human rights, 78 of which pertained to labor and social standards. Misconduct was identified in 20 cases. Coun-termeasures were taken in all cases. The results of the annual survey conducted at our Group companies reflect the working
conditions of 100% of our employ ees in 2013. If the survey eva-lu ation indicates that our voluntary commitments are being insufficiently implemented, we investigate this information and introduce remedial measures. In order to improve our worldwide adherence to international labor and social standards, we con-duct regional risk analyses for our businesses every year, including in 2013.
For more on labor and social standards, see basf.com/labor_social_standards
For more on our monitoring system, see page 22 onward
For more on compliance, see page 127 onward
Social commitment
Management’s ReportBASF Report 2013 45
Social commitment
Principles and criteria for support
− Supporting projects that offer long-term benefits − We foster education, science, social projects, sports and cultural events in communities around BASF sites − Collaboration with expert partners such as the United Nations
Highlights 2013
− “Water is Precious” recognized as a UNESCO Education for Sustainable Development project − Emergency relief for typhoon victims in the Philippines − €1.4 million donated by BASF SE and its employees for reconstruction and flood protection measures after flooding in Central Europe − €395,000 collected in end-of-year donation campaign
We take on social responsibility: We are involved in diverse projects worldwide, especially in the communi-ties in which our sites are located. Our main focus is on access to education. In this way, we promote innovative capacity and future viability.
StrategyIn 2013, the BASF Group spent a total of €49.2 million support-ing projects (2012: €49.0 million). Of this amount, we donated 27% (2012: 24%). We support initiatives that reach out to as many people as possible and have long-lasting impact. We foster education, science, social projects, sports and cultural events in the communities around our sites. On a regional level, we work together with universities, schools and nonprofit orga-nizations. We support BASF Stiftung, a charitable foundation based in Germany, in its international projects with various U.N. and nongovernmental organizations.
BASF Group donations, sponsorship and own projects in 2013 (Million €)
1 Education 26.6 (54.1%)
2 Social projects 6.5 (13.2%)
3 Culture 6.4 (13.0%)
4 Science 3.7 (7.5%)
5 Sports 2.2 (4.5%)
6 Other 3.8 (7.7%)
Focus on educationIn 2013, 70,866 children and young people in 30 countries visited our Kids’ Labs and Teens’ Labs. Our “Water is Precious” project was recognized as an offi-cial project of the U.N. World Decade of Education for Sustain-able Development by the German Commission for UNESCO. As part of the project, we provide elementary school teachers and students with an understanding of the responsible use of water through their own experimentation.
1
2
3
4
56
€49.2million
As a founding member of the Wissensfabrik (Knowledge Factory), BASF is part of a nationwide network of more than 100 companies and foundations making a contribution to edu-cation and entrepreneurship in Germany. BASF additionally maintains over 200 educational partnerships with schools and kindergartens and provides mentors for young companies. We expanded our early-childhood education initiative, Offensive Bildung, with two new projects in 2013. The Kinder Stärken! (Making Kids Strong!) project centers on fostering the health and resilience of children in ten day care centers in the Rhine-Neckar Metropolitan Region. The Treffpunkt Familienkita (Meeting Point: Family Day Care Center) project is helping ten day care centers in Ludwigshafen grow into family day care cen-ters, aiming to create optimal educational and development oppor tunities for children together with parents, day care cen-ters and other faci lities. Furthermore, we initiated the Frühe Bildung im Austausch (Exchange on Early Education) event series in 2013 to provide a platform for professional exchange with experts on educa-tional practice.
BASF Stiftung projectsTogether with UN-HABITAT and Save the Children, BASF Stiftung began reconstruction and prevention projects in 2013 after the earthquake in the Sichuan province of China. BASF in China and its employees also supported these projects. BASF Stiftung provided a total of €300,000 to the United Nations World Food Programme and UNICEF for emergency relief measures to aid the victims of the typhoon in the Philippines. BASF SE and its employees in Germany donated around €1.4 million to BASF Stiftung after the flood disaster in Cen- tral Europe to support reconstruction and flood protection measures. The company and its employees contributed around €395,000 to BASF Stiftung in the 2013 end-of-year donation campaign. BASF Stiftung uses this money to support the edu-cational projects of UNICEF, the United Nations Children’s Fund, to aid Syrian refugee children.
For more information, see basf.com/international_donations

The business year at BASF
Economic environment
BASF Report 2013Management’s Report46
Trends in the global economy in 2013
− Global gross domestic product growth not as strong as in previous year (2013: +2.3%; 2012: +2.5%), remaining lower than our original forecast (+2.6%) − Slow start to the year in major emerging markets and in Europe − Indications of global economic recovery toward end of year
1 Weighting by country changed as a result of updating the baseline year. Prior-year figures have been adjusted accordingly.
In 2013, global economic growth was once again weaker than in the previous year. The beginning of the year was particularly sluggish for the major emerging markets and Europe. Growth was somewhat slower in the United States, as well. The end of the year saw indications of recovery in the global economy. At 2.3%, global gross domestic product did not rise as much as it did in 2012 (+2.5%)1 or as we had originally forecast for 2013 (+2.6%), despite positive developments in Japan.
For the forecast for the economic environment in 2014, see page 115 onward
Economic development was marked by sharp fluctuation in 2013. The debt crisis and resulting consolidation efforts contin-ued to put a strain on the economy in Europe. In addition, the unusually cold winter in Northwestern Europe was detrimental for construction spending and private consumption. The weak European economy – especially at the beginning of the year – negatively impacted development in the emerging markets. Poli-tical uncertainty had a dampening effect, as well. Indications that the U.S. Federal Reserve would tighten its fiscal policy led to considerable depreciation in many emerging market curren-cies. Uncertainty declined toward the end of the year after economic data suggested that the European economy was bottoming out, and the Chinese economy picked up speed.
Trends in the global economy by regionIn the European Union, gross domestic product stagnated in 2013. This was mainly on account of the first quarter’s signifi-cant decline in growth. Growth rates were positive from the second quarter on; the slight recovery was predominantly supported by foreign economic influences. Domestic demand remained weak due to high unemployment rates in Southern Europe and a low propensity to invest. While the Spanish and Portuguese economies showed slight growth again over the course of the year, the recession in Italy continued unabated.
The Eastern European countries only achieved minimal gains. Of the larger EU countries, only the United Kingdom saw unex-pectedly strong growth. Germany was not able to escape this weak European environment: At 0.5%, growth in gross domes-tic product remained very low (2012: +0.9%) and was mainly driven by private consumption.
Gross domestic product Real change compared with previous year
World 2013 2.3%
2012 2.5%
European Union 2013 0.1%
2012 (0.3%)
United States 2013 1.9%
2012 2.8%
Asia (excl. Japan) 2013 5.9%
2012 5.9%
Japan 2013 1.6%
2012 1.4%
South America 2013 2.8%
2012 2.3%
The United States saw moderate but weaker growth compared with 2012. Dampening effects came from the government; public spending declined overall. Budget cuts in the spring and the consequences of the budget and debt dispute in the fall also negatively impacted the economy. Private consumption, how-ever, benefited from the continued recovery of the job market. Investment grew, as well.
The business year at BASFEconomic environment

The business year at BASF
Economic environment
Management’s ReportBASF Report 2013 47
Development of industrial production in 2013
− At 2.5%, somewhat slower growth in global industrial production than in previous year (+2.7%) − Reduced growth in several major customer industries − Especially sharp growth decline in transportation sector (2013: +2.1%, 2012: +6.2%) − Recovery in construction sector and stronger growth in agriculture
BASF sales by industry Direct customers
>15% Chemicals and plastics | Energy and resources
10–15% Consumer goods | Transportation
5–10% Agriculture | Construction
<5% Health and nutrition | Electronics
The economy in Asia (excluding Japan) experienced growth as strong as in 2012. Growth in China accelerated over the course of the year, and at 7.7%, remained at the previous year’s level. The other emerging markets of Asia posted somewhat lower growth rates on average compared with 2012. Aside from weak global growth, one factor here was the considerable depre ciation of these countries’ currencies with respect to the U.S. dollar. Gross domestic product in Japan grew comparably fast, as in the previous year. This was largely owing to government spending programs and the weak yen. Growth in South America was slightly higher than in 2012, yet remained considerably below the average of previous years. Gross domestic product grew somewhat faster, espe cially in Brazil and Argentina, driven partly by the dynamically growing agricultural sector. High inflation rates, infrastructure bottle-necks, low raw material prices and a deteriorating consumption climate all dragged at the growth dynamic. By contrast, Chile, Peru and Colombia posted robust growth.
Trends in key customer industriesGlobal industrial production grew by 2.5% in 2013, somewhat more slowly than in the previous year (+2.7%) and far below our prediction of +3.7%. Growth decelerated slightly in the industri-alized countries (2013: +0.5%; 2012: +0.7%). This was largely the result of lower growth rates in the United States and Japan. In Europe, the decline in industrial production was significantly less than in 2012. Reduced growth in the emerging economies (2013: +4.6%; 2012: +5.0%) was mainly due to weaker develop-ment in China and India. Many of the chemical sector’s customer industries saw slower growth in 2013 than in the previous year. The decline was particularly significant in the transportation industry. After pronounced catch-up effects over the last few years, U.S.
auto mobile production continued its robust growth but was nev-ertheless considerably slower than in 2012. Production fell sharply in Japan after the significant gains of the previous year. Growth in automobile production was also reduced in the emerging markets of Asia. The decline in European automobile production slowed down, yet production continued to shrink. Only the construction and agricultural sectors were able to buck this trend. The United States, Japan and the emerging markets of Asia saw robust development in the construction indus try. The decline in construction activities decelerated slightly in Europe. Agriculture benefited from better weather con-ditions than in the previous year, which was marked by long dry spells.
Growth in key customer industries Real change compared with the previous year
Industries total 2013 2.5%
2012 2.7%
Transportation 2013 2.1%
2012 6.2%
Energy and resources
2013 1.8%
2012 2.7%
Construction 2013 3.4%
2012 2.0%
Consumer goods 2013 2.2%
2012 2.2%
Electronics 2013 3.1%
2012 4.3%
Health and nutrition
2013 3.2%
2012 4.0%
Agriculture 2013 3.3%
2012 1.1%

The business year at BASF
Economic environment
BASF Report 2013Management’s Report48
Trends in the chemical industry in 2013
− Growth in global chemical production (excluding pharmaceuticals) stronger than in previous year (2013: +4.6%; 2012: +2.9%) − Positive growth in Japan after significant decline in previous year − Somewhat higher growth rates in China − Crude oil price of Brent blend just under prior-year level
Price trends for crude oil (Brent blend) and naphtha ($/barrel, $/metric ton)
Trends in the chemical industryIn contrast to industrial production, the chemical industry (excluding pharmaceuticals) grew slightly faster than in the pre-vious year (2013: +4.6%; 2012: +2.9%), marginally above our forecast of +4.3%. Growth rates in chemical production had already increased somewhat over the course of 2012, so that the starting conditions in 2013 were more favorable for higher chemical, as opposed to industrial, production.
Chemical production (excluding pharmaceuticals) Real change compared with previous year
World 2013 4.6%
2012 2.9%
European Union 2013 0.0%
2012 (2.7%)
United States 2013 3.2%
2012 2.1%
Asia (excl. Japan) 2013 8.5%
2012 7.8%
Japan 2013 1.8%
2012 (4.9%)
South America 2013 1.3%
2012 2.6%
The development of the chemical industry varied widely from region to region. After a sharp decline in 2012, chemical pro-duction in Europe stagnated. The United States chemical sector posted stable growth against a backdrop of robust growth in customer industries, especially the automotive and construction industries. Growth rates in China and the other emerging markets were overall slightly above the high levels of 2012. After the prior year’s significant decline, the Japanese chemical industry was able to again achieve moderately posi-tive growth. Growth rates fell in South America, mostly as a result of slower growth in Brazil.
Important raw material pricesAt an annual average of around $109 per barrel in 2013, the crude oil price of Brent blend was just under the previous year’s level ($112 per barrel). The oil price fluctuated over the course of the year between $116 per barrel in February and $103 per barrel in May and June. The springtime’s comparatively high price level was primarily attributable to political conflicts in the Middle East. Average monthly prices for the chemical raw material naphtha ranged over the course of 2013 between $985 per metric ton in February and $820 per metric ton in April. The average annual price of naphtha in 2013 was $902 per metric ton, slightly below the prior-year level ($937 per metric ton). At $3.73 per mmbtu, the average price of gas in the United States was above the very low 2012 level ($2.75 per mmbtu). The price of gas in the European Union remained substantially higher on average, at around $11.80 per mmbtu. In China, government-stipulated wholesale gas prices for industrial consumers were raised by around 15% in the middle of the year to a national average of around $8.40 per mmbtu. In China’s coastal regions, the price of gas was even between $10 and $12 per mmbtu.
Oil spot price (Brent blend) in $/barrelNaphtha spot price in $/metric ton
$/metric ton $/barrel
1,050
1,200
15
30
45
75
60
90
105
120
135
2012 20132011201020092008150
300
450
600
750
900

The business year at BASF
Results of operations
Management’s ReportBASF Report 2013 49
Results of operations
Sales
− Slight increase, mostly through higher sales volumes − Negative currency effects slow down sales growth
+3%
Sales2 (million €)
2013 73,973
2012 (restated) 72,129
2012 78,729
2011 73,497
2010 63,873
2009 50,693
2 The figures for 2009 to 2011 were not restated according to IFRS 10 and 11 (see page 5). The figures for 2012 are shown before and after the restatement.
Sales and earnings (million €)
2013 2012 Change in %
Sales 73,973 72,129 2.6
Income from operations before depreciation and amortization (EBITDA) 10,427 10,009 4.2
EBITDA margin % 14.1 13.9 –
Income from operations (EBIT) before special items 7,190 6,647 8.2
Income from operations (EBIT) 7,273 6,742 7.9
Financial result (560) (765) 26.8
Income before taxes and minority interests 6,713 5,977 12.3
Income before minority interests 5,173 5,067 2.1
Net income 4,842 4,819 0.5
Earnings per share € 5.27 5.25 0.4
Adjusted earnings per share € 5.37 5.64 (4.8)
Sales and earnings by quarter 20131 (million €)
1st quarter 2nd quarter 3rd quarter 4th quarter 2013
Sales 19,738 18,353 17,733 18,149 73,973
Income from operations before depreciation and amortization (EBITDA) 2,854 2,489 2,494 2,590 10,427
Income from operations (EBIT) before special items 2,214 1,832 1,692 1,452 7,190
Income from operations (EBIT) 2,169 1,773 1,682 1,649 7,273
Financial result (126) (162) (167) (105) (560)
Income before taxes and minority interests 2,043 1,611 1,515 1,544 6,713
Net income 1,446 1,157 1,096 1,143 4,842
Earnings per share € 1.57 1.26 1.20 1.24 5.27
Adjusted earnings per share € 1.67 1.40 1.28 1.02 5.37
Sales and earnings by quarter 20121 (million €)
1st quarter 2nd quarter 3rd quarter 4th quarter 2012
Sales 18,840 17,836 17,472 17,981 72,129
Income from operations before depreciation and amortization (EBITDA) 3,304 2,510 2,141 2,054 10,009
Income from operations (EBIT) before special items 2,010 1,937 1,471 1,229 6,647
Income from operations (EBIT) 2,598 1,676 1,403 1,065 6,742
Financial result (158) (145) (175) (287) (765)
Income before taxes and minority interests 2,440 1,531 1,228 778 5,977
Net income 1,703 1,208 925 983 4,819
Earnings per share € 1.85 1.32 1.01 1.07 5.25
Adjusted earnings per share € 1.54 1.59 1.16 1.35 5.64
1 Quarterly results not audited

The business year at BASF
Results of operations
BASF Report 2013Management’s Report50
Income from operations before special items
− Slight increase compared with 2012
− Earnings improve, especially in Agricultural Solutions, Functional Materials & Solutions and Other
+8%
Income from operations before special items2 (million €)
2013 7,190
2012 (restated) 6,647
2012 8,881
2011 8,447
2010 8,138
2009 4,852
2 The figures for 2009 to 2011 were not restated according to IFRS 10 and 11 (see page 5). The figures for 2012 are shown before and after the restatement.
1 Our chemicals business includes the Chemicals, Performance Products and Functional Materials & Solutions segments.
Growth in both the world economy and industrial pro-duction was slower in 2013 than in the previous year. In this challenging environment, our business developed solidly overall. Sales rose by just under 3% to reach €73,973 million. A considerable, volumes-driven sales increase in the Oil & Gas and Agricultural Solutions seg-ments was largely responsible for this development. Sales slightly declined in the chemicals business1 despite higher sales volumes. This was mainly on account of nega tive currency effects. Income from operations before special items rose by around 8% to €7,190 million. In addition to our suc - cessful business with crop protection products and a higher contribution from the Functional Materials & Solutions segment, this increase was also due in large part to the earnings improvement in Other.
Sales and income from operations before special itemsWe increased sales by just under 3% to €73,973 in 2013, primarily through higher sales volumes. The Oil & Gas and Agricultural Solutions segments posted an especially consider-able volumes increase. Sales volumes grew slightly in the chemi-cals business. The acquisitions of Pronova BioPharma ASA and the Becker Underwood Group, as well as of assets from Statoil ASA, also contributed to sales growth. Sales prices were sta-ble overall. Sales were negatively impacted by currency effects. Income from operations before special items surpassed the 2012 level by around 8%, reaching €7,190 million. This was largely owing to the considerable earnings increase in the Agricultural Solutions and Functional Materials & Solutions segments as well as significantly improved earnings in Other. Partly counteracting this development was a lower contribution from the Performance Products segment. Sales in the Chemicals segment were 5% below the level of 2012 as a result of falling prices and negative currency effects. We increased sales volumes in the Intermediates and Monomers divisions. Volumes declined in the Petrochemicals
division, however, due in part to scheduled plant shutdowns. Income from operations before special items rose by 1% over-all. This was attributable to the significantly higher contribution from the Petrochemicals division. In the Performance Products segment, sales were down by 1% in 2013 despite higher volumes. Negative currency effects and lower prices resulting from reduced raw material costs were responsible for this decrease. The acquisition of Pronova Bio-Pharma had a positive impact on sales. We posted a 4% decline in income from operations before special items. This was mainly owing to negative currency effects. We improved sales by 1% in the Functional Materials & Solutions segment, especially through higher sales volumes in the Performance Materials and Catalysts divisions. Sales declined considerably in the Construction Chemicals division, due primarily to currency effects. We raised income from opera-tions before special items by 15%. All divisions contributed to this increase. Sales in the Agricultural Solutions segment exceeded the level of 2012 by 12%. In a positive market environment, we raised sales volumes and prices in all regions and indications. The acquisition of Becker Underwood also boosted sales growth; negative currency effects had an adverse impact. Income from operations before special items rose by 18%, thanks in particu-lar to the increase in volumes and prices.
Factors influencing sales BASF Group
Change in million €
Change in %
Volumes 3,732 5
Prices (467) 0
Currencies (2,006) (3)
Acquisitions and changes in the scope of consolidation 793 1
Divestitures (208) 0
Total change in sales 1,844 3

The business year at BASF
Results of operations
Management’s ReportBASF Report 2013 51
Special items (million €)
2013 2012
Integration costs (86) (2)
Restructuring measures (257) (273)
Divestitures 591 605
Other charges and income (165) (235)
Total special items reported in income from operations (EBIT) 83 95
Special items reported in financial result 119 (88)
Total special items reported in income before taxes 202 7
Mainly as a result of increased volumes, sales in the Oil & Gas segment grew by 16%. In the Exploration & Production busi-ness sector, this growth was particularly attributable to the acti vities acquired from Statoil in Norway, as well as to higher volumes in Russia and from our offshore field in Libya. Volumes also rose in the Natural Gas Trading business sector. Income from operations before special items surpassed the level of 2012 by 5%. A considerably higher contribution from the Explora-tion & Production business sector was able to more than offset the margin-related earnings decline in the Natural Gas Trading business sector. Sales in Other grew by €129 million to €4,190 million in comparison with the previous year. This was due to increased sales for precursors not assigned to a particular segment. Income from operations before special items improved to minus €618 million as a result of lower charges, such as those from the long-term incentive program, compared with minus €790 million in 2012.
For more on business reviews by segment, see page 58 onward
Income from operations before special items for the BASF Group includes income from companies accounted for using the equity method. In 2013, this amounted to €298 million compared with €361 million in the previous year. The decline was mainly attributable to lower contributions from the Oil & Gas segment.
Income from operations and special itemsAt €7,273 million, income from operations before special items for the BASF Group in 2013 was up from the previous year’s level (€6,742 million). Special items in 2013 resulted in an earnings contribution of €83 million (2012: €95 million). Divestitures of €591 million contributed to this total, which primarily included special income from the reclassification of GASCADE Gastransport GmbH, headquartered in Kassel, Germany, due to loss of control, as well as from the disposal of a 15-percent share in the Edvard Grieg development project in
Norway. Divestitures had contributed €605 million to earnings in 2012, especially as a result of disposal gains from the fertil-izer business. Special charges for various restructuring measures fell by €16 million year-on-year to €257 million. By contrast, special charges for the integration of acquired businesses increased to €86 million (2012: €2 million). Moreover, other special charges totaling €165 million arose in 2013. These primarily concerned impairments related to a plant in the Chemicals segment as well as to a gas field devel-opment project in the Oil & Gas segment. Other special charges of €235 million in 2012 were mostly attributable to impairment charges on a Norwegian oilfield development project. Income from operations after cost of capital grew by €708 million to €1,872 million. This means we once again earned a high premium on our cost of capital.
Financial result and net incomeThe financial result improved to minus €560 million, compared with minus €765 million in the previous year. The interest result improved by €19 million to minus €528 million on account of lower interest expenses for financial indebtedness. The bonds redeemed in 2012 and 2013 could be refinanced at more favorable conditions. Income from shareholdings fell by €28 million to €4 million compared with the previous year. Other financial expenses and income balanced out to minus €36 million compared with minus €250 million in 2012. This was mostly due to positive effects from the market valua-tion of options for the disposal of our share in the Styrolution joint venture. As a result, special income of €119 million arose in 2013, compared with the special charge of €88 million in 2012. Income before taxes and minority interests therefore included special items of €202 million, compared with €7 million in 2012. Income before taxes and minority interests increased year-on-year by €736 million to €6,713 million. Return on assets amounted to 11.6%, compared with 11.0% in the previous year.

The business year at BASF
Results of operations
BASF Report 2013Management’s Report52
Income from operations (EBIT)
− EBIT before special items, EBIT and EBIT after cost of capital rise − Premium once again earned on cost of capital − Special income mainly from reclassification of GASCADE Gastransport GmbH and disposal of share in Edvard Grieg development project
Financial result and net income
− Financial result improves considerably compared with previous year − Net income increases slightly
Income taxes grew by €630 million to €1,540 million. The tax rate increased significantly from 15.2% to 22.9%. The previous year had included tax credits from impairment charges on a Norwegian oilfield development project as well as the reversal of tax provisions. Neither the special income from the disposal of a 15-percent share in the Edvard Grieg development project in Norway nor the earnings from the loss of control of the GASCADE Gastransport GmbH resulted in tax burdens in 2013. Income before minority interests rose by €106 million to €5,173 million. Minority interests increased from €248 million to €331 million. After a negative earnings contribution in the previous year due to the temporary maintenance shutdown of the steam cracker, there were minority interests in profits at BASF Total Petrochemicals LLC in Port Arthur, Texas, in 2013. However, minority interests in profits were lower primarily at WINGAS GmbH because of falling margins in the natural gas trading business and at BASF Petronas Chemicals Sdn. Bhd., Malaysia, due to margin pressure and unscheduled production outages resulting from delivery problems with its main supplier. Net income amounted to €4,842 million, slightly above the previous year’s level of €4,819 million. Earnings per share rose from €5.25 to €5.27.
For information on the tax rate, see the Notes to the Consolidated Financial Statements from page 178 onward
For information on accounting methods, see the Notes to the Consolidated Financial Statements from page 149 onward
Cash flowAt €7,870 million, we increased cash provided by operating activities by €1,268 million compared with the previous year. This was largely due to a reduction in the amount of net capital tied down in net working capital. At €4,660 million, payments for property, plant and equip-ment and intangible assets were higher than both the level of depreciation and the level of 2012. At €3,210 million, free cash flow also exceeded the prior-year level (2012: €2,587 million).
Adjusted earnings per shareBy adjusting for special items and the amortization of intangible assets, adjusted earnings per share is a key ratio that offers long-term comparability and is more suitable for predicting the company’s future profitability. In 2013, adjusted earnings per share amounted to €5.37 compared with €5.64 in the previous year.
Adjusted earnings per share (million €)
2013 2012
Income before taxes and minority interests 6,713 5,977
Special items (202) (7)
Amortization of intangible assets 635 673
Amortization of intangible assets contained in special items (4) (75)
Adjusted income before taxes and minority interests 7,142 6,568
Adjusted income taxes (1,878) (1,130)
Adjusted income before minority interests 5,264 5,438
Adjusted minority interests (335) (256)
Adjusted net income 4,929 5,182
Weighted average number of outstanding shares (in thousands) 918,479 918,479
Adjusted earnings per share (€) 5.37 5.64
Adjusted income before taxes and minority interests, adjusted net income, and adjusted earnings per share are key ratios that are not defined under International Financial Reporting Standards (IFRS). They should therefore be viewed as supple-mentary information.
For more information on the earnings per share according to IFRS, see the Notes to the Consolidated Financial Statements on page 174

The business year at BASF
Results of operations
Management’s ReportBASF Report 2013 53
Actual development compared with outlook for 2013Overall, we achieved the increase we forecasted in BASF Group sales and income from operations for 2013. Performance in the individual segments varied, however. We raised sales and income from operations in the Functional Materials & Solutions, Agricultural Solutions and Oil & Gas segments, as targeted. In Other, we were able to increase sales, thus exceeding our fore-cast. This was particularly due to higher-than-expected sales
for precursors not assigned to a particular segment. Contrary to our expectations, sales in the Chemicals segment were down compared with 2012 levels. In the Petro-chemicals division, sales prices fell as a result of lower raw mate-rial costs. We increased our sales volumes as expected in the Monomers and Intermediates divisions; however, this gain in volumes was offset by negative currency effects, as well as by declining prices. Overall, we did not achieve the targeted improve ment in income from operations, mostly on account of special charges from the impairment of a plant in 2013.
Earnings per share and cash flow
− Earnings per share rise by €0.02 to €5.27 compared with 2012
− Adjusted earnings per share decrease by €0.27 to €5.37
− Cash provided by operating activities and free cash flow considerably higher than in previous year
1 Excluding additions to property, plant and equipment resulting from acquisitions, capitalized exploration, restoration obligations and IT investments
In the Performance Products segment, we anticipated sales growth in all divisions. This was achieved in the Nutrition & Health division. In the other divisions, sales were particularly dampened by negative currency effects that were stronger than expected. We reached the targeted increase in income from operations in the Care Chemicals and Paper Chemicals divisions. Earnings declined in the Dispersions & Pigments, Nutrition & Health and Performance Chemicals divisions, especially owing to the nega-tive currency effects. We invested a total of €4.4 billion in property, plant and equipment in 20131, putting us at the upper end of the planned range of up to €4.5 billion.
For information on our expectations for 2014, see page 118 onward
Forecast/actual comparison
Sales Income from operations (EBIT)
2013 forecast 2013 actual 2013 forecast 2013 actual
Chemicals Increase (5%) Increase (4%)
Performance Products Increase (1%) Increase (14%)
Functional Materials & Solutions Increase +1% Increase +27%
Agricultural Solutions Increase +12% Increase +18%
Oil & Gas Increase +16% Increase +50%
Other Decrease +3% Decrease (209%)2
BASF Group Increase +3% Increase +8%
2 For more on income before operations of Other, see the Notes to the Consolidated Financial Statements on page 172.

The business year at BASF
Net assets
BASF Report 2013Management’s Report54
Assets
− Total assets exceed previous year’s level by €1,656 million − Noncurrent assets rise year-on-year, mainly as a result of investments and acquisitions − Decline in current assets of €209 million
Net assets
Total assets amounted to €64,382 million, exceeding the level of 2012 by €1,656 million. Noncurrent assets grew by €1,865 million to €37,124 mil-lion. At €12,235 million, intangible assets including goodwill matched the previous year’s level. The acquisitions-driven increase in intan gible assets of €1,158 million was counter- balanced mainly by currency effects and amortization. The value of tangible fixed assets increased by €1,644 mil-lion to €18,254 million, primarily as a result of investments and acquisitions. At €6,220 million, additions to property, plant and equipment considerably exceeded depreciation. Partly coun-teracting this were the reclassification of GASCADE Gastrans-port GmbH (headquartered in Kassel, Germany) and transfers from property, plant and equipment resulting from the transfer of a fully consolidated company’s assets to an equity-accounted Group company in the Oil & Gas segment.
The €481 million decline in deferred tax assets was mostly due to the use of tax loss carryforwards as well as to actuarial gains on defined benefit plans. At €27,258 million, current assets were €209 million below the previous year’s level. Along with lower trade accounts receivable, the decline in disposal group assets for the natural gas trading business contributed to this development. While inven tory levels were comparable with those of 2012, other receivables and miscellaneous assets increased. At €1,815 million, cash and cash equivalents were €168 mil-lion above the level of December 31, 2012.
For more on the composition and development of individual asset items in the balance sheet, see the Notes to the Consolidated Financial Statements from page 181 onward
Assets
December 31, 2013 December 31, 2012
Million € % Million € %
Intangible assets 12,235 19.0 12,193 19.4
Property, plant and equipment 18,254 28.4 16,610 26.5
Investments accounted for using the equity method 4,137 6.4 3,459 5.5
Other financial assets 630 1.0 613 1.0
Deferred taxes 992 1.5 1,473 2.3
Other receivables and miscellaneous noncurrent assets 876 1.4 911 1.5
Noncurrent assets 37,124 57.7 35,259 56.2
Inventories 9,592 14.9 9,581 15.3
Accounts receivable, trade 9,376 14.6 9,506 15.2
Other receivables and miscellaneous current assets 3,630 5.6 3,455 5.5
Marketable securities 17 . 14 .
Cash and cash equivalents 1,815 2.8 1,647 2.6
Assets of disposal groups 2,828 4.4 3,264 5.2
Current assets 27,258 42.3 27,467 43.8
Total assets 64,382 100.0 62,726 100.0

The business year at BASF
Financial position
Management’s ReportBASF Report 2013 55
Equity and liabilities
− Equity ratio rises to 43.2%
− Increase in long-term and decline in short-term financial indebtedness − Net debt above prior-year level
Net debt (million €)
Dec. 31, 2013 Dec. 31, 2012
Cash and cash equivalents 1,815 1,647
Financial indebtedness 14,407 12,798
Net debt 12,592 11,151
Financial position
Equity grew by €2,168 million compared with the previous year. Net income amounted to €4,842 million, which exceeded divi-dend payments by €2,454 million. Additionally, the revaluation of defined benefit plans resulted in an increase in equity of €1,127 million. The equity ratio rose to 43.2% (2012: 40.8%). Compared with the end of 2012, noncurrent liabilities grew by €1,395 million to €21,790 million. Long-term financial indebt-edness increased by €2,447 million to €11,151 million. Over the course of 2013, we issued bonds with a nominal value of €2.65 billion and NOK 1.45 billion with maturities between 3 and 30 years as part of our €15 billion Debt Issuance Program. We
also issued a U.S. private placement of $1.25 billion consisting of three tranches with maturities between 12 and 21 years. Furthermore, loans and promissory notes in the amounts of €1.87 billion, £0.3 billion, and $0.15 billion were paid back in 2013. A bond due in 2014 with a total volume of €1.25 billion was reclassified to short-term financial indebtedness. Deferred tax liabilities rose by €615 million and other liabilities by €46 mil-lion. However, provisions for pensions and similar obligations declined by €1,712 million because of higher discount rates. Other provisions matched the level of the previous year.
Equity and liabilities
December 31, 2013 December 31, 2012
Million € % Million € %
Subscribed capital 4,341 6.7 4,364 6.9
Retained earnings 26,170 40.7 23,708 37.8
Other comprehensive income (3,400) (5.3) (3,461) (5.5)
Minority interests 678 1.1 1,010 1.6
Equity 27,789 43.2 25,621 40.8
Provisions for pensions and similar obligations 3,709 5.8 5,421 8.6
Other provisions 2,924 4.5 2,925 4.7
Deferred taxes 2,849 4.4 2,234 3.5
Financial indebtedness 11,151 17.3 8,704 13.9
Other liabilities 1,157 1.8 1,111 1.8
Noncurrent liabilities 21,790 33.8 20,395 32.5
Accounts payable, trade 4,505 7.0 4,502 7.2
Provisions 2,616 4.1 2,628 4.2
Tax liabilities 954 1.5 870 1.4
Financial indebtedness 3,256 5.0 4,094 6.5
Other liabilities 2,182 3.4 2,623 4.2
Liabilities of disposal groups 1,290 2.0 1,993 3.2
Current liabilities 14,803 23.0 16,710 26.7
Total equity and liabilities 64,382 100.0 62,726 100.0

The business year at BASF
Financial position
BASF Report 2013Management’s Report56
Maturities of financial indebtedness (million €)
2019 and beyond 4,393
2018 1,746
2017 779
2016 1,051
2015 3,182
2014 3,256
Financing instruments (million €)
1 Bank loans 1,812
2 Eurobonds 9,196
3 USD commercial paper 1,232
4 Other 2,167
1
2
4
3
€14,407million
Current liabilities declined by €1,907 million to €14,803 million. This was the result of the €838 million decline in financial liabili-ties to €3,256 million as well as the €703 million decrease in the liabilities of the natural gas trading disposal group. Other liabili-ties also fell by €441 million. While tax liabilities rose by €84 mil-lion in 2013, trade accounts payable and short-term provisions both matched the prior-year level. Long-term financial indebtedness increased overall by €1,609 million to €14,407 million. Net debt rose to €12,592 million.
For more on the composition and development of individual liability items in the balance sheet, see the Notes to the Consolidated Financial Statements from page 188 onward
For more on the development of the balance sheet, see the Ten-Year Summary from page 226 onward
For more on the disposal group for the natural gas trading business, see the Notes to the Consolidated Financial Statements on page 169
Financing policy and credit ratingsOur financing policy is aimed at ensuring our solvency at all times, limiting the risks associated with financing and opti-mizing our cost of capital. We preferably meet our external financing needs on international capital markets. We strive to maintain at least a solid A rating, which allows us unrestricted access to money and capital markets. Our financing measures are aligned with our operative business planning as well as the company’s strategic direction and also ensure the financial flexibility to take advantage of strategic options. With “A+/A-1/outlook stable” from rating agency Standard & Poor’s and “A1/P-1/outlook stable” from Moody’s, we have good credit ratings, especially compared with competitors in the chemical industry. Standard & Poor’s last confirmed our long-term rating on November 22, 2013; Moody’s last confirmed our long-term rating on October 14, 2013, and pronounced the outlook stable. Both agencies maintained BASF’s short-term ratings.
Corporate bonds form the basis of our medium to long-term debt financing. These are issued in euros and other currencies with different maturities. Our goal is to ensure a balanced maturity profile and diverse range of investors, and to opti mize our debt capital financing conditions. For short-term financing, we use BASF SE’s commercial paper program, which has an issuing volume of up to $12.5 bil-lion. On December 31, 2013, $1.70 billion worth of commercial paper was outstanding under this program. Firmly committed, syndicated credit facilities of €6 billion serve to cover the repay-ment of outstanding commercial paper, and can also be used for general company purposes. These credit lines were not used in the course of 2013. Our external financing is therefore largely independent of short-term fluctuations in the credit markets. Off-balance-sheet financing tools, such as leasing, are of minor importance to us. BASF Group’s most important finan-cial contracts contain no side agreements with regard to specific financial ratios (financial covenants) or compliance with a specific rating (rating trigger).
For more on the financing tools used, see the Notes to the Consolidated Financial Statements from page 201 onward
Financial management in the BASF Group is centralized and supported by regional finance units. To minimize risks and exploit internal optimization potential within the Group, we bundle the financing, financial investments and foreign currency hedging of BASF SE’s subsidiaries. When possible, this occurs within the BASF Group. Foreign currency risks are primarily hedged centrally by means of derivative financial instruments in the market.

The business year at BASF
Financial position
Management’s ReportBASF Report 2013 57
Cash flow1 (billion €)
Cash provided by operating activities Payments related to property, plant and equipment and intangible assets Free cash flow2
Financing and cash flows
− Financing principles remain unchanged − “A” ratings confirmed − Cash provided by operating activities above 2012 level − Payments for investments and acquisitions increase
1 The figures for the 2009 to 2011 business years were not restated according to the new accounting and reporting standards IFRS 10 and 11 (see page 5).2 Cash provided by operating activities less payments related to property, plant and equipment and intangible assets
201320122011201020090
1
2
3
4
5
6
7
8
Statement of cash flowsAt €7,870 million, we increased cash provided by operating activities by €1,268 million in 2013 compared with the previous year. This was largely due to a reduction in the amount of capi-tal tied down in net working capital. Cash used in investing activities amounted to minus €5,769 million compared with minus €3,977 million in 2012. At €4,660 million, payments for property, plant and equipment and intangible assets were higher than both the level of depre-ciation and the prior year. Acquisitions led to a cash outflow of €1,156 million in 2013 (2012: €1,043 million). We received €63 mil-lion in cash inflow from divestitures in 2013. This amount totaled €724 million in 2012, predominantly from thedisposal of our ferti-lizer activities. Cash outflow from financial investments and other
items in 2013 was mainly attributable to the increase in financ-ing-related receivables.
For more on investments and acquisitions, see page 36 onward
Cash used in financing activities amounted to minus €1,874 million. In comparison with 2012, cash outflow was lower by €1,030 million, which was largely due to lower repay-ment of bonds and promissory notes; by contrast, the volume of newly issued bonds rose. We paid €2,388 million in dividends to shareholders of BASF SE and €314 million to minority share-holders in Group companies. In total, cash and cash equivalents rose by €168 million compared with the previous year, amounting to €1,815 million as of December 31, 2013.
Statement of cash flows (million €)
2013 2012
Net income 4,842 4,819
Depreciation and amortization of intangible assets, property, plant and equipment and financial assets 3,196 3,288
Changes in working capital 805 (844)
Miscellaneous items (973) (661)
Cash provided by operating activities 7,870 6,602
Payments related to property, plant and equipment and intangible assets (4,660) (4,015)
Acquisitions/divestitures (1,093) (319)
Financial investments and other items (16) 357
Cash used in investing activities (5,769) (3,977)
Capital increases/repayments, share repurchases – (1)
Changes in financial liabilities 828 (343)
Dividends (2,702) (2,560)
Cash used in financing activities (1,874) (2,904)
Net changes in cash and cash equivalents 227 (279)
Cash and cash equivalents as of beginning of year and other changes 1,588 1,926
Cash and cash equivalents as of end of year 1,815 1,647

The business year at BASF
Business review by segment
BASF Report 2013Management’s Report58
Business review by segment
Contributions to total sales by segment
Chemicals 23%
Performance Products 21%
Functional Materials & Solutions 23%
Agricultural Solutions 7%
Oil & Gas 20%
Other 6%
Contributions to EBITDA by segment
Chemicals 28%
Performance Products 19%
Functional Materials & Solutions 15%
Agricultural Solutions 13%
Oil & Gas 30%
Other (5%)
Segment overview (million €)
Sales
Income from operations beforedepreciation and amortization
(EBITDA)Income from operations (EBIT)
before special items
2013 2012 2013 2012 2013 2012
Chemicals 16,994 17,887 2,956 3,021 2,182 2,171
Performance Products 15,534 15,713 1,987 2,090 1,365 1,421
Functional Materials & Solutions 17,252 17,049 1,498 1,363 1,070 932
Agricultural Solutions 5,227 4,679 1,375 1,182 1,222 1,037
Oil & Gas 14,776 12,740 3,144 2,445 1,969 1,876
Other1 4,190 4,061 (533) (92) (618) (790)
73,973 72,129 10,427 10,009 7,190 6,647
Segment overview (million €)
Income from operations (EBIT) Assets Investments2
2013 2012 2013 2012 2013 2012
Chemicals 2,086 2,173 10,908 10,559 1,958 1,324
Performance Products 1,100 1,276 13,614 13,457 1,497 764
Functional Materials & Solutions 1,027 806 11,899 12,146 611 760
Agricultural Solutions 1,208 1,026 6,777 6,527 324 1,054
Oil & Gas 2,516 1,676 11,916 11,252 2,954 1,172
Other1 (664) (215) 9,268 8,785 169 189
7,273 6,742 64,382 62,726 7,513 5,263
1 Information on the composition of Other can be found in the Notes to the Consolidated Financial Statements from page 171 onward. 2 Additions to property, plant and equipment (thereof from acquisitions: €1,511 million in 2013 and €106 million in 2012) and intangible assets
(thereof from acquisitions €1,158 million in 2013 and €1,073 million in 2012)

The business year at BASF
Business review by segment
Management’s ReportBASF Report 2013 59
EBIT before special items by segment (million €)
Chemicals 2,182
Performance Products 1,365
Functional Materials & Solutions 1,070
Agricultural Solutions 1,222
Oil & Gas 1,969
Other (618)
EBIT before special items BASF Group by quarter1 (million €)
1st quarter 20131st quarter 2012
2,2142,010
2nd quarter 20132nd quarter 2012
1,8321,937
3rd quarter 20133rd quarter 2012
1,6921,471
4th quarter 20134th quarter 2012
1,4521,229
1 Quarterly results not audited
Sales1 (million €)
1st quarter 2nd quarter 3rd quarter 4th quarter
2013 2012 2013 2012 2013 2012 2013 2012
Chemicals 4,396 4,513 4,183 4,343 4,224 4,601 4,191 4,430
Performance Products 3,880 3,963 4,032 4,079 3,939 3,975 3,683 3,696
Functional Materials & Solutions 4,181 4,168 4,503 4,412 4,439 4,304 4,129 4,165
Agricultural Solutions 1,556 1,327 1,727 1,467 1,054 1,008 890 877
Oil & Gas 4,660 3,893 2,836 2,567 3,130 2,497 4,150 3,783
Other2 1,065 976 1,072 968 947 1,087 1,106 1,030
19,738 18,840 18,353 17,836 17,733 17,472 18,149 17,981
Income from operations (EBIT) before special items1 (million €)
1st quarter 2nd quarter 3rd quarter 4th quarter
2013 2012 2013 2012 2013 2012 2013 2012
Chemicals 650 556 495 601 527 569 510 445
Performance Products 379 452 394 442 376 344 216 183
Functional Materials & Solutions 239 257 293 216 300 231 238 228
Agricultural Solutions 498 419 485 414 172 171 67 33
Oil & Gas 630 640 382 330 422 499 535 407
Other2 (182) (314) (217) (66) (105) (343) (114) (67)
2,214 2,010 1,832 1,937 1,692 1,471 1,452 1,229
Income from operations (EBIT)1 (million €)
1st quarter 2nd quarter 3rd quarter 4th quarter
2013 2012 2013 2012 2013 2012 2013 2012
Chemicals 650 556 494 601 442 570 500 446
Performance Products 367 429 344 379 322 321 67 147
Functional Materials & Solutions 240 290 283 215 292 231 212 70
Agricultural Solutions 492 419 485 414 168 169 63 24
Oil & Gas 630 640 381 250 587 499 918 287
Other2 (210) 264 (214) (183) (129) (387) (111) 91
2,169 2,598 1,773 1,676 1,682 1,403 1,649 1,065
1 Quarterly results not audited2 Information on the composition of Other can be found in the Notes to the Consolidated Financial Statements from page 171 onward.

The business year at BASF
Chemicals
BASF Report 2013Management’s Report60
Chemicals
Strategy
− Production of a broad range of basic chemicals and intermediates in integrated production facilities: the Verbund − Supplying the value chains in the BASF Verbund and marketing our products to external customers − Technology and cost leadership represent most important competitive advantages − Success factors: economies of scale, Verbund advantages, continuous optimization of access to raw materials, lean processes, reliable and cost-effective logistics − Constant optimization of production structures
The Chemicals segment consists of the Petrochemicals, Monomers and Intermediates divisions. In our integrated production facilities – our Verbund – we produce a broad range of basic chemicals and intermediates in Europe, Asia and North America for our internal and external customers.
With our production facilities, we form the core of the Verbund structure and supply the BASF segments with basic chemicals for the production of downstream products. We add value with innovations in processes and production, and invest in future markets to ensure the growth of the entire BASF Verbund. As a reliable supplier, we market our products to customers in downstream industries, primarily in the chemical, electronics, construction, textile, lumber, automotive, pharmaceutical and crop protection industries. We continually improve our value chains and are expanding our market position – particularly outside Europe – with new methods and technologies, as well as through capital expenditures and collaborations in future markets. We invest in research and development in order to develop new technologies and to make our existing technologies even more efficient. Cost leadership and a clear orientation along individual value chains are among our most important compet-itive advantages. We concentrate on the critical success factors of the classical chemicals business: making use of economies of scale, the advantages of our Verbund, continuous optimiza-tion of access to raw materials, lean processes, and reliable, cost-effective logistics. Furthermore, we are constantly improv-ing our global production structures and aligning these even more closely with regional market requirements.
Catamold®
Cost-effective solution for small and complex metal parts in the automotive and electronics industries
Value for BASF
9%Expected annual market growth from 2013 to 2020
Value for our customersUp to
40%Reduction in production costs
Value for BASF Metal injection molding is becoming steadily more important for manufacturers of small and complex metal parts for automotive and electronic appli-cations. With Catamold®, an innovative injection molding material, we have figured out how to significantly improve the cost effectiveness of this procedure. This makes it economically attractive to switch from machining and precision casting to metal injection molding. By 2020, we expect the worldwide market for our Catamold® products to grow by around 9% each year.
Value for our customers Thanks to Catamold®, the costs associated with producing these metal parts decrease by up to 40% compared with conventional methods – while maintaining comparable stability and dimensional accuracy. Furthermore, Catamold® makes new designs possible and reduces the weight of metal parts. This benefits not only our own customers, but the end users, as well.

The business year at BASF
Chemicals
Management’s ReportBASF Report 2013 61
Products
− Petrochemicals: broad range of basic products as well as specialties for the chemical and plastics industries, for example − Monomers: inorganic basic products and specialties as well as isocyanate and polyamide for various branches, such as the plastics, construction and electronics industries − Intermediates: most comprehensive intermediates portfolio in the world, including precursors for coatings, plastics, textile fibers and crop protection products
Products, customers and applications
Division Products Customer industries and applications
Petrochemicals Basic products: ethylene, propylene, butadiene, benzene, alcohols, solvents, plasticizers, alkylene oxides, glycols and acrylic monomers
Specialties: Special plasticizers such as Hexamoll® DINCH®, special acrylates
Use within BASF Verbund Chemical and plastics industries; detergent, automotive, packaging and textile industries; production of paints, coatings and cosmetics as well as oilfield, construction and paper chemicals
Monomers Basic products: isocyanates (MDI, TDI), ammonia, caprolactam, adipic acid, chlorine, urea, glues and impregnating resins, caustic soda, polyamides 6 and 6,6, standard alcoholates, sulfuric and nitric acid
Specialties: Electronic chemicals, metal systems
Use within BASF Verbund
Sectors such as plastics, electronics, lumber, furniture, packaging, textile, construction, automotive and other industries
Intermediates Basic products: butanediol and derivatives, alkylamines and alkanolamines, neopentylglycol, formic and propionic acid
Specialties: specialty amines such as tert-Butylamine, gas treatment chemicals, vinyl monomers, acid chlorides, chloroformates, chiral intermediates
Use within BASF Verbund
Plastics, coatings and pharmaceutical industries, production of detergents and cleaners as well as crop protection products and textile fibers
Capital expenditures
Location Project
Additional annual capacity through expansion
(metric tons)Total annual capacity
(metric tons) Startup
Antwerp, Belgium Construction: butadiene extraction 155,000 2014
Camaçari, Brazil Construction: acrylic acid complex 160,000 2014
Chongqing, China Construction: MDI plant 400,000 2014
Geismar, Louisiana Construction: formic acid plant 50,000 2014
Ludwigshafen, Germany Construction: TDI plant 300,000 2015
Replacement: nitric acid plants n/a 2015
Expansion: Hexamoll® DINCH® plant 100,000 200,000 2014
Maoming, China Construction: isononanol plant1 n/a 2015
Nanjing, China Construction: additional acrylic acid complex 160,000 320,000 2014
Construction: tert-Butylamine plant 10,000 2013
Shanghai, China Construction: Ultramid® plant 100,000 2015
1 Operated through joint venture with Sinopec

The business year at BASF
Chemicals
BASF Report 2013Management’s Report62
Sales – Chemicals (million €)
2013 16,994
2012 17,887
Sales by division
1 Petrochemicals 46%
2 Monomers 37%
3 Intermediates 17%
1
2
3
€16,994million
Production capacities of significant products1
Product
Sites
Annual capacity (metric tons) Europe North America Asia Pacific
South America, Africa, Middle East
Acrylic acid X X X 1,190,000
Alkylamines X X X 250,000
Formic acid X X 255,000
Ammonia X 1,525,000
Benzene X X X 820,000
Butadiene X X X 645,000
Butanediol equivalents X X X 535,000
Chlorine X 385,000
Ethanolamine and derivatives X X 400,000
Ethylene X X X 3,375,000
Ethylene oxide X X X 1,395,000
Urea X 545,000
Isocyanates X X X 1,900,000
Caustic soda X 360,000
Neopentylglycol X X X 165,000
Oxo-C4 alcohols (measured as butyraldehyde) X X X 1,495,000
Polyamides 6 and 6,6 X X 720,000
Polyamide precursors X X 1,070,000
PolyTHF® X X X 250,000
Propionic acid X X 150,000
Propylene X X X 2,550,000
Propylene oxide X X 925,000
Sulfuric acid X 920,000
Plasticizers X X X 660,000
1 All capacities are included at 100%, including plants belonging to joint operations and joint ventures.

The business year at BASF
Chemicals
Management’s ReportBASF Report 2013 63
Factors influencing sales – Chemicals
Volumes 0%
Prices (3%)
Portfolio 0%
Currencies (2%)
Sales (5%)
Income from operations before special items – Chemicals (million €)
2013 2,182
2012 2,171
ChemicalsIn the Chemicals segment, sales to third parties declined by €893 million to €16,994 million on account of lower prices and negative currency effects (volumes 0%, prices –3%, currencies –2%). Income from operations before special items rose by €11 million to €2,182 million. This was largely attributable to a considerable earnings increase in the Petrochemicals division, which more than compensated for the margin-related decline in the Monomers division. Income from operations in the segment fell by €87 million to €2,086 million. Special charges arose from the impairment of a plant. We strive to slightly increase sales in 2014. In the Petro-chemicals and Monomers divisions, we anticipate slight sales growth. Sales in the Intermediates division are likely to rise con-siderably. We expect higher sales volumes in the Monomers divi sion, particularly for isocyanates, while the startup of new plants will contribute to sales growth in the Petrochemicals divi-sion. We forecast higher demand in the Intermediates division
from the following key industries: automotive, crop protection and textile fibers. Overall, income from operations before spe-cial items is expected to be slightly below the 2013 level due to startup costs for several plants that will begin operations.
PetrochemicalsIn the Petrochemicals division, sales to third parties decreased by €475 million to €7,785 million in 2013. Aside from negative currency effects, this decline was due to lower volumes and prices (volumes –2%, prices –2%, currencies –2%). Sales in Europe did not match the previous year’s level, mostly on account of lower volumes. The scheduled shutdown of the steam cracker in Antwerp, Belgium, significantly contrib-uted to this development. Reduced prices were further detri-mental to sales development in the region. In North America, the lower price level in some product lines and the weaker U.S. dollar led to a slight decline in sales. By contrast, sales in Asia remained stable despite a difficult market environment.
Segment data Chemicals (million €)
2013 2012 Change in %
Sales to third parties 16,994 17,887 (5)
Thereof Petrochemicals 7,785 8,260 (6)
Monomers 6,385 6,772 (6)
Intermediates 2,824 2,855 (1)
Intersegmental transfers 6,388 5,947 7
Sales including intersegmental transfers 23,382 23,834 (2)
Income from operations before depreciation and amortization (EBITDA) 2,956 3,021 (2)
EBITDA margin % 17.4 16.9 –
Income from operations (EBIT) before special items 2,182 2,171 1
Income from operations (EBIT) 2,086 2,173 (4)
Income from operations (EBIT) after cost of capital 917 1,040 (12)
Assets 10,908 10,559 3
Research and development expenses 178 184 (3)
Additions to property, plant and equipment and intangible assets 1,958 1,324 48

The business year at BASF
Chemicals
BASF Report 2013Management’s Report64
Petrochemicals
− Sales significantly below previous year’s level − Lower volumes and prices in addition to negative currency effects largely responsible for sales decline − Considerable rise in earnings due to significantly better margins for steam cracker products in North America
Monomers
− Sales decrease significantly despite higher sales volumes − Sales development adversely impacted by negative currency and portfolio effects as well as lower prices − Considerable earnings decline particularly due to weaker margins for caprolactam and polyamides
We observed pressure on margins, mainly in the acrylates and solvents business in Asia. This was particularly attributable to addi tional capacities and the resulting improvement in product availability in the region. Nevertheless, overall income from opera tions before special items considerably exceeded the level of 2012. We were able to more than compensate for lower margins in some product lines, particularly through significantly improved margins for steam cracker products in North America. In Nanjing, China, we began construction on an acrylic acid plant in 2013 with an intended capacity of 160,000 metric tons per year. In Port Arthur, Texas, we continued to increase our feed flexibility in order to take even better advantage of low gas prices in the United States.
Petrochemicals – Sales by region (Location of customer)
1 Europe 53%
2 North America 34%
3 Asia Pacific 11%
4South America, Africa, Middle East 2%
12
34
€7,785million
MonomersAt €6,385 million, sales to third parties in the Monomers division were €387 million below the level of 2012 (volumes 1%, prices –4%, portfolio –1%, currencies –2%). The sales decline in Europe and Asia in the second half of the year was especially consid-erable. In the isocyanates business area, we increased our sales through higher volumes. Sales volumes for MDI exceeded the 2012 levels in all regions, while we were able to raise sales volumes for TDI, primarily in Europe. Sales in the polyamides business area fell as a result of lower prices. The further expan-sion of caprolactam capacity in China and dampened market growth for fiber polymers both led to price declines and lower margins. Our business with polymers for extrusion applications continued to develop positively despite growing competition. Sales for inorganic basic products were down compared with the previous year. This was largely on account of portfolio effects as well as lower prices for ammonia. Income from operations before special items was signifi-cantly below the level of 2012. This is mostly attributable to weaker margins for caprolactam and polyamides. Monomers – Sales by region (Location of customer)
1 Europe 40%
2 North America 21%
3 Asia Pacific 32%
4South America, Africa, Middle East 7%
1
2
3
4
€6,385million
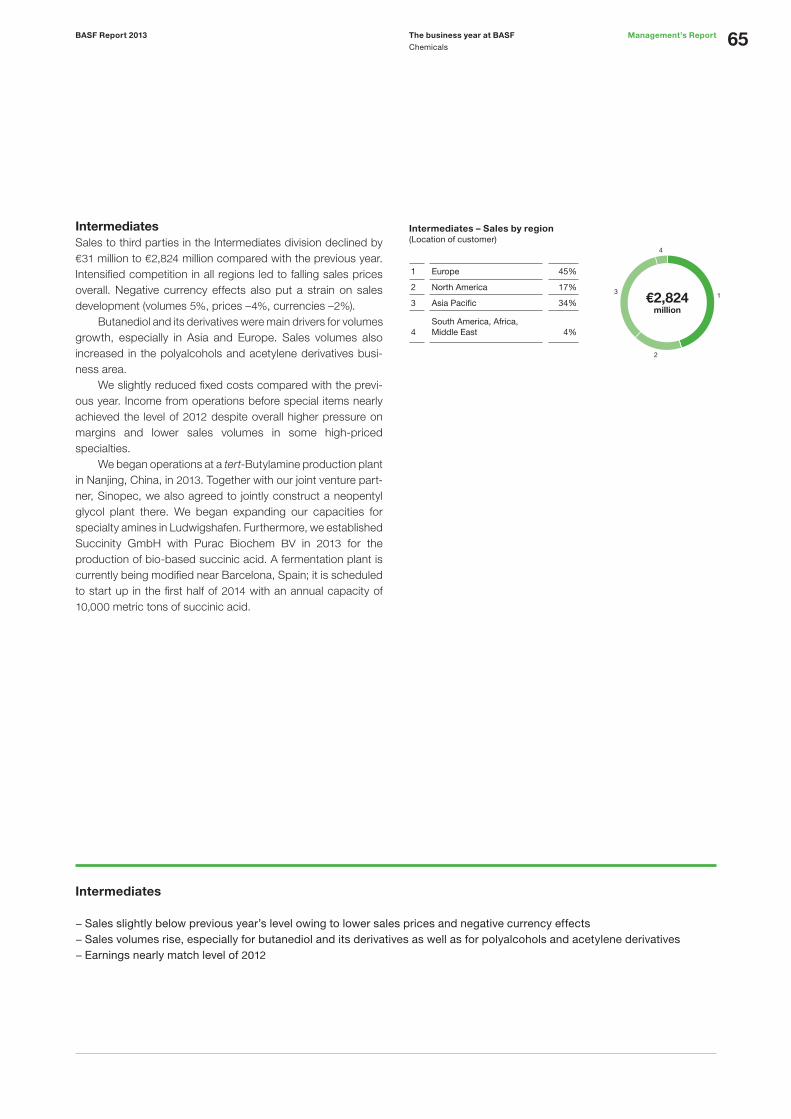
The business year at BASF
Chemicals
Management’s ReportBASF Report 2013 65
Intermediates
− Sales slightly below previous year’s level owing to lower sales prices and negative currency effects − Sales volumes rise, especially for butanediol and its derivatives as well as for polyalcohols and acetylene derivatives − Earnings nearly match level of 2012
IntermediatesSales to third parties in the Intermediates division declined by €31 million to €2,824 million compared with the previous year. Intensified competition in all regions led to falling sales prices overall. Negative currency effects also put a strain on sales devel opment (volumes 5%, prices –4%, currencies –2%). Butanediol and its derivatives were main drivers for volumes growth, especially in Asia and Europe. Sales volumes also increased in the polyalcohols and acetylene derivatives busi-ness area. We slightly reduced fixed costs compared with the previ-ous year. Income from operations before special items nearly achieved the level of 2012 despite overall higher pressure on margins and lower sales volumes in some high-priced specialties. We began operations at a tert-Butylamine production plant in Nanjing, China, in 2013. Together with our joint venture part-ner, Sinopec, we also agreed to jointly construct a neopentyl glycol plant there. We began expanding our capacities for specialty amines in Ludwigshafen. Furthermore, we established Succinity GmbH with Purac Biochem BV in 2013 for the production of bio-based succinic acid. A fermentation plant is currently being modified near Barcelona, Spain; it is scheduled to start up in the first half of 2014 with an annual capacity of 10,000 metric tons of succinic acid.
Intermediates – Sales by region (Location of customer)
1 Europe 45%
2 North America 17%
3 Asia Pacific 34%
4South America, Africa, Middle East 4%
1
2
3
4
€2,824million

The business year at BASF
Performance Products
BASF Report 2013Management’s Report66
Performance Products
Strategy
− Customized products enable our customers to make their production processes more efficient and improve their products’ application properties − Global presence ensures reliable supply to customers in all regions − Specialties: innovation, close relationships with leading customer companies, application and development expertise − Standard products: efficient production structures, backward integration in Production Verbund’s value chains, technology and cost leadership
The Performance Products segment consists of the Dis-persions & Pigments, Care Chemicals, Nutrition & Health, Paper Chemicals and Performance Chemicals divisions. Our solutions enhance the performance of industrial and consumer products worldwide. With our customized products, our customers can make their production pro-cesses more efficient or give their products improved application properties.
We take on the challenges arising from important future issues, especially population growth: scarce resources, strains on the environment and climate, greater demand for food and the desire for better quality of life. In doing so, we focus on research and development and maintain close relationships with leading companies in our key customer industries. We position our-selves globally in order to reliably supply customers in all regions. We invest in the development of innovations through which our products and processes, as well as our customers’ applications and processes, contribute to sustainability by enabling, for example, the more efficient use of resources. Industry-specific specialties make up a major part of our product range. These products create additional value for our customers, which allows them to stand out from the competi-tion. We develop new solutions together with our customers and strive for long-term partnerships which create profitable growth opportunities for both sides. We pursue a different business model for standard prod-ucts, such as vitamins or dispersions for paper coatings. Here, efficient production structures, backward integration in our Produc tion Verbund’s value chains, capacity management, and technology and cost leadership are all essential. We support our customers by serving as a reliable supplier with consis tent product quality, a good price/performance ratio and lean processes.
Methanesulfonic acidThe readily biodegradable alternative to conventional acids
Value for BASF
55%Yearly increase in sales volumes since 2003
Value for the environment
100%Biodegradable
Value for BASF Marketed under the brand names Lutropur® MSA and Lutropur® M, BASF produces methane sulfonic acid using a proprietary and patented process. The innovative technology and high product quality allow for numerous new applications. Since its intro duction, we have raised sales volumes of methane-sulfonic acid by an average of 55% per year.
Value for the environment Methanesulfonic acid is not only colorless and odorless, it is also 100% bio degradable. According to OECD criteria, it is also considered “readily biodegradable,” since significantly more than 70% of the substance degrades within ten days. Methane sulfonic acid occurs in nature as a part of the natu ral sulfur cycle. Its unique set of properties makes it possible to modify established industrial proces-ses or to replace less environmentally friendly acids.

The business year at BASF
Performance Products
Management’s ReportBASF Report 2013 67
Products
− Dispersions & Pigments: raw materials for the formulation of coatings, printing and packaging inks, varnishes, adhesives and construction materials − Care Chemicals: ingredients for hygiene, personal care, home care and industrial & institutional cleaning businesses as well as for applications in the chemical industry − Nutrition & Health: products for the food and feed industries, the flavor and fragrance industry and the pharmaceutical industry − Paper Chemicals: products for the paper industry, packaging made of paper − Performance Chemicals: wide range of customized products for industrial applications
Products, customers and applications
Division Products Customer industries and applications
Dispersions & Pigments Polymer dispersions, pigments, resins, high-performance additives, formulation additives
Printing and packaging industry, adhesives industry, products for construction chemicals, raw materials for paints and coatings, specialties for the electronics and other industries
Care Chemicals Ingredients for skin and hair cleansing and care products, such as emollients, cosmetic active ingredients, polymers and UV filters
Ingredients for detergents and cleaners in household, institution or industry, such as surfactants, chelating agents, polymers and products for optical effects
Solvents for crop protection formulations and products for metal surface treatments
Superabsorbents for the hygiene industry
Cosmetics industry, hygiene industry, detergent and cleaner industry, agricultural industry and technical applications
Nutrition & Health Additives for the food and feed industries, such as vitamins, carotenoids, sterols, enzymes, emulsifiers and omega-3 fatty acids
Flavors and fragrances, such as geraniol, citronellol, L-menthol and linalool
Active ingredients and excipients for the pharmaceutical industry, such as caffeine, ibuprofen and pseudoephedrine as well as binders and coatings for tablets, synthesizing pharmaceutical substances and intermediates for our customers
Food and feed industries, flavor and fragrance industry and pharmaceutical industry
Paper Chemicals Dispersions for paper coating, functional chemicals, process chemicals, kaolin minerals
Paper industry, packaging made of paper
Performance Chemicals Antioxidants, light stabilizers, pigments and flame retardants for plastic applications
Fuel and refinery additives, polyisobutene, brake fluids and engine coolants, lubricant additives and basestocks, components for metalworking fluids and compounded lubricants
Process chemicals for the extraction of oil, gas, metals and minerals, chemicals for enhanced oil recovery, water treatment chemicals, membrane technologies
Auxiliaries for the production and treatment of leather and textiles
Plastics processing industry, fuel and lubricant industry, oil and gas industry, mining industry, municipal and industrial water treatment, leather and textile industry

The business year at BASF
Performance Products
BASF Report 2013Management’s Report68
Sales – Performance Products (million €)
2013 15,534
2012 15,713
Sales by division
1 Dispersions & Pigments 23%
2 Care Chemicals 31%
3 Nutrition & Health 14%
4 Paper Chemicals 9%
5 Performance Chemicals 23%
1
23
4
5
€15,534million
Capital expenditures
Location Project
Additional annual capacity through
expansion (metric tons)
Total annual
capacity (metric tons) Startup
Camaçari, Brazil Construction: superabsorbents 60,000 2014/2015
Dahej, India Construction: dispersions n/a 2014
Construction: surfactants n/a 2014
Freeport, Texas Construction: dispersions n/a 2014
Ludwigshafen, Germany Expansion: polyvinylamine n/a n/a 2013
Expansion: vinyl formamide n/a n/a 2014
Nanjing, China Construction: superabsorbents 60,000 2014
Construction: additives n/a 2014
Construction: pigments n/a 2013
Singapore Expansion: antioxidants n/a n/a 2013
Theodore, Alabama Construction: chelating agents n/a 2015
Production capacities of significant products
Product
Sites
Annual capacity (metric tons)Europe North America Asia Pacific
South America, Africa, Middle East
Anionic surfactants X X X X 550,000
Citral X 40,000
Chelating agents X X X 120,000
Methanesulfonic acid X 30,000
Nonionic surfactants X X X 630,000
Organic pigments X X X X n/a
Polyisobutene X X 215,000
Superabsorbents X X X 470,000

The business year at BASF
Performance Products
Management’s ReportBASF Report 2013 69
Factors influencing sales – Performance Products
Volumes 3%
Prices (2%)
Portfolio 1%
Currencies (3%)
Sales (1%)
Income from operations before special items – Performance Products (million €)
2013 1,365
2012 1,421
Performance Products We were able to increase sales volumes in the Performance Products segment; however, sales to third parties in 2013 decreased by €179 million to €15,534 million. Negative currency effects and price reductions on account of lower raw material costs were largely responsible for this. The acquisition of Pronova BioPharma ASA slowed this sales decline (volumes 3%, prices –2%, portfolio 1%, currencies –3%). Compared with 2012, income from operations before special items decreased by €56 million to €1,365 million. This was particularly attributable to the negative currency effects. Special charges arose from the integration of Pronova BioPharma as well as from restruc turing measures. As a result, income from operations fell by €176 mil-lion to €1,100 million.
In a market environment that continues to be challenging, we aim to slightly increase sales in 2014 through organic growth. In the Dispersions & Pigments division, we anticipate rising demand from two key industries: automotive manufacture and construction. We also expect higher sales volumes in the Care Chemicals and Nutrition & Health divisions. Sales prices are likely to remain under pressure. We want to increase the capa city utilization of our existing plants and achieve high utili-zation of new plants, such as for superabsorbents and disper-sions, from the start. We anticipate income from operations before special items considerably above the level of 2013. Strict cost discipline and repositioning measures to increase our com-petitiveness in all areas should contribute to this.
Segment data Performance Products (million €)
2013 2012 Change in %
Sales to third parties 15,534 15,713 (1)
Thereof Dispersions & Pigments 3,557 3,668 (3)
Care Chemicals 4,871 4,898 (1)
Nutrition & Health 2,088 1,959 7
Paper Chemicals 1,442 1,564 (8)
Performance Chemicals 3,576 3,624 (1)
Intersegmental transfers 489 457 7
Sales including intersegmental transfers 16,023 16,170 (1)
Income from operations before depreciation and amortization (EBITDA) 1,987 2,090 (5)
EBITDA margin % 12.8 13.3 –
Income from operations (EBIT) before special items 1,365 1,421 (4)
Income from operations (EBIT) 1,100 1,276 (14)
Income from operations (EBIT) after cost of capital (447) (242) (85)
Assets 13,614 13,457 1
Research and development expenses 377 345 9
Additions to property, plant and equipment and intangible assets 1,497 764 96

The business year at BASF
Performance Products
BASF Report 2013Management’s Report70
Dispersions & Pigments
− Sales down slightly, mostly because of currency effects − Sales volumes rise in all business areas − Earnings slightly below level of 2012
Care Chemicals
− Sales just under level of 2012
− Higher sales volumes almost fully offset lower prices and negative currency effects − Earnings rise considerably, driven mainly by volumes
Dispersions & PigmentsIn the Dispersions & Pigments division, sales to third parties declined by €111 million to €3,557 million. This was largely due to negative currency effects from the depreciation of the Japa-nese yen and the U.S. dollar relative to the euro (volumes 4%, prices –2%, portfolio –1%, currencies –4%). Despite these negative currency effects and intense pres-sure on prices, we were able to increase sales volumes in all business areas. We observed strong demand for dispersions in Asia Pacific and North America, while our resins were increas-ingly sought after in Europe. In the additives business, we achieved significantly higher volumes in all regions. Sales fell in the pigments business, however, as a result of currency effects and the divestiture of the offset printing inks business (IMEX) in the third quarter of 2012. Income from operations before special items was only slightly below the level of 2012 despite these negative currency effects and a challenging market environment. Through restruc-turing measures and thanks to our strict cost management, we reduced fixed costs compared with the previous year. Special charges were mostly related to restructuring measures in the pigments business. In 2013, we invested in the construction of new plants in Asia. These will contribute to our future growth in the region.
Dispersions & Pigments – Sales by region (Location of customer)
1 Europe 42%
2 North America 27%
3 Asia Pacific 24%
4
South America, Africa, Middle East 7%
1
2
3
4
€3,557million
Care ChemicalsAt €4,871 million, sales to third parties in the Care Chemicals divi sion were €27 million below the level of 2012. Lower prices, primarily brought about by lower raw material costs, and nega-tive currency effects from the U.S. dollar and Japanese yen were almost fully offset by higher sales volumes (volumes 5%, prices –3%, currencies –3%). Prices declined in particular for lauric oil-based standard products. We were able to increase volumes in all business areas and regions despite a difficult market environment. We achieved the strongest volumes growth in the personal care products and hygiene businesses. In the hygiene business area, we particu-larly benefited from temporarily low capacities on the market. Overall growth momentum came primarily from Europe and South America. Our capacity utilization was higher than in the previous year. Despite the negative currency effects, income from operations before special items grew considerably, mainly on account of the volumes increase. Furthermore, we reduced our fixed costs. We purchased enzyme technology for detergents and cleaners from Henkel AG & Co. KGaA in 2013 in order to further strengthen our future market position for important ingredients for the detergents and cleaners industry.
Care Chemicals – Sales by region (Location of customer)
1 Europe 51%
2 North America 23%
3 Asia Pacific 14%
4
South America, Africa, Middle East 12%
1
2
3
4
€4,871million

The business year at BASF
Performance Products
Management’s ReportBASF Report 2013 71
Nutrition & Health
− Acquisition of Pronova BioPharma ASA responsible for significant sales growth − Sales volumes grow in almost all business areas and regions − Margin pressure, negative currency effects and higher fixed costs lead to considerable decline in earnings
Paper Chemicals
− Sales significantly below previous year’s level − Decline in sales largely due to lower prices and negative currency effects − Earnings decrease significantly, mainly on account of lower margins
Nutrition & HealthIn the Nutrition & Health division, sales to third parties rose by €129 million to €2,088 million in 2013. This considerable growth is attributable to the integration of the acquired Pronova BioPharma ASA business, a leading producer of omega-3 fatty acids. The sales increase was weakened by negative currency effects as well as by lower sales prices mainly resulting from sustained competitive pressure in the vitamins business (vol-umes 2%, prices –2%, portfolio 10%, currencies –3%). With demand largely stable, we were able to raise our sales volumes in almost all business areas and regions. We posted the largest volumes growth in the pharmaceutical and flavor and fragrance business areas. Despite the positive contribution from Pronova BioPharma, income from operations before special items was considerably below the level of 2012. This was largely because of rising mar-gin pressure and negative currency effects. Fixed costs were higher than the previous year’s level, owing to increased research spending and higher production and selling expenses. Special charges arose from the integration of Pronova BioPharma and measures to increase our competitiveness.
Nutrition & Health – Sales by region (Location of customer)
1 Europe 46%
2 North America 24%
3 Asia Pacific 21%
4
South America, Africa, Middle East 9%
1
2
3
4
€2,088million
Paper ChemicalsSales to third parties in the Paper Chemicals division fell by €122 million to €1,442 million compared with 2012 (volumes –2%, prices –4%, currencies –2%). Adjusted for the effects of restructuring measures, sales volumes matched the level of the previous year. This meant that our business developed better than the rest of our market, which shrank slightly in 2013. Lower raw material costs and an aggressive competitive environment led to declining prices. Negative currency effects additionally dampened sales. The market development for graphical paper and packag-ing goods was considerably weaker than expected in all regions. Demand for paper chemicals declined as a result. While the paper industry in Europe and North America was marked by consolidation, massive overcapacities arose in Asia, especially in China. In this environment, we continued to realign our port-folio toward chemicals for packaging paper. Furthermore, we continued to concentrate on product lines with clear competi-tive advantages for us and for our customers. For example, we significantly increased sales volumes of VFA-based cationic polymers, which enable paper manufacturers to increase effi-ciency and reduce costs in the production process, thereby growing faster than the market. Income from operations before special items fell consider-ably, mostly as a result of lower margins. Fixed costs were at the prior-year level. Our continuous cost-reduction programs and restructuring measures, such as exiting the optical brightener business in North America, were able to compen-sate for higher costs from the startup of new plants in Asia as well as from investments in our Center for Sustainable Paper Packaging.

The business year at BASF
Performance Products
BASF Report 2013Management’s Report72
Performance Chemicals
− Sales slightly below 2012 level as a result of currency effects − Sales volumes increase, especially in water treatment, oilfield and mining chemicals, and fuel and lubricant additives business areas − Earnings decline slightly, largely owing to negative currency effects
Paper Chemicals – Sales by region (Location of customer)
1 Europe 46%
2 North America 22%
3 Asia Pacific 26%
4
South America, Africa, Middle East 6%
Performance ChemicalsSales to third parties in the Performance Chemicals division decreased by €48 million to €3,576 million compared with 2012. This was largely due to the depreciation of important currencies relative to the euro (volumes 2%, prices 0%, currencies –3%). We observed a slight rise in demand. In China and Europe, eco-nomic growth was slower than we had anticipated. Neverthe-less, we were able to increase sales volumes, particularly in the business areas for water treatment, oilfield and mining chemi-cals, and fuel and lubricant additives. Income from operations before special items was slightly down compared with the previous year. This is mostly attribut-able to the negative currency effects, which were particularly detrimental to our business with plastic additives. The previous year had also included insurance payments received for dam-age caused by the earthquake and tsunami in Japan. In 2013, special charges arose from restructuring measures, such as the even closer orientation of our plastic additives and water treat-ment chemicals businesses toward the changing needs of the market. Measures taken included the optimization of individual sites and of our portfolio as well as the realignment of the poly-acrylamide value chain. In the future, we will group the pigments business of the plastic additives business area into the Disper-sions & Pigments division.
1
2
3
4
€1,442million
In 2013, we began operations at a plastic additives plant in Singa pore, further increasing our proximity to customers in this growing region. In addition, we started the production of customer-specific antioxidant formulations in Bahrain, thus meeting increasing demand from important customer sectors like the automotive industry.
Performance Chemicals – Sales by region (Location of customer)
1 Europe 40%
2 North America 24%
3 Asia Pacific 25%
4
South America, Africa, Middle East 11%
1
2
3
4
€3,576million

The business year at BASF
Functional Materials & Solutions
Management’s ReportBASF Report 2013 73
Strategy
− Development of innovative products and technologies in close collaboration with our customers − Focus on specialties and system solutions that allow customers to stand out from the competition − Continuous optimization of our product portfolio in accordance with regional market requirements and trends in the customer industries
Products
− Catalysts: automotive and process catalysts, battery materials, precious metal trading − Construction Chemicals: solutions for building structure and envelopes, interior construction and infrastructure − Coatings: coatings solutions for automotive and industrial applications, decorative paints − Performance Materials: polyurethanes, thermoplastics, foams and epoxy resins
Functional Materials & Solutions
The Functional Materials & Solutions segment comprises the Catalysts, Construction Chemicals, Coatings and Performance Materials divisions. They develop system solutions, services and innovative products for specific sectors and customers, particularly for the automotive, electronics, chemical and construction industries as well as for household applications and sports and leisure. Our portfolio ranges from catalysts, battery materials, engineering plastics, polyurethanes, automotive and industrial coatings and concrete additives to construc-tion products such as industrial flooring and decorative paints.
We use BASF’s expertise as the world’s leading chemical company to develop innovative products and technologies in close cooperation with our customers. Our aim is to find the best solu tion in terms of cost and functionality, helping our cus-tomers contribute to sustainable development. Our specialties and system solutions enable customers to stand out from the competition. One focus of our strategy is the ongoing optimization of our product portfolio and structures according to different regional market requirements as well as trends in our customer indus-tries. We are positioning ourselves to grow faster than the market and become even less dependent on the cyclicality of individual industries. We aim to secure our leading market position in Europe, to profitably expand our position in the North American market and to selectively extend our activities in the growth regions of Asia, South America, Eastern Europe and the Middle East.
Copper chabazite zeolitesImportant raw materials for diesel catalysts
Value for BASF
13%Annual increase in sales volumes for heavy-duty diesel engine vehicle catalysts since 2011
Value for the environment Elimination of more than
90%Of harmful nitrogen oxides (NOx) from diesel engine exhaust
Value for BASF Stricter vehicle emission regulations mean an increasing demand for modern catalysts. Our inno vative copper chabazite zeolites are important raw materials for emission-control catalysts in diesel engines. The development of zeolites has helped us increase our sales volumes for heavy-duty diesel engine vehicle catalysts by 13% each year since 2011.
Value for the environment Our copper chabazite zeolites enable the elimination of more than 90% of harmful nitrogen oxides from diesel engine exhaust, setting a new industry standard. Specialized zeolites are also being increasingly applied in the production of petrochemicals.

The business year at BASF
Functional Materials & Solutions
BASF Report 2013Management’s Report74
Sales – Functional Materials & Solutions (million €)
2013 17,252
2012 17,049
Sales by division
1 Catalysts 33%
2 Construction Chemicals 12%
3 Coatings 17%
4 Performance Materials 38%
1
2
4
3
€17,252million
Capital expenditures
Location Project Startup
Dahej, India Construction: polyols, polyurethane systems, TPU and Cellasto® 2014
Geismar, Louisiana Construction: polyurethane systems 2015
Kazan, Russia Construction: concrete admixtures 2013
Lemförde, Germany Construction: TPU 2014
Ludwigshafen, Germany Expansion: Neopor® 2013
Construction: specialty zeolites 2014
Münster, Germany Expansion: coating resins 2015
Shanghai, China Expansion: compounding engineering plastics 2014
Construction: TPU 2014
Construction: undercoats 2014
Construction: coating resins 2015
Sroda Slaska, Poland Construction: mobile emissions catalysts 2014
Sydney, Australia Construction: competence center for automotive refinish coatings 2013
Trostberg, Germany Capacity expansion: dry mortars 2015
Yeosu, South Korea Construction: Ultrason® 2014
Products, customers and applications
Division Products Customer industries and applications
Catalysts Automotive and process catalysts
Battery materials
Precious and base metal services
Automotive and chemical industry, refineries, battery manufacturers
Solutions for the protection of air quality as well as the production of fuels, chemicals, plastics and battery materials
Construction Chemicals Concrete admixtures, cement additives, underground construction solutions, flooring systems, sealants, solutions for the protection and repair of concrete, high-performance mortars and grouts, tile-laying systems, exterior insulation and finishing systems, expansion joints, wood protection solutions
Cement and concrete producers, construction companies, craftsmen, builders’ merchants
Solutions for commercial and residential building construction, maintenance, repair and renovation as well as infrastructure
Coatings Coatings solutions for automotive and industrial applications
Decorative paints
Automotive industry, body shops, steel industry, painting businesses and private consumers, wind energy industry
Performance Materials Polyurethane systems and specialty elastomers, engineering and high-performance plastics, biopolymers and epoxy resins, insulation and specialty foams
Automotive, construction, electrical, household appliances, furniture, packaging, shoe soles and uppers

The business year at BASF
Functional Materials & Solutions
Management’s ReportBASF Report 2013 75
Factors influencing sales – Functional Materials & Solutions
Volumes 4%
Prices 1%
Portfolio 0%
Currencies (4%)
Sales 1%
Income from operations before special items – Functional Materials & Solutions (million €)
2013 1,070
2012 932
Functional Materials & SolutionsIn the Functional Materials & Solutions segment, sales to third parties in 2013 rose by €203 million to €17,252 million (volumes 4%, prices 1%, currencies –4%). This is primarily attributable to higher sales volumes in the Performance Materials and Cata-lysts divisions. Sales in all divisions were negatively impacted by currency effects. In the Construction Chemicals divi sion, portfolio measures additionally put a strain on sales develop-ment. At €1,070 million, income from operations before special items exceeded the level of 2012 by €138 million. All divi sions contributed to this considerable increase. Income from opera-tions in the segment grew by €221 million to €1,027 million as a result of lower special charges. In 2012, high special charges had occur red from measures to improve competitiveness in the Construction Chemicals division.
For 2014, we anticipate higher demand from our key customer industries, especially from the automotive and construction sectors. Sales volumes for our innovative specialties and sys-tem solutions are therefore likely to rise significantly. While we forecast a slight sales increase in the Catalysts division and a considerable sales increase in the Coatings and Performance Mate rials divisions, we are expecting sales in the Construction Chemicals division to match the level of 2013 as a result of port-folio effects. Overall, we are aiming for slight sales growth and a considerable, mainly volumes-driven increase in income from operations before special items.
CatalystsIn the Catalysts division, we raised sales to third parties to €5,708 million, up by €140 million compared with the previous year (volumes 5%, prices 1%, currencies –3%). A higher contri-bution from precious metal trading and the increase in sales of
Segment data Functional Materials & Solutions (million €)
2013 2012 Change in %
Sales to third parties 17,252 17,049 1
Thereof Catalysts 5,708 5,568 3
Construction Chemicals 2,120 2,315 (8)
Coatings 2,927 2,961 (1)
Performance Materials 6,497 6,205 5
Intersegmental transfers 835 419 99
Sales including intersegmental transfers 18,087 17,468 4
Income from operations before depreciation and amortization (EBITDA) 1,498 1,363 10
EBITDA margin % 8.7 8.0 –
Income from operations (EBIT) before special items 1,070 932 15
Income from operations (EBIT) 1,027 806 27
Income from operations (EBIT) after cost of capital (328) (548) 40
Assets 11,899 12,146 (2)
Research and development expenses 367 348 5
Additions to property, plant and equipment and intangible assets 611 760 (20)

The business year at BASF
Functional Materials & Solutions
BASF Report 2013Management’s Report76
Catalysts
− Sales slightly above 2012 level − Higher sales contribution from precious metal trading and our business with mobile emissions catalysts − Significant earnings increase, mostly on account of higher margins for refinery catalysts and higher sales volumes for mobile emissions catalysts
Construction Chemicals
− Sales decrease considerably particularly as a result of currency effects − Earnings significantly exceed prior-year level − Strict fixed cost management and efficiency measures decisive for earnings improvement
mobile emissions catalysts were largely responsible for this. Dampening effects came from lower sales levels for chemical catalysts. As a result of greater demand for catalysts for heavy duty diesel-engine vehicles, as well as increased automobile produc-tion in Asia Pacific, sales volumes grew for our mobile emissions catalysts. Volumes declined in Europe due to the weak eco-nomic environment, despite an increase in sales volumes for diesel-powered vehicle catalysts. Sales volumes for mobile emissions catalysts continued to climb in North America on account of the growing demand for automobiles. In the chemi-cal catalysts business area, we posted lower sales volumes due to the limited availability of some of our plants. Sales in precious metal trading grew by €13 million to €2,355 million through higher volumes and prices. Income from operations before special items significantly exceeded the level of the previous year. This was largely the result of higher margins for refinery catalysts and increased sales volumes for mobile emissions catalysts. Chemical catalysts posted lower earnings levels. The contribution from precious metal trading was also lower.
Catalysts – Sales by region (Location of customer)
1 Europe 39%
2 North America 33%
3 Asia Pacific 18%
4
South America, Africa, Middle East 10%
Construction ChemicalsIn the Construction Chemicals division, sales to third parties decreased by €195 million in 2013 to €2,120 million. This was particularly attributable to negative currency effects (volumes –2%, prices 1%, portfolio –2%, currencies –5%).
1
2
3
4
€5,708million
In Europe, sales decreased primarily on account of the divesti-ture of individual businesses in addition to declining market development. We were able to significantly increase sales in Russia, bucking the industry trend. In the Middle East, particu-larly in Saudi Arabia, we also achieved a considerable sales increase thanks in part to positive development in construction activity. Sales in Asia declined significantly. This was mostly because of negative currency effects and decreased demand, especially in China. Our sales volumes in Japan and Southeast Asia rose compared with the previous year. With prices stable, currency effects in North America led to lower sales. Income from operations before special items considerably exceeded the level of 2012. Strict fixed cost management and further efficiency measures were decisive in this development.
Construction Chemicals – Sales by region (Location of customer)
1 Europe 41%
2 North America 26%
3 Asia Pacific 19%
4
South America, Africa, Middle East 14%
CoatingsSales to third parties in the Coatings division decreased by €34 million to €2,927 million. Negative currency and portfolio effects were almost fully offset by higher volumes and prices (volumes 4%, prices 2%, portfolio –1%, currencies –6%). Actual development was therefore just under our forecasted sales increase. While we were able to increase sales volumes in Asia and North America, they were stable in both Europe and South America. We raised sales prices in some business areas due to further increases in raw material costs.
1
2
3
4
€2,120million

The business year at BASF
Functional Materials & Solutions
Management’s ReportBASF Report 2013 77
Coatings
− Sales slightly below level of previous year − Negative currency and portfolio effects nearly offset by higher volumes and prices − Considerable earnings increase, mostly as a result of higher sales volumes for OEM coatings
Performance Materials
− Sales rise slightly, driven mainly by volumes − Sales growth achieved in all regions − Earnings improve significantly thanks to higher sales volumes
Our business with OEM coatings developed very successfully thanks to growing demand in Asia and North America. Automo-tive refinish coatings saw lower demand in Europe. We were able to offset this decline with increased volumes in Asia as well as higher sales prices in the other regions. In the industrial coat-ings business, sales development was strained by somewhat weaker demand for coil coatings from the Russian steel indus-try as well as for coatings for wind turbine rotor blades from the emerging markets. Demand for decorative paints declined slightly in South America, primarily in the premium segment. Sales for the business area were also negatively impacted by currency effects. Higher prices could not fully offset this. Sales decreased in Europe due to the divestiture of our business with Relius® decorative paints. Income from operations before special items grew consid-erably, mainly owing to higher sales volumes for OEM coatings. Our fixed costs fell as a result of our programs to increase effi-ciency as well as currency effects. We were not fully able to pass higher raw material costs – caused in part by negative currency effects in South America – on to the market. Special charges arose from business unit restructuring in Europe as well as the sale of our decorative paints business in Argentina.
Coatings – Sales by region (Location of customer)
1 Europe 39%
2 North America 15%
3 Asia Pacific 21%
4
South America, Africa, Middle East 25%
1
2
3
4
€2,927million
Performance MaterialsIn the Performance Materials division, sales to third parties in 2013 rose by €292 million to €6,497 million (volumes 7%, prices 1%, currencies –3%). Boosted by volumes, we raised our sales in all regions. Price levels were largely stable overall. Sales development was reduced by negative currency effects, partic-ularly in South America and Asia. Despite significantly reduced growth in the automotive industry compared with 2012, our businesses with polyurethane systems, engineering plastics and specialties for the automo-tive sector developed successfully. In a market environment that remained difficult, we benefited in Europe from our project busi-ness as well as from the high level of exports by premium manufacturers. We saw increased demand in North America. Growth in Europe’s construction sector remained negative. Nevertheless, we raised our sales of polyurethane systems for the construction industry in the region. In the other regions, our sales to the construction industry increased in a growing market. We significantly improved income from operations before special items compared with the previous year. This was mainly the result of higher volumes. We successfully concluded the restructuring of our business with Styropor® in Asia in 2013. Furthermore, we expanded and bundled our production capacity for polyure-thane systems and specialties in South America at the site in Guaratinguetá, Brazil.
Performance Materials – Sales by region (Location of customer)
1 Europe 49%
2 North America 19%
3 Asia Pacific 26%
4
South America, Africa, Middle East 6%
1
2
3
4
€6,497million

The business year at BASF
Agricultural Solutions
BASF Report 2013Management’s Report78
Agricultural Solutions
Strategy
− Contribution to feeding growing world population − Long-term innovation strategy ensures future growth − Investments in core and growth markets − Structural integration of Becker Underwood completed and Functional Crop Care global business unit established − Development of solutions that go beyond conventional crop protection measures
The Agricultural Solutions segment consists of the Crop Protection division. We develop and produce innovative solutions for the improvement of crop health and yields, and market them worldwide. BASF Plant Science, whose data is reported in Other, conducts research in the field of plant biotechnology.
Crop Protection – StrategyOur strategy has been developed based on long-term market trends. One challenge for sustainable development is ensuring enough food for a growing world population. To do this, we need to increase crop yields. Since arable farmland is limited, innova tions are essential here. We therefore rely on a long-term inno vation strategy to secure our future growth. We offer our customers a broad portfolio of integrated solutions and continu-ally invest in our development pipeline in order to create inno-vations in chemistry and biology. Our research and develop-ment activi ties focus on solutions ranging from soil to seeds and crops. We are intensifying our investment in growth markets and continuing to expand our good position in our core markets. In October 2013, we concluded the structural integration of the businesses acquired from Becker Underwood at the end of 2012. The Functional Crop Care global business unit was estab lished in the course of the acquisition. In addition to prod-ucts for seed enhancement and innovations for better soil manage ment, Functional Crop Care will also provide techno-logies that make plants more resistant to stress factors such as heat, cold and nutrient deficiency. These solutions strengthen the health of crops, thus going beyond conventional crop protection. In addition, we will continue to enhance our partner-ships with seed companies, also benefiting from the technologi-cal competence of BASF Plant Science.
We work together with different BASF divisions to develop the best solutions for our customers, helping farmers secure and increase their yields.
Clearfield® Production system in MalaysiaHigher yields in rice cultivation
Value for BASF More than
9%Expected annual sales growth in Malaysia until 2018
Value for our customersUp to
3xGreater rice yields
Value for BASF The Clearfield® Production System combines our broad-spectrum herbicides with our partners’ nontransgenic, herbicide-tolerant seeds. In Malaysia, we expect a more than 9% increase in sales of our Clearfield® production system each year until 2018.
Value for our customers Weedy rice can cause considerable harvest losses in rice cultivation. By applying Clearfield®, our customers secure their harvests and can achieve up to three times more yield from their crops.
InvestmentsIn 2013, we invested €300 million in property, plant and equip-ment. A major portion of this total consisted of investments to expand production capacity for our F 500® fungicide as well as for an important precursor for the new fungicide Xemium®. Furthermore, we increased our sites’ research and development

The business year at BASF
Agricultural Solutions
Management’s ReportBASF Report 2013 79
Products
− Fungicides, herbicides, insecticides for the protection of plants against fungal diseases, weeds and harmful insects − Function Crop Care, such as biological crop protection, seed solutions − Products for pest control
BASF Plant Science
− BASF’s plant biotechnology company − Pioneering gene identification platform − Development of crops with clear advantages for farmers, consumers and the environment
Products, customers and applications
Indications and sectors Application Product examples
Fungicides Protecting crops from harmful fungal attacks; improving plant health
Boscalid, Metiram, Dimethomorph, Initium®, Metrafenone, F 500®, Xemium®, AgCelence® (umbrella brand)
Herbicides Prevention of nutrient and water deprivation caused by weeds Kixor®, Dicamba, Pendimethalin, Imazamox, Topramezone, Clearfield® herbicide tolerance system
Insecticides Combating insect pests in agriculture Fipronil, Alpha-Cypermethrin, Chlorfenapyr, Teflubenzuron
Functional Crop Care Products beyond traditional crop protection for plant health and increased yield potential, such as biological control products, seed treatments, polymers and colorants
Standak® Top, Biostacked®, Flo Rite®, Vault® HP plus Integral®, Subtilex® NG
Pest control Nonagricultural applications: public health, professional pest control, landscape maintenance
Products for professional pest control:Termidor® to guard against termite infestation
Products for public health:Interceptor® mosquito nets to protect against malaria
capacities, especially with the expansion of our research facility in Raleigh, North Carolina. In order to fully meet ongoing high demand for our innovative products in the future, we will invest around €1.8 billion in developing and expanding our pro-duction of active ingredients between 2014 and 2018. This includes the capacity expansion planned for our F 500® and Xemium® fungicides in Germany as well as for the Dicamba and Kixor® herbicides produced in the United States.
BASF Plant SciencePlant biotechnology at BASFBASF Plant Science is one of the world’s leading companies in plant biotechnology for agriculture. Our headquarters at the Research Triangle Park site near Raleigh, North Carolina, ensure our proximity to our main markets in North and South America. With our global network of research sites in the United States, Canada, Belgium and Germany, we help farmers meet the grow-ing demand for increased agricultural productivity as well as better nutrition. BASF invests more than €150 million per year
to accomplish these goals. Research and development expen-ses, sales, earnings and all other data of BASF Plant Science are not included in the Agricultural Solutions segment; they are reported in Other. With a pioneering platform for gene identification, BASF Plant Science has specialized in the development of plant char-acteristics such as higher yield, herbicide tolerance and disease resistance. Our goal is to optimize crops so that farmers can achieve greater and more consistent yields. In this way, we make an important contribution to securing a better food supply for a growing world population. We also contribute to sustain-able agri culture, as the cultivation of these plants significantly reduces the amount of land, water and energy required to pro-duce each metric ton of harvested crops. One example is the drought-resistant corn launched on the market in 2013 which can protect farmers in the United States from harvest losses when water sources are limited.
For more on innovations in BASF Plant Science, see page 35

The business year at BASF
Agricultural Solutions
BASF Report 2013Management’s Report80
Sales – Agricultural Solutions (million €)
2013 5,227
2012 4,679
Factors influencing sales – Agricultural Solutions
Volumes 10%
Prices 3%
Portfolio 4%
Currencies (5%)
Sales 12%
Agricultural SolutionsWe improved sales to third parties in 2013 by €548 million to €5,227 million. Thanks to more favorable weather conditions, agriculture grew faster than in the previous year despite the late start to the season in the northern hemisphere. In this posi-tive market environment, we raised both sales volumes and prices. Despite increased expenses for the expansion of our business activities, income from operations before special items exceeded the previous year’s level by €185 million to reach €1,222 million. Special charges were mostly related to the integration of the Becker Underwood business acquired in November 2012. Income from operations therefore rose by €182 million to €1,208 million. We will continue our strategy of profitable growth with inno-vative products and solutions in 2014. We expect continuing high exchange rate volatility in our most important growth mar-kets. Prices for agricultural products are expected to be lower than in 2013, while nevertheless remaining above the averages of the last five years. We anticipate significant sales growth and a slight increase in income from operations before special items.
Crop ProtectionBusiness was very successful in the Crop Protection division in 2013. We increased sales to third parties by €548 million to €5,227 million compared with the previous year. This significant sales growth was chiefly due to increased volumes and prices in all regions and indications. The acquisition of Becker Under-wood further increased sales. We successfully completed the integration of the acquired activities in the third quarter. Nega-tive currency effects particularly impacted our business in the emerging markets (volumes 10%, prices 3%, portfolio 4%, currencies –5%).
Segment data Agricultural Solutions1 (million €)
2013 2012 Change in %
Sales to third parties 5,227 4,679 12
Intersegmental transfers 36 29 24
Sales including intersegmental transfers 5,263 4,708 12
Income from operations before depreciation and amortization (EBITDA) 1,375 1,182 16
EBITDA margin % 26.3 25.3 –
Income from operations (EBIT) before special items 1,222 1,037 18
Income from operations (EBIT) 1,208 1,026 18
Income from operations (EBIT) after cost of capital 447 384 16
Assets 6,777 6,527 4
Research and development expenses 469 430 9
Additions to property, plant and equipment and intangible assets 324 1,054 (69)
1 Research and development expenses, sales, earnings and all other data of BASF Plant Science are not included in the Agricultural Solutions segment; they are reported in Other.

The business year at BASF
Agricultural Solutions
Management’s ReportBASF Report 2013 81
Income from operations before special items – Agricultural Solutions (million €)
2013 1,222
2012 1,037
Crop Protection
− Sales rise considerably thanks to higher volumes and sales prices as well as portfolio effects − Sales grow in almost all regions and indications − Significant earnings increase
In Europe, sales increased year-on-year by €126 million to €1,946 million. This was largely the result of higher volumes and sales prices for fungicides, especially Xemium®, and for herbi-cides. Our business developed successfully, especially in Germany and France. Sales in North America exceeded the previous year’s level by €389 million, amounting to €1,497 million. Growth was particularly driven by greater demand and higher prices for fungicides and herbicides. The acquisition of Becker Under-wood also contributed significantly to this sharp increase in sales. Nega tive currency effects dampened sales. Sales in Asia declined by €12 million to €513 million. The depreciation of numerous currencies in the region relative to the euro had a negative impact on sales development. Increased demand for fungicides in growing markets such as China, Indonesia and India were not able to fully offset this. In South America, we improved sales by €45 million to €1,271 million despite highly negative currency effects. Sales volumes for insecticides grew. We successfully launched our Kixor® herbicide and Xemium® fungicide on the Brazilian market. At €1,222 million, income from operations before special items in the Crop Protection division exceeded the level of 2012 by €185 million. This significant growth was primarily the result of increased volumes and sales prices.
Crop Protection – Sales by region (Location of customer)
1 Europe 37%
2 North America 29%
3 Asia Pacific 10%
4
South America, Africa, Middle East 24%
Crop Protection – Sales by indication and sector
1 Fungicides 43%
2 Herbicides 34%
3 Insecticides* 17%
4 Functional Crop Care 6%
* Including pest control
1
2
3
4
€5,227million
1
2
3
4
€5,227million

The business year at BASF
Oil & Gas
BASF Report 2013Management’s Report82
Strategy
− Oil and gas activities bundled into Wintershall Group − Pursuit of our growth strategy through exploration, acquisitions, strategic partnerships and technological expertise − Important contribution to securing Europe’s natural gas supply
Exploration & Production
− Increased collaboration with Gazprom right at the source − Expansion of our position in Norway − Intensification of activities in the Middle East
Oil & Gas
BASF’s oil and gas activities are bundled in the Winters-hall Group. Wintershall and its subsidiaries operate in the business sectors Exploration & Production and Natural Gas Trading.
In the future, crude oil and natural gas will continue to contrib-ute significantly toward covering the sharply rising energy demand of a growing world population. That is why we invest in the exploration and production of oil and gas, primarily in our core regions Europe, Russia, North Africa and South America. We also aim to establish the Middle East as another of our core regions. Our growth strategy is based on innovative technologies and selected collaborations. With the acquisition of assets from Statoil in July 2013, we achieved a significant milestone in the cooperation established in 2012. As a result of the transaction, our daily oil and gas production in Norway rose from around 3,000 barrels of oil equivalent (BOE) to just under 40,000 BOE. We also took over operatorship of the Brage oilfield. We made progress in our collaboration with ADNOC, the national oil company of Abu Dhabi, on the Shuweihat gas project in 2013. This project is an important step for us toward estab lishing a greater presence in the Middle East. As part of an asset swap with our longtime partner Gazprom, we will acquire 25% plus one share in two additional blocks of the Achimov Formation in the Urengoy Field in Western Siberia in 2014. In return, Gazprom will receive Wintershall’s share of the gas trading and storage business – which was previously jointly operated – as well as a share of 50% in Wintershall Noordzee B.V. The transaction will take place with retroactive financial effect as of April 1, 2013. The importation of natural gas through pipelines will continue to be of great significance to Europe’s supply security in the future. For this reason, in addition to developing and producing gas in and around Europe, we also help create the necessary transport infrastructure. For example, we will partici-pate in the construction of the South Stream Offshore Pipeline through the South Stream Transport B.V.
No more flaring Wintershall uses waste gas to produce electricity, heat and steam
Value for BASFAround
530 million m3
of associated gas put to efficient use each year
Value for the environmentPrevention of more than
2 million tons of carbon emissions from oil production every year
Value for BASF For a long time, the associated gases released during crude oil production were burned off, unused. By investing in innovative technology, we were able to cease this “flaring” at all our production sites. The associated gas is instead utilized for the generation of electricity, heat and steam. We save costs, thanks to lower expenses for emissions certificates and less energy purchasing.
Value for the environment The flaring of associa-ted gas not only destroys valuable energy resources, it also creates large quantities of greenhouse gases. By using the associated gas efficiently, we prevent around two million metric tons of carbon emissions from oil production per year.
Handling hydrocarbons in a responsible manner demands special measures for the protection of people and the environ-ment. We carefully assess the potential effects of every project before we begin. Together with experts, contractors and relevant stakeholders, we develop methods and implement measures to be able to use resources even more efficiently and minimize the impact on the environment. In doing so, we act in accordance with international agreements, local legislation and our own, self- imposed high standards.

The business year at BASF
Oil & Gas
Management’s ReportBASF Report 2013 83
Natural Gas Trading
− Preparation for complete transfer of previously jointly operated natural gas trading and storage business to Gazprom − Nordeuropäische Erdgasleitung (Northern European Natural Gas Pipeline) reaches full transport capacity
Important developments in 2013
− We operate our first oil and gas platform on Norwegian continental shelf − Production freeze in Libyan onshore fields since July due to export terminal strikes − Improved conditions in Argentina fulfill requirements for expanding oil and gas production
Exploration & ProductionEurope: The Mittelplate oilfield off the North Sea coast is the cornerstone of our crude oil production in Germany. We and RWE-DEA each own a 50% stake in this field, the largest known oil deposit in the country. At the Bockstedt oilfield, we con tinued our field test for increasing recovery rates with the biopolymer, Schizophyllan. In 2013, Wintershall Noordzee B.V. discovered a new crude oil reservoir in the southern North Sea, in Danish territory close to the Ravn field. Investigations into its possible commercial develop ment are to follow. Our activities in Norway form a significant part of our port-folio. By acquiring shares in the Brage, Vega and Gjøa fields from Statoil, our daily oil and gas production there increased from around 3,000 barrels of oil equivalent (BOE) to nearly 40,000 BOE starting in August 2013. Since October, we have been the operator of the Brage field with a major production platform on the Norwegian continental shelf. Our plans for the development and operation of the Knarr and Edvard Grieg oilfields have been approved by the Norwe-gian authorities. With the Asha Noor exploration well in the southern Norwegian North Sea, we have discovered an addi-tional crude oil reservoir, which we operate ourselves. Our license portfolio was expanded by the award of four new exploration licenses in Norway and six new blocks in the British North Sea. We are selling selected assets on the British continental shelf to the Hungarian MOL Group as part of our portfolio optimization. The transaction is expected to conclude in the first quarter of 2014 with retroactive financial effect as of January 1, 2013, subject to approval by the relevant authorities. Russia: The Yuzhno Russkoye natural gas field in Western Siberia has been operating at plateau production since 2009. We have a 35% economic interest in this field. We hold a stake of 50% in the development of Block IA of the Achimov formation in the Urengoy field in Western Siberia. The gradual development of this field was accelerated; 25 wells were pro-ducing at the end of 2013. We signed a contract with Gazprom
in December 2013 for the joint development of Blocks IV and V, as well. Wintershall will acquire 25% plus one share. Production is scheduled to begin in 2016. North Africa / Middle East: In Libya, we operate eight oil-fields in the onshore concessions 96 and 97. Strikes at export terminals forced us to suspend our entire oil and gas produc-tion in July 2013. The Al Jurf offshore oilfield in Libya, in which we have an investment, was able to remain in normal operation all year. In Abu Dhabi, we are preparing the first appraisal well in the Shuweihat sour gas and condensate field together with ADNOC and the Austrian oil and gas company, OMV. In addition, we are involved in the exploration of Block 4N of the Khuff Formation off the coast of Qatar, where natural gas was proven in 2013. Block 3 was returned after the end of the exploration phase. Furthermore, we concluded a strategic cooperation agreement in the region with Mubadala Petroleum. South America: We hold shares in a total of 15 onshore and offshore fields in Argentina. In the Neuquén Basin, we con-tinued our technology projects to explore the potential for shale gas and oil. The Argentinian government created various incen-tives to encourage investment in the oil and gas sector. We were therefore able to achieve, for example, significantly higher earn-ings contributions for gas volumes exceeding a certain base production level. These improved conditions support our search for new deposits, in which we are increasingly exploring uncon-ventional resources. In Chile, we returned the Otway and Tran-quilo blocks after the end of the first exploration period.
For more on current reserves, see pages 86 and 216
Natural Gas TradingThe activities in this business sector conducted together with Gazprom are predominantly combined into the W & G Beteiligungs-GmbH & Co. KG (W & G) Group. W & G primarily fulfills holding and financing responsibilities for the gas trading, transport and storage business, and holds the shares in the Ostsee-Pipeline-Anbindungsleitung (Baltic Sea Pipeline Link, or

The business year at BASF
Oil & Gas
BASF Report 2013Management’s Report84
Sales – Oil & Gas (million €)
2013 14,776
2012 12,740
Sales by division
1 Exploration & Production 20%
2 Natural Gas Trading 80%
1
2
€14,776million
Capital expenditures
Location Project Total capacity* Completion
Argentina Development of Vega-Pleyade field 25 million BOE** 2016***
Germany Construction of NEL onshore pipeline link to Nord Stream pipeline 20 billion m3 2012***/2013
North Sea, Norway Development of Knarr field 20 million BOE** 2014***
Development of Maria field 13 million BOE** 2018***
Development of Edvard Grieg (Luno) field 35 million BOE** 2015***/2017
Siberia, Russia Achimgaz, development of Achimov horizon in Urengoy gas and condensate field
70 million BOE** 2008***/2018
* Plateau production** BOE = barrel oil equivalent*** Year of startup
OPAL). The natural gas trading, gas transport and gas storage sectors act as independent subsidiaries under the umbrella of the holding. This organizational structure allows us to meet the unbundling requirements set down by the German Energy Act. Natural gas trading: The W & G subsidiary WINGAS markets natural gas from various sources to Germany and other Euro pean countries. Its main customers are municipal utilities and regional gas suppliers as well as larger industrial firms and power plants. Furthermore, WINGAS is active on spot trading markets. As part of the agreed-upon asset swap, we will completely transfer our shares in WINGAS and in the natural gas trading companies in Berlin and in Zug, Switzerland – including their subsidiaries – to Gazprom. Gas transport: The W & G Group’s transport companies operate a gas pipeline system over 3,200 kilometers long. Construction work on the Nordeuropäische Erdgasleitung (North European Natural Gas Pipeline, or NEL) was completed in Octo ber 2013. With its full transport capacity of around 20 billion cubic meters of natural gas per year, the NEL is now ready for commercial operation.
We hold a 15.5% share in the Nord Stream Pipeline through Nord Stream AG, which is equity-accounted as a financial asset in the BASF Group financial statements. Other sharehold-ers are Gazprom (51%) and E.ON (15.5%), as well as N.V. Neder-landse Gasunie and GDF Suez (9% each). With a total capacity of 55 billion cubic meters of natural gas per year, this pipeline, which stretches from Russia to the German coast over the Baltic Sea, helps bolster supply security in Europe. The South Stream Offshore Pipeline through the Black Sea is developed, constructed and operated by South Stream Transport B.V. The company is owned by Gazprom (50%), Eni (20%), Wintershall (15%) and EdF (15%). The gradual expansion to a transport capacity of 63 billion cubic meters of natural gas per year is scheduled to begin at the end of 2015. Gas storage: The WINGAS subsidiary astora GmbH & Co. KG markets the storage capacity of Western Europe’s largest natural gas storage facility in Rehden, Germany, as well as our share in the Haidach storage facility in Austria. The Jemgum natural gas storage facility in northern Germany began partial operations in 2013. We will transfer our gas storage activities to Gazprom as part of the asset swap.

The business year at BASF
Oil & Gas
Management’s ReportBASF Report 2013 85
Factors influencing sales – Oil & Gas
Volumes 14%
Prices/currencies (1%)
Portfolio 3%
Sales 16%
Income from operations before special items – Oil & Gas (million €)
2013 1,969
2012 1,876
Segment data Oil & Gas1 (million €)
2013 2012 Change in %
Sales to third parties 14,776 12,740 16
Thereof Exploration & Production 2,929 2,584 13
Natural Gas Trading 11,847 10,156 17
Intersegmental transfers 1,160 1,104 5
Sales including intersegmental transfers 15,936 13,844 15
Income from operations before depreciation and amortization (EBITDA) 3,144 2,445 29
Thereof Exploration & Production 2,133 1,775 20
Natural Gas Trading 1,011 670 51
EBITDA margin % 21.3 19.2 –
Income from operations (EBIT) before special items 1,969 1,876 5
Thereof Exploration & Production 1,540 1,387 11
Natural Gas Trading 429 489 (12)
Income from operations (EBIT) 2,516 1,676 50
Thereof Exploration & Production 1,659 1,187 40
Natural Gas Trading 857 489 75
Income from operations (EBIT) after cost of capital 1,283 530 142
Assets 11,916 11,252 6
Thereof Exploration & Production 7,731 5,766 34
Natural Gas Trading 4,185 5,486 (24)
Research and development expenses 53 32 66
Exploration expenses 187 221 (15)
Additions to property, plant and equipment and intangible assets 2,954 1,172 152
Net income2 1,780 1,201 48
1 Supplementary information on the Oil & Gas segment can be found from page 216 onward.2 Information on the net income of the Oil & Gas segment can be found in the reconciliation reporting Oil & Gas in the Notes to the Consolidated Financial
Statements on page 172.

The business year at BASF
Oil & Gas
BASF Report 2013Management’s Report86
Oil & Gas segment
− Sales grow considerably, especially as a result of increased volumes in both business sectors − Income from operations before special items improves slightly through higher contribution from Exploration & Production − Net income considerably above previous year’s level − Current reserves increase from 9 to 11 years
Oil & GasSales to third parties in the Oil & Gas segment grew by €2,036 million to €14,776 million in 2013. This was primarily the result of increased volumes in both business sectors (volumes 14%, prices/currencies –1%, portfolio 3%). At €1,969 million, income from operations before special items exceeded the previous year’s level by €93 million thanks to the higher contri-bution from the Exploration & Production business sector. Vari-ous special items led to an increase of €840 million in income from operations, for a total of €2,516 million. Net income improved by €579 million to €1,780 million. Our planning for 2014 is based on an average oil price of $110 per barrel and a U.S. dollar exchange rate of $1.30 per euro. We expect sales considerably below the 2013 level as a result of the divestiture of the gas trading and storage business planned for the middle of 2014. We anticipate a slight increase in income from operations before special items, driven by the first all-year inclusion of the Norwegian activities acquired from Statoil and the further expansion of Achimgaz production. We also expect to be able to resume onshore production in Libya. The asset swap planned with Gazprom will negatively affect income from operations before special items in 2014 as a result of the missing contributions from the current businesses to be disposed of.
Exploration & ProductionSales to third parties in the Exploration & Production business sector rose year-on-year by €345 million to €2,929 million. This growth was largely attributable to the activities acquired from Statoil in Norway, as well as to higher volumes in Russia and from our offshore field in Libya.
The average price of Brent crude oil was just under $109 per barrel, a reduction of 3% compared with the previous year. In euro terms, the price of oil declined by 6% to €82 per barrel due to the weaker U.S. dollar. At 132 million barrels of oil equivalent (BOE), our crude oil and natural gas production matched the level of 2012. Produc-tion from our fully or proportionally consolidated activities increased considerably through the inclusion of the fields acquired in Norway and the accelerated expansion of produc-tion in the Achimgaz joint operation in Russia; yet this increase was negated by the suspension of crude oil and associated gas production at our equity-accounted onshore fields in Libya, caused by strikes at export terminals in July 2013. Income from operations before special items improved by €153 million to €1,540 million, mainly as a result of higher contributions from Norway, Argentina and Russia. Special income of €164 million arose from the disposal of a share in the Edvard Grieg oilfield, partly counterbalanced by an impairment on a field development project. In the search for new crude oil and natural gas deposits, we finished drilling a total of 20 exploration and appraisal wells in 2013, of which 8 were successful. Our proven crude oil and natural gas reserves totaled 1,458 million BOE at the end of 2013, 20% more than in the pre-vious year. We replenished 280% of the volumes produced in 2013. The reserve-to-production ratio is 11 years (2012: 9 years). This is based on Wintershall’s share of production in 2013 and refers to the reserves at year-end.

The business year at BASF
Oil & Gas
Management’s ReportBASF Report 2013 87
Exploration & Production
− Sales grow, particularly as a result of higher volumes − Crude oil and natural gas production at prior-year level despite suspension of production for onshore activities in Libya − Income from operations before special items considerably above level of previous year, thanks primarily to increased contributions from Norway, Argentina and Russia
Natural Gas Trading
− Sales increase considerably on account of higher trading volumes − Considerable decline in income from operations before special items, mostly due to margin pressure in natural gas trading business
Natural Gas TradingAs a result of higher volumes, sales to third parties in the Natural Gas Trading business sector grew by €1,691 million to €11,847 million. At 521 billion kilowatt hours, sales volumes were significantly above the level of the previous year. We achieved growth of 23% to 277 billion kilowatt hours in our business abroad. WINGAS sold 7% of its volumes to BASF Group com-panies outside of the Oil & Gas segment. Despite this positive volumes development, income from operations before special items declined by €60 million to €429 million, mostly as a result of pressure on retail margins. Continuing optimization measures on the procurement end were only partly able to halt the decline in margins. Earnings fell slightly in gas transport. Special income of €429 million arose from the reclassification of GASCADE Gastransport GmbH due to loss of control.
Oil & Gas – Sales by region (Location of customer)
1 Europe 97%
2 North America 0%
3 Asia Pacific 0%
4
South America, Africa, Middle East
3%
1
4
€14,776million

The business year at BASF
Regional results
BASF Report 2013Management’s Report88
Sales by region (by location of company)
1 Germany 42%
2 Europe (excl. Germany) 16%
3 North America 20%
4 Asia Pacific 16%
5
South America, Africa, Middle East 6%
Income from operations before special items by region
1 Germany 26%
2 Europe (excl. Germany) 36%
3 North America 21%
4 Asia Pacific 12%
5
South America, Africa, Middle East 5%
1 Our chemicals business includes the Chemicals, Performance Products and Functional Materials & Solutions segments.
1
2
3
4
5
€73,973million
1
2
3
4
5
€7,190million
Regional results
EuropeIn 2013, companies headquartered in Europe posted a sales increase of 5% to €43,335 million. This was mainly due to the higher contribution from the Oil & Gas segment. At €23,857 million, sales in the chemicals business1 were down by 2% compared with 2012. Sales declined in the Chemicals segment mostly as a result of significantly lower volumes in the Petrochemicals division as well as lower prices. In the Performance Products segment, sales rose slightly compared with the previous year. Higher sales volumes as well as the inclusion of the acquired Pronova BioPharma ASA businesses contributed to this. Sales in the Functional Materials & Solutions segment were above the 2012 level, driven by volumes and prices. The Agricultural Solutions segment continuned to develop, once again increasing our sales, particularly as a result of higher sales volumes. Sales in the Oil & Gas segment rose significantly. This was largely on account of volumes growth in natural gas trading and the inclu-sion of the activities acquired from Statoil. At €4,422 million, income from operations before special items surpassed the level of the previous year by 2%. Higher contributions from the Agricultural Solutions segment and
improved earnings in Other were able to more than offset lower earnings in the chemicals business, which fell by 5% to €2,550 million. We are taking a series of steps to strengthen the competi-tiveness of the Performance Products segment. We are adapt-ing our business to altered market conditions by streamlining processes, investing in new technologies, taking portfolio measures and making organizational revisions. In Russia, we opened an additional production facility for concrete admixtures in Kazan. This allows us to even better address the needs of our customers.
North AmericaAt €14,573 million, sales for companies headquartered in North America were up year-on-year by 1%. Sales grew considerably in the Agricultural Solutions segment, thanks to the first all-year inclusion of the Becker Underwood businesses as well as to strong business with herbicides and fungicides. We posted a decline in sales in the Performance Products segment and in Other. In local-currency terms, sales in the region grew by 4%. Income from operations before special items increased by 49% to €1,539 million compared with the previous year. This
Regions (million €)
Sales
by location of companySales
by location of customerIncome from operations
before special items
2013 2012Change
in % 2013 2012Change
in % 2013 2012Change
in %
Europe 43,335 41,445 5 41,221 39,428 5 4,422 4,356 2
Thereof Germany 31,571 29,320 8 14,446 15,210 (5) 1,854 2,292 (19)
North America 14,573 14,441 1 14,272 13,992 2 1,539 1,036 49
Asia Pacific 11,679 11,694 . 12,450 12,546 (1) 842 888 (5)
South America, Africa, Middle East 4,386 4,549 (4) 6,030 6,163 (2) 387 367 5
73,973 72,129 3 73,973 72,129 3 7,190 6,647 8

The business year at BASF
Regional results
Management’s ReportBASF Report 2013 89
Regional trends
− Europe: series of measures for strengthening competitiveness of Performance Products segment − North America: focus on innovation, attractive market segments and cross-business initiatives; increased investment in region − Asia Pacific: strengthening research and development presence and local production; plants for production of brake fluids and tert-Butylamine startup in China − South America, Africa, Middle East: implementation of new growth strategy begun in South America; laboratory for mining chemicals opened in South Africa
was mainly the result of the significantly higher contribution from the Chemicals segment due to improved plant availability and higher margins in the Petrochemicals division. The Functional Materials & Solutions and Agricultural Solutions segments were also able to considerably improve their earnings. We made progress in implementing our regional strategy for North America. An even stronger customer and market orientation plays a key role here. We continue to focus on inno-vation, attractive market segments and cross-business initia-tives in order to ensure profitable growth. At the same time, we are increasing our operational excellence through ongoing improvements. We are boosting our investments in the region. We will start up several new plants in 2014, such as production facilities for formic acid and dispersions. We are exploring a joint investment in a world-scale ammonia production plant with Yara on the U.S. Gulf Coast.
Asia PacificCompanies headquartered in Asia Pacific were able to increase sales by 5% in local-currency terms in 2013; in euro terms, sales matched the prior-year level, reaching €11,679 million. We increased sales volumes despite the difficult business environ-ment. We saw high demand, especially in the Intermediates, Catalysts and Coatings divisions. However, higher sales vol-umes could not fully compensate for negative currency effects and declining prices. Income from operations before special items declined by 5% to €842 million. This was largely attributable to weaker margins in the Chemicals and Performance Products segments. In initiating our regional “Grow smartly” strategy, we will further strengthen our research and development presence in Asia Pacific through, for example, a battery materials laboratory in Japan and a center for electronic materials in Korea. By 2020, we aim to increase the proportion of sales in Asia Pacific from local production to around 75%. We started up production plants for brake fluid in Shanghai, China, and for tert-Butylamine in Nanjing, China, in 2013. Furthermore, we began construction
on plants for isononanol in Maoming, China, and for automotive coatings and Ultramid® in Shanghai, China. We are expanding our production of mobile emissions catalysts in Chennai, India. To increase our profitability, we started a new program in 2013 to improve our regional structures. The goal here is to make our organization more efficient and even more closely aligned with our customers’ needs.
South America, Africa, Middle EastAt €4,386 million, sales for companies headquartered in South America, Africa, Middle East were 4% below the level of 2012. In local-currency terms, sales rose by 7%. Chemical industry development in South America was weaker than we had expected. Sales declined slightly. Negative currency effects were only partially offset by higher volumes and prices. Demand rose particularly in the Agricultural Solutions segment; the Becker Underwood business acquired at the end of 2012 also contributed to sales growth. Sales decreased considerably for companies in Africa, particularly on account of currency effects. By contrast, sales rose slightly in the Middle East. Increased volumes more than compensated for negative currency effects. Income from operations before special items in the region improved by 5% to €387 million because of a higher contribu-tion from the Oil & Gas segment in Argentina. We devised a new growth strategy for South America and began its implementation. Aside from expanding our existing businesses, our focus is on the exploitation of additional growth potential through a stronger industry orientation and through innovations. Furthermore, investments such as the construction of a production complex for acrylic acid and superabsorbents in Camaçari, Brazil, will make an important contribution to our future growth. We will continue to increase our efficiency and optimize cost structures. In South Africa, we opened a laboratory for mining chemicals in 2013 which allows us to offer technical services for mining customers throughout Africa.

Responsibility along the value chain
Supply chain management
BASF Report 2013Management’s Report90
Stations along the value chain1
Suppliers Transport Production Transport Customers
Suppliers
− Supplier Code of Conduct includes environmental protection as well as compliance with human rights, labor and social standards, antidiscrimination and anticorruption policies − 155 raw material supplier sites audited on sustainability standards
1 The diagram depicts the different stations along the value chain. The topics in each chapter address the station shown in dark green.
Responsibility along the value chainSupply chain management
Our suppliers are an important element of our value chain. Together with our suppliers, we aim to create value and minimize risks.
StrategyWith our sustainability-oriented supply chain management, we pursue two primary goals: We aim to strengthen our suppliers’ awareness of our standards and expectations, and shape their contribution to sustainable development in a transparent manner. What we expect from our suppliersBoth new and existing suppliers are selected and evaluated not only on the basis of economic criteria, but also on environmen-tal, social and corporate governance standards. Our Supplier Code of Conduct is based on internationally recognized guide-lines, such as the principles of the United Nations’ Global Com-pact Initiative, the International Labor Organization conventions and Responsible Care. Available in 26 languages, the Code of Conduct covers environmental protection as well as compliance with human rights, labor and social standards, and antidiscrim-ination and anticorruption policies. We provided training on sustainability-oriented supplier management to 745 employees in procurement around the world in 2013. This enables them to enter into dialog with our suppliers to raise awareness of, and minimize possible risks along, the supply chain
Evaluating our suppliersBASF participates in the “Together for Sustainability” (TfS) initiative of leading chemical companies for the global standard-ization of supplier evaluations and auditing. This initiative aims to develop and implement a global program for the respon-sible supply of goods and services and to improve suppliers’ environmental and social standards. The evaluation process is simplified for both suppliers and TfS member companies by a globally uniform questionnaire. The initiative’s members initiated a total of around 2,000 sustainability assessments and audits in 2013. Starting in 2014, the activities will be expanded to include further countries and gain new members for the initiative. In implementing the TfS program, risk matrices help us identify suppliers with a high sustainability risk potential based on country and product risks. Using this risk analysis and other evaluations, we audited a total of 155 raw material supplier sites on sustainability standards and initiated 550 sustainability assessments through an external service provider in 2013. If we discover a need for improvement, we support our suppliers in the development of measures to fulfill our standards. We then check again according to a defined time-frame based on the sustainability risk measured. If we cannot find any improve ment, we terminate the business relationship. This occurred in 12 cases in 2013.
For more on supply chain management, see basf.com/supplychain

Responsibility along the value chain
Raw materials
Management’s ReportBASF Report 2013 91
Raw materials
Stations along the value chain
Suppliers Transport Production Transport Customers
Renewable resources
− Around 3.5% of raw materials purchased worldwide from renewable resources in 2013
− Development of “mass balance method,” which utilizes renewable raw materials in Verbund − First commercial-scale production of 1,4-butanediol from sugar
Responsible resource management is an integral part of our strategy. It is applied within the company through our Verbund concept, our innovative products and the use of renewable raw materials. In the search for alternative raw materials, we employ solutions that contribute to sustainability.
StrategyThe Verbund system is an important component of our resource efficiency strategy: The by-products of one plant often serve as feedstock elsewhere, thus helping us to use raw materials more efficiently. In 2013, BASF purchased a total of around 30,000 dif-ferent raw materials from more than 6,000 suppliers. Some of our most important raw materials are naphtha, natural gas, methanol, ammonia and benzene. We examine the use of renewable resources in our Verbund system and are involved in the responsible cultivation and utilization of renewables in numerous projects along the value chain.
Renewable resources In 2013, around 3.5% of the raw materials we purchased world-wide were from renewable resources. We intensified our research and development activities for products and produc-tion processes based on renewable raw materials in 2013. For example, we developed the innovative “mass balance method” together with TÜV SÜD, in which fossil resources in the current Production Verbund are replaced by renewable resources with sustainability certification. The formulation and quality of the cor-responding end products remain unchanged. In this process, renew able raw materials are used as feedstock at the very begin ning of production in the Verbund, and allocated to the respec tive sales products using the new certification methods. The certified products thus contribute to sustainable develop-ment by saving fossil resources and reducing greenhouse gas
emissions. We are supplying the first of these products – dispersions for construction adhesives – to a major manufac-turer in adhesives whose products include flooring adhe sives for the construction industry. Together with our partner, Purac Biochem B.V., we estab-lished Succinity GmbH for the production of bio-based succinic acid. The bacterium used in this process can create succinic acid naturally from various renewable raw materials. This makes bio-based succinic acid an economically and ecologically via-ble alter native to petrochemical raw materials. Succinic acid is used in a number of applications, such as in the production of bioplastics, chemical intermediates, solvents, polyurethanes and plasticizers. Furthermore, we produced the first amounts of 1,4-butane-diol on a commercial scale using sugars as a renewable feedstock in 2013, based on a licensing agreement with the company Genomatica Inc. Butanediol and its derivatives are also used for producing plastics and solvents as well as elec-tronic chemicals and elastic fibers. Together with Cargill Inc. and Novozymes A/S, we are developing technologies to produce acrylic acid from renew-able raw materials. As part of this cooperation, trial amounts of 3-hydroxypropionic acid have been produced from renewable raw materials since 2013. This is a potential precursor for bio-based acrylic acid. One of the main applications for bio-based acrylic acid is in the production of superabsorbents for the hygiene industry. Since 2012, BASF has invested in the technology company Renmatix Inc., which owns a method for obtaining industrial sugar from biomass. This technology can expand the base of renewable resources for BASF’s future processes. Together with Cargill and the German governmental agency for international cooperation, we also continued our project for the economical, environmentally friendly and socially

Responsibility along the value chain
Raw materials
BASF Report 2013Management’s Report92
Mineral raw materials
− We investigate the origins of the minerals we use and reserve the right to conduct external audits
Preserving ecosystems
− Worldwide investigation shows no impact on biodiversity of our production sites adjacent to Ramsar Sites or IUCN Category I, II or III protected areas − European network of eleven farms established for preservation of biodiversity
responsible production of coconut oil in the Philippines. Our goal is to develop and implement sustainability standards for the certi fication and production of this oil. As a member of the Roundtable on Sustainable Palm Oil, BASF is involved in projects which include the conservation of biodiversity in the cultivation of palm oil. By 2015, we aim to use palm and palm kernel oil only from agriculture certified according to sustaina-bility criteria.
Mineral raw materialsIn 2013, we once again performed an analysis to find out if we obtain raw materials from “conflict mines.” To our current knowledge, this is not the case. Our suppliers have confirmed to us that they do not source their minerals from the Democratic Republic of Congo or its neighboring countries. We investigate the origins of the minerals we use and reserve the right to conduct an external audit and, if necessary, terminate our business relationship with that supplier. Through a standardized questionnaire, new suppliers must disclose to us in advance if their products contain conflict minerals.
Preserving ecosystemsWe as a company are dependent on ecosystem services and also have an impact on them. Examples include the availability of clean water and renewable resources, or even the regulating effects of ecosystem services on the preservation of air, water and soil quality. Biodiversity forms the foundation of ecosystem services. In 2013, we investigated our production sites around the world to discover which are located near internationally pro-tected areas: 2% of our production sites (excluding Oil & Gas) are adjacent to a Ramsar Site, 1% to a Category I, II or III pro-tected area of the International Union for the Conservation of Nature (IUCN), and none of our production sites is adjacent to a UNESCO protected area. We did not discover any impact of our activities on biodiversity in these areas in 2013. In order to help preserve biodiversity and natural resources using modern agriculture, BASF established a European net-work with eleven “biodiversity farms.” Within this network, we are developing biodiversity promotion measures together with one of the largest farms in Germany as well as with experts from science and nature conservation organizations. The farm network aims to grow into a global network by 2020.

Responsibility along the value chain
Responsible Care Management System
Management’s ReportBASF Report 2013 93
Stations along the value chain
Suppliers Transport Production Transport Customers
Group directives and audits
− New requirement implemented for safe transportation of our products on barges − Guideline for incident reporting made even more transparent − Introduction of short-notice audits at production sites in Europe
Responsible Care Management System
We act responsibly as an integral part of society and have set out the framework for our voluntary commitments in our Responsible Care Management System. We never compromise on the safety and security of our employ-ees, contractors and neighbors as well as our facilities, transportation and products.
StrategyBASF’s Responsible Care Management System comprises the global rules, standards and procedures for environmental and health protection, safety and security for the various stations along our value chain. Our regulations cover the transportation of raw materials, the activities at our sites and warehouses, the distribution of our products and our customers’ application of the products. Concrete specifications for implementing these measures are laid out in binding directives. These describe the relevant responsibilities, requirements and assessment methods. We regularly conduct audits to monitor our perfor-mance and progress. We use the findings from these audits for continual improvement. We set ourselves ambitious goals for environmental and health protection, safety and security. Our guidelines and require ments are constantly updated. In 2013, for example, we designed an even more transparent global guideline for incident reporting, and implemented a new requirement for the safe transportation of our products on barges. In addition, we set up a central database for our contaminated sites. We assess risks in all areas ranging from research and pro-duction to logistics, and how these could affect the environment, the surrounding community or the safety and security of our employees. In our databases, we document accidents, near-misses and safety-related incidents at our sites as well as on our transportation routes. We foster awareness of workplace safety and safe behavior in every individual with our worldwide safety initiatives.
For more on Responsible Care, see basf.com/responsible-care_e
AuditsRegular audits help ensure that standards are met for environ-mental and health protection, safety and security. We carry out audits at BASF sites and at companies in which BASF is a majo rity shareholder. We have defined our regulations for Respon sible Care audits in a global Group directive. During our audits, we create an environmental, safety and security profile that shows if our performance is sufficient to properly address the existing hazard potential. If this is not the case, we agree on measures and conduct follow-up audits on their implementa-tion soon afterward. Our internal audit system complies with the standards for external auditing procedures ISO 19011 and OHSAS 18001. Worldwide, 200 BASF production sites are certified in accordance with ISO 14001 (2012: 196). We intro-duced short-notice audits throughout Europe in 2013, which included facility inspections and document reviews. We plan to conduct these audits worldwide in 2014. In the BASF Group in 2013, 132 environmental, safety and security audits were carried out at 85 sites, in addition to 22 short-notice audits at 10 sites. We audited 44 sites with respect to occupational medi-cine and health protection.
For more on occupational safety and health protection, see page 95 onward
Costs and provisions for environmental protection in the BASF Group (million €)
2013 2012
Operating costs for environmental protection 893 901
Investments in new and improved environmental protection plants and facilities1 325 268
Provisions for environmental protection measures and remediation2 601 617
1 Investments comprise end-of-pipe measures as well as integrated environmental protection measures
2 Values shown refer to December 31 of the respective year

Responsibility along the value chain
Safety, security and health – Transportation and storage
BASF Report 2013Management’s Report94
Safety, security and health
Stations along the value chain
Suppliers Transport Production Transport Customers
Transportation accidents per 10,000 shipments(Reduction compared with baseline 2003: –61%)
2011 2012 2013201020092008
2020 Goal–70%
Baseline2003
0.56
0.36
0.240.18
0.220.28
0.24
Our regulations and measures for transportation and warehouse safety comprise the delivery of raw mate rials, the storage and distribution of chemical products among BASF sites and customers, and the transportation of waste from our sites to the disposal facilities.
StrategyWe have defined and updated global directives for the transpor-tation and storage of chemical products both in our own warehouses as well as in rented facilities. In order to make the transportation of our products by barge even safer, we set out new requirements in 2013. Furthermore, we introduced a require-ment for the selection of external warehouses that increases the focus on safety. Our 2020 goal is to reduce the worldwide number of transpor tation accidents per 10,000 shipments to 0.17, a 70% reduction compared with baseline 2003. In 2013, we lowered the number of yearly transportation accidents to 0.22 per 10,000 shipments compared with 0.56 in 2003 (2012: 0.24), represent-ing a decrease of 61%. The number of product spillages during shipment in 2013 amounted to 0.23 per 10,000 shipments (2012: 0.25).
Accident prevention and assistanceWe stipulate worldwide requirements for our logistics service providers and assess them in terms of safety and quality. In 2013, we assessed around 450 companies around the world. Our experts use our own evaluation and monitoring tools as well as internationally approved schemes, such as the European Safety and Quality Assessment System. If we find out that our standards are not being met, we discuss this with our logistics service providers and ensure that the necessary measures for improvement are immediately initiated. Together with other companies, we conducted workshops on transportation and warehouse safety in port facilities in Mombasa, Kenya, and Tema, Ghana, in 2013 as part of a cooperation project of the United Nations Environment Pro-gramme and the International Council of Chemical Associations.
We evaluate the risks in transporting raw materials with high hazard potential: In 2013, for example, we carried out risk assess ments for the combined road and rail transport of chlo-rine in Italy as well as for the transport of propylene oxide in India. To further promote uniform transportation safety standards in the chemical industry, we worked with the European Chemi cal Industry Council, CEFIC, to develop a guideline for conducting risk assessments. We plan to implement this guideline world-wide from 2014 onward. If an incident occurs despite all preventive measures, we provide swift and specially coordinated assistance worldwide. More than 150 employees are active around the world as trained transportation safety advisors, taking part in support processes and procedures and helping to derive the right measures for avoiding incidents.
2020 GoalFewer transportation accidents
–70%We aim to reduce the worldwide number of transportation accidents per 10,000 shipments by 70% compared with 2003.
Activities in external networks We are actively involved in external networks which quickly pro-vide information and assistance in emergencies. These include the German Transport Accident Information and Emergency Response System (TUIS), in which BASF plays a coordinating role. In 2013, we provided assistance to other companies in around 250 cases. We apply the experience we have gathered in working with TUIS to set up similar systems in other countries. For example, we advanced the global standardization of accident assistance procedures in 2013.
For more, see basf.com/distribution_safety and basf.com/emergency_response
Transportation and storage

Responsibility along the value chain
Safety, security and health – Production
Management’s ReportBASF Report 2013 95
At our sites, we never compromise on safety. For occupational safety and health protection, we rely on compre hensive preventive measures as well as on the involve ment of all employees and contractors. Our global safety and security concepts serve to protect our employees, contractors and neighbors as well as to pre-vent property damage and protect information and com-pany assets. They help prevent loss of production and damage to the environment.
Global goalsWe have set ourselves ambitious goals for occupational safety and health protection. By 2020, we want to reduce the number of work-related accidents per million working hours by 80% to 0.65 work-related accidents compared with baseline 2002. We measure our performance in health protection using the Health Performance Index (HPI). The HPI comprises five com-ponents: confirmed occupational diseases, medical emergency drills, first aid training, preventive medicine and health promo-tion. Each contributes a maximum of 0.2 to the total score. The highest possible score is 1.0. Our goal is to reach a value of more than 0.9 every year.
Occupational safetyWe promote and monitor safety at work through methods such as risk assessments, safety rules, seminars and audits. In addi tion to routine safety instructions, around 15,000 employ-ees have received training in occupational safety at our sites worldwide as well as at our “Safety Champions Training Cen-ter” at the site in Ludwigshafen in 2013. To raise employee awareness of safe behavior on business trips, we updated our recommendations for business travelers in 2013. In 2013, 1.4 work-related accidents per million working hours occurred at BASF sites worldwide, representing a decrease compared with the previous year (2012: 1.7). Com-pared with baseline 2002, the lost-time injury rate declined by
58%. There were 2.1 work-related accidents per million work-ing hours for contractors in 2013 (2012: 2.4). Unfortunately, there were three fatal work-related traffic acci dents in 2013: One employee suffered a fatal traffic acci-dent in January in Dubai, United Arab Emirates. In April, one employ ee died on a business trip in Moscow, Russia, and another suffered a fatal traffic accident on a business trip in Shanghai, China. In order to achieve our ambitious 2020 goal of reducing the work-related accident rate by 80% compared with 2002, we particularly rely on the commitment of our employees and on clearly defined safety rules. For example, we expanded our require ments for the safe handling of hazardous materials in the laboratory in 2013.
For more on occupational safety, see basf.com/occupational_safety
2020 GoalFewer work-related accidents1 (baseline 2002)
Annual goalHealth Performance Index
–80% >0.91 Per million working hours
Health protectionOur global health management serves to promote and protect the health and productivity of our employees. Contributing to this were numerous emergency drills and health promotion mea-sures in 2013. Worldwide standards for occupational medi cine and health protection within BASF are specified in a directive that is implemented by a global network of experts. We regularly conduct occupational medical audits to monitor our performance.
Production
Stations along the value chain
Suppliers Transport Production Transport Customers
Occupational safety and health protection
− Update of our safety recommendations for business travelers − Expansion of requirements for safe handling of hazardous materials in the laboratory − Worldwide campaign for back health planned for 2014
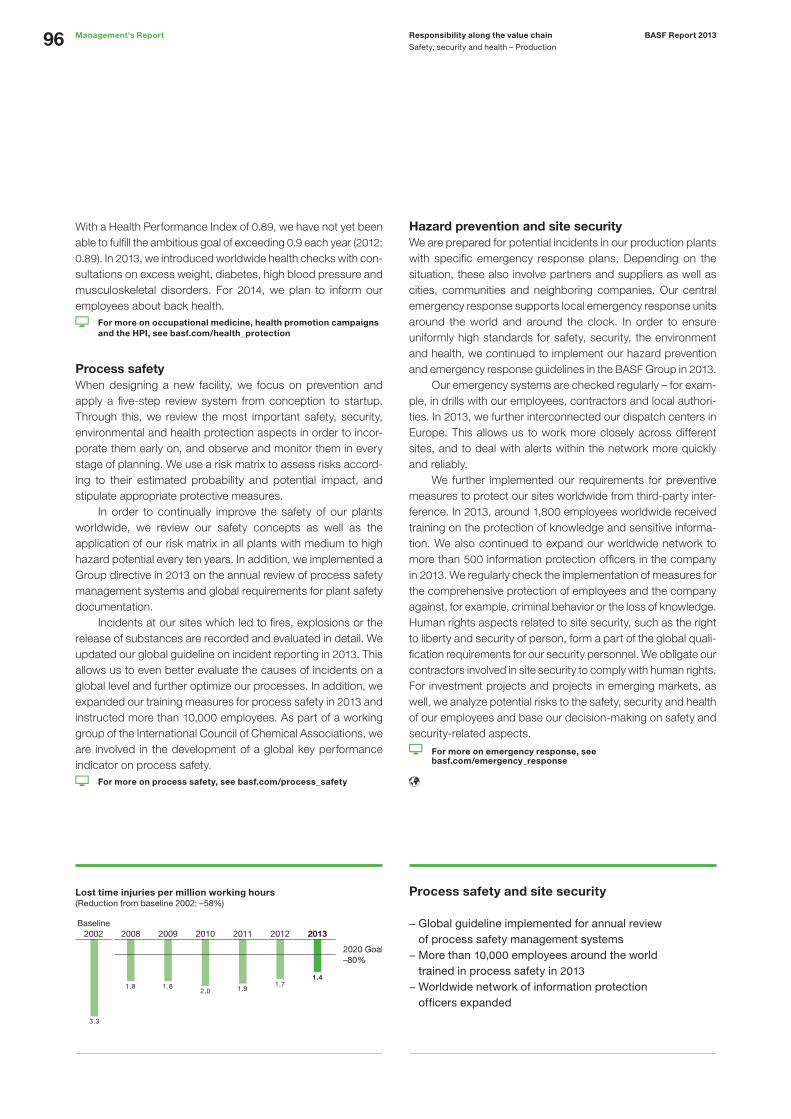
Responsibility along the value chain
Safety, security and health – Production
BASF Report 2013Management’s Report96
With a Health Performance Index of 0.89, we have not yet been able to fulfill the ambitious goal of exceeding 0.9 each year (2012: 0.89). In 2013, we introduced worldwide health checks with con-sultations on excess weight, diabetes, high blood pressure and musculoskeletal disorders. For 2014, we plan to inform our employ ees about back health.
For more on occupational medicine, health promotion campaigns and the HPI, see basf.com/health_protection
Process safetyWhen designing a new facility, we focus on prevention and apply a five-step review system from conception to startup. Through this, we review the most important safety, security, envi ronmental and health protection aspects in order to incor-porate them early on, and observe and monitor them in every stage of planning. We use a risk matrix to assess risks accord-ing to their estimated probability and potential impact, and stipulate appropriate protective measures. In order to continually improve the safety of our plants worldwide, we review our safety concepts as well as the application of our risk matrix in all plants with medium to high hazard potential every ten years. In addition, we implemented a Group directive in 2013 on the annual review of process safety management systems and global requirements for plant safety documentation. Incidents at our sites which led to fires, explosions or the release of substances are recorded and evaluated in detail. We updated our global guideline on incident reporting in 2013. This allows us to even better evaluate the causes of incidents on a global level and further optimize our processes. In addition, we expanded our training measures for process safety in 2013 and instructed more than 10,000 employees. As part of a working group of the International Council of Chemical Associations, we are involved in the development of a global key performance indi cator on process safety.
For more on process safety, see basf.com/process_safety
Hazard prevention and site securityWe are prepared for potential incidents in our production plants with specific emergency response plans. Depending on the situ ation, these also involve partners and suppliers as well as cities, communities and neighboring companies. Our central emergency response supports local emergency response units around the world and around the clock. In order to ensure uniformly high standards for safety, security, the environment and health, we continued to implement our hazard prevention and emergency response guidelines in the BASF Group in 2013. Our emergency systems are checked regularly – for exam-ple, in drills with our employees, contractors and local authori-ties. In 2013, we further interconnected our dispatch centers in Europe. This allows us to work more closely across different sites, and to deal with alerts within the network more quickly and reliably. We further implemented our requirements for preventive measures to protect our sites worldwide from third-party inter-ference. In 2013, around 1,800 employees worldwide received training on the protection of knowledge and sensitive informa-tion. We also continued to expand our worldwide network to more than 500 information protection officers in the company in 2013. We regularly check the implementation of measures for the comprehensive protection of employees and the company against, for example, criminal behavior or the loss of knowledge. Human rights aspects related to site security, such as the right to liberty and security of person, form a part of the global quali-fication requirements for our security personnel. We obligate our contractors involved in site security to comply with human rights. For investment projects and projects in emerging markets, as well, we analyze potential risks to the safety, security and health of our employees and base our decision-making on safety and security-related aspects.
For more on emergency response, see basf.com/emergency_response
Lost time injuries per million working hours (Reduction from baseline 2002: –58%)
Process safety and site security
− Global guideline implemented for annual review of process safety management systems − More than 10,000 employees around the world trained in process safety in 2013
− Worldwide network of information protection officers expanded
2011 2012 2013201020092008
2020 Goal–80%
Baseline2002
3.3
1.8 1.82.0 1.9
1.71.4

Responsibility along the value chain
Safety, security and health – Products
Management’s ReportBASF Report 2013 97
Stations along the value chain
Suppliers Transport Production Transport Customers
Product stewardship
− Global directives with uniformly high standards − Global product strategy workshops conducted with chemical industry representatives in Bulgaria, Chile, the Gulf States, India, Russia and South Korea − Second registration phase of REACH concluded
We review the safety of our products from research to production and finally to our customers’ use of the pro-ducts. We work continually to ensure that our products pose no risk to people or the environment when they are used responsibly and in the manner intended.
StrategyWe ensure uniformly high standards for product stewardship worldwide and our voluntary initiatives go beyond legal require-ments. We monitor the implementation of our guidelines with regular audits. We provide extensive information on our chemical products to our customers and the public with safety data sheets in more than 30 languages. This is achieved with the help of a global data base in which we maintain and evaluate continuously updated environmental, health and safety data for our sub-stances and products. Our global emergency hotline network provides information around the clock. We offer our customers needs-based training in the safe use of our products, such as plastics for sensitive applications like food packaging. We continually work together with our customers on optimizing our products, keeping an eye on consumer protection criteria, as well. Furthermore, we use our Eco- Efficiency Analysis to advise our customers on the evalua-tion of product risks and support them in improving the CO2
footprint of their products. With our global goals for risk assessment, we are support-ing the implementation of initiatives such as the Global Product Strategy (GPS) of the International Council of Chemical Associ-ations (ICCA). GPS is establishing worldwide standards and best practices to improve the safe management of chemical substances. In addition, we are also involved in workshops and training seminars in developing countries and emerging markets. In 2013, for example, we instructed chemical industry representatives on GPS in Bulgaria, Chile, the Gulf States, India, Russia and South Korea. In order to facilitate public access to information, we were involved in the setup of an ICCA online portal providing around 430 GPS safety summaries.
For more on GPS, see basf.com/gps_e
2020 GoalRisk assessment of all products
>99%Risk assessment of all products that we sell in quantities of more than one metric ton per year.
Global goalsBy 2020, we will conduct risk assessments for all substances and mixtures BASF sells worldwide in quantities of more than one metric ton per year. We already reached 56% of this goal in 2013 (2012: 45%). The risk associated with using a substance is the combination of its hazardous properties and its potential exposure to people and the environment.
REACH and other legal requirementsWe completed the second registration phase of REACH in 2013. By the deadline of May 31, 2013, we had registered a total of 1,222 substances with the European Chemicals Agency in the first and second registration phases. We expect that the cost of implementing REACH will continue to average around €50 million per year. When it comes to REACH, we are in close contact with our customers and suppliers. Another contribution BASF makes to international chemi-cal safety is through our support of the United Nations’ initiative to implement a Globally Harmonised System of Classification and Labeling of Chemicals.
For more on auditing of suppliers, see page 90
Products

Responsibility along the value chain
Safety, security and health – Products
BASF Report 2013Management’s Report98
Use of animal studies
− Ecological and toxicological testing before our products are launched on the market − Use of alternative and complementary methods wherever possible and accepted by the authorities − Our projects for developing alternative methods awarded prize in 2013
New technologies
− Use of new technologies to develop products and solutions that contribute to sustainable development − Conclusion of NanoGEM research project and involvement in the European Union’s NanoDefine project
Ecological and toxicological testingBefore launching products on the market, we subject them to a variety of ecological and toxicological testing. We apply the most current scientific knowledge in the research and development of our products. We conduct animal studies only when they are unavoidable. In some cases, animal studies are stipulated by REACH and other national legislation outside the European Union in order to obtain more information on the properties and effects of chemical products. We adhere to the specifications laid down by the German Animal Welfare Act as well as the requirements of the Associa-tion for Assessment and Accreditation of Laboratory Animal Care – the highest standard for laboratory animals in the world. We are continually developing and optimizing alternative and complementary methods, and put these into practice whenever possible and accepted by the authorities. BASF spent €2.8 mil-lion for this purpose in 2013. We use alternative and comple-mentary methods in more than a third of our tests. Currently, 27 alternative methods are being used in our labs and another 16 are in the development stage. In 2013, for example, we devel oped a test strategy that allows us to predict whether par-ticular substances induce human skin allergies. We will apply this test strategy to classify hundreds of substances in the third registration phase of REACH, enabling us to further avoid animal testing. In addition, we developed a method toget her with European partners that allows us to test the neuro toxi-cological potential of substances on test cells grown in the laboratory. In 2013, the German Federal Ministry of Food, Agriculture and Consumer Protection awarded us the Animal Protection Research Prize for our projects on the development of alternative methods.
For more on alternative methods, see basf.com/alternative_methods
Management of new technologiesNew technologies such as biotechnology or nanotechnology offer solutions for key societal challenges – for example, in the areas of climate protection or health and nutrition. Our Nanotechnology Code of Conduct sets out principles for using nanomaterials. This includes our agreement to partici-pate in safety research on nanomaterials. Over the past years, we have conducted more than 150 toxicological and eco toxicological studies and participated in around 30 different projects related to the safety of nanomaterials. We published the results in around 55 scientific articles as well as online. Together with partners from science, politics and industry, we concluded the NanoGEM project in 2013 in Europe, in which we examined the life cycle of functionalized nanoparticles and nanocomposite materials. One of our findings was that toxi city is determined not by the size of the particles but by the properties of the substance. We have been involved in the Euro pean Commission’s NanoDefine project since 2013. In the United States, we are developing methods for the safe handling of nanomaterials along the entire value chain together with local authorities in the NanoRelease project. In the use of biotechnology, we follow the code of conduct of EuropaBio, the European association for biotechnology indus-tries. We constantly improve our product safety activities in the field of biotechnology in order to effectively minimize poten tial risks and ensure that all standards and national laws are met. Our internal risk management is based on the protection of people, animals and the environment. We implemented a scorecard system to monitor the risks of working with biotech-nology. It ensures compliance with standards and transparent processes at BASF.
For more on nanotechnology and the Nanotechnology Code of Conduct, see basf.com/nanotechnology
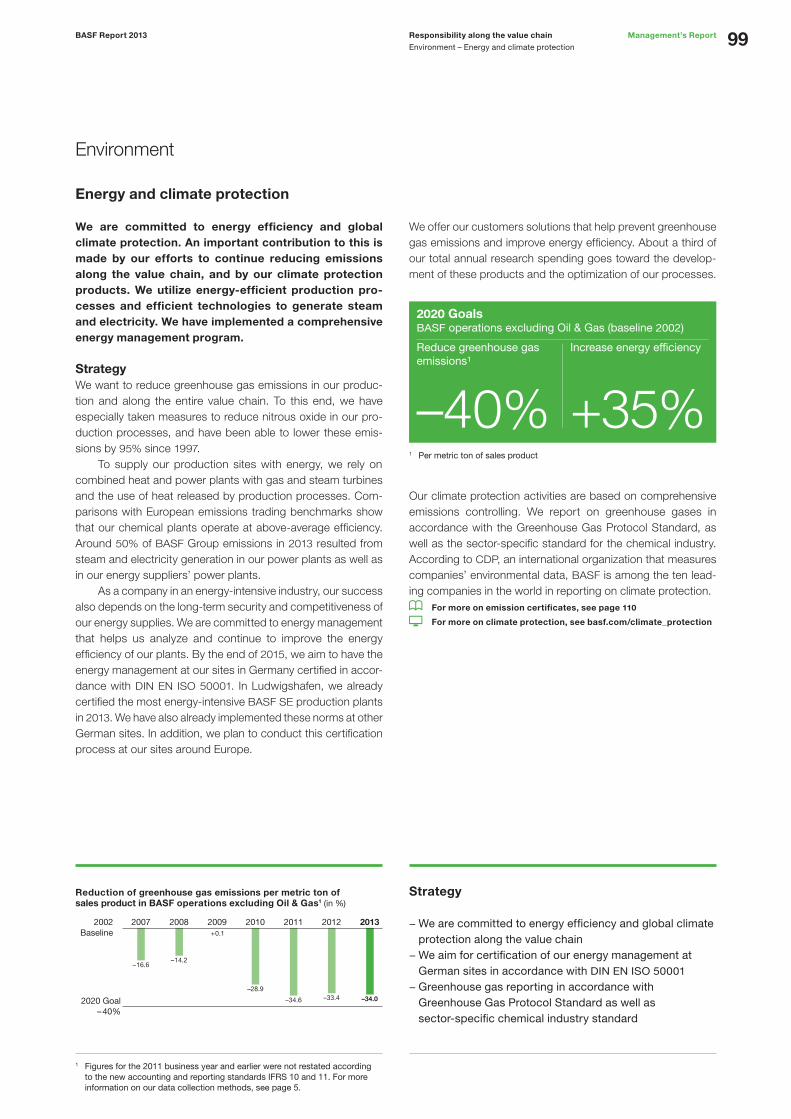
Responsibility along the value chain
Environment – Energy and climate protection
Management’s ReportBASF Report 2013 99
Reduction of greenhouse gas emissions per metric ton of sales product in BASF operations excluding Oil & Gas1 (in %)
Strategy
− We are committed to energy efficiency and global climate protection along the value chain − We aim for certification of our energy management at German sites in accordance with DIN EN ISO 50001
− Greenhouse gas reporting in accordance with Greenhouse Gas Protocol Standard as well as sector-specific chemical industry standard
1 Figures for the 2011 business year and earlier were not restated according to the new accounting and reporting standards IFRS 10 and 11. For more information on our data collection methods, see page 5.
2012 20132009 2010 201120082007
2020 Goal– 40%
2002Baseline
Reduction of specific greenhouse gas emissions1
per metric ton of sales (baseline 2002)
–28.9
–34.6
–16.6–14.2
+0.1
–33.4 –34.0
Environment
Energy and climate protection
We are committed to energy efficiency and global climate protection. An important contribution to this is made by our efforts to continue reducing emissions along the value chain, and by our climate protection products. We utilize energy-efficient production pro-cesses and efficient technologies to generate steam and electricity. We have implemented a comprehensive energy management program.
StrategyWe want to reduce greenhouse gas emissions in our produc-tion and along the entire value chain. To this end, we have especially taken measures to reduce nitrous oxide in our pro-duction processes, and have been able to lower these emis-sions by 95% since 1997. To supply our production sites with energy, we rely on combined heat and power plants with gas and steam turbines and the use of heat released by production processes. Com-parisons with European emissions trading benchmarks show that our chemical plants operate at above-average efficiency. Around 50% of BASF Group emissions in 2013 resulted from steam and electricity generation in our power plants as well as in our energy suppliers’ power plants. As a company in an energy-intensive industry, our success also depends on the long-term security and competitiveness of our energy supplies. We are committed to energy management that helps us analyze and continue to improve the energy efficiency of our plants. By the end of 2015, we aim to have the energy management at our sites in Germany certified in accor-dance with DIN EN ISO 50001. In Ludwigshafen, we already certified the most energy-intensive BASF SE production plants in 2013. We have also already implemented these norms at other German sites. In addition, we plan to conduct this certification process at our sites around Europe.
We offer our customers solutions that help prevent greenhouse gas emissions and improve energy efficiency. About a third of our total annual research spending goes toward the develop-ment of these products and the optimization of our processes.
2020 GoalsBASF operations excluding Oil & Gas (baseline 2002)
Reduce greenhouse gas emissions¹
–40%Increase energy efficiency
+35%1 Per metric ton of sales product
Our climate protection activities are based on comprehensive emissions controlling. We report on greenhouse gases in accordance with the Greenhouse Gas Protocol Standard, as well as the sector-specific standard for the chemical industry. According to CDP, an international organization that measures companies’ environmental data, BASF is among the ten lead-ing companies in the world in reporting on climate protection.
For more on emission certificates, see page 110
For more on climate protection, see basf.com/climate_protection

Responsibility along the value chain
Environment – Energy and climate protection
BASF Report 2013Management’s Report100
Increase in energy efficiency of production processes in BASF operations excluding Oil & Gas1, 2 (in %)
Reduction of carbon emissions
− Reduction of specific greenhouse gas emissions by 34% compared with baseline 2002
− Increase energy efficiency by 19.8% compared with baseline 2002
− Reduction of carbon emissions in natural gas transport by 9.0% compared with baseline 2010
1 Deviation from Reports 2008 to 2011 due to correction of previous years’ energy efficiency parameter as a result of reclassification of natural gas usage2 The figures for the 2011 business year and earlier were not restated according to the new accounting and reporting standards IFRS 10 and 11. For more
information on our data collection methods, see page 5.
2010 2011 2012 2013200920082007
2020 Goal+35%
2002Baseline
21.621.8
15.8
23.225.7
21.919.8
Global goalsBy 2020, we aim to reduce our greenhouse gas emissions per metric ton of sales product by 40% compared with baseline 2002. We achieved a reduction of 34% in 2013 (2012: reduction of 33.4%). Since 1990, we have been able to lower our green-house gas emissions from BASF operations (excluding Oil & Gas) by 48.3% and reduce specific emissions by 74.2% overall. By 2020, we want to improve the energy efficiency of our pro-duction processes by 35% compared with 2002. We were able to achieve an increase of 19.8% in 2013 (2012: 21.9%).
Our goal is to achieve a 10% reduction in carbon emissions in the natural gas transportation business – calculated by amount and distance of transported natural gas – by 2020 compared with baseline 2010. With the help of more energy- efficient pipelines and the more intense use of waste heat in the transportation network, we were able to reduce carbon emissions by around 9% in 2013 (2012: a reduction of 22.1%). The year-on-year increase in specific emissions was the result of nonoptimal capacity utilization for the pipeline compressor stations.
BASF Group’s greenhouse gas emissions according to the Greenhouse Gas Protocol1 (1,000 metric tons of CO2 equivalents)
BASF operations including Oil & Gas GWP factor2 2002 2012 2013
Scope 1
CO2 (carbon dioxide) 1 14,634 16,745 16,976
N2O (nitrous oxide) 310 6,407 857 789
CH4 (methane) 21 244 66 73
HFC (hydrofluorocarbons)2 140-11,700 61 80 76
SF6 (sulfur hexafluoride) 23,900 0 1 1
Scope 2
CO2 1 5,243 3,977 3,987
Total 26,589 21,726 21,902
Sale of energy to third parties (Scope 1)3
CO2 1 347 1,059 927
Total 26,936 22,785 22,829
Offsets (certificates sold)4 0 0 142
Total including offsets 26,936 22,785 22,971
1 BASF reports separately on direct and indirect emissions from the purchase of energy. Scope 1 emissions encompass both direct emissions from production and generation of steam and electricity, as well as direct emissions from the generation of steam and electricity for sale. Scope 2 emissions comprise indirect emissions from the purchase of energy for BASF use.
2 GWP factor: Global warming potential of the individual gases expressed as a factor of CO2 emissions. The GWP factor is based on the Intergovernmental Panel on Climate Change 1995, which will be retained in 2013 for purposes of comparability. HFC (hydrofluorocarbons) are calculated using the GWP factors of the individual components.
3 Also includes sales to BASF Group companies; as a result, emissions reported under Scope 2 can be reported again in some cases 4 Voluntary Carbon Units (VCU) certificates from measures to reduce emissions, which were sold to third parties

Responsibility along the value chain
Environment – Energy and climate protection
Management’s ReportBASF Report 2013 101
Key indicators for climate protection and energy in BASF operations excluding Oil & Gas
Baseline 2002 2012 2013
Greenhouse gas emissions1 (million metric tons of CO2 equivalents) 24.713 20.658 20.729
Specific greenhouse gas emissions (metric tons of CO2 equivalents per metric ton of sales product) 0.897 0.598 0.592
Primary energy demand2 (million MWh) 55.759 57.375 59.164
Energy efficiency (metric tons of sales product per MWh) 0.494 0.602 0.592
1 Scope 1 and Scope 2 according to the Greenhouse Gas Protocol Standard, excluding emissions from the generation of steam and electricity for sale to third parties2 Primary energy used in BASF’s plants as well as in the plants of our energy suppliers to cover energy demand for production processes
Energy supply and efficiencyWith gas and steam turbines in our combined heat and power plants, we can meet 70% of the electricity demand of the BASF Group. Compared with separate methods of generating steam and electricity, we saved around 13 million MWh of fossil fuels and prevented 2.6 million metric tons of carbon emissions in 2013. The Verbund system is an important component of our energy efficiency concept: Waste heat from one plant’s produc-tion process is used as energy in other plants. In this way, we saved around 17 million MWh in 2013 – this corresponds to 3.5 million metric tons’ worth of prevented carbon emissions. To even further increase the energy efficiency of our site in Lampertheim, Germany, we installed a combined heat and power plant in 2013 that supplies the entire site with power and steam. The use of this technology will enable us to decrease carbon emissions by around 14,000 metric tons per year.
We rely on locally available energy sources for the supply of energy at our sites. Especially in the growing Asian market, we and our energy suppliers must make use of coal as an energy source to a certain extent, since the more climate-friendly nat-ural gas is not available in sufficient quantities and at competi-tive prices. We are exploring the use of renewable energies. These can only become a permanent part of our energy mix if they are competitive in terms of supply security and cost. With numer-ous research projects, we contribute to increasing the efficiency of technologies for the use of renewable energy sources. For example, we are working on developing storage technologies that help even out the fluctuations involved in feeding electric-ity from renewable sources into the power grid.
1
2
12
3
Electricity supply
1 Internally generated 67%
2 Purchased 33%
Steam supply
1 Internally generated 53%
2 Waste heat 43%
3 Purchased 4%
Residual fuels5.2 million MWh
Fossil and residual fuels used for power generation in power plants of the BASF Group
Energy supply of the BASF Group 2013
37.4 million MWhTotal:
Steam52.6 millionmetric tons
Electricity15.0 million
MWh Natural gas30.8 million MWh
82%
Heating oil0.3 million MWh
1%
Coal1.1 million MWh
3%
14%

Responsibility along the value chain
Environment – Energy and climate protection
BASF Report 2013Management’s Report102
Corporate carbon footprint and climate protection products
− Comprehensive reporting on greenhouse gas emissions along the value chain − Use of climate protection products sold in 2013 prevents emission of 300 million metric tons of CO2 for our customers − Sales of around €6.7 billion achieved with climate protection products in 2013
Corporate carbon footprint and climate protection productsBASF has been publishing a comprehensive corporate carbon footprint since as early as 2008. This reports on all emissions along the value chain and shows the volume of emissions prevented through the use of our climate protection products. We plan our climate protection activities along the value chain based on our corporate carbon footprint. In 2013, for example, we began exploring – together with our largest suppliers – how we can even more transparently disclose carbon emissions within the value chain and further prevent them.
Greenhouse gas emissions along the BASF value chain in 20131 (in million metric tons of CO2 equivalents)
54 SuppliersPurchased products, services and capital goods (C 1, 2, 3a)
51 CustomersEmissions from the use of end products (C 11)
23 BASFProduction (including genera-tion of steam and electricity)
2 Other(C 3b, 3c, 5, 8, 13, 15)
4 TransportTransport of products, employees’ commuting and business travel (C 4, 6, 7, 9)
15 DisposalIncineration with energy recovery, landfilling (C 12)
1 According to Greenhouse Gas Protocol, Scope 1, 2 and 3 (categories within Scope 3 shown in parentheses)
We have defined climate protection products as those product groups which, compared with the alternatives, prevent green-house gas emissions from production and use to disposal, and whose ecoefficiency is at least as good as that of the alterna-tives. For example, BASF’s Keropur®-brand fuel additives result in better combustion in engines. This enables an approximately 1% decrease in fuel consumption and reduces pollutants and greenhouse gases in the exhaust. Our Neopor® insulation materials help reduce carbon emissions and energy require-ments in buildings.
The use of climate protection products we sold in 2013 prevents the emission of 300 million metric tons of CO2 for our custom-ers (2012: 320 million metric tons).
Prevention of greenhouse gas emissions through the use of BASF products by sector (in million metric tons of CO2 equivalents)
1 Housing and construction 246
2 Industry 31
3 Transport 7
4 Agriculture 7
5 Other 9
We generated sales of around €6.7 billion (around 9% of BASF Group sales) with our climate protection products in 2013 (2012: €7.2 billion), such as building insulation materials, plastic com-ponents for the automotive industry, and materials for wind turbines. The year-on-year decrease in sales with climate pro-tection products resulted from lower demand in the housing and construction sector. Our goal is to continually increase the con-tribution of our current climate protection products, as well as of new products and solutions, to climate protection.
For more information on our emissions reporting, see basf.com/corporate_carbon_footprint
1
2
3 4 5
300 million metric tons
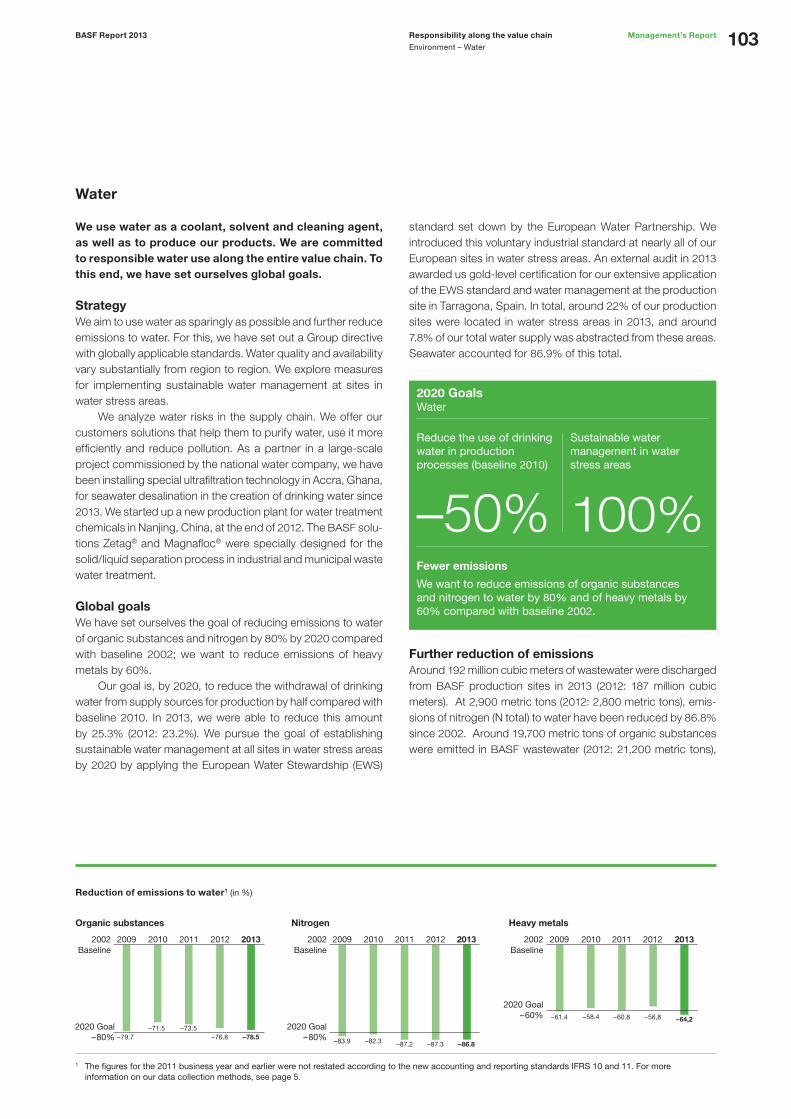
Responsibility along the value chain
Environment – Water
Management’s ReportBASF Report 2013 103
We use water as a coolant, solvent and cleaning agent, as well as to produce our products. We are committed to responsible water use along the entire value chain. To this end, we have set ourselves global goals.
StrategyWe aim to use water as sparingly as possible and further reduce emissions to water. For this, we have set out a Group directive with globally applicable standards. Water quality and availa bility vary substantially from region to region. We explore measures for implementing sustainable water management at sites in water stress areas. We analyze water risks in the supply chain. We offer our customers solutions that help them to purify water, use it more efficiently and reduce pollution. As a partner in a large-scale project commissioned by the national water company, we have been installing special ultrafiltration technology in Accra, Ghana, for seawater desalination in the creation of drinking water since 2013. We started up a new production plant for water treatment chemicals in Nanjing, China, at the end of 2012. The BASF solu-tions Zetag® and Magnafloc® were specially designed for the solid/liquid separation process in industrial and municipal waste water treatment. Global goalsWe have set ourselves the goal of reducing emissions to water of organic substances and nitrogen by 80% by 2020 compared with baseline 2002; we want to reduce emissions of heavy metals by 60%. Our goal is, by 2020, to reduce the withdrawal of drinking water from supply sources for production by half compared with baseline 2010. In 2013, we were able to reduce this amount by 25.3% (2012: 23.2%). We pursue the goal of establishing sustainable water management at all sites in water stress areas by 2020 by applying the European Water Stewardship (EWS)
standard set down by the European Water Partnership. We intro duced this voluntary industrial standard at nearly all of our European sites in water stress areas. An external audit in 2013 awarded us gold-level certification for our extensive application of the EWS standard and water management at the production site in Tarragona, Spain. In total, around 22% of our production sites were located in water stress areas in 2013, and around 7.8% of our total water supply was abstracted from these areas. Seawater accounted for 86.9% of this total.
2020 GoalsWater
Reduce the use of drinking water in production processes (baseline 2010)
–50%
Sustainable water management in water stress areas
100%Fewer emissions
We want to reduce emissions of organic substances and nitrogen to water by 80% and of heavy metals by 60% compared with baseline 2002.
Further reduction of emissionsAround 192 million cubic meters of wastewater were discharged from BASF production sites in 2013 (2012: 187 million cubic meters). At 2,900 metric tons (2012: 2,800 metric tons), emis-sions of nitrogen (N total) to water have been reduced by 86.8% since 2002. Around 19,700 metric tons of organic substances were emitted in BASF wastewater (2012: 21,200 metric tons),
Reduction of emissions to water1 (in %)
1 The figures for the 2011 business year and earlier were not restated according to the new accounting and reporting standards IFRS 10 and 11. For more information on our data collection methods, see page 5.
Organic substances Nitrogen Heavy metals
2020 Goal– 80%
2020 Goal– 80%
2020 Goal– 60%
2002Baseline
2002Baseline
2002Baseline
–79.7–71.5 –73.5
–76.8 –78.5–82.3 –87.2–83.9
–58.4 –60.8–61.4
–86.8–87.3
–64,2–56,8
2012 2013201120102009 2012 2013201120102009 2012 2013201120102009
Water

Responsibility along the value chain
Environment – Water
BASF Report 2013Management’s Report104
Use of water
− Gold-level certification for the application of the European Water Stewardship standard at the site in Tarragona, Spain − Construction of plants to improve wastewater analytics at sites in Geismar, Louisiana, and Ludwigshafen, Germany − Commitment to protecting Rhine River at Ludwigshafen site when set temperature limits are exceeded
1
2 3 2 3
1
Water use Water dischargeWater supply
Water in the BASF Group in 2013 (million cubic meters per year)
1 Total from production processes, graywater, rinsing and purification in production2 The difference between the volume of water supplied and discharged is mainly attributable to evaporation losses during closed-circuit cooling.
Production1
253
Cooling– Closed-circuit cooling 3,888– Flow cooling 1,583
1 Cooling water 1,583 (uncontaminated) (89.2%)
3 14 (0.8%)
2 Wastewater from 178 production (10.0%)
Total: 5,724Total: 1,781 Total: 1,7752
86%
14%Graywater
1 Surface water 1,671 (93.8%)
2 Groundwater 87 (4.9%)
3 Drinking water 23 (1.3%)
representing a reduction of 78.5% since 2002. Our wastewater contained 21.9 metric tons of heavy metals (2012: 26.2 metric tons), representing a worldwide reduction of 64.2% compared with 2002. Phosphorus emissions amounted to 339 metric tons (2012: 366 metric tons). To avoid unanticipated emissions, we will review our water protection concepts at all production sites by 2015. We are con-structing plants for the improvement of wastewater analytics at our sites in Ludwigshafen, Germany, and Geismar, Louisiana, which will help us to identify unanticipated emissions at an even earlier stage. The Ludwigshafen plant also contains special online monitoring systems that enable us to catch relevant pollu tants in our wastewater even more quickly.
Water useWe recirculate water as much as possible in order to withdraw less from supply sources. We have recooling plants at our larger sites to reduce the temperature of the cooling water before it is discharged back into a body of water. To protect the Rhine River, we have committed to the step-by-step reduction of heat input from the Ludwigshafen site when set temperature limits are exceeded, for example as a result of long heat waves or low river levels. The supply, treatment, transportation and recooling of water is associated with a high energy demand. By applying diverse measures, we aim to keep this as low as possible.
For more, see basf.com/water

Responsibility along the value chain
Environment – Air and soil
Management’s ReportBASF Report 2013 105
Emissions to air1 (in metric tons) Air pollutants from BASF operations excluding Oil & Gas
20022 2010 2011 2012 2013
CO (carbon monoxide) 46,208 3,964 4,419 4,264 4,547
NOx (total NO2 (nitrogen dioxide) + NO (nitrogen monoxide), calculated as NO2) 15,045 12,764 13,003 11,507 11,551
NMVOCs (non-methane volatile organic compounds) 15,005 5,550 6,127 6,148 5,760
SOx (total various sulfur oxides) 6,633 4,934 4,483 3,423 4,489
Dust 1,734 3,537 3,069 2,858 3,542
NH3/other (NH3 (ammonia) and other inorganic substances) 994 3,191 3,263 2,382 2,496
Total 85,619 33,940 34,364 30,581 32,385
1 The figures for the 2011 business year and earlier were not restated according to the new accounting and reporting standards IFRS 10 and 11. For more information on our data collection methods, see page 5.
2 Baseline
We want to further reduce emissions to air from our production and prevent waste. We have set ourselves standards for doing so in a global directive. If no recovery options are available, we dispose of waste in a correct and environmentally responsible manner.
StrategyRegular monitoring of our emissions to air is a part of environ-mental management at BASF. Aside from greenhouse gases, we also measure emissions of other pollutants into the atmo-sphere. Our reporting does not take into account air pollu tant emissions from oil and gas operations due to their substantial fluctuation during exploration phases. We aim to prevent and reduce waste. We regularly carry out audits to inspect external waste management plants, ensuring that our hazardous waste is correctly disposed of.
2020 GoalReduce emissions of air pollutants
–70%We aim to reduce air pollutants from our chemical plants by 70% compared with 2002.
Emissions to airBy 2020, we aim to decrease absolute emissions of air pollut-ants from our chemical plants worldwide by 70% in comparison with baseline 2002. The decline was 62.2% in 2013; we reduced emissions to 32,385 metric tons (2012: 30,581 metric tons). Emissions of ozone-depleting substances as defined by the Montreal Protocol totaled 28 metric tons in 2013 (2012: 27 met-ric tons), while emissions of heavy metals totaled 3 metric tons (2012: 3 metric tons). We offer our customers products that
enable them to reduce emissions. In 2013, for example, we developed a catalyst for gasoline engines that, in addition to carbon monoxide, hydrocarbons and nitrogen oxides, also reduces the emission of particulate matter in traffic.
Waste managementIn 2013, we stipulated a globally valid standard for monitoring contaminated sites and conducting remediation measures. In the selection of appropriate measures for site remediation, we work on solutions to balance costs, nature conservation and climate protection aspects, legal requirements, and increased transportation volumes. For example, we continued to advance a series of remediation measures at our sites in Switzerland in 2013.
Waste management, BASF Group (million metric tons)
2012 2013
Total waste generation1 2.21 2.472
Thereof from oil and gas exploration 0.16 0.14
Waste recovered 0.89 0.73
Recycled 0.26 0.31
Thermally recovered 0.63 0.42
Waste disposed of 1.32 1.75
In underground landfills 0.11 0.12
In surface landfills 0.65 0.80
Through incineration 0.56 0.82
Classification of waste for disposal3
Non-hazardous waste 0.41 0.44
Hazardous waste 0.91 1.31
Transported hazardous waste 0.33 0.33
1 Comprises all production waste and hazardous waste from construction activities
2 The increase compared with 2012 is mainly due to construction activity at the site in Ludwigshafen, Germany.
3 The classification of waste into hazardous and non-hazardous waste is performed according to local regulations.
Air and soil

Forecast
Opportunities and risks report
BASF Report 2013Management’s Report106
ForecastOpportunities and risks report
Strategy and goals
− Detect opportunities and risks as early as possible − Take measures to limit business losses − Avoid risks that threaten the company’s continued existence − Create long-term value through improved managerial decisions
Overall assessment
− Most significant causes of opportunities and risks are development of economy and important customer industries as well as volatility in exchange rates and margins − Considerable risks arise from sovereign debt crisis in Europe and possible deceleration of growth in China − No threat to continued existence of BASF Group
The goal of BASF’s risk management is to identify and evaluate opportunities and risks as early as possible and to take appropriate measures in order to seize opportunities and limit business losses. The aim here is to avoid risks that pose a threat to BASF’s continued existence and to make improved managerial decisions to create lasting value. We understand risk to be any event that can negatively impact the achievement of our short-term operational or long-term strategic goals. We define opportunities as possible successes that exceed our defined goals.
In order to effectively measure and manage identified opportu-nities and risks, we quantify these in terms of probability and economic impact in the event they occur. We use statistical methods to aggregate opportunities and risks into risk factors. This way, we achieve an overall view of opportunities and risks at a portfolio level, allowing us to take effective measures for risk management.
Overall assessmentWe expect the global economy to continue to grow in the next two years. We see material risks in the renewed intensification of the sovereign debt crisis in Europe as well as in possibly decelerating economic growth in China. A new global economic crisis could result if market uncertainty rises again or demand is impaired more than anticipated by extensive fiscal austerity measures. Important opportunities and risks for our earnings are also associated with uncertainty regarding the development of key customer industries as well as volatility in foreign currency exchange rates and margins.
Potential short-term effects on EBIT of key opportunity and risk factors subsequent to measures taken1
Possible variations related to:Outlook
– 2014 +
Business environment and sector
Market growth
Margins
Competition
Regulation/policy
Company-specific opportunities and risks
Purchasing/supply chain
Investments/production
Personnel
Acquisitions/cooperations
Information technology
Law
Finance
Exchange rate volatility
Other financial opportunities and risks
< 50 million € ≥ 50 million € < 100 million € ≥ 100 million € < 500 million € ≥ 500 million €
1 Using a 95% confidence interval per risk factor based on planned values; summation is not permissible
According to our assessment, there continue to be no significant individual risks that pose a threat to the continued existence of the BASF Group. The same applies to the sum of individual risks, even in the case of another global economic crisis.

Forecast
Opportunities and risks report
Management’s ReportBASF Report 2013 107
Internal control and risk management system with regard to the Group financial reporting process
− Uniform, Group-wide guidelines set accounting policies, processes and dates − Strict adherence to principles of segregation of duties and dual control and regulation of access rights − Annual evaluation of control environment at significant companies and units using a standardized questionnaire and of relevant processes using a central risk catalog
Risk management processThe BASF Group’s risk management process is based on the international risk management standard COSO II Enterprise Risk Management – Integrated Framework (2004) and has the following key features:
Organization and responsibilities – Risk management is the responsibility of the Board of Executive Directors, which also determines the processes for approving investments, acquisitions and divestitures.
– The Board of Executive Directors is supported by the corpo-rate divisions Finance, Strategic Planning & Controlling and Legal, Taxes & Insurance, as well as the Corporate Control-ling unit and the Chief Compliance Officer. They coordinate the risk management process at Group level and provide the structure and appropriate methodology. Opportunity and risk management is thus integrated in the strategy, planning and budgeting processes.
– A network of risk managers in the business and central units advances the implementation of appropriate risk management practices in daily operations.
– The management of specific opportunities and risks is largely delegated to the business units and is steered at a local level. Risks relating to exchange rates and raw material prices are an exception. In this case, there is an initial consolidation at a Group-wide level before derivative hedging instruments, for example, are used.
– The internal auditing unit (Corporate Audit) is responsible for regularly auditing the risk management system established by the Board of Executive Directors in accordance with Section 91(2) of the German Stock Corporation Act. Furthermore, as part of its monitoring of the Board of Executive Directors, the Supervisory Board considers the effectiveness of the risk management system. An external auditor evaluates the establishment and suitability of an early detection system for risks.
Instruments – The Risk Management Process Manual, applicable throug-hout the Group, forms the framework for risk management and is implemented by the business units according to their particular business conditions.
Organization of BASF Group’s risk management
Supervisory Board
Board of Executive Directors
Corporate Units
FinanceStrategic Planning
& ControllingLegal, Taxes & Insurance
Divisions Competence CentersVerbund SitesRegions
Corporate Controlling:Monthly Global Executive
Team Meetings(Levels 1 and 2)
Corporate Audit
Chief Compliance Officer
External Auditors

Forecast
Opportunities and risks report
BASF Report 2013Management’s Report108
Risk management process
− Integrated process with standardized tools for identifying, assessing and reporting opportunities and risks − Decentralized management of specific opportunities and risks − Aggregation of opportunities and risks on a Group level − Regular reporting on operational and strategic opportunity/risk exposure
Annual evaluation process
− Evaluation of control environment − Identification and documentation of control activities − Assessment of control activities − Monitoring of control weaknesses − Internal confirmation of internal control system
– A catalog of opportunity and risk categories helps to identify all relevant opportunities and risks as comprehensively as possible.
– Standardized evaluation and reporting tools are available for the identification and evaluation of risks. The aggregation of opportunities, risks and sensitivities at the business and Group level using a Monte Carlo simulation helps us to identify effects and trends across the company.
– Company management is informed about operational oppor-tunities and risks (observation period of up to one year) in the monthly management report produced by the Corporate Controlling unit. In addition, the corporate divisions Strategic Planning & Controlling and Finance provide information twice a year about the aggregated opportunity/risk exposure of the BASF Group. Furthermore, if a new individual risk is identified which bears reputational risks or has a more than €10 million impact on earnings, it must be immediately reported.
– As part of our strategy development, the Strategic Planning unit conducts strategic opportunity/risk analyses with a ten-year assessment period. These analyses are annually reviewed during the course of the strategic controlling and are adapted if necessary.
When BASF was included in the Dow Jones Sustainability Index in 2013, the company once again received special recog-nition for its risk management system.
Significant features of the internal control and risk management system with regard to the Group financial reporting processThe Consolidated Financial Statements are prepared by a unit in the corporate division Finance. BASF Group’s accounting process is based on a uniform accounting guideline that sets out accounting policies and the significant processes and deadlines on a Group-wide basis. There are binding directives for the internal reconciliations and other accounting operations. Standard software is used to carry out the accounting processes for the preparation of the individual financial
statements as well as for the Consolidated Financial Statements. There are clear rules for the access rights of each participant in these processes. Employees involved in the accounting and reporting process meet the qualitative requirements and participate in training on a regular basis. There is a clear assignment of responsibilities between the specialist units, companies and regional service units involved. We strictly adhere to the principles of segregation of duties and dual control. Complex actuarial reports and evaluations are produced by specialized service providers or specially qualified employees. Our internal control system for financial reporting continu-ously monitors these principles. To this end, methods are provided for the structured and Group-wide uniform evaluation of the internal control system in financial reporting. The significant risks for the BASF Group regarding a reliable control environment and proper financial reporting are reviewed and updated on an annual basis. Risks are compiled into a standardized questionnaire and presented in a central risk catalog. In a centralized selection process, companies and units are identified that are exposed to particular risks, that have a mate-rial impact on the Consolidated Financial Statements of the BASF Group or that provide service processes. The selection process is conducted annually. In the relevant companies and units, one person is given the responsibility of monitoring the execution of the annual evaluation process.
This process consists of the following steps:– Evaluation of the control environment The adherence to internal and external guidelines that are relevant for the maintenance of a reliable control environment is checked by means of a standardized questionnaire. This is supported by sample taking.– Identification and documentation of the control activities In order to mitigate the risks to the financial reporting processes listed in our central risk catalog, corresponding control activi-ties are conducted and documented.

Forecast
Opportunities and risks report
Management’s ReportBASF Report 2013 109
Development of demand
− Development of demand in sales markets one of strongest drivers of opportunities and risks − Possible negative effects on demand from intensification of sovereign debt crisis in Europe and deceleration of economic growth in China
Margin volatility
− Possible oversupply could lead to lower margins in some value chains − Raw material costs remain high − If demand declines, increasing risk that raw material costs cannot be passed on to the market
– Assessment of the control activities After documentation, a test is performed to verify whether the described controls are capable of adequately mitigating the risks. In the subsequent test phase, samples are taken to test whether, in practice, the controls were executed as described.– Monitoring of control weaknesses The managers responsible receive reports on any control weak-nesses identified and their resolution, and an interdisciplinary committee investigates their relevance for the BASF Group. The Board of Executive Directors and the Audit Committee are informed once control weaknesses have been identified that have a considerable impact on the financial reporting.– Internal confirmation of the internal control system The managing director and chief financial officer responsible for each consolidated Group company confirm to the Board of Executive Directors of BASF SE at the end of the annual cycle the effectiveness of the internal control system with regard to accounting as well as the accuracy and reliability of financial reporting.
Short-term opportunities and risksDemand fluctuation due to volatility in market growth: The development of our sales markets is one of the strongest drivers of opportunities and risks. More details on our assump-tions regarding short-term growth rates for the global economy, regions and key customer industries, such as the chemicals, automotive and construction sectors, can be found from pages 115 to 117. In accordance with this baseline scenario, we are planning to achieve volume growth in our chemicals business in all segments. In addition to the baseline scenario, we also consider risk scenarios. These include, for example, a renewed intensification of the sovereign debt crisis in Europe, which would dampen private demand, unsettle investors and limit the ability of businesses to get refinancing. In this case, Europe would be faced with a new recession and a further increase in unemployment.
Relevant risks also include an unexpectedly sharp deceleration of growth in China. Despite stabilization in the second half of 2013, there is a danger that increasing the focus of economic growth on private consumption will not occur without short-term losses. Furthermore, the course of 2013 showed that the Chi-nese interbank market reacts to liquidity shortages with sharp interest rate fluctuations. A demand-driven decline in oil prices can be expected in these risk scenarios; the euro would depreciate relative to the U.S. dollar compared with our baseline scenario, since Europe is particularly exposed to debt-related risks. We consider a massive sovereign debt crisis in the United States to be unlikely. Climatic influences can also have positive or negative effects on our crop protection business.
Margin volatility due to fluctuating raw material prices and/or fluctuating product supply: We generally anticipate stable margins in 2014. However, for some products and value chains, it is possible that margin pressure could be increased by, for example, new capacities. This would have a negative effect on our earnings. The average oil price of Brent crude in 2013 was around $109 per barrel, slightly lower than in the previous year. For 2014, we anticipate an average oil price of $110 per barrel. We there-fore expect the price level of the raw materials and petrochem-ical basic products that are important to our business to remain high. If there were a considerable decline in demand, this could lead to significant narrowing of our margins and the need to write down inventories. The influence of the oil price is reduced through the contribution of our Oil & Gas business. Earnings in this business rise by around €15 million for every $1 increase in the average annual barrel price of Brent crude.

Forecast
Opportunities and risks report
BASF Report 2013Management’s Report110
Regulation
− Risks include regulation of use of chemicals and intensification of geopolitical tensions − Opportunities for our catalysts business from tightening automobile emissions regulations − Energy policies result in risks and opportunities
Delivery bottlenecks
− Avoidance of unplanned shutdowns through high technical standards and diversification within our global production Verbund − Procurement risks minimized by a broad portfolio, global purchasing activities and careful selection of suppliers
Regulation and political risks: Due to the European chemi-cals regulation REACH, which came into force in 2007, BASF and our European customers face the risk of being placed at a disadvantage to our non-European competitors due to the cost-intensive test and registration procedures. Other risks for us include further regulation, for example, of the use of chemicals; the intensification of geopolitical tensions; the destabilization of political systems; and the imposition of trade barriers, such as Chinese restrictions on exports of rare earths or OPEC quotas for oil production. Moreover, we are closely observing the political situation in Argentina that led to the intensification of foreign exchange restrictions in 2012. Since December 2013, the E.U. Commission has been investigating whether the exemption of energy-intensive companies from the German Renewable Energy Act’s surcharge promoting renewable energy sources (“EEG surcharge”) consti-tutes a violation of E.U. regulations on state aid. This does not represent a material risk for the BASF Group, since we produce large portions of our electricity in our own power plants and self-generated energy is not subject to the EEG surcharge. However, the German government is considering an EEG amendment in 2014 that would partially include companies’ self-generated energy in the EEG surcharge system. The regulation currently under discussion would result in substan-tial additional costs per year and be detrimental for our competi-tiveness at German production sites. By contrast, we view Germany’s decision to phase out the use of nuclear power as well as worldwide support for the expansion of renewable energy and measures to increase energy efficiency as an opportunity for increased demand for our products. For example, we offer diverse solutions for wind turbines in addition to insulation foams for buildings. Our cata-lysts business benefits from the tightening of automobile emissions regulations.
Delivery bottlenecks resulting from interruptions in produc-tion or the supply chain and raw material shortages: We try to prevent unscheduled plant shutdowns by adhering to high technical standards and continuously improving our plants. We reduce the effects of unscheduled shutdowns through diversi-fication within our global production Verbund. We minimize procurement risks through our broad portfolio, global purchasing activities and the purchase of addi-tional quantities of raw materials on spot markets. If possible, we avoid procuring raw materials from a single supplier. When this cannot be avoided, we try to foster competition or we know-ingly enter into this relationship and assess the consequences of potential non-delivery. We continuously monitor the credit risk of important business partners, both customers as well as suppliers.
Information technology risks: BASF relies on a number of IT systems. The nonavailability of critical IT systems and applica-tions can have a direct impact on production and logistic processes. If data are lost or manipulated, this can, for exam-ple, negatively affect process safety and the accuracy of our financial reporting. Unauthorized access to sensitive data, such as personnel records, competition-related information or research results, can result in legal consequences or jeopardize our competitive position. To minimize such risks, BASF has implemented applica-tion-specific measures such as stable and redundantly designed IT systems, backup processes, virus and access protection and encryption systems as well as integrated, Group-wide standard-ized IT infrastructure and applications. The systems used for information security are continuously tested and updated. In addition, our employees receive regular training on information and data protection. IT-related risk management is conducted using Group-wide regulations for organization and application, as well as an internal control system based on these regulations.

Forecast
Opportunities and risks report
Management’s ReportBASF Report 2013 111
Litigation and claims
− Limitation of legal risks with the help of an internal control system − Estimate of monetary effects from legal disputes and proceedings as realistic as possible − Regular employee training as part of Group-wide Compliance Program
Financial opportunities and risks
− Exchange rate volatility − Interest rate risks − Risks from metal and raw material trading − Liquidity risks − Risk of asset losses − Impairment risks − Risks from pension obligations
Litigation and claims: In order to assess the risks from current legal disputes and proceedings and any potential need to rec-ognize provisions, we prepare our own analysis and assess-ment of the circumstances and claims considered. In addition, in individual cases, we consider the results of comparable pro-ceedings and independent legal opinions. Furthermore, we make assumptions as to the probability of claims’ success, and to which extent. The actual costs can deviate from these estimates. We use an internal control system to limit risks from poten-tial infringements of rights or laws. For example, we try to avoid patent and licensing disputes whenever possible through exten-sive clearance research. As part of our Group-wide Compliance Program, our employees receive regular training.
For more on our Group-wide Compliance Program, see page 127
Financial opportunities and risks The management of liquidity, currency and interest rate risks is conducted in the Treasury unit. The management of commod-ity price risks takes place in the Procurement competence cen-ter or in the appropriately authorized Group companies. Detailed guidelines and procedures exist for dealing with financial risks. Among other things, they provide for the segregation of trading and back office functions.
Exchange rate volatility: Our competitiveness on global markets is influenced by fluctuations in exchange rates. For BASF’s purchasing, opportunities and risks arise in particular when the U.S. dollar exchange rate fluctuates. A full-year rise in the value of the U.S. dollar/euro exchange rate by $0.01 would result in an increase of around €50 million in BASF’s earnings, assuming other conditions remain the same. On the production side, we mitigate foreign currency risks by having production sites in the respective currency zones.
Foreign currency risks result from the translation of receivables, liabilities and other monetary items in accordance with IAS 21 at the closing rate into the functional currency of the respective Group company. In addition, we incorporate planned purchase and sales transactions in foreign currencies in our financial foreign currency risk management. These risks are hedged using derivative instruments, if necessary.
Interest rate risks: Interest rate risks result from potential changes in prevailing market interest rates. These can cause a change in the present value of fixed-rate instruments and fluctuations in the interest payments for variable-rate instru-ments, which would positively or negatively affect earnings. To hedge these risks, interest rate swaps and combined interest rate and currency derivatives are used in individual cases. In addition to market interest rates, BASF’s financing costs are determined by the credit risk premiums to be paid. These are mainly influenced by our credit rating and the market conditions at the time of issue. In the short to medium term, BASF is largely protected from the possible effects on its interest result thanks to the well-balanced maturity profile of its financial debt.
Risks from metal and raw material trading: In the catalysts business, BASF employs commodity derivatives for precious metals and trades precious metals on behalf of third parties and on its own account. In addition, we use our knowledge of the markets for crude oil and oil products to generate earnings from the trade of raw materials. To address specific risks associated with these trades, which are not part of our operating business, we set and continuously monitor limits with regard to the type and size of the deals concluded.
Forecast
Opportunities and risks report
BASF Report 2013Management’s Report112
Exchange rate volatility
− Exchange rate volatility a significant risk factor; opportunities and risks in particular from U.S. dollar exchange rate fluctuations − Production-related foreign currency risks limited by having sites in the respective currency zones − Net position in foreign-currency-denominated receivables and liabilities as well as planned foreign-currency transactions hedged with derivatives
Risk of asset losses
− Export credit insurance and investment guarantees to hedge country-related risks − Reduction of credit risks through credit checks and transaction limits − No concentration of default risks on receivables at any individual business partner − Use of credit insurance and bank guarantees
Liquidity risks: Risks from fluctuating cash flows are recognized in a timely manner as part of our liquidity planning. We have access to extensive liquidity at any time thanks to our good ratings, our unrestricted access to the commercial paper market and committed bank credit lines. In the short to medium term, BASF is largely protected against potential refinancing risks by a balanced maturity profile for financial indebtedness as well as through diversification in various financial markets.
For more on financial risks, see the Notes to the Consolidated Financial Statements from page 201 onward
For more on the maturity profile, see the Notes to the Consolidated Financial Statements on page 197
Risk of asset losses: We limit country-specific risks with measures based on internally determined country ratings, which are continuously updated to reflect changing environment conditions. We selectively use export credit insurance and investment guarantees to limit specific country-related risks. We lower credit risks for our financial investments by engaging in transactions only with banks with good credit ratings and by adhering to fixed limits. The credit ratings are continuously monitored and the limits are adjusted accordingly. We reduce the risk of default on receivables by continuously monitoring the creditworthiness and payment behavior of our customers and by setting appropriate credit limits. Due to the global activities and diversified customer structure of the BASF Group, there are no major concentrations of credit default risk. Risks are also limi-ted through the use of credit insurance and bank guarantees.
Impairment risks: The risk of an asset impairment occurs if the assumed interest rate in an impairment test increases or the predicted cash flows decline. In the current business environ-ment, we consider the risk of impairment of individual assets such as customer relationships, technologies and brands, as well as goodwill, to be nonmaterial.
Long-term incentive program for executives: Our executives have the opportunity to participate in a share-price-based com-pensation program. The need for provisions for this program varies according to the development of the BASF share price and the MSCI World Chemicals Index; this leads to a corre-sponding increase or decrease in personnel costs.
Risks from pension obligations: We predominantly finance company pension obligations externally through separate plan assets. This particularly includes BASF Pensionskasse VVaG and BASF Pensionstreuhand e.V. in Germany, in addition to the large pension plans of our Group companies in North America, the United Kingdom and Switzerland. To address the risk of underfunding pension plans due to market-related fluctuations in plan assets, we have investment strategies that align return and risk optimization to the structure of the pension obligations. Stress scenarios are also simulated regularly by means of port-folio analyses. Furthermore, new employees are almost always offered defined contribution plans. An adjustment to the inter-est rates used in discounting pension obligations leads imme-diately to changes in stockholders’ equity.
Long-term opportunities and risksLong-term demand development: In our “We create chemi-stry” strategy, we operate under the assumption that chemical production (excluding pharmaceuticals) will grow worldwide by an average of 4% annually until 2020, faster than global gross domestic product and also somewhat more rapidly than in the previous 10 years. We want our sales to increase significantly faster, by an average of 6% annually. We plan to accom plish this with our broad, market-oriented portfolio, which we will further strengthen in coming years through investments in new produc-tion capacity, R&D activities and acquisitions. Our ambitious goal for 2020 is thus to reach sales of €110 billion and we strive to increase income from operations before depreciation and amortization (EBITDA) to €22 billion.

Forecast
Opportunities and risks report
Management’s ReportBASF Report 2013 113
Long-term development
− Annual average growth of 4% in global chemical production expected; growth risks if long-lasting stagnation results from sovereign debt crises − BASF aims for above-average growth − Active portfolio management: taking advantage of opportunities with targeted investments in production capacity, R&D activities and acquisitions; minimizing risks with divestitures
Innovation
− Major component of our growth strategy − Risks minimized through Know-How Verbund as well as continuous review of efficiency, chances of success and operating environment of research projects − Ongoing dialog with partners and customers to improve chances of success
If the continuing sovereign debt crises result in a slackening of global economic growth, these goals could prove to be too ambitious. As a result of our high degree of diversification across various customer industries and regions, we would still expect our growth to be above the market average, even under these conditions.
For more on the “We create chemistry” strategy, see page 21 onward
Development of the competitive and customer landscape: We expect competitors from emerging markets to become increasingly important in the years ahead. Furthermore, we anticipate that many raw material suppliers will expand their value chains. We are addressing this risk through active portfo-lio management. We exit markets where risks outweigh oppor-tunities, and in which we do not see satisfactory opportunities to stand out from our competitors in the long term. For exam-ple, we will complete the divestiture of our natural gas trading and storage business as part of an asset swap with Gazprom, which will take retroactive financial effect as of April 1, 2013. In order to remain competitive, we continuously improve our operational excellence. Our strategic excellence program, STEP, also contributes to this. Starting at the end of 2015, we expect the more than 100 individual projects to contribute around €1 billion to our earnings each year. In order to achieve long-term profitable growth, our research and business focus is on highly innovative business areas, which we sometimes enter into through strategic coop-erative partnerships.
Innovation: We are observing a trend toward more sustainabil-ity in our customer industries. We want to take advantage of the resulting opportunities with innovations – particularly in the growth fields we have identified. These include Batteries for Mobility, Functional Crop Care to improve agricultural efficiency, solutions for water treatment and technologies for the use of renewable energy sources, such as wind, solar thermal and pho-tovoltaic power.
New products launched on the market between 2011 and 2020 are expected to contribute €30 billion to sales in 2020. To achieve this goal, we also aim to invest around 3% of our sales (excluding Oil & Gas) in research and development. We also address the risk of the technical or economic failure of research and development projects by maintaining a balanced and diver-sified project portfolio, as well as through professional project management (R&D controlling). We optimize the effectiveness and efficiency of our research activities through our global Know-How Verbund as well as through collaboration with partners and customers. Further-more, in a program and project management process, we continuously review the chances of success and the underlying assumptions of research projects; this review includes all phases from idea generation to product launch. The trust of customers and consumers is essential for the successful introduction of new technologies. That is why we enter into dialog with stake-holders at an early stage of development.
For more on innovation, see page 30 onward
Portfolio development through investments: We expect the increase in chemical production in emerging markets in the com-ing years to be significantly above the global average. This will create opportunities that we want to exploit by expanding our presence in these economies; therefore, more than one-third of our investment volume between 2011 and 2020 will be spent in emerging markets. Our decisions on the type, size and locations of our invest-ment projects are based on assumptions related to the long-term development of markets, margins and costs, as well as raw material availability and country, currency and technology risks. Opportunities and risks arise when real developments devi ate from our assumptions, particularly with respect to demand develop ment and intensity of competition. In the implementation phase, we make use of our experi-ence in project management and controlling in order to mini-mize technical risks as well as the risk of cost overruns or missed deadlines. For more on our investment plans, see page 120 onward

Forecast
Opportunities and risks report
BASF Report 2013Management’s Report114
Investments
− Investment decisions on the basis of assumptions regarding development of markets, margins and costs, as well as raw material availability and country, currency and technology risks − Opportunities and risks arising from deviating development − Risks in project implementation minimized by making use of experience in project management and controlling
Personnel
− Intensified global competition for highly qualified specialist and management candidates − Risk of loss of expertise from numerous retirements − More effective personnel recruitment and retention with the help of various measures
Acquisitions: In the future, we will continue to refine our port-folio through acquisitions that promise above-average profitable growth, are innovation-driven and offer added value for our customers while reducing the cyclicality of our earnings. The evaluation of opportunities and risks already plays a significant role during the assessment of potential acquisition targets. A detailed analysis and quantification are conducted as part of due diligence. Examples of risks include increased staff turnover, delayed realization of synergies, and the assumption of obligations that were not precisely quantifiable in advance. If our expectations in this regard are not fulfilled, risks could arise, such as the need to impair intangible assets; however, there could also be opportunities, for example, from additional synergies. For more on our acquisitions, see page 36 onward
Recruitment and long-term retention of qualified employ-ees: Global competition for highly qualified employees and lead-ers has grown in recent years; in the medium to long term, this will likely be further intensified by demographic change. As a result, there is an increased risk that job vacancies could not be filled with suitable applicants, or only after a delay. Business could be negatively affected in the medium and long term by the loss of expertise in North America and Europe due to disproportionately high retirement numbers, as well as by the challenge arising from additional recruitment demand in Asia arising from the growth we strive to achieve. We address these risks with our global programs Generations@Work and Diversity + Inclusion, the Employee Development project, employer branding and a greater emphasis on further develop-ing our employees as well as additional regional initiatives. With these measures, we increase BASF’s attractiveness as an employer and retain our employees in the long term.
For more on the individual initiatives and our goals, see page 39 onward
Sustainability: BASF is committed to integrating environmen-tal protection and socially responsible conduct into its business activities. Infringements of our voluntary commitments and legal violations represent a reputational risk and could lead to operational or strategic risks. Before acquiring a company, we take into account its focus on sustainability and we consider this in the acquisition process. We use the results of our global issue management for sustainability to initiate change processes in the company in order to be prepared for any potential risks and to exploit opportunities. We have established global monitoring systems which also include our supply chain – these enable us to ensure adherence to laws and our voluntary commitments in the areas of environment, safety, security and health as well as to labor and social standards. In order to assure society’s acceptance of our business activities, we engage in ongoing dialog with relevant stakeholders. The Nano Dialog Forum is an example. Ultimately, however, residual risks remain in all entrepreneurial activities which even comprehen-sive risk management cannot exclude.
For more on sustainability, see page 27 onward
For more on monitoring tools, see page 22 onward

Forecast
Economic environment in 2014
Management’s ReportBASF Report 2013 115
We expect the following developments in 2014:
− Global economic growth at 2.8%, only somewhat faster than in 2013 (+2.3%) − Global economy continues to face substantial risks − Currency volatility remains high in emerging markets − Bottoming out and weak growth of gross domestic product in European Union (+1.0%) − U.S. growth at 2.5%, slightly up from prior year; growth in Asia (excluding Japan) at prior-year level (+5.8%); somewhat slower growth in China (+7.0%); stable growth in Japan (+1.5%) and South America (+2.6%) − Oil price to average $110 per barrel for the year − Average exchange rate of $1.30 per euro
Economic environment in 2014
The global economy will likely grow by 2.8% in 2014, only somewhat faster than in the previous year (+2.3%). We expect growth to remain weak in the eurozone. The global economy will continue to face significant risks. At 4.4%, global chemical production will presumably grow at the previous year’s rate (+4.6%) due to the slower momentum expected for China. For 2014, we assume an average price for Brent crude oil of $110 per barrel and an exchange rate of $1.30 per euro. Exchange rate volatility in the emerging markets will remain high.
We expect the economy in the European Union to bottom out and grow slowly in 2014. While Germany, the United Kingdom, and the northern and eastern E.U. countries will presumably grow faster than one percent, we anticipate mostly stagnating economic development for the countries in Southern Europe. Our forecast anticipates a continuing reform and consolidation process in Europe and no renewed escalation of the sovereign debt crisis. For the United States, we expect the overall economy to grow somewhat faster than in 2013. Economic uncertainty with regard to future austerity measures decreased following the settlement of the budget dispute. Low energy prices and continued improvement in the labor market will favor moderate growth of the U.S. economy.
Outlook for gross domestic product 2014 (Real change compared with previous year)
World 2.8%
European Union 1.0%
United States 2.5%
Asia (excl. Japan) 5.8%
Japan 1.5%
South America 2.6%
Trends in gross domestic product 2014–2016 (Average annual real change)
World 3.0%
European Union 1.4%
United States 2.5%
Asia (excl. Japan) 6.2%
Japan 1.2%
South America 3.0%
Economic growth in Asia (excluding Japan) in 2014 is likely to match prior-year levels. Based on China’s economic policy to decrease dependence on investment and export, we expect growth there to be somewhat weaker. By contrast, we anticipate stronger growth on average in India and the other emerging markets due to increased competitiveness arising from the depreciation of their currencies.

Forecast
Economic environment in 2014
BASF Report 2013Management’s Report116
We expect the following developments in key customer industries in 2014:
− At 3.7%, growth in global industrial production above previous year’s level (+2.5%) − Transportation: significantly stronger growth than in 2013
− Energy and resources: growth marginally ahead of the previous year − Construction: slight upturn in growth − Consumer goods: stronger growth; robust growth in the electrical and textile industries − Electronics: considerable acceleration in growth − Health and nutrition: continuing solid growth − Agriculture: growth at previous year’s level
Japan is expected to largely maintain its pace of expansion in 2014. Sales tax increases planned for the spring will dampen growth, but this will be partly offset by positive fiscal stimulus measures. For South America, we assume that growth rates will remain around the same level as 2013. We anticipate greater, export-led demand owing to brightened global economic pros-pects. Domestic demand in Brazil will remain subdued as a result of inflationary tendencies and increasing interest rates.
Outlook for key customer industriesConsidering the general economic upswing forecasted, we expect higher growth rates in global industrial production than in the previous year (2014: +3.7%; 2013: +2.5%). Industrial pro-duction in the emerging markets will likely continue to grow sig-nificantly faster (+5.2%) than in industrialized countries (+2.3%). We expect the transportation sector to grow considerably faster than in the previous year. In the Asian emerging markets and in Eastern Europe, we forecast a significant increase in auto-motive production. In Western Europe, however, the automotive industry is likely to further shrink, but at a slower rate than in the previous year. Growth in the global energy and resources sector is expected to be higher than in 2013. We anticipate a somewhat stronger increase in the demand for energy and resources as a result of accelerating growth in industrial production.
In the construction industry, we also expect a slight upturn. After a major slowdown in construction activity in Europe in recent years, we expect the market to shrink only slightly overall in 2014. However, the differences within the European Union will still be great: We predict a continuing decline in Spain, Italy and France, whereas we anticipate growth in Germany, the United Kingdom and Northern Europe. The upturn in the Ameri can housing market will likely continue. In the emerging markets of Asia and in South America, high growth rates are expected in infrastructure investments. We expect the consumer goods industry to grow faster in 2014 than in the previous year. Production is likely to increase slightly in industrialized countries, with especially positive momentum coming from Japan and the United States. By contrast, we anticipate only a slight increase in Europe. Growth in the emerging markets is expected to moderately accelerate. We anticipate robust growth overall, especially in the electrical and textile industries, whereas production in the paper industry will likely increase more moderately. We forecast significant growth in the electronics industry, which is typically very cyclical. We expect the electronics indus-try to enjoy strong growth, especially in the emerging markets of Asia but also in Japan and the United States. In Europe, how-ever, only slight growth is predicted. We expect the health and nutrition segment to continue to grow solidly in the emerging markets in 2014. We anticipate high growth rates in the emerging markets, but not significantly higher than in the previous year. However, we expect growth to accelerate in the industrialized countries. We foresee robust production growth in agriculture, matching the level of the previous year.

Forecast
Economic environment in 2014
Management’s ReportBASF Report 2013 117
We expect the following developments in the chemical industry in 2014:
− Stable growth in global chemical production (2014: +4.4%; 2013: +4.6%) − European Union: no widespread improvement (+1.1%) − United States: at +2.8%, growth rates comparable with previous year; robust growth in key customer industries − Asia (excluding Japan): somewhat weaker growth (+7.2%) due to anticipated consolidation in China − Japan: growth at 2.5%, higher than in previous year − South America: slight recovery (2.4%)
Outlook for the chemical industryWe anticipate growth in chemical production (excluding pharmaceuticals) of 4.4% in 2014 (2013: 4.6%). Rising demand in our customer industries will presumably lead to solid demand for chemical industry products. For the emerging markets, we anticipate high growth rates that are nevertheless somewhat lower than in the previous year (+6.3%) due to the expected macro economic consolidation in China, the world’s largest chemical market. Chemical production in the industrialized countries will likely grow somewhat faster than in 2013 (+1.9%). We do not anticipate widespread improvement in the chemi-cal industry in the European Union in 2014. While production in Spain and Italy will likely stagnate or slightly decrease, we expect slow growth in Germany, France and the United Kingdom. Due to robust growth in the automobile industry, the con-struction sector and other key customer industries, we antici-pate similarly high growth rates in chemical production in the United States, as in 2013. The chemical industry in the United States will increasingly benefit from low energy and raw mate-rial costs. In Asia (excluding Japan), the construction sector and the automotive, electronics and consumer goods industries will create a solid demand for input from the chemical industry in 2014. Nonetheless, we assume that growth will be somewhat weaker compared with the previous year as a consequence of the consolidation expected in China.
For Japan, we anticipate faster growth in the chemical indus try due to the higher growth rates forecasted for industrial produc-tion. We expect chemical production in South America to slightly accelerate in 2014. Brazil, the largest market in the region, will likely see only minimal growth and remain at a rate below the country’s long-term average. The environment will continue to be challenging in Argentina. Stronger growth impetus will probably come from Chile and Colombia.
Outlook chemical production 2014 (excl. pharmaceuticals) (Real change compared with previous year)
World 4.4%
European Union 1.1%
United States 2.8%
Asia (excl. Japan) 7.2%
Japan 2.5%
South America 2.4%
Trends chemical production 2014–2016 (excl. pharmaceuticals) (Average annual real change)
World 4.6%
European Union 1.3%
United States 2.9%
Asia (excl. Japan) 7.3%
Japan 1.6%
South America 3.0%

Forecast
Outlook 2014
BASF Report 2013Management’s Report118
Outlook 2014
Outlook 2014
− Somewhat faster growth expected for global economy despite continuing volatility − BASF business to perform well in market environment that remains challenging − Increase in sales volumes targeted, excluding effects of acquisitions and divestitures − Sales likely to be slightly below 2013 levels, due to divestiture of gas trading and storage business planned for middle of 2014
− Slight increase in income from operations (EBIT) before special items targeted − EBIT expected to considerably exceed 2013 level thanks to special income from divestiture of gas trading and storage business − Considerable increase in EBIT after cost of capital forecasted
1 Our chemicals business includes the Chemicals, Performance Products and Functional Materials & Solutions segments.
The world economy is expected to grow slightly faster in 2014 than in 2013, despite continuing volatility. For the global chemical industry, we anticipate growth rates comparable with the previous year’s level. We forecast somewhat higher growth in key customer industries such as the transportation, consumer goods and electronics industries. This will likely have a positive effect on our business. Overall, we expect to perform well in a market environment that remains challenging in 2014. We aim to increase our sales volumes excluding the effects of acqui sitions and divestitures. Nonetheless, sales are likely to decline slightly compared with 2013, due to the divestiture of the gas trading and storage business planned for the middle of 2014. We expect a slight increase in income from operations before special items, especially as a result of considerably higher contribu-tions from the Performance Products and Functional Materials & Solutions segments. We aim to earn a high premium on our cost of capital once again in 2014.
As presented in detail on pages 115 to 117, we anticipate an increase in global economic growth (+2.8%) and industrial pro-duction (+3.7%) in 2014. For the chemical industry, we expect a growth rate of +4.4%, comparable with the level of 2013. We assume an average price for Brent crude oil of $110 per barrel and an average exchange rate of $1.30 per euro.
Sales and earnings forecast for the BASF GroupThe divestiture of the gas trading and storage business planned for the middle of 2014 will presumably reduce BASF Group sales considerably in 2014. However, we only expect a slight decrease in sales overall as a result of the slight rise in sales anticipated for the chemicals business1 and significant sales growth in the Agricultural Solutions segment.
We want to slightly increase income from operations before special items. We anticipate a significant earnings improvement in the Performance Products and Functional Materials & Solu-tions segments. We predict considerably higher income from operations for the BASF Group than in 2013. Special income arising from the planned divestiture of our gas trading and storage business is expected to make a significant contribution here. We aim to con-siderably increase income from operations after cost of capital and therefore earn a high premium on our cost of capital. The significant risks and opportunities which could affect the attainment of our forecast are explained on pages 106 to 114.
Sales and earnings forecast for the segmentsWe strive to slightly increase sales in the Chemicals segment. In the Petrochemicals and Monomers divisions, we anticipate slight sales growth. Sales in the Intermediates division are likely to rise considerably. We expect higher sales volumes in the Monomers division, particularly for isocyanates, while the startup of new plants will contribute to sales growth in the Petro-chemicals division. We forecast higher demand for the Interme-diates division from the following key industries: auto motive, crop protection and textile fibers. Overall, income from opera-tions before special items is expected to be slightly below the 2013 level due to startup costs for several plants that will begin operations. In a market environment that continues to be challenging, we aim to slightly increase sales in the Performance Products segment through organic growth. In the Dispersions & Pigments division, we anticipate higher demand from two key industries: automotive and construction. We also expect higher sales volumes in the Care Chemicals and Nutrition & Health divisions. Sales prices are likely to remain under pressure. We want to increase the capacity utilization of our existing plants and achieve high utilization of new plants, such as for superabsor-bents and dispersions, from the start. We anticipate income

Forecast
Outlook 2014
Management’s ReportBASF Report 2013 119
Planned capital expenditures by segment 2014–2018
1 Chemicals 33%
2 Performance Products 15%
3Functional Materials & Solutions 12%
4 Agricultural Solutions 7%
5 Oil & Gas 20%
6 Other (infrastructure, R+D) 13%
Planned capital expenditures by region 2014–2018
1 Europe 49%
2 North America 25%
3 Asia Pacific 18%
4
South America, Africa, Middle East 4%
5
Site alternatives currently being investigated 4%
1
23
4
5
6
€20.2billion
1
2
3
4 5
€20.2billion
Forecast by segment1 (million €)
SalesIncome from operations (EBIT)
before special items
2013 Forecast 2014 2013 Forecast 2014
Chemicals 16,994 slight increase 2,182 slight decline
Performance Products 15,534 slight increase 1,365 considerable increase
Functional Materials & Solutions 17,252 slight increase 1,070 considerable increase
Agricultural Solutions 5,227 considerable increase 1,222 slight increase
Oil & Gas 14,776 considerable decline 1,969 slight increase
Other 4,190 considerable decline (618) slight decline
BASF Group 73,973 slight decline 7,190 slight increase
1 For sales, “slight” represents a change of 1-5%, while “considerable” applies for changes of 6% and higher. “At prior-year level” indicates no change (+/–0%). For earnings, “slight” means a change of 1-10%, while “considerable” is used for changes of 11% and higher. “At prior-year level” indicates no change (+/–0%).
from opera tions before special items considerably above the level of 2013. Strict cost discipline and respositioning measures to increase competitiveness in all areas will contribute to this. In the Functional Materials & Solutions segment, we anti-ci pate higher demand from our key customer sectors, especially from the automotive and construction industries. Sales volumes of our innovative specialties and system solutions are therefore likely to rise considerably. While we forecast a slight sales increase in the Catalysts division and a considerable increase in sales in the Coatings and Performance Materials divisions, we are expecting sales in the Construction Chemi cals division to match the 2013 levels as a result of portfolio effects. Overall, we strive to increase sales slightly and income from operations before special items considerably, boosted espe-cially by volumes. In the Agricultural Solutions segment, we will continue our strategy of profitable growth with innovative products and solutions. We expect continuing high exchange rate vola tility in our most important growth markets. Prices for agricultural
products are likely to be lower than in 2013, while never theless remain ing above the averages of the past five years. We antici-pate significant sales growth and a slight increase in income from opera tions before special items. We expect sales in the Oil & Gas segment to be signifi-cantly below the 2013 level due to the divestiture of the gas trading and storage business planned for the middle of 2014. For income from operations before special items, we anticipate a slight increase. The first all-year inclusion of the Norwegian acti vities acquired from Statoil ASA and the further expansion of Achimgaz production will drive this increase. We also expect to be able to resume onshore production in Libya. The asset swap planned with Gazprom will have a negative effect on income from opera tions before special items due to the missing contributions from the current business to be disposed of in 2014.

Forecast
Outlook 2014
BASF Report 2013Management’s Report120
Key investments in 2014
− Construction of a TDI plant in Ludwigshafen, Germany − Construction of an MDI plant in Chongqing, China − Construction of production complex for acrylic acid and superabsorbents in Camaçari, Brazil − Development of Edvard Grieg and Knarr oil deposits in Norwegian North Sea − Field development of Achimov formation in Siberia, Russia
Dividends and financing
− Annual year-on-year dividend increase targeted − Targeted rating: at least a solid A − Flexible use of attractive capital market conditions; continued issue of medium to long-term bonds and use of commercial paper program
1 Excluding additions to property, plant and equipment resulting from acquisitions, capitalized exploration, restoration obligations and IT investments
For Other, we expect sales to decrease significantly and income from operations before special items to decrease slightly in 2014. Lower sales for precursors and the discontinuation of compen-satory payments from the divestiture of the fertilizer business will contribute to this.
Investment planningTo enhance our chemical activities, we are planning capital expen ditures of €30 billion to €35 billion for the period between 2011 and 2020; more than a third of this sum will be invested in emerging markets, further strengthening our presence in these growth markets. In particular, we are already planning or carrying out the following major projects:
Capital expenditures: selected major projects
Location Project
Camaçari, Brazil Construction: production complex for acrylic acid and superabsorbents
Chongqing, China Construction: MDI plant
Geismar, Louisiana Construction: formic acid plant
Ludwigshafen, Germany
Construction: TDI plant
Replacement: nitric acid plants
Ludwigshafen and Schwarzheide, Germany
Expansion of capacities for F 500® and Xemium® fungicides
Shanghai, China Construction: Ultramid® plant
Construction: coating resins
Sroda Slaska, Poland
Construction: mobile emissions catalysts plant
Theodore, Alabama Construction: chelating agents
In the Oil & Gas segment, our investments of around €4 billion by 2018 will focus mainly on the development of proven gas and oil deposits in Russia, Norway and Argentina, as well as the explor ation of new oil and gas reserves. For 2014, we plan investments of around €4.4 billion1, particularly for the major projects named above.
DividendsWe stand by our ambitious dividend policy and offer our share-holders an attractive dividend yield. We continue to aim to increase our dividend each year, or at least maintain it at the previous year’s level.
Information on the proposed dividend can be found from page 12 onward
FinancingThe goals of our financing policy are securing liquidity at all times, limiting risks associated with financing and optimizing our cost of capital. We aim to maintain at least a solid A rating. Cash outflows are expected to result from the scheduled repayment of bonds with a total volume equivalent of around €1,250 million. To refinance mature bonds and to optimize our maturity profile, we will continue to issue medium to long-term corporate bonds and make use of our commercial paper pro-gram. Our access to the capital markets allows us to benefit from attractive conditions for flexible financing for the BASF Group.
Information on our financing policies can be found on page 56
Events after the reporting periodThere have been no significant changes in the company’s situation or market environment since the beginning of the 2014 business year.

3 Co
rpo
rate
Go
vern
ance
Corporate Governance
Corporate governance report 122
Compliance 127
Management and Supervisory Boards 129
Compensation report 131
Report of the Supervisory Board 136
Declaration of Conformity 140

Corporate governance report BASF Report 2013Corporate Governance122
Corporate governance report
Corporate governance refers to the entire system for managing and supervising a company. This includes the organization, values, corporate principles and guidelines as well as internal and external control and monitoring mechanisms. Effective and transparent corporate governance guarantees that BASF is managed and monitored in a responsible manner focused on value creation. This fosters the confidence of our domestic and international investors, the financial markets, our cus-tomers and other business partners, employees, and the public in BASF.
The fundamental elements of BASF SE’s corporate governance system are: its two-tier system, with a transparent and effective separation of company management and supervision between BASF’s Board of Executive Directors and the Supervisory Board; the equal representation of shareholders and employees on the Supervisory Board; and the shareholders’ rights of co-admini-stration and supervision at the Annual Shareholders’ Meeting.
Two-tier management system of BASF SE
Direction and management by the Board of Executive DirectorsThe Board of Executive Directors is responsible for the manage-ment of the company, and represents BASF SE in business undertakings with third parties. BASF’s Board of Executive Directors is strictly separated from the Supervisory Board: A member of the Board of Executive Directors cannot simulta-neously be a member of the Supervisory Board. The Board of Executive Directors agrees on the corporate goals and strategic alignment of the BASF Group as well as their individual business areas, and determines the company’s internal organi-zation. It also manages and monitors the business units of the BASF Group through the planning and setting of the corporate budget, the allocation of resources and management capacities, the monitoring and decision-making regarding significant indi-vidual measures, and the control of the operational management. The Board’s actions and decisions are aligned with the compa-ny’s best interests. It is committed to the goal of sustainably increas ing the company’s value. Among the Board’s responsibil-ities is the preparation of the consolidated and individual finan-cial statements of BASF SE. Furthermore, it must ensure that the company’s activities comply with legal requirements and internal corporate directives. This includes the establishment of appro-priate controls and risk management systems. Decisions that are reserved for the Board as a whole by law, through the Board of Executive Directors’ Rules of Procedure or through resolutions adopted by the Board, are made at regularly held Board meetings called by the Chairman of the Board of Executive Directors. Board decisions are generally based on detailed information and analyses provided by the business areas and specialist units, and, if deemed necessary, by exter-nal consultants. Board decisions can generally be made via a simple majority. In the case of a tied vote, the casting vote is given by the Chairman of the Board. However, the Chairman of the Board does not have the right to veto the decisions of the Board of Executive Directors. Members of the Board of Executive Directors are authorized to make decisions individually in their assigned areas of responsibility. The Board can set up Board Committees to consult and decide on individual issues; these must include at least three members of the Board of Executive Directors. For the prepa ration of important decisions, such as those on acquisitions, divesti-tures, investments and personnel, the Board has various commissions at the level below the Board that carefully assess the planned measure and evaluate the associated opportunities and risks, and based on this information, report and make recommendations to the Board – independently of the affected business area. The Board of Executive Directors informs the Supervisory Board regularly, without delay and comprehensively, of all issues important to the company with regard to planning, business development, risk situation, risk management and compliance. Furthermore, the Board of Executive Directors
reportsappoints
monitors advises
Board of Executive Directors– 8 members, appointed by the Supervisory Board– Chairman appointed by the Supervisory Board
The Board of Executive Directors is responsible for the management of the company, and represents BASF SE
in business undertakings with third parties.
Supervisory Board– 12 members: 6 shareholder representatives elected at the Annual
Shareholders’ Meeting and 6 employee representatives– Chairman elected by the Supervisory Board

Corporate governance report Corporate GovernanceBASF Report 2013 123
coordinates the company’s strategic approach with the Supervi-sory Board. The Statutes of BASF SE define certain transactions that require the Board of Executive Directors to obtain the Supervisory Board’s approval prior to their conclusion. Such cases include the acquisition and disposal of enterprises and parts of enterprises, as well as the issue of bonds or compara-ble financial instruments. However, this is only necessary if the acquisition or disposal price or the amount of the issue in an individual case exceeds 3% of the equity reported in the last approved Consoli dated Financial Statements of the BASF Group.
For more on risk management in the Outlook, see pages 106 to 114
The members of the Board of Executive Directors, including their areas of responsibility and memberships on the supervisory bodies of other companies, are listed on page 129. Compensation of the Board of Executive Directors is described in detail in the Compensation Report on pages 131 to 134
Supervision of company management by the Supervisory BoardThe Supervisory Board appoints the members of the Board of Execu tive Directors and supervises and advises the Board on management issues. As members of the Supervisory Board cannot simultaneously be members of the Board of Executive Direc tors, a high level of autonomy is already structurally ensured with regard to the supervision of the Board of Executive Directors. Together with the SE Council Regulation, the Statutes of BASF SE and the Agreement Concerning the Involvement of Employees in BASF SE (Employee Participation Agreement) constitute the relevant legal basis for the size and composition of the Supervisory Board. The German Codetermination Act does not apply to BASF as a European stock corporation (Socie-tas Europaea, SE). The Supervisory Board of BASF SE comprises twelve members. Six members are elected by the shareholders at the Annual Shareholders’ Meeting. The remaining six members are elected by the BASF Europa Betriebsrat (European Works Council), the European employee representation body of the BASF Group. Resolutions of the Supervisory Board are passed by a simple majority vote of the participating members. In the event of a tie, the vote of the Chairman of the Supervisory Board, who must always be a shareholder representative, shall be the casting vote. This resolution process is also applicable for the appointment and dismissal of members of the Board of Executive Directors by the Supervisory Board. BASF SE’s Supervisory Board has established a total of three Supervisory Board Committees: the Personnel Committee, the Audit Committee and the Nomination Committee.
For more on the Statutes of BASF SE and the Employee Participation Agreement, see basf.com/investor/cg_e
The members of the Supervisory Board of BASF SE, including their membership on the supervisory bodies of other companies, are listed on page 130. Compensation of the Supervisory Board is described in detail in the Compensation Report on pages 134 and 135
Personnel Committee – Chairman: Dr. h. c. Eggert Voscherau – Members: Michael Diekmann, Robert Oswald, Michael VassiliadisDuties– Prepares the appointment of members to the Board of
Executive Directors by the Supervisory Board as well as the employment contracts to be entered into with members of the Board of Executive Directors
– When making recommendations for appointments to the Board of Executive Directors, considers professional qualifi-cations, international experience and leadership skills as well as long-term succession planning, diversity, and especially the appropriate consideration of women
– Prepares the resolutions made by the Supervisory Board with regard to the system and determination of the amount of com-pensation paid to members of the Board of Executive Directors
Audit Committee – Chairman: Max Dietrich Kley– Members: Ralf-Gerd Bastian, Franz Fehrenbach, Michael
VassiliadisDuties– Prepares the negotiations and resolutions of the Supervisory
Board for the approval of the Financial Statements and Consolidated Financial Statements, and discusses the quarterly and first-half financial reports with the Board of Executive Directors prior to their publication
– Deals with monitoring the financial reporting process, the annual audit, the effectiveness of the internal control system, the risk management system, and the internal auditing system as well as compliance issues
– Is responsible for business relations with the company’s external auditor: prepares the Supervisory Board’s proposal to the Shareholders’ Meeting regarding the selection of an auditor, monitors the auditor’s independence, defines the focus areas of the audit together with the auditor, negotiates auditing fees and establishes the conditions for the provision of the auditor’s non-audit services
– Is authorized to request any information that it deems neces-sary from the auditor or Board of Executive Directors; can also view all of BASF’s business documents and examine these and all other assets belonging to BASF. The Audit Committee can also engage experts such as auditors or lawyers to carry out these inspections.
Nomination Committee– Members: Dr. h. c. Eggert Voscherau, Prof. Dr. François
Diederich, Michael Diekmann, Franz Fehrenbach, Max Dietrich Kley, Anke Schäferkordt
Duties– Identifies suitable candidates for the Supervisory Board based
on objectives for the composition decided on by the Supervi-sory Board
– Prepares the recommendations made by the Supervisory Board for the election of Supervisory Board members for the Shareholders’ Meeting

Corporate governance report BASF Report 2013Corporate Governance124
Objectives for the composition of the Supervisory BoardOne important concern of good corporate governance is to ensure that seats on the responsible corporate bodies, the Board of Executive Directors and the Supervisory Board, are appropri-ately filled. The criteria comprise professional and personal qual-ifications, the diversity of the members and the independence of the Supervisory Board. Seats on the Board of Executive Direc-tors and Supervisory Board should be filled with members who ensure a well-balanced consideration of all the knowledge, skills and personal qualifications necessary to manage and supervise BASF as a large, globally operating, capital market-oriented com-pany in the chemical industry.
On October 21, 2010, the Supervisory Board agreed upon objec-tives for the composition of the Supervisory Board in accordance with Section 5.4.1 of the German Corporate Governance Code; in its meeting of December 20, 2012, an objective was added for the number of independent Supervisory Board members. According to these objectives, the Supervisory Board shall be composed in such a way that the members as a group possess knowledge, ability and expert experience
– In the management of an internationally operating company, – In cross-industry value creation along different value chains, – In the application of accounting principles and internal control procedures, and
– In the field of technical and scientific innovations in the chem-ical sector and associated industries as well as in the sectors using chemical products.
With regard to diversity, the Supervisory Board shall consider a vari ety of professional and international experience as well as the participation of women. At least two women shall belong to the Super visory Board. With regard to independence, the Supervisory Board aims to ensure that all Supervisory Board members are inde-pendent as defined by the terms of the Code. Individuals who may have a conflict of interest shall not be nominated for election to the Supervisory Board. The same applies to candidates who will have reached the age of 70 by the day of the election. There are currently two women on the Supervisory Board. We are committed to further increasing the proportion of women at the next scheduled election to the Supervisory Board at the Annual Shareholders’ Meeting on May 2, 2014. In assessing indepen-dence, the Supervisory Board assumes that neither election as an employee representative, nor membership on the Board of Exec-utive Directors more than two years in the past, taken together or in isolation, precludes the classification as independent. On this basis, the Supervisory Board has determined that all of its current members can be considered independent. We firmly believe the current formation of the Supervisory Board fulfills the objectives agreed on by the Supervisory Board regarding its composition.
Shareholders’ rights Shareholders exercise their rights of co-administration and super vision at the Annual Shareholders’ Meeting. The Annual Shareholders’ Meeting elects half of the members of the Super-visory Board and, in particular, decides on the formal discharge of the Board of Executive Directors and the Supervisory Board, the distribution of profits, capital measures, the authorization of share buybacks, changes to the Statutes and the selection of the auditor. Each BASF SE share represents one vote. All of BASF SE’s shares are registered shares. Shareholders are obliged to have themselves entered with their shares into the company share register and to provide the information necessary for registra-tion in the share register according to the German Stock Corporation Act. There are no registration restrictions and there is no limit to the number of shares that can be registered to one shareholder. Only the persons listed in the share register are entitled to vote as shareholders. Listed shareholders may exercise their voting rights at the Annual Shareholders’ Meeting either personally, through a representative of their choice or through a company-appointed proxy authorized by the share-holders to vote according to their instructions. There are neither voting caps to limit the number of votes a shareholder may cast nor special voting rights. BASF has fully implemented the prin-ciple of “one share, one vote.” All shareholders entered in the share register are entitled to participate in the Annual Shareholders’ Meetings, to have their say concerning any item on the agenda and to request informa-tion about company issues insofar as this is necessary to make an informed judgment about the item on the agenda under dis-cussion. Registered shareholders are also entitled to file motions pertaining to proposals for resolutions made by the Board of Executive Directors and Supervisory Board at the Annual Share-holders’ Meeting and to contest resolutions of the Sharehold-ers’ Meeting and have them evaluated for their lawfulness in court. Shareholders who hold at least €100,000 of the compa-ny’s share capital, a quota corresponding to 78,125 shares, are furthermore entitled to request that additional items be added to the agenda of the Annual Shareholders’ Meeting.

Corporate governance report Corporate GovernanceBASF Report 2013 125
Implementation of the German Corporate Governance Code BASF supports the German Corporate Governance Code, which is regarded as an important tool in the capital market- focused continuing development of corporate governance and control, and advocates responsible corporate governance that focuses on sustainably increasing the value of the company. BASF SE follows all recommendations of the German Corporate Governance Code in its most recently revised version of May 2013. This also applies to the Code’s new recommendations regarding compensation of the Board of Executive Directors. The new recommendations regarding transparency in the compensation of the Board of Executive Directors, however, will first need to be applied in the 2014 reporting year. In the same manner, BASF has followed nearly all of the non-obligatory suggestions of the German Corporate Gover-nance Code. We have not implemented the suggestion to enable shareholders to follow the proceedings of the entire Annual Shareholders’ Meeting online. The Annual Sharehold-ers’ Meeting is publicly accessible via online broadcast until the end of the speech by the Chairman of the Board of Executive Directors. The subsequent discussion of items on the agenda is not accessible online in order to preserve the character of the Annual Shareholders’ Meeting as a meeting attended by our shareholders on-site.
The joint Declaration of Conformity 2013 by the Board of Executive Directors and Supervisory Board of BASF SE is rendered on page 140
For more on the Declaration of Conformity 2013, the implementation of the Code’s suggestions and the German Corporate Governance Code, see basf.com/governance_e
Disclosure according to Section 315(4) of the German Commercial Code and the explanatory report of the Board of Executive Directors according to Section 176(1) Sentence 1 of the German Stock Corporation ActAs of December 31, 2013, the subscribed capital of BASF SE was €1,175,652,728.32, divided into 918,478,694 registered shares with no par value. Each share entitles the holder to one vote at the Annual Shareholders’ Meeting. Restrictions on the right to vote or transfer shares do not exist. The same rights and duties apply to all shares. According to the Statutes, share-holders are not entitled to receive share certificates. There are neither different classes of shares nor shares with preferential voting rights (golden shares). The appointment and dismissal of members of the Board of Executive Directors is legally governed by the regulations in Article 39 of the SE Council Regulation, Section 16 of the SE Implementation Act and Sections 84, 85 of the German Stock Corporation Act, as well as Article 7 of the BASF SE Statutes. Accordingly, the Supervisory Board determines the number of members of the Board of Executive Directors (at least two), appoints the members of the Board of Executive Directors, and can nominate a chairperson, as well as one or more vice- chairpersons. The members of the Board of Executive Directors are appointed for a maximum of five years, and reappointments are permissible. The Supervisory Board can dismiss a member of the Board of Executive Directors if there is serious cause to do so. Serious cause includes, in particular, a gross breach of the duties pertaining to the Board of Executive Directors and a vote of no confidence at the Annual Shareholders’ Meeting. The Supervisory Board decides on appointments and dismissals according to its own best judgment. According to Article 59(1) SE Council Regulation, amend-ments to the Statutes of BASF SE require a resolution of the Annual Shareholders’ Meeting adopted with at least a two-thirds majority of the votes cast, provided that the legal provisions applicable to German stock corporations under the German Stock Corporation Act do not stipulate or allow for larger majority requirements. In the case of amendments to the Stat-utes, the Section 179(2) of the German Stock Corporation Act requires a majority of at least three-quarters of the subscribed capital represented. Pursuant to Article 12(6) of the Statutes of BASF SE, the Supervisory Board is authorized to resolve upon amendments to the Statutes that merely concern their wording. This applies in particular to the adjustment of the share capital and the number of shares after the redemption of repurchased BASF shares and after a new issue of shares from the autho-rized capital. Until April 30, 2014, the Board of Executive Directors of BASF SE is empowered by a resolution passed at the Annual Shareholders’ Meeting of April 30, 2009, to increase the subscribed capital – with the approval of the Supervisory Board

Corporate governance report BASF Report 2013Corporate Governance126
– by a total amount of €500 million through the issue of new shares (authorized capital). A right to subscribe to the new shares shall be granted to shareholders. This can also be done by a credit institution acquiring the new shares with the obliga-tion to offer these to shareholders (indirect subscription right). The Board of Executive Directors is authorized to exclude the statutory subscription right of shareholders in certain exceptional cases that are narrowly defined in Section 5(8) of the BASF SE Statutes. This applies in particular if, for capital increases in return for cash contributions, the issue price of the new shares is not substantially lower than the stock market price of BASF shares and the total number of shares issued under this authorization is not more than 10% of the subscribed capi-tal on the date of issue. At the Annual Shareholders’ Meeting on April 27, 2012, the Board of Executive Directors was authorized to purchase up to 10% of the shares existing at the time of the resolution (10% of the company’s share capital) until April 26, 2017. At the discre-tion of the Board of Executive Directors, the purchase can take place on the stock exchange or by way of a public purchase offer directed to all shareholders. The Board of Executive Direc-tors is authorized to sell the repurchased company shares (a) through a stock exchange, (b) through a public offer directed to all shareholders and – with the approval of the Supervisory Board – to third parties, (c) for a cash payment that is not significantly lower than the stock exchange price at the time of sale and (d) for contributions in kind, particularly in connection with the acquisition of companies, parts of companies or shares in companies or in connection with mergers. In the cases speci-fied under (c) and (d), the shareholders’ subscription right is excluded. The Board of Executive Directors is furthermore authorized to redeem the shares bought back and to reduce the share capital by the proportion of the share capital accounted for by the redeemed shares. Bonds issued by BASF SE grant the bearer the right to request early repayment of the bonds at nominal value if one person – or several persons acting in concert – hold or acquire a BASF SE share volume after the time of issuance which corresponds to more than 50% of the voting rights (change of control), and one of the rating agencies named in the bond’s terms and conditions withdraws its rating of BASF SE or the bond, or reduces it to a noninvestment grade rating within 120 days after the change-of-control event. In the event of a change of control, members of the Board of Executive Directors shall, under certain additional conditions, receive compensation (details of which are listed in the Com-pensation Report on page 134). A change of control is assumed when a shareholder informs BASF of a shareholding of at least 25% or the increase of such a holding. In addition, employees of BASF SE and its subsidiaries who are classed as senior execu tives will receive a severance payment if their contract of employment is terminated by BASF within 18 months of the occur rence of a change of control, provided the employee has
not given cause for the termination. The employee whose service contract has been terminated in such a case will receive a maximum severance payment of 1.5 times the annual salary (fixed component) depending on the number of months that have passed since the change-of-control event. The remaining specifications stipulated in Section 315(4) of the German Commercial Code refer to situations that are not applicable to BASF SE.
For more on bonds issued by BASF SE, see basf.com/investor/bonds_e
Directors’ and Officers’ liability insurance BASF SE has taken out liability insurance that covers the activities of members of the Board of Executive Directors and the Supervisory Board (D&O insurance). This policy provides for the level of deductibles for the Board of Executive Directors as prescribed by Section 93(2)3 of the German Stock Corporation Act and for the level of deductibles for the Supervisory Board as recommended in Section 3.8(3) of the German Corporate Governance Code.
Share ownership by Members of the Board of Executive Directors and the Supervisory Board No member of the Board of Executive Directors or the Supervi-sory Board owns shares in BASF SE and related options or other derivatives that account for 1% or more of the share capital. Furthermore, the total volume of BASF SE shares and related financial instruments held by members of the Board of Execu-tive Directors and the Supervisory Board accounts for less than 1% of the shares issued by the company.
Share dealings of the Board of Executive Directors and Supervisory Board (Directors’ Dealings under Section 15a of German Securities Trading Act) In accordance with Section 15a of the German Securities Trading Act (Wertpapierhandelsgesetz), all members of the Board of Executive Directors and the Supervisory Board as well as certain members of their families are required to disclose the purchase or sale of BASF shares and other related rights to the Federal Financial Supervisory Authority (Bundesanstalt für Finanzdienstleistungsaufsicht) and to the company if transac-tions within the calendar year exceed the threshold of €5,000. In 2013, a total of nine purchases and one disposal by mem-bers of the Board of Executive Directors and the Supervisory Board and members of their families subject to disclosure were reported as Directors’ Dealings, involving between 100 and 5,500 BASF shares. The price per share was between €65.00 and €78.30. The volume of the individual trades was between €7,006.00 and €412,500.00. The disclosed share transactions are published on the website of BASF SE.
For more on directors’ dealings in 2013, see basf.com/governance/sharedealings_e

Compliance Corporate GovernanceBASF Report 2013 127
Our Group-wide Compliance Program aims to ensure adherence to legal regulations and the company’s internal guidelines. We have integrated compliance into our “We create chemistry” strategy. Our employee Code of Conduct firmly embeds these mandatory standards into day-to-day business. Members of the Board of Executive Directors are also expressly obligated to follow these principles.
Based on international standards, BASF’s Compliance Program combines important laws and company policies regulating the behavior of all BASF employees in working with business partners, officials, colleagues and society. The uniform Code of Conduct, updated in 2013, merges previous behavioral guide-lines and now also covers human rights, labor and social standards, and conflicts of interest. These issues had previously been regulated by voluntary commitments as well as internal guidelines. We have also increased our focus on protecting data privacy by adding the issue to our global Code of Conduct. Our efforts are principally aimed at preventing violations from the outset. To this end, all employees are required within a prescribed time frame to take part in basic compliance training, refresher courses and special tutorials dealing with, for example, antitrust law or trade control regulations. In 2013, more than 47,000 employees worldwide took part in a total of around 62,000 hours of compliance training.
Compliance
We particularly encourage our employees to actively and promptly seek guidance if in doubt. For this, they can consult not only their managers but also numerous specialist depart-ments and company compliance officers. We have also set up 50 external hotlines worldwide which our employees can turn to anonymously. All reported incidents are investigated by our experts. We make sure that all concerns are processed within a determined time frame. BASF’s Chief Compliance Officer (CCO) manages the implementation of our compliance management system, supported by more than 100 compliance officers worldwide. The CCO regularly reports to the Board of Executive Directors on progress in the program’s implementation as well as on any significant findings. Furthermore, the CCO reports to the Super-visory Board’s Audit Committee in at least one of its meetings each year on the status of the Compliance Program as well as any major developments. In the event of significant incidents, the Audit Committee is immediately informed by the Board of Executive Directors. BASF’s Corporate Audit department monitors adherence to compliance principles, covering all areas in which compliance violations could occur. They investigate whether employees adhere to regulations and make sure that the established processes, procedures and monitoring tools are appropriate and sufficient to minimize potential risk or preclude violations in the first place. In 2013, 111 Group-wide audits of this kind were
BASF’s Code of ConductOur actions are based on behavior compliant with the Code, which comprises important laws as well as company-internal regulations.
Money Laundering
Human Rights, Labor and Social Standards
Protection of Environment, Health and Safety
Antitrust Laws
Corruption
Gifts and Entertainment
Protection of Company Property and Property of Business Partners
Conflicts of Interest Information Protection and Insider Trading Laws
Protection of Data Privacy
Imports and Exports

Compliance BASF Report 2013Corporate Governance128
performed (2012: 92), predominantly in the areas of antitrust law, imports and exports, and gifts and entertainment. If violations occur despite preventive measures, we investigate and rectify these immediately. In 2013, 304 calls and emails were received by our exter-nal hotlines (2012: 308). Concerns involved topics ranging from questions on personnel management and handling of company property to information on the behavior of business partners. We launch an investigation into all cases of suspected miscon-duct that we become aware of. Confirmed violations are penal-ized and can lead to dismissal. In doing so, we make sure to take necessary action in accordance with consistent company criteria. If necessary, a notification is sent to the appropriate autho rity. It is becoming increasingly important to investigate our busi-ness partners in terms of adherence to corporate governance and compliance standards. This is especially the case in eval-uating our suppliers; we have intensified our activities in this area. Even outside of our company, we support the respect of human rights and the fight against corruption: We are a founding member of the United Nations Global Compact, and are committed to our responsibility in accordance with the U.N. Guiding Principles on Business and Human Rights. As a member of Transparency International Deutschland and the Partnering Against Corruption Initiative (PACI) of the World Economic Forum, we assist in the implementation of these organizations’ objectives. As a member of the U.N. Global Compact LEAD, we report in accordance with the Blueprint for Corporate Sustainability Leadership. This action plan comprises concrete measures to support the U.N. Millennium Development Goals, addressing topics such as transparency and stakeholder engagement.
Abiding by compliance standards is part of responsible leader-ship. This has been expressly embedded in our values, where we state: “We strictly adhere to our compliance standards.” We are convinced that compliance with these standards will not only avoid the disadvantages associated with violations, such as fines. We see compliance as the right way ahead to secure our company’s long-term success.
For more on the BASF Code of Conduct, see basf.com/code_of_conduct
For more on human rights, labor and social standards, see page 44 and basf.com/human_rights
For more on our supply chain management, see page 90
,

Management and Supervisory Boards Corporate GovernanceBASF Report 2013 129
Management and Supervisory Boards
Board of Executive DirectorsThere were eight members on the Board of Executive Directors of BASF SE as of December 31, 2013.
Dr. Andreas KreimeyerDegree: Biology; 58 years old; 28 years at BASF
Responsibilities: Crop Protection; Coatings; Biological & Effect Systems Research; BASF Plant Science; BASF New Business; Region South America
First appointed: 2003 Term expires: 2015
Internal memberships as defined in Section 100(2) of the German Stock Corporation Act: BASF Coatings GmbH (Chairman of the Supervisory Board)
Dr. Harald SchwagerChemistry; 53 years old; 26 years at BASF
Responsibilities: Oil & Gas; Construction Chemicals; Procurement; Region Europe
First appointed: 2008 Term expires: 2016
Internal memberships as defined in Section 100(2) of the German Stock Corporation Act: Wintershall Holding GmbH (Chairman of the Supervisory Board) Wintershall AG (Chairman of the Supervisory Board)
Comparable German and non-German controlling bodies: Nord Stream AG (member of the Shareholders’ Committee) South Stream Transport Services AG (member of the Administrative Council until June 30, 2013) South Stream Transport B.V. (member of the Board of Directors)
Wayne T. Smith Degrees: Chemical Engineering, Business Administration (MBA); 53 years old; 10 years at BASF
Responsibilities: Petrochemicals; Monomers; Intermediates; Process Research & Chemical Engineering
First appointed: 2012 Term expires: 2015
Margret SuckaleDegrees: Law, Business Administration (MBA); 57 years old; 5 years at BASF
Responsibilities: Engineering & Maintenance; Environment, Health & Safety; European Site & Verbund Management; Human Resources
First appointed: 2011 Term expires: 2017
Comparable German and non-German controlling bodies: BASF Antwerpen N.V. (Chairwoman of the Administrative Council)
Dr. Kurt BockChairman of the Board of Executive Directors Degree: Business Administration; 55 years old; 23 years at BASF
Responsibilities: Legal, Taxes & Insurance; Strategic Planning & Controlling; Communications & Government Relations; Global Executive Human Resources; Investor Relations; Compliance
First appointed: 2003 Term expires: 2016
Dr. Martin BrudermüllerVice Chairman of the Board of Executive Directors Degree: Chemistry; 52 years old; 26 years at BASF
Responsibilities: Performance Materials; Greater China & Functions Asia Pacific; South & East Asia, ASEAN and Australia/New Zealand; Corporate Technology & Operational Excellence
First appointed: 2006 Term expires: 2016
Comparable German and non-German controlling bodies: Styrolution Holding GmbH (Vice Chairman of the Advisory Board)
Dr. Hans-Ulrich EngelDegree: Law; 54 years old; 26 years at BASF
Responsibilities: Finance; Catalysts; Corporate Controlling; Corporate Audit; Information Services & Supply Chain Operations; Market & Business Development North America; Regional Functions North America
First appointed: 2008 Term expires: 2016
Internal memberships as defined in Section 100(2) of the German Stock Corporation Act: BASF Personal Care and Nutrition GmbH (member of the Supervisory Board until August 30, 2013)
Michael HeinzDegree: Business Administration (MBA); 49 years old; 30 years at BASF
Responsibilities: Dispersions & Pigments; Care Chemicals; Nutrition & Health; Paper Chemicals; Performance Chemicals; Advanced Materials & Systems Research; Perspectives
First appointed: 2011 Term expires: 2019
Internal memberships as defined in Section 100(2) of the German Stock Corporation Act: BASF Coatings GmbH (member of the Supervisory Board) BASF Personal Care and Nutrition GmbH (Chairman of the Supervisory Board until August 30, 2013)

Management and Supervisory Boards BASF Report 2013Corporate Governance130
Dr. h.c. Eggert Voscherau, Wachenheim, Germany
Chairman of the Supervisory Board of BASF SE
Former Vice Chairman of the Board of Executive Directors of BASF SE
Comparable German and non-German controlling bodies: Zentrum für Europäische Wirtschaftsforschung GmbH (Centre for European Economic Research) (ZEW) (Vice Chairman of the Supervisory Board)
Michael Diekmann, Munich, Germany
Vice Chairman of the Supervisory Board of BASF SE
Chairman of the Board of Management of Allianz SE
Supervisory Board memberships (excluding internal memberships): Linde AG (Vice Chairman) Siemens AG (member)
Internal memberships as defined in Section 100(2) of the German Stock Corporation Act: Allianz Deutschland AG (member of the Supervisory Board) Allianz Asset Management AG (Chairman of the Supervisory Board)
Comparable German and non-German controlling bodies: Allianz France S.A. (Vice Chairman of the Administrative Council) Allianz S.p.A. (member of the Administrative Council)
Robert Oswald, Altrip, Germany
Vice Chairman of the Supervisory Board of BASF SE
Chairman of the Works Council of the Ludwigshafen site of BASF SE and Chairman of the Joint Works Council of the BASF Group
Ralf-Gerd Bastian, Neuhofen, Germany
Member of the Works Council of the Ludwigshafen site of BASF SE
Wolfgang Daniel, Heidelberg, Germany
Vice Chairman of the Works Council of the Ludwigshafen site of BASF SE
Prof. Dr. François Diederich, Zurich, Switzerland
Professor at the Swiss Federal Institute of Technology, Zurich
Franz Fehrenbach, Stuttgart, Germany
Chairman of the Supervisory Board of Robert Bosch GmbH
Supervisory Board memberships (excluding internal memberships): Stihl AG (Vice Chairman) Linde AG (member since May 29, 2013)
Comparable German and non-German controlling bodies: Robert Bosch Corporation (member of the Board of Directors) Stihl Holding AG & Co. KG (member of the Advisory Board)
Max Dietrich Kley, Heidelberg, Germany
Lawyer
Supervisory Board memberships (excluding internal memberships): SGL Carbon SE (Chairman until April 30, 2013) HeidelbergCement AG (member)
Anke Schäferkordt, Cologne, Germany
Member of the Executive Board of Bertelsmann SE & Co. KGaA Co-CEO of RTL Group S.A. Chief Executive Officer of RTL Television GmbH
Supervisory Board memberships (excluding internal memberships): Software AG (member)
Denise Schellemans, Brecht, Belgium
Full-time trade union delegate
Ralf Sikorski, Wiesbaden, Germany
Member of the Central Board of Executive Directors of the Mining, Chemical and Energy Industries Union
Supervisory Board memberships (excluding internal memberships): Villeroy & Boch AG (member) Villeroy & Boch Fliesen GmbH (member) Steag Power Saar GmbH (Vice Chairman) Steag New Energies GmbH (Vice Chairman) KSBG Kommunale Verwaltungsgesellschaft mbH (Vice Chairman) RWE Generation SE (member)
Michael Vassiliadis, Hannover, Germany
Chairman of the Mining, Chemical and Energy Industries Union
Supervisory Board memberships (excluding internal memberships): K+S Aktiengesellschaft (Vice Chairman) Henkel AG & Co. KGaA (member until April 15, 2013) Steag GmbH (Vice Chairman) Evonik Industries AG (Vice Chairman)
The Supervisory Board consists of shareholder and employee repre sentatives; seats on the Board are accorded following the principle of parity. The six shareholder representatives are elected by the Annual Shareholders’ Meeting, and the six employee rep-resentatives are appointed by the employee representative body, the BASF Europa Betriebsrat (European Works Council). The term of office of the Supervisory Board commenced following the Annual Shareholders’ Meeting on April 30, 2009, in which the shareholder representatives on the Supervisory Board were elected. It termi-nates upon conclusion of the Annual Shareholders’ Meeting, which resolves on the discharge of members of the Supervisory Board for the fourth complete financial year after the term of office com-menced; this is the Annual Shareholders’ Meeting on May 2, 2014. The Supervisory Board comprises the following members:
Supervisory BoardIn accordance with the Statutes, the Supervisory Board of BASF SE comprises twelve members.

Compensation report Corporate GovernanceBASF Report 2013 131
Compensation report
This report outlines the main principles of the compen-sation for the Board of Executive Directors and discloses the amount and structure of the compensation of each Board member. Furthermore, it provides information on end-of-service undertakings with respect to Board members, as well as information on the compensation of Supervisory Board members.
Compensation of the Board of Executive DirectorsThis report meets the disclosure requirements of the German Commercial Code, supplemented by the additional require-ments based on the German Act on Disclosure of Management Board Remuneration (Vorstandsvergütungs-Offenlegungs- gesetz) as well as the German Act on the Appropriateness of Management Board Remuneration (Gesetz zur Angemessen-heit der Vorstandsvergütung), and is aligned with the recom-mendations of the German Corporate Governance Code as amended on May 13, 2013. Based on a proposal by the Personnel Committee, the Supervisory Board determines the amount and structure of compensation of members of the Board of Executive Directors. The amount of compensation is determined by the company’s size, complexity and financial position, as well as the perfor-mance of the Board of Executive Directors. Internal and exter-nal appropriateness of the Board’s compensation is reviewed by external auditors on a regular basis. Globally operating companies based in Europe serve as an external reference. For internal comparison, compensation is considered in total as well as over time, especially for senior executives.
For more on the Supervisory Board and its committees, see page 130 and from page 137 onward
PrinciplesThe compensation of the Board of Executive Directors is designed to promote sustainable corporate development. It is marked by a pronounced variability in relation to the performance of the Board of Executive Directors and BASF Group’s return on assets.
The compensation of the Board of Executive Directors comprises:1. A fixed salary,2. Annual variable compensation (variable bonus),3. A share-price-based, long-term incentive (LTI) program,4. Nonmonetary compensation and other additional compensation, and5. Company pension benefits.
The compensation components are shown in detail below:
1. The fixed salary is a set amount of yearly compensation paid out in even installments. It is regularly reviewed by the Supervisory Board and adjusted, if necessary.
2. The annual variable compensation (variable bonus) is based on the performance of the entire Board and the return on assets. The return on assets is also used to determine the variable compensation of all other employee groups. In order to assess the sustainable performance of the Board of Executive Directors, each year the Supervisory Board sets a target agreement with the entire Board of Executive Direc-tors that primarily contains medium and long-term goals. The Supervisory Board assesses the goal achievement of the current year and the previous two years. A performance factor with a value between 0 and 1.5 is determined on the basis of the goal achievement ascertained by the Super- visory Board. The variable bonus for the prior fiscal year is payable after the Annual Shareholders’ Meeting. Board members, like other employee groups, may contrib-ute a portion of their annual variable bonus into a deferred compensation program. For members of the Board of Executive Directors, as well as for all other senior executives of the German BASF Group, the maximum amount that can be contributed to this program is €30,000. Board members have taken advantage of this offer to varying degrees.
3. A share-price-based, long-term incentive program (the LTI program) exists for members of the Board of Executive Directors. It is also offered to all other senior executives of BASF Group. Members of the Board of Executive Directors are subject to a stricter set of rules than are contained in the general program conditions: They are required to participate in the program with at least 10% of their variable bonus. This mandatory investment consisting of BASF shares is subject to a holding period of four years. For any additional voluntary investment of up to 20% of the variable bonus, the general holding period of two years applies. Members of the Board of Executive Directors may only exercise their options at least four years after they have been granted (vesting period). This compensation component is limited by the structure of the LTI program as well as by the upper limit on the options’ exercise value.
For more on share ownership by members of the Board of Executive Directors, see page 126
For more on the LTI progam, see page 43 and page 210

Compensation report BASF Report 2013Corporate Governance132
4. Included in nonmonetary compensation and other addi -tional compensation are the following: delegation allowances, accident insurance premiums and other similar bene fits, and the personal use of, or benefit from, communication equipment, means of transport and security measures made available by the company. The members of the Board did not receive loans or advances from the company in 2013. The members of the Board are covered by loss liability insurance concluded by the company (D&O insurance) which includes a deductible.
For more on the D&O insurance of the Board of Executive Directors, see page 126
5. As part of the pension benefits granted to the Board of Execu-tive Directors (“Board Performance Pension”), company pension benefits are intended to accrue annual pension units. The method used to determine the amount of the pen-sion benefits generally corresponds to that used for the other senior executives of the German BASF Group. The method is designed such that both the performance of the company and the progression of the individual Board member’s career significantly affect the pension entitlement. The annual pension benefits accruing to Board members in a given reporting year (pension unit) are composed of a fixed and a variable component. The fixed component is calculated by multiplying the annual fixed compensation above the Social Security Contribution Ceiling by 32% (contribution factor). The variable component of the pension unit is the result of multiplying the fixed component with a factor that is dependent on the return on assets in the report-ing year and the performance factor, which is also decisive for the bonus. The amount resulting from the fixed and the variable component is converted into a pension unit (lifelong pension) using actuarial factors based on an actuarial interest rate (5%), the probability of death, invalidity and bereavement (Heubeck Richttafeln, 2005G) and an assumed pension increase (at least 1.0% per annum).
The sum of the pension units accumulated over the report-ing years determines the respective Board member’s pension benefit in the event of a claim. This is the amount that is payable upon retirement. Pension benefits take effect at the end of service after completion of the member’s 60th year of age, or on account of disability or death. Pension payments are reviewed on a regular basis and adjusted by at least 1.0% each year. The pension units also include survivor benefits. Upon the death of an active or former member of the Board, the surviving spouse receives a survivor pension amounting to 60% of the Board member’s pension entitlement. The orphan pension amounts to 10% for each half-orphan, 33% for an orphan, 25% each for two orphans and 20% each for three or more orphans of the pension entitlement of the deceased (former) Board member. Total survivor benefits may not exceed 75% of the Board member’s pension entitlement. If the survivor pensions exceed the upper limit, they will be proportionately reduced. Board members are members of the BASF Pensionskasse VVaG, as are generally all employees of BASF SE. Contri- butions and benefits are determined by the Statutes of the BASF Pensionskasse VVaG and the General Conditions of Insurance.

Compensation report Corporate GovernanceBASF Report 2013 133
Total compensation of the Board of Executive Directors (thousand €)
Non-performance-related
Perfor-mance-related Options granted
YearFixed
salary
Non-monetary compen-
sation and other additional compen-
sationVariable bonus1
Total cash compensa-
tion Number
Market value at
option grant date2
Total compen-sation (cash
compensation plus options
granted)
Dr. Kurt Bock Chairman
2013 1,200 124 2,794 4,118 54,240 1,282 5,400
2012 1,200 142 3,174 4,516 56,004 770 5,286
Dr. Martin BrudermüllerVice Chairman
2013 7983 5714 1,858 3,227 36,072 852 4,079
2012 8683 7194 2,111 3,698 41,184 566 4,264
Dr. Hans-Ulrich Engel 2013 5553 8144 1,397 2,766 27,120 641 3,407
2012 5883 7734 1,587 2,948 33,876 466 3,414
Michael Heinz 2013 600 125 1,397 2,122 27,120 641 2,763
2012 600 335 1,587 2,522 25,860 355 2,877
Dr. Andreas Kreimeyer 2013 600 97 1,397 2,094 27,120 641 2,735
2012 600 93 1,587 2,280 33,876 466 2,746
Dr. Harald Schwager 2013 600 160 1,397 2,157 27,120 641 2,798
2012 600 104 1,587 2,291 33,876 466 2,757
Wayne T. Smith (since April 27, 2012)
2013 600 4754 1,397 2,472 21,276 503 2,975
2012 375 3144 1,076 1,765 10,748 148 1,913
Margret Suckale 2013 600 76 1,397 2,073 10,880 257 2,330
2012 600 139 1,587 2,326 26,092 359 2,685
Total 2013 5,553 2,442 13,034 21,029 230,948 5,458 26,487
Total 2012 5,6295 2,6505 14,8125 23,0915 289,4685 3,9805 27,0715
1 The basis for the variable bonus is the return on assets adjusted for special items and the performance factor. This includes contributions made to the deferred compensation program.
2 Fair values reported in 2013 for options granted are based on the binomial model (previous year: Monte Carlo Simulation). Had this binomial model been applied to calculate the fair value of option rights granted in 2012, the results would have been as follows: Dr. Kurt Bock €1,200 thousand, Dr. Martin Brudermüller €883 thousand, Dr. Hans-Ulrich Engel €726 thousand, Michael Heinz €554 thousand, Dr. Andreas Kreimeyer €726 thousand, Dr. Harald Schwager €726 thousand, Wayne T. Smith €230 thousand, and Margret Suckale €559 thousand.
3 Payment is made in local currency based on a theoretical net salary in Germany.4 Includes payments to cover additional costs of transfers, such as assumption of prevailing local rental fees5 Prior-year figures include compensation for a member who left the Board of Executive Directors in 2012.
Based on the principles listed above, individual Board members received the following compensation:
The options granted resulted in an expense in 2013. This person-nel expense refers to the sum of all options from the LTI programs 2005 to 2013. It is calculated as the difference in the value of the options on December 31, 2013, compared with the value on Decem ber 31, 2012, considering the options exercised and granted in 2013. The value of the options is based primarily on the development of the BASF share price and its outperformance compared with the benchmark indices specified for the LTI pro-grams 2005 to 2013. The personnel expenses reported below are purely account-ing figures which do not equate with the actual cash gains should options be exercised. Each member of the Board may decide on the timing and scope of the exercise of options of the individual
years, while taking into account the general terms and conditions and ceilings of the LTI program. The personnel expenses for the year 2013 relating to all options issued were as follows: Dr. Kurt Bock €1,870 thousand (2012: €4,525 thousand); Dr. Martin Brudermüller €1,773 thou-sand (2012: €5,355 thousand); Dr. Hans-Ulrich Engel €1,593 thou-sand (2012: €3,741 thousand); Michael Heinz €477 thousand (2012: €1,661 thousand); Dr. Andreas Kreimeyer €1,477 thousand (2012: €3,134 thousand); Dr. Harald Schwager €1,716 thousand (2012: €3,839 thousand); Wayne T. Smith €312 thousand (2012: €698 thousand); and Margret Suckale €390 thousand (2012: €532 thousand).
For more on the LTI progam, see page 43 and page 210 onward

Compensation report BASF Report 2013Corporate Governance134
Pension benefitsThe service cost attributable to 2013 include costs for BASF Pensionskasse VVaG as well as for the Performance Pension and are as follows: Dr. Kurt Bock €943 thousand (2012: €818 thousand); Dr. Martin Brudermüller €679 thousand (2012: €570 thousand); Dr. Hans-Ulrich Engel €545 thousand (2012: €462 thousand); Michael Heinz €520 thousand (2012: €418 thou-sand); Dr. Andreas Kreimeyer €534 thousand (2012: €476 thou-sand); Dr. Harald Schwager €523 thousand (2012: €441 thou-sand); Wayne T. Smith €546 thousand (2012: €318 thousand); and Margret Suckale €442 thousand (2012: €408 thousand). The present value of pension benefits (defined benefit obligation) is an accounting figure for the entitlements that the Board members have accumulated in their years of service at BASF. The defined benefit obligations up to and including 2013 are as follows: Dr. Kurt Bock €13,154 thousand (2012: €13,083 thousand); Dr. Martin Brudermüller €9,070 thousand (2012: €8,991 thousand); Dr. Hans-Ulrich Engel €7,165 thousand (2012: €7,018 thousand); Michael Heinz €5,313 thousand (2012: €5,246 thousand); Dr. Andreas Kreimeyer €11,275 thousand (2012: €11,081 thousand); Dr. Harald Schwager €6,707 thou-sand (2012: €6,596 thousand); Wayne T. Smith €935 thousand (2012: €488 thousand); and Margret Suckale €2,148 thousand (2012: €1,817 thousand).
End-of-service benefitsIn the event that a member of the Board of Executive Directors retires from employment before the age of 60, either because their appointment was not extended or was revoked for an impor tant reason, they are entitled to pension benefits if they have served on the Board for at least ten years or if the time needed to reach legal retirement age is less than ten years. The company is entitled to offset compensation received for any other work done against pension benefits until the legal retire-ment age is reached. The following applies to end of service due to a change- of-control event: A change-of-control event, in terms of this provision, occurs when a shareholder informs BASF of a share-holding of at least 25%, or the increase of such a holding. If a Board member’s appointment is revoked within one year following a change-of-control event, the Board member will receive the contractually agreed payments for the remaining contractual term of office as a one-off payment (fixed compen-sation and variable bonus). Furthermore, the Board member may receive the fair value of the option rights acquired in connection with the LTI program within a period of three months or may continue to hold the existing rights under the terms of the program. For the determination of the accrued pension benefits from the “Board Performance Pension,” the time up to the regular expiry of office is taken into consideration. There is a general limit on severance pay (severance payment cap) for all Board members. Accordingly, payments made to a Board
member upon premature termination of their contract, without serious cause, may not exceed the value of two years’ compen-sation nor compensate more than the remaining term of the con-tract. The severance payment cap is to be calculated on the basis of the total compensation for the past full financial year and, if appropriate, also the expected total compensation for the current financial year. If the appointment to the Board of Execu tive Directors is prematurely terminated as the result of a change of control, the payments may not exceed 150% of the severance compensation cap. Former members of the Board of Executive DirectorsTotal compensation for previous Board members and their surviving dependents amounted to €10.5 million in 2013 (2012: €23.7 million). This figure also contains payments that previous Board members have themselves financed through the deferred compensation program and personnel expense for the year 2013 relating to options that previous members of the Board still hold from the time of their active service period. The continuation of the options that have not yet been exercised at the time of retirement, along with the continuation of the associated holding period for individual investment in BASF shares under the conditions of the program, is intended in order to particularly emphasize how sustainability is incorpo-rated into the compensation for the Board members. Pension provisions for previous Board members and their surviving dependents amounted to €131.8 million (2012: €142.3 million).
Compensation of Supervisory Board membersThe disclosure of compensation of the Supervisory Board is based on the German Commercial Code and is aligned with the recommendations of the German Corporate Governance Code. The compensation of the Supervisory Board is regulated by the Statutes of BASF SE passed by the Annual Shareholders’ Meeting. Each member of the Supervisory Board receives an annual fixed compensation of €60,000 and a performance-related variable compensation for each full €0.01 by which the earnings per share of the BASF Group, as declared in the BASF Group Consolidated Financial Statements for the year for which the remu neration is paid, exceeds the minimum earnings per share. For 2013, minimum earnings per share amounted to €1.60 (2012: €1.55). The performance-related variable remuneration is €800 for each full €0.01 of earnings per share up to an earnings per share of €2.35, €600 for each further €0.01 of earnings per share up to an earnings per share of €2.85, and €400 for each €0.01 beyond this. The minimum earnings per share and the corre-sponding thresholds shall increase by €0.05 for each subsequent financial year. The performance-related variable compensation is limited to a maximum amount of €120,000.

Compensation report Corporate GovernanceBASF Report 2013 135
Compensation of the Supervisory Board of BASF SE (thousand €)
Fixed compensation Performance-related
variable compensationPayment for commit-
tee memberships Total compensation
2013 2012 2013 2012 2013 2012 2013 2012
Dr. h.c. Eggert Voscherau, Chairman1 150.0 150.0 300.0 300.0 25.0 25.0 475.0 475.0
Michael Diekmann, Vice Chairman2 90.0 90.0 180.0 180.0 12.5 12.5 282.5 282.5
Robert Oswald, Vice Chairman2 90.0 90.0 180.0 180.0 12.5 12.5 282.5 282.5
Ralf-Gerd Bastian3 60.0 60.0 120.0 120.0 50.0 50.0 230.0 230.0
Wolfgang Daniel 60.0 60.0 120.0 120.0 180.0 180.0
Prof. Dr. François Diederich 60.0 60.0 120.0 120.0 180.0 180.0
Franz Fehrenbach3 60.0 60.0 120.0 120.0 50.0 50.0 230.0 230.0
Max Dietrich Kley4 60.0 60.0 120.0 120.0 100.0 100.0 280.0 280.0
Anke Schäferkordt 60.0 60.0 120.0 120.0 180.0 180.0
Denise Schellemans 60.0 60.0 120.0 120.0 180.0 180.0
Ralf Sikorski 60.0 60.0 120.0 120.0 180.0 180.0
Michael Vassiliadis2, 3 60.0 60.0 120.0 120.0 62.5 62.5 242.5 242.5
Total 870.0 870.0 1,740.0 1,740.0 312.5 312.5 2,922.5 2,922.5
1 Chairman of the Personnel Committee 2 Member of the Personnel Committee 3 Member of the Audit Committee 4 Chairman of the Audit Committee
Compensation for Supervisory Board membership and membership of Supervisory Board committees is payable after the Annual Shareholders’ Meeting, which approves the Consol-idated Financial Statements upon which the variable compen-sation is based. Accordingly, compensation relating to the year 2013 will be paid following the Annual Shareholders’ Meeting on May 2, 2014. In 2013, as in 2012, the company paid the Super - visory Board member Prof. Dr. François Diederich a total of CHF 38,400 (2013: approximately €31,200; 2012: approximately
Total compensation of the Supervisory Board of the company for the activity in 2013, including the attendance fees, was around €3 million (2012: around €3 million). The compensation of the individual Supervisory Board members is as follows:
€31,900) plus value-added taxes and out-of-pocket expenses for consulting work in the area of chemical research based on a consulting contract approved by the Supervisory Board.
Beyond this, no other Supervisory Board members received any compensation in 2013 for services rendered personally, in particular, the rendering of advisory and agency services.
For more on share ownership by members of the Supervisory Board, see page 126
Based on the earnings per share of €5.27 published in the BASF Group Consolidated Financial Statements 2013, the perfor-mance-related compensation reached the maximum amount of €120,000 (2012: €120,000). The chairman of the Supervisory Board receives two and-a-half times and a vice chairman one-and-a-half times the compensation of an ordinary member. Members of the Supervisory Board who are members of a committee, except for the Nomination Committee, receive a further fixed compensation for this purpose in the amount of €12,500. For the Audit Committee, the further fixed compensa-tion is €50,000. The chairman of a committee shall receive twice and a vice chairman one-and-a-half times the further fixed compensation.
The company reimburses members of the Supervisory Board for out-of-pocket expenses and value-added tax to be paid with regard to their activities as members of the Supervisory Board or of a committee. The company further grants the members of the Supervisory Board a fee of €500 for attending a meeting of the Supervisory Board or one of its committees to which they belong and includes the performance of the duties of the members of the Supervisory Board in the cover of a loss liability insurance concluded by it (D&O insurance), which includes a deductible.
For more on the D&O insurance of the Supervisory Board, see page 126

Report of the Supervisory Board BASF Report 2013Corporate Governance136
Report of the Supervisory Board
Dear Shareholder,
Notwithstanding the continuing sovereign debt crisis and slow-down in the global economy, BASF brought the 2013 business year to a successful close. The previous year’s high sales and earnings levels were once again slightly surpassed. This was thanks to our competitive products, increasingly global business orientation, power of innovation, and most especially, to our highly motivated employees whose commitment makes BASF’s success possible. Maintaining this excellence is an important task of the Board of Executive Directors. To remain successful in the future, however, we must also succeed in recognizing busi-ness areas with high growth potential and developing innovative and marketable products and solutions for our customers. This is at the core of BASF’s “We create chemistry” strategy.
Monitoring and consultation in an ongoing dialog with the Board of Executive DirectorsIn 2013, the Supervisory Board of BASF SE exercised its duties as required by law and the Statutes with the utmost care. We regularly monitored the management of the Board of Executive Directors and provided advice on the company’s strategic development and important individual measures, about which the Supervisory Board was thoroughly informed by the Board of Executive Directors. This occurred in the form of written and verbal reports on business policies and the situation and devel-opment of the business, as well as the company’s profitability, global HR policy and planning with regard to finances, capital expenditures and human resources at BASF SE and its major subsidiaries. We were also informed as to any deviations between the course of business and planning. The Super- visory Board discussed in detail the reports from the Board of Executive Directors, and also deliberated on prospects for the
company and its individual business areas with the Board of Execu tive Directors. Outside of Supervisory Board meetings, the Chairman of the Board of Executive Directors also regularly informed the Chairman of the Supervisory Board regarding current developments and items significant for the company. The Supervisory Board was always involved at an early stage in deci sions of major importance. The Supervisory Board dis-cussed and voted on all of those individual measures taken by the Board of Executive Directors which by law or the Statutes required the approval of the Supervisory Board. In 2013, this only applied to approval for various guarantees of a limited nature (in terms of time and scope) pertaining to financing the South Stream gas pipeline project through the Black Sea, in which BASF’s subsidiary Wintershall holds a minority interest.
Supervisory Board meetingsThe Supervisory Board held five meetings in the 2013 reporting year. Three of the five meetings in 2013 were attended by all twelve Supervisory Board members; at two of the meetings, eleven members were present. The members of the Super- visory Board elected by shareholders and those elected by the employ ees prepared for the meetings in separate preliminary discussions.
In all of its meetings, the Supervisory Board discussed the further development of the BASF Group’s business activities through acquisitions, divestitures and investment projects. The Oil & Gas segment was once again a focus of our discussions this year. We were particularly occupied with the progress of nego tiations with Gazprom on an asset swap that was success-fully completed in December. In this transaction, we will exchange shares in the natural gas trading business, grouped into the WINGAS companies, for another share in a gas field in Western Siberia. A further topic centered on the Performance Products segment, for which we discussed restructuring measures in indi vidual businesses – for example, in the Paper Chemicals divi sion. All meetings dealt with the important matter of ongoing major investment projects, such as the construction of an MDI plant in Chongqing, China, and a TDI plant in Ludwigshafen.
In addition to strategically significant individual measures, the Supervisory Board also addressed BASF’s strategy and long-term business prospects in individual regions and business areas. We were informed about and discussed the Construc-tion Chemicals division’s strategy and reorientation as well as the BASF Group’s new information technology strategy at our meeting on July 18, 2013. Moreover, we discussed the imple-mentation status of the “We create chemistry” strategy, intro-duced in 2011, with the Board of Executive Directors. At our meeting on October 24, 2013, we deliberated on the strategy of

Report of the Supervisory Board Corporate GovernanceBASF Report 2013 137
the Intermediates division. Development in the field of energy was another central topic. This involves the effects of changing German energy policy – and its potentially negative impact on the conditions surrounding future chemical production in Germany – as well as the changing competitive environment resulting from the availability of shale gas, especially in the United States.
In four Supervisory Board meetings, examples of innovations were once again used to inform us about research and develop-ment topics and the development of future markets, and we discussed these with the Board of Executive Directors. One example was FWC™, the four-way catalyst for gasoline engines that complies with strict new emissions regulations like Euro 6. Further examples were Cetiol® RLF, the bio-based emollient for the personal care market, and the new high-performance insu-lation material, SLENTITE™. At the meeting of December 12, 2013, we discussed and approved the Board of Executive Directors’ operative and financial planning for 2014. In addition, we once again empowered the Board of Executive Directors to procure necessary financing in 2014.
The Supervisory Board thoroughly considered the personnel issues of the Board of Executive Directors during the meetings of July 18 and December 12, 2013. Based on the recommen-dations of the Personnel Committee, the Supervisory Board exten ded Margret Suckale’s appointment to the Board of Execu-tive Directors to 2017 and that of Michael Heinz to 2019 in the meeting of July 18, 2013. The previous appointments had ended upon conclusion of the 2014 Annual Shareholders’ Meeting. At the same meeting, amendments were made to the compensa-tion of the Board of Executive Directors. Based on preparations conducted by the Personnel Committee, we met with the Board of Executive Directors at the meeting of December 12, 2013, to deliberate and agree on its targets for 2014, and determined the Board of Executive Directors’ performance evaluation for 2013. Together with the return on assets of the BASF Group, this evalu ation is essential in ascertaining the performance- related component of the compensation of the Board of Execu-tive Directors.
CommitteesBASF SE’s Supervisory Board has a total of three committees: 1) the committee for personnel matters of the Board of Executive Directors and the granting of loans in accordance with Section 89(4) of the German Stock Corporation Act (Personnel Commit-tee), 2) the Audit Committee and 3) the Nomination Committee. Following each Committee meeting, the chairpersons of the Committees reported in detail about the meetings and the activi-ties of the Committees at the subsequent meeting of the Super-visory Board.
The Personnel Committee met twice during the reporting period. At its meeting of July 17, 2013, the Personnel Commit-tee addressed the staffing of the Board of Executive Directors and recommended to the Supervisory Board plenum that the appointments of Margret Suckale and Michael Heinz, which would otherwise expire on May 2, 2014, upon conclusion of the Annual Shareholders’ Meeting, be extended by three years to 2017 and by five years to 2019, respectively. The Committee also discussed amendments to the compensation of the Board of Executive Directors at this meeting and made proposals to the Supervisory Board plenum. At the meeting of December 11, 2013, it primarily evaluated the Board of Executive Directors’ performance in 2013 and the level of their target achievement, and, together with the Board of Executive Directors, discussed the target agreement to be entered into between the Super-visory Board and the Board of Executive Directors for 2014. A further topic comprised the regular review of the Board of Execu-tive Directors’ remuneration.
The Audit Committee is responsible for all the tasks listed in Section 107(3)(2) of the German Stock Corporation Act and in Subsection 5.3.2 of the German Corporate Governance Code in its version of May 13, 2013. The Audit Committee met five times during the reporting period. All committee members attended all meetings. The core duties were to review BASF SE’s Finan-cial Statements and Consolidated Financial Statements, as well as to discuss the quarterly and first-half financial reports with the Board of Executive Directors prior to their publication. Other important activities included advising the Board of Executive Directors on accounting issues and the internal control system. The internal auditing system and compliance in the BASF Group were each a focus at one meeting of the Audit Committee. In these meetings, the head of the Corporate Audit department and the Chief Compliance Officer reported to the Audit Committee and answered its questions. In its meeting of July 22, 2013, the Audit Committee charged KPMG – the auditor elected at the Annual Shareholders’ Meeting – with the audit for the 2013 reporting year and agreed on the auditing fees. The focus areas for the annual audit were discussed and defined together with the auditor. The Audit Committee approved certain non-audit services and authorized the Board of Executive Directors to

Report of the Supervisory Board BASF Report 2013Corporate Governance138
engage KPMG for such services. The authorization of each service applies for one reporting year and is limited in amount. Other services provided by the auditor must be individually approved by the Audit Committee. Furthermore, the Audit Committee recommended to the Supervisory Board that KPMG once again be nominated for the election of the auditor at the Annual Shareholders’ Meeting in 2014.
The Nomination Committee is responsible for preparing candidate proposals for the election of those Supervisory Board members who are elected by the Annual Shareholders’ Meeting. The Nomination Committee is guided by the objectives for the composition of the Supervisory Board that were adopted by the Supervisory Board in 2010, revised in 2012 and adjusted to conform to the new recommendations of the German Corpo-rate Governance Code. With a view to the upcoming regular elec-tion of the Supervisory Board members at the Annual Sharehold-ers’ Meeting on May 2, 2014, the Nomination Committee was intensely occupied with the requirements for its composition in 2013, considering the search for, and selection of, persons who would complete the required profile of the Supervisory Board as a whole. They conferred on this at their meeting of July 17, 2013. Candidate selection was particularly influenced by the fact that the Chairman of the Supervisory Board, Dr. h.c. Eggert Voscherau, and of the Audit Committee, Max Dietrich Kley, would not stand for reelection. In light of this, the Nomination Commit-tee put forth candidate proposals at its meeting on February 19, 2014, including a suggestion for the election of the future Chair-man of the Supervisory Board, and submitted this to the Super-visory Board for its resolution on candidates to propose at the Annual Shareholders’ Meeting. The Supervisory Board accepted the Nomination Committee’s suggestion in unmodified form for its candidate proposal.
Corporate governance and Declaration of ConformityThe Supervisory Board places great value on ensuring good corporate governance: In 2013, we were therefore once again intensely engaged with the corporate governance standards practiced in the company and with the implementation of the German Corporate Governance Code’s recommendations and suggestions. At our meeting of October 24, 2013, we discussed the amendments made to the German Corporate Governance Code on May 13, 2013, and their implementation at BASF.
At its meeting of December 12, 2013, the Supervisory Board approved the joint Declaration of Conformity by the Supervisory Board and the Board of Executive Directors in accordance with Section 161 of the German Stock Corporation Act, and carried out assessments of efficiency and independence. BASF com-plies with the recommendations of the German Corporate Governance Code in its version of May 13, 2013, without excep-tion. However, the new proposals made in Subsection 4.2.5(3) of the Code on the presentation of the compensation for the Board of Executive Directors, which will first apply for compen-sation made in business years following December 31, 2013, will not be applied prematurely in the BASF Report 2013. The entire Declaration of Conformity is provided on page 140 and is also available to shareholders on BASF’s website. An important aspect of good corporate governance is the independence of Supervisory Board members and their freedom from conflicts of interest. According to estimations of the Supervisory Board, all of its members can be considered independent as defined by the German Corporate Governance Code. The criteria used for this evaluation can be found in the Corporate Governance Report on page 124. In cases where Supervisory Board members hold advisory or management positions at companies with which BASF has business relations, we see no impairment of their inde pen dence, as the scope of these businesses is relatively marginal and furthermore takes place under conditions similar to those of a third party. The Corporate Governance Report of the BASF Group provides extensive information on BASF’s cor-porate governance. It also includes the Compensation Report, containing full details on the compensation for the Board of Execu tive Directors and the Supervisory Board.

Report of the Supervisory Board Corporate GovernanceBASF Report 2013 139
Annual Financial Statements of BASF SE and Consolidated Financial StatementsKPMG AG Wirtschaftsprüfungsgesellschaft, the auditor elected by the Annual Shareholders’ Meeting for the 2013 reporting year, has audited the Financial Statements of BASF SE and the BASF Group Consolidated Financial Statements, including the Management’s Report and the accounting records from which they were prepared, and have approved them free of qualifi- cation. Furthermore, the auditor certified that the Board of Executive Directors had taken the measures incumbent on it under Section 91(2) of the German Stock Corporation Act in an appropriate manner. In particular, it had instituted an appropri-ate information and monitoring system that fulfilled the require-ments of the company. This system is suitable, both in design and application, for providing early warning of developments that pose a threat to the continued existence of the company.
The documents to be examined and the auditor’s reports were sent in a timely manner to every member of the Supervisory Board. The auditor attended the accounts review meeting of the Audit Committee on February 19, 2014, as well as the accounts meeting of the Supervisory Board on February 20, 2014, and reported on the main findings of the audit. The auditor also provided detailed explanations of the reports on the day before the accounts meeting of the Supervisory Board. The Audit Committee reviewed the Financial Statements and Management’s Report at its meeting on February 19, 2014, and discussed them in detail with the auditor. The Chairman of the Audit Committee gave a detailed account of the preliminary review at the Supervisory Board meeting on February 20, 2014. On the basis of this preliminary review by the Audit Committee, the Supervisory Board has examined the Financial Statements and Management’s Report of BASF SE for 2013, the proposal by the Board of Executive Directors for the appropriation of profit as well as the Consolidated Financial Statements and Manage-ment’s Report for the BASF Group for 2013. We have reviewed, acknowledged and approved the auditor’s reports. The results of the preliminary review by the Audit Committee and the results of our own examination fully concur with those of the audit. The Supervisory Board sees no grounds for objection to the management and submitted reports.
At the Supervisory Board’s accounts meeting on February 20, 2014, we approved the Financial Statements of BASF SE and the Consolidated Financial Statements of the BASF Group prepared by the Board of Executive Directors, making the BASF SE Financial Statements final. We concur with the proposal of the Board of Executive Directors regarding the appropriation of profit and the payment of a dividend of €2.70 per share.
ThanksThe Board of Executive Directors continued to demonstrate impressive company leadership in 2013. The high-quality work of the entire team of the Board of Executive Directors and employees was once again crucial to BASF’s success. The Supervisory Board thanks the management and all employees of the BASF Group worldwide for the work they performed in 2013.
Ludwigshafen, February 20, 2014
The Supervisory Board
Dr. h. c. Eggert VoscherauChairman of the Supervisory Board

Declaration of Conformity BASF Report 2013Corporate Governance140
Declaration of Conformity 2013 of the Board of Executive Directors and the Supervisory Board of BASF SE
Declaration of Conformity
The Board of Executive Directors and the Super- visory Board of BASF SE hereby declare pursuant to Section 161 AktG (Stock Corporation Act)
1. The recommendations of the Government Commission on the German Corporate Governance Code as amended on May 15, 2012, published by the Federal Ministry of Justice on June 18, 2012, in the official section of the electronic FederalGazette, have been complied with since the submission of thelast Declaration of Conformity on December 20, 2012.
2. The recommendations of the Government Commissionon the German Corporate Governance Code as amended onMay 13, 2013, published by the Federal Ministry of Justiceon June 10, 2013, in the official section of the electronic FederalGazette, are complied with and will be complied with.
The declaration in No. 2 above applies with regard to the recommendation in Article 4.2.5(3) of the German Corporate Governance Code as amended on May 13, 2013, provided that this new recommendation will be relevant for the first time for compensation reports of financial years starting after Decem-ber 31, 2013.
Ludwigshafen, dated December 12, 2013
The Supervisory Board of BASF SE
The Board of Executive Directorsof BASF SE

4 Co
nso
lidat
ed F
inan
cial
Sta
tem
ents
Consolidated Financial Statements
Notes
Statement by the Board of Executive Directors 142
Auditor’s report 143
Statement of income 144
Statement of income and expense recognized in equity 145
Balance sheet 146
Statement of cash flows 147
Statement of equity 148
Policies and scope of consolidation
1 – Summary of accounting policies 149
2 – Scope of consolidation 163
3 – List of Shares Held of the BASF Group in accordance with Section 313(2) of the German Commercial Code 171
Segments and regions
4 – Reporting by segment and region 171
Notes on Statement of Income
5 – Earnings per share 174
6 – Functional costs 175
7 – Other operating income 175
8 – Other operating expenses 176
9 – Income from companies accounted for using the equity method 177
10 – Financial result 177
11 – Income taxes 178
12 – Minority interests 180
13 – Personnel expenses and employees 180
Notes on Balance Sheet
14 – Intangible assets 181
15 – Property, plant and equipment 184
16 – Investments accounted for using the equity method and other financial assets 186
17 – Inventories 186
18 – Receivables and miscellaneous assets 187
19 – Capital, reserves and retained earnings 188
20 – Other comprehensive income 189
21 – Minority interests 190
22 – Provisions for pensions and similar obligations 190
23 – Other provisions 195
24 – Liabilities 197
25 – Contingent liabilites and other financial obligations 199
26 – Risks from litigation and claims 200
27 – Supplementary information on financial instruments 201
28 – Leasing 208
Other explanatory notes
29 – Statement of cash flows and capital structure management 209
30 – Share-price-based compensation program and BASF incentive share program 210
31 – Compensation for the Board of Executive Directors and Supervisory Board of BASF SE 212
32 – Related-party transactions 213
33 – Services provided by the external auditor 214
34 – Declaration of Conformity with the German Corporate Governance Code 214

Statement by the Board of Executive Directors
BASF Report 2013Consolidated Financial Statements142
Statement by the Board of Executive Directors and assurance pursuant to Sections 297(2), 315(1) of the German Commercial Code (HGB)
The Board of Executive Directors of BASF SE is responsible for preparing the Consolidated Financial Statements and Manage-ment’s Report of the BASF Group. The Consolidated Financial Statements for 2013 were prepared according to the International Financial Reporting Standards (IFRS), which are published by the International Accounting Standards Board (IASB), London, and have been endorsed by the European Union. In order to ensure the adherence of the Consolidated Financial Statements of the BASF Group and Management’s Report to the applicable accounting rules, and the accuracy of reporting, we have established effective internal control systems. The adherence to uniform, Group- wide accounting and reporting standards, and the reliability and effectiveness of our control systems are continually audited throughout the Group by our internal audit department. The risk management system we have set up is designed to identify material risks in a timely manner, thus enabling the Board of Executive Directors to take appropriate defensive measures as required.
To the best of our knowledge, and in accordance with the applicable reporting principles, the Consolidated Financial Statements of the BASF Group give a true and fair view of the net assets, financial position and results of operations of the Group, and the Management’s Report includes a fair review of the development and performance of the business and the position of the Group, together with a description of the principal opportunities and risks associated with the expected development of the Group.
Ludwigshafen, February 19, 2014
Dr. Kurt BockChairman of the Board of Executive Directors
Dr. Hans-Ulrich EngelChief Financial Officer
Dr. Andreas Kreimeyer
Wayne T. Smith
Dr. Martin BrudermüllerVice Chairman of the Board of Executive Directors
Michael Heinz
Dr. Harald Schwager
Margret Suckale

Auditor’s report
Consolidated Financial StatementsBASF Report 2013 143
Auditor’s report
We have audited the Consolidated Financial Statements prepared by BASF SE, Ludwigshafen am Rhein, Germany, comprising the statement of income, statement of income and expense recognized in equity, balance sheet, statement of cash flows, statement of equity and the notes to the Consolidated Financial Statements, together with the Management’s Report for the business year from January 1 to December 31, 2013. The preparation of the Consolidated Financial Statements and the Management’s Report in accordance with IFRSs as adopted by the European Union, and the additional require-ments of German commercial law pursuant to Section 315a(1) HGB [Handelsgesetzbuch “German Commercial Code”] are the responsibility of the parent company’s management. Our responsibility is to express an opinion on the Consoli dated Financial Statements and on the Management’s Report based on our audit. In addition, we have been instructed to express an opinion as to whether the Consolidated Financial Statements comply with full IFRS. We conducted our audit of the Consolidated Financial Statements in accordance with Section 317 HGB and German generally accepted standards for the audit of financial state-ments promulgated by the Institut der Wirtschaftsprüfer (IDW). Those standards require that we plan and perform the audit such that misstatements materially affecting the presentation of the net assets, financial position and results of operations in the Consolidated Financial Statements in accordance with the appli-cable financial reporting framework and in the Management’s
Report are detected with reasonable assurance. Knowledge of the business activities and the economic and legal environment of the Group and expectations as to possible misstatements are taken into account in the determination of audit procedures. The effectiveness of the accounting- related internal control system and the evidence supporting the disclosures in the Consolidated Financial Statements and the Management’s Report are exam-ined primarily on a test basis within the framework of the audit. The audit includes assessing the annual financial statements of those entities included in consolidation, the determination of entities to be included in consolidation, the accounting and consolidation principles used and significant estimates made by management, as well as evaluating the overall presentation of the Consolidated Financial Statements and the Manage-ment’s Report. We believe that our audit provides a reasonable basis for our opinion. Our audit has not led to any reservations. In our opinion, based on the findings of our audit, the Con-solidated Financial Statements comply with IFRSs as adopted by the E.U., the additional requirements of German commercial law pursuant to Section 315a(1) HGB and full IFRS and give a true and fair view of the net assets, financial position and results of operations of the Group in accordance with these require-ments. The Management’s Report is consistent with the Consolidated Financial Statements and as a whole provides a suitable view of the Group’s position and suitably presents the opportunities and risks of future development.
Frankfurt am Main, February 19, 2014
KPMG AG
Wirtschaftsprüfungsgesellschaft
Prof. Dr. Schindler Wirtschaftsprüfer
KraußWirtschaftsprüfer

Statement of income
BASF Report 2013Consolidated Financial Statements144
Statement of incomeBASF Group
Statement of income (million €)
Explanations in note 20132012
(restated)
Sales revenue [4] 73,973 72,129
Cost of sales [6] (55,483) (54,266)
Gross profit on sales 18,490 17,863
Selling expenses [6] (7,423) (7,447)
General and administrative expenses [6] (1,366) (1,359)
Research expenses [6] (1,835) (1,732)
Other operating income [7] 1,679 1,709
Other operating expenses [8] (2,570) (2,653)
Income from companies accounted for using the equity method [9] 298 361
Income from operations [4] 7,273 6,742
Income from other shareholdings 74 75
Expenses from other shareholdings (70) (43)
Interest income 160 177
Interest expense (688) (724)
Other financial income 238 73
Other financial expenses (274) (323)
Financial result [10] (560) (765)
Income before taxes and minority interests 6,713 5,977
Income taxes [11] (1,540) (910)
Income before minority interests 5,173 5,067
Minority interests [12] (331) (248)
Net income 4,842 4,819
Earnings per share (€) [5] 5.27 5.25
Dilution effect [5] – –
Diluted earnings per share (€) [5] 5.27 5.25

Consolidated Financial StatementsBASF Report 2013 145
Statement of income and expense recognized in equityBASF Group
Statement of income and expense recognizes in equity
Income before minority interests and income and expense recognized in equity (million €)
20132012
(restated)
Income before minority interests 5,173 5,067
Remeasurement of defined benefit plans 1,531 (2,732)
Remeasurement due to acquisition of majority of shares (1) (3)
Deferred taxes for items that will not be reclassified to the statement of income (404) 847
Income and expense recognized directly in equity that will not be reclassified to the statement of income at a later date 1,126 (1,888)
Foreign currency translation adjustment (1,098) (211)
Fair value changes in available-for-sale securities (1) 7
Cash flow hedges 13 12
Hedges in net investments on foreign operations – 2
Deferred taxes for items that will be reclassified to the statement of income 21 (11)
Income and expense recognized directly in equity that will be reclassified to the statement of income at a later date (1,065) (201)
Minority interests (34) (9)
Total income and expense recognized directly in equity 27 (2,098)
Income before minority interests and income and expense recognized directly in equity 5,200 2,969
Thereof attributable to shareholders of BASF SE 4,903 2,730
attributable to minority interests 297 239
Development of income and expense recognized directly in equity of shareholders of BASF SE (million €)
Other comprehensive income
Remeasure-ment of defined
benefit plans
Foreign currency
translation adjustment
Measurement of securities at
fair valueCash flow
hedges
Hedges of net investments
in foreign operations
Remeasure-ment due to
acquisition of majority
of shares
Total income and expense
recognized directly in
equity
As of January 1, 20131 (3,571) 165 17 (73) – 1 (3,461)
Additions – – – – – – –
Releases 1,531 (1,098) (1) 13 – (1) 444
Deferred taxes (404) 16 (1) 6 – – (383)
As of December 31, 2013 (2,444) (917) 15 (54) – – (3,400)
As of January 1, 20121 (1,686) 373 10 (71) (2) 4 (1,372)
Additions (2,732) – 7 – – – (2,725)
Releases – (211) – 12 2 (3) (200)
Deferred taxes 847 3 – (14) – – 836
As of December 31, 20121 (3,571) 165 17 (73) – 1 (3,461)
1 Restated figures
Statement of income and expense recognized in equity

Balance sheet
BASF Report 2013Consolidated Financial Statements146
Balance sheetBASF Group
Assets (million €)
Explanations in note December 31, 2013December 31, 2012
(restated)January 1, 2012
(restated)
Intangible assets [14] 12,235 12,193 11,850
Property, plant and equipment [15] 18,254 16,610 16,182
Investments accounted for using the equity method [16] 4,137 3,459 3,486
Other financial assets [16] 630 613 578
Deferred tax assets [11] 992 1,473 862
Other receivables and miscellaneous noncurrent assets [18] 876 911 816
Noncurrent assets 37,124 35,259 33,774
Inventories [17] 9,592 9,581 9,676
Accounts receivable, trade [18] 9,376 9,506 10,151
Other receivables and miscellaneous current assets [18] 3,630 3,455 3,679
Marketable securities 17 14 14
Cash and cash equivalents 1,815 1,647 1,903
Assets of disposal groups [2] 2,828 3,264 295
Current assets 27,258 27,467 25,718
Total assets 64,382 62,726 59,492
Equity and liabilities (million €)
Explanations in note December 31, 2013December 31, 2012
(restated)January 1, 2012
(restated)
Subscribed capital [19] 1,176 1,176 1,176
Capital surplus [19] 3,165 3,188 3,203
Retained earnings [19] 26,170 23,708 21,168
Other comprehensive income [20] (3,400) (3,461) (1,372)
Equity of shareholders of BASF SE 27,111 24,611 24,175
Minority interests [21] 678 1,010 1,040
Equity 27,789 25,621 25,215
Provisions for pensions and similar obligations [22] 3,709 5,421 3,162
Other provisions [23] 2,924 2,925 3,223
Deferred tax liabilities [11] 2,849 2,234 2,301
Financial indebtedness [24] 11,151 8,704 8,670
Other liabilities [24] 1,157 1,111 1,171
Noncurrent liabilities 21,790 20,395 18,527
Accounts payable, trade 4,505 4,502 4,827
Provisions [23] 2,616 2,628 3,115
Tax liabilities [11] 954 870 841
Financial indebtedness [24] 3,256 4,094 3,833
Other liabilities [24] 2,182 2,623 3,047
Liabilities of disposal groups [2] 1,290 1,993 87
Current liabilities 14,803 16,710 15,750
Total equity and liabilities 64,382 62,726 59,492

Statement of cash flows
Consolidated Financial StatementsBASF Report 2013 147
Statement of cash flowsBASF Group
Statement of cash flows1 (million €)
20132012
(restated)
Net income 4,842 4,819
Depreciation and amortization of intangible assets, property, plant and equipment and financial assets 3,196 3,288
Changes in inventories (215) (672)
Changes in receivables 512 (1,104)
Changes in operating liabilities and other provisions 508 932
Changes in pension provisions, defined benefit assets, net assets of disposal groups and other noncash items (970) (223)
Net gains from disposal of noncurrent assets and securities (3) (438)
Cash provided by operating activities 7,870 6,602
Payments related to property, plant and equipment and intangible assets (4,660) (4,015)
Payments related to financial assets and securities (784) (144)
Payments related to acquisitions (1,156) (1,043)
Proceeds from divestitures 63 724
Proceeds from the disposal of noncurrent assets and securities 768 501
Cash used in investing activities (5,769) (3,977)
Capital increases/repayments and other equity transactions – (1)
Proceeds from the addition of financial and similar liabilities 5,636 4,904
Repayment of financial and similar liabilities (4,808) (5,247)
Dividends paid
To shareholders of BASF SE (2,388) (2,296)
minority shareholders (314) (264)
Cash used in financing activities (1,874) (2,904)
Net changes in cash and cash equivalents 227 (279)
Effects on cash and cash equivalents
From foreign exchange rates (60) 21
changes in scope of consolidation 1 2
Cash and cash equivalents at the beginning of the year 1,647 1,903
Cash and cash equivalents at the end of the year 1,815 1,647
1 More information on the Statement of Cash Flows can be found in the Management’s Report (Financial Position) from page 57 onward.Other information on cash flows can be found in Note 29 on page 209.

Statement of equity
BASF Report 2013Consolidated Financial Statements148
Statement of equityBASF Group
Statement of equity1 (million €)
Number of shares
outstandingSubscribed
capitalCapital surplus
Retained earnings
Other com-prehensive
income2
Equity of share holders
of BASF SEMinority interests Equity
January 1, 2013 (restated) 918,478,694 1,176 3,188 23,708 (3,461) 24,611 1,010 25,621
Effects of acquisitions achieved in stages – – – – – – (3) (3)
Dividends paid – – – (2,388) – (2,388) (314)3 (2,702)
Net income – – – 4,842 – 4,842 331 5,173
Changes to income and expense recognized directly in equity – – – – 61 61 (34) 27
Changes in scope of consolidation and other changes – – (23)4 8 – (15) (312) (327)
December 31, 2013 918,478,694 1,176 3,165 26,170 (3,400) 27,111 678 27,789
January 1, 2012 (before restatement) 918,478,694 1,176 3,203 19,446 314 24,139 1,246 25,385
Restatement – – – 1,722 (1,686) 36 (206) (170)
January 1, 2012 (restated) 918,478,694 1,176 3,203 21,168 (1,372) 24,175 1,040 25,215
Effects of acquisitions achieved in stages – – – – – – (5) (5)
Dividend paid – – – (2,296) – (2,296) (264)3 (2,560)
Net income – – – 4,819 – 4,819 248 5,067
Changes to income and expense recognized directly in equity – – – – (2,089) (2,089) (9) (2,098)
Changes in scope of consolidation and other changes – – (15)4 17 – 2 – 2
December 31, 2012 (restated) 918,478,694 1,176 3,188 23,708 (3,461) 24,611 1,010 25,621
1 For more information on the items relating to equity see Notes 19 and 20 on page 188 onward 2 Details are provided in the overview “Income and expense recognized in equity” on page 145 3 Including profit and loss transfers 4 Granting of BASF shares under the BASF share program “plus”

Notes
Policies and scope of consolidation
Consolidated Financial StatementsBASF Report 2013 149
1.1 – General information
BASF SE is a publicly listed corporation based in Ludwigshafen am Rhein. Its official address is Carl-Bosch-Str. 38, 67056 Lud-wigshafen am Rhein, Germany. The Consolidated Financial Statements of BASF SE as of December 31, 2013, have been prepared in accordance with the International Financial Reporting Standards (IFRS) of the Interna-tional Accounting Standards Board (IASB) and Section 315a(1) of the German Commercial Code (HGB). IFRSs are, as a rule, only applied after they have been endorsed by the European Union. For the 2013 fiscal year, all of the binding IFRSs and pronounce-ments of the International Financial Reporting Interpretations Committee (IFRIC) were applied. The Consolidated Financial Statements are presented in euros. All amounts, including the figures for previous years, are given in million euros unless otherwise indicated. The individual financial statements of the consolidated companies are prepared as of the balance sheet date of the Con-solidated Financial Statements. The accounting policies that have been applied are the same as those in 2012, with the exception of any changes arising from the application of new or revised standards. The previous year’s figures have been adjusted accordingly. In its meeting on February 17, 2014, the Board of Executive Directors prepared the Consolidated Financial Statements, sub-mitted them to the Supervisory Board for approval, and released them for publication.
1.2 – Changes in accounting principles
The application of the following International Financial Report-ing Standards effective January 1, 2013, resulted in changes for BASF’s accounting methods in 2013:
IFRS 10 – Consolidated Financial StatementsIFRS 10 contains a new, comprehensive definition of control. The new standard replaces the provisions of IAS 27 – Separate Financial Statements (previously “Consolidated and Separate Financial Statements”), which regulates the preparation of con-solidated financial statements, as well as SIC 12 Consolidation – Special Purpose Entities. According to both IAS 27 and IFRS 10, a group consists of a parent entity and the subsidiaries con-trolled by the parent. IFRS 10 provides a new definition of con-trol compared with IAS 27. This is applied in determining the companies to be consolidated. “Control” assumes the simulta-neous fulfillment of the following three criteria:
– The parent company holds decision-making power over the relevant activities of the investee,
– The parent company has rights to variable returns from the investee, and
– The parent company can use its decision-making power to affect the variable returns.
Based on corporate governance and potential supplementary agreements, companies were analyzed for their relevant activi-ties and variable returns, and the link between the variable returns and the extent to which their relevant activities could be influenced. Upon application of the new standard, four companies have been switched from full consolidation to the equity method. For three companies, no control exists according to IFRS 10, as BASF’s partners in these companies have the ability to influence the determination and implementation of certain relevant activi-ties through supervisory bodies. Despite an investment of 51%, the oil and gas production company in Libya is not controlled according to IFRS 10, because contractual arrangements with the Libyan government strictly limit influence on variable returns after income taxes. While BASF does not hold majority shares in ZAO Gazprom YRGM Trading, BASF is entitled to the earnings of the company due to profit distribution arrangements, so that the company is fully consolidated in the Group Consolidated Financial Statements.
Effects of initial use of IFRS 10 (million €)
January 1, 2012
Noncurrent assets (364)
Thereof property, plant and equipment (574)
investments accounted for using the equity method 217
Current assets (324)
Thereof cash and cash equivalents (34)
Total assets (688)
Equity (207)
Noncurrent liabilities (377)
Thereof financial indebtedness –
Current liabilities (104)
Thereof financial indebtedness –
Total equity and liabilities (688)
IFRS 11 – Joint ArrangementsUntil the end of 2012, BASF principally consolidated companies controlled together with a partner in the financial statements on a proportional basis, pursuant to IAS 31. According to IFRS 11, which regulates the accounting of joint arrangements, joint ventures must now be distinguished from joint operations. In the case of a joint venture, the parties that have joint control of a legally independent company have rights to the net assets of that arrangement. In joint operations, the parties that have joint control have direct rights to the assets and obligations for the lia bilities relating to the arrangement. This requirement is par-ticularly fulfilled if the production output of the joint arrangement is almost entirely transferred to the partners and there is no access to external financing sources.
1 – Summary of accounting policies
NotesPolicies and scope of consolidation

Notes
Policies and scope of consolidation
BASF Report 2013Consolidated Financial Statements150
Shares in joint ventures must now be accounted for using the equity method. In the case of joint operations, the proportional share of assets, liabilities, income and expenses must be reported. Companies whose corporate governance structures classi-fied them as joint arrangements were analyzed to determine if they met the criteria for joint ventures or joint operations as per IFRS 11. This required an analysis of the joint arrangement’s struc-ture and, if the arrangement was structured through a separate vehicle, its legal form, contractual arrangements and all other facts and circumstances were reviewed. Upon application of the new standard, 14 BASF Group companies were shifted to the equity method instead of being proportionally consolidated. For eight companies, BASF must report the proportional share of assets, liabilities, income and expenses, since they market their products directly to the partners and have no access to external financing. The following shows the impact of the shift from proportional consolidation to equity accounting as part of the initial applica-tion of IFRS 11 effective January 1, 2012:
Effects of initial use of IFRS 11 (million €)
January 1, 2012
Noncurrent assets 57
Thereof property, plant and equipment (1,210)
investments accounted for using the equity method 1,417
Current assets (1,045)
Thereof cash and cash equivalents (111)
Total assets (988)
Equity 9
Noncurrent liabilities (374)
Thereof financial indebtedness (349)
Current liabilities (623)
Thereof financial indebtedness (151)
Total equity and liabilities (988)
Reclassification of equity income as part of income from operationsWith the application of IFRSs 10 and 11, the equity income, which was previously reported as part of the financial result, is now reported as part of income from operations (EBIT). The changed presentation in income from operations reflects the operational character of investments accounted for using the equity method.
IFRS 12 – Disclosure of Interests in Other EntitiesIFRS 12 stipulates the disclosures required with regard to the new IFRS 10 – Consolidated Financial Statements and IFRS 11 – Joint Arrangements. This standard replaces the disclosures pre-viously required by IAS 27 – Separate Financial Statements and IAS 28 – Investments in Associates. The application of IFRS 12 is intended to enable assessment of the nature of, and risks associated with, interests in subsidiaries, joint arrangements, associated companies and unconsolidated structured entities.
To this end, the significant judgments and assumptions are described which are used to determine control, joint control or significant influence for the inclusion of the investment in the consolidated financial statements. Disclosures of interests in subsidiaries provide insight into the group structure and the influence of the other entities. Summarized financial information must be reported for subsidiaries whose minority interests are material to the Consolidated Financial Statements as a whole. Information on joint arrangements and associated companies furthermore enables the evaluation of the nature, extent and financial effects of these investments. This includes disclosures on contractual relationships, the description of activities and summarized financial information for joint arrangements and asso ciated companies that are considered material for the Consolidated Finan cial Statements.
IAS 19 (revised) – Employee BenefitsThe most significant change of IAS 19 (revised) requires that experience-based adjustments and effects from changes of actuarial assumptions, reported as actuarial gains and losses, must be recognized directly in other comprehensive income. The previous option of immediate recognition in the income statement, reporting in equity, or delayed reporting according to the corridor method, was abolished. The amendment does not affect the total amount of BASF’s equity because actuarial gains and losses have already been treated in accordance with the approach required by IAS 19 (revised). The accumulated amount of actuarial gains and losses, which was previously a part of retained earnings, has been reclassified to other com-prehensive income. This reclassification amounted to €2,444 mil-lion at the end of 2013 and €3,571 million at the end of 2012. With IAS 19 (revised), changes in the benefit levels result-ing from plan amendments with retroactive effect on past service are no longer to be amortized over the vesting period. The retroactive benefit amendments are to be recognized immediately in EBIT in the year of the plan amendment. The application of this accounting policy led to a reduction in the EBIT of the BASF Group of €3 million for 2013 and an increase of €16 million for 2012. This impacted the amount of pension provisions accordingly. Additionally, the revised standard requires that returns on plan assets recognized in the income statement are no longer calculated according to expectations but are instead based on the discount rate applied for pension obligations. The applica-tion of this accounting method led to a reduction of €110 million in the BASF Group’s financial result in 2013 and €80 million for 2012. The amounts recognized for remeasurements of defined contribution plans in other comprehensive income increased accordingly. The clarified definition of termination benefits in IAS 19 (revised) and the resulting change in accounting policy for early-retirement agreements reduced EBIT by €7 million in 2013 and by €17 million in 2012. This resulted in an increase in other pro-visions by the same amount.

Notes
Policies and scope of consolidation
Consolidated Financial StatementsBASF Report 2013 151
Statement of income and expense recognized in equity (amendments to IAS 1)As a result of amendments to IAS 1, income and expenses recognized directly in equity that will be reclassified to the state-ment of income at a later date must now be distinguished from those that will never be reclassified.
The application is reflected in the Statement of Income and Expense Recognized in Equity on page 145
Amendments to IFRS 7 – Financial Instruments: Disclo-suresWith this amendment to IFRS 7, the disclosure requirements on financial instruments that either are, or can be, offset are expanded. These changes have no material impact on the Consolidated Financial Statements of the BASF Group.
IFRS 13 – Fair Value MeasurementThis standard provides for the uniform measurement of fair value in IFRS-prepared financial statements. All fair value measure-ments required by other standards must now follow the uniform guidance provided by IFRS 13; only for IAS 17 and IFRS 2 do individual rules remain. The standard furthermore replaces and expands the disclosure requirements on fair value measure-ments in other IFRSs. IFRS 13 defines fair value as the exit price; that is, the price that would be received to sell an asset or paid to transfer a liability. A three-level hierarchy has been introduced based on dependence on observable market prices, as previ-ously known from the fair value measurement of financial assets. In accordance with the transitional provisions of IFRS 13, the new fair value measurement guidance has been applied pro-spectively and no comparative information for new disclosures has been provided. Notwithstanding the above, the change had no material impact on the measurements of the Group’s assets and liabilities.
Amendments to IAS 36 – Impairment of AssetsA new mandatory disclosure for goodwill impairment tests as per IAS 36 was introduced as a consequential amendment from IFRS 13 – Fair Value Measurement. Consequently, the recover-able amount of cash-generating units must be disclosed regard-less of whether an impairment was actually made. This note was introduced by the IASB unintentionally, however, and deleted with the amendment from May 2013. Furthermore, this amendment results in additional disclo-sures when an impairment is made and the recoverable amount is calculated based on fair value. The early adoption of the resulting changes was effective for the 2013 business year.
IFRS Annual Improvements: Cycle 2009 - 2011
Five standards were changed as part of the Annual Improve-ments project. The adjustment of the wording in certain IFRSs aims to clarify the guidance provided in existing standards. There are also changes that have an impact on accounting, recognition, measurement and information in the notes. The affected standards are IAS 1, IAS 16, IAS 32, IAS 34 and IFRS 1. These changes have no material impact on the Consolidated Financial Statements of the BASF Group.
Reclassification of loans within noncurrent assets Long-term loans are now reported under other receivables and miscellaneous assets. Such loans were previously reported in the balance sheet under other financial assets. The change in presentation better reflects the economic substance of this item as a receivable. The prior year figures have been adjusted for comparability. As of January 1, 2012, €252 million in loans were reclassified from “other financial assets” in the balance sheet to “other receivables and miscellaneous assets” as well as €259 million as of December 31, 2012.
Changes in segment structure BASF optimized its organizational structure effective January 1, 2013. Since this date, BASF’s business has been conducted by 14 (previously 15) operating divisions aggregated into five (pre-viously six) segments for reporting purposes. The divisions are largely allocated to the segments based on their business models. The Plastics segment has been dissolved; its busi-nesses with high-volume products and basic polymers have been integrated into the Chemicals segment, and the busi-nesses with innovative plastics have been bundled into the new Performance Materials division in the Functional Materials & Solutions segment.
For more information, see Note 4 from page 171 onward
The following provides a summary of the effects of the changes resulting from IFRS 10, IFRS 11, IAS 19 (revised), amendments to IAS 1 and the reclassification of loans for the reporting year 2012. The effects on net income and earnings per share resulted from the first-time application of IAS 19 (revised).

Notes
Policies and scope of consolidation
BASF Report 2013Consolidated Financial Statements152
Restatement of statement of income for 2012 as a result of revised accounting and reporting standards (million €)
2012(restated)
2012(previous) Change
Sales 72,129 78,729 (6,600)
Cost of sales (54,266) (58,022) 3,756
Gross profit on sales 17,863 20,707 (2,844)
Selling expenses (7,447) (7,644) 197
General and administrative expenses (1,359) (1,392) 33
Research and development expenses (1,732) (1,746) 14
Other operating income 1,709 1,722 (13)
Other operating expenses (2,653) (2,671) 18
Income from companies accounted for using the equity method1 361 – 361
Income from operations 6,742 8,976 (2,234)
Income from companies accounted for using the equity method – 171 (171)
Other income from shareholdings 75 75 –
Other expenses from shareholdings (43) (43) –
Interest income 177 179 (2)
Interest expense (724) (752) 28
Other financial results (250) (170) (80)
Financial results (765) (540) (225)
Income before taxes and minority interests 5,977 8,436 (2,459)
Income taxes (910) (3,214) 2,304
Income before minority interests 5,067 5,222 (155)
Minority interests (248) (343) 95
Net income 4,819 4,879 (60)
Earnings per share (€) 5.25 5.31 (0.06)
Dilution effects – – –
Diluted earnings per share (€) 5.25 5.31 (0.06)
1 Including income from companies accounted for using the equity method reported in the 2012 financial result

Notes
Policies and scope of consolidation
Consolidated Financial StatementsBASF Report 2013 153
Restatement of income before minority interests and statement of income and expense recognized directly in equity for 2012 as a result of revised accounting and reporting standards (million €)
2012(restated)
2012(previous) Change
Income before minority interests 5,067 5,222 (155)
Remeasurements of defined benefit plans (2,732) (2,813) 81
Remeasurements due to acquisition of majority shares (3) (3) –
Deferred taxes for items that will not be reclassified to the statement of income 847 874 (27)
Total income and expense recognized directly in equity that will not be reclassified to the statement of income at a later date (1,888) (1,942) 54
Foreign currency translation adjustment (211) (211) –
Fair value changes in available-for-sale securities 7 7 –
Cash flow hedges 12 12 –
Hedges in net investments on foreign operations 2 2 –
Deferred taxes for items that will be reclassified into the statement of income (11) (11) –
Total income and expense recognized directly in equity that will bereclassified to the statement of income at a later date (201) (201) –
Minority interests (9) (9) –
Total income and expense recognized directly in equity (2,098) (2,152) 54
Income before minority interests and statement of income and expense recognized directly in equity 2,969 3,070 (101)
Thereof attributable to shareholders of BASF SE 2,730 2,736 (6)
attributable to minority interests 239 334 (95)

Notes
Policies and scope of consolidation
BASF Report 2013Consolidated Financial Statements154
Restatement of balance sheet for 2012 as a result of revised accounting and reporting standards
Balance sheet – assets (million €)
December 31, 2012 January 1, 2012
restated previous change restated previous change
Intangible assets 12,193 12,241 (48) 11,850 11,919 (69)
Property, plant and equipment 16,610 18,177 (1,567) 16,182 17,966 (1,784)
Investments accounted for using the equity method 3,459 2,045 1,414 3,486 1,852 1,634
Other financial assets 613 880 (267) 578 848 (270)
Deferred tax assets 1,473 1,545 (72) 862 941 (79)
Other receivables and noncurrent assets 911 650 261 816 561 255
Noncurrent assets 35,259 35,538 (279) 33,774 34,087 (313)
Inventories 9,581 9,930 (349) 9,676 10,059 (383)
Accounts receivable, trade 9,506 10,138 (632) 10,151 10,886 (735)
Other receivables and miscellaneous current assets 3,455 3,504 (49) 3,679 3,781 (102)
Marketable securities 14 23 (9) 14 19 (5)
Cash and cash equivalents 1,647 1,777 (130) 1,903 2,048 (145)
Assets of disposal groups 3,264 3,417 (153) 295 295 –
Current assets 27,467 28,789 (1,322) 25,718 27,088 (1,370)
Total assets 62,726 64,327 (1,601) 59,492 61,175 (1,683)
Balance sheet – equity and liabilities (million €)
December 31, 2012 January 1, 2012
restated previous change restated previous change
Subscribed capital 1,176 1,176 – 1,176 1,176 –
Capital surplus 3,188 3,188 – 3,203 3,203 –
Retained earnings 23,708 20,106 3,602 21,168 19,446 1,722
Other equity items (3,461) 110 (3,571) (1,372) 314 (1,686)
Equity of shareholders of BASF SE 24,611 24,580 31 24,175 24,139 36
Minority interests 1,010 1,224 (214) 1,040 1,246 (206)
Equity 25,621 25,804 (183) 25,215 25,385 (170)
Provisions for pensions and similar obligations 5,421 5,460 (39) 3,162 3,189 (27)
Other provisions 2,925 3,024 (99) 3,223 3,335 (112)
Deferred tax liabilities 2,234 2,511 (277) 2,301 2,628 (327)
Financial indebtedness 8,704 9,113 (409) 8,670 9,019 (349)
Other liabilities 1,111 1,083 28 1,171 1,142 29
Noncurrent liabilities 20,395 21,191 (796) 18,527 19,313 (786)
Accounts payable, trade 4,502 4,696 (194) 4,827 5,121 (294)
Provisions 2,628 2,687 (59) 3,115 3,210 (95)
Tax liabilities 870 1,080 (210) 841 1,038 (197)
Financial indebtedness 4,094 4,242 (148) 3,833 3,985 (152)
Other liabilities 2,623 2,395 228 3,047 3,036 11
Liabilities of disposal groups 1,993 2,232 (239) 87 87 –
Current liabilities 16,710 17,332 (622) 15,750 16,477 (727)
Total equity and liabilities 62,726 64,327 (1,601) 59,492 61,175 (1,683)

Notes
Policies and scope of consolidation
Consolidated Financial StatementsBASF Report 2013 155
Restatement of statement of cash flows for 2012 as a result of revised accounting and reporting standards (million €)
2012(restated)
2012(previous) Change
Net income 4,819 4,879 (60)
Depreciation and amortization of intangible assets, property, plant and equipment and financial assets 3,288 3,561 (273)
Changes in inventories (672) (640) (32)
Changes in receivables (1,104) (1,122) 18
Changes in operating liabilities and other provisions 932 807 125
Changes in pension provisions, defined benefit assets, net assets of disposal groups and other non-cash items (223) (314) 91
Net gains from disposal of noncurrent assets and securities (438) (438) –
Cash provided by operating activities 6,602 6,733 (131)
Payments related to intangible assets and property, plant and equipment (4,015) (4,149) 134
Payments related to financial assets and securities (144) (144) –
Payments related to acquisitions (1,043) (1,043) –
Proceeds from divestitures 724 724 –
Proceeds from the disposal of noncurrent assets and securities 501 524 (23)
Cash used in investing activities (3,977) (4,088) 111
Capital increases/repayments and other equity transactions (1) (1) –
Proceeds from the addition of financial liabilities 4,904 5,005 (101)
Repayment of financial liabilities (5,247) (5,291) 44
Dividends paid
To shareholders of BASF SE (2,296) (2,296) –
minority shareholders (264) (345) 81
Cash used in financing activities (2,904) (2,928) 24
Net changes in cash and cash equivalents (279) (283) 4
Effects on cash and cash equivalents
From foreign exchange rates 21 10 11
changes in scope of consolidation 2 2 –
Cash and cash equivalents at the beginning of the year 1,903 2,048 (145)
Cash and cash equivalents at the end of the year 1,647 1,777 (130)
IFRSs and IFRICs not yet to be consideredThe effects on the BASF Group financial statements of the IFRSs and IFRICs not yet in force or not yet endorsed by the European Union in the 2013 fiscal year were reviewed and are explained below. Other new standards or interpretations and amendments of existing standards and interpretations have no material impact on the BASF Group. Implementing the standards before endorse ment by the European Union is not planned.
IFRS 9 – Financial Instruments In November 2009, IASB published IFRS 9 – Financial Instru-ments. As the first phase of the project to replace IAS 39 – Financial Instruments: Recognition and Measurement, this stan-dard introduces new classes, classification criteria and measurement criteria for financial instruments. In addition, new requirements under IFRS 9 were published in October 2010 on the accounting for financial liabilities and the derecognition of finan cial instruments. In particular, these changes will affect those financial liabilities that were optionally measured at fair value.
In November 2013, new regulations were published pertaining to hedge accounting. These contain future requirements for the accounting treatment of hedging relationships. For liabilities measured at fair value, an amendment to IFRS 9 furthermore allows the early application of the option to recognize changes in the fair value attributable to changes in the liability’s credit risk directly in equity. Moreover, the effective date of January 1, 2015, was rescinded. A new effective date will only be determined when the standard is complete. Only afterward is endorsement by the European Union foreseen. The potential impact on BASF is currently being analyzed.
1.3 – Group accounting principles
Scope of consolidation: The scope of consolidation is based on the application of the new standards IFRS 10 and 11 effec-tive January 1, 2013.
For more information, see Note 1.2 from page 149 onward

Notes
Policies and scope of consolidation
BASF Report 2013Consolidated Financial Statements156
In addition to BASF SE, the Consolidated Financial Statements include all material subsidiaries on a fully consolidated and all material joint operations on a proportionally consolidated basis. Companies whose business is dormant or of low volume, and are of secondary importance for the presentation of a true and fair view of the net assets, financial position and results of opera-tions, are not consolidated, but rather are reported under other shareholdings. These companies are carried at amortized cost and are written down in the case of an impairment. The aggre-gate assets and equity of these companies amount to less than 1% of the corresponding value at Group level. Application of the equity method: Joint ventures and associated companies are accounted for in the Consolidated Financial Statements using the equity method. Associated com-panies are entities in which significant influence can be exer-cised over their operating and financial policies and which are not subsidiaries, joint ventures or joint operations. In general, this applies to companies in which BASF has an interest between 20% and 50%. Consolidation methods: Assets and liabilities of consoli-dated companies are uniformly recognized and measured in accordance with the principles described herein. For equity- accounted companies, material deviations in measurement resulting from the application of other accounting principles are adjusted for. Transactions between consolidated companies as well as intercompany profits resulting from sales and services rendered between consolidated companies are eliminated in full; for joint operations, they are proportionally eliminated. Material intercom-pany profits related to companies accounted for using the equity method are eliminated. Capital consolidation is conducted at the acquisition date according to the purchase method. Initially, all assets, liabilities and additional intangible assets that are to be capitalized are valued at fair value. Finally, the acquisition cost is compared with the proportional share of the net assets acquired at fair value. The resulting positive differences are capitalized as goodwill. Negative differences are reviewed once more, then recognized directly in the income statement. The incidental acquisition costs of a business combination are recognized in the income statement under other operating expenses. Foreign currency translations: The cost of assets acquired in foreign currencies and revenue from sales in foreign currencies are recorded at the exchange rate on the date of the transaction. Foreign currency receivables and liabilities are valued at the exchange rates on the balance sheet date. Foreign exchange gains or losses resulting from the translation of assets and liabilities are reported as other operating expenses or other operating income under other financial income or expenses; for available-for-sale financial assets, they are reported in other comprehensive income.
Translation of foreign currency financial statements: The translation of foreign currency financial statements depends on the functional currency of the consolidated companies. For companies whose functional currency is not the euro, transla-tion into the reporting currency is based on the closing rate method: Balance sheet items are translated into euros using closing rates on the balance sheet date; expenses and income are translated into euros at monthly average rates and accumu-lated for the year. The difference between a company’s trans-lated equity at historical rates at the time of acquisition and its equity at closing rates on the balance sheet date is reported separately in equity under other comprehensive income (trans-lation adjustments) and is recognized in income only upon the company’s disposal. For certain companies outside the eurozone or U.S. dollar zone, the euro or U.S. dollar is the functional currency.
Selected exchange rates (1 EUR equals)
Closing rates Average rates
Dec. 31, 2013
Dec. 31, 2012
2013
2012
Brazil (BRL) 3.26 2.70 2.87 2.51
China (CNY) 8.35 8.22 8.16 8.11
Great Britain (GBP) 0.83 0.82 0.85 0.81
Japan (JPY) 144.72 113.61 129.66 102.49
Malaysia (MYR) 4.52 4.03 4.19 3.97
Mexico (MXN) 18.07 17.18 16.96 16.90
Russia (RUB) 45.32 40.33 42.34 39.93
Switzerland (CHF) 1.23 1.21 1.23 1.21
South Korea (KRW) 1,450.93 1,406.23 1,453.91 1,447.69
United States (USD) 1.38 1.32 1.33 1.28
1.4 – Accounting policies
Revenue recognitionRevenues from the sale of goods or the rendering of services are recognized upon the transfer of ownership and risk to the buyer. They are measured at the fair value of the consideration received. Sales revenues are reported without sales tax. Expected rebates and other trade discounts are either accrued or deducted. Provisions are made according to the principle of individual measurement to cover probable risks related to the return of products, estimated future warranty obligations and other claims. Revenues from the sale of precious metals to industrial customers as well as revenues from natural gas trading are recognized at the time of shipment and the corresponding pur-chase price is recorded at cost of sales. In the trading of pre-cious metals and their derivatives with broker-traders, where there is usually no physical delivery, revenues are recorded on a net basis. Revenues from the natural gas trading activities of a project company consolidated by BASF are also recorded on a net basis.

Notes
Policies and scope of consolidation
Consolidated Financial StatementsBASF Report 2013 157
In certain cases, customer acceptance is required on delivery. For these cases, sales are recognized after the buyer’s consent has been given. Payments relating to the sale or licensing of technologies or technological expertise are recognized in income according to the contractually agreed transfer of the rights and obligations associated with those technologies.
AssetsAcquired intangible assets (excluding goodwill) with defined useful lives are valued at cost less scheduled straight-line amor-tization. The useful life is determined using the period of the underlying contract or the period of time over which the intan-gible asset is expected to be used. Impairments are recognized if the recoverable amount of the asset is lower than the carrying amount. The recoverable amount is the higher of either fair value less costs to sell and the value in use. If the reasons for the impairment no longer exist, the write-downs are reversed up to the value of the asset, had an impairment not been recorded. Depending on the type of intangible asset, the amortization expense is recorded as cost of sales, selling expenses, research and development expenses or other operating expenses. Intangible assets with indefinite useful lives are trade names and trademarks that have been acquired as part of acquisitions. They are measured at their cost and tested for impairment annu ally. Goodwill is only written down if there is an impairment. Impair ment testing takes place once a year and whenever there is an indication of an impairment. Internally generated intangible assets primarily comprise internally developed software. Such software and other inter-nally generated assets for internal use are valued at cost and amortized over their useful lives. Impairments are recognized if the carrying amount of an asset exceeds the recoverable amount. In addition to those costs directly attributable to the asset, costs of internally generated intangible assets also include an appropriate allocation of overhead costs. Borrowing costs are capitalized to the extent that they apply to the purchase or the period of construction of qualifying assets. The estimated useful lives and amortization methods are based on historical values, plans and estimates. These esti-mates also consider the period and distribution of future cash inflows. The depreciation methods, useful lives and residual values are reviewed at each balance sheet date. The weighted-average useful lives of intangible assets amounted to:
Average amortization in years
2013 2012
Distribution, supply and similar rights 15 13
Product rights, licenses and trademarks 17 17
Know-how, patents and production technologies 14 13
Internally generated intangible assets 4 5
Other rights and values 8 7
Emission rights: Emission right certificates, granted free-of-charge by the German Emissions Trading Authority (Deutsche Emissionshandelsstelle) or a similar authority in other countries, are recognized at fair value at the time they are credited to the electronic register run by the relevant governmental author-ity. Purchased emission rights are recorded at cost. In some Euro pean countries, emission certificates for 2013 will not be credited until 2014. In such cases, the rights to receive emission certi ficates are capitalized as intangible assets. Subsequently, they are measured at fair value, up to a maximum of cost. If the fair value is lower than the carrying amount on the balance sheet date, the emission rights are written down. Property, plant and equipment are carried over their use-ful lives at acquisition or production cost less scheduled depre-ciation and impairments. The revaluation method is not applied. Low-value assets are fully written off in the year of acquisition and are shown as disposals. The cost of self-constructed plants includes direct costs, appropriate allocations of material and manufacturing costs, and a share of the general administrative costs of the divisions involved in the construction of the plants. Borrowing costs are capitalized to the extent that they apply to the purchase or the period of construction of qualifying assets. Expenditures related to the scheduled maintenance of large-scale plants are separately capitalized and depreciated using the straight-line method over the period until the next planned turnaround. The costs for the replacement of compo-nents are recognized as assets when an additional future bene-fit is expected. The book value of the replaced components is derecognized. The costs for maintenance and repair as part of normal business operations are recognized as an expense. Both movable and immovable fixed assets are for the most part depreciated using the straight-line method. The estimated useful lives and amortization methods applied are based on his-torical values, plans and estimates. These estimates also con-sider the period and distribution of future cash inflows. The depreciation methods, useful lives and residual values are reviewed at each balance sheet date. The weighted-average depreciation periods were as follows:

Notes
Policies and scope of consolidation
BASF Report 2013Consolidated Financial Statements158
Weighted-average depreciation period in years
2013 2012
Buildings and structural installations 22 20
Machinery and technical equipment 10 10
Long-distance natural gas pipelines 25 25
Miscellaneous equipment and fixtures 7 7
Impairments are recognized if the recoverable amount of the asset is lower than the carrying amount. The measurement is based on fair value less selling costs or the value in use. Value in use is determined on the basis of the average weighted cost of capital after taxes, which was between 7.42% and 12.22% (2012: 6.79% and 11.59%), depending on tax rates and country-related risks. An impairment is recognized for the difference between the carrying amount and the recoverable amount. If the reasons for the impairment no longer exist, the write-downs are reversed up to the value of the asset, if an impair ment had not been recorded. Investment properties held to realize capital gains or rental income are immaterial. They are valued at the lower of fair value or acquisition cost less scheduled depreciation. Leases: A lease is an agreement whereby the lessor conveys to the lessee in return for a payment or series of payments the right to use an asset for an agreed period of time. Leasing contracts are classified as either finance or operating leases. Assets subject to operating leases are not capitalized. Lease payments are recognized in the income statement in the year they are incurred. A lease is classified as a finance lease if it substantially transfers all of the risks and rewards related to the leased asset. Assets subject to a finance lease are recognized as assets at the present value of the minimum lease payments. A leasing liability is recorded in the same amount. The periodic lease payments must be divided into principal and interest compo-nents. The principal component reduces the outstanding liability, while the interest component represents an interest expense. Depreciation takes place over the shorter of the useful life of the asset or the period of the lease. Leases can be embedded within other contracts. If sepa-ration is required under IFRS, then the embedded lease is recorded separately from its host contract and each compo-nent of the contract is carried and measured in accordance with the applicable regulations. BASF acts as a lessor for finance leases to a minor extent only.
Borrowing costs: Borrowing costs directly incurred as part of the acquisition, construction or production of an eligible asset are capitalized as part of the acquisition or production cost of that asset. A qualifying asset is an asset when the time period to get ready for its intended use or sale is longer than one year. Borrowing costs are capitalized up to the date the asset is ready for its intended use. The borrowing costs are calculated based on a rate of 4.5% (2012: 4.5%), which is adjusted on a country-specific basis. All other borrowing costs are recognized as an expense in the period in which they are incurred. Government grants: Government grants related to the acquisition or construction of property, plant and equipment reduce the acquisition or construction cost of the respective assets. Other government grants or government assistance are recognized immediately as other operating income or treated as deferred income and reversed over the underlying period. Investments accounted for using the equity method: The carrying amounts of these companies are adjusted annually based on the pro rata share of net income, dividends and other changes in equity. Should there be indications of a permanent reduction in the value of an investment, an impairment is recog-nized in the income statement. Inventories are carried at cost. If the listed, market or fair value of the sales product which forms the basis for the net realizable value is lower, then this is applied and an impairment is recognized. The net realizable value is based on the selling price in the ordinary course of business less the estimated costs of completing and selling the product. In addition to direct costs, cost of conversion includes an appropriate allocation of production overhead costs based on normal utilization rates of the production plants, provided that they are related to the production process. Pensions, social services and voluntary social benefits are also included, as well as allocations for administrative costs, provided they relate to the production. Borrowing costs are not included in cost of conversion. Valuation allowances on inventories result from price declines in sales products and extended inventory coverage. For the measurement of inventories in the precious metals trading business, the Company applies the exception for com-modity broker-traders under IAS 2. Accordingly, inventories held exclusively for trading purposes are to be measured at fair value. Changes in value are recognized in the income statement. Deferred taxes: Deferred taxes are recorded for temporary differences between the carrying amount of assets and liabilities in the financial statements and the carrying amounts for tax purposes as well as for tax loss carryforwards and unused tax credits. This also comprises temporary differences arising from business combinations, with the exception of goodwill. Deferred tax assets and liabilities are calculated according to country- specific tax rates. Any changes to the tax rate enacted or substantively enacted on or before the balance sheet date are taken into consideration. The tax rate for corporations based in Germany was, as in the previous year, 29%.

Notes
Policies and scope of consolidation
Consolidated Financial StatementsBASF Report 2013 159
Deferred tax assets are offset against deferred tax liabilities provided they are related to the same taxation authority. Surpluses of deferred tax assets are only recognized provided that the tax benefits are likely to be realized. The valuation of deferred tax assets depends on the estimated probability of a reversal of the temporary differences and the ability to utilize tax loss carryfor-wards and unused tax credits. This depends on whether future taxable profits will exist during the period in which temporary differences are reversed and in which tax loss carryforwards and unused tax credits can be claimed. Based on experience and the expected development of taxable income, it is assumed that the benefits of the recognized deferred tax assets will be realized. The valuation of deferred tax assets is based on internal projections of the future earnings of the particular Group company. Changes in deferred taxes in the balance sheet are recorded as deferred tax expense or income if the transaction or event on which they are based is not to be recognized directly in equity. For those effects which have been recognized in equity, changes to deferred tax assets and tax liabilities are also recognized directly in equity. No deferred tax liabilities are recognized for differences between the proportional IFRS equity and the tax base of the investment in a consolidated subsidiary when a reversal of these differences is not expected in the foreseeable future. Deferred tax liabilities are recognized for dividend distributions which are planned for the following year if these distributions lead to a reversal of temporary differences. For more information, see Note 11 from page 178 onward
Financial instrumentsFinancial assets and financial liabilities are recognized in the balance sheet when the BASF Group becomes a party to a financial instrument. Financial assets are derecognized when the contractual rights to the cash flows from the financial asset expire or when the financial asset, with all risks and rewards of ownership, is transferred. Financial liabilities are derecognized when the contractual obligation expires, is discharged or cancelled. Regular way purchases and sales of financial instruments are accounted for using the settlement date; in precious metals trading, the day of trading is used. The fair value of a financial instrument is the amount that would be received to sell an asset or paid to transfer a liability in an orderly transaction between market participants at the measurement date. When pricing on an active market is avail-able, for example on a stock exchange, this price is used for the measurement. Otherwise, the measurement is based on inter-nal measurement models using current market parameters or external measurements, for example, from banks. These inter-nal measurements predominantly use the net present value method and option pricing models. If there is objective evidence of a permanent impairment of a financial instrument that is not measured at fair value through profit or loss, an impairment loss is recognized. If the reason for the impairment of loans and receivables as well as held-to- maturity financial instruments no longer exists, the impairment is reversed up to the amortized cost and recognized in the income statement. Impairments on financial instruments are booked in separate accounts.
Financial assets and liabilities are divided into the following mea-surement categories:
– Financial assets and liabilities at fair value recognized in the income statement consist of derivatives and other trad-ing instruments. At BASF, this measurement category only includes derivatives. Derivatives are reported in other assets or other liabilities. BASF does not make use of the fair value option under IAS 39. The calculation of fair values is based on market parameters or measurement models based on such parameters. In some exceptional cases, the fair value is calculated using parameters which are not observable on the market.
– Loans and receivables comprise financial assets with fixed or determinable payments, which are not quoted on an active market and are not derivatives or classified as available-for-sale. This measurement category includes trade accounts receivable as well as other receivables and loans reported under other receivables and miscellaneous assets. Initial mea-surement is done at fair value, which generally matches the nominal value of the receivable or loan. Interest-free and low-interest long-term loans and receivables are recorded at pres-ent value. Subsequent measurement recognized in income is generally made at amortized cost using the effective interest method. If there is objective evidence for an impairment of a receiv-able or loan, an individual valuation allowance is made. When assessing the need for a valuation allowance, regional and sector-specific conditions are considered. In addition, use is made of internal and external ratings as well as the assess-ments of debt collection agencies and credit insurers, when available. A portion of receivables is covered by credit insur-ance. Bank guarantees and letters of credit are used to a lim-ited extent. Valuation allowances are only recognized for those receivables which are not covered by insurance or other col-lateral. The valuation allowances for receivables whose insur-ance includes a deductible cannot exceed the amount of the deductible. Impairments are based on historical values relat-ing to customer solvency and the age, period overdue, insur-ance policies and customer-specific risks. In addition, a valu-ation allowance must be recognized when the contractual conditions which form the basis for the receivable are changed through renegotiation in such a way that the present value of the future cash flows decreases. Receivables for which no objective indication for an impair-ment exists may be impaired based on historical default rates. In addition, valuation allowances are made on receivables based on transfer risks for certain countries. If, in a subsequent period, the amount of the valuation allowance decreases and the decrease can be related objec-tively to an event occurring after the impairment was recog-nized, the previously recognized write-down is to be reversed in the income statement. Reversals of valuation allowances may not exceed amortized cost. Loans and receivables are derec-ognized when they are definitively found to be uncollectible.

Notes
Policies and scope of consolidation
BASF Report 2013Consolidated Financial Statements160
– Held-to-maturity financial assets consist of non-derivative financial assets with fixed or determinable payments and a fixed term, for which there is the ability and intent to hold until maturity, and which do not fall under other valuation cate-gories. Initial measurement is done at fair value, which matches the nominal value in most cases. Subsequent measurement is carried out at amortized cost, using the effective interest method. For BASF, there are no material financial assets that fall under this category.
– Available-for-sale financial assets comprise financial assets which are not derivatives and do not fall under any of the previously stated valuation categories. This measurement category comprises shareholdings reported under the item other financial assets which are not accounted for using the equity method as well as short and long-term securities. The measurement is carried out at fair value. Changes in fair value are recognized directly in equity under the item other comprehensive income and are only recognized in the income statement when the assets are disposed of or have been impaired. Subsequent reversals are recognized directly in equity (other comprehensive income). Only in the case of debt instruments are reversals up to the amount of the original impair ment recognized in the income statement; reversals above this amount are recognized directly in equity. If the fair value of available-for-sale financial assets drops below acqui-sition costs, the assets are impaired if the decline in value is significant and can be considered lasting. The fair values are determined using market prices. Shareholdings whose fair value cannot be reliably determined are carried at acquisition cost and are written down in the case of an impairment. When determining the value of these shareholdings, the acquisition costs constitute the best estimate of their fair value. This cat-egory of shareholdings includes investments in other share-holdings, provided that these shares are not publicly traded. There are no plans to sell significant stakes in these share-holdings.
– Financial liabilities which are not derivatives are initially measured at fair value, which normally corresponds to the amount received. This usually corresponds to the amount received. Subsequent measurement is carried out at amor-tized cost, using the effective interest method.
– Cash and cash equivalents consist primarily of cash on hand and bank balances.
There were no reclassifications from one measurement category to another in 2013 and 2012. The same applies for transfers between levels in the fair value hierarchy. Revenue from interest-bearing assets is recognized on the outstanding receivables on the balance sheet date using interest rates calculated by means of the effective interest method. Dividends from shareholdings not accounted for using the equity method are recognized when the shareholders’ right to receive payment is established. Derivative financial instruments can be embedded within other contracts. If IFRS requires separation, then the embed-ded derivative is recorded separately from its host contract and shown at fair value. Financial guarantees of the BASF Group are contracts that require compensation payments to be made to the guar-antee holder if a debtor fails to make payment when due under the terms of the financial guarantee. Financial guarantees are measured at fair value upon initial recognition. In subsequent periods, financial guarantees are carried at the higher of amor-tized cost or the best estimate of the present obligation on the financial reporting date. Cash flow hedge accounting is applied for selected deals to hedge future transactions. The effective portion of the change in fair value of the derivative is thereby recognized directly in equity under other comprehensive income, taking deferred taxes into account. The ineffective portion is recognized immediately in the income statement. In the case of future trans-actions that will lead to a nonfinancial asset or a nonfinancial debt, the cumulative fair value changes in equity are either charged against the acquisition costs on initial recognition or recognized in profit or loss in the reporting period in which the hedged item is recorded in the income statement. For hedges based on financial assets or debts, the cumulative fair value changes of the hedges are transferred from equity to the income statement in the reporting period in which the hedged item is recognized in the income statement. The maturity of the hedg-ing instrument is determined based on the effective date of the future trans action. Hedge accounting can be used to hedge the translation risk from investments in foreign subsidiaries (hedge of a net investment in a foreign operation). The effective portion of the hedge is recognized in equity. If the foreign operation is dis-posed of, these amounts are reclassified to the income state-ment. The ineffective portion of the hedge is immediately rec-ognized in the income statement.

Notes
Policies and scope of consolidation
Consolidated Financial StatementsBASF Report 2013 161
When fair value hedges are used, the asset or liability is hedged against the risk of a change in fair value, with changes in the market value of the derivative financial instruments recognized in the income statement. Furthermore, the carrying amount of the underlying transaction is adjusted by the profit or loss resulting from the hedged risk, offsetting the effect in the income statement. The derivatives employed by BASF for hedging purposes are effective hedges from an economic point of view. Changes in the fair value of the derivatives almost completely offset the changes in the value of the underlying transactions. DebtProvisions for pensions and similar obligations: Provisions for pensions are based on actuarial computations made accord-ing to the projected unit credit method, which applies valuation parameters that include: future developments in compensation, pensions and inflation, employee turnover and the life expec-tancy of beneficiaries. The resulting obligations are discounted on the balance sheet date using the market yields on high- quality corporate fixed-rate bonds with an AA rating. Similar obligations, especially those arising from commit-ments by North American Group companies to pay the health-care costs and life insurance premiums of retired staff and their dependents, are included in pension provisions. The calculation of pension provisions is based on actuarial reports.
For more information on provisions for pensions and similar obli-gations, see Note 22 from page 190 onward
Other provisions: Other provisions are recognized when there is a present obligation as a result of a past event and when there is a probable outflow of resources whose amount can be reliably estimated. Provisions are recognized at the probable settlement value. Provisions for German trade income tax, German corpo-rate income tax and similar income taxes are determined and recognized in the amount necessary to meet the expected payment obligations less any prepayments that have been made. Other taxes to be assessed are considered accordingly. Provisions are established for certain environmental pro-tection measures and risks if the measures are considered likely as a result of present legal or constructive obligations arising from a past event. Provisions for restoration obligations primar-ily concern the filling of wells and the removal of production facilities upon the termination of production in the Oil & Gas segment. When the obligation arises, the provision is measured at the present value of the future restoration costs. An asset is capitalized for the same amount as part of the carrying amount of the plant concerned and is depreciated along with the plant. The discount on the provision is unwound annually until the time of the planned restoration.
Other provisions also include expected charges for the rehabili-tation of contaminated sites, the recultivation of landfills, the removal of environmental contamination at existing production or storage facilities and other similar measures. If BASF is the only responsible party that can be identified, the provision covers the entire expected claim. At sites operated together with one or more partners, the provision generally covers only BASF’s share of the expected claim. The determination of the amount of the provision is based on the available technical information on the site, the technology used, legal regulations, and official obligations. Provisions are recognized for expected severance pay-ments or similar personnel expenses as well as for demolition expenses and other charges related to the closing of operations that have been planned and publicly announced by manage-ment. Provisions for long-service and anniversary bonuses are predominantly calculated based on actuarial principles. For contracts signed under the early retirement programs, approved supplemental payments are accrued in installments until the end of the exemption phase at the latest. Accounting and measure-ment follow the German Accounting Standards Committee’s application note 1 (IFRS) of December 4, 2012. Other provisions also cover risks resulting from legal disputes and proceedings. In order to determine the amount of the provisions, the Company takes into consideration the facts related to each case, the size of the claim, claims awarded in similar cases and independent expert advice as well as assump-tions regarding the probability of a successful claim and the range of possible claims. The actual costs can deviate from these estimates.
For more information, see Note 26 on page 200
The probable amount required to settle long-term provi-sions is discounted if the effect of discounting is material. In this case, the provision is recognized at present value. Assumptions must be made in determining the discount rate used for calcu-lating long-term provisions. Financing costs related to the com-pounding of provisions in subsequent periods are shown in other financial results.
Other accounting policiesAcquisition of companies: In company acquisitions, the acquired assets and liabilities are recognized at fair value on the date the acquirer effectively obtains control. The fair value of acquired assets and assumed liabilities at the date of exchange, as well as the useful lives of the acquired assets, are determined on the basis of assumptions. The measurement is largely based on projected cash flows. The actual cash flows can differ signifi-cantly from the cash flows used to determine the fair values. Independent external appraisals are used for the purchase price allocation of material acquisitions. Valuations in the course of busi-ness combinations are based on existing information as of the acquisition date.

Notes
Policies and scope of consolidation
BASF Report 2013Consolidated Financial Statements162
Groups of assets and liabilities held for disposal/disposal groups: These comprise those assets and directly associated liabilities shown on the balance sheet whose sale in the context of a single transaction is highly probable. The assets and liabil-ities of disposal groups are recognized at the lower of the sum of their carrying amounts or fair value less costs to sell; this does not apply to assets which do not fall under the valuation princi-ples of IFRS 5. Scheduled depreciation of noncurrent assets and the use of the equity method are suspended.
Further information on the assets and liabilities of the disposal group can be found in Note 2.4 on page 169
Oil and gas exploration: Exploration and development expen-ditures are accounted for using the successful efforts method. Under this method, costs of successful exploratory drilling as well as successful and dry development wells are capitalized. An exploration well is a well located outside of an area with proven oil and gas reserves. A development well is a well which is drilled to the depth of a reservoir of oil or gas within an area with proven reserves. Exploratory drilling is generally reported under construc-tion in progress until its success can be determined. When the presence of hydrocarbons is proven such that the economic development of the field is probable, the costs remain capital-ized as suspended well costs. At least once a year, all sus-pended wells are assessed from an economic, technical and strategic viewpoint to see if development is still intended. If this is not the case, the capitalized expenses for the well in question are written off. When reserves are proven and the development of the field begins, the exploration wells are reclassified as machinery and technical equipment. Production costs include all costs incurred to operate, repair and maintain the wells as well as the associated plant and ancillary production equipment, including the associated depreciation. The unit of production method is used to depreciate assets from oil and gas exploration at the field or reservoir level. Depre-ciation is generally calculated on the basis of the production of the period in relation to the proven, developed reserves. Exploration expenses pertain exclusively to the Oil & Gas segment and include all costs related to areas with unproven oil or gas deposits. These include costs for the exploration of areas with possible oil or gas deposits, among others. Costs for geo-logical and geophysical investigations are always reported under exploration expenses. In addition, this item includes all valua-tion allowances for capitalized expenses for exploration wells which did not encounter proven reserves. Scheduled depreciation of successful exploratory drilling is reported under cost of sales.
An Exploration and Production Sharing Agreement is a type of contract in crude oil and gas concessions whereby the expen ses and profits from the exploration, development and production phases are divided between the state and one or more explora tion and production companies using defined keys. The revenue BASF is entitled to under such contracts is reported as sales. The intangible asset from the marketing contract for natural gas from the Yuzhno Russkoye natural gas field is amortized based on BASF’s share of the produced and distributed volumes. Intangible assets in the Oil & Gas segment relate primarily to exploration and drilling rights. During the exploration phase, these are not subject to scheduled amortization but are tested for impairment annually. When economic success is determined, the rights are amortized in accordance with the unit of produc-tion method.
Use of estimates and assumptions in the preparation of the Consolidated Financial StatementsThe carrying amount of assets, liabilities and provisions, contingent liabilities and other financial obligations in the Consolidated Financial Statements depends on the use of estimates and assumptions. Specific estimates or assumptions used in individual accounting or valuation methods are disclosed in their respective sections. They are based on the circum-stances and estimates on the balance sheet date and affect the reported amounts of income and expenses during the report-ing periods. These assumptions affect the determination of useful lives of property, plant and equipment and intangible assets, the measurement of provisions, the carrying amount of investments, and other similar valuations of assets and obliga-tions. Although uncertainty is appropriately incorporated in the valuation factors, actual results can differ from these estimates.
Impairment tests on assets are carried out whenever certain triggering events indicate that an impairment may be necessary. External triggering events include, for example, changes in customer industries, technologies used and economic down-turns. Internal triggering events for an impairment include lower product profitability, planned restructuring measures or physical damage to assets.

Notes
Policies and scope of consolidation
Consolidated Financial StatementsBASF Report 2013 163
Impairment tests are based on a comparison of the carrying amount and the recoverable amount. The recoverable amount is the higher of fair value less costs to sell and the value in use. Value in use is generally determined using the discounted cash flow method. The estimation of cash flows and the assumptions used consider all information available on the respective balance sheet date on the future development of the operating business. Actual future developments may vary. Impairment testing relies upon the cash-generating unit’s long-term earnings forecasts, which are based on economic trends. The weighted average cost of capital (WACC) based on the Capital Asset Pricing Model plays an important role in impairment testing. The WACC is made up of the risk-free interest rate, the country-specific tax rates, the beta of the BASF share and assumptions as to the spread for credit risk and the market risk premium for the cost of equity. Additional important assumptions are the forecasts for the detailed planning period and the terminal growth rates used.
For more information, see Note 14 from page 181 onward
An impairment is recognized if the recoverable amount of the asset is lower than the carrying amount. The impairment of the asset (excluding goodwill) is made in the amount of the differ-ence between these amounts. The goodwill impairment test is based on cash-generating units. At BASF, the cash-generating units are predominantly the business units, or in certain cases, the divisions. If there is a need for a valuation allowance, the carrying amount of goodwill is written down, and if necessary completely written off as a first step. If there is further need for a valuation allowance, this is allocated to the remaining assets of the cash-generating unit. Goodwill impairments are reported under other operating expenses. Impairment reversals are not conducted for goodwill.
2 – Scope of consolidation
2.1 – Changes in scope of consolidation
In 2013, the scope of consolidation for the Consolidated Financial Statements encompassed 309 companies (2012: 312). Of this number, nine companies were first-time consolidations (2012: 35). Since the beginning of 2013, a total of twelve companies were deconsolidated due to divestiture, merger, sale or immateriality (2012: 22).
First-time consolidations in 2013 comprised:
– A total of three companies in conjunction with the acquisition of Pronova BioPharma ASA
– One company through the acquisition of Verenium Corpora-tion
– An additional five companies which had previously not been consolidated, which were registered in Germany, South Africa, Uruguay, Canada and China.
First-time consolidations in 2012 comprised:
– A total of 12 companies in conjunction with the acquisition of the Becker Underwood Group
– Four companies as a result of the acquisition of Novolyte – An additional 19 companies which had previously not been consolidated, which are registered in Germany, the United States, the Netherlands, the United Kingdom, Belgium, France, China, Brazil, Ukraine, South Korea and Bahrain.
A list of companies included in the Consolidated Financial Statements and a list of all companies in which BASF SE has a share as required by Section 313(2) of the German Commercial Code is provided in the List of Shares Held.
For more information, see Note 3 on page 171 and basf.com/en/investor/cg
Scope of consolidation
EuropeThereof
GermanyNorth
America Asia Pacific
South America,
Africa, Middle East 2013 2012
As of January 1 191 70 46 54 21 312 299
Thereof proportionally consolidated 6 – – 2 – 8 10
First-time consolidations 4 1 2 1 2 9 35
Thereof proportionally consolidated – – – – – – –
Deconsolidations 6 4 6 – – 12 22
Thereof proportionally consolidated – – – – – – 2
As of December 31 189 67 42 55 23 309 312
Thereof proportionally consolidated 6 – – 2 – 8 8

Notes
Policies and scope of consolidation
BASF Report 2013Consolidated Financial Statements164
Overview of impact of changes to the scope of consolidation1 (excluding acquisitions and divestitures)
2013 2012
Million € % Million € %
Sales 32 . (16) .
Noncurrent assets (3) . 49 0.1
Thereof property, plant and equipment 1 . 54 0.3
Current assets 28 0.1 7 .
Thereof cash and cash equivalents 2 0.1 . .
Assets 25 . 56 0.1
Equity 8 . 6 .
Noncurrent liabilities 5 . 12 0.1
Thereof financial indebtedness . . . .
Current liabilities 12 . 38 0.2
Thereof financial indebtedness 5 0.2 . .
Total equity and liabilities 25 . 56 0.1
Contingent liabilities and other financial obligations . . 20 0.2
1 Effects from the initial use of IFRS 10 und IFRS 11 are not included in this overview, since they have been considered as of January 1, 2012.
2.2 – Joint operations
Proportionally consolidated joint operations particularly comprise:
– ELLBA C.V., Rotterdam, the Netherlands, and ELLBA Eastern Private Ltd., Singapore, which are operated jointly with Shell and produce propylene oxide and styrene monomers
– BASF DOW HPPO Production B.V.B.A., Antwerp, Belgium, which is operated jointly with The Dow Chemical Company to produce propylene oxide
– ZAO Achimgaz, Novy Urengoy, Russia, which is jointly operated with Gazprom for the production of natural gas and condensate.
BASF holds a 50% share in each of these companies and controls them together with an additional partner. The companies sell their products directly to the partners and have no access to external financing sources. They were therefore classified as joint operations per IFRS 11.
Financial information on proportionally consolidated companies (BASF stake)
Million € 2013 2012
Income statement information
Sales 1,548 1,423
Income from operations 220 147
Income before taxes and minority interests 219 149
Net income 195 143
Balance sheet information
Noncurrent assets 503 434
Thereof property, plant and equipment 468 396
Current assets 269 256
Thereof marketable securities, cash and cash equivalents 26 13
Total assets 772 690
Equity 388 319
Noncurrent liabilities 202 201
Thereof financial indebtedness – –
Current liabilities 182 170
Thereof financial indebtedness – –
Total equity and liabilities 772 690
Contingent liabilities and other financial obligations 575 679
Statement of cash flows
Cash provided by operating activities 272 210
Cash used in investing activities (140) (117)
Cash used in financing activities (119) (96)
Net changes in cash and cash equivalents 13 (3)
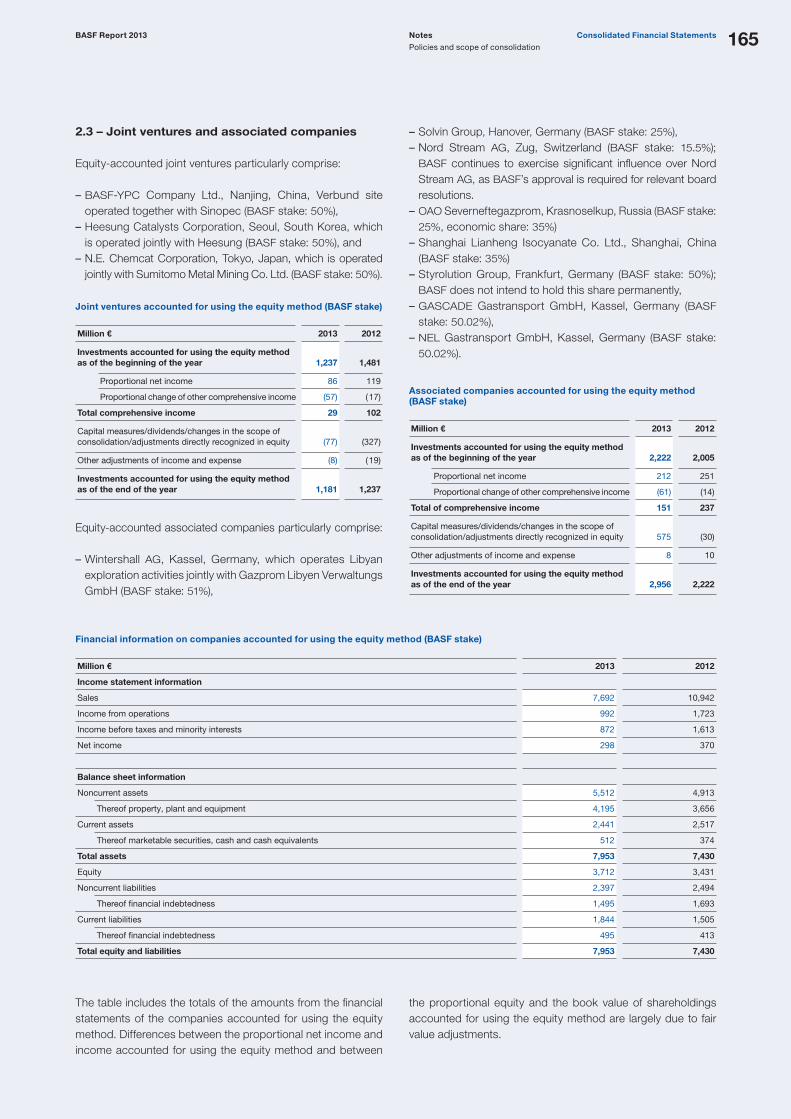
Notes
Policies and scope of consolidation
Consolidated Financial StatementsBASF Report 2013 165
2.3 – Joint ventures and associated companies
Equity-accounted joint ventures particularly comprise:
– BASF-YPC Company Ltd., Nanjing, China, Verbund site operated together with Sinopec (BASF stake: 50%),
– Heesung Catalysts Corporation, Seoul, South Korea, which is operated jointly with Heesung (BASF stake: 50%), and
– N.E. Chemcat Corporation, Tokyo, Japan, which is operated jointly with Sumitomo Metal Mining Co. Ltd. (BASF stake: 50%).
Joint ventures accounted for using the equity method (BASF stake)
Million € 2013 2012
Investments accounted for using the equity method as of the beginning of the year 1,237 1,481
Proportional net income 86 119
Proportional change of other comprehensive income (57) ( 17)
Total comprehensive income 29 102
Capital measures/dividends/changes in the scope of consolidation/adjustments directly recognized in equity
(77)
(327)
Other adjustments of income and expense (8) ( 19)
Investments accounted for using the equity method as of the end of the year 1,181 1,237
Equity-accounted associated companies particularly comprise:
– Wintershall AG, Kassel, Germany, which operates Libyan exploration activities jointly with Gazprom Libyen Verwaltungs GmbH (BASF stake: 51%),
– Solvin Group, Hanover, Germany (BASF stake: 25%), – Nord Stream AG, Zug, Switzerland (BASF stake: 15.5%); BASF continues to exercise significant influence over Nord Stream AG, as BASF’s approval is required for relevant board resolutions.
– OAO Severneftegazprom, Krasnoselkup, Russia (BASF stake: 25%, economic share: 35%)
– Shanghai Lianheng Isocyanate Co. Ltd., Shanghai, China (BASF stake: 35%)
– Styrolution Group, Frankfurt, Germany (BASF stake: 50%); BASF does not intend to hold this share permanently,
– GASCADE Gastransport GmbH, Kassel, Germany (BASF stake: 50.02%),
– NEL Gastransport GmbH, Kassel, Germany (BASF stake: 50.02%).
Associated companies accounted for using the equity method (BASF stake)
Million € 2013 2012
Investments accounted for using the equity method as of the beginning of the year 2,222 2,005
Proportional net income 212 251
Proportional change of other comprehensive income (61) (14)
Total of comprehensive income 151 237
Capital measures/dividends/changes in the scope of consolidation/adjustments directly recognized in equity 575
(30)
Other adjustments of income and expense 8 10
Investments accounted for using the equity method as of the end of the year 2,956 2,222
Financial information on companies accounted for using the equity method (BASF stake)
Million € 2013 2012
Income statement information
Sales 7,692 10,942
Income from operations 992 1,723
Income before taxes and minority interests 872 1,613
Net income 298 370
Balance sheet information
Noncurrent assets 5,512 4,913
Thereof property, plant and equipment 4,195 3,656
Current assets 2,441 2,517
Thereof marketable securities, cash and cash equivalents 512 374
Total assets 7,953 7,430
Equity 3,712 3,431
Noncurrent liabilities 2,397 2,494
Thereof financial indebtedness 1,495 1,693
Current liabilities 1,844 1,505
Thereof financial indebtedness 495 413
Total equity and liabilities 7,953 7,430
The table includes the totals of the amounts from the financial statements of the companies accounted for using the equity method. Differences between the proportional net income and income accounted for using the equity method and between
the proportional equity and the book value of shareholdings accoun ted for using the equity method are largely due to fair value adjustments.

Notes
Policies and scope of consolidation
BASF Report 2013Consolidated Financial Statements166
2.4 – Acquisitions and divestitures
AcquisitionsIn 2013, BASF acquired the following activities:
– On January 31, 2013, BASF took over all the shares of Pronova BioPharma ASA, a company headquartered in Lysaker, Norway, which researches, develops and produces highly concentrated omega -3 fatty acids. With the acquisition of Pronova BioPharma ASA, BASF aims to take a leading position in the global market for omega -3 fatty acids. Pronova BioPharma ASA’s business has been merged with BASF’s previous activities within the Nutrition & Health division into a global business unit. BASF is now a supplier of the complete range of omega -3 fatty acids in varying concentrations. In the 2013 business year, Pronova BioPharma ASA contributed €200 million to sales and minus €24 million to net income. The negative earnings contribution was attributable to the propor-tional use of inventories recognized at market value in the course of the purchase price allocation as well as the pro rata amortization of intangible assets totaling €97 million.
The following table shows an overview of the fair values of the assets and liabilities acquired with the Pronova BioPharma ASA takeover as of January 31, 2013. Goodwill represents the assets which are not separable when conducting the purchase price allocation. It primarily relates to the employee know-how and synergies from the integration of the acquired businesses.
Purchase price allocation for Pronova BioPharma ASA acquisition as of January 31, 2013 (million €)
Fair value at time of acquisition
Property, plant and equipment 288
Other intangible assets 271
Financial assets and other noncurrent assets 14
Noncurrent assets 573
Inventories 136
Accounts receivable, trade 10
Cash and cash equivalents 55
Other current assets 19
Current assets 220
Assets 793
Provisions for pensions and similar obligations 3
Other long-term provisions 5
Deferred tax liabilities 115
Other noncurrent liabilities 31
Noncurrent liabilities 154
Financial indebtedness 171
Provisions 5
Other current liabilities 78
Current liabilities 254
Liabilities 408
Net assets 385
Goodwill 141
Total purchase price 526
The following additional acquisitions were made in 2013:
– Effective March 11, 2013, BASF completed its acquisition of parts of Ciech Group’s TDI business, as announced in the third quarter of 2012. The acquisition largely comprised intellectual property rights and access to customers. TDI is used primarily in furniture and automotive industry applica-tions. The acquired business has been integrated into the Monomers division.
– BASF acquired an enzyme technology for detergents and cleaners from Henkel AG & Co. KGaA, Düsseldorf, Germany, on April 17, 2013. This comprises production hosts, various detergent enzymes, and the corresponding intellectual property. The activities were integrated into the Care Chemicals division.

Notes
Policies and scope of consolidation
Consolidated Financial StatementsBASF Report 2013 167
– BASF concluded the acquisition of assets from Statoil ASA, headquartered in Stavanger, Norway, effective July 31, 2013. The transaction included the acquisition of shares in the Brage (32.7%), Vega (30%) and Gjøa (15%) fields, which were inte-grated into the Oil & Gas segment, thus increasing the company’s daily production in Norway from around 3,000 BOE to nearly 40,000 BOE. In return, Statoil ASA received a 15-per-cent share in the Edvard Grieg development project as well as financial compensation of $1.35 billion, which translates to €1.02 billion. BASF will pay up to a maximum of an additional $100 million contingent on the successful development of the Vega field. The transaction was concluded with retroactive commercial effect as of January 1, 2013. For this reason, earnings from shares in the production of the Brage, Vega and Gjøa fields as well as investments made in these fields since the beginning of 2013 have led to purchase price adjustments. Furthermore, the probable obligation arising from the success-ful development of the Vega field was calculated in the pur-chase price adjustments. The fair value of the share of the dis-posal of the Edvard Grieg development project at €259 million was included in the calculation of the total purchase price.
Total purchase price of Statoil ASA transaction (million €)
July 31, 2013
Compensation payment 1,017
15% share on fair value of Edvard Grieg 259
Purchase price adjustments (423)
Total purchase price 853
At the closing date of the transaction, a payment was made in the amount of €588 million in addition to the disposal of the share in the Edvard Grieg development project.
Net payment of Statoil ASA transaction (million €)
July 31, 2013
Total purchase price 853
15% share on fair value of Edvard Grieg (259)
Purchase price to be paid in future (6)
Net payment 588
The following table shows an overview of the preliminary fair values of the assets and liabilities acquired from Statoil ASA as of July 31, 2013.
Purchase price allocation for Statoil ASA transaction (million €)
Fair value at time of acquisition
Property, plant and equipment 1,204
Other intangible assets 32
Financial assets and other noncurrent assets 197
Noncurrent assets 1,433
Inventories –
Accounts receivable, trade –
Cash and cash equivalents –
Other current assets 3
Current assets 3
Assets 1,436
Provisions for pensions and similar obligations –
Other long-term provisions 271
Deferred tax liabilities 705
Other noncurrent liabilities –
Noncurrent liabilities 976
Financial indebtedness –
Provisions –
Other liabilities 250
Current liabilities 250
Liabilities 1,226
Net assets 210
Goodwill 643
Total purchase price 853
The transfer of assets from Statoil ASA increased sales in the 2013 business year by €368 million and net income by €24 mil-lion. If the acquired assets had been included as of January 1, 2013, pro forma sales would have amounted to €931 million and income €98 million. Taking into account the fair value of €259 million of the transferred portion of the Edvard Grieg develop ment project, income was realized in the amount of €164 million as a special item.
– Effective October 31, 2013, BASF completed the acquisition of all shares in the Verenium Corporation, based in San Diego, California. As part of the official takeover bid, initially 71% of the shares were bindingly tendered to BASF. All other eligible Verenium shares were converted into a cash claim in the amount of the public bid of $4.00 per share, thus completing the acquisition. Verenium Corporation develops and markets high-quality enzymes which, as catalysts, enable and accel-erate biological and chemical processes. At the time of acqui-sition, the acquired activities were allocated to the Perfor-mance Products segment as well as to Other.

Notes
Policies and scope of consolidation
BASF Report 2013Consolidated Financial Statements168
The purchase prices for the businesses acquired in 2013 totaled €1,490 million, including noncash purchase price components. Payments for acquisitions amounted to €1,225 million. The purchase price allocations were carried out in accordance with IFRS 3 and are based on estimates. With the exception of the acquisition of Pronova BioPharma ASA, the purchase price allocations should be regarded as preliminary and can be adjusted within one year after the acquisition.
BASF acquired the following businesses in 2012:
– On February 13, 2012, BASF acquired the Ovonic Battery Company, headquartered in Rochester Hills, Michigan. Ovonic holds numerous patents and patent applications worldwide in the area of nickel-metal hydride (NiMH) battery technology. The company was incorporated into the newly established Battery Materials business unit, a part of the Catalysts division.
– BASF acquired the polyethylene terephthalate (PET) foams business from B.C. Foam S.p.A., headquartered in Volpi ano, Italy, effective February 29, 2012. The acquisition comprised production facilities and industrial property rights. The acquired business became part of the Performance Materials division.
– On April 25, 2012, BASF acquired the energy storage activi-ties of Novolyte Technologies LP, headquartered in Cleveland, Ohio, which focus on developing, producing and marketing performance electrolyte formulations for lithium-ion batteries. These activities will continue operations as part of BASF’s Battery Materials unit. BASF also acquired the performance materials business from Novolyte Holdings LP, which was integrated into the Intermediates division. As part of the acquisition, BASF is continuing the joint venture in Nantong, China, operated by Novolyte and Foosung Co., Ltd., a Korean producer of lithium hexafluorophosphate (LiPF6).
– BASF concluded the acquisition of the Brazilian Mazzaferro Group’s polyamide polymer business on May 2, 2012. BASF integrated the acquired activities into its existing engineering plastics and polyamide polymer business within the Monomers division.
– On May 8, 2012, BASF acquired Equateq Ltd., a producer of highly concentrated omega-3 fatty acids based in Callanish, Scotland. With this acquisition, BASF expanded the Nutrition & Health division’s portfolio of omega-3 products for the phar-maceutical and dietary supplement industries.
– BASF purchased ITWC Inc.’s business, headquartered in Malcom, Iowa, on July 1, 2012. The transaction complemented BASF’s offering of polyurethane products, systems and specialties in North America. The business was integrated into the Performance Materials division.
– Effective November 21, 2012, BASF acquired the Becker Underwood Group, which has its headquarters in Ames, Iowa. Becker Underwood is one of the leading global providers of technologies for biological seed treatment and seed treatment colors and polymers, as well as products in the areas of biological crop protection, turf and horticulture, animal nutrition and landscape design. Most of the Becker Underwood busi-nesses joined the newly established Functional Crop Care global business unit as part of BASF’s Crop Protection division. Becker Underwood’s animal nutrition business was integrated into BASF’s Nutrition & Health division.
The following overview shows the effects of the acquisitions conducted in 2013 and 2012 on the Consolidated Financial Statements as of the acquisition date. If acquisitions resulted in the transfer of assets or the assumption of additional liabilities, these are shown as a net impact.
Effects of acquisitions in the year of acquisition
2013 2012
Million € % Million € %
Goodwill 779 11.3 586 9.2
Other intangible assets 310 5.8 487 8.3
Property, plant and equipment 1,386 7.6 106 0.6
Financial assets – – 70 2.4
Other noncurrent assets 236 12.6 10 0.2
Noncurrent assets 2,711 7.3 1,259 3.6
Current assets 276 1.0 167 0.6
Thereof cash and cash equivalents 69 3.8 12 0.7
Assets 2,987 4.6 1,426 2.3
Equity 164 0.6 4 .
Noncurrent liabilities 1,094 5.0 211 1
Thereof financial indebtedness 19 0.2 – –
Current liabilities 504 3.4 156 0.9
Thereof financial indebtedness 171 5.3 86 2.1
Total equity and liabilities 1,762 2.7 371 0.6
Payments for acquisitions 1,225 1,055

Notes
Policies and scope of consolidation
Consolidated Financial StatementsBASF Report 2013 169
Assets and liabilities of disposal groups
– On November 14, 2012, BASF and Gazprom agreed to swap assets of equal value. The final contract was signed on Decem-ber 23, 2013. It is anticipated that the transaction will be closed in mid-2014 with retroactive financial effect as of April 1, 2013. The European Commission agreed to the transaction at the beginning of December 2013. Under the agreement, BASF will receive 25% plus one share in the blocks IV and V in the Achimov formation of the Urengoy natural gas and condensate field in Western Siberia. According to the development plan, blocks IV and V have total hydrocarbon resources of 274 billion cubic meters of natural gas and 74 million metric tons of condensate. A total annual plateau production of at least 8 billion cubic meters of natural gas is expected from the two blocks. Produc-tion startup is planned for 2016. In return, BASF will completely transfer its share in the currently jointly operated natural gas trading and storage business to its partner Gazprom. This includes the 50% shares in the natural gas trading com panies WINGAS GmbH and Wintershall Erdgas Handelshaus GmbH & Co. KG, including their subsidiaries, and shares in the natural gas storage facilities in Rehden and Jemgum, Germany, and in Haidach, Austria. Gazprom will also receive a 50% share in Wintershall Noordzee B.V., which is active in the exploration and production of oil and gas in the southern North Sea (the Netherlands, the United Kingdom and Denmark). The assets and liabili ties of these activities were reclassified into a disposal group at year-end 2012. Until completion of the transaction, sales and income of the BASF’s natural gas trading business as well as that of Wintershall Noordzee B.V. will continue to be reported in the Oil & Gas segment.
The values of the disposal group are shown in the following table:
Natural gas trading disposal group (million €)
Dec. 31,
2013Dec. 31,
2012
Intangible assets 96 92
Property, plant and equipment 1,102 912
Investments accounted for using the equity-method 81 81
Other financial assets 13 1
Inventories 569 689
Accounts receivable, trade 857 1,321
Positive fair values of derivatives 20 39
Other receivables and miscellaneous assets 78 121
Cash and cash equivalents 12 8
Assets of the disposal group 2,828 3,264
Provisions for pensions and similar obligations 18 21
Other provisions 462 503
Accounts payable, trade 648 1,278
Negative fair values of derivatives 46 45
Other liabilities 116 146
Liabilities of the disposal group 1,290 1,993
Net assets 1,538 1,271
Divestitures In 2013, the following activities were either divested by BASF or their inclusion in the financial statements was altered due to loss of control:
– Effective April 2, 2013, BASF concluded the sale of its sprayed concrete technology business for tunneling and mining to Atlas Copco, announced in the fourth quarter of 2012. The transaction comprises the production site in Winterthur, Switzerland, and the sales and service activities in Hermsdorf, Germany. The business had been part of the Construction Chemicals division.
– On July 1, 2013, BASF sold its activities in the CONICA Sports Surfaces business, including the site in Schaffhausen, Switzerland, to the Serafin Group, headquartered in Munich, Germany. The sale included the development, production and marketing of flooring systems for running tracks, gymnasiums, tennis courts and playgrounds as well as artificial turf solu-tions. The activities had been part of the Construction Chemi-cals division.
– On September 30, 2013 BASF concluded the sale of Indus-trial Water Management France S.A.S., Lyon, France, to Degrémont, a subsidiary of SUEZ ENVIRONNEMENT. The business had been part of the Performance Chemicals divi-sion.
– On December 31, 2013, BASF concluded the sale of Wall Systems GmbH & Co. KG, headquartered in Marktredwitz, Germany, to ROCKWOOL, as announced on July 18, 2013. The company’s main business is in systems for internal and external building insulation as well as for the renovation and restoration of historical structures. The activities had been part of the Construction Chemicals division.
– A supplementary agreement to the articles of association for GASCADE Gastransport GmbH expired on December 31, 2013. With the expiration of the agreement and the resulting change in the corporate governance structure, BASF lost con-trol over GASCADE Gastransport GmbH and has only signif-icant influence over the shareholding. According to IFRS 10, this results in a reclassification from fully consolidated com-pany to an associated company accounted for using the equity method in the BASF Group financial statements as of the effec tive date. BASF continues to hold a 50.02% share in GASCADE Gastransport GmbH.
The balance sheet values of GASCADE Gastransport GmbH (100%) at the time of the reclassification from full consolidation to the equity method are shown in the following table:

Notes
Policies and scope of consolidation
BASF Report 2013Consolidated Financial Statements170
GASCADE Gastransport GmbH (million €)
Dec. 31, 2013
Intangible assets 16
Property, plant and equipment 882
Inventories 26
Accounts receivable, trade 5
Positive fair values of derivatives –
Other receivables and miscellaneous assets 109
Cash and cash equivalents –
Assets 1,038
Provisions for pensions and similar obligations 10
Other provisions 196
Accounts payable, trade 52
Negative fair values of derivatives –
Other liabilities 376
Liabilities 634
Net assets 404
Minority interests 202
Proportion of net assets 202
The equity-accounted carrying amount of GASCADE Gastrans-port GmbH, measured at fair value, amounted to €631 million at the time of the addition. Income of €429 million from the reclassi fication corresponds with the balance of the investment’s fair value and the outgoing net assets as per IFRS 10.
The following overview shows the individual components of BASF’s profit realization from the reclassification of GASCADE Gastransport GmbH:
Profit realization from reclassification of GASCADE Gastransport GmbH (million €)
Dec. 31, 2013
Fair value of the stake in GASCADE Gastransport GmbH 631
Disposed proportion of net assets 202
Disposal gains 429
In 2012, BASF divested the following activities:
– As of January 31, 2012, BASF sold its 50% share in the jointly controlled entity PEC-Rhin S.A., Ottmarsheim, France, to its joint venture partner GPN, Courbevoie, France. PEC-Rhin owned and operated production facilities for CAN/AN fertilizers (calcium ammonium nitrate and ammonium nitrate), as well as production facilities for the intermediates ammonia and nitric acid.
– The disposal of BASF’s fertilizer activities in Antwerp, Belgium, to EuroChem, Moscow, Russia, which had been agreed upon on September 27, 2011, was completed on March 31, 2012, after approval was granted by anti-trust authorities. The sale comprised production facilities for CAN/AN fertilizers (calcium ammonium nitrate and ammonium nitrate), NPK fertilizers (nitrogen, phosphate, potassium), nitrophosphoric acid and three related nitric acid plants.
– On August 30, 2012, BASF concluded the sale of its offset print-ing inks business (IMEX), announced on March 15, 2012, to Quantum Kapital AG, headquartered in St. Gallen, Switzerland. The divestiture covered all offset printing inks activities as well as the transfer of all employees at the site in Maastricht, the Netherlands, assigned to the business. The business had been part of the Dispersions & Pigments division.
– As of November 30, 2012, BASF completed the divestiture of the decorative paints business of Relius Coatings GmbH & Co. KG, Oldenburg, Germany, and of its share in Relius France S.A.S., Ostwald, France. The business had been part of the Coatings division.
– As of December 19, 2012, BASF sold its Capcure® brand curative business to Gabriel Performance Products LLC, based in Ashtabula, Ohio. The business had been part of the Disper-sions & Pigments division.
The following overview shows the effect of the divestitures in 2013 and 2012 on the consolidated financial statements. The line item sales reflects the year-on-year decline resulting from divestitures. The impact on equity relates mainly to gains and losses from divestitures.
Effects of divestitures in the year of divestiture
2013 2012
Million € % Million € %
Sales (208) (0.3) (810) (1.1)
Noncurrent assets (345) (0.9) 84 0.2
Thereof property, plant and equipment (895) (4.9) (16) (0.1)
Current assets 297 1.1 (263) (1.0)
Thereof cash and cash equivalents (3) (0.2) (7) (0.4)
Assets (48) (0.1) (179) (0.3)
Equity 233 0.8 400 1.6
Noncurrent liabilities (200) (0.9) 154 0.8
Thereof financial indebtedness – – (1) .
Current liabilities (14) (0.1) (2) .
Thereof financial indebtedness – – – –
Total equity and liabilities 19 . 552 0.9
Proceeds from divestitures 67 731

Notes
Segments and regions
Consolidated Financial StatementsBASF Report 2013 171
3 – List of Shares Held of the BASF Group in accordance with Section 313(2) of the German Commercial Code
List of Shares HeldThe list of consolidated companies and the complete list of all companies in which BASF SE has a share as required by Section 313(2) of the German Commercial Code is an integral
component of the audited Consolidated Financial Statements submitted to the electronic Federal Gazette. It is also published online. basf.com/en/investor/cg
4 – Reporting by segment and region
Agricultural Solutions is made up of the Crop Protection division, whose products guard crops against fungal infections, insects and weeds, and secure yields as well serve as biological seed treatments. Plant biotechnology research is not assigned to this segment; it is reported in Other. The Oil & Gas segment is composed of the Oil & Gas division with its Exploration & Production and Natural Gas Trading business sectors. Activities not assigned to a particular division are reported in Other. These include the sale of raw materials, engineering and other services, rental income and leases. With cross divisional corporate research, BASF is develop-ing growth fields and ensuring its long- term competence with regard to technology and methods. This includes plant biotech-nology research. Corporate research costs are not allocated to the segments, but are reported under Other, as are corporate costs that comprise expenses for the steering of the BASF Group. Earnings from currency conversion that are not allocated to the segments are also reported under Other, as are earnings from the hedging of raw material prices and foreign currency exchange risks. Furthermore, revenues and expenses from the long -term incentive (LTI) program are reported here. Transfers between the segments are generally executed at market-based prices. Assets, as well as their depreciation and amortization, are allocated to the segments based on economic control. Assets used by more than one segment are allocated based on the percentage of usage.
BASF optimized its organizational structure effective January 1, 2013. Since this date, BASF’s business has been conducted by 14 (previously 15) operating divisions aggregated into five (pre-viously six) segments for reporting purposes. The divisions are allocated to the segments based on their business models. The Plastics segment has been dissolved; its businesses with high -volume products and basic polymers have been integrated into the Chemicals segment, and the businesses with innova-tive plastics have been bundled into the new Performance Materials division in the Functional Materials & Solutions segment. The previous year’s figures have been adjusted to match the new organizational structure. The Chemicals segment comprises the classical chemicals business with basic chemicals and intermediates. It forms the core of BASF’s Production Verbund and is the starting point for a majority of the value chains. In addition to supplying the chemical industry and other sectors, the segment ensures that other BASF divisions are supplied with chemicals for producing down stream products. Chemicals comprises the Petrochemi-cals, Monomers and Intermediates divisions. The Performance Products segment consists of the Dispersions & Pigments, Care Chemicals, Nutrition & Health, Paper Chemicals and Performance Chemicals divisions. Customized products allow customers to make their production processes more efficient or to give their products improved application properties. The Functional Materials & Solutions segment groups together system solutions, services and innovative products for specific sectors and customers, in particular for the automotive, electrical, chemical and construction industries. It comprises the Catalysts, Construction Chemicals, Coatings and Perfor-mance Materials divisions.
Agreed-upon future transactions – On December 12, 2013, BASF signed an agreement with the Hungarian MOL Group for the sale of selected oil and gas investments in the North Sea. The transaction com- prises 14 licenses, including non-operated equity stakes in the Broom field (29%) as well as the Catcher (20%),
Cladhan (33.5%) and Scolty/Crathes (50%) developments. The transaction will be financially retroactive to January 1, 2013. Subject to approval by the relevant authorities and partners, it is expected to be closed in the first quarter of 2014.
Segments and regions

Notes
Segments and regions
BASF Report 2013Consolidated Financial Statements172
Income from operations (EBIT) of Other (million €)
2013 2012
Corporate research costs (386) (391)
Costs of the corporate headquarters (237) (255)
Other businesses 251 871
Foreign currency results, hedging and other measurement effects (190) (454)
Miscellaneous income and expenses (102) 14
Income from operations of Other (664) (215)
The decline in income from operations in Other is mainly attrib-utable to the fact that it contained gains of €645 million on the disposal of the fertilizer business in 2012. The year-on-year improvement in foreign currency results, hedging and other measurement effects resulted mainly from
reduced expenses arising from the long-term incentive program in 2013. At €104 million, they were €195 million lower than in the previous year. Furthermore, income rose from foreign currency translation and hedging transactions.
Assets of Other (million €)
2013 2012
Assets of businesses included in Other 3,351 3,152
Financial assets 630 613
Deferred tax assets 992 1,473
Cash and cash equivalents/marketable securities 1,832 1,661
Defined benefit assets 47 41
Miscellaneous receivables/prepaid expenses/assets of the disposal group not allocated to operations 2,416 1,845
Assets of Other 9,268 8,785
The reconciliation reporting Oil & Gas reconciles the income from operations in the Oil & Gas segment with the contribution of the segment to the net income of the BASF Group. The improvement in income from operations resulted primarily from the reclassification of GASCADE Transport GmbH, Kassel, Germany, and a special income related to the sale of a 15-percent share in the Edvard Grieg development project in return for the acquisition of assets from Statoil ASA. Due to low, partly regulated local gas prices, price compensa-tions for gas producers were introduced in Argentina as part of
the New Gas Price Scheme (NGPS). This led to an increase in Other operating income in 2013. The Oil & Gas segment’s other income relate to income and expenses not included in the segment’s income from opera-tions, the interest result as well as the other financial result. The year-on-year increase is mostly attributable to currency effects. The tax rate increase was largely the result of high tax credits in the previous year related to impairment charges on a Norwegian oilfield development project.
Reconciliation reporting Oil & Gas (million €)
2013 2012
Income from operations 2,516 1,676
Income from shareholdings (2) (8)
Other income 71 (122)
Income before taxes and minority interests 2,585 1,546
Income taxes (673) (181)
Income before minority interests 1,912 1,365
Minority interests (132) (164)
Net income 1,780 1,201

Notes
Segments and regions
Consolidated Financial StatementsBASF Report 2013 173
Segments 2013 (million €)
Chemicals
Perfor- mance
Products
Functional Mate-rials &
Solutions
Agri- cultural
Solutions Oil & Gas
Thereof Explora-
tion & Production Other
BASF Group
Sales 16,994 15,534 17,252 5,227 14,776 2,929 4,190 73,973
Intersegmental transfers 6,388 489 835 36 1,160 305 53 8,961
Sales including intersegmental transfers 23,382 16,023 18,087 5,263 15,936 3,234 4,243 82,934
Income from operations 2,086 1,100 1,027 1,208 2,516 1,659 (664) 7,273
Assets 10,908 13,614 11,899 6,777 11,916 7,731 9,268 64,382
Thereof goodwill 56 1,967 2,032 1,796 959 959 62 6,872
intangible assets 256 1,818 1,331 364 1,529 1,527 65 5,363
property, plant and equipment 5,383 4,154 2,722 925 4,213 3,314 857 18,254
Debt 3,122 4,078 2,751 1,374 3,099 2,207 22,169 36,593
Research and development expenses 178 377 367 469 53 53 391 1,835
Additions to property, plant and equipment and intangible assets 1,958 1,497 611 324 2,954 2,834 169 7,513
Amortization of intangible assets and depreciation of property, plant and equipment 870 887 471 167 628 474 131 3,154
Thereof impairments 95 58 20 1 54 54 10 238
Segments 2012 (million €)
Chemicals
Perfor- mance
Products
Functional Mate-rials &
Solutions
Agri- cultural
Solutions Oil & Gas
Thereof Explora-
tion & Production Other
BASF Group
Sales 17,887 15,713 17,049 4,679 12,740 2,584 4,061 72,129
Intersegmental transfers 5,947 457 419 29 1,104 3 112 8,068
Sales including intersegmental transfers 23,834 16,170 17,468 4,708 13,844 2,587 4,173 80,197
Income from operations 2,173 1,276 806 1,026 1,676 1,187 (215) 6,742
Assets 10,559 13,457 12,146 6,527 11,252 5,766 8,785 62,726
Thereof goodwill 70 1,906 2,161 1,870 325 325 52 6,384
intangible assets 180 1,858 1,527 424 1,759 1,740 61 5,809
property, plant and equipment 4,693 3,867 2,455 785 4,042 1,727 768 16,610
Debt 3,600 4,355 3,182 1,485 3,199 1,370 21,284 37,105
Research and development expenses 184 345 348 430 32 32 393 1,732
Additions to property, plant and equipment and intangible assets 1,324 764 760 1,054 1,172 768 189 5,263
Amortization of intangible assets and depreciation of property, plant and equipment 848 814 557 156 769 588 123 3,267
Thereof impairments – 38 95 – 200 200 2 335

Notes
Notes on Statement of Income
BASF Report 2013Consolidated Financial Statements174
Regions 2013 (million €)
EuropeThereof
GermanyNorth
AmericaAsia
Pacific
South America,
Africa, Middle
EastBASF
Group
Location of customers
Sales 41,221 14,446 14,272 12,450 6,030 73,973
Share (%) 55.7 19.5 19.3 16.8 8.2 100.0
Location of companies
Sales 43,335 31,571 14,573 11,679 4,386 73,973
Sales including interregional transfers 50,307 36,984 17,025 12,188 4,580 84,100
Income from operations 4,598 2,189 1,488 817 370 7,273
Assets 39,016 22,022 12,683 8,797 3,886 64,382
Thereof property, plant and equipment 10,968 5,784 3,740 2,476 1,070 18,254
Additions to property, plant and equipment and intangible assets 5,586 1,766 782 696 449 7,513
Amortization of intangible assets and depreciation of property, plant and equipment 2,083 1,075 663 300 108 3,154
Employees as of December 31 70,977 52,523 16,996 16,708 7,525 112,206
Regions 2012 (million €)
EuropeThereof
GermanyNorth
AmericaAsia
Pacific
South America,
Africa, Middle
EastBASF
Group
Location of customers
Sales 39,428 15,210 13,992 12,546 6,163 72,129
Share (%) 54.7 21.1 19.4 17.4 8.5 100.0
Location of companies
Sales 41,445 29,320 14,441 11,694 4,549 72,129
Sales including interregional transfers 48,263 34,775 16,899 12,161 4,744 82,067
Income from operations 4,557 2,249 969 855 361 6,742
Assets 36,782 22,431 13,301 8,751 3,892 62,726
Thereof property, plant and equipment 9,880 6,399 3,720 2,183 827 16,610
Additions to property, plant and equipment and intangible assets 2,570 1,557 1,838 539 316 5,263
Amortization of intangible assets and depreciation of property, plant and equipment 2,166 1,080 662 332 107 3,267
Employees as of December 31 70,638 52,362 16,665 16,406 7,073 110,782
Earnings per share
2013 2012
Net income million € 4,842 4,819
Weighted-average number of outstanding shares 1,000 918,479 918,479
Earnings per share € 5.27 5.25
Diluted earnings per share € 5.27 5.25
5 – Earnings per share
In accordance with IAS 33, a potential dilutive effect must be considered in the diluted earnings per share for those BASF shares which will be granted in the future as a part of the BASF share program “plus.” This applies regardless of the fact that the necessary shares are acquired by third parties on the market on behalf of BASF, and the fact that there are no plans for the issuance of new shares. For 2013, there was no dilutive effect.

Notes
Notes on Statement of Income
Consolidated Financial StatementsBASF Report 2013 175
7 – Other operating income
Million € 2013 2012
Reversal of provisions 125 121
Revenue from miscellaneous revenue-generating activities 200 145
Income from foreign currency and hedging transactions 116 69
Income from the translation of financial statements in foreign currencies 29 33
Gains on the disposal of fixed assets and divestitures 640 698
Income on the reversal of valuation allowances for business-related receivables 39 60
Other 530 583
Other operating income 1,679 1,709
6 – Functional costs
The reversal of provisions was primarily related to closures and restructuring measures, employee obligations, risks from lawsuits and damage claims as well as various other items as part of the normal course of business. Provisions were reversed if the circumstances on the balance sheet date were such that utilization was no longer expected or expected to a lesser extent. Revenue from miscellaneous revenue-generating activities primarily included income from rentals, property sales, catering operations, cultural events and logistics services. Income from foreign currency and hedging transac-tions concerned foreign currency translations of receivables and payables as well as changes in fair value of currency deriva-tives and other hedging transactions. Income from the translation of financial statements in foreign currencies included gains arising from the translation of subsidiaries outside of the eurozone that use the euro as their functional currency.
Under the cost-of-sales method, functional costs incurred by the operating functions are determined on the basis of cost center accounting. The functional costs contain in particular the personnel costs, depreciation and amortization accumulated on the underlying final cost centers as well as allocated costs within the cost accounting cycle. Operating expenses that cannot be allocated to the functional costs are reported as Other operating expenses.
For more on Other operating expenses, see Note 8 on page 176
Cost of salesCost of sales includes all production and purchase costs of the Company’s own products as well as merchandise which has been sold in the period.
Gains on the disposal of fixed assets and divestitures arose in the amount of €429 million from the reclassification of GASCADE Gastransport GmbH, Kassel, Germany, due to loss of control after changes in corporate governance. In addition, there were disposal gains amounting to €164 million on the divesti ture of a 15-percent share in the Edvard Grieg develop-ment project in return for assets from Statoil ASA. The previous year had particularly included €645 million in gains from the sale of the fertilizer activities. Income on the reversal of valuation allowances for business- related receivables resulted mainly from the settle-ment of receivables for which a valuation allowance had been recorded. Other included government grants and government assistance from several countries in favor of BASF amounting to €136 million. These were primarily attributable to price compensation for gas producers from the Argentinian govern-ment, which was introduced in connection with the New Gas Price Scheme (NGPS) due to the lower, partly locally regulated gas prices.
Selling expensesSelling expenses include in particular marketing and advertis-ing costs, freight costs, packaging costs, distribution manage-ment costs, commissions, and licensing costs.
General and administrative expensesGeneral and administrative expenses primarily include the costs of the central units, the costs of managing business units and divisions as well as costs of general management, the Board of Executive Directors and the Supervisory Board.
Research and development expensesResearch and development expenses include the costs result-ing from research projects as well as the necessary license fees for research activities.
For more on research and development expenses by segment, see Note 4 on page 173

Notes
Notes on Statement of Income
BASF Report 2013Consolidated Financial Statements176
In 2013, expenses for restructuring measures amounting to €149 million primarily related to severance payments. Further expenses for restructuring at several sites in the Construction Chemicals division amounted to €14 million in 2013 (2012: €37 million) and €18 million in the Dispersions & Pigments division in 2013. Costs arising from the integration of Becker Underwood amounted to €14 million in 2013. In 2012, €47 mil-lion related to expenses at the site in Grenzach, Germany, and €17 million at a site in France. Further restructuring at several sites in the Performance Chemicals division amounted to €24 million in 2012. Expenses arose from environmental protection and safety measures, costs of demolition and removal, and planning expenses related to capital expenditures that are not subject to mandatory capitalization according to IFRS. Expenses for demolition, removal and project planning totaled €239 million in 2013 and €168 million in 2012. These related in particular to the Ludwigshafen site in both years. Furthermore, additions of €32 million to environmental provisions in 2013 were related to the remediation of landfills, particularly in Germany, Switzerland and North America. In 2012, expenses of €24 mil-lion arose from the remediation of landfills at various sites in North America. Amortization, depreciation and impairments of intan-gible assets and property, plant and equipment of €83 mil-lion resulted from the impairment of a plant in the Chemicals segment. Impairments on exploration licenses in the Oil & Gas segment amounted to €45 million. Furthermore, impairments included €15 million for assets at a site in the United Kingdom. Valuation allowances on a Norwegian oilfield development project arose in 2012 in the amount of €200 million. Further valuation allowances in the previous year were related to marketing and trademark rights in the Construction Chemicals
division amounting to €71 million and for property, plant and equipment at several sites amounting to €13 million. Costs from miscellaneous revenue-generating activi-ties concerned the respective items presented in other operat-ing income.
For more information, see Note 7 on page 175
Expenses from foreign-currency and hedging transactions as well as from the measurement of LTI options were related to foreign currency translations of receivables and payables as well as changes in the fair value of currency derivatives and other hedging transactions. In addition, expenses of €104 million resulted from the long-term incentive program (LTI program) in 2013 (2012: €299 million). This was due to lower increase in the share price of 8.9% in 2013 in comparison with an increase of 32.0% in 2012. Losses from the disposal of fixed assets and divesti-tures in 2013 in the amount of €14 million arose mainly from smaller divestitures in the Construction Chemicals division. In 2012, losses of €17 million arose from the sale of assets at several North American sites. Expenses from the addition of valuation allowances for business-related receivables declined in comparison with the previous year by €9 million. This was due to lower additions in Brazil in comparison with the previous year.
8 – Other operating expenses
Million € 2013 2012
Restructuring measures 316 198
Environmental protection and safety measures, costs of demolition and removal, and planning expenses related to capital expenditures that are not subject to mandatory capitalization 369 214
Amortization, depreciation and impairments of intangible assets and property, plant and equipment 248 377
Costs from miscellaneous revenue-generating activities 185 146
Expenses from foreign-currency and hedging transactions as well as from the measurement of LTI options 263 548
Losses from the translation of the financial statements in foreign currencies 108 53
Losses from the disposal of fixed assets and divestitures 49 45
Oil and gas exploration expenses 187 221
Expenses from the addition of valuation allowances for business-related receivables 72 81
Expenses from the use of inventories measured at market value and the derecognition of obsolete inventory 280 177
Other 493 593
Other operating expenses 2,570 2,653
Furthermore, miscellaneous income included the delayed earnings contribution from the fertilizer business in both years. Further income in both years was related to gains from precious
metal trading, insurance refunds, curtailments of various pension plans, reversal of impairments on property, plant and equip-ment, and a number of other items.

Notes
Notes on Statement of Income
Consolidated Financial StatementsBASF Report 2013 177
10 – Financial result
Million € 2013 2012
Dividends and similar income 44 41
Income from the disposal of shareholdings 20 17
Income from profit transfer agreements 8 14
Income from tax allocation to participating interests 2 3
Income from other shareholdings 74 75
Losses from loss transfer agreements (18) (23)
Write-downs on/losses from the sale of shareholdings (52) (20)
Expenses from other shareholdings (70) (43)
Interest income from cash and cash equivalents 140 169
Interest and dividend income from securities and loans 20 8
Interest income 160 177
Interest expenses (688) (724)
Net interest income from overfunded pensions and similar obligations 2 6
Income from the capitalization of borrowing cost 108 67
Miscellaneous financial income 128 –
Other financial income 238 73
Write-downs on/losses from the disposal of securities and loans (4) (18)
Net interest expenses from underfunded pensions and similar obligations (192) (121)
Net interest expense from other long-term personnel obligations (8) (16)
Interest compounding on other noncurrent liabilities (70) (59)
Miscellaneous financial expenses – (109)
Other financial expenses (274) (323)
Financial result (560) (765)
Expenses from the use of inventory measured at market value and the derecognition of obsolete inventory were attributable to the use of inventory measured at market value taken over from the Pronova BioPharma ASA and Becker Underwood acquisitions amounting to €63 million.
Other expenses arose from the implementation of projects, REACH and the provision of services. Additionally, expenses arose from additions to provisions for various matters as well as a number of other items. In 2012, other expenses also included the cost of a settlement reached in a legal dispute in the United States.
9 – Income from companies accounted for using the equity method
Million € 2013 2012
Proportional net income 298 370
Thereof joint ventures 86 119
associated companies 212 251
Other adjustments of income and expense – (9)
Thereof joint ventures (8) (19)
associated companies 8 10
Income from companies accounted for using the equity method 298
361
The largest portion of income from companies accounted for using the equity method came from the Oil & Gas segment, mostly from OAO Severneftegazprom and Wintershall AG. Shareholdings in Styrolution Holding GmbH and BASF-YPC Company Ltd. also contributed significantly to income. Income declined by €63 million compared with the previ-ous year because the carrying amounts of equity-accounted companies in the natural gas trading disposal group remained unchanged since the group’s creation in November 2012, and are only tested for impairment. Furthermore, strikes at export termi nals have led to the suspension of all onshore oil and asso-ciated gas-producing activities in Libya since July 2013.

Notes
Notes on Statement of Income
BASF Report 2013Consolidated Financial Statements178
Income from shareholdings declined from €32 million to €4 million, primarily as a result of impairments on other share-holdings. The interest result improved slightly compared with the previous year. This was due to lower interest expenses arising from redeemed bonds that could be refinanced with more favorable conditions as well as a reduction in liabilities to credit institutions. The decrease in interest income is mainly attribut-able to lower income from interest rate swaps. The considerable year-on-year increase in net interest expense from underfunded plans is due to the rise in under-funding over the course of 2012, since the calculation of the net interest expense is based on the net balance approach at the beginning of each corresponding year. The main reason for the rise in underfunding is the significant increase in the defined
benefit obligation for pension obligations resulting from the capital market-related reduction in the discount rate as of the balance sheet date of December 31, 2012. Miscellaneous financial income in 2013 included effects from the market valuation of options for the disposal of BASF’s share in the Styrolution joint venture amounting to €119 million. In 2012, the market valuation of these options let to €88 million in other financial expenses.
Income before taxes and minority interests totaled €6,713 mil-lion (2012: €5,977 million). Of this amount, €1,885 million was attributable to Germany (2012: €1,897 million) and €4,828 mil-lion to foreign countries (2012: €4,080 million). In Germany, a uniform corporate income tax rate of 15.0% as well as a solidarity surcharge of 5.5% thereon is levied on all paid out and retained earnings. In addition to corporate income tax, income generated in Germany is subject to a trade tax that varies depending on the municipality in which the company is represented. In 2013, the weighted average tax rate amounted to 13.3% as in the previous year. The profits of foreign Group companies are assessed using the tax rates applicable in their respective countries. Deferred tax assets and liabilities in the Consolidated Financial Statements must be valued using the tax rates applicable for the period in which the asset or liability is realized or settled.
For German Group companies, deferred taxes were calculated using a uniform 29% rate. For foreign Group companies, deferred taxes were calcu-lated using the tax rates applicable in the individual foreign coun-tries. These rates averaged 31.2% in 2013 and 22.6% in 2012. Other taxes include real estate taxes and other compara-ble taxes of €99 million in 2013, and €93 million in 2012; they are allocated to the appropriate functional costs. Changes in valuation allowances for deferred tax assets for tax loss carryforwards resulted in income of €6 million in 2013. In 2012 this resulted in an expense of €3 million.
11 – Income taxes
Million € 2013 2012
Corporate income tax, solidarity surcharge and trade taxes (Germany) 339 451
Foreign income tax 1,139 843
Taxes for prior years (65) (329)
Current tax expense 1,413 965
Deferred tax expense (+)/income (–) 127 (55)
Income taxes 1,540 910
Other taxes as well as sales and consumption taxes 342 330
Tax expense 1,882 1,240

Notes
Notes on Statement of Income
Consolidated Financial StatementsBASF Report 2013 179
Reconciliation from the statutory tax rate in Germany to the effective tax rate
2013 2012
Million € % Million € %
Income before taxes and minority interests 6,713 – 5,977 –
Expected tax based on German corporate income tax (15%) 1,007 15.0 897 15.0
Solidarity surcharge 8 0.1 10 0.2
German trade tax 185 2.7 231 3.8
Foreign tax-rate differential 750 11.2 298 5.0
Tax-exempt income (258) (3.8) (107) (1.8)
Non-deductible expenses 90 1.3 78 1.3
Income after taxes of companies accounted for using the equity method (45) (0.7) (54) (0.9)
Taxes for prior years (65) (1.0) (329) (5.5)
Deferred tax liabilities for the future reversal of temporary differences associated with shares held (16) (0.2) (26) (0.4)
Other (116) (1.7) (88) (1.5)
Income taxes/effective tax rate 1,540 22.9 910 15.2
Deferred tax assets and liabilities (million €)
Deferred tax assets Deferred tax liabilities
2013 2012 2013 2012
Intangible assets 128 154 1,805 1,829
Property, plant and equipment 218 246 2,273 1,606
Financial assets 13 15 70 83
Inventories and accounts receivable 263 314 602 651
Provisions for pensions and similar obligations 1,573 2,087 461 514
Other provisions and liabilities 1,122 730 128 54
Tax loss carryforwards 363 572 – –
Other 188 226 243 284
Netting (2,733) (2,787) (2,733) (2,787)
Valuation allowances for deferred tax assets (143) (84) – –
Thereof for tax loss carryforwards (48) (54) – –
Total 992 1,473 2,849 2,234
Thereof current 426 585 271 262
For planned dividend distributions of Group companies and planned disposals, the resulting future income taxes and with-holding taxes are recognized as deferred tax liabilities as long as they are expected to lead to a reversal of temporary differ-ences. A planning horizon of one year was assumed for planned dividend distributions. A decrease in planned dividend distribu-tions led to deferred tax income of €16 million in 2013 (2012: €26 million).
The taxes for prior years primarily contain reversals of long-term tax provisions. The rise in the foreign tax-rate differential was largely attributable to improved earnings in Norway. The disposal of shares in the Edvard Grieg development project as well as income from loss of control over GASCADE Gastransport GmbH did not result in tax expenses. Therefore tax credits in the amount of €193 million were included in tax-exempt income.
Deferred taxes result primarily from temporary differences between tax balances and the measurement of assets and liabil-ities according to IFRS as well as from tax loss carryforwards and unused tax credits. The remeasurement of all the assets and liabilities associated with acquisitions according to IFRS 3 has resulted in significant deviations between fair values and the values in the tax accounts. This leads primarily to deferred tax lia bilities.
Deferred tax assets were offset against deferred tax liabilities of the same maturity if they were related to the same taxation authority.

Notes
Notes on Statement of Income
BASF Report 2013Consolidated Financial Statements180
Personnel expensesPersonnel expenses increased by 3.6%, from €8,963 million in 2012 to €9,285 million in 2013. This was largely attributable to higher pension benefits, wage and salary increases and the increased number of employees.
Personnel expenses (million €)
2013 2012
Wages and salaries 7,455 7,269
Social security contributions and expenses for pensions and assistance 1,830 1,694
Thereof for pension benefits 579 408
Personnel expenses 9,285 8,963
Number of employeesThe number of employees was 112,206 on December 31, 2013 (December 31, 2012: 110,782 employees). The average number of employees was distributed over the regions as follows:
Average number of employees
2013 2012
Europe 71,000 70,583
Thereof Germany 52,568 52,054
North America 16,838 16,216
Asia Pacific 16,533 16,105
South America, Africa, Middle East 7,473 7,065
BASF Group 111,844 109,969
Thereof apprentices and trainees 2,639 2,464
temporary staff 2,617 2,930
Employees from joint operations are included in the average number of employees relative to BASF’s share in the company. On average 344 employees worked for joint operations in 2013 (2012: 317 employees).
13 – Personnel expenses and employees
After a negative contribution to earnings in the previous year, there were minority interests in profits at BASF Total Petro-chemicals LLC in Port Arthur, Texas, in 2013. By contrast, minority interests in profits were lower primar-ily at WINGAS GmbH, Kassel, Germany, and BASF Petronas Chemicals Sdn. Bhd., Shah Alam, Malaysia.
For more information on minority interests in consolidated com-panies, see Note 21 on page 190
12 – Minority interests
Million € 2013 2012
Minority interests in profits 333 282
Minority interests in losses (2) (34)
Total 331 248
Undistributed earnings of subsidiaries resulted in temporary differences of €7,985 million in 2013 (2012: €7,946 million) for which deferred tax liabilities were not recognized, as they are either not subject to taxation on payout or they are expected to be reinvested for indefinite periods of time. The regional distribution of tax loss carryforwards is as follows:
Tax loss carryforwards (million €)
Tax loss carryforwards Deferred tax assets
2013 2012 2013 2012
Germany 1 12 – 1
Foreign 2,275 2,585 315 517
Total 2,276 2,597 315 518
German tax losses may be carried forward indefinitely. Foreign tax loss carryforwards exist primarily in the region Europe. Valuation allowances on deferred tax assets were reversed for tax loss carryforwards of €14 million. In 2012, valuation allowances on deferred tax assets were recognized for tax loss carryforwards of €6 million. Tax obligations primarily include assessed income taxes and other taxes as well as estimated income taxes not yet assessed for the current year. Tax obligations amounted to €954 million in 2013 (2012: €870 million).

Notes
Notes on Balance Sheet
Consolidated Financial StatementsBASF Report 2013 181
The goodwill of BASF is allocated to 27 cash-generating units (2012: 31) which are defined either on the basis of business units or on a higher level. The annual impairment testing took place in the fourth quarter of the year on the basis of the cash-generating units. The recoverable amount was determined using the value in use; this was done using five-year plans and their respective cash flows which had been approved by company management. For the time period after the fifth year, a terminal value is calculated using a forward projection from the last detailed planning year as a perpetual annuity. In accordance with IAS 36, the applied growth rates do not factor in capacity- increasing investments for which no cash outflows have taken place. The planning is based on experience, current performance and management’s best possible estimates on the future development of individual para meters, such as raw material prices and profit margins. Market assumptions regarding, for example, economic devel-opment and market growth are included based on external macro economic sources as well as sources specific to the industry. The weighted average cost of capital rate after tax required for the impairment tests is determined using the Capital Asset Pricing Model. It comprises a risk-free rate, the market risk premium and the spread for the credit risk. The calculation also takes into account BASF’s capital structure and the volatility of the BASF share in comparison with the capital market (beta) as well as the average tax rate of each cash-generating unit. The impairment tests were conducted assuming a weighted average cost of capital rate between 7.47% and 7.57% (2012: 6.82% to 7.01%). For the cash-generating unit Exploration & Production in the Oil & Gas segment, a cost of capital rate of 8.83% was applied (2012: 8.39%), which takes country-specific risks into account. In determining the value in use for the majority of cash- generating units, BASF generally anticipates that a reasonably possible deviation from the key assumptions will not lead to the carrying amount of the units exceeding their respective recov-erable amounts. The goodwill of the Constuction Chemicals divi-sion and the cash-generating unit Pigments in the Dispersions & Pigments division are exceptions. The goodwill of the Construc-tion Chemicals division arose in connection with the acquisition of Degussa Bauchemie in the 2006 financial year and the good-will of the cash-generating unit Pigments arose in connection with the acquisition of Engelhard and CIBA in the 2006 and 2009 financial years, respectively. In the 2013 financial year, the value in use of Construction Chemicals exceeded the carrying amount by around €225 million and the value in use of Pigments exceeded the carrying amount by approximately €241 million. The weighted average cost of capital rate used for the impair-ment testing of Construction Chemicals and of Pigments was 7.52% (2012: 6.91%) and 7.50% (2012: 6.89%), respectively. The recoverable amounts would equal the carrying amounts if the weighted average cost of capital rate increased by 0.52% for Construction Chemicals and by 1.05% for Pigments.
Earnings in the Construction Chemicals division were influenced by the growth of the construction industry. Earnings in the cash-generating unit Pigments were influenced by the growth in the application areas organic and inorganic pigments as well as effect pigments and pigment preparations. The focus on attractive market segments and the measures introduced to increase efficiency also influenced earnings. The carrying amounts of the Construction Chemicals and the Pigments units would equal the value in use if income from operations of the last detailed planning year, as the basis for the terminal value, were lower by 9.75% or 18.02%, respectively. The impairment tests resulted in no impairment losses on goodwill in 2013, as in the previous year.
14 – Intangible assets
Notes on Balance Sheet

Notes
Notes on Balance Sheet
BASF Report 2013Consolidated Financial Statements182
Development of intangible assets 2013 (million €)
Distribution, supply and
similar rights
Product rights, licenses and trademarks
Know-how, patents and production
technologies
Internally generated intangible
assets
Other rights and
values2 Goodwill Total
Cost
Balance as of January 1, 2013 4,397 1,414 1,892 92 697 6,384 14,876
Changes in scope of consolidation 1 3 – – 1 3 8
Additions – 5 18 14 98 – 135
Additions from acquisitions 33 52 198 – 88 787 1,158
Disposals (35) (104) (71) (31) (48) (18) (307)
Transfers – – (2) 3 11 3 15
Exchange differences (225) (6) (51) (1) (29) (287) (599)
Balance as of December 31, 2013 4,171 1,364 1,984 77 818 6,872 15,286
Accumulated valuation allowances
Balance as of January 1, 2013 1,389 399 614 55 226 – 2,683
Changes in scope of consolidation 1 1 – – 1 – 3
Additions 305 67 166 19 78 – 635
Disposals (30) (38) (71) (31) (45) – (215)
Transfers – – – – (4) – (4)
Exchange differences (28) – (14) – (9) – (51)
Balance as of December 31, 2013 1,637 429 695 43 247 – 3,051
Net carrying amount as of December 31, 2013 2,534 935 1,289 34 571 6,872 12,235
2 Including licenses to such rights and values
There were additions of €412 million to intangible assets in 2013 in connection with the acquisition of Pronova BioPharma ASA. Of this amount, €164 million pertained mainly to technologies, €141 million to goodwill and €83 million to other rights and values.
The transaction with Statoil ASA resulted in additions of €675 million to intangible assets, €643 million of which to goodwill and the remaining amount to other rights and values. The disposal of a 15-percent share of the Edvard Grieg development field reduced intangible assets by €70 million, of which €8 million represented a pro-rata share of goodwill.
Goodwill of cash-generating units (million €)
2013 2012
Cash-generating unit Goodwill Growth rates1 Goodwill Growth rates1
Crop Protection division 1,796 2.0% 1,870 2.0%
Catalysts division (excluding battery materials) 1,223 2.0% 1,365 2.0%
Exploration & Production in the Oil & Gas segment 959 (2.0%) 325 0.0%
Construction Chemicals division 642 1.5% 691 1.5%
Personal Care Ingredients in the Care Chemicals division 473 2.0% 440 2.0%
Pigments in the Dispersions & Pigments division 352 2.0% 368 2.0%
Other cash-generating units 1,427 0.0–2.0% 1,325 0.0–2.0%
Goodwill as of December 31 6,872 6,384
1 Growth rates of impairment tests to determine terminal values in accordance with IAS 36

Notes
Notes on Balance Sheet
Consolidated Financial StatementsBASF Report 2013 183
In connection with the acquisition of Becker Underwood in 2012, there were additions of €806 million to intangible assets, of which €499 million were to goodwill. The acquisition of the energy storage business of Novolyte Technologies LP, Cleveland, Ohio, resulted in additions of €134 million to intangible assets, of which €55 million were to goodwill.
The amounts recorded under transfers resulted primarily from the reclassification of intangible assets to assets of disposal groups.
Development of intangible assets 2012 (million €)
Distribution, supply and
similar rights
Product rights, licenses and trademarks
Know-how, patents and production
technologies
Internally generated intangible
assets
Other rights and
values1 Goodwill Total
Cost
Balance as of January 1, 2012 4,768 1,626 1,950 81 602 5,961 14,988
Changes in scope of consolidation 7 2 8 3 1 14 35
Additions 5 19 20 20 42 – 106
Additions from acquisitions 45 37 176 – 229 586 1,073
Disposals (382) (272) (261) (12) (149) (6) (1,082)
Transfers (44) 5 12 – (18) (64) (109)
Exchange differences (2) (3) (13) – (10) (107) (135)
Balance as of December 31, 2012 4,397 1,414 1,892 92 697 6,384 14,876
Accumulated valuation allowances
Balance as of January 1, 2012 1,425 603 743 49 318 – 3,138
Changes in scope of consolidation 2 1 4 – 1 – 8
Additions 396 63 132 17 65 – 673
Disposals (382) (271) (259) (11) (140) – (1,063)
Transfers (34) 3 – – (14) – (45)
Exchange differences (18) – (6) – (4) – (28)
Balance as of December 31, 2012 1,389 399 614 55 226 – 2,683
Net carrying amount as of December 31, 2012 3,008 1,015 1,278 37 471 6,384 12,193
1 Including licenses to such rights and values
In connection with the acquisition of Verenium, there were additions of €20 million to intangible assets in 2013, of which €4 million were to goodwill. Concessions for oil and gas production under the category product rights, licenses and trademarks with a net carrying amount of €455 million in 2013 (2012: €497 million) authorize the exploration and production of oil and gas in certain areas. Some of these rights entail obligations to deliver a portion of the production output to local companies. At the end of the term of a concession, the rights are returned.
In other rights and values, the line item transfers includes addi-tions the market value adjustments of emission rights recognized directly in equity as of the balance sheet date. Disposals were primarily caused by the derecognition of fully amortized intangible assets. Impairments of €25 million were recognized in 2013, primarily related to licenses in the Oil & Gas segment and customer relations in the Performance Products segment. The recoverable amount was determined using the value in use. Impairments are reported under other operating expenses. There were no material reversals of impairments in 2013.

Notes
Notes on Balance Sheet
BASF Report 2013Consolidated Financial Statements184
Additions to property, plant and equipment in 2013 amounted to €6,220 million. Significant investments were particularly related to the construction of a TDI plant in Ludwigshafen, Germany; an MDI plant in Chongqing, China; an acrylic acid production complex in Camaçari, Brazil; and oil and gas production facilities and wells in Europe. Investments for expansion purposes were particularly made at the sites in Ludwigshafen, Germany; Antwerp, Belgium; Geismar, Louisiana; and Port Arthur, Texas. Property, plant and equip-ment rose by €1,511 million on account of acquisitions; €1,204 million came from the acquisition of assets from Statoil ASA, Stavanger, Norway, and €288 million from the acquisition of Pronova BioPharma ASA, Lysaker, Norway.
Impairments of €213 million under accumulated depreciation in 2013 resulted mostly from the full write-down of a plant in the Chemicals segment, as well as from a gas field development project in the Oil & Gas segment that was impaired on a recoverable amount of €82 million. The recoverable amount for both impairments was determined using the value in use. Transfers of property, plant and equipment, primarily machinery and technical equipment, in the amount of €1.382 million primarily resulted from transfer of assets from fully consolidated to equity-accounted Group companies and from the reclassification of GASCADE Gastransport GmbH, Kassel, Germany, in the Oil & Gas segment. In 2013, transfers included a write-up of €1 million.
15 – Property, plant and equipment
Development of property, plant and equipment 2013 (million €)
Land, land rights and buildings
Machinery and technical
equipment
Miscellaneous equipment and
fixturesConstruction in
progress Total
Cost
Balance as of January 1, 2013 8,683 38,745 3,246 3,245 53,919
Changes in scope of consolidation – 1 1 – 2
Additions 219 884 194 3,412 4,709
Additions from acquisitions 75 1,426 4 6 1,511
Disposals (187) (705) (157) (151) (1,200)
Transfers 118 (2,193) 54 (1,394) (3,415)
Exchange differences (226) (650) (55) (129) (1,060)
Balance as of December 31, 2013 8,682 37,508 3,287 4,989 54,466
Accumulated depreciation
Balance as of January 1, 2013 5,058 29,526 2,561 164 37,309
Changes in scope of consolidation – – 1 – 1
Additions 276 1,971 208 64 2,519
Disposals (144) (681) (138) (23) (986)
Transfers (26) (1,947) (38) (5) (2,016)
Exchange differences (98) (475) (42) – (615)
Balance as of December 31, 2013 5,066 28,394 2,552 200 36,212
Net carrying amount as of December 31, 2013 3,616 9,114 735 4,789 18,254
In other rights and values, the line item transfers includes the market value adjustments of emission rights recognized directly in equity as of the balance sheet date. Disposals primarily concerned the derecognition of fully amortized intangible assets. In 2012, impairments of €75 million were recognized. Impairments are reported under other operating expenses.
A significant share of the impairments occurred in conjunction with the restructuring of the Construction Chemicals division (Functional Solutions segment) in Europe and were related to distribution, supply and similar rights and trademarks. There were no material reversals of impairments in 2012.

Notes
Notes on Balance Sheet
Consolidated Financial StatementsBASF Report 2013 185
Additions to property, plant and equipment in 2012 amounted to €4,084 million. Additions to property, plant and equipment resulting from acquisitions totaled €106 million, primarily due to the acquisition of Novolyte in the United States and China. Further investments related especially to the construction of a TDI plant in Ludwigshafen, Germany; the construction of an MDI plant in Chongqing, China; the construction of oil and gas production facilities and wells in Europe; the expansion of the MDI plant in Antwerp, Belgium; and the purchase of a new administrative building in Florham Park, New Jersey. The amounts recorded under transfers were primarily related to property, plant and equipment that was reclassified into the natural gas trading disposal group.
In 2012, impairments of €260 million were recognized in depreciation. A significant portion of the impairments were related to the full write-down of a Norwegian oilfield develop-ment project in the Oil & Gas segment. Changes in the scope of consolidation were predominantly related to the first-time full consolidation of hte Aktiengesell-schaft. In 2012, BASF exercised a purchase option for a plant site in China, which led to the reversal of a previous impairment of a purchase option. This €24 million reversal is included under transfers.
Development of property, plant and equipment 2012 (million €)
Land, land rights and buildings
Machinery and technical
equipment
Miscellaneous equipment and
fixturesConstruction in
progress Total
Cost
Balance as of January 1, 2012 8,465 39,226 3,066 2,677 53,434
Changes in scope of consolidation 19 189 11 29 248
Additions 269 1,056 227 2,426 3,978
Additions from acquisitions 34 60 4 8 106
Disposals (130) (617) (140) (8) (895)
Transfers 106 (965) 100 (1,872) (2,631)
Exchange differences (80) (204) (22) (15) (321)
Balance as of December 31, 2012 8,683 38,745 3,246 3,245 53,919
Accumulated depreciation
Balance as of January 1, 2012 4,945 29,781 2,501 25 37,252
Changes in scope of consolidation 11 177 7 – 195
Additions 268 1,977 197 152 2,594
Disposals (92) (573) (132) (1) (798)
Transfers (38) (1,680) 4 (12) (1,726)
Exchange differences (36) (156) (16) – (208)
Balance as of December 31, 2012 5,058 29,526 2,561 164 37,309
Net carrying amount as of December 31, 2012 3,625 9,219 685 3,081 16,610

Notes
Notes on Balance Sheet
BASF Report 2013Consolidated Financial Statements186
16 – Investments accounted for using the equity method and other financial assets
Investments accounted for using the equity method (million €)
2013 2012
Balance as of January 1 3,459 3,486
Changes in scope of consolidation – –
Additions 103 44
Disposals (6) (6)
Transfers 714 (58)
Exchange differences (133) (7)
Balance as of December 31 4,137 3,459
Accumulated valuation allowances – –
Net carrying amount as of December 31 4,137 3,459
Other financial assets (million €)
2013 2012
Other shareholdings 598 578
Long-term securities 32 35
Other financial assets 630 613
Due to increased business activities, the equity method has been applied to NEL Gastransport GmbH, Kassel, Germany, since 2013. A subsequent capital increase led to additions of €103 million to investments accounted for using the equity method. The loss of control over GASCADE Gastransport GmbH, Kassel, Germany, led to the transition from full consoli-dation to the equity method. Transfers of €631 million resulted from the measurement of the shareholding at fair value. Transfers in 2012 particularly included earnings and dividend
payments from investments accounted for using the equity method. Additions in 2012 resulted from a capital increase at Lucura Versicherungs AG, Ludwigshafen, Germany, and WINGAS Storage UK Ltd., London, England, as well as from the acquisi-tion of Novolyte Technologies LP, Independence, Ohio. In 2013, impairments on other shareholdings of €41 million were recognized.
17 – Inventories
Million € 2013 2012
Raw materials and factory supplies 2,560 2,629
Work-in-process, finished goods and merchandise 6,923 6,865
Advance payments and services-in-process 109 87
Inventories 9,592 9,581
Work-in-process, finished goods and merchandise are combined into one item due to the production conditions in the chemical industry. Services-in-process primarily relate to services not invoiced as of the balance sheet date. Inventories are valued using the weighted average cost method. Impairments are reversed if the reasons for the impair-ments no longer apply.
Cost of sales included inventories recognized as an expense amounting to €43,965 million in 2013, and €43,018 million in 2012. Valuation allowances on inventories amounted to €16 mil-lion in 2013 and €18 million in 2012. Of the total inventory, €1,890 million was valued at net realizable value in 2013 (2012: €2,175 million).

Notes
Notes on Balance Sheet
Consolidated Financial StatementsBASF Report 2013 187
18 – Receivables and miscellaneous assets
Other receivables and miscellaneous assets (million €)
2013 2012
Thereof
short-term Thereof
short-term
Receivables from joint operations, joint ventures, associated companies and other shareholdings 1,110 911 598 433
Loans and interest receivables 140 17 111 2
Derivatives with positive fair values 399 309 431 332
Receivables from finance leases 29 – 21 −
Insurance compensation received 11 11 10 10
Other 449 306 512 274
Other receivables and assets which qualify as financial instruments 2,138 1,554 1,683 1,051
Prepaid expenses 248 199 228 189
Defined benefit assets 47 – 41 −
Tax refund claims 702 668 1,019 992
Employee receivables 78 53 60 51
Precious metal trading positions 858 858 955 955
Other 435 298 380 217
Other receivables and assets which do not qualify as financial instruments 2,368 2,076 2,683 2,404
Other receivables and assets 4,506 3,630 4,366 3,455
The increase in short-term receivables from joint operations, joint ventures, associated companies and other sharehold-ings primarily arose from increased receivables from NEL Gas-transport GmbH, Kassel, Germany, and from the deconsolida-tion of GASCADE Gastransport GmbH, Kassel, Germany. The receivables mainly include short-term loans and interest receiv-ables from joint operations, joint ventures, associated companies and other shareholdings amounting to €750 million and long-term loans and interest receivables amounting to €182 million. In 2013, prepaid expenses included prepayments for operating expenses of €71 million (2012: €86 million) as well as prepayments for insurance premiums of €25 million (2012: €24 million). The decrease in other receivables from tax refund claims was primarily due to the collection of prior-year tax refund claims in Norway.
Precious metal trading positions primarily comprise physical positions and precious metal accounts as well as long positions in precious metals, which are largely hedged through sales or derivatives. The decrease in the precious metal trading posi-tions was primarily due to lower precious metal prices. In other receivables which qualify as financial instruments, financial receivables such as receivables from the sale of assets are reported. The decrease is mainly due to reduced receivables in connection with investment projects carried out with a part-ner of BASF. The increase in other receivables which do not qualify as financial instruments was largely attributable to the receivables from the Argentinian government in connection with the new gas price scheme (NGPS).
Valuation allowances for doubtful receivables 2013 (million €)
Balance as of January 1,
2013
Additions recognized
in income
Reversals recognized
in income
Additions not recognized
in income
Reversals not recognized
in income
Balance as of December 31,
2013
Accounts receivable, trade 335 72 39 24 71 321
Other receivables 100 1 5 28 23 101
Total 435 73 44 52 94 422

Notes
Notes on Balance Sheet
BASF Report 2013Consolidated Financial Statements188
In comparison with the previous year, there were no expected major payment defaults by a customer in 2013 and therefore there was a decline in additions to valuation allowances recog-nized in income. A portion of receivables is covered by credit insurance. The changes recognized in income contained individual valuation allowances, group-wise individual valuation allow-ances and valuation allowances due to transfer risks. The changes not recognized in income were primarily related to changes in the scope of consolidation, translation adjustments and derecognition of uncollectible receivables. Even in the current economic environment, BASF does not note any material changes in the credit quality of its receivables. In 2013, after being individually assessed for impairment, valuation allowances of €50 million were recognized for trade
accounts receivable and €18 million reversed. After being individually assessed for impairment, valuation allowances of €1 million for other receivables were recognized in the income statement and €5 million reversed. In 2012, after being individ-ually assessed for impairment, valuation allowances of €49 mil-lion for trade accounts receivable and €37 million reversed. After being individually assessed for impairment, valuation allowances of €1 million were reversed and recognized in the income statement. Contractual conditions of receivables were not renegotiated to any major extent in 2013 and 2012. Overdue trade accounts receivable which have not been individually assessed for impairment were included in credit insurance policies in the amount of €148 million on Decem-ber 31, 2013 (December 31, 2012: €150 million).
Aging analysis of trade accounts receivable (million €)
2013 2012
Gross value Valuation allowances Gross value Valuation allowances
Not yet due 8,624 28 8,509 47
Past due less than 30 days 532 1 605 3
Past due between 30 and 89 days 131 8 170 7
Past due more than 90 days 410 284 557 278
Total 9,697 321 9,841 335
As of December 31, 2013, there were no material other receivables classified as financial instruments that were overdue and for which no valuation allowance was made.
19 – Capital, reserves and retained earnings
Authorized capitalAt the Annual Shareholders’ Meeting of April 30, 2009, share-holders authorized the Board of Executive Directors, with the approval of the Supervisory Board, to increase the subscribed capital by issuing new shares in an amount of up to €500 mil-lion against cash through April 30, 2014. The Board of Execu-tive Directors is empowered, following the approval of the Supervisory Board, to decide on the exclusion of shareholders’ subscription rights for these new shares in certain predefined cases covered by the enabling resolution. Until now, this option has not been exercised and no new shares have been issued.
Reserves and retained earningsCapital surplus includes share premiums from the issuance of shares, the consideration for warrants and negative goodwill from the capital consolidation resulting from acquisitions of subsidiaries in exchange for the issue of BASF SE shares at par value.
Million € 2013 2012
Legal reserves 488 431
Other retained earnings 25,682 23,277
Reserves and retained earnings 26,170 23,708
Valuation allowances for doubtful receivables 2012 (million €)
Balance as of January 1,
2012
Additions recognized
in income
Reversals recognized
in income
Additions not recognized
in income
Reversals not recognized
in income
Balance as of December 31,
2012
Accounts receivable, trade 424 81 60 10 120 335
Other receivables 46 – 1 89 34 100
Total 470 81 61 99 154 435

Notes
Notes on Balance Sheet
Consolidated Financial StatementsBASF Report 2013 189
20 – Other comprehensive income
Other comprehensive incomeThe income and expenses shown in other comprehensive income are divided into two categories. Items that will be recognized in the income statement in the future (known as “recycling”) and those that will not. The first category includes translation adjustments, the measurement of securities at fair value, and changes in the fair value of derivatives held to hedge future cash flows and net investments in a foreign operation. Items in other comprehensive income that will not be reclassi-fied to the income statement in the future include effects from the remeasurement of defined benefit plans and the remeasure-ment of assets and liabilities due to acquisition of a majority interest.
Translation adjustmentsThe translation adjustments due to the use of the closing rate method are shown under currency translation adjustments as a component of other comprehensive income in equity (trans-lation adjustments) and are recognized in the income statement only upon the disposal of a company.
Measurement of securities at fair valueFor fully and proportionally consolidated companies, as well as those companies which are accounted for using the equity method, changes in value of available-for-sale securities in excess of their acquisition costs are accounted for in other com-prehensive income, without impacting the income statement, until the securities are disposed of. Upon disposal, the changes accumulated in other comprehensive income are recognized in the income statement.
Cash flow hedgesDerivatives are used to hedge future cash flows. The effective portion of the change in value of these derivatives is recognized in equity. This also comprises equity effects from the hedging of future cash flows at companies accounted for using the equity method. Hedging future cash flows at Nord Stream AG, Zug, Swit-zerland, a company accounted for using the equity method, resulted in a change of €30 million in 2013 and of minus €35 mil-lion in 2012.
Hedges of net investments in foreign operationsHedge accounting can be used to hedge the translation risk from the net investment in a foreign operation. Effects recorded in equity are recognized in the income statement upon sale of the operation or return of the investment.
Remeasurement of defined benefit plansActuarial gains and losses from changed estimations with regard to actuarial assumptions used for calculating defined pension obligations, as well as the difference between standardized and actual returns on plan assets, are recognized directly in equity as other comprehensive income.
Remeasurement due to acquisition of majority of sharesUntil 2008, effects from the revaluation of net assets were recorded in equity when they arose due to the acquisition of a majority of shares in a previously proportionally consolidated company. Additional depreciation of these revalued assets leads to a reversal of the corresponding item in equity; this does not affect income.
Transfers between the line item legal reserves and the line item other retained earnings increased legal reserves by €57 million in 2013 and by €48 million in 2012. The acquisition of shares in companies which BASF already controls or includes as a joint arrangement in the Consolidated Financial Statements is treated as a transaction between share-holders, as long as this does not lead to a change in the con-solidation method. There were no transactions of this type in 2013, as in the previous year.
Payment of dividendsIn accordance with the resolution of the Annual Shareholders’ Meeting on April 26, 2013, BASF SE paid a dividend of €2.60 per share from the retained profit of the 2012 fiscal year. With 918,478,694 shares entitled to dividends, this amounts to a total dividend payout of €2,388,044,604.40.

Notes
Notes on Balance Sheet
BASF Report 2013Consolidated Financial Statements190
21 – Minority interests
2013 2012
Equity stake Equity stake
Group company Partner (%) Million € (%) Million €
W & G shareholdings (WINGAS GmbH, WINGAS Holding GmbH, WINGAS UK Limited)
Gazprom Group, Moscow, Russia
49.98 121 49.98 426
BASF India Ltd., Mumbai, India Shares are publicly traded 26.67 37 26.67 41
BASF PETRONAS Chemicals Sdn. Bhd., Shah Alam, Malaysia
PETRONAS (Petroliam Nasional Bhd.), Kuala Lumpur, Malaysia
40.00 108 40.00 113
BASF TOTAL Petrochemicals LLC, Port Arthur, Texas Total Petrochemicals Inc., Houston, Texas 40.00 214 40.00 216
Shanghai BASF Polyurethane Company Ltd., Shanghai, China
Shanghai Hua Yi (Group) Company, Shanghai, China, and SinopecShanghai GaoQiao Petrochemical Corporation, Shanghai, China
30.00
81
30.00
92
Other 117 122
Total 678 1,010
In addition to state pension plans, most employees are entitled to Company pension benefits from either defined contribution or defined benefit plans. Benefits generally depend on years of service, contributions or compensation, and take into consider-ation the legal framework of labor, tax and social security laws of the countries where the companies are located. To limit the risks of changing market conditions as well as demographic develop-ments, employees have been almost exclusively offered defined contribution plans for future years of service in recent years. The Group Pension Committee monitors the risks of all pension plans of the Group. In this connection, it issues guide-lines regarding the governance and risk management of pensions plans, particularly with regard to the funding of the pension plans and the portfolio structure of the existing plan assets. The orga-nization, responsibilites, strategy, implementation and reporting requirements are documented for the units involved.
Economic and legal environmentIn some countries – especially in Germany, the United Kingdom, the Netherlands, Switzerland and Belgium – there are pension obligations subject to a governmental supervisory authority or similar legal restrictions. For example, there are minimum funding requirements to cover pension obligations, which are based on actuarial assumptions that may differ from those in IAS 19. Furthermore, there are restrictions in qualitative and quantitative terms for the investment in different asset catego-ries. This could result in fluctuating employer contributions, finan cing requirements and the absorption of obligations from the pension funds to comply with the regulatory requirements. The obligations and the plan assets used to fund the obli-gations are exposed to demographic, legal and economic risks. Economic risks primarily include unforeseen develop ments in goods and capital markets. They affect, for example, pension adjustments based on the level of inflation in Germany and in the
United Kingdom, as well as the impact of the discount rate on the amount of the defined benefit obligation. In previous years, measues taken to close plans with defined benefits for future service, especially bene fits based on final pay promises and the assumption of healthcare costs for former employees, however, led to a reduction in risk with regard to future benefit levels. As of December 31, 2013, approximately 3% remaining of the total pension obligations were related to final pay promises, and around 2% related to the assumption of healthcare costs. The funding strategy of the Group is aligned with country-specific supervisory and tax regluations.
Description of the defined benefit plans
GermanyFor BASF SE and German Group companies, a basic level of benefits is provided by BASF Pensionskasse VVaG, a legally independent funded plan which is financed by contributions of employees and the employer and the return on assets. BASF SE will ensure the necessary contributions to adequately finance the benefits promised by BASF Pensionskasse VVaG. Some of the benefits financed via the BASF Pensionskasse VVaG are subject to adjustments that must be borne by its member companies to the extent that these cannot be borne by BASF Pensionskasse VVaG due to the regulations imposed by the German supervisory authority. In 2004, the defined benefit plan at BASF was closed for new employees and replaced by a defined contribution plan. At BASF SE, occupational pension promises that exceed the basic level of benefits are financed under a contractual trust arrangement by BASF Pensions treuhand e.V.; at German Group companies, these benefits are almost exclusively financed via pension provisions. The benefits are largely based on cash balance plans. Furthermore, employ ees are given the option of participating in deferred compensation schemes.
22 – Provisions for pensions and similar obligations

Notes
Notes on Balance Sheet
Consolidated Financial StatementsBASF Report 2013 191
Actuarial assumptions The valuation of the defined benefit obligation is largely based on the following assumptions:
Assumptions used to determine the defined benefit obligation as of December 31
Germany United States SwitzerlandUnited
Kingdom
2013 2012 2013 2012 2013 2012 2013 2012
Discount rate 3.90 3.50 4.80 3.75 2.40 2.00 4.40 4.40
Projected pension increase 2.00 2.00 – – – – 3.10 2.70
United StatesDefined benefit plans for employees of U.S. companies are closed to new employees and are frozen to further increases in benefits from future years of service for most groups of the work-force. There is no entitlement to pension adjustments to com-pensate for cost-of-living increases. For future years of service, employees are granted benefits based on defined contribution plans. The legal and regulatory frameworks governing the plans are based on the U.S. Employee Retirement Income Security Act (ERISA), which requires the plan sponsor to ensure a minimum funding level. Any employer contributions necessary to meet the minimum funding level would be based on the results of an actu arial valuation. Furthermore, there are unfunded pension plans that are not subject to ERISA. Additional similar obligations arise from plans which assume the healthcare costs and life insurance premiums of retired employees and their dependents. Such plans are closed to new entrants. In addition, the company-sponsored subsidy to such plans is not subject to annual increases.
SwitzerlandThe employees of the BASF Group in Switzerland receive a Company pension, which is financed through a pension fund by employer and employee contributions as well as the return on assets. The pension plan is accounted for as a defined benefit plan, as the obligatory minimum pension guaranteed by law according to the Swiss law “Berufliche Vorsorge (BVG)” is included in the scheme. All benefits vest immediately. Accord-ing to government regulations, the employer is obligated to make contributions, so that the pension fund is able to grant minimum benefits guaranteed by law. The pension committee, based on equal representation, manages and governs the plan promises and assets.
United KingdomThe BASF Group maintains defined benefit plans in the United Kingdom, which were closed for further increases in benefit from future years of service. A part of the workforce still receives benefit increases depending on service period in connection with a career average plan. Adjustments to compensate for increases in the cost of living until the beginning of retirement are legally required for beneficiaries of defined benefit plans. The financing of the pension plans is determined by the pro-visions of the regulatory authority for pensions and the relevant social and labor law requirements. The defined benefit plans are administered by a trust company, whose Board of Trustees, according to the trustee agreement and law, represent the interests of the beneficiaries and ensure that the benefits can be paid in the future. The required funding is determined using technical valuations according to local regulations every three years. Following the closure of defined benefit plans, employees are granted benefits based on defined contribution plans for future years of service.
Other countriesIn the case of subsidiaries in other countries, defined benefits are covered in some cases by pension provisions, but mainly by external insurance companies or pension funds.

Notes
Notes on Balance Sheet
BASF Report 2013Consolidated Financial Statements192
Composition of expenses for pension benefits (million €)
2013 2012
Expenses for defined benefit plans 325 170
Expenses for defined contribution plans 254 238
Expenses for pension benefits (recognized in income from operations) 579 408
Net interest expenses from underfunded pension plans and similar obligations 192 121
Net interest income from overfunded pension plans and similar obligations (2) (6)
Expenses for pension benefits (recognized in the financial result) 190 115
A change in the material actuarial assumptions would have the following effects on the defined benefit obligation:
Sensitivity of the defined benefit obligation as of December 31 (million €)
Increase by 0.5 percentage points Decrease by 0.5 percentage points
2013 2012 2013 2012
Discount rate (1,380) (1,520) 1,550 1,700
Projected pension increase 860 850 (780) (780)
An alternative valuation of the defined benefit obligation was conducted in order to determine how changes in the underly-ing assumptions would influence the amount of the defined bene fit obligation. A linear extrapolation of these amounts based
on alternative changes in the assumptions as well as an addition of combined changes in the individual assumptions is not possible.
Explanation of the amounts in the statement of income and balance sheet
Sensitivity analysis
Assumptions used to determine expenses for pension plans in each business year
Germany United States SwitzerlandUnited
Kingdom
2013 2012 2013 2012 2013 2012 2013 2012
Discount rate 3.50 5.00 3.75 4.75 2.00 2.50 4.40 4.90
Projected pension increase 2.00 2.00 – – – – 2.70 2.90
The assumptions used to ascertain the defined benefit obliga-tion as of December 31 are used in the following year to deter-mine the expenses for pension plans. A Group-wide, uniform procedure was used for the first time starting December 31, 2013, to determine the discount rates used for the valuation of material pension obligations of the BASF Group. Accordingly, the discount rates were derived from the yields on corporate bonds in the respective currency zones with an issuing volume of more than 100 million units of the respective currency with a minimum rating of AA– up to AA+ from one of the three rating agencies: Fitch, Moody’s, or Standard & Poor’s. If the defined benefit obligation as of December 31, 2013 had been valued for the material currency zones using the method applied in the previous year, it would be €390 million higher. The net interest expense for the financial
year 2014 will be €10 million lower as a result of the new procedure. The measurement date for the pension plans is set as December 31 of the respective financial year, and is generally made based on the most recent actuarial mortality tables, which in Germany are derived from the BASF Group population and last updated in 2010.
Actuarial mortality tables (significant countries) as of December 31, 2013
Germany Heubeck Richttafeln 2005G (modified)
United States RP2000 Combined Healthy Fully Generational Mortality Table
Switzerland BVG 2010 generation
United Kingdom S1PxA (standard actuarial mortality tables for self-administered plans (SAPS))
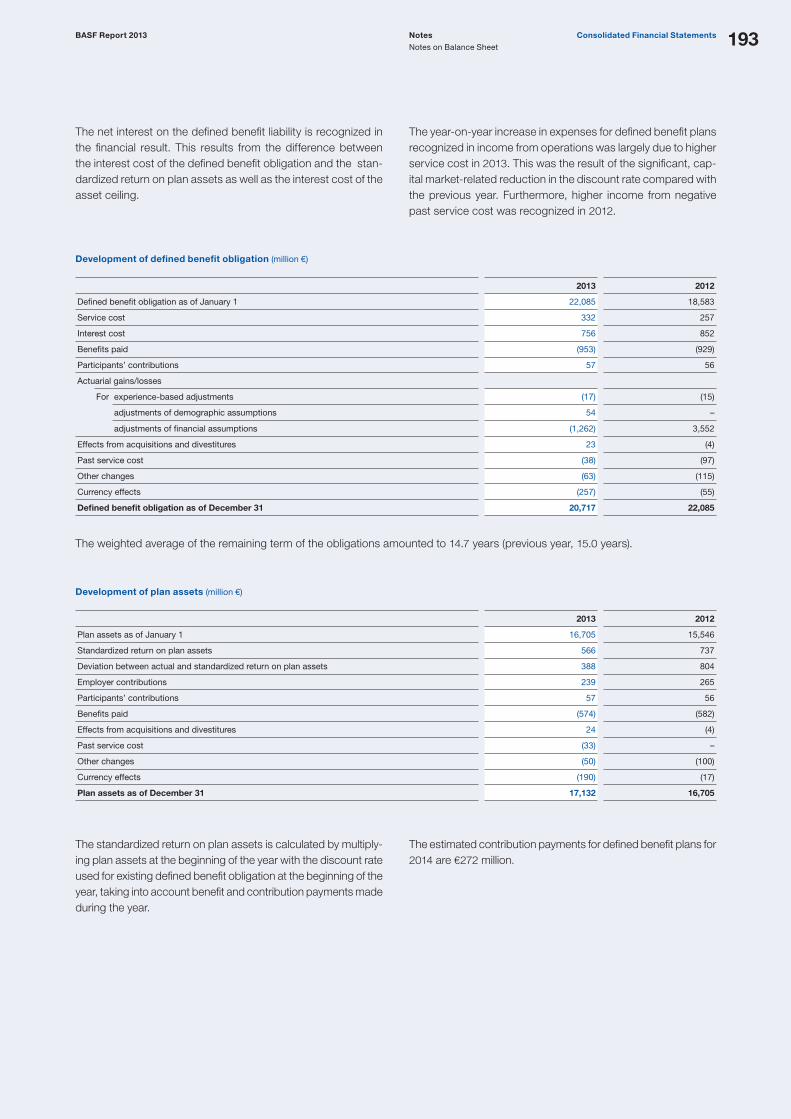
Notes
Notes on Balance Sheet
Consolidated Financial StatementsBASF Report 2013 193
The net interest on the defined benefit liability is recognized in the financial result. This results from the difference between the interest cost of the defined benefit obligation and the stan-dardized return on plan assets as well as the interest cost of the asset ceiling.
The year-on-year increase in expenses for defined benefit plans recognized in income from operations was largely due to higher service cost in 2013. This was the result of the significant, cap-ital market-related reduction in the discount rate compared with the previous year. Furthermore, higher income from negative past service cost was recognized in 2012.
Development of defined benefit obligation (million €)
2013 2012
Defined benefit obligation as of January 1 22,085 18,583
Service cost 332 257
Interest cost 756 852
Benefits paid (953) (929)
Participants’ contributions 57 56
Actuarial gains/losses
For experience-based adjustments (17) (15)
adjustments of demographic assumptions 54 –
adjustments of financial assumptions (1,262) 3,552
Effects from acquisitions and divestitures 23 (4)
Past service cost (38) (97)
Other changes (63) (115)
Currency effects (257) (55)
Defined benefit obligation as of December 31 20,717 22,085
The weighted average of the remaining term of the obligations amounted to 14.7 years (previous year, 15.0 years).
Development of plan assets (million €)
2013 2012
Plan assets as of January 1 16,705 15,546
Standardized return on plan assets 566 737
Deviation between actual and standardized return on plan assets 388 804
Employer contributions 239 265
Participants’ contributions 57 56
Benefits paid (574) (582)
Effects from acquisitions and divestitures 24 (4)
Past service cost (33) –
Other changes (50) (100)
Currency effects (190) (17)
Plan assets as of December 31 17,132 16,705
The standardized return on plan assets is calculated by multiply-ing plan assets at the beginning of the year with the discount rate used for existing defined benefit obligation at the beginning of the year, taking into account benefit and contribution payments made during the year.
The estimated contribution payments for defined benefit plans for 2014 are €272 million.

Notes
Notes on Balance Sheet
BASF Report 2013Consolidated Financial Statements194
Regional allocation of defined benefit plans as of December 31 (million €)
Pension obligations Plan assets Net balance sheet
2013 2012 2013 2012 2013 2012
Germany 13,369 13,999 10,941 10,386 (2,428) (3,613)
United States 3,263 3,816 2,111 2,301 (1,152) (1,515)
Switzerland 1,694 1,828 1,763 1,738 5 (90)
United Kingdom 1,525 1,462 1,543 1,489 18 27
Other 866 980 774 791 (105) (189)
Total 20,717 22,085 17,132 16,705 (3,662) (5,380)
Development of the net defined benefit liability (million €)
2013 2012
Net defined benefit liability as of January 1 (5,380) (3,038)
Service cost (332) (257)
Interest cost (756) (852)
Standardized return on plan assets 566 737
Actuarial gains/losses of the defined benefit obligation 1,225 (3,537)
Deviation between actual and standardized return on plan assets 388 804
Changes in asset ceiling recognized directly in equity (77) 1
Benefits paid by unfunded plans 379 347
Employer contributions 239 265
Effects from acquisitions and divestitures 1 –
Past service cost 5 97
Other changes 13 15
Currency effects 67 38
Net defined benefit liability as of December 31 (3,662) (5,380)
Thereof defined benefit assets 47 41
provisions for pensions and similar obligations (3,709) (5,421)
Development of asset ceiling (million €)
2013 2012
Asset ceiling as of January 1 – (1)
Changes recognized directly in equity in the business year 82 1
Transfer in gas trading business disposal group (5) –
Asset ceiling as of December 31 77 –
Assets from overfunded plans can only be recognized to the extent that it is possible that the existing overfunded plans can be used for the reduction of future contributions or the return to
plan sponsors. To the extent that these requirements are not met, recognition is not possible due to the necessity of an asset ceiling.
Explanations regarding plan assets The target asset allocation has been defined by using asset liability studies and is reviewed regularly. Accordingly, plan assets are aligned with the long-term development of the defined benefit obligation, taking into consideration investment risks and adherence to regulations. The existing portfolio structure is oriented towards the target asset allocation. In addition, current
market assessments are taken into consideration. In order to mitigate risks and maximize returns, a widely spread global port-folio of individual asset classes is held. Liability-driven investment (LDI) techniques, such as hedging the risk of changes in interest rates and inflation, are used in par ticular pension plans, especially in the British and American plans.

Notes
Notes on Balance Sheet
Consolidated Financial StatementsBASF Report 2013 195
Current funding situation of the pension plans as of December 31 (million €)
2013 2012
Defined benefit obligation Plan assets
Defined benefit obligation Plan assets
Unfunded pension plans 2,288 – 2,437 –
Funded pension plans 18,429 17,132 19,648 16,705
Total 20,717 17,132 22,085 16,705
Structure of plan assets (%)
2013 2012
Equity instruments 27 28
Debt instruments 56 57
Thereof for government debtors 13 14
for other debtors 43 43
Real estate 4 4
Alternative investments 12 10
Cash and cash equivalents 1 1
Total 100 100
Almost all of the equity instruments are priced on an active mar-ket. The category debt instruments includes promissory notes and debentures (Pfandbriefe), which were acquired through pri-vate placements with a market value in the amount of €1,676 mil-lion in 2013 and €2,018 million in 2012. For such securities, especially those held by domestic pension plans, there is no active market. The capital market compensates for this lack of fungibil-ity with yield premiums depending on the maturity. There is no active markets for plan assets in real estate and alternative invest ments – except in exceptional cases. The asset class debt instruments comprises promissory notes and debentures (Pfandbriefe) in addition to corporate and government bonds. Government bonds primarily concern those
countries enjoying the highest credit ratings such as the United States, the United Kingdom and Switzerland. Corporate bonds mainly comprise investment-grade bonds, whereby particular high-yield bonds are also held. There may be a change of plan asset allocation due to a change in current market assessment based on continuous monitoring of default risk in relation to a given risk budget and creditworthiness of issuers. Alternative invest ments largely comprise investments in private equity, abso-lute return funds and senior secured loans. On December 31, 2013, plan assets contained securities issued by BASF Group companies with a market value of €8 mil-lion in 2013 and €21 million in 2012. The market value of the prop-erties of legally independent pension funds rented to BASF Group companies amounted to €76 million on December 31, 2013, and €57 million on December 31, 2012. Since 2010 there has been an agreement between BASF SE and BASF Pensionskasse about the granting of profit participa-tion capital with a nominal value of €80 million, which is used to strengthen the financing of the BASF Pensionskasse. No mate-rial transactions took place between the legally independent pen-sion funds and BASF Group companies in 2013. The funding of the plans was as follows:
Defined contribution plans and government pensionsThe contributions to defined-contribution plans included in income from operations amounted to €254 million in 2013 and €238 mil-
lion in 2012. Contributions to government pension plans were €557 million in 2013 and €547 million in 2012.
23 – Other provisions
2013 2012
Million €Thereof
short-termThereof
short-term
Restoration obligations 996 50 748 8
Environmental protection and remediation costs 601 156 617 125
Employee obligations 1,866 1,305 1,905 1,261
Sales and purchase risks 612 606 635 626
Restructuring measures 228 153 198 154
Litigation, damage claims, guarantees and similar commitments 105 49 171 78
Other 1,132 297 1,279 376
Total 5,540 2,616 5,553 2,628

Notes
Notes on Balance Sheet
BASF Report 2013Consolidated Financial Statements196
Restoration obligations primarily relate to the estimated costs for the filling of wells, the removal of production equipment after the end of production and the removal of natural gas pipelines. The increase in long-term provisions through additions as a result of the acquisition of three fields from Statoil ASA in the Oil & Gas segment were partially offset by the disposal of provisions in other changes as a result of the loss of control over GASCADE Gas-transport GmbH. Provisions for environmental protection and remediation costs cover expected costs for rehabilitating contaminated sites, recultivating landfills, removal of environmental contamination at existing production or storage sites and similar measures. In addition, provisions are recognized in connection with the allocation of emission certificates from the German Emissions Trading Authority or other similar bodies. Provisions for employee obligations include obligations for the granting of long-service bonuses, anniversary payments, variable compensation including associated social security con-tributions, and other accruals as well as provisions for early retirement programs for employees nearing retirement.
For more information on provisions for the long-term incentive program, see Note 30 from page 210 onward
The sales and purchase risks provisions include warranties, product liability, customer rebates and other price reductions, sales commissions, and provisions for expected losses on com-mitted purchases as well as provisions for onerous contracts. The restructuring measures provisions include severance payments to employees as well as expected costs for site closures, including the costs for demolition and similar measures. Provisions for litigation, damage claims, guarantees and similar commitments include the expected costs of litigation, obligations under damage claims, and other guarantees. The decrease was primarily due to the utilization of provisions for litigation in Brazil and currency effects. Other includes long-term tax provisions as well as further present obligations and accruals. The decrease is primarily related to the reclassification of tax provisions to liabilities. The following table shows the development of other provi-sions by category. Other changes include changes in the scope of consolidation, currency effects and the reclassification of obligations to liabilities when the amount and timing of these obligations become known.
Development of other provisions in 2013 (million €)
Jan. 1, 2013 AdditionsUnwinding of the discount Utilization Reversals
Other changes Dec. 31, 2013
Restoration obligations 748 454 39 (23) (1) (221) 996
Environmental protection and remediation costs 617 131 5 (128) (19) (5) 601
Employee obligations 1,905 1,460 10 (1,407) (88) (14) 1,866
Sales and purchase risks 635 319 . (234) (60) (48) 612
Restructuring measures 198 137 . (79) (21) (7) 228
Litigation, damage claims, guarantees and similar commitments 171 25 . (47) (23) (21) 105
Other 1,279 218 . (157) (84) (124) 1,132
Total 5,553 2,744 54 (2,075) (296) (440) 5,540

Notes
Notes on Balance Sheet
Consolidated Financial StatementsBASF Report 2013 197
24 – Liabilities
Financial indebtedness (million €)
Carrying amounts based on effective interest method
Currency
Nominal value (million,
currency of issue)Effective
interest rate 2013 2012
BASF SE
Commercial Paper USD 1,700 1,232 1,288
4.5% Bond 2006/2016 EUR 500 4.62% 499 498
Variable Bond 2013/2016 EUR 200 variable 200 –
4.25% Bond 2009/2016 EUR 200 4.40% 199 199
5.875% Bond 2009/2017 GBP 400 6.04% 478 487
4.625% Bond 2009/2017 EUR 300 4.69% 299 299
Variable Bond 2013/2018 EUR 300 variable 300 –
1.5% Bond 2012/2018 EUR 1,000 1.51% 1,000 745
Variable Bond 2013/2020 EUR 300 variable 300 –
1.875% Bond 2013/2021 EUR 700 1.94% 697 –
2% Bond 2012/2022 EUR 1,000 2.16% 987 986
3.675% Bond 2013/2025 NOK 1,450 3.70% 173 –
3% Bond 2013/2033 EUR 500 3.15% 489 –
2.875% Bond 2013/2033 EUR 200 3.09% 198 –
3.25% Bond 2013/2043 EUR 200 3.27% 199 –
3.89% U.S. Private Placement Series A 2013/2025 USD 250 3.92% 181 –
4.09% U.S. Private Placement Series B 2013/2028 USD 700 4.11% 506 –
4.43% U.S. Private Placement Series C 2013/2034 USD 300 4.45% 217 –
BASF Finance Europe N.V.
6% Bond 2008/2013 EUR 1,250 6.15% – 1,248
5% Bond 2007/2014 EUR 1,250 5.04% 1,250 1,250
3.625% Bond 2008/2015 CHF 200 3.77% 163 165
5.125% Bond 2009/2015 EUR 2,000 5.07% 2,001 2,002
4.5% Bond 2009/2016 EUR 150 4.56% 150 150
Ciba Specialty Chemicals Finance Luxembourg S.A.
4.875% Bond 2003/2018 EUR 477 4.88% 428 418
Other Bonds 449 659
Bonds and other liabilities to the capital markets 12,595 10,394
Liabilities to credit institutions 1,812 2,404
Financial indebtedness 14,407 12,798
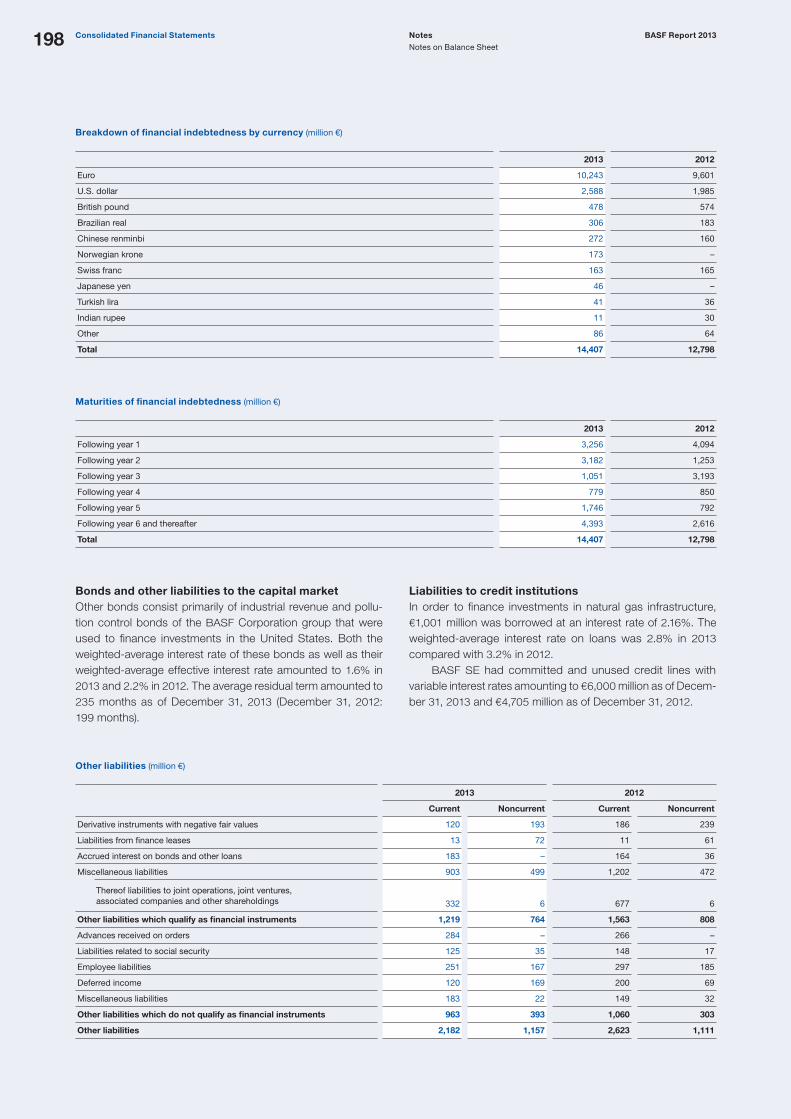
Notes
Notes on Balance Sheet
BASF Report 2013Consolidated Financial Statements198
Other liabilities (million €)
2013 2012
Current Noncurrent Current Noncurrent
Derivative instruments with negative fair values 120 193 186 239
Liabilities from finance leases 13 72 11 61
Accrued interest on bonds and other loans 183 – 164 36
Miscellaneous liabilities 903 499 1,202 472
Thereof liabilities to joint operations, joint ventures, associated companies and other shareholdings 332 6 677 6
Other liabilities which qualify as financial instruments 1,219 764 1,563 808
Advances received on orders 284 – 266 –
Liabilities related to social security 125 35 148 17
Employee liabilities 251 167 297 185
Deferred income 120 169 200 69
Miscellaneous liabilities 183 22 149 32
Other liabilities which do not qualify as financial instruments 963 393 1,060 303
Other liabilities 2,182 1,157 2,623 1,111
Breakdown of financial indebtedness by currency (million €)
2013 2012
Euro 10,243 9,601
U.S. dollar 2,588 1,985
British pound 478 574
Brazilian real 306 183
Chinese renminbi 272 160
Norwegian krone 173 –
Swiss franc 163 165
Japanese yen 46 –
Turkish lira 41 36
Indian rupee 11 30
Other 86 64
Total 14,407 12,798
Maturities of financial indebtedness (million €)
2013 2012
Following year 1 3,256 4,094
Following year 2 3,182 1,253
Following year 3 1,051 3,193
Following year 4 779 850
Following year 5 1,746 792
Following year 6 and thereafter 4,393 2,616
Total 14,407 12,798
Bonds and other liabilities to the capital marketOther bonds consist primarily of industrial revenue and pollu-tion control bonds of the BASF Corporation group that were used to finance investments in the United States. Both the weighted-average interest rate of these bonds as well as their weighted-average effective interest rate amounted to 1.6% in 2013 and 2.2% in 2012. The average residual term amounted to 235 months as of December 31, 2013 (December 31, 2012: 199 months).
Liabilities to credit institutionsIn order to finance investments in natural gas infrastructure, €1,001 million was borrowed at an interest rate of 2.16%. The weighted-average interest rate on loans was 2.8% in 2013 compared with 3.2% in 2012. BASF SE had committed and unused credit lines with variable interest rates amounting to €6,000 million as of Decem-ber 31, 2013 and €4,705 million as of December 31, 2012.

Notes
Notes on Balance Sheet
Consolidated Financial StatementsBASF Report 2013 199
25 – Contingent liabilities and other financial obligations
The contingent liabilities listed below are stated at nominal value:
Contingent liabilities (million €)
2013 2012
Bills of exchange 8 4
Guarantees 61 73
Thereof to associated companies 8 8
Warranties 47 63
Thereof to associated companies 20 36
Collateral granted on behalf of third-party liabilities 3 4
Total 119 144
Other liabilitiesLiabilities to joint operations, joint ventures, associated compa-nies and other shareholdings arose mainly from financial invest-ments of equity-accounted companies in the BASF Group. The decline in 2013 was mainly attributable to companies in the Oil & Gas segment.
For more information on financial risks and derivative financial instruments, see Note 27 from page 201 onward
For more information on liabilities arising from leasing contracts, see Note 28 on page 208
Secured liabilities (million €)
2013 2012
Liabilities to credit institutions 3 3
Miscellaneous liabilities 34 13
Secured liabilities 37 16
Liabilities to credit institutions were secured primarily with registered land charges. There are no secured contingent liabilities.
Other financial obligations (million €)
2013 2012
Construction in progress 5,921 6,618
Thereof purchase commitments 2,056 2,164
for the purchase of intangible assets 14 10
Obligation arising from long-term leases (excluding finance leases) 1,397 1,239
Payment and loan commitments and other financial obligations 82 126
Total 7,400 7,983
BASF has a stake of 15.5% in the project company Nord Stream AG, Zug, Switzerland, whose purpose is to construct and operate a natural gas pipeline through the Baltic Sea from Vyborg, Russia, to Greifswald, Germany. The construction of the second pipeline was completed in 2012. The Nord Stream pipeline has thus attained its full transport capacity of 55 billion cubic meters of natural gas per year. In conjunction with the project financing, the lending banks were issued two guarantees which were limited to BASF’s pro-portional stake in the project. BASF was released from the first guarantee in 2012. It is assumed that no claims will be made against the outstanding guarantee.
In accordance with the provisions of Section 17 of the Repub-lic of Ireland Companies (Amendments) Act 1986, BASF SE gives irrevocable guarantees with respect to the liabilities, as referred to in Section 5(c)(ii) of that Act, of the subsidiary company BASF Ireland Ltd., Dublin, Republic of Ireland. As of December 31, 2013, the liabilities of BASF Ireland Ltd. totaled €22 million and €19 million as of December 31, 2012.

Notes
Notes on Balance Sheet
BASF Report 2013Consolidated Financial Statements200
26 – Risks from litigation and claims
BASF S.A., Brazil, and Shell are defendants in several individual lawsuits and one class action lawsuit regarding existing and potential health damage to former employees and contractors’ employees, their families and descendants due to their employment at a site in Paulinia, Brazil, which was significantly contaminated by the production of crop protection products. BASF acquired the site from American Cyanamid in 2000, who had in turn acquired it from Shell in 1995. The contamination stems from the period before 2000. In August 2010, BASF S.A. and Shell were jointly ordered to pay damages, including for medical treatment and personal suffering, equivalent to approximately €490 million, not including interest. The appeal against this first-instance judgment was rejected on April 4, 2011. On August 13, 2012, BASF S.A.’s review appeal against this decision was accepted by the highest labor court in Brazil. The parties reached a settlement to finally end the proceedings on April 8, 2013, BASF S.A.’s share of the damages amounts to roughly €30 million.
On May 21, 2013, the International Court of Arbitration (ICC) notified Wintershall Energía S.A., Argentina (WIAR) of the commencement of an arbitration proceedings against WIAR, Total Austral S.A. and Pan American Energy LLC by Metrogas S.A., Chile. The defendants, as sellers, concluded a natural gas supply contract with Metrogas in 1997. In the arbitration proce-dure, Metrogas claims damages as a result of insufficient gas deliveries. The value of the claim amounts to €180 million, of which WIAR would have to bear 37.5%. The defendants are of the opinion that Metrogas does not have any claim for damages. In addition, BASF SE and its affiliated companies are defendants in or parties to further judicial, arbitrational and regulatory proceedings. Based on the current state of knowledge, these proceedings will have no material influence on the economic situation of BASF.
Assets used under long-term leasesAssets used under long-term leases primarily concern buildings and IT infrastructure.
For more information on liabilities from leasing, see Note 28 on page 208
Obligations arising from long-term leases (Excluding finance leases) (million €)
2014 326
2015 276
2016 198
2017 150
2018 113
2019 and thereafter 334
Total 1,397
Purchase obligations from long-term natural gas and raw material supply contractsThe Company has entered into long-term purchase contracts for natural gas in the Natural Gas Trading business sector which are subject to continual price adjustments. These purchase obligations mainly relate to long-term supply contracts with nat-ural gas purchasers with terms between one and 19 years.
The Company purchases raw materials via long-term contracts and on spot markets. The fixed purchase obligations of long-term purchase contracts with a remaining term of at least one year as of December 31, 2013, are as follows:
Purchase obligations from natural gas and raw material supply contracts (million €)
BASF Group excluding the
disposal groupDisposal
group
2014 8,118 8,411
2015 5,245 6,535
2016 3,908 6,462
2017 2,940 6,555
2018 2,676 6,960
2019 and thereafter 7,933 98,666
Total 30,820 133,589
The purchase obligations from natural gas and raw material supply contracts of the natural gas trading disposal group are separately reported in the above table on account of their importance.

Notes
Notes on Balance Sheet
Consolidated Financial StatementsBASF Report 2013 201
27 – Supplementary information on financial instruments
27.1 – Financial risks
Market risksForeign currency risks: Changes in exchange rates could lead to negative changes in the value of financial instruments and adverse changes in future cash flows from planned transac-tions. Foreign currency risks from financial instruments result from the translation at the closing rate of financial receivables, loans, securities, cash and financial liabilities into the functional currency of the respective Group company. Foreign currency contracts in a variety of currencies are used to hedge foreign exchange risks from primary financial instruments and planned transactions. The foreign currency risk exposure corresponds to the net amount of the nominal volume of the primary and the derivative financial instruments which are exposed to currency risks. In addition, planned purchase and sales transactions of the respective following year are included, if they fall under the currency risk management system. Opposite positions in the same currency are offset against each other. The sensitivity analysis is conducted by simulating a 10% depreciation in all currencies against the respective functional currency. The effect on BASF’s income before taxes and minority interests would have been minus €286 million as of Decem-ber 31, 2013, and minus €296 million as of December 31, 2012. The effect from the items designated under hedge accounting would have increased the equity of the shareholders of BASF SE before income taxes by €93 million on December 31, 2013 (2012: €89 million). This refers to transactions in U.S. dollars and British pounds. The currency exposure amounted to €1,905 million on December 31, 2013 (December 31, 2012: €1,910 million).
Exposure and sensitivity by currency (million €)
Exposure 2013
Sensitivity 2013
Exposure 2012
Sensitivity 2012
U.S. dollar 1,231 (121) 1,602 (157)
Other 674 (72) 308 (50)
Total 1,905 (193) 1,910 (207)
Due to the use of options to hedge currency risks, the sensitiv-ity analysis is not a linear function of the assumed changes in exchange rates. Interest rate risks: Interest rate risks result from changes in prevailing market interest rates, which can cause a change in the fair value of fixed-rate instruments, and changes in the interest payments of variable-rate instruments. To hedge these risks, interest rate swaps and combined interest rate and currency derivatives are used. While these risks are relevant to the financing activities of BASF, they are not of material signifi-cance for BASF’s operating activities. The variable interest exposure, which also includes fixed rate bonds set to mature in the following year, amounted to minus €2,666 million as of December 31, 2013, compared with minus €3,340 million as of December 31, 2012. An increase in all relevant interest rates by one percentage point would have raised income before taxes and minority interests by €6 million as of December 31, 2013, and raised income before taxes and minority interests by €13 million as of December 31, 2012. The effect from the items designated under hedge accounting would have increased the equity of the shareholders of BASF SE before income taxes by €19 million on December 31, 2013. In 2012, the sensitivity of the equity of the shareholders of BASF SE to changes in interest rates was not material.
Carrying amount of nonderivative interest-bearing financial instruments (million €)
2013 2012
Fixed interest rate
Variable interest rate
Fixed interest rate
Variable interest rate
Loans 1,012 122 227 32
Securities 24 6 43 6
Financial indebtedness 12,004 2,403 10,718 2,080
Nominal and fair value of interest rate and combined interest and cross-currency swaps (million €)
2013 2012
Nominal value Fair value Nominal value Fair value
Interest rate swaps 1,800 (20) 1,000 (41)
Thereof payer swaps 1,800 (20) 1,000 (41)
Combined interest and cross-currency swaps 1,667 30 797 94
Thereof fixed rate 1,667 30 797 94

Notes
Notes on Balance Sheet
BASF Report 2013Consolidated Financial Statements202
Options for disposal of shareholdings: BASF and INEOS have agreed upon options for BASF’s withdrawal from the sharehold-ing in Styrolution. These options are classified as derivatives according to IAS 39. A significant risk variable which is decisive for the valuation of both options is the value of the company. An additional negative impact on earnings of €31 million would have resulted had the value of Styrolution been 10% higher as of December 31, 2013 (2012: €45 million). Had the company value been 10% lower as of December 31, 2013, increased earnings of €35 million would have resulted (2012: €46 million). Further-more, in accordance with the valuation model, the value of the options is influenced by the multiples of the peer group as well as their volatility. Commodity price risks: Some of BASF’s divisions are exposed to strong fluctuations in raw material prices. These result primarily from the following raw materials: naphtha, propylene, benzene, lauric oils, titanium dioxide, cyclohexane, methanol, natural gas, butadiene, LPG condensate, ammonia and precious metals. BASF takes the following measures to reduce price risks associated with the purchase of raw materials:
– BASF uses commodity derivatives to hedge the risks from the volatility of raw material prices. These are primarily options and swaps on crude oil, oil products and natural gas.
– In order to secure margins, the Oil & Gas segment uses commodity derivatives, primarily swaps on oil products, in the Natural Gas Trading business sector. Risks to margins arise in volatile markets when purchase and sales contracts are priced differently.
– The Catalysts division enters into both short-term and long-term purchase contracts with precious metal producers. It also buys precious metals on spot markets from a variety of business partners. The price risk from precious metals purchased to be sold on to third parties, or for use in the production of catalysts, is hedged using derivative instru-ments. This is mainly done using forward contracts which are settled by either entering into offsetting contracts or by delivering the precious metals.
– In the Crop Protection division, the sales prices of products are sometimes coupled to the price of certain agricultural commodities. To hedge the resulting risks, derivatives on agricultural commodities are concluded.
– Furthermore, BASF utilizes electricity derivatives on a limited scale. As of December 31, 2013, there were no deals out-standing.
In addition, BASF holds limited unhedged precious metal and oil product positions, which can also include derivatives, for trading on its own account. The value of these positions is exposed to market price volatility and is subject to constant monitoring. In connection with CO2 emissions trading, various types of CO2 certificates are purchased and sold using forward con-tracts. The goal of these transactions is to benefit from market price differences. These deals are settled by physical delivery. As of December 31, 2013 as well as of December 31, 2012, there were no deals outstanding.
By holding commodity derivatives and precious metal trading positions, BASF is exposed to price risks. The valuation of commodity derivatives and precious metal trading positions at fair value means that adverse changes in market prices could negatively affect the earnings and equity of BASF. BASF performs value-at-risk analyses for all commodity derivatives and precious metals trading positions. Using the value-at-risk analysis, we continually quantify market risk and forecast the maximum possible loss within a given confidence interval over a defined period. The value-at-risk calculation is based on a confidence interval of 95% and a holding period of one day. A confidence interval of 95% means that there is a 95% probability that the maximum loss does not exceed the value at risk within a one-day period. The value-at-risk calculation for precious metals is based on a confidence interval of 99%. BASF uses the variance-covariance approach. BASF uses value at risk as a supplement to other risk management tools and also sets volume-based, exposure and stop loss limits. Exposure to commodity derivatives (million €)
2013 2012
ExposureValue at
Risk ExposureValue at
Risk
Crude oil, oil products and natural gas 3,291 29 (212) (2)
Precious metals 42 1 33 1
Electricity – – 24 .
Agricultural commodities (133) 1 (148) .
Total 3,200 31 (303) (1)
The exposure corresponds to the net amount of all long and short positions of the respective commodity category.
For more information regarding financial risks and BASF’s risk management, see the chapter “Opportunities and risks report” in the Management’s Report from page 106 onward
Default and credit riskDefault and credit risks arise when counterparties do not fulfill their contractual obligations. BASF regularly analyzes the creditworthiness of each significant debtor and grants credit limits on the basis of this analysis. Due to the global activities and diversified customer structure of the BASF Group, there is no significant concentration of default risk. The carrying amount of all receivables, loans and interest-bearing securities plus the nominal value of contingent liabilities excluding potential warranty obligations represents the maximum default risk for BASF.
For more information on credit risks, see Note 18 from page 187 onward

Notes
Notes on Balance Sheet
Consolidated Financial StatementsBASF Report 2013 203
Maturities of contractual cash flows from financial liabilities 2013 (million €)
Bonds and other liabilities to the capital market
Liabilities to credit institutions
Liabilities resulting from
derivative finan - cial instruments
Miscellaneous liabilities Total
2014 2,894 815 171 921 4,801
2015 2,506 1,029 28 79 3,642
2016 1,285 20 2 49 1,356
2017 976 2 – 25 1,003
2018 1,934 2 – 22 1,958
2019 and thereafter 5,539 9 – 425 5,973
Total 15,134 1,877 201 1,521 18,733
Maturities of contractual cash flows from financial liabilities 2012 (million €)
Bonds and other liabilities to the capital market
Liabilities to credit institutions
Liabilities resulting from
derivative finan - cial instruments
Miscellaneous liabilities Total
2013 3,127 1,429 188 1,293 6,037
2014 1,504 58 4 75 1,641
2015 2,323 1,029 2 21 3,375
2016 988 3 – 19 1,010
2017 896 2 1 17 916
2018 and thereafter 2,830 9 – 429 3,268
Total 11,668 2,530 195 1,854 16,247
27.2 – Maturity analysis
The interest and principal payments as well as other payments for derivative financial instruments are relevant for the presen-tation of the maturities of the contractual cash flows from finan-cial liabilities. Future cash flows are not discounted here.
27.3 – Classes and categories of financial instruments
For trade accounts receivable, other receivables and miscella-neous assets, loans, cash and cash equivalents, as well as trade accounts payable and other liabilities, the carrying amount approximates the fair value. Shareholdings which are not traded on an active market and whose fair value could not be reliably determined are recognized at amortized cost and are reported under other financial assets. The carrying amount of shareholdings which are traded on an active market and therefore recognized at fair value amounted to €1 million as of both December 31, 2013 and December 31, 2012. They are included under the line item shares in other shareholdings. For more information, see Note 16 on page 186
Derivatives are included using their net cash flows, provided they have a negative fair value and therefore represent a liability. Derivatives with positive fair values are assets and are therefore not considered. Trade accounts payable are generally interest-free and due within one year. Therefore the carrying amount of trade accounts payable equals the sum of future cash flows.
The carrying amount of financial indebtedness amounted to €14,407 million on December 31, 2013 (December 31, 2012: €12,798 million). The fair value of financial indebtedness amounted to €14,918 million at the end of 2013 (end of 2012: €13,703 million). The fair value of financial indebtedness is determined on the basis of interbank interest rates. The difference between carrying amounts and fair values results primarily from changes in market interest rates.
Liquidity risksBASF promptly recognizes any risks from cash flow fluctuations as part of the liquidity planning. BASF has ready access to sufficient liquid funds from our ongoing commercial paper program and confirmed lines of credit from banks.

Notes
Notes on Balance Sheet
BASF Report 2013Consolidated Financial Statements204
Carrying amounts and fair values of financial instruments as of December 31, 2013 (million €)
Carrying amount
Total carrying amount within
scope of application of
IFRS 7
Valuation category in
accordance with IAS 392 Fair value
Thereof fair value
level 13
Thereof fair value
level 24
Thereof fair value
level 35
Shareholdings1 598 598 Afs 1 1 – –
Receivables from finance leases 29 29 n.a. 29 – – –
Accounts receivable, trade 9,376 9,376 LaR 9,376 – – –
Derivatives – no hedge accounting 327 327 aFVtPL 327 7 320 .
Derivatives – with hedge accounting 72 72 n.a. 72 – 72 –
Other receivables and miscellaneous assets6 4,078 1,710 LaR 1,710 – – –
Securities 49 49 Afs 49 49 – –
Cash and cash equivalents 1,815 1,815 LaR 1,815 1,815 – –
Total assets 16,344 13,976 13,379 1,872 392 .
Bonds 11,363 11,363 AmC 11,874 – – –
Commercial paper 1,232 1,232 AmC 1,232 – – –
Liabilities to credit institutions 1,812 1,812 AmC 1,812 – – –
Liabilities from finance leases 85 85 n.a. 85 – – –
Accounts payable, trade 4,505 4,505 AmC 4,505 – – –
Derivatives – no hedge accounting 229 229 aFVtPL 229 3 110 116
Derivatives – with hedge accounting 84 84 n.a. 84 – 84 –
Other liabilities6 2,941 1,585 AmC 1,585 – – –
Total liabilities 22,251 20,895 21,406 3 194 116
Carrying amounts and fair values of financial instruments as of December 31, 2012 (million €)
Carrying amount
Total carrying amount within
scope of application of
IFRS 7
Valuation category in
accordance with IAS 392 Fair value
Thereof fair value
level 13
Thereof fair value
level 24
Thereof fair value
level 35
Shareholdings1 578 578 Afs 1 1 – –
Receivables from finance leases 21 21 n.a. 21 – – –
Accounts receivable, trade 9,506 9,506 LaR 9,506 – – –
Derivatives – no hedge accounting 343 343 aFVtPL 343 11 331 1
Derivatives – with hedge accounting 88 88 n.a. 88 – 88 –
Other receivables and miscellaneous assets6 3,914 1,231 LaR 1,231 – – –
Securities 49 49 Afs 49 49 – –
Cash and cash equivalents 1,647 1,647 LaR 1,647 1,647 – –
Total assets 16,146 13,463 12,886 1,708 419 1
Bonds 9,106 9,106 AmC 10,011 – – –
Commercial paper 1,288 1,288 AmC 1,288 – – –
Liabilities to credit institutions 2,404 2,404 AmC 2,404 – – –
Liabilities from finance leases 72 72 n.a. 72 – – –
Accounts payable, trade 4,502 4,502 AmC 4,502 – – –
Derivatives – no hedge accounting 374 374 aFVtPL 374 5 133 236
Derivatives – with hedge accounting 51 51 n.a. 51 – 51 –
Other liabilities6 3,237 1,874 AmC 1,874 – – –
Total liabilities 21,034 19,671 20,576 5 184 236
1 The difference between carrying amount and fair value results from shareholdings measured at acquisition cost, for which the fair value could not be reliably determined (2013: €597 million; 2012: €577 million).
2 Afs: available-for-sale; LaR: loans and receivables; aFVtPL: at-fair-value-through-profit-or-loss; AmC: amortized cost; a more detailed description of the categories can be found in Note 1 from page 149 onward.
3 Determination of the fair value based on quoted, unadjusted prices on active markets.4 Determination of the fair value based on parameters for which directly or indirectly quoted prices on active markets are available.5 Determination of the fair value based on parameters for which there is no observable market data.6 Not including separately shown derivatives as well as receivables and liabilities from finance leases

Notes
Notes on Balance Sheet
Consolidated Financial StatementsBASF Report 2013 205
Derivatives whose fair value is calculated using parameters not observable on the market (level 3) only include the options agreed upon with INEOS regarding the sale of BASF’s share in Styrolution Holding GmbH. The sale and purchase options are shown on the balance sheet under other long-term receivables
The table “Offsetting financial assets and financial liabilities” shows the extent to which financial assets and financial liabili-ties are offset in the balance sheet, as well as potential effects from the offsetting of instruments subject to a legally enforce-able global netting agreement or similar agreement. In accor-dance with IAS 32, financial assets and liabilities can only be offset if a company has a legal right of set-off and intends to settle on a net basis. Deviations from the derivatives with positive and negative fair values reported in other receivables and other liabilities arose mainly from options for the disposal of shareholdings, since these are not subject to netting agreements and therefore are not included in the table above. The same applies for embed-ded derivatives as well as derivatives which are not subject to netting agreements. Derivatives which are reported in the dis-posal group natural gas trading, however, are included in the table above.
or other noncurrent liabilities. As of December 31, 2013, the market value of these options amounted to minus €116 million and to minus €235 million as of December 31, 2012. The result-ing difference of €119 million was recorded in the financial result.
Net gains and losses from financial instruments comprise the results of valuations, the amortization of discounts, the recog-nition and reversal of impairments, results from the translation of foreign currencies as well as interest, dividends and all other effects on the earnings resulting from financial instruments. The line item financial instruments at fair value through profit or loss contains only those gains and losses from instruments which are not designated as hedging instruments as defined by IAS 39. Net gains or net losses from available-for-sale financial assets contain income from write-downs/write-ups, interest, dividends and the reclassification of valuation effects from equity on the sale of the securities and shareholdings. The net losses from loans and receivables relate primarily to results from the translation of foreign currencies.
The gains and losses from the valuation of securities and share-holdings recognized in the equity of the shareholders of BASF SE are shown in the Statement of income and expense recognized in equity on page 145
Offsetting of financial assets and financial liabilities as of December 31, 2013 (million €)
Amounts which can be offset Amounts which cannot be offset
Gross amount Amount offset Net amount
Due toglobal netting
agreements
Relating to financial
collateralPotential
net amount
Derivatives with positive fair values 413 (24) 389 (63) (32) 294
Derivatives with negative fair values 257 (24) 233 (87) (15) 131
Offsetting of financial assets and financial liabilities as of December 31, 2012 (million €)
Amounts which can be offset Amounts which cannot be offset
Gross amount Amount offset Net amount
Due toglobal netting
agreements
Relating to financial
collateralPotential
net amount
Derivatives with positive fair values 444 (10) 434 (109) (50) 275
Derivatives with negative fair values 191 (10) 181 (91) (5) 85

Notes
Notes on Balance Sheet
BASF Report 2013Consolidated Financial Statements206
Net gains and losses from financial instruments (million €)
2013 2012
Loans and receivables (295) (384)
Thereof interest result 92 86
Available-for-sale financial assets (28) 1
Thereof interest result 2 2
Liabilities measured at amortized cost (115) (606)
Thereof interest result (450) (502)
Financial instruments at fair value through profit or loss 22 108
27.4 – Derivative instruments and hedge accounting
The use of derivative instrumentsThe Company is exposed to foreign-currency, interest-rate and commodity-price risks during the normal course of business. These risks are hedged through a centrally determined strategy employing derivative instruments. In addition, derivative instru-ments are used to replace primary financial instruments, such as fixed-interest securities. Hedging is only employed for under-lying positions from the operating business, cash investments, and financing as well as for planned sales and raw material purchases. The risks from the underlying transactions and the derivatives are constantly monitored. Where derivatives have a positive market value, the Company is exposed to credit risks from derivative transactions in the event of nonperformance of the other party. To minimize the default risk on derivatives with positive market values, transactions are exclusively conducted with creditworthy banks and partners and are subject to predefined credit limits.
To ensure effective risk management, risk positions are central-ized at BASF SE and certain Group companies. Contracting and execution of derivative financial instruments for hedging purposes is conducted according to internal guidelines, and is subject to strict control mechanisms. The fair values of derivative financial instruments are calcu-lated using valuation models which use input parameters observable on the market. Exceptions to this are some com-modity derivatives, whose valuation is based directly on market prices and the options agreed upon with INEOS, whose fair values are determined based on parameters not observable on the market.
Fair value of derivative instruments (million €)
2013 2012
Foreign currency forward contracts 48 99
Foreign currency options 93 69
Foreign currency derivatives 141 168
Thereof designated hedging instruments as defined by IAS 39 (hedge accounting) 38 47
Interest rate swaps (20) (41)
Thereof designated hedging instruments as defined by IAS 39 (hedge accounting) 4 –
Combined interest and cross currency swaps 30 94
Thereof designated hedging instruments as defined by IAS 39 (hedge accounting) (34) –
Interest derivatives 10 53
Options for disposal of shareholdings (116) (235)
Commodity derivatives 25 14
Thereof designated hedging instruments as defined by IAS 39 (hedge accounting) (20) (10)
Derivative financial instruments 60 .
Thereof natural gas trading disposal group (26) (6)

Notes
Notes on Balance Sheet
Consolidated Financial StatementsBASF Report 2013 207
Cash flow hedge accountingSome of the planned purchases of naphtha are hedged using swaps and options on oil and oil products. Some of these hedges were shown in the Consolidated Financial Statements of the BASF Group by means of cash flow hedge accounting, where gains and losses from hedges were initially recognized directly in equity. Gains and losses from hedges are included in cost of sales at the point in time at which the hedged item is recognized in the consolidated statement of income. Furthermore, cash flow hedge accounting was used to a minor extent for natural gas purchases. Cash flow hedge accounting is applied in the Natural Gas Trading business sector for crude oil swaps concluded in order to hedge price risks from purchase and sales contracts for natural gas. These contracts have variable prices and the price formula is coupled with the oil price. This hedging is related to the disposal group for the natural gas trading business. The majority of the planned transactions and their effect on earnings occur in the year following the balance sheet date. A small part relates to 2015. In 2013, effective changes in the fair value of hedging instruments of minus €9 million (2012: minus €4 million) was recognized in the equity of the shareholders of BASF SE. In 2013, effective changes in the fair value of hedging instruments of €9 million were derecognized from the equity of the shareholders of BASF SE and recorded as an expense in cost of sales. In 2012, there was an expense of €16 million in this regard. The ineffective part in the change in value of the hedge amounted to €2 million in 2013 and less than €1 million in 2012. This amount was reported in the income statement in cost of sales, in other operating income and in other operating expenses. BASF uses cash flow hedge accounting for derivatives used to hedge foreign currency risks from gas purchase and sales contracts. These effects are attributable to the disposal group for the natural gas trading business. The impact on earnings from the underlying transactions occurs primarily in 2014, with a smaller impact in the period between 2015 and 2016. In 2013, the effective change in values of the hedges was minus €32 mil-lion (2012: minus €46 million), which was recognized in the equity of the shareholders of BASF SE. The amounts derecognized from the equity of shareholders of BASF SE increased cost of sales by €21 million (2012: €49 million). There were no ineffec-tive parts.
BASF also uses cash flow hedge accounting for some foreign currency derivatives to hedge planned sales denominated in U.S. dollars. The impact on earnings from the underlying trans-actions will occur in 2014. In 2013, effective changes in the fair value of the hedging instruments of minus €18 million (2012: €25 million) were recognized in the equity of the shareholders of BASF SE. A total of €43 million (2012: €4 million) was derec-ognized from the equity of shareholders of BASF SE and was booked in expenses from foreign currency transactions. The hedge was entirely effective. The interest rate risk of the Floating Rate Notes issued by BASF SE in 2013 (€200 million note 2013/2016, €300 million note 2013/2018, €300 million note 2013/2020) was hedged using interest rate swaps. The bonds and the interest rate swaps were designated in a hedging relationship. In 2013, the effective change in the fair value of the hedging instruments was minus €10 million and was recognized in the equity of the sharehold-ers of BASF SE. There were no ineffective parts. Furthermore, BASF SE’s fixed-rate U.S. private placement of $1.25 billion, issued in 2013, was converted into euros using currency swaps. This hedge was designated as a cash flow hedge. It was entirely effective. In 2013, the change in values recognized in the equity of the shareholders of BASF SE amounted to minus €7 million. In 2013, €14 million was derec-ognized from other comprehensive income and recorded as interest income. In 2004 and 2005, fair value changes from forward inter-est-rate swaps entered into hedge interest-rate risks from the refinancing of an expiring bond were recognized directly in equity using cash flow hedge accounting. The hedge was closed in 2005 as a new bond was issued to refinance the expiring bond. The new bond was due in 2012. Over the term of the bond, the changes in fair value of interest rate swaps recognized in the equity were reclassified proportionally from equity of the share-holders of BASF SE to the consolidated statement of income. In 2012, €3 million was derecognized from other comprehen-sive income and recorded as interest expense.
Fair value hedge accountingIn the previous year, BASF converted the 3.75% fixed-interest rate euro bond of BASF SE (nominal volume €1,350 million) into a variable-rate bond using interest rate swaps in order to hedge interest rate risks. The bond and the derivatives were designated as a fair value hedge. The bond and the hedge both matured in October 2012. in 2013, no hedging relationships were desig-nated as fair value hedges.

Notes
Notes on Balance Sheet
BASF Report 2013Consolidated Financial Statements208
Liabilities from finance leases (million €)
2013 2012
Minimum lease payments Interest portion Leasing liability
Minimum lease payments Interest portion Leasing liability
Following year 1 27 7 20 24 5 19
Following year 2 21 6 15 22 5 17
Following year 3 19 4 15 16 4 12
Following year 4 13 3 10 13 2 11
Following year 5 10 3 7 8 2 6
More than 5 years 45 17 28 37 16 21
Total 135 40 95 120 34 86
In 2013 and 2012, no conditional lease payments for finance leases were recognized in expenses. In 2013 and 2012, leasing liabilities were not offset by any significant future minimum lease payments from subleases. In addition, BASF is a lessee under operating lease con-tracts. The lease commitments totaling €1,397 million in 2013 (2012: €1,239 million) are due in the following years:
Commitments from operating lease contracts (million €)
Nominal value of the future minimum lease payments
December 31, 2013
December 31, 2012
Less than 1 year 326 315
1–5 years 737 645
More than 5 years 334 279
Total 1,397 1,239
28 – Leasing
Leased assetsProperty, plant and equipment include those assets which are considered to be economically owned through a finance lease. They primarily concern the following items:
Leased assets (million €)
2013 2012
Acquisition cost Net book value Acquisition cost Net book value
Land, land rights and buildings 42 25 44 25
Machinery and technical equipment 103 38 102 39
Miscellaneous equipment and fixtures 39 12 37 12
Total 184 75 183 76
Hedge of a net investment in a foreign operationIn the previous year, the currency translation risk from an invest-ment in a foreign operation was hedged using foreign currency forward contracts. Due to a capital reduction during the year
2012, the hedging relationship had been ended. Hedging resulted in a loss of €2 million, which was recorded in expenses from foreign currency transactions. In 2013 there was no hedge of a net investment in a foreign operation.
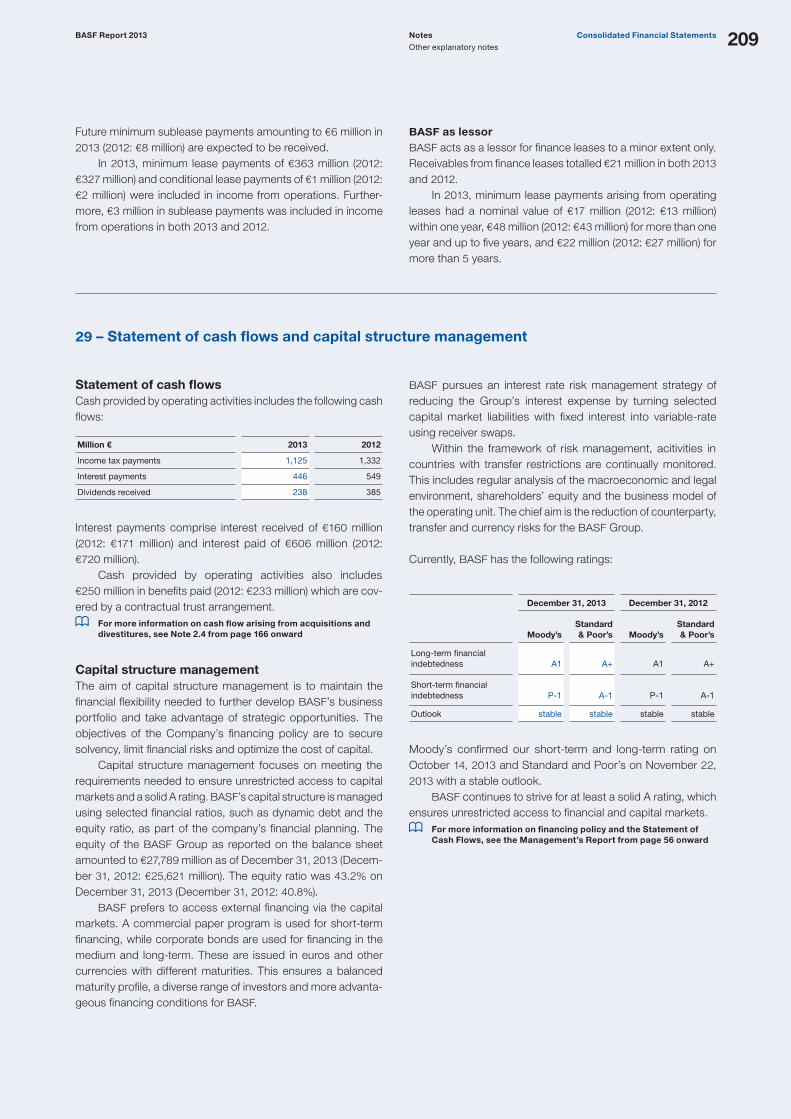
Notes
Other explanatory notes
Consolidated Financial StatementsBASF Report 2013 209
Statement of cash flowsCash provided by operating activities includes the following cash flows:
Million € 2013 2012
Income tax payments 1,125 1,332
Interest payments 446 549
Dividends received 238 385
Interest payments comprise interest received of €160 million (2012: €171 million) and interest paid of €606 million (2012: €720 million). Cash provided by operating activities also includes €250 million in benefits paid (2012: €233 million) which are cov-ered by a contractual trust arrangement.
For more information on cash flow arising from acquisitions and divestitures, see Note 2.4 from page 166 onward
Capital structure managementThe aim of capital structure management is to maintain the financial flexibility needed to further develop BASF’s business portfolio and take advantage of strategic opportunities. The objectives of the Company’s financing policy are to secure solvency, limit financial risks and optimize the cost of capital. Capital structure management focuses on meeting the requirements needed to ensure unrestricted access to capital markets and a solid A rating. BASF’s capital structure is managed using selected financial ratios, such as dynamic debt and the equity ratio, as part of the company’s financial planning. The equity of the BASF Group as reported on the balance sheet amounted to €27,789 million as of December 31, 2013 (Decem-ber 31, 2012: €25,621 million). The equity ratio was 43.2% on December 31, 2013 (December 31, 2012: 40.8%). BASF prefers to access external financing via the capital markets. A commercial paper program is used for short-term financing, while corporate bonds are used for financing in the medium and long-term. These are issued in euros and other currencies with different maturities. This ensures a balanced maturity profile, a diverse range of investors and more advanta-geous financing conditions for BASF.
BASF pursues an interest rate risk management strategy of reducing the Group’s interest expense by turning selected capital market liabilities with fixed interest into variable-rate using receiver swaps. Within the framework of risk management, acitivities in countries with transfer restrictions are continually monitored. This includes regular analysis of the macroeconomic and legal environment, shareholders’ equity and the business model of the operating unit. The chief aim is the reduction of counterparty, transfer and currency risks for the BASF Group.
Currently, BASF has the following ratings:
December 31, 2013 December 31, 2012
Moody’sStandard & Poor’s Moody’s
Standard & Poor’s
Long-term financial indebtedness A1 A+
A1
A+
Short-term financial indebtedness P-1 A-1
P-1
A-1
Outlook stable stable stable stable
Moody’s confirmed our short-term and long-term rating on October 14, 2013 and Standard and Poor’s on November 22, 2013 with a stable outlook. BASF continues to strive for at least a solid A rating, which ensures unrestricted access to financial and capital markets.
For more information on financing policy and the Statement of Cash Flows, see the Management’s Report from page 56 onward
29 – Statement of cash flows and capital structure management
Future minimum sublease payments amounting to €6 million in 2013 (2012: €8 million) are expected to be received. In 2013, minimum lease payments of €363 million (2012: €327 million) and conditional lease payments of €1 million (2012: €2 million) were included in income from operations. Further-more, €3 million in sublease payments was included in income from operations in both 2013 and 2012.
BASF as lessorBASF acts as a lessor for finance leases to a minor extent only. Receivables from finance leases totalled €21 million in both 2013 and 2012. In 2013, minimum lease payments arising from operating leases had a nominal value of €17 million (2012: €13 million) within one year, €48 million (2012: €43 million) for more than one year and up to five years, and €22 million (2012: €27 million) for more than 5 years.
Other explanatory notes

Notes
Other explanatory notes
BASF Report 2013Consolidated Financial Statements210
30 – Share-price-based compensation program and BASF incentive share program
Share-price-based compensation programIn 2013, BASF continued its share-price-based compensation program known as the long-term incentive (LTI) program for senior executives of the BASF Group. This program has been in place since 1999. Approximately 1,200 senior executives, including the Board of Executive Directors, are currently entitled to participate in this program. This program provides for the granting of virtual options, which are settled in cash when exercised. Participation in the LTI program is voluntary. In order to take part in the program, a participant must make a personal invest-ment: A participant must hold BASF shares amounting to 10% to 30% of his or her individual variable compensation for a two-year period from the granting of the option (holding period). The number of shares to be held is determined by the amount of variable compensation and the weighted-average market price for BASF shares on the first business day after the Annual Share-holders’ Meeting, which was €70.22 on April 29, 2013. The participant receives four option rights per invested share. Each option consists of two parts, right A and right B, which may be exercised if defined thresholds have been met: The threshold of right A is met if the price of the BASF share has increased by more than 30% in comparison with the base price (absolute threshold). The value of right A will be the difference between the market price of BASF shares on the exercise date and the base price; it is limited to 100% of the base price. Right B may be exercised if the cumulative percentage performance of BASF shares exceeds (relative threshold) the percentage per-formance of the MSCI World Chemicals IndexSM (MSCI Chemi-cals). The value of right B will be the base price of the option multiplied by twice the percentage outperformance of BASF shares compared with the MSCI Chemicals Index on the exer-cise date. It is limited to the closing price on the date of exercise minus the computed nominal value of BASF shares. Beginning with the 2013 (LTI) program, right B is only valuable if the price of BASF shares at least corresponds with the base price. The options were granted on July 1, 2013, and may be exercised following a two-year vesting period, between July 1, 2015 and June 30, 2021. During the exercise period, there are certain times (closed periods) during which the options may not be exercised. Each option can only be exercised in full. This means that one of the performance targets must be surpassed. If the other performance target is not surpassed and the option is exercised, the other option right lapses. A participant’s maxi-mum gain from exercising an option is limited to five times the original individual investment starting with the 2013 LTI program. The maximum gain from exercising an option is limited to ten times the original individual investment for programs from pre-vious years. Option rights are nontransferable and are forfeited if the option holders no longer work for BASF or have sold part of their individual investment before the expiry of the two-year vesting period. They remain valid in the case of retirement. For the members of the Board of Executive Directors, the long-term orientation of the program is significantly strengthened com-pared to the conditions applying to the other participants. The members of the Board of Executive Directors are required to
participate in the LTI program with at least 10% of their gross bonus. In view of this binding personal investment (in the form of BASF shares), an extended holding period of four years applies. Under the LTI program, members of the Board of Executive Directors may not exercise their options until at least four years after they have been granted (vesting period). Excepting the cases named above, the 2006 to 2012 pro-grams were structured in a similar way to the LTI program 2013. The models used in the valuation of the option plans are based on the arbitrage-free valuation model according to Black-Scholes. The fair values of the options are determined using the binomial model.
Fair value of options and parameters used as of December 31, 20131
LTI program of the year
2013 2012
Fair value € 34.91 43.82
Dividend yield % 3.36 3.36
Risk-free interest rate % 1.59 1.34
Volatility BASF share % 28.57 30.13
Volatility MSCI Chemicals % 19.50 20.69
Correlation BASF share price: MSCI Chemicals % 79.62 80.07
1 It is assumed that the options will be exercised based upon the potential gains.
As of December 31, 2013, the fair values and the valuation parameters relate to the LTI programs 2013 and 2012. For the programs from preceding years, corresponding fair values were computed and valuation parameters were used. Volatility was determined on the basis of the monthly clos-ing prices over a historical period corresponding to the remain-ing term of the options. The number of options granted amounted to 2,081,900 in 2013 (2012: 2,651,612). As a result of a resolution by the Board of Executive Directors in 2002 to settle options in cash, options outstanding from the programs 2006 to 2013 were valued with the fair value as of the balance sheet date December 31, 2013. A proportion-ate provision is recorded for programs in the vesting period. The LTI provision decreased from €411 million as of December 31, 2012 to €367 million as of December 31, 2013, due to lower fair values of the options on average. The utilization of provisions amounted to €148 million in 2013 (2012: €157 million). Person-nel expenses amounted to €104 million in 2013 (2012: €299 mil-lion). The total intrinsic value of exercisable options amounted to €160 million as of December 31, 2013, and €269 million as of December 31, 2012.
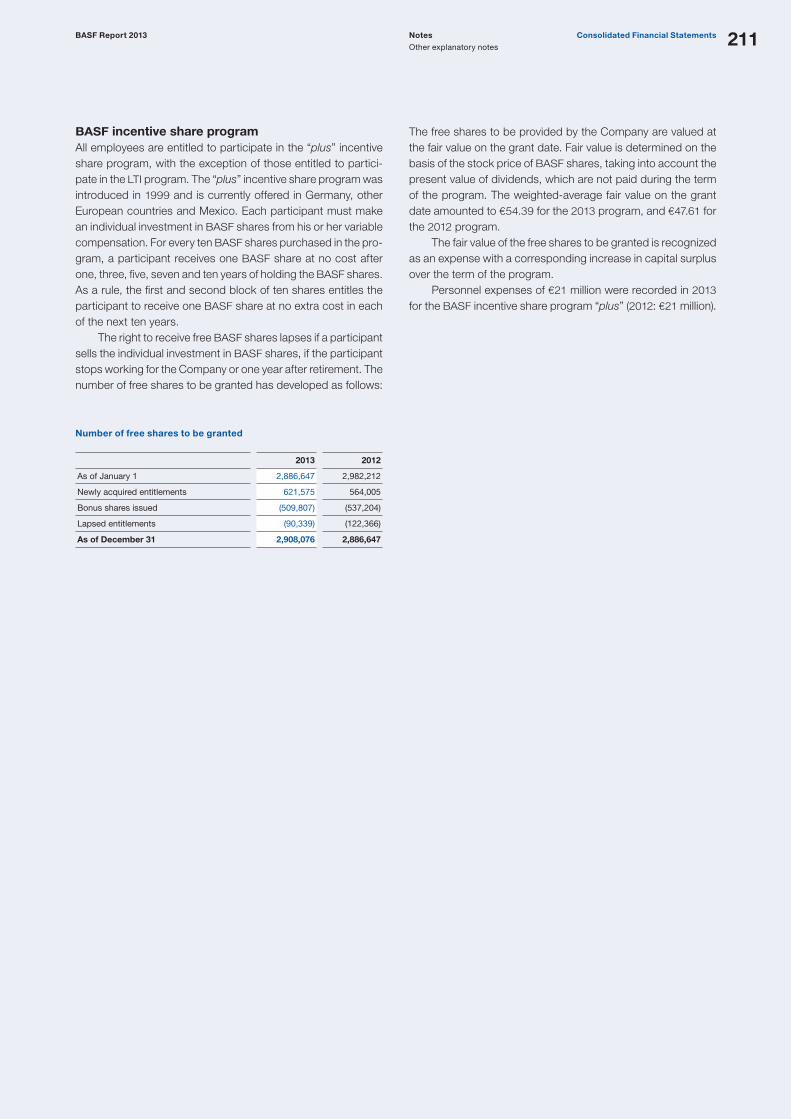
Notes
Other explanatory notes
Consolidated Financial StatementsBASF Report 2013 211
The free shares to be provided by the Company are valued at the fair value on the grant date. Fair value is determined on the basis of the stock price of BASF shares, taking into account the present value of dividends, which are not paid during the term of the program. The weighted-average fair value on the grant date amounted to €54.39 for the 2013 program, and €47.61 for the 2012 program. The fair value of the free shares to be granted is recognized as an expense with a corresponding increase in capital surplus over the term of the program. Personnel expenses of €21 million were recorded in 2013 for the BASF incentive share program “plus” (2012: €21 million).
BASF incentive share programAll employees are entitled to participate in the “plus” incentive share program, with the exception of those entitled to partici-pate in the LTI program. The “plus” incentive share program was introduced in 1999 and is currently offered in Germany, other European countries and Mexico. Each participant must make an individual investment in BASF shares from his or her variable compensation. For every ten BASF shares purchased in the pro-gram, a participant receives one BASF share at no cost after one, three, five, seven and ten years of holding the BASF shares. As a rule, the first and second block of ten shares entitles the participant to receive one BASF share at no extra cost in each of the next ten years. The right to receive free BASF shares lapses if a participant sells the individual investment in BASF shares, if the participant stops working for the Company or one year after retirement. The number of free shares to be granted has developed as follows:
Number of free shares to be granted
2013 2012
As of January 1 2,886,647 2,982,212
Newly acquired entitlements 621,575 564,005
Bonus shares issued (509,807) (537,204)
Lapsed entitlements (90,339) (122,366)
As of December 31 2,908,076 2,886,647

Notes
Other explanatory notes
BASF Report 2013Consolidated Financial Statements212
31 – Compensation for the Board of Executive Directors and Supervisory Board of BASF SE
Million € 2013 2012
Performance-related and not performance-related cash compensation for the Board of Executive Directors 21.0 23.1
Market value of options granted to the Board of Executive Directors in the fiscal year as of the grant date 5.5 4.0
Total compensation for the Board of Executive Directors 26.5 27.1
Service costs for members of the Board of Executive Directors 4.7 4.1
Compensation for the Supervisory Board 3.0 3.0
Total compensation for former members of the Board of Executive Directors and their surviving dependents 10.5 23.7
Pension provisions for former members of the Board of Executive Directors and their surviving dependents 131.8 142.3
Guarantees assumed for members of the Board of Executive Directors and the Supervisory Board – –
Performance-related compensation for the Board of Executive Directors is based on the return on assets, as well as the performance of the entire Board. Return on assets corresponds to earnings before taxes plus borrowing costs as a percentage of average assets. The members of the Board of Executive Directors were granted 230,948 options under the long-term incentive (LTI) pro-gram in 2013.
The options of active and former members of the Board resulted in personnel expenses of €10.3 million in 2013. In 2012, the options resulted in expenses of €37.5 million.
For more information on the compensation of members of the Board of Executive Directors, see the Compensation Report from page 131 onward
For more information on the members of the Supervisory Board and Board of Executive Directors, including their memberships on other boards, see page 129 onward

Notes
Other explanatory notes
Consolidated Financial StatementsBASF Report 2013 213
2013 2012
Million € SalesAccounts
receivable, tradeAccounts
payable, trade SalesAccounts
receivable, tradeAccounts
payable, trade
Nonconsolidated subsidiaries 507 154 70 628 178 64
Joint ventures 609 117 293 707 109 172
Joint operations 413 35 57 412 57 55
Associated companies and other shareholdings 3,217 397 101 3,088 268 34
Sales from joint ventures related primarily to sales with Wintershall Erdgas Handelshaus GmbH & Co. KG, Berlin, Germany; Polioles S.A. de C.V., Lerma, Mexiko; Heesung Catalysts Corporation, Seoul, South Korea; and BASF-YPC Company Ltd., Nanjing, China. The nonconsolidated share of the sales with these companies amounted to €461 million in 2013 and €517 million in 2012. Sales with associated companies and other shareholdings resulted primarily from the business with VNG – Verbundnetz Gas Aktiengesellschaft, Leipzig, Germany; Erdgas Münster GmbH, Münster, Germany; and the Styrolution Group. The non-consolidated portion of the sales with these companies amounted to €2,940 million in 2013 and €2,935 million in 2012.
As in the previous year, there were no significant valuation allowances in 2013 for trade accounts receivable from related parties. There were no reportable related party transactions with members of the Board of Executive Directors or the Super visory Board and their related parties in 2013.
For more information on subsidiaries, joint ventures, joint operations and associated companies, see the List of Shares Held of the BASF Group 2013 on page 171
For more information on the Board of Executive Directors and the Supervisory Board, see Management and Supervisory Boards and Compensation Report from page 129 onward
32 – Related-party transactions
IAS 24 requires the disclosure of transactions with related par-ties. A related party is a person or entity over whom/which the BASF Group can exercise influence or significant influence, or an entity that is controlled by the BASF Group. In particular, this comprises nonconsolidated subsidiaries, joint ventures, joint operations, associated companies and other shareholdings.
The following table shows the volume of business with related parties that are included at amortized cost, accounted for using the equity method or are proportionally consolidated.

Notes
Other explanatory notes
BASF Report 2013Consolidated Financial Statements214
33 – Services provided by the external auditor
BASF Group companies have used the following services from KPMG:
Million € 2013 2012
Annual audit 20.5 21.4
Thereof domestic 7.0 7.1
Audit-related services 0.5 0.6
Thereof domestic 0.2 0.2
Tax consultation services 0.1 .
Thereof domestic 0.1 –
Other services 0.3 0.1
Thereof domestic 0.3 .
Total 21.4 22.1
The line item annual audit related to expenses for the audit of the Consolidated Financial Statements of the BASF Group as well as the legally required financial statements of BASF SE and
its consolidated subsidiary companies and jointly controlled entities.
Declaration pursuant to Section 161 AktG (Stock Corporation Act)The annual Declaration of Conformity with the German Corpo-rate Governance Code according to Section 161 of the German
34 – Declaration of Conformity with the German Corporate Governance Code
Stock Corporation Act was signed by the Board of Executive Directors and the Supervisory Board of BASF SE on Decem-ber 12, 2013, and is published online. basf.com/governance_e

5 Oil
& G
as
Supplementary Information on the Oil & Gas Segment
Supplementary information on the Oil & Gas segment 216
Supplementary Information on the Oil & Gas Segment

BASF Report 2013Supplementary Information on the Oil & Gas Segment216
Supplementary Information on the Oil & Gas Segment(Unaudited)
The following tables provide supplemental information on the Exploration & Production business sector of the Oil & Gas segment. In the absence of detailed disclosure rules in this area under IFRS, the Group has elected to voluntarily disclose the following information, which would have been required under SFAS No. 69 (Disclosure of Oil and Gas Producing Activities) and by the Securities and Exchange Commission. In order to present economically meaningful reporting of the cooperation with Gazprom in the Yuzhno Russkoye and Achimgaz projects, several modifications have been made to SFAS 69. BASF has an interest of 35% in the economic rewards of the Yuzhno Russkoye field through OAO Severneftegazprom (SNG), the company which holds the production license. SNG is accounted for using the equity method. A project company, which is fully consolidated, was established for these operations. For the Achimgaz project, in which BASF has an interest of 50%, full field development was begun after the successful completion of the pilot phase in 2011. In the following overviews, BASF’s stake in both projects is included under “Russia.” In addition, the values for SNG, which is accounted for using the equity method, are presented separately. All fully consolidated subsidiaries are included with 100%. As a result of the application of IFRS 10, the Wintershall subsidiary, which was fully consolidated in the previous year, and holds the production and exploration rights to the Libyan onshore concessions 96 and 97, on which BASF holds a 51% share, is now accounted for using the equity method as asso-ciated company according to IAS 28. The stake which was part of the asset swap with Gazprom in 2007 is no longer taken into account.
For more on IFRS 10 and 11, see the Notes from page 149 onward
The following table provides an overview of the most important differences between the information given for the Exploration & Production business sector in the Consolidated Financial State-ment of the BASF Group and the supplemental information for the Oil & Gas segment.
BASF reporting
Supplementary information on Oil & Gas
Other activities in Exploration & Production (e.g., trading business and joint venture services)
included
not included
Activities accounted for using the equity method (Severneftegazprom, Wolgodeminoil and Wintershall AG)
earnings from the equity method included in EBIT
included on a proportional basis
Corporate overhead costs and financing costs
included not included
The regions include the following countries with operating activities:
RegionExploration & Production Exploration
Russia Russia
Rest of Europe United Kingdom, the Netherlands, Norway
Denmark
North Africa/ Middle East
Libya Abu Dhabi, Qatar
South America Argentina Chile
Statistical information on the concession areas or the number of wells is not given due to its limited informative value.
Oil and gas reservesProven oil and gas reserves are the estimated volumes of crude oil, natural gas and condensate that are shown by geological and engineering data with reasonable certainty to be recover-able in future years from known reserves under existing economic and operating conditions. Accordingly, reserve estimates could be materially different from the quantities of oil and natural gas that are ultimately recovered. To reduce uncer-tainties, Wintershall uses independent, internationally recog-nized reserve auditors to perform recurring reserves audits of its major oil and gas fields. The tables on the following pages show the estimated net quantities as of December 31, 2012 and 2013, of the Company’s proven oil and gas reserves and proven developed oil and gas reserves as well as changes in estimated proven reserves as a result of production and other factors. The currency exchange factor for natural gas in barrel of oil equivalent has been adjusted in 2013 in order to better reflect the recomposition of natural gas qualities in the portfolio. It is now 5.6 billion standard cubic feet (BSCF) per million barrels of oil equivalent (MMBOE), instead of 6.0 BSCF per MMBOE.

Supplementary Information on the Oil & Gas SegmentBASF Report 2013 217
Oil 2013
GermanyRest of Europe Russia
North Africa, Middle East
South America Total
Proven developed and undeveloped oil reserves as of January 1, millions of barrels (MMbbl) 57 18 52 124 20 271
Revisions and other changes 7 1 44 4 (7) 49
Extensions and discoveries – – 1 – – 1
Purchase/sale of reserves – 28 – – – 28
Production 7 4 8 11 2 32
Proven reserves as of December 31 57 43 89 117 11 317
Thereof equity-accounted companies – – 9 103 – 112
Proven reserves excluding equity-accounted companies 57 43 80 14 11 205
Proven developed reserves as of December 31 45 29 56 96 8 234
Gas 2013
GermanyRest of Europe Russia
North Africa, Middle East
South America Total
Proven developed and undeveloped gas reserves as of January 1, billion standard cubic feet (BSCF)1 205 129 3,794 86 1,102 5,316
Revisions and other changes 27 43 1,328 (13) 41 1,426
Extensions and discoveries – – – – – –
Purchase/sale of reserves – 211 – – – 211
Production 24 49 349 5 134 561
Proven reserves as of December 31 208 334 4,773 68 1,009 6,392
Thereof equity-accounted companies – – 3,637 68 – 3,705
Proven reserves excluding equity-accounted companies 208 334 1,136 – 1,009 2,687
Proven developed reserves as of December 31 168 302 4,264 56 597 5,387
1 The conversion factor for natural gas is 5.6 BSCF per MMBOE (million barrels of oil equivalent).

BASF Report 2013Supplementary Information on the Oil & Gas Segment218
Oil 2012
GermanyRest of Europe Russia
North Africa, Middle East1
South America Total
Proven developed and undeveloped oil reserves as of January 1, millions of barrels (MMbbl) 61 10 40 140 24 275
Revisions and other changes 3 – 15 3 (1) 20
Extensions and discoveries – 9 1 – – 10
Purchase/sale of reserves – – – – – –
Production 7 1 4 19 3 34
Proven reserves as of December 31 57 18 52 124 20 271
Thereof equity-accounted companies – – 12 109 – 121
Proven reserves excluding equity-accounted companies 57 18 40 15 20 150
Proven developed reserves as of December 31 47 3 31 113 13 207
Gas 2012
GermanyRest of Europe Russia
North Africa, Middle East1
South America Total
Proven developed and undeveloped gas reserves as of January 1, billion standard cubic feet (BSCF)2 225 110 3,761 97 1,097 5,290
Revisions and other changes 8 41 350 (1) 147 545
Extensions and discoveries – 23 13 – – 36
Purchase/sale of reserves – – – – – –
Production 28 45 330 10 142 555
Proven reserves as of December 31 205 129 3,794 86 1,102 5,316
Thereof equity-accounted companies – – 3,215 86 – 3,301
Proven reserves excluding equity-accounted companies 205 129 579 – 1,102 2,015
Proven developed reserves as of December 31 177 87 3,492 68 737 4,561
1 Restated as a result of amended IFRS2 The conversion factor for natural gas is 5.6 BSCF per MMBOE (million barrels of oil equivalent); previously, this was 6 BSCF per MMBOE.

Supplementary Information on the Oil & Gas SegmentBASF Report 2013 219
2013 (million €)
GermanyRest of Europe Russia
North Africa, Middle East
South America Total
Sales crude oil (including condensate and LPG) 505 326 172 865 132 2,000
Sales natural gas 142 398 890 1 238 1,669
Local duties (royalties, export, etc.) 115 2 165 30 81 393
Total sales (net of duties) 532 722 897 836 289 3,276
Production costs 116 195 77 112 100 600
Exploration expenses 8 175 11 41 17 252
Depreciation, amortization and impairment 69 150 36 77 49 381
Other 8 (77) 33 (6) (103) (145)
Income before taxes 331 279 740 612 226 2,188
Income taxes 96 79 153 599 60 987
Operating income after taxes 235 200 587 13 166 1,201
Equity-accounted income – – 82 37 – 119
Income after taxes and equity-accounted income 235 200 505 (24) 166 1,082
2012 (million €)
GermanyRest of Europe Russia
North Africa, Middle East1
South America Total
Sales crude oil (including condensate and LPG) 519 130 127 1,565 150 2,491
Sales natural gas 157 316 898 4 228 1,603
Local duties (royalties, export, etc.) 113 2 155 60 88 418
Total sales (net of duties) 563 444 870 1,509 290 3,676
Production costs 115 146 72 124 94 551
Exploration expenses 10 192 14 43 15 274
Depreciation, amortization and impairment 70 350 32 35 46 533
Other 9 52 15 2 32 110
Income before taxes 359 (296) 737 1,305 103 2,208
Income taxes 104 (262) 143 1,211 29 1,225
Operating income after taxes 255 (34) 594 94 74 983
Equity-accounted income – – 109 89 – 198
Income after taxes and equity-accounted income 255 (34) 485 5 74 785
1 Restated as a result of amended IFRS
Operating income from oil and gas-producing activities Operating income represents only those revenues and expenses directly associated with Wintershall’s oil and gas production. These amounts do not include financing costs (such as interest expenses) or corporate overhead costs and do not equal the
contributions of the Oil & Gas segment. The differences in sales compared with the segment reporting results from sales for mer-chandise and services. Estimated income taxes were calculated using local applicable income tax rates.

BASF Report 2013Supplementary Information on the Oil & Gas Segment220
Costs incurred in oil and gas property acquisition, exploration and development activitiesCosts incurred represent amounts capitalized or charged against income as incurred in connection with oil and gas property acquisition, exploration and development activities.
2013 (million €)
GermanyRest of Europe Russia
North Africa, Middle East
South America Total
Acquisitions – 853 – – – 853
Exploration and technology 10 262 19 60 34 385
Development 68 534 152 37 69 860
Total net costs 78 1,649 171 97 103 2,098
2012 (million €)
GermanyRest of Europe Russia
North Africa, Middle East1
South America Total
Acquisitions – – – – – –
Exploration and technology 25 311 20 98 24 478
Development 78 233 117 19 38 485
Total net costs 103 544 137 117 62 963
1 Restated as a result of amended IFRS

Supplementary Information on the Oil & Gas SegmentBASF Report 2013 221
Capitalized costs relating to oil and gas-producing activitiesCapitalized costs represent total expenditures on proven and unproven oil and gas properties with related accumulated depreciation and amortization.
2013 (million €)
GermanyRest of Europe Russia
North Africa, Middle East
South America Total
Proven properties 786 2,604 2,415 825 1,024 7,654
Unproven properties 72 1,167 17 176 62 1,494
Other equipment 729 958 1 25 – 1,713
Total gross assets 1,587 4,729 2,433 1,026 1,086 10,861
Accumulated depreciation 1,100 2,049 461 605 734 4,949
Total net assets 487 2,680 1,972 421 352 5,912
2012 (million €)
GermanyRest of Europe Russia
North Africa, Middle East1
South America Total
Proven properties 732 1,178 2,447 793 1,015 6,165
Unproven properties 58 903 17 157 32 1,167
Other equipment 705 875 4 23 – 1,607
Total gross assets 1,495 2,956 2,468 973 1,047 8,939
Accumulated depreciation 1,048 1,730 408 537 734 4,457
Total net assets 447 1,226 2,060 436 313 4,482
1 Restated as a result of amended IFRS

BASF Report 2013Supplementary Information on the Oil & Gas Segment222
Capitalized exploration well-drilling costs: Suspended well costsExploratory drilling costs are capitalized until the drilling of the well is complete. If hydrocarbons are found, and, subject to further appraisal activity which may include the drilling of further wells, are likely to be capable of commercial development, the costs continue to be carried as an asset. All such carried costs are subject to technical, commercial and management review at least once a year to confirm the continued intent to develop or otherwise extract value from the discovery. When this is no longer the case, the costs are written off. If proven reserves of oil or natural gas are determined and development is sanctioned, the relevant expenditure is transferred to machinery and tech-nical equipment. Unsuccessful exploration wells are impaired in exploration expenses. The following table indicates the changes to the capitalized exploration well-drilling costs.
Capitalized exploration well-drilling costs1 (million €)
2013 2012
As of January 1 471 299
Additions pending determination of proven reserves 223 277
Capitalized exploratory well costs charged to expense (98) (75)
Reclassifications to wells, facilities and equipment (64) (30)
As of December 31 532 471
1 Only fully consolidated companies; prior-year figures restated as a result of amended IFRS
The following table provides an aging of capitalized well costs, the amounts capitalized and, on the last line, the number of suspended exploration wells.
Capitalized exploration well-drilling costs1 (million €)
2013 2012
Wells for which drilling is not complete 120 165
Wells capitalized less than one year 144 78
Wells capitalized more than one year 268 228
Total 532 471
Number of suspended wells 39 39
1 Only fully consolidated companies; prior-year figures restated as a result of amended IFRS
Standardized measure of discounted future net cash flows relating to proven oil and gas reserves (SMOG) The following information has been prepared in accordance with SFAS 69 and the regulations of the Securities and Exchange Commission, which require the standardized measure of discounted future cash flows based on sales prices, costs and statutory interest rates. The proven reserves are valued at the average price calculated from the prices on the first day of the month. The values calculated in this way are subject to a 10% annual discount rate. The projection should not be viewed as a realistic estimate of future cash flows. It does not take into account planned trans-actions such as the asset swap with Gazprom agreed upon for 2014 and the sale of selected shares in the British continental shelf in the North Sea to the Hungarian MOL Group. Further-more, the total value of future net cash flows should not be interpreted as representing the current enterprise value. Material revisions of estimates of proven reserves may occur in the future, development and production of the reserves may not occur in the period assumed, actual prices realized are expected to vary significantly from those used and actual costs may also vary. The company’s investment and operating decisions are not based on the information presented below, but on a wide range of reserve estimates, and on different price and cost assump-tions from those reflected in this information. Beyond the above considerations, the “standardized mea-sure of future net cash flows” is also not directly comparable with asset balances appearing elsewhere in the Consolidated Financial Statements because any such comparison would require a reconciling adjustment.

Supplementary Information on the Oil & Gas SegmentBASF Report 2013 223
Standardized measure of discounted future cash flows 2013 (million €)
GermanyRest of Europe Russia
North Africa, Middle East
South America Total
Future revenues 4,537 6,059 11,021 9,246 2,879 33,742
Future production/development costs 2,231 3,114 2,045 2,499 1,179 11,068
Future income taxes 518 2,002 1,522 5,184 489 9,715
Future net cash flows 1,788 943 7,454 1,563 1,211 12,959
Discounted to present value at a 10% annual rate 713 185 3,063 477 446 4,884
Standardized measures of discounted future cash flows 1,075 758 4,391 1,086 765 8,075
Thereof equity-accounted companies – – 726 835 – 1,561
Total excluding equity-accounted companies 1,075 758 3,665 251 765 6,514
Standardized measure of discounted future cash flows 2012 (million €)
GermanyRest of Europe Russia
North Africa, Middle East1
South America Total
Future revenues 4,667 2,386 9,661 10,333 2,125 29,172
Future production/development costs 1,997 2,134 1,862 1,936 1,094 9,023
Future income taxes 625 131 1,295 6,891 245 9,187
Future net cash flows 2,045 121 6,504 1,506 786 10,962
Discounted to present value at a 10% annual rate 742 96 2,472 508 332 4,150
Standardized measures of discounted future cash flows 1,303 25 4,032 998 454 6,812
Thereof equity-accounted companies – – 933 733 – 1,666
Total excluding equity-accounted companies 1,303 25 3,099 265 454 5,146
1 Restated as a result of amended IFRS

BASF Report 2013Supplementary Information on the Oil & Gas Segment224
Summary of changes in standardized measure of discounted future net cash flows 2013 (million €)
GermanyRest of Europe Russia
North Africa, Middle East
South America Total
Balance as of January 1 1,303 25 4,032 998 454 6,812
Sales and transfers of oil and gas produced, net of production costs (416) (221) (826) (734) (188) (2,385)
Net changes in price and in development and production costs (130) (217) (207) (776) 522 (808)
Extension, discoveries and improved recovery, less related costs – – 9 – – 9
Revisions of previous quantity estimates 133 81 1,029 486 77 1,806
Development costs incurred during the period 68 343 152 27 67 657
Changes in estimated future development costs (128) 83 (170) (196) (67) (478)
Purchase/sale reserves – 689 – – – 689
Net change in income taxes 92 (55) (71) 783 (157) 592
Accretion of discounts 155 26 443 498 57 1,179
Other (2) 4 – – – 2
Standardized measures of discounted future cash flows (SMOG) 1,075 758 4,391 1,086 765 8,075
Thereof equity-accounted companies – – 726 835 – 1,561
Total excluding equity-accounted companies 1,075 758 3,665 251 765 6,514
Summary of changes in standardized measure of discounted future net cash flows 2012 (million €)
GermanyRest of Europe Russia
North Africa, Middle East1
South America Total
Balance as of January 1 1,327 155 3,444 1,035 548 6,509
Sales and transfers of oil and gas produced, net of production costs (448) (305) (865) (1,394) (196) (3,208)
Net changes in price and in development and production costs 140 120 971 563 (50) 1,744
Extension, discoveries and improved recovery, less related costs – (133) 37 – – (96)
Revisions of previous quantity estimates 89 131 332 (28) 236 760
Development costs incurred during the period 78 171 117 19 37 422
Changes in estimated future development costs (62) (187) (235) (26) (83) (593)
Purchase/sale reserves – – – – – –
Net change in income taxes 21 50 (144) 266 (94) 99
Accretion of discounts 159 28 375 563 56 1,181
Other (1) (5) – – – (6)
Standardized measures of discounted future cash flows (SMOG) 1,303 25 4,032 998 454 6,812
Thereof equity-accounted companies – – 933 733 – 1,666
Total excluding equity-accounted companies 1,303 25 3,099 265 454 5,146
1 Restated as a result of amended IFRS

6 Ove
rvie
ws
Overviews
Overviews
Ten-year summary 226
GRI and Global Compact Index 228
Statement GRI Application Level Check 230
Selected prizes and awards 231
Registered trademarks 232
Glossary 233
Index 238

Ten-year summary
BASF Report 2013Overviews226
Million € 2004 2005 2006 2007 2008 2009 2010 2011 20121 2013
Sales and earnings
Sales 37,537 42,745 52,610 57,951 62,304 50,693 63,873 73,497 72,129 73,973
Income from operations before depreciation and amortization (EBITDA)
7,685
8,233
9,723
10,225 9,562
7,388
11,131
11,993 10,009 10,427
Income from operations (EBIT) 5,193 5,830 6,750 7,316 6,463 3,677 7,761 8,586 6,742 7,273
Income before taxes 4,347 5,926 6,527 6,935 5,976 3,079 7,373 8,970 5,977 6,713
Income before minority interests 2,133 3,168 3,466 4,325 3,305 1,655 5,074 6,603 5,067 5,173
Net income 2,004 3,007 3,215 4,065 2,912 1,410 4,557 6,188 4,819 4,842
Capital expenditures, depreciation and amortization
Additions to property, plant and equipment and intangible assets
2,163
2,523
10,039
4,425 3,634
5,972
5,304
3,646 5,263 7,513
Thereof property, plant and equipment 2,022 2,188 4,068 2,564 2,809 4,126 3,294 3,199 4,084 6,220
Depreciation and amortization of property, plant and equipment and intangible assets
2,492
2,403
2,973
2,909 3,099
3,711
3,370 3,407 3,267 3,154
Thereof property, plant and equipment 2,053 2,035 2,482 2,294 2,481 2,614 2,667 2,618 2,594 2,519
Number of employees
At year-end 81,955 80,945 95,247 95,175 96,924 104,779 109,140 111,141 110,782 112,206
Annual average 85,022 80,992 88,160 94,893 95,885 103,612 104,043 110,403 109,969 111,844
Personnel expenses 5,615 5,574 6,210 6,648 6,364 7,107 8,228 8,576 8,963 9,285
Research and development expenses 1,173 1,064 1,277 1,380 1,355 1,398 1,492 1,605 1,732 1,835
Key data
Earnings per share2,3 € 1.83 2.87 3.19 4.16 3.13 1.54 4.96 6.74 5.25 5.27
Cash provided by operating activities4 4,634 5,2505 5,940 5,807 5,023 5,693 6,460 7,105 6,602 7,870
EBITDA margin % 20.5 19.3 18.5 17.6 15.3 14.6 17.4 16.3 13.9 14.1
Return on assets % 13.2 17.7 17.5 16.4 13.5 7.5 14.7 16.1 11.0 11.6
Return on equity after tax % 12.9 18.6 19.2 22.4 17.0 8.9 24.6 27.5 19.9 19.4
Appropriation of profits
Net income of BASF SE6 1,363 1,273 1,951 2,267 2,982 2,176 3,737 3,506 2,880 2,826
Dividends 904 1,015 1,484 1,831 1,791 1,561 2,021 2,296 2,388 2,480
Dividend per share2 € 0.85 1.00 1.50 1.95 1.95 1.70 2.20 2.50 2.60 2.70
Number of shares as of December 312,7 million 1,080.9 1,028.8 999.4 956.4 918.5 918.5 918.5 918.5 918.5 918.5
1 We have applied International Financial Reporting Standards 10 und 11 as well as International Accounting Standard 19 (revised) since January 1, 2013. Figures for 2012 have been restated; no restatement has been made for 2011 and earlier.
2 We conducted a two-for-one stock split in the second quarter of 2008. The previous year’s figures for earnings per share, dividend per share and number of shares have been adjusted accordingly.
3 Adjusted for special items and impairment of intangible assets, earnings per share were €5.37 in 2013 and €5.64 in 2012.4 Includes the change in reporting from 2009 onward of the effects of regular extensions of U.S. dollar hedging transactions 5 Before external financing of pension obligations6 Calculated in accordance with German GAAP7 After deduction of repurchased shares earmarked for cancellation
Ten-year summary

Ten-year summary
OverviewsBASF Report 2013 227
Balance sheet (IFRS)
Million € 2004 2005 2006 2007 2008 2009 2010 2011 20121 2013
Intangible assets 3,607 3,720 8,922 9,559 9,889 10,449 12,245 11,919 12,193 12,235
Property, plant and equipment 13,063 13,987 14,902 14,215 15,032 16,285 17,241 17,966 16,610 18,254
Investments accounted for using the equity method 1,100 244 651 834 1,146 1,340 1,328 1,852 3,459 4,137
Other financial assets 938 813 1,190 1,952 1,947 1,619 1,953 848 613 630
Deferred taxes 1,337 1,255 622 679 930 1,042 1,112 941 1,473 992
Other receivables and miscellaneous noncurrent assets 473 524 612 655 642 946 653 561 911 876
Noncurrent assets 20,518 20,543 26,899 27,894 29,586 31,681 34,532 34,087 35,259 37,124
Inventories 4,645 5,430 6,672 6,578 6,763 6,776 8,688 10,059 9,581 9,592
Accounts receivable, trade 5,861 7,020 8,223 8,561 7,752 7,738 10,167 10,886 9,506 9,376
Other receivables and miscellaneous current assets 2,133 1,586 2,607 2,337 3,948 3,223 3,883 3,781 3,455 3,630
Marketable securities 205 183 56 51 35 15 16 19 14 17
Cash and cash equivalents 2,086 908 834 767 2,776 1,835 1,493 2,048 1,647 1,815
Assets of disposal groups – – – 614 – – 614 295 3,264 2,828
Current assets 14,930 15,127 18,392 18,908 21,274 19,587 24,861 27,088 27,467 27,258
Total assets 35,448 35,670 45,291 46,802 50,860 51,268 59,393 61,175 62,726 64,382
Subscribed capital 1,383 1,317 1,279 1,224 1,176 1,176 1,176 1,176 1,176 1,176
Capital surplus 3,028 3,100 3,141 3,173 3,241 3,229 3,216 3,203 3,188 3,165
Retained earnings 11,923 11,928 13,302 14,556 13,250 12,916 15,817 19,446 23,708 26,170
Other comprehensive income (60) 696 325 174 (96) 156 1,195 314 (3,461) (3,400)
Minority interests 328 482 531 971 1,151 1,132 1,253 1,246 1,010 678
Equity 16,602 17,523 18,578 20,098 18,722 18,609 22,657 25,385 25,621 27,789
Provisions for pensions and similar obligations 4,124 1,547 1,452 1,292 1,712 2,255 2,778 3,189 5,421 3,709
Other provisions 2,376 2,791 3,080 3,015 2,757 3,289 3,352 3,335 2,925 2,924
Deferred taxes 948 699 1,441 2,060 2,167 2,093 2,467 2,628 2,234 2,849
Financial indebtedness 1,845 3,682 5,788 6,954 8,290 12,444 11,670 9,019 8,704 11,151
Other liabilities 1,079 1,043 972 901 917 898 901 1,142 1,111 1,157
Noncurrent liabilities 10,372 9,762 12,733 14,222 15,843 20,979 21,168 19,313 20,395 21,790
Accounts payable, trade 2,372 2,777 4,755 3,763 2,734 2,786 4,738 5,121 4,502 4,505
Provisions 2,364 2,763 2,848 2,697 3,043 3,276 3,324 3,210 2,628 2,616
Tax liabilities 644 887 858 881 860 1,003 1,140 1,038 870 954
Financial indebtedness 1,453 259 3,695 3,148 6,224 2,375 3,369 3,985 4,094 3,256
Other liabilities 1,641 1,699 1,824 1,976 3,434 2,240 2,802 3,036 2,623 2,182
Liabilities of disposal groups – – – 17 – – 195 87 1,993 1,290
Current liabilities 8,474 8,385 13,980 12,482 16,295 11,680 15,568 16,477 16,710 14,803
Total equity and liabilities 35,448 35,670 45,291 46,802 50,860 51,268 59,393 61,175 62,726 64,382
1 We have applied International Financial Reporting Standards 10 und 11 as well as International Accounting Standard 19 (revised) since January 1, 2013. Figures for 2012 have been restated; no restatement has been made for the figures of 2011 and earlier.

GRI and Global Compact Index
BASF Report 2013Overviews228
GRI and Global Compact Index
The complete GRI Index with core and additional indicators as well as the ten principles of the Global Compact can be found at basf.com/gri_gc_e
Global Compact Principles
GRI Indicator
Subject
Page
Profile
1.1–1.2 Strategy and analysis 8–9, 21–23, 26–29, 31–32, 35, 36, 39, 41, 46, 90, 91, 97, 112–114, 118–120
2.1–2.10 Organizational profile Cover, 5, 13–15, 18–20, 24, 30, 34, 35, 37, 39, 41, 45, 49, 54, 58–59, 61, 62, 67, 68, 74, 79, 82–84, 88–89, 98, 115, 118–120, 166–174, 231, 232
3.1–3.4 Report profile Cover, 4–6
3.5–3.11 Report scope and boundary 4–6, 20, 27–29, 55, 57
3.12 GRI Content Index 228–229
3.13 Assurance 6, 143
1–10 4.1–4.10 Corporate governance 4, 21–23, 26, 27, 39, 41–44, 82, 90, 93–98, 103, 105, 107–108, 111, 113, 114, 122–124, 127–139, 210–211
1–10 4.11–4.13 Commitments to external initiatives 4–6, 22–23, 29, 40, 41, 44, 45, 82, 90–94, 96–99, 103, 114, 125, 128
4.14–4.17 Stakeholder engagement 5, 15, 27–30, 38, 39, 41– 43, 45, 82, 90–92, 94, 96–98, 113, 114, 128
Economic performance
1,4,6,7Management approach
Cover, 19–24, 26, 49, 54, 55, 58–59, 106–114, 142–208
7 EC1–EC4 Economic performance Cover, 12, 13, 16, 24, 30, 35–37, 40–41, 43, 49, 54, 55, 57–60, 63, 66, 69, 73, 75, 78, 80, 85, 88, 98, 102, 109, 144, 147, 148, 161, 178–180, 190–195, 210–211
6 EC6–EC7 Market presence 90
EC8–EC9 Indirect economic impacts 27, 36, 40–41, 45
Environmental performance
7,8,9Management approach
Cover, 19–23, 25, 27–29, 82–83, 90–97, 99, 101–105, 125, 127–128
8,9 EN1–EN2 Materials Cover, 19–20, 91–92, 101, 104, 105
8,9 EN3–EN7 Energy Cover, 25, 31–33, 82, 91, 99–102, 105
8,9 EN8–EN10 Water Cover, 25, 103, 104
8 EN11–EN14 Biodiversity 27, 35, 82, 92, 102
7,8,9 EN16–EN25 Emissions, wastewater, and waste Cover, 19–20, 32, 33, 73, 91, 92, 99–105
7,8,9 EN26 Products and services 27, 31–32, 34, 35, 66, 93, 94, 96, 99–105
8 EN28 Compliance 176, 195–196, 200
8 EN29 Transport 93, 94, 102, 105
7,8,9 EN30 Overall 30, 93, 98, 99, 101, 102, 104, 176
Social performance
Labor practice and labor quality
1,3,6 Management approach Cover, 21–25, 28–29, 39–41, 43, 44, 95–96, 127–128
6 LA1–LA3, LA15 Employment Cover, 30, 39–43, 114, 180
1,3 LA4–LA5 Labor/management relations Cover, 43, 44
1 LA6–LA9 Occupational health and safety Cover, 25, 41, 93–97
LA10–LA12 Training and education 26, 29, 40–42, 90, 94, 95, 127
1,6 LA13–LA14 Diversity and equal opportunities 24, 41–43

GRI and Global Compact Index
OverviewsBASF Report 2013 229
Since 2003, BASF has been participating in the feedback meetings of theGlobal Reporting Initiative (GRI) and has been working to further develop theguidelines together with experts from industry, non-governmental organiza-tions, analysts and financial auditors. GRI aims to improve the comparabilityof sustainability reporting. We reported on the basis of the GRI for the firsttime in our Corporate Report 2003. Since 2005, we have been supporting theGlobal Reporting Initiative as an Organizational Stakeholder. This report has been aligned with the indicators of the current GRI guideline G3.1.
This short index shows where to find information on the GRI core andadditional indicators as well as topics relevant to the principles of theGlobal Compact in this report. An extended overview is available online atbasf.com/gri_gc_e. The online index contains all GRI reporting elements aswell as all GRI core and additional indicators and shows where details are tobe found in our printed and online reporting. We also give a brief explanationif no data is available for a given indicator.
More information on GRI can be found at www.globalreporting.org
Global Compact Principles
GRI Indicator
Subject
Page
Human rights
1,2,3,4,5,6 Management approach 21–23, 27–29, 43, 44, 91, 92, 94, 127–128
1,2,3,4,5,6 HR1–HR3 Investment and procurement practices 27, 90, 96, 127
1,2,6 HR4 Non-discrimination 44, 127
1,2,3 HR5 Freedom of association and collective bargaining 44, 90
1,2,5 HR6 Child labor 44, 90
1,2,4 HR7 Forced and compulsory labor 44, 90
1,2 HR8 Security practices 96
HR10 Assessment 44, 90, 93
HR11 Remediation 44
Society
10 Management approach 21–23, 29, 44, 45, 121–140, 127–128, 200
SO1, SO9, SO10 Community Cover, 29, 45, 92, 93, 96
10 SO2–SO4 Corruption 127
1–10 SO5–SO6 Policies 29
Product responsibility
1,8 Management approach 22–23, 25, 27–29, 33–35, 38, 93–98, 127–128
1 PR1 Customer health and safety 33, 34, 38, 90, 93, 94, 98, 102
8 PR3, PR5 Product and service labeling 21–22, 38, 96, 97
PR6 Marketing communications 45

Statement GRI Application Level Check
BASF Report 2013Overviews230
Statement GRI Application Level Check

Selected prizes and awards
OverviewsBASF Report 2013 231
Selected prizes and awards
CDP Global 500 Climate Disclosure Leadership IndexBASF in leading position in reporting on climate protectionIn 2013, BASF was inclued in the CDP Global 500 Climate Disclosure Leadership Index for the ninth time in succession. The index contains companies that report on climate protection in a particularly transparent and comprehensive manner. As in previous years, BASF achieved the top ranking in the Materials sector.
Dow Jones Sustainability IndexBASF share included in DJSI World for thirteenth consecutive yearBASF shares were again included in the Dow Jones Sustainability World Index. The analysts especially pointed out the company’s commitment to risk and crisis management, human capital development, and plant biotechnology.
European Water Stewardship certificateBASF awarded for responsible use of waterBASF is the first chemical company in the world to achieve gold-level certification according to the European Water Stewardship (EWS) standard for its production site in Tarragona, Spain in 2013. In the course of an external audit, the water management of the production site was certified.

Registered trademarks
BASF Report 2013Overviews232
Registered trademarks
AgBalance reg. trademark of BASF Group
AgCelence reg. trademark of BASF Group
BioStacked reg. trademark of BASF Group
BOOST trademark of adidas AG
CAPCURE reg. trademark of Gabriel Performance Products LLC
CATAMOLD reg. trademark of BASF Group
CELLASTO reg. trademark of BASF Group
CLEARFIELD reg. trademark of BASF Group
DINCH reg. trademark of BASF Group
ECOVIO reg. trademark of BASF Group
EMGARD reg. trademark of BASF Group
F 500 reg. trademark of BASF Group
FLORITE reg. trademark of BASF Group
FWC trademark of BASF Group
Genuity DroughtGard reg. trademark of Monsanto Technology LLC
GLASURIT reg. trademark of BASF Group
HEXAMOLL reg. trademark of BASF Group
INTEGRAL reg. trademark of BASF Group
INFINERGY reg. trademark of BASF Group
INITIUM reg. trademark of BASF Group
INTERCEPTOR reg. trademark of BASF Group
KEROPUR reg. trademark of BASF Group
KIXOR reg. trademark of BASF Group
KOLLICOAT reg. trademark of BASF Group
LUMINA trademark of BASF Group
LUTROPUR reg. trademark of BASF Group
MAGNAFLOC reg. trademark of BASF Group
MASTERPOLYHEED reg. trademark of Construction Research & Technology GmbH
NEOPOR reg. trademark of BASF Group
PLANTAQUAT NC reg. trademark of BASF Group
POLYTHF reg. trademark of BASF Group
RELIUS reg. trademark of PROSOL Lacke + Farben GmbH
RESPONSIBLE CARE reg. trademark of Conseil Européen de l’Industrie Chimique
SEEBALANCE reg. trademark of BASF Group
SET – applied sustainability reg. trademark of BASF Group
SLENTITE trademark of BASF Group
STANDAK reg. trademark of BASF Group
STYROPOR reg. trademark of BASF Group
SUBTILEX NC reg. trademark of BASF Group
TERMIDOR reg. trademark of BASF Group
ULTRACOM trademark of BASF Group
ULTRAMID reg. trademark of BASF Group
ULTRASON reg. trademark of BASF Group
VAULT reg. trademark of BASF Group
XEMIUM reg. trademark of BASF Group
ZETAG reg. trademark of BASF Group
Registered trademarks1
1 Trademarks are not necessarily registered in all countries.

Glossary
OverviewsBASF Report 2013 233
Glossary
A
Associated companiesThese are companies in which significant influence can be exer-cised over their operating and financial policies, and which are not subsidiaries, joint ventures or joint operations. In general, this applies to companies in which BASF has an interest of 20% to 50%.
AuditsAudits are a strategic tool for managing standards. During a site or plant audit, clearly defined criteria are used to create a profile for topics pertaining to, for example, environment, safety or health.
B
Backup lineA backup line is a confirmed line of credit that can be drawn upon in connection with the issue of commercial paper if market liquidity is not sufficient, or for the purpose of general corporate financing. It is one of the instruments BASF uses to ensure it is able to make payments at all times.
Barrel of oil equivalent (BOE)A barrel of oil equivalent is an international standard for comparing the thermal energy of different fuels. It is equal to one barrel of crude oil, or 6,000 cubic feet or 169 cubic meters of natural gas.
BiocatalysisBiocatalysis is the use of enzymes as biological catalysts for the tar-geted application, acceleration or control of chemical reactions. The high selectivity of enzyme catalysts allows for simplified processes and lower production costs.
BiotechnologyBiotechnology includes all processes and products that use living organisms, for example bacteria and yeasts, or their cellular con-stituents.
1.4-butanediol (BDO) 1.4-butanediol is an intermediate of BASF. BDO and its derivatives are used for producing plastics, polyurethanes, solvents, electronic chemicals and elastic fibers.
C
CO2 equivalentsCO2 equivalents are units for measuring the effect of greenhouse gas emissions. A factor known as the global warming potential (GWP) shows the effect of the individual gases compared with CO2 as the reference value.
Coil coatingsCoil coatings are specialty coatings that can be applied to steel and aluminum bands creating a composite material that incorporates the traits of the metal and the coating material. The composite material is especially resistant to corrosion and can be easily formed. Coil coating sheets are mainly used in the construction industry.
Commercial paper programThe commercial paper program is a framework agreement between BASF and banks regarding the issuing of debt obligations on the financial market (commercial paper). The commercial paper is issued under a rolling program for which the terms can be determined individually. This requires a good rating.
ComplianceCompliance is an important element of corporate governance. It refers to the company’s behavior in accordance with laws, guide-lines and voluntary codices.
Conflict minerals/conflict minesConflict minerals describe minerals listed in the U.S. Conflict Min erals Trade Act. These include tantalite (coltan), cassiterite (tin ore), wolf-ramite, gold, and their derivatives. Some conflict mines are suspected of being used to finance armed conflicts in the Democratic Republic of Congo or neighboring states.
Consumer goods sectorThe consumer goods sector includes, for example, the textiles and leather industry, the electrical industry and domestic appliance manu-facturing, as well as the paper industry and the personal care and cleaners sector.
E
EBITEarnings before interest and taxes (EBIT) – at BASF, EBIT corres-ponds to income from operations.
EBIT after cost of capitalEBIT after cost of capital is calculated by deducting the cost of capi-ital from the EBIT of the operating divisions. The cost of capital thereby reflects the shareholders’ expectations regarding return (in the form of dividends or share price increases) and interest payable to creditors. If the EBIT after cost of capital has a positive value, we have earned a premium on our cost of capital.
EBITDAEarnings before interest, taxes, depreciation and amortization (EBITDA) – at BASF, EBITDA corresponds to income from opera-tions before depreciation and amortization.
EBITDA marginThe EBITDA margin is the margin that we earn on sales from our operating activities before depreciation and amortization. It is calculated as income from operations before depreciation and amor-tization as a percentage of sales.

Glossary
BASF Report 2013Overviews234
Eco-Efficiency AnalysisThe Eco-Efficiency Analysis developed by BASF is a method for the assessment of products and processes with respect to economic and environmental issues. The aim is to compare products with regard to profitability and environmental performance.
Ecosystem servicesCompanies simultaneously rely on and have an impact on ecosys-tem services. These include, for example, the conservation of air, water and soil quality. Biodiversity, which is understood as the diver-sity of life forms on our planet, serves as a basis of and indicator for the integ rity of ecological systems.
Equity methodThe equity method is used to account for shareholdings in joint ven-tures and associated companies. Based on the acquisition costs of the shareholding as of the acquisition date, the carrying amount is continuously adjusted to the changes in equity of the company in which the share is held.
European Water Stewardship (EWS) StandardThe European Water Stewardship Standard enables businesses and agriculture to assess the sustainability of their water manage-ment practices. The criteria are: water abstraction volumes, water quality, conservation of biodiversity and water governance. The European-wide standard came into force at the end of 2011 and was developed by NGOs, governments and businesses under the direction of the independent organization European Water Partner-ship (EWP).
ExplorationExploration refers to the exploration and investigation of an area in the search for mineral resources such as crude oil or natural gas. The exploration process involves using suitable geophysical processes to find structures that may contain oil and gas then proving a possi-ble find by means of exploratory drilling.
F
Field developmentField development is the term for the installation of production facilities and the drilling of production wells for the commercial exploitation of oil and natural gas deposits.
FormulationFormulation describes the combination of one or more active substances with excipients like emulsifiers, stabilizers and other non-active components in order to improve the applicability and effectiveness of various products, such as cosmetics, pharmaceu-ticals, agricultural chemicals, paints and coatings.
Free cash flow Free cash flow is cash provided by operating activities less payments related to property, plant and equipment and intangible assets.
G
Global Product Strategy (GPS)The Global Product Strategy aims to establish global product stewardship standards and practices for companies. The program, initiated by the International Council of Chemical Associations, strives to ensure the safe handling of chemicals by reducing existing differ-ences in risk assessment.
Greenhouse Gas Protocol (GHG Protocol)The Greenhouse Gas Protocol, used by companies from different sectors, NGOs and governments, is a globally recognized standard to quantify and manage greenhouse gas emissions. The reporting standards and recommendations for the implementation of projects to reduce emissions are jointly developed by companies, govern-ments and NGOs under the guidance of the World Resources Insti-tute and the World Business Council for Sustainable Development.
H
Health Performance Index (HPI)The Health Performance Index is an indicator developed by BASF to provide more detailed insight into our approach to health manage-ment. It comprises five components: confirmed occupational diseases, medical emergency drills, first aid, preventive medicine and health promotion.
I
IASIAS stands for International Accounting Standards (see also IFRS).
IFRSThe International Financial Reporting Standards (until 2001: Inter- national Accounting Standards, IAS) are developed and published by the International Accounting Standards Board, headquartered in London, England. In accordance with the IAS Regulation, the appli-cation of IFRS has been mandatory for listed companies headquar-tered in the European Union since 2005.
ILO Core Labor StandardsThe ILO Core Labor Standards are laid out in a declaration of the International Labor Organization (ILO). It comprises eight conventions which set minimum requirements for decent working conditions. BASF has a Group-wide system to monitor employees’ and sup pliers’ adherence to these labor standards.
ISO 14001ISO 14001 is an international standard developed by the International Organization for Standardization (ISO) that determines the general requirements for an environmental management system for volun-tary certification.

Glossary
OverviewsBASF Report 2013 235
ISO 19011ISO 19011 is an international standard developed by the International Organization for Standardization (ISO) that determines requirements for audits of quality management and environmental management systems.
ISO 50001ISO 50001 is an international standard developed by the International Organization for Standardization (ISO) that determines the general requirements for an energy management system for voluntary certi-fication.
IUCN categories of protected areasThe International Union for Conservation of Nature (IUCN) is an inter-national nongovernmental organization that aims to raise awareness for the protection of species and to contribute to the sustainable use and conservation of resources. IUCN classifies the world’s protected areas. Categories I, II and III comprise “Strict Nature Reserve and Wil-derness Area,” “National Park” and “Natural Monument or Feature.”
J
Joint arrangementA joint arrangement refers to joint ventures and joint operations, and describes a jointly controlled arrangement of two or more parties. This arrangement exists if decisions about relevant activities require the unanimous consent of all parties sharing control.
Joint operationA joint operation is a joint arrangement in which the parties that share control have direct rights to the assets and liabilities relating to the arrange ment. For joint operations, the proportional share of assets, liabilities, income and expenses are reported in the BASF Group Con-solidated Financial Statements.
Joint ventureA joint venture is a joint arrangement in which the parties that have joint control of a legally independent entity have rights to the net assets of that arrangement. Joint ventures are accounted for using the equity method in the BASF Group Consolidated Financial Statements.
L
Long-term incentive program (LTI)The long-term incentive program is a share-price-based compen-sation program for senior executives of the BASF Group and members of the Board of Executive Directors. The program aims to tie a portion of the participants’ compensation to the long-term, abso lute and relative performance of BASF shares.
M
Materiality analysisBASF uses the materiality analysis to gain information from internal and external stakeholders about the significance of sustainability topics. The results help determine present and future opportunities and risks for BASF’s business and develop strategies to address these at an early stage.
MDIMDI stands for diphenylmethane diisocyanate and is one of the most important raw materials for the production of the plastic polyure-thane. This plastic is used for applications ranging from the soles of high-tech running shoes and shock absorbers for vehicle engines to insulation for refrigerators and buildings.
MigrationIn chemistry, migration refers to the movement of molecules on the surface of plastics or in surrounding materials. Plastics with low migration values hinder or prevent the migration of, for example, additives, which makes them especially suitable for applications that come into contact with food or drinking water.
Monitoring systemMonitoring systems and tools serve to measure and ensure the ad-herence to standards. One area that is monitored is our voluntary commitments, such as the adherence to human rights and interna-tionally recognized labor standards.
MSCI World Chemicals IndexThe MSCI World Chemicals Index is a stock index that includes the world’s biggest chemical companies. It measures the performance of the companies in the index in their respective national currencies, thus considerably reducing currency effects.
N
NanomaterialsThe International Organization for Standardization defines nano-materials as materials with one or more external dimensions on a nanoscale or with internal structure or surface structure on a nano-scale. For regulatory purposes, there are additional definitions for nanomaterials worldwide.
NaphthaNaphtha is petroleum that is produced during oil refining. Heavy naphtha is the starting point for gasoline production. Light naphtha is the most important feedstock for steam crackers.
NMVOC (Non Methane Volatile Organic Compounds)VOCs (volatile organic compounds) are organic substances that, at low temperatures, are present in the air as gas. These include some hydrocarbons, alcohols, aldehydes and organic acids. NMVOCs are VOCs from which methane is excluded.

Glossary
BASF Report 2013Overviews236
O
OHSAS 18001The Occupational Health and Safety Assessment Series (OHSAS) comprises, among other things, the standard OHSAS 18001 which includes a management system for occupational safety. This sys-tem can be integrated into an existing quality and environmental protection management system and certified accordingly.
P
Patent Asset IndexThe Patent Asset Index measures the strength of a company’s patent portfolio. It is made up of two factors: (1) portfolio size (the number of worldwide active patent families) and (2) competitive impact, which is the combination of technology relevance and market coverage (weighted by market size).
Peak sales potentialThe peak sales potential of the crop protection pipeline describes the total peak sales generated and expected for individual products in the pipeline. It comprises active ingredients and system solutions that have been on the market since 2010 or will be launched on the market by 2020. The peak sales potential of individual products corresponds to the highest sales value to be expected from one year of the observation period.
Propylene oxide (PO)Propylene oxide (PO), a very reactive compound, is generated by the oxidation of propylene and is used as basic chemical for further processing in the chemical industry.
R
Ramsar SiteRamsar Sites were defined in the Ramsar Convention of 1971. These are protected Wetlands of International Importance, such as lagoons, moors, lakes, rivers and marshlands.
REACHREACH is a European Union regulatory framework for the registra-tion, evaluation and authorization of chemicals, and will be imple-mented gradually until 2018. Companies are obligated to collect data on the properties and uses of produced and imported substances and to assess any risks. The European Chemicals Agency reviews the submitted dossiers and, if applicable, requests additional information.
Renewable resourcesThe term renewable resources refers to biomass that origins from different sources (plants and microorganisms, for example), and is used for industrial purposes. Renewable resources are used for manufacturing numerous products and for generating electricity and other forms of energy.
Responsible CareResponsible Care refers to a worldwide initiative by the chemical industry to continuously improve its performance in the areas of environmental protection, health and safety.
RetentionProfits generated can be used in two ways: distribution to share-holders or retention within the company.
Return on assetsReturn on assets describes the return we make on the average assets employed during the year. It is calculated as income before taxes and minority interests plus interest expenses as a percentage of average assets.
S
Special itemsSpecial items describe one-time charges or one-time income that significantly affect the earnings of a segment or the BASF Group. Special items include, for example, charges arising from restruc-turing measures or earnings from divestitures.
Spot market (cash market)A spot market is a market where an agreed-upon deal, including delivery, acceptance and payment, occurs immediately, as opposed to forward contracts, where the delivery, acceptance and payment occurs at a point in time after the conclusion of the deal.
Steam crackerA steam cracker is a plant in which steam is used to “crack” naphtha (petroleum) or natural gas. The resulting petrochemicals are the raw materials used to produce most of BASF’s products.
T
TDITDI stands for toluene diisocyanate and is a starting material for the production of polyurethane. It is used primarily in the automotive indus try (for example, in seat cushions and interiors) and the furni-ture industry (for example, for flexible foams for mattresses or cush-ioning, or in wood coating).
TUISTUIS is a German transport accident information and emergency response system jointly operated by around 130 chemical compa-nies. The member companies can be reached by the public author-ities at any time and provide assistance over the telephone, expert on-site advice or special technical equipment.

Glossary
OverviewsBASF Report 2013 237
U
UNESCO protected areaUNESCO protected areas, or World Heritage Sites, are natural sites of exceptional value. These important habitats can be home to endangered plant and animal species.
V
Value chainA value chain describes the successive steps in a production pro-cess: from raw materials through various intermediate steps, such as transportation and production, to the finished product.
VerbundIn the BASF Verbund (pronounced “fair-boond”), production facili-ties, energy flow, logistics and infrastructure are intelligently net-worked with each other in order to increase production yields, save resources and energy, and reduce logistics costs. A significant factor in the Verbund concept is the Know-How Verbund, in which BASF employees engage in worldwide exchange and expert knowledge is pooled in technology platforms.
VFA-based cationic polymersVFA stands for vinylformamide, a starting material for water-solu-ble, cationic polymers. VFA-based cationic polymers are used in the paper industry to increase efficiency in production processes.
W
Water stress areasWater stress areas are areas in which water represents a scarce resource, and where people abstract more than 60 percent of the water available. The most important factors leading to water scar-city are: low precipitation, high temperatures, low air humidity, unfavorable soil properties and high water abstraction rates.
White biotechnologyWhite biotechnology is an area of biotechnology, also called indus-trial biotechnology, that uses microorganisms and/or enzymes to produce chemical products that are utilized in many levels of the value chain in the chemical industry. This involves, for example, the biotechnological production of chiral intermediates.

Index
BASF Report 2013Overviews238
Index
AAcquisitions 37, 39, 50 f., 54, 57, 58, 82, 106 f., 112 ff.,
118, 147, 155, 157, 162, 164, 166 ff.,
179, 181 ff., cover
Agricultural Solutions 18, 34 f., 36, 38, 50 f., 58 f., 78 ff., 171,
173, cover
Air and soil 5, 105
Auditor’s report 6, 143
Audits 23, 27, 90, 92, 93, 95, 97, 103, 105, 107,
127, 233, cover
BBalance sheet 54 ff., 108, 143, 146, 148 ff., 154 ff.,
169, 175, 178 ff., 181 ff., 227
BASF Plant Science 30, 35, 78 ff., cover
Biodiversity 28, 92, 234, 236
Biotechnology 14, 30 ff., 35, 78 f., 98, 171, 233, 237,
cover
Board of Executive Directors 8 f., 10 f., 107, 109, 122 ff., 129, 131 ff.,
136 ff., 140, 142
CCare Chemicals 18, 37, 53, 66 ff., 118, 166, 171, 182, cover
Cash flow 53, 57, 112, 145, 147, 153, 155, 160 ff.,
189, 207, 209, 222 ff., 226, 234, cover
Catalysts 18, 34, 50, 73 ff., 119, 165, 168, 171, 182,
202, 213, cover
Chemicals 18 f., 33 ff., 50 ff., 58 f., 60 ff., 118 f.,
151, 171, 173, 184, cover
Climate protection 1 ff., 5, 14 f., 25, 30, 98, 99 ff., 105
Coatings 18, 34, 73 ff., 170 f., cover
Compliance 22 f., 27 f., 42, 44, 107, 111, 122 f., 127 f., 233
Construction Chemicals 18, 34, 50, 73 ff., 119, 169, 171, 176, 181 f.,
cover
Cooperation 31 f., 34 f., 40, 60, 82 f., 91, 94, 106, 113, 216
Corporate governance 23, 90, 122 ff., 128, 149 f., 169, 175, 233
Cost of capital 24, 26, 52, 63, 69, 75, 80, 85, 118, 120,
157 f., 163, 177, 209, cover
Crop Protection 18, 35, 78, 80 f., 168, 171, 182, 202
Customers 18 ff., 27, 29 f., 33 ff., 37, 38, 41, 47 f., 60 f.,
64 ff., 70 ff., 76 ff., 81, 84, 87 ff., 93 ff., 97 ff.,
99 f., 106, 110, 112 f., 174, cover
DDerivative financial instruments 160, 203, 205 Dispersions & Pigments 18, 53, 66 ff., 72, 118, 170 f., 176, 181 f.,
cover
Divestitures 50 f., 57, 107, 113, 118, 136, 147, 155,
164, 166, 169 f., 175 ff.
Dividend 12 f., 16, 55, 57, 120, 139, 147 f., 155,
158 , 160, 165, 177, 179, 189, 205, 209 ff.,
226, cover
Diversity 22, 28, 41 f., 123 f.
Donations and sponsorship 29, 45, cover
EEco-Efficiency Analysis 27, 97, 236
Ecosystems 29, 92, 236
Emerging markets 20, 23, 36 f., 46 ff., 77, 96 f., 113, 115 ff.,
120
Employee representatives 23, 43, 44
Employees 13, 18 f., 22 ff., 26, 29, 30, 39 ff., 45, 93,
94, 95 f., 108, 110 ff., 114, 127, 161, 180,
190 f., 196, 211, 226, cover
Energy efficiency 1 ff., 5, 15, 25, 28, 30, 33, 36, 99 ff., 110,
cover
Environmental protection 5, 27, 93, 99 ff., 103, 105, 127, 161, 176,
195, 196, 236, cover
Equity 26, 55, 112, 143, 145, 147, 148, 153ff.,
159ff., 189, 201 ff., 226 f.
Events after the reporting period 120
Exploration & Production 18, 51, 82 ff., 171, 173, 181, 182, 216, cover
External audit 6, 143, 230
FField development 36, 83 f., 120, 162, 216, 234
Functional Materials & Solutions 18, 34 f., 36, 38, 50 f., 58 f., 73 ff., 88 f,
118 f., 151, 171, 173, cover
Further training 40 f.
GGlobal Compact 4 f., 9, 22, 29, 90, 128, 228 f.
Global Reporting Initiative 4 ff., 228 f.
Goodwill 36 f., 54, 112, 163
Growth fields 23, 30 ff., 35, 38, 113, 171
HHealth protection 28, 93, 95 f., cover
Human rights 22, 28, 44, 90, 96, 127 f.
IIncome, statement of 143, 144 f., 151 ff., 160 f., 174 ff., 192
Innovation 21 ff., 30 ff., 66, 78 f., 89, 91, 98, 113 f.,
124, 137, cover
Inorganics 19
Intermediates 18 f., 50 f., 60 ff., 65, 118, 168, cover
Investments 23, 27, 36 f., 46, 54, 57 f., 60 f., 63, 68 f.,
71, 74 f., 78, 80, 82 f., 84 f., 93, 106 f., 112 ff.,
115 f., 119 f., 145, 153, 173 f., 184 f., 198, 226,
cover
Investor Relations 15, 18
LLabor and social standards 23, 27 f., 44, 90, 114, 127 f.
MMass balance method 9, 27, 91
Materiality analysis 5, 27, 28 f., 235
Material aspects 1 ff., 28 f.
Monitoring system 23, 27, 44, 108 f., 114, 234, 235
Monomers 18 f., 37, 50 f., 60 ff., 118, 166, 168, 171,
cover
NNanotechnology 29, 31 f., 98, 236
Natural Gas Trading 18, 51, 82 ff., 87, 171, 200, 202, 207, cover
Nutrition 21, 27 ff., 31 f., 47, 78 f., 98, 116, 168,
cover
Nutrition & Health 18, 37, 53, 66 ff., 71, 118, 166, 168,
cover

B
AS
F G
rou
p 2
013
at a
gla
nce
OOil & Gas 18, 20, 35 f., 38, 50 ff., 58 f., 82 ff., 99 ff.,
105, 119 f., 136, 161, 167, 169, 171 f., 173,
216 ff., cover
Organization 18, 38, 107, 111, 122, 151, 171
PPaper Chemicals 18, 53, 66 ff., 71 f., 171, cover
Patents 30, 157, 168, 182 f.
Pensions 55 f., 146, 154 f., 161, 169 f., 190 ff.
Performance Chemicals 18, 53, 66 ff., 72, 169, 171, 176, cover
Performance Materials 18 , 34, 50, 73 ff., 77, 119, 151, 168, 171,
cover
Performance Products 18, 33 ff., 50 , 53, 58 f., 66 ff., 118 f., 170,
171, 173, 183, cover
Petrochemicals 18 f., 50, 52 f., 60 ff., 63 f., 118, cover
Production 19 f., 21, 23, 24 ff., 27 ff., 33, 36 ff., 47 f., 68,
88 ff., 95 f., 99 ff., 103 f., 105, 157 f., 161 f.,
164, 167 ff., 171, 184 f., 202, 217 f., cover
Product stewardship 27 f., 97 f., 234
RRating 12, 14 f., 56 f., 111 f., 120, 126, 158 f., 161
Raw materials 9, 20, 21, 27 f., 31 ff., 47, 48, 60, 64, 66 f.,
91 f., 93, 94, 109 ff., 116, 200, 202, 235,
cover
REACH 97 f., 110, 177, 236
Regions 15, 18, 23, 36, 39, 46, 88 f., 107, 119, 137,
171, 172 ff.
Renewable resources 9, 27 f., 91, 235
Research and development 23 ff., 30 ff., 60, 66, 89, 91, 98,
113 f., 137, cover
Responsible Care 23, 27, 90, 93, 236, cover
SSafety and security 5, 18, 22 f., 25, 27 ff., 93, 94, 95 f., 97 f.,
110, 114, 127, 132, 159, 176, 198, 233,
236, cover
Sales 23 f., 46, 49 ff., 58 f., 62 ff., 68 ff., 70 ff., 79 ff.,
84 f., 88 ff., 102, 111, 118 f., 226, cover
Segment data 63, 69, 75, 80, 85
Share 12 ff., 24, 37, 43, 49, 53, 57, 112, 124 ff.,
131, 134 f., 139, 144, 148, 152, 167, 174,
188 f., 195, 210 f., 226
Shareholders 8 ff., 26, 29, 57, 120, 122 ff., 137f., 145 ff.,
154 f., 205, 207, cover
Sites 19 f., 25, 29, 45, 62, 68, 82, 90, 92,
94 ff., 99, 101, 103 ff., 107, 110 f.,184
Special items 26, 49, 50 ff., 58 f., 63 ff., 69 ff., 75 , 78,
80 f., 85, 86 ff., 118 ff., 126, 236, cover
Stakeholders 1, 5, 23, 27 ff., 113 f., 128, 228, 229
Standards 5 f., 22 ff., 27 ff., 42, 44, 90, 92, 93, 94, 95 f.,
97 f., 103 f., 105, 110, 114, 127 f.
Strategy 15, 18, 21 ff., 27, 29, 38, 39, 42, 89,
112 f., 127
Statement by the Board of Executive Directors 142
Supervisory Board 107, 122 ff., 127, 130, 131, 134 f., 136 ff.,
140
Suppliers 27, 90, 91 f., 96, 97, 102, 110, 128, cover
Supply chain 90 , 102, 103, 106, 110, 114, 128, cover
Sustainability 4 ff., 8 f., 14 f., 22, 27 ff., 33, 35, 66, 90,
91 f., 93, 99 ff., 113 f., 134, 235, cover
TTechnology fields 30 ff.
Transport 5, 25, 31, 47, 82 ff., 86 f., 93, 94, 99 f., 102,
104, 105, 116, 237, cover
VValue-based management 26
Value chain 1 ff., 18 f., 27 f., 32 f., 38, 60, 66, 72, 90 ff.,
93 , 98, 99, 109, 113, 171, 237
Values 22 f., 42, 122, 128
Verbund 19 f., 21, 27, 30, 33, 38, 40, 60 f., 66, 91,
101, 107, 110, 113, 165, 171, 237
Vocational training 40, 180
WWater 25, 28 f., 30 f., 33, 45, 67, 72, 79, 92,
103 f., 113, 231, 234, 236, 237, cover
Wind power 32, 74, 77, 110, 113
Wintershall 20, 25, 37, 82 ff., 86, 165, 169, 177, 213,
216
This report is printed on FSC® certified real art paper, which contains products from BASF Paper Chemicals.
For more information on the production process, selection of paper and printing of this report, see basf.com/report_production
Publisher: BASF SE Communications & Government Relations 67056 Ludwigshafen, Germany
Design: Addison Group, London
Printing: Kunst- und Werbedruck, Bad Oeynhausen, Germany
Photography: Cover: Gerald SchillingPhoto series: Yan de Andrés, Alexander Grüber, Günter Hogen, Bernhard Kunz/Wissensfabrik, Mauricio Ramirez, Gerald Schilling, Detlef SchmalowBoard of Executive Directors and portraits: Andreas Pohlmann

Re
po
rt 2
013
Published on February 25, 2014
You can find this and other BASF publications online at www.basf.com
You can also order the reports:
– By telephone: +49 621 60-99001– Online: basf.com/mediaorders
General inquiries Phone: +49 621 60-0
Corporate Media RelationsJennifer Moore-Braun, Phone: +49 621 60-99123
Corporate Sustainability Relations Thorsten Pinkepank, Phone: +49 621 60-41976
Investor Relations Magdalena Moll, Phone: +49 621 60-48230
Internet www.basf.com
ContactFurther information
Annual Shareholders’ Meeting 2014 / Interim Report 1st Quarter 2014
May 2, 2014Interim Report 1st Half 2014
July 24, 2014Interim Report 3rd Quarter 2014
Oct. 24, 2014Full-Year Results 2014
Feb. 27, 2015Annual Shareholders’ Meeting 2015 / Interim Report 1st Quarter 2015
April 30, 2015
BASF supports the chemical industry’s global Responsible Care initiative.
ZO
AC
140
1 E
IS
SN
186
6-93
87