Chemically blockable transformation and ultra- …Chemically blockable transformation and...
17
© 2009 Macmillan Publishers Limited. All rights reserved. NATURE CHEMISTRY | www.nature.com/naturechemistry 1 SUPPLEMENTARY INFORMATION DOI: 10.1038/NCHEM.254 Chemically blockable transformation and ultra- selective low pressure adsorption in a metal organic framework Bo Xiao, 1 Peter J. Byrne, 1 Paul S. Wheatley, 1 David S. Wragg, 1 Xuebo Zhao, 2 Ashleigh J. Fletcher, 2 K. Mark Thomas, 2 Lars Peters, 3 John S.O. Evans, 3 Russell E. Morris 1 1 EaStChem School of Chemistry, University of St Andrews, Purdie Building, St Andrews KY16 9ST, UK. 2 Northern Carbon Research Laboratories, School of Natural Sciences, Bedson Building Newcastle University, Newcastle upon Tyne, NE1 7RU, UK 3 Department of Chemistry, University of Durham Science Laboratories, South Road, Durham, DH1 3LE, UK
Transcript of Chemically blockable transformation and ultra- …Chemically blockable transformation and...

© 2009 Macmillan Publishers Limited. All rights reserved.
nature chemistry | www.nature.com/naturechemistry 1
Supplementary informationdoi: 10.1038/nchem.254
Chemically blockable transformation and ultra-
selective low pressure adsorption in a metal
organic framework
Bo Xiao,1 Peter J. Byrne,1 Paul S. Wheatley,1 David S. Wragg,1 Xuebo Zhao,2 Ashleigh J.
Fletcher,2K. Mark Thomas,2 Lars Peters,3 John S.O. Evans,3 Russell E. Morris1
1EaStChem School of Chemistry, University of St Andrews, Purdie Building, St Andrews
KY16 9ST, UK.
2Northern Carbon Research Laboratories, School of Natural Sciences, Bedson Building
Newcastle University, Newcastle upon Tyne, NE1 7RU, UK
3Department of Chemistry, University of Durham Science Laboratories, South Road,
Durham, DH1 3LE, UK
Supplementary Information
S1 Synthesis of Cu-SIP-3
In a typical synthesis, Cu(NO3)2·3H2O (Alfa Aesar 98%) (2.42g) and 5-sulfoisophthalic
acid, sodium salt (NaH2SIP) (Aldrich, 95%) (2.68g) were dissolved in a 12mL
EtOH/H2O (50:50) solution. The mixture was heated in a 50mL Teflon lined autoclave at

© 2009 Macmillan Publishers Limited. All rights reserved.
nature chemistry | www.nature.com/naturechemistry 2
Supplementary informationdoi: 10.1038/nchem.254
383K for five days, followed by naturally cooling down to room temperature. The
yielded crystals were cleaned by sonication in a 100mL solution (EtOH/H2O) for 5
minutes and then filtrated out. The aqua blue crystals were collected and dried in air.
S2 NO adsorption/desorption isotherms
The isotherms of NO adsorption and desorption on samples were measured using a
gravimetric adsorption system composed of a CI microbalance integrated with a thermal
stabilizer, reactor, vacuum lines, thermostats and pressure transducers. The balance has
sensitivity of 0.1 µg and reproducibility of 0.01% load. ~50 mg CuSIP were degassed
under vacuum (10-4 mbar) at 423K prior to NO adsorption until no further weight loss
was observed. The dried NO gas (Air Liquide, 99.5%) was then introduced into the
adsorption system. The isotherms of NO adsorption were obtained through controlling
adsorption equilibrium at different desired pressures until up to 1 bar. Desorption was
conducted by reducing NO pressure in adsorption system to the desired values until
reaching equilibrium.
S3 TG analysis
The TG analysis of sample was carried out using a NETZSCH STA449C TG system
connected to a PFEIFFER vacuum ThermoStar mass spectrometer through a quartz glass
capillary heated at 453K. ~10mg sample was used for the TG measurement. The sample
was heated at rate of 5Kmin-1 in argon flow (45mLmin-1) from room temperature to
1073K. The species with m/z: 28 (CO), 44 (CO2), 48 (SO2) and 64 (SO3) were monitored
throughout experiment.
Chemically blockable transformation and ultra-
selective low pressure adsorption in a metal
organic framework
Bo Xiao,1 Peter J. Byrne,1 Paul S. Wheatley,1 David S. Wragg,1 Xuebo Zhao,2 Ashleigh J.
Fletcher,2K. Mark Thomas,2 Lars Peters,3 John S.O. Evans,3 Russell E. Morris1
1EaStChem School of Chemistry, University of St Andrews, Purdie Building, St Andrews
KY16 9ST, UK.
2Northern Carbon Research Laboratories, School of Natural Sciences, Bedson Building
Newcastle University, Newcastle upon Tyne, NE1 7RU, UK
3Department of Chemistry, University of Durham Science Laboratories, South Road,
Durham, DH1 3LE, UK
Supplementary Information
S1 Synthesis of Cu-SIP-3
In a typical synthesis, Cu(NO3)2·3H2O (Alfa Aesar 98%) (2.42g) and 5-sulfoisophthalic
acid, sodium salt (NaH2SIP) (Aldrich, 95%) (2.68g) were dissolved in a 12mL
EtOH/H2O (50:50) solution. The mixture was heated in a 50mL Teflon lined autoclave at

© 2009 Macmillan Publishers Limited. All rights reserved.
nature chemistry | www.nature.com/naturechemistry 3
Supplementary informationdoi: 10.1038/nchem.254
300 400 500 600 700 800 900 100040
60
80
100
Temperature/K
SO2 (30x)CO
CO2
Inte
nsity
ofsp
ecie
sde
sorb
ed
Wei
ghtl
osse
s,%
wt
Figure S1 TG analysis of sample Cu SIP-3 (5.6%wt weight loss at <423K; 5.4%wt at
423-500K).
S4 Variable Temperature X-ray Diffraction experiments on Cu-SIP MOF
Two VT experiments were performed on Cu-SIP MOF, using the same scan parameters
and heating/cooling features between 300 and 445 K (corrected temperatures), the first in
air (d8_03479.raw), the second under a constant N2 gas flow (d8_03492.raw).
20 min diffraction patterns were taken on a Bruker AXS D8 diffractometer, using
monochromatic Cu K 1 radiation. Diffracted intensities were recorded with a gas–filled
Våntec linear PSD in 0.0085° steps (0.14 s/step) in the 2 range 5-75°. Figures 1-4 show
2D “film” plots of both experiments (max T at range 36).

© 2009 Macmillan Publishers Limited. All rights reserved.
nature chemistry | www.nature.com/naturechemistry 4
Supplementary informationdoi: 10.1038/nchem.254
Figure S2: 2D “film” plot of the diffraction patterns taken under normal atmospheric
conditions. The sample de-hydrated between ~388 and 409 K. Re-hydration occurred on
cooling between ~ 329 and 320 K. During both, de-hydration and re-hydration, the lines
broaden significantly, indicating a decreasing crystallite/domain size.

© 2009 Macmillan Publishers Limited. All rights reserved.
nature chemistry | www.nature.com/naturechemistry 5
Supplementary informationdoi: 10.1038/nchem.254
Figure S3: Fragment of the 2D “film” plot from Figure 1, demonstrating a significant
shift of the reflection positions of Cu-SIP MOF in the vicinity of the de-hydration
reaction and the line-broadening during de- and re-hydration.

© 2009 Macmillan Publishers Limited. All rights reserved.
nature chemistry | www.nature.com/naturechemistry 6
Supplementary informationdoi: 10.1038/nchem.254
Figure S4: 2D “film” plot of the diffraction patterns taken under constant N2 flow. The
sample de-hydrated between ~368 and 405 K. No re-hydration was observed on cooling.

© 2009 Macmillan Publishers Limited. All rights reserved.
nature chemistry | www.nature.com/naturechemistry 7
Supplementary informationdoi: 10.1038/nchem.254
Figure S5: Fragment of the 2D “film” plot from Figure 3, demonstrating a significant
shift of the reflection positions of Cu-SIP MOF in the vicinity of the dehydration reaction.
All powder diffraction data were analysed by the Rietveld method (Rietveld, 1967)
within the TOPAS software package (Coelho, 2000). In the final 2-phase refinement cycle,
24 independent parameters were refined (9 coefficients for a background polynomial, the
sample height, 4 lattice parameters, 1 isotropic thermal displacement parameter and 1
scale factor for each phase, and 1 parameter each for a gaussian and a lorentzian
contribution to size broadening of the reflections. Prior to this final refinement cycle, a
room temperature ”instrumental” peak shape function (Thompson, Cox & Hastings,
1987), axial divergence correction and an eigth-order spherical harmonic (the latter for
each phase) modelling preferred orientation were determined and kept constant thereafter.
In none of the refinements, fractional atomic coordinates were allowed to vary due to the
© 2009 Macmillan Publishers Limited. All rights reserved.
nature chemistry | www.nature.com/naturechemistry 8
Supplementary informationdoi: 10.1038/nchem.254
limited number of observations, the complexity of the structures, and the dominance of
Cu in scattering power, with respect to the other elements in the material.
Figure S6: Plot of the refinement result for the hydrated phase at ~ 300 K (range 1,
experiment under N2).
Figure S7: Plot of the refinement result for the de-hydrated phase at ~ 445 K (range 36,
experiment under N2).
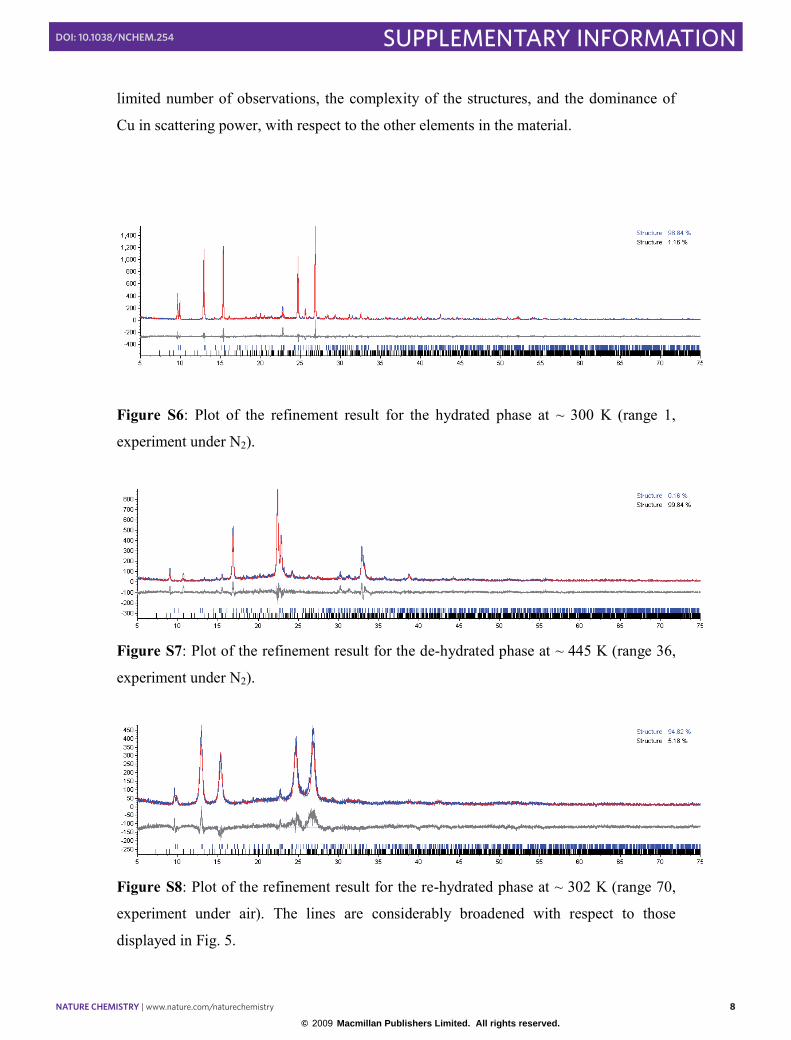
Figure S8: Plot of the refinement result for the re-hydrated phase at ~ 302 K (range 70,
experiment under air). The lines are considerably broadened with respect to those
displayed in Fig. 5.

© 2009 Macmillan Publishers Limited. All rights reserved.
nature chemistry | www.nature.com/naturechemistry 9
Supplementary informationdoi: 10.1038/nchem.254
Figure S9: Refined grain/domain size of Cu-SIP MOF as function of temperature for the
data series collected under air. Grain size decreases significantly during dehydration
(from ~4500nm to ~ 40nm) and again during rehydration (to ~15nm), probably
explaining the observed peak-broadening effects.
In addition to the fact that the material re-hydrates on cooling under air, which was not
observed under nitrogen, the lattice parameters of the hydrated material behave slightly
differently in both experiments, mainly such that the de-hydration under nitrogen occurs
at a ~20K lower temperature. This can be derived from Figs. 9-13 for a, b, c, and the
cell volume. The pronounced changes in these parameters, shortly before the actual
dehydration takes place, correspond to the significant shift of the reflection positions of
Cu-SIP MOF in the vicinity of the dehydration reaction as depicted in Figures 2 and 4.
0.00
10.00
20.00
30.00
40.00
50.00
60.00
70.00
80.00
300 310 320 330 340 350 360 370 380
T / K
size
/nm
Air
0.00
500.00
1000.00
1500.00
2000.00
2500.00
3000.00
3500.00
4000.00
4500.00
5000.00
300 310 320 330 340 350 360 370 380 390 400 410 420 430 440 450
T / K
size
/nm
Air

© 2009 Macmillan Publishers Limited. All rights reserved.
nature chemistry | www.nature.com/naturechemistry 10
Supplementary informationdoi: 10.1038/nchem.254
The difference in the dehydration temperatures possibly indicates a shift of the univariant
reaction curve towards higher T with increasing water partial pressure.
7.22
7.24
7.26
7.28
7.30
7.32
7.34
7.36
7.38
300 310 320 330 340 350 360 370 380 390 400 410
T / K
a/Å
N2Air
Figure S10: Variation of the lattice parameter a of Cu-SIP MOF with T.
17.90
18.00
18.10
18.20
18.30
18.40
18.50
18.60
18.70
300 310 320 330 340 350 360 370 380 390 400 410
T / K
b/Å
N2Air
Figure S11: Variation of the lattice parameter b of Cu-SIP MOF with T.

© 2009 Macmillan Publishers Limited. All rights reserved.
nature chemistry | www.nature.com/naturechemistry 11
Supplementary informationdoi: 10.1038/nchem.254
9.70
9.80
9.90
10.00
10.10
10.20
10.30
10.40
300 310 320 330 340 350 360 370 380 390 400 410
T / K
c/Å
N2Air
Figure S12: Variation of the lattice parameter c of Cu-SIP MOF with T.
92.20
92.40
92.60
92.80
93.00
93.20
93.40
93.60
93.80
94.00
94.20
94.40
300 310 320 330 340 350 360 370 380 390 400 410
T / K
beta
/°
N2Air
Figure S13: Variation of the lattice parameter of Cu-SIP MOF with T.

© 2009 Macmillan Publishers Limited. All rights reserved.
nature chemistry | www.nature.com/naturechemistry 12
Supplementary informationdoi: 10.1038/nchem.254
1310.00
1315.00
1320.00
1325.00
1330.00
1335.00
1340.00
1345.00
1350.00
1355.00
1360.00
300 310 320 330 340 350 360 370 380 390 400 410
T / K
V/Å
^3
N2Air
Figure S14: Variation of the cell volume of Cu-SIP MOF with T.
In contrast to the above, the lattice parameters of the dehydrated phase behave very
similarly in both experiments, under air and nitrogen. However, the behaviour of lattice
parameter a possibly indicates that some water initially remains trapped in the structure
and is then gradually released on further heating.

© 2009 Macmillan Publishers Limited. All rights reserved.
nature chemistry | www.nature.com/naturechemistry 13
Supplementary informationdoi: 10.1038/nchem.254
0.0
0.1
0.2
0.3
0.4
0.5
0.6
0.7
0.8
0.9
1.0
0 10 20 30 40 50 60 70
range No
Pha
sefra
ctio
n
% hydr% dehydr
Figure S15: Phase fraction of the hydrated and dehydrated phases as function of the
range number, experiment under N2.
0.0
0.1
0.2
0.3
0.4
0.5
0.6
0.7
0.8
0.9
1.0
0 10 20 30 40 50 60 70
range No
Pha
sefra
ctio
n
% hydr% dehydr
Figure S16: Phase fraction of the hydrated and dehydrated phases as function of the
range number, experiment under air.

© 2009 Macmillan Publishers Limited. All rights reserved.
nature chemistry | www.nature.com/naturechemistry 14
Supplementary informationdoi: 10.1038/nchem.254
S4 Cu-SIP-3-pyridine
It was obtained using Cu(NO3)2·3H2O (Alfa Aesar 98%) (2.42g), 5-sulfoisophthalic acid,
sodium salt (NaH2SIP) (Aldrich, 95%) (2.68g) and pyridine (Py) (Alfa Aesar 98%)(0.41g)
mixed with a 12mL EtOH/H2O solution (50:50) in a 50mL Teflon linned autoclave. The
mixture was heated at 383K for five days and then naturally cooled down to room
temperature. The yields were sonicated in a 100mL EtOH/H2O solution for 5 minutes,
then filtrated under vacuum. The blue crystals were collected and dried in air.
S5 TGA Analysis
303 400 500 600 700 800 900 100030
40
50
60
70
80
90
100
Wei
ghtl
osse
s/%
wt
Temperature/K
SO3
NO2
NO
SO2
Inte
nsity
Figure S17. Thermal gravimetric analysis of CuSIP-pyridine (weight loss:3.75%wt at <
473K. Sample is decomposed and releases species containing NO and NO at >566K).
S6 HRTEM
Experimental

© 2009 Macmillan Publishers Limited. All rights reserved.
nature chemistry | www.nature.com/naturechemistry 15
Supplementary informationdoi: 10.1038/nchem.254
HRTEM was performed using a JEOL JEM-2011 electron microscope operating at 200
kV, with a point resolution of 0.19 nm. Most MOF samples are electron beam sensitive.
This is why very few electron microscopic results from these materials were reported. In
our work, several operations were carried out in order to obtain reasonably good HRTEM
images. For example, the specimen was tried and inserted into the microscope, kept in the
vacuum system for one hour or so. The microscopic conditions were pre-tuned. The
orientation of the crystal was adjusted at low magnification. Images were recorded at
200,000× to 300,000× using a Gatan 794 CCD camera with a very low beam irradiation
dose, e.g., < 2 pA/cm2. This method we applied for many zeolites and other beam
sensitive materials [P. A. Wright, W. Z. Zhou, J. Perez-Pariente, M. Arranz, J. Am. Chem.
Soc. 127, 494–495 (2005); J. F. Geng, W. Z. Zhou, P. Skelton, W. B. Yue, I. A. Kinloch,
A. H. Windle, B. F. G. Johnson, J. Am. Chem. Soc. 130, 2527-2534 (2008)].
Without a cryo-specimen stage, even the above operations are performed, some samples
are still too sensitive to electron beam and HRTEM imaging is nearly impossible. It was
found that the specimen of Cu-SIP-3 was extremely unstable under the electron beam and
no HRTEM images were successfully obtained. However, when the sample was
dehydrated the water molecules were replaced by pyridine, the sample Cu-SIP-3-pyridine
was reasonably stable under the beam irradiation. Figure S18 shows HRTEM of this
sample viewed down the [-130] zone axis. On this projection, the structure shows Cu-rich
(dark) and pyridine (bright) alternative fringes along the [001] axis. In the area marked by
a circle, a defect was observed, which looks like an antiphase defect where the Cu-rich
and pyridine fringes change their locations. In other words, the structure shifts along the
[001] axis by a quarter unit cell dimension. This type of defect often implies some new
building units in the antiphase boundary. The boundary is not clear and does not show a
dark image contrast as we normally observed from antiphase defects [A. C. McLaughlin,
W. Z. Zhou, J. P. Attfield, A. N. Fitch, J. L. Tallon, Phys. Rev. B 60, 7512–7516 (1999)],
indicating that the antiphase defect plane is not parallel to the view direction.
Crystal defects often give us information about the crystal growth mechanism [W. Z.
Zhou, J. Mater. Chem., (2008) DOI: 10.1039/B808158A]. In other particles, we often
observe layered defects. Figure S19 is a typical image showing a large number of layered
defects. The lattice d-spacing measured from the image is 3.0 A, which can be indexed
S4 Cu-SIP-3-pyridine
It was obtained using Cu(NO3)2·3H2O (Alfa Aesar 98%) (2.42g), 5-sulfoisophthalic acid,
sodium salt (NaH2SIP) (Aldrich, 95%) (2.68g) and pyridine (Py) (Alfa Aesar 98%)(0.41g)
mixed with a 12mL EtOH/H2O solution (50:50) in a 50mL Teflon linned autoclave. The
mixture was heated at 383K for five days and then naturally cooled down to room
temperature. The yields were sonicated in a 100mL EtOH/H2O solution for 5 minutes,
then filtrated under vacuum. The blue crystals were collected and dried in air.
S5 TGA Analysis
303 400 500 600 700 800 900 100030
40
50
60
70
80
90
100
Wei
ghtl
osse
s/%
wt
Temperature/K
SO3
NO2
NO
SO2
Inte
nsity
Figure S17. Thermal gravimetric analysis of CuSIP-pyridine (weight loss:3.75%wt at <
473K. Sample is decomposed and releases species containing NO and NO at >566K).
S6 HRTEM
Experimental

© 2009 Macmillan Publishers Limited. All rights reserved.
nature chemistry | www.nature.com/naturechemistry 16
Supplementary informationdoi: 10.1038/nchem.254
onto (212) of the crystal structure. The atomic plan normal to the disordered direction can
be identified to be close to (010), which has an interplane angle with (212) of 80°. This
defect indicates that the crystal growth route follows a layer-by-layer manner along the
[010] direction. On the (010) plane, the structure shifting often takes place.
Figure S18. HRTEM image of Cu-SIP-3-pyridine viewed down the [-130] zone axis. The
botton right inset is a FFT diffraction pattern indexed to the unit cell determined by single
crystal XRD. The top left inset shows computer created image from the FFT diffraction
pattern by removing the noise. The area marked by the circle shows an antiphase-like
defect.
HRTEM was performed using a JEOL JEM-2011 electron microscope operating at 200
kV, with a point resolution of 0.19 nm. Most MOF samples are electron beam sensitive.
This is why very few electron microscopic results from these materials were reported. In
our work, several operations were carried out in order to obtain reasonably good HRTEM
images. For example, the specimen was tried and inserted into the microscope, kept in the
vacuum system for one hour or so. The microscopic conditions were pre-tuned. The
orientation of the crystal was adjusted at low magnification. Images were recorded at
200,000× to 300,000× using a Gatan 794 CCD camera with a very low beam irradiation
dose, e.g., < 2 pA/cm2. This method we applied for many zeolites and other beam
sensitive materials [P. A. Wright, W. Z. Zhou, J. Perez-Pariente, M. Arranz, J. Am. Chem.
Soc. 127, 494–495 (2005); J. F. Geng, W. Z. Zhou, P. Skelton, W. B. Yue, I. A. Kinloch,
A. H. Windle, B. F. G. Johnson, J. Am. Chem. Soc. 130, 2527-2534 (2008)].
Without a cryo-specimen stage, even the above operations are performed, some samples
are still too sensitive to electron beam and HRTEM imaging is nearly impossible. It was
found that the specimen of Cu-SIP-3 was extremely unstable under the electron beam and
no HRTEM images were successfully obtained. However, when the sample was
dehydrated the water molecules were replaced by pyridine, the sample Cu-SIP-3-pyridine
was reasonably stable under the beam irradiation. Figure S18 shows HRTEM of this
sample viewed down the [-130] zone axis. On this projection, the structure shows Cu-rich
(dark) and pyridine (bright) alternative fringes along the [001] axis. In the area marked by
a circle, a defect was observed, which looks like an antiphase defect where the Cu-rich
and pyridine fringes change their locations. In other words, the structure shifts along the
[001] axis by a quarter unit cell dimension. This type of defect often implies some new
building units in the antiphase boundary. The boundary is not clear and does not show a
dark image contrast as we normally observed from antiphase defects [A. C. McLaughlin,
W. Z. Zhou, J. P. Attfield, A. N. Fitch, J. L. Tallon, Phys. Rev. B 60, 7512–7516 (1999)],
indicating that the antiphase defect plane is not parallel to the view direction.
Crystal defects often give us information about the crystal growth mechanism [W. Z.
Zhou, J. Mater. Chem., (2008) DOI: 10.1039/B808158A]. In other particles, we often
observe layered defects. Figure S19 is a typical image showing a large number of layered
defects. The lattice d-spacing measured from the image is 3.0 A, which can be indexed

© 2009 Macmillan Publishers Limited. All rights reserved.
nature chemistry | www.nature.com/naturechemistry 17
Supplementary informationdoi: 10.1038/nchem.254
Figure S19 HRTEM image of Cu-SIP-3-pyridine showing a large number of layereddefects along the [010] axis.
Figure S19 HRTEM image of Cu-SIP-3-pyridine showing a large number of layereddefects along the [010] axis.