Chemical Transparency and Footprinting: Evolution, Key Players and Hot Trends
76
-
Upload
sustainable-brands -
Category
Business
-
view
85 -
download
0
Transcript of Chemical Transparency and Footprinting: Evolution, Key Players and Hot Trends


The Evolution of In-House Sustainability Data Management: A Manufacturer’s Journey
Kellie Ballew
Sr. Product Sustainability Manager

• Wholly owned subsidiary of Berkshire-Hathaway, Inc.
• World’s largest carpet manufacturer
• Global provider of carpet, rugs, hardwood, laminate, tile & stone, resilient, turf, and pad products
• Headquartered in Dalton, Georgia
• Founded in 1967
• Annual revenue ~ $5 billion
• Greater than 23,000 associates globally

•Customer Expectations
•Alignment With Company Values
•Regulatory Compliance
•Green Building Certification Programs
•Voluntary Green Product Certification Schemes

“I am working on a LEED v4 project, so how do your flooring products contribute?”
THE SWEET SPOT: Someone cares what chemicals are in building products.

THE SWEETER SPOT:Someone cares how building product chemistry impacts occupant wellness.

Programs that restrict certain chemicals in the built environment.

Product CertificationsPRODUCT CERTIFICATIONSGREEN BUILDING PROGRAM CONTRIBUTION

9

Our Client’s Global Ask
X
Y
Z
α
β
γ

Product CertificationsPRODUCT CERTIFICATIONS
Manufacturer Navigation

How It’s Made

Overview: Identify Goals & Values
Generic Carpet Tile PFD

Overview: Identify Goals & Values
Generic Carpet Tile PFD


Overview: Identify Goals & Values
Generic Carpet Tile Chemical Tree (Excerpted)

FlooringPortfolio Management

Evolution of Tools

Evolution of Tools

Evolution of Tools
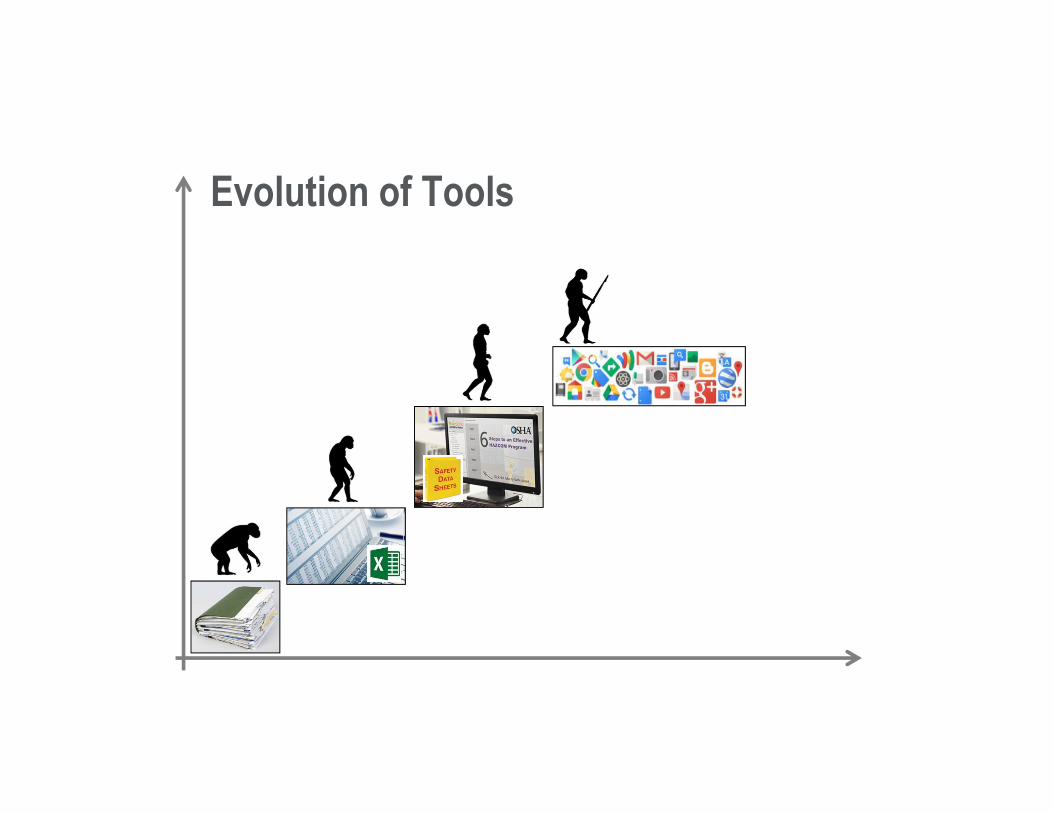
Evolution of Tools
Evolution of Tools

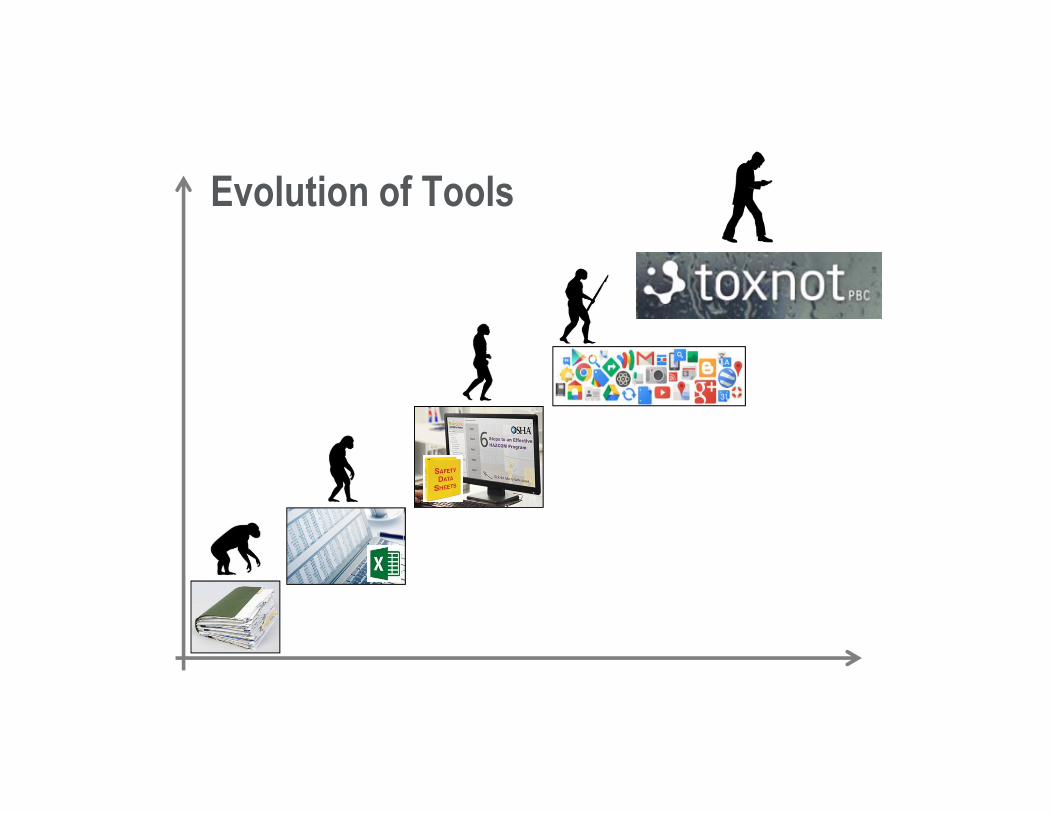
Why toxnot?

� Consistent Platform for BoM Management Across Shaw Product Platforms
� Extensive Chemical Databaseo GreenScreeno C2C Assessmento Authoritative Listso Regulatory Flaggingo Shaw RSL*
� Hazard Screening – Internal RM Qualifications
� Report Generationo HPD 2.1o Declare Labelo Other
� Customization & Support from toxnot

Flexibility
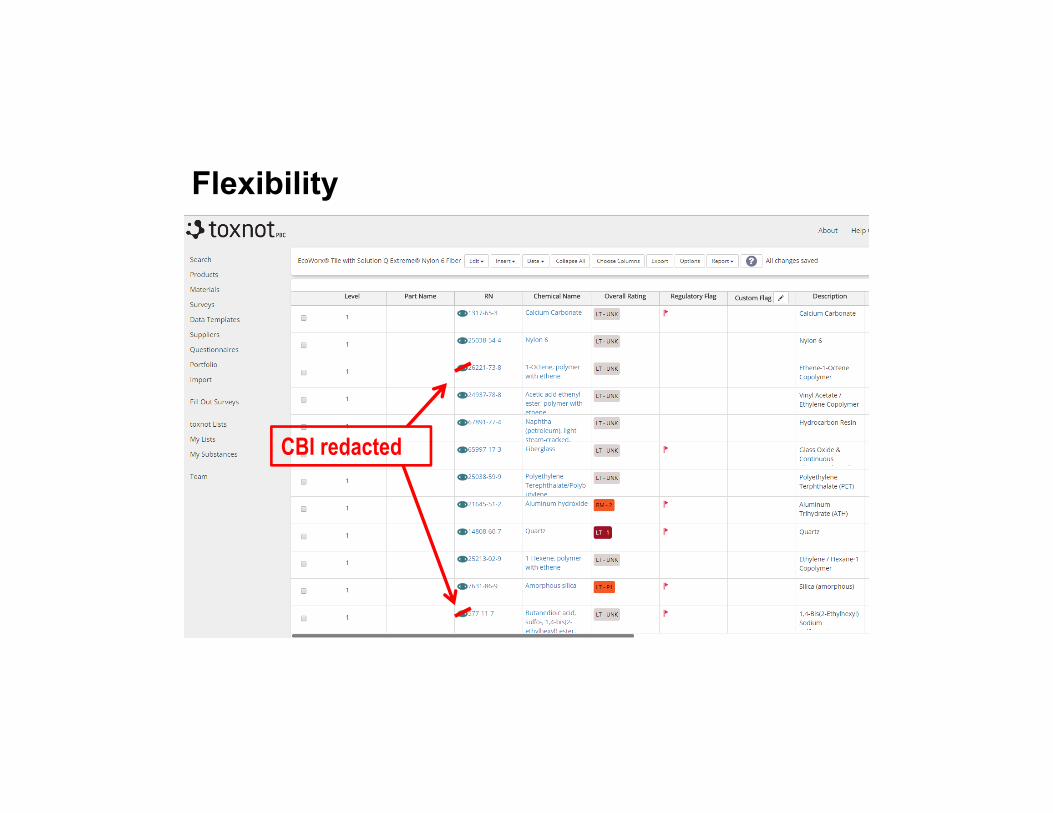
Flexibility
CBI redacted

Report Generation From The Same Dataset!

What’s Next For Shaw?
�Build More
�Collaboration with C2C
�Suppliers via toxnot


Toxnot helps product manufacturers design and sell better products
Chemicals
Hazard
Database
SupplyChain
Data
Collection
Product
Reporting
Engine
2
UnderstandCurrent
SupplyChainRisks
BeyondLegal
Assurances
OptimizeChemicalsto
Design“Eco”Products
andRemoveRisks
ShowProgress,Drive
Sales,Reduce
ComplianceCosts

Chemicals Hazard Data and Reporting
2017 Trends
3

What we have
Diagram originally created by Matt
Thurston, REI, with further modifications
from industry colleagues.
The Textile & Textile Chemistry Supply “Network”
Rev. 4.6
Materials “Converter”
Could be any combination of organizations
upstream in the supply chain to
produce finished materials
Textile Supplier Tiering
BrandsRetailers
Large retailer w/ private brand(s)
Brands with Strong Retail
x100s
Agents, Trading
Companies & Licensees
mega trading
company
Finished Goods Assemblers
(+ subcontract)
mega cut/sew
Tier 1
Weavers, Knitters &
Nonwovens
Dyers, Printers,
Finishers, & Laminators
Tier 2
mega factory complex from greige to garment
Fibers, Feathers/ Down Processing, Spinners, Film &
Tape Mfg.
Tier 3
Raw Material Suppliers
Tier 4
Polymers, Fertilizers,
Surfactants, Pesticides, etc.
Masterbatches, Polymers, Lubricants,
Dyes, Surfactants, Auxiliaries, etc.
Sizing agents, Preparation agents, etc.
Dyes, Auxiliaries, Carriers,
Coatings, Inks, Repellents, etc.
Detergents, Conditioning agents,
Printing Inks, Treatments, etc.
Chemical “Converter”
and/or “Trader”
Chemical SupplierTieringCH1
Chemical formulator/
blender/mixerCH2
ChemicalSynthesis and
PolymerizationCH3
Raw chemical supplierCH4
agriculture / ores / minerals (as chem
istry feedstock)
fossil fuels
(a) (b)

Supplier Buyer InteractionsKey Trend:
Transparency futureproofs corporate chemicals strategy
5

A fork in the road
Compliance Management:• Conforms to
Specification• Legal Requirements• Liability Transfer
Product Management• Defined Chemistry• Data Requirements• Shared Liability• Requires Greater
Transparency
FUTURE

Transparency isn’t perfect

Industry Sector Trends
transparency
statusquo
ecodesigncompliance
ConsumerPackagedGoods
Apparel

The Product Reporting Ecosystem
Key Trend: The unbundling of methods and tools
will enable scaling up
9
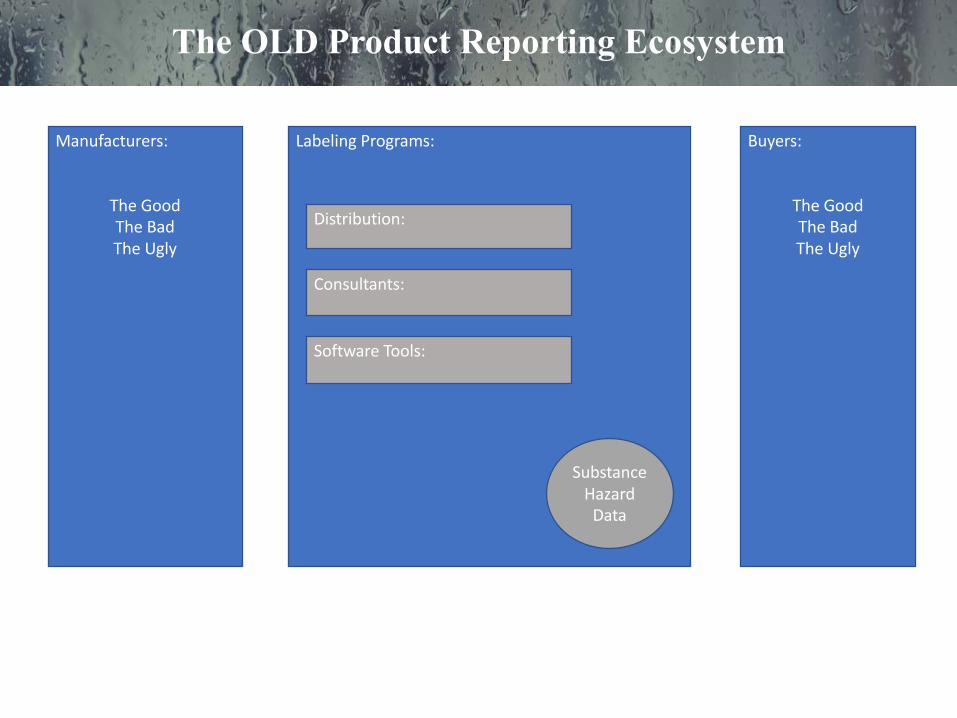
LabelingPrograms:
The OLD Product Reporting Ecosystem
Manufacturers:
TheGood
TheBad
TheUgly
Distribution:
SoftwareTools:
Consultants:
Substance
Hazard
Data
Buyers:
TheGood
TheBad
TheUgly

The NEW Product Reporting Ecosystem
Manufacturers:
TheGood
TheBad
TheUgly
Distribution:
MindfulMaterials
Ecomedes
Giga
UL
HPDDatabase
DeclareDatabase
C2CDatabase
others
Methods:
HPD
Declare
C2C
LEEDManf.Inv.
Others
ProductChemicalsDataSolutions:
toxnot,theWercs,Scivera,iPoint,Actio,PLM
Consultants:
Lots
Substance
Hazard
Data
Buyers:
TheGood
TheBad
TheUgly

Why the focus on Substance Data Matters
12
HPDLEEDManf.Inventory Declare
SubstanceData
(BOM)
Request1 Request3Request2
MSDS
(Minimum
Disclosure)
LEEDManf.Inventory
HPD
Declare

Supplier Data CollectionKey Trend:
Disclosure control builds trust

Chart a middle path
• Nobody knows what’s in the product
• Somebody knows what’s in the product
• Somebody cares what’s in the product
• Everybody knows what’s in the product
14
TheSweetSpot

Disclosure Example
15
SupplierView RequestorView

Key Trends
Supplier Buyer Interactions• Key Trend: Transparency futureproofs corporate chemicals strategy
The Product Reporting Ecosystem• Key Trend: The unbundling of methods and tools will enable scaling up
Supplier Data Collection• Key Trend: Disclosure control builds trust
16

The Business Case for Sustainability
Tim Greiner, Pure Strategies
Sustainable Brands New Metrics November, 2017

Pure Strategies Snapshot
Sustainability experts since 1998
Highly experienced team
Long term clients including notable leaders
2

We supplement our client services with original research that uncovers best practices, the business case, and trends
3
Reports on sustainability programs, food industry, chemicals management,
product sustainability
Over 400 global companies interviewed
Example finding: Billions realized in one year by
sustainability programs at 150 companies

4
Whatisthebusinesscaseforsustainability?

A range of benefits can be earned from product sustainability programs

Unpacking the business case
Employees
Operations & Supply Chain
Materials
• 25-50% lower average turnover rate • 13% greater productivity • ~5% lower wage accepted by workers
• 5-15% lower manufacturing cost • 9-16% lower supply chain cost
• 10-25% lower material cost

Unpacking the business case
Regulation
Operations & Supply
Chain
Reputation
• Avoid fines and regulatory costs
• Reduce systematic risk by 4%
• Reduce share price volatility 2-50%
• Reduce cost of debt 40% or more

Unpacking the business case
Innovation
Revenue
Market Value
• 6x growth rate from sustainable products and services
• 5-20% sales uplift • Up to a 20% price premium • Customer loyalty
• Up to a 6% increase share price • 10-25% increase in brand value

Unpacking the business case
Innovation
Revenue
Market Value
Regulation
Operations & Supply
Chain
Reputation
Employees
Operations & Supply Chain
Materials

References
1. CDP. Climate Action and Profitability. 2014. 2. The Conference Board and IRRC Institute. Driving Revenue Growth:
through sustainable products and services. 2015. 3. Hainmueller, J. and M.J. Hiscox. The Socially Conscious Consumer?
Field Experimental Tests of Consumer Support for Fair Labor Standards – Working Paper from Massachusetts Institute of Technology Political Science Department. 2015.
4. Hainmueller, J., M.J. Hiscox, and S. Sequeira. Consumer Demand for the Fair Trade Label: Evidence from a Multi-Store Field Experiment - Working Paper from Massachusetts Institute of Technology Political Science Department. . 2014.
5. Henderson, R. Making the Business Case for Environmental Sustainability – Working Paper from Harvard Business School. 2015.
6. Project ROI. Defining the competitive and financial advantages of corporate responsibility and sustainability. 2015.
7. World Economic Forum. Beyond Supply Chains Empowering Responsible Value Chains. 2015.
MikeSchade,MindtheStoreCampaignDirectorSaferChemicals,HealthyFamilies

NEW2017reportcardonretailersreleasedtoday

ReportPublishedOnNewWebsite:RetailerReportCard.com

MethodologyandMetricsforReportCard
• Evaluationof30retailersbasedonpubliclyavailableinformation,across11consumerproductsectors
• 14keymetrics,harmonizedw/CFP• 9primary:policy,oversight,
accountability,disclosure,action,saferalternatives,transparency,chemicalfootprint,3rd partystandards
• 5extracredit:jointannouncement,continuousimprovement,saferproducts,collaboration,impactinvestment
• 135possiblenumberpointsandcorrespondinglettergrades


FiveKeyFindings.

HighestandLowestScoringRetailers

RecommendationsforRetailers

Thankyou.VisitRetailerReportCard.com to
readthebrandnewreport
Getintouch:[email protected]
@Mike_Schade@SaferChemicals
Followsthereportreleaseat#MindTheStore

1
BizNGO Annual Meeting
December 8, 2014
Sally Edwards Lowell Center for
Sustainable Production,
UMASS Lowell
Founders:• CleanProduc1onAc1on• PureStrategies• LowellCenterforSustainableProduc1on
ChemicalFootprintProject

CFP Assessment Framework
2
AssessmentTool:20Ques1ons-100pts

Responders to the 2016 Survey
3

Value of CFP
4
• Common language • Quantitative metric to
measure progress • Gap analysis • Alignment with leading
business practices & investors
Chemical Footprint: the total mass of chemicals of high concern (CoHCs) in products sold by a company, used in its manufacturing operations and by its suppliers, and contained in packaging. 5
a project of Clean Production Action

CFP survey is free and available
6

Timeline
November 1, 2017: CFP Survey opened
December 7, 2017: CFP Workshop (Boston)
January 31, 2018: CFP Survey closed
June 2018: CFP Annual Report released
chemicalfootprint.org
7