Chemical Sensors for the New Sampling/Sensor Initiative
18
Chemical Sensors for the New Sampling/Sensor Initiative Nelson Lytle Honeywell International, Inc. January 11, 2005
-
Upload
lewis-whitehead -
Category
Documents
-
view
39 -
download
0
description
Chemical Sensors for the New Sampling/Sensor Initiative. Nelson Lytle Honeywell International, Inc. January 11, 2005. Objectives. Illustrate sensor/composition/property measurement concept with examples Discuss potential NeSSI sensor cluster applications - PowerPoint PPT Presentation
Transcript of Chemical Sensors for the New Sampling/Sensor Initiative

Chemical Sensors for the NewSampling/Sensor Initiative
Nelson Lytle
Honeywell International, Inc.
January 11, 2005

Objectives
• Illustrate sensor/composition/property measurement concept with examples
• Discuss potential NeSSI sensor cluster applications
• Invite sensor developers to participate• Increase the applicability of NeSSI as a
sensor platform• Get tools into chemist’s and engineer’s hands

The Ten NeedsChemical/Composition/Property
• Bio Assay• Chemical Composition• Cleaning Validation• Coating Consistency• Mixing Efficiency
• Moisture Concentration• Particle Sizing• Vapor Characterization• Viscosity/Rheology• Waste Minimization
Mel Koch, CPAC
Major Goals of NeSSI
• Modular, miniature, smart sample system• Based on ISA SP76 standard• Field mounted• Open connectivity for communications• Integration of sample system with
physical/chemical sensors• Technology bridge to process for micro-
analytical devices

NeSSI: Enabler for Micro Analytical(the “rail” concept)
Standard Mechanical Interface “Rail”
Standard Electrical (Digital) Interface “Rail”
Anyone’s Sensor Anyone’s Actuator
SAM*
Standard “hockey- puck
PC”P
V
*Sensor/Actuator Manager
Standard“connectivity”
Desirable Properties Sensor Wish List
• Global electrical (hazardous) certifications• Plug & Play (self-identifies)• Robust (> 99.9% uptime)• Self checking/calibrating/correcting• Low cost (<$5K)• Suitable for operating as a Functional Clusters• Gas and/or Liquid Service • Fast (continuous) Response (< 10 seconds)• Physically small in size • Low Power (for intrinsic safe operation)• Low/No Utility or Reagent Usage
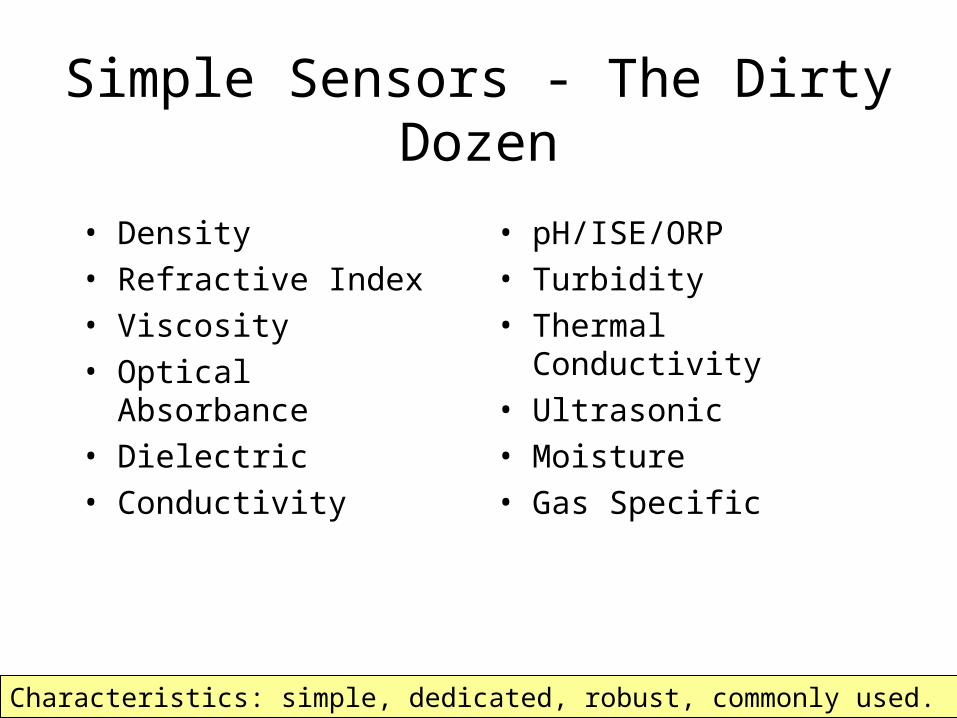
Simple Sensors - The Dirty Dozen
• Density• Refractive Index• Viscosity• Optical Absorbance• Dielectric• Conductivity
• pH/ISE/ORP• Turbidity• Thermal Conductivity• Ultrasonic• Moisture• Gas Specific
Characteristics: simple, dedicated, robust, commonly used.
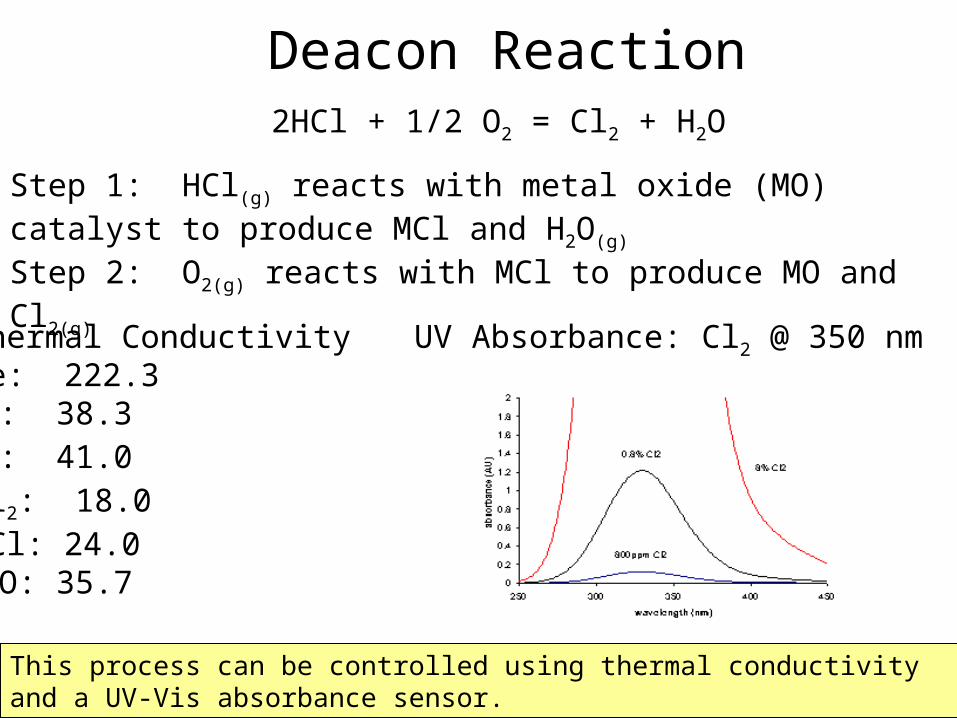
Deacon Reaction2HCl + 1/2 O2 = Cl2 + H2O
Step 1: HCl(g) reacts with metal oxide (MO) catalyst to produce MCl and H2O(g)
Step 2: O2(g) reacts with MCl to produce MO and Cl2(g)
Thermal ConductivityHe: 222.3N2: 38.3O2: 41.0Cl2: 18.0HCl: 24.0H2O: 35.7
UV Absorbance: Cl2 @ 350 nm
This process can be controlled using thermal conductivity and a UV-Vis absorbance sensor.
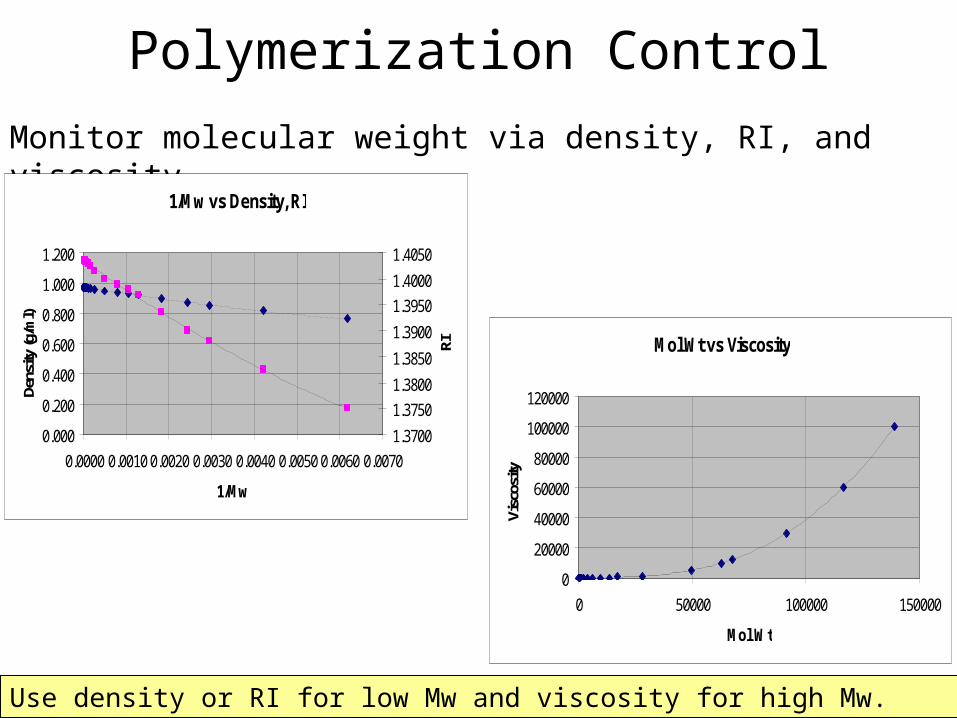
Polymerization Control
Monitor molecular weight via density, RI, and viscosity.
Use density or RI for low Mw and viscosity for high Mw.
Mol Wt vs Viscosity
0
20000
40000
60000
80000
100000
120000
0 50000 100000 150000
Mol Wt
Visc
osity
1/Mw vs Density, RI
0.000
0.200
0.400
0.600
0.800
1.000
1.200
0.0000 0.0010 0.0020 0.0030 0.0040 0.0050 0.0060 0.0070
1/Mw
Dens
ity (g
/ml)
1.3700
1.3750
1.3800
1.3850
1.3900
1.3950
1.4000
1.4050
RI

Unsaturation in Edible Oils
NIR absorbance can be used to monitor unsaturation in edible oils. But so can density and RI.
Iodine Value vs RI and Density
1.466
1.468
1.47
1.472
1.474
1.476
80 90 100 110 120 130 140 150
Iodine Value
RI
0.9080
0.9100
0.9120
0.9140
0.9160
0.9180
0.9200
0.9220
Den
sity
Iodine Value vs 889 and 930 nm Absorbance
0.380
0.390
0.400
0.410
0.420
0.430
0.440
0.450
80 90 100 110 120 130 140 150
Iodine Value
889
nm
Ab
s
0.100
0.110
0.120
0.130
0.140
0.150
930
nm
Ab
s
0
.1
.2
.3
.4
.5
750 800 850 900 950 1000 1050 1100
Counts / Nanometers Overlay X-Zoom CURSOR
File # 1 = 1544D2 6/21/2004 7:20 PM Res=0

Edible Oil Classification
Use density, RI, viscosity, optical absorbance to classify oils.
-0.5
0
0.5
-4 -3 -2 -1 0 1 2 3 4 pca eo 7-19-04, X-expl: 98%,2%
soybean
olive
corn w
peanut
canola csafflower
sunflower
corn m
canola m
olive ev
soy/canola
corn/canola
PC1
PC2 Scores
-0.2
0
0.2
0.4
0.6
0.8
1.0
-0.4 -0.3 -0.2 -0.1 0 0.1 0.2 0.3 0.4 pca eo 7-19-04, X-expl: 98%,2%
iodine value889.92 abs
930.98 abs
viscosity
RI
density
PC1
PC2 X-loadings
Simple sensors can monitor blending and determine quality of edible oils.
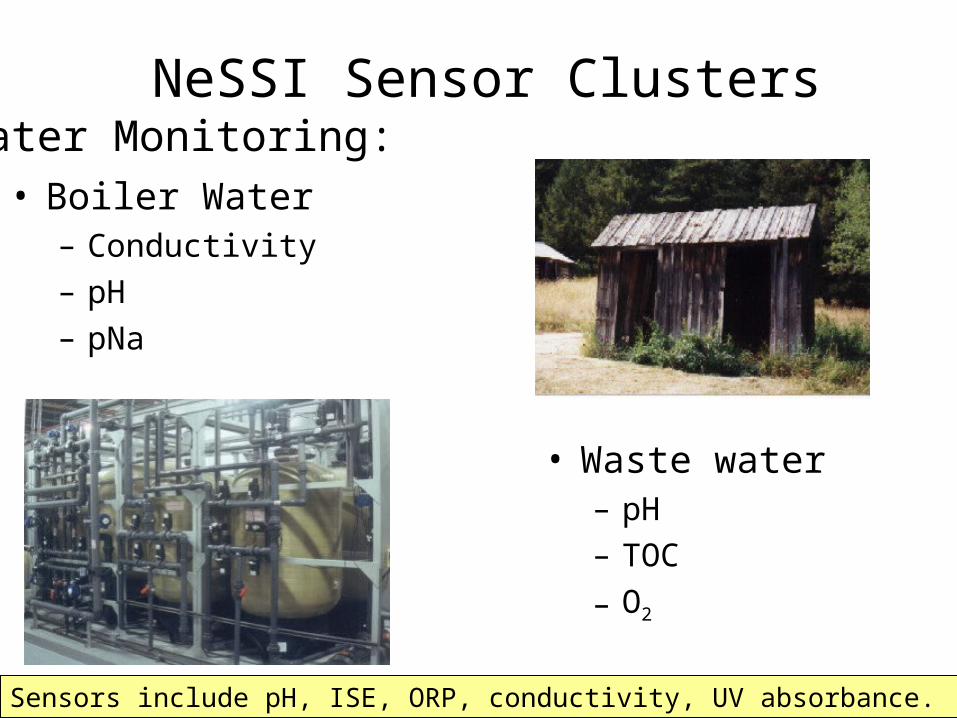
NeSSI Sensor Clusters
• Boiler Water– Conductivity– pH– pNa
• Waste water– pH– TOC
– O2
Sensors include pH, ISE, ORP, conductivity, UV absorbance.
Water Monitoring:
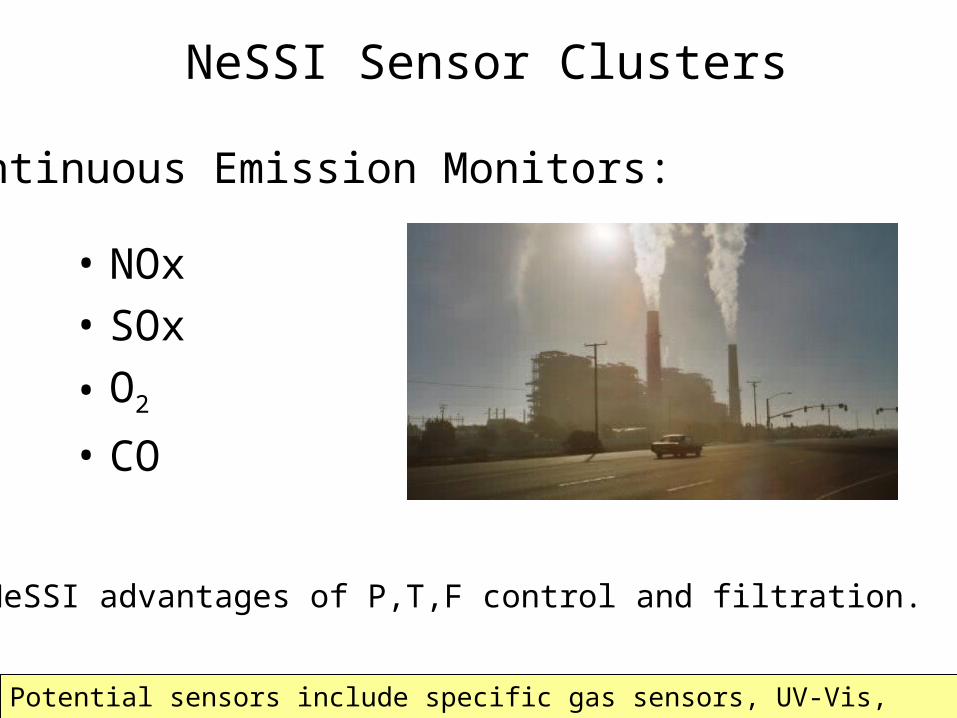
NeSSI Sensor Clusters
• NOx
• SOx
• O2
• CO
Potential sensors include specific gas sensors, UV-Vis, and IR.
Continuous Emission Monitors:
Use NeSSI advantages of P,T,F control and filtration.

Jet Fuel Properties:
• Density• Flash point• Freezing point• Fuel system icing
inhibitor• Aromatics
Sensors include density, RI, turbidity, NIR/IR absorbance.
NeSSI Sensor Clusters
What am I proposing?
• Simple sensors provide a way to perform analyses that are useful for process control and optimization
• These are measurements that are being used today
• Simply adapt them to the NeSSI standard

Conclusion
• I hope that I have made you aware of the opportunity to use simple, robust sensors to make chemical and property measurements.
• I hope to motivate sensor developers to make sensors available that meet the NeSSI standard.

Everything is in place to make it happen.
Come on in … the water’s fine.

FIN