Chemical sensors (Chemosensors) “A chemosensor is molecule … lezione... · Chemical sensors...
67
Chemical sensors (Chemosensors) “A chemosensor is molecule of abiotic origin that signals the presence of matter or energy” (A. W. Czarnick) Working mode UNITA’ DI SEGNALAZIONE SITO DI RICONOSCIMENTO ANALITA SEGNALE UNITA’ DI TRASDUZIONE • A receptor capable to selectively bind the analyte • A site with some tunable moelcular property • A transduction mechanism that converts the recongintion into a modification of the tunable property signal In principle, any measurable molecular property can be used
Transcript of Chemical sensors (Chemosensors) “A chemosensor is molecule … lezione... · Chemical sensors...

Chemical sensors (Chemosensors)“A chemosensor is molecule of abiotic origin that signals the presence of matter or energy”
(A. W. Czarnick)
Working mode
UNITA’ DI SEGNALAZIONE
SITO DIRICONOSCIMENTO
ANALITASEGNALE
UNITA’ DI TRASDUZIONE
• A receptor capable to selectively bind the analyte• A site with some tunable moelcular property• A transduction mechanism that converts the recongintion into a
modification of the tunable property signal
In principle, any measurable molecular property can be used

Chemical sensors (Chemosensors)
Fluorescent chemosensorIt is a chemosensor that generate a fluorescence signal
Why fluorescence?
Sensitivity (even single molecule detection is possible) High spatial and temporal resolution Low cost and easily performed instrumentations
Most used:• Redox potential• Absorbance (color)• Luminescence (fluorescence)• NMR relaxation times (recent)
Sensor: device that interacts reversibly with an analyte with measurable signal generationA chemosensor is not a sensor, strictly speaking, as it is not a device, but it can be the active part of the device.

Which signal do we measure with fluorescent chemosensors? Fluorescence quenching (ON-OFF) Fluorescence increase (OFF-ON) Emission spectrum shape modification (ratiometric) Life-time Emission anisotropy
Photoluminescence
Emission of photons by molecules as a consequence of electronic transitions

INTRINSECO
On Off
STRATEGIE PER LA PROGETTAZIONE DI UN SENSORE SUPRAMOLECOLARE
CONIUGATO
AUTOASSEMBLATO +

Esempi di sensori intrinseci
O
N
O
OO
N N
COO-
COO--OOCCOO-
COO-
N
N
H3CO
O N
H3C
COO-
COO-
COO-
COO-
FURA-2(Tsien 1980)
Quin-2(Tsien 1985)
Ca2+
COO-
NH
NO COO-
COO-COO-
Mag-Indo-1(London 1989)
Mg2+
O
N
O
N
O OMeOMe
OO
CC O
O
OO
C
C
O
O
O
O
(Tsien 1989)
Na+

Fura-2
R. Y. Tsien, J. Biol. Chem. 1985, 6, 3440
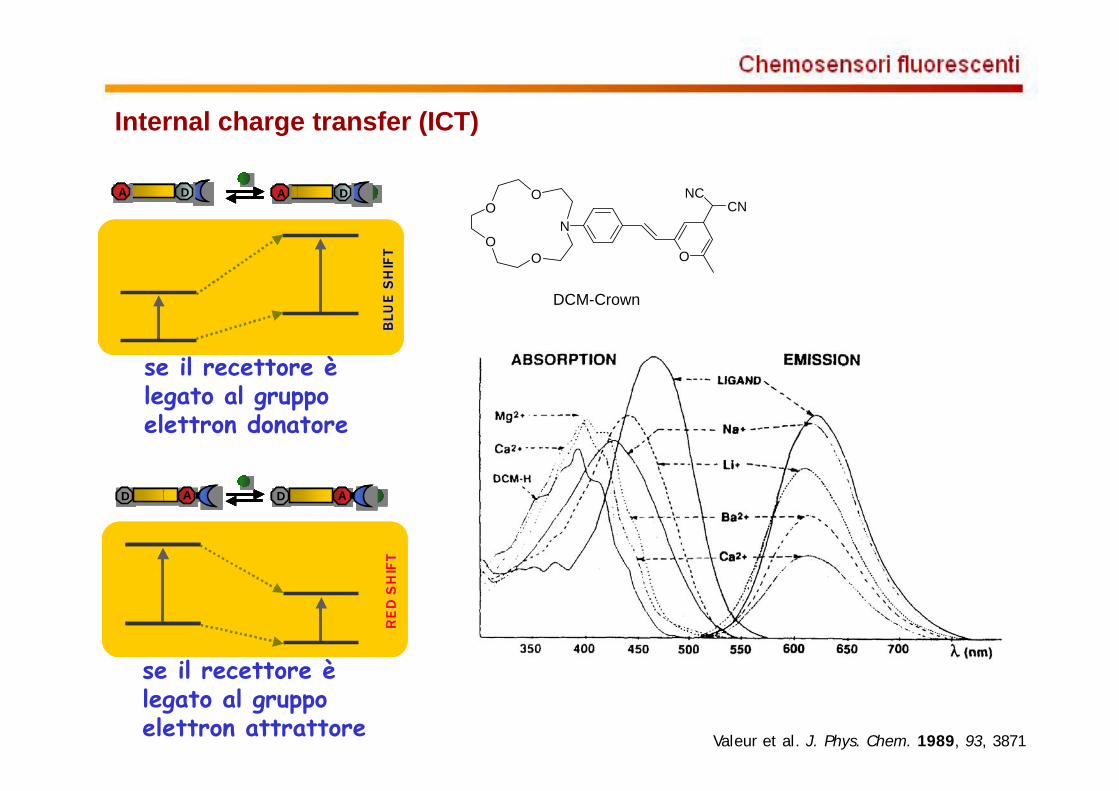
Internal charge transfer (ICT)
A D A D
BLU
E S
HIF
TB
LUE
SH
IFT
A D A DA DA D A DA D
BLU
E S
HIF
TB
LUE
SH
IFT
RE
D S
HIF
TR
ED
SH
IFT
D A D A
RE
D S
HIF
TR
ED
SH
IFT
D A D AD A D A
N
O
OO
O
O
NCCN
DCM-Crown
Valeur et al. J. Phys. Chem. 1989, 93, 3871
se il recettore è legato al gruppo elettron donatore
se il recettore è legato al gruppo elettron attrattore

Intrinsic chemosensor
Advantage: the direct interaction between the bound substrate and the fluorophore automatically leads to the modification of the emission properties. The transduction mechanism is somehow intrinsic to the chemosensor structure.
Design: the donor atoms for the complexation of the substrate are part of the fluorophore system, therefore the analyte binds to a receptor subsite which is an integrated part of the fluorophore aromatic system.
Weakness: rigidity of the design. They have to be designed around the substrate and any modification of the binding site may results in a change of the emission properties of the dye and vice versa.

INTRINSECO
On Off
CONIUGATO
AUTOASSEMBLATO +
STRATEGIE PER LA PROGETTAZIONE DI UN SENSORE SUPRAMOLECOLARE

Photoinduced electron transfer (PET)
LUMO
HO MO
excitedacceptor
donor
PE T
acceptorradical anion
donorradical cation
Back E TLUMO
HO MO
excitedacceptor
donor
PE T
acceptorradical anion
donorradical cation
Back E T
D
h h h’
D
e-
DD
h h h’
DDD
e-
PE T
LUMO
HO MO
fluorophore free receptor fluorophore
boundreceptor
recettore “libero” recettore “complessato”

Conjugate chemosensors: ET and PET
PET
LUMO
HOMO
fluorophorenitrogenlone pair fluorophore
free receptor
nitrogenlone pair
bound receptor
PETLUMO
HOMO
fluorophoreCu 2+
fluorophorez2
Cu 2+
x2 - y2
BeT
CH2
NH HN
OO
NH2H2N
2H+
CH2
N N
OO
H2NNH2
Cu2+
Cu2+, 2OH-
Active substrates
Fabbrizzi et al. Chem Eur. J. 1996, 2, 75.
Silent substrates
O O
N
O
O
O
N
N
N
N
De Silva, 1986 Czarnik Acc. Chem. Res., 1994, 27, 302-308
Zn2+K+

NH2
OCH3
H2N
OCH3
NH2
H3CO
NH2
OCH3
H2N
OCH3
NH3
H3CO
NH2
OCH3
HN
OCH3
NH3
H3CO
NH2
OCH3
HN
OCH3
NH2
H3CO
pK1 = 5.2 pK2 = 6.9 pK3 = 9.3
0
200
400
600
800
1000
4 5 6 7 8 9 10 11 12pH
I of f
luor
esce
nce
-0.2
0.0
0.2
0.4
0.6
0.8
1.0
% o
f spe
cies
LHL
H2L
H3L
ATMCA = 1 M, ex = 368 nm, em = 415 nm
LH3L H2L H1L
HOMO
E
LUMO
excitedfluorophore
boundreceptor
hvFlu
HOMO
E
LUMO
excitedfluorophore
freereceptor
PET
HOMOHOMO
Conjugate chemosensors: ATMCA (pH)

NH2
OCH3
H2N
OCH3
NH3
H3CO
pH = 5NH
OCH3
NH
OCH3
NH
H3CO
Cu2+
Cu2+
[metal ion], M
0
20
40
60
80
100
0.00E+00 5.00E-07 1.00E-06 1.50E-06 2.00E-06 2.50E-06
I/I0 (
%, 4
15 n
m)
Cu(II)Co(II)Ni(II)Hg(II)Zn(II)Fe(II)Cd(II)Mn(II)Pb(II)Cu(II) + all
[ATMCA] = 1 M
Conjugate chemosensors: ATMCA (Cu2+)
logKapp = 8.0

0
100
200
300
400
500
600
0.00E+00 4.00E-07 8.00E-07 1.20E-06 1.60E-06 2.00E-06
[metal ion], M
I (41
5nm
)
Ni(II)Zn(II)Cu(II)Co(II)Cd(II)Fe(II)Hg(II)Pb(II)Mn(II)
pH = 7Zn2+NH
OCH3
NH
OCH3
NH
H3CO
Zn2+
NH2
OCH3
HN
OCH3
NH3
H3CO
[ATMCA] = 1 M
Conjugate chemosensors: ATMCA (Zn2+)
logKapp = 7.0

0
100
200
300
400
500
600
0 0.25 0.5 0.75 1 1.25 1.5 1.75 2
n
I
Zn(II)Zn(II) +Cu(II)Zn(II) +Co(II)Zn(II) +Hg(II)
0
0.2
0.4
0.6
0.8
1
1.2
0 0.25 0.5 0.75 1 1.25 1.5 1.75 2
n
I/I(m
ax)
Zn(II)
Zn(II) + Ni(II)Zn(II) + Fe(II)
Zn(II) + Mn(II)Zn(II) + Pb(II)
Zn(II) + Ni, Fe, Pb, Mn
[ATMCA] = 1 M
[ATMCA] = 1 M
Conjugate chemosensors: ATMCA (Zn2+)

Applicazione biomedica di sensori intrinseci
J.K. Tusa, H. He, JACS,

Formazione di eccimeri
M M*+ E*
OOO
O
O OOO
CO2Et
CO2Et
Na+ OOO
O
O OOO
OOEt
OEtO
excimer emission
monomer emission
calix[4]arene calix[4]arene
Jin et al. J. Chem. Soc., Chem. Commun., 1992, 499.
La complessazione del catione provoca una variazione conformazionale

Altri effetti dovuti alla variazione della conformazione
O O
O
OO
Ca2+
O O
O
OO
Ca2+
Finney et al. J. Am. Chem. Soc. 2001, 123, 1260.
FAM
TAMRA
K+
FAM
TAMRA
G
G
G
G
G
G
G
G
G
G
G
G
K+
K+
h
random coil
h
FRET
tetraplexstructure
O O-O
CO2-
HN
OOP O-OOGGGTTAGGGTTAGGGTTAGGG
P-OO
OHN
OH
O
O
CO2-
O N(CH3)2(H3C)2N
FAM(donor)
TAMRA(acceptor)
Takenaka et al. J. Am. Chem. Soc. 2002, 124, 14286.
increasing K+
concentration
planarizzazione del diarile
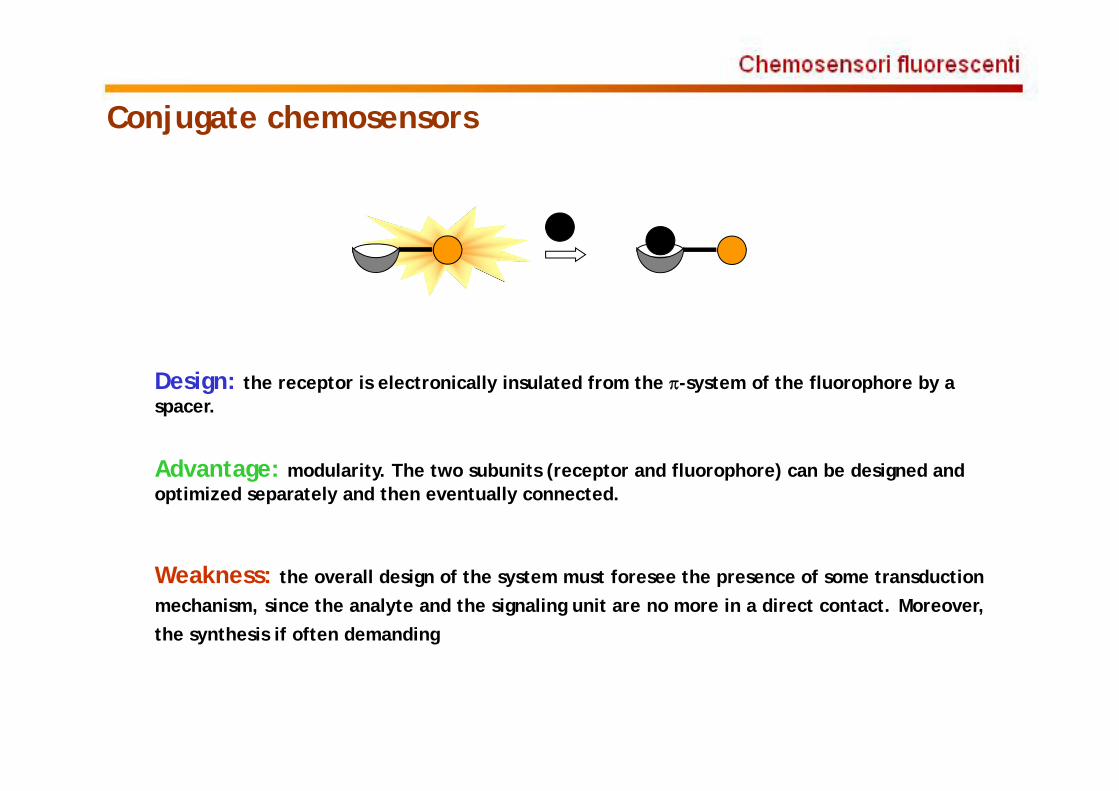
Conjugate chemosensors
Advantage: modularity. The two subunits (receptor and fluorophore) can be designed and optimized separately and then eventually connected.
Design: the receptor is electronically insulated from the -system of the fluorophore by a spacer.
Weakness: the overall design of the system must foresee the presence of some transduction mechanism, since the analyte and the signaling unit are no more in a direct contact. Moreover, the synthesis if often demanding

INTRINSECO
On Off
CONIUGATO
AUTOASSEMBLATO +
STRATEGIE PER LA PROGETTAZIONE DI UN SENSORE SUPRAMOLECOLARE

NH
OCH3
NH
OCH3
NH
H3CO
Zn2+
NH
OCH3
NH
OCH3
NH
H3CO
Zn2+
S
S
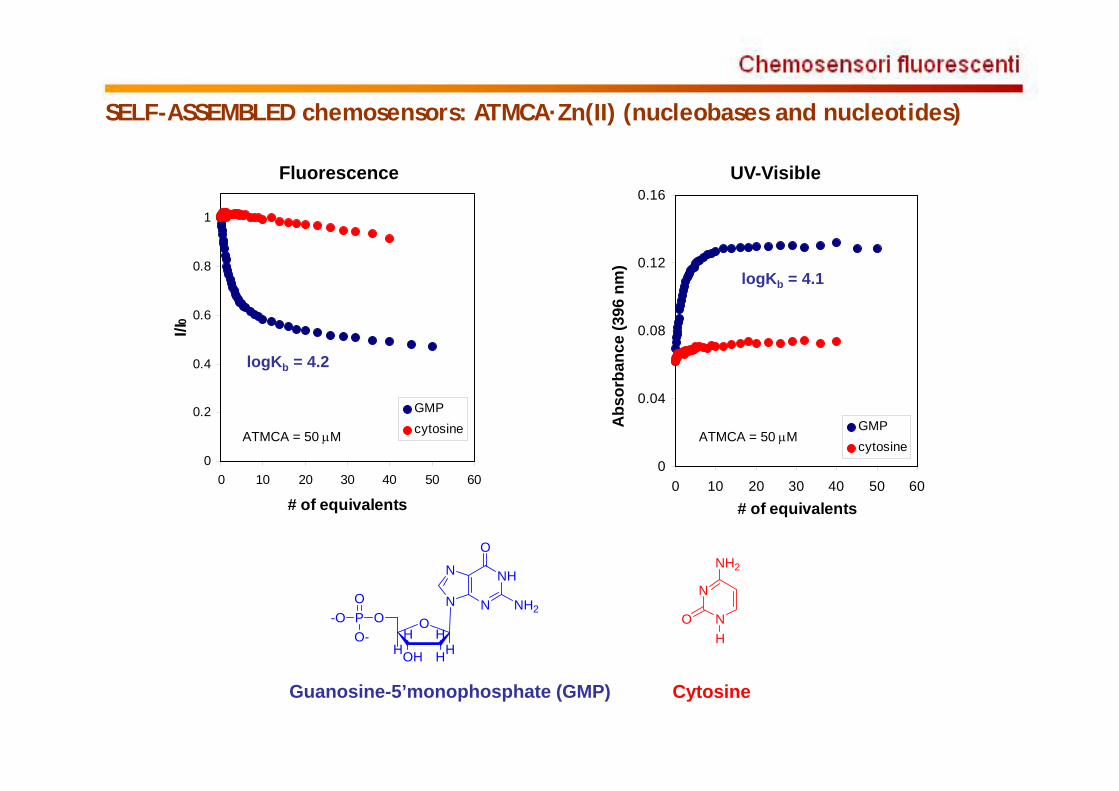
A organic substrate (anions) may bind to the Zn(II) ions forming a ternary complex.If the substrate is able to interact with the fluorophore this may result in thequenching of the fluorescence emission.
pH = 7
SELF-ASSEMBLED chemosensors: ATMCA·Zn(II) (organic anions)
0
0.04
0.08
0.12
0.16
0 10 20 30 40 50 60# of equivalents
Abs
orba
nce
(396
nm
)
GMPcytosine
0
0.2
0.4
0.6
0.8
1
0 10 20 30 40 50 60
# of equivalents
I/I0
GMPcytosine
Fluorescence UV-Visible
logKb = 4.1
logKb = 4.2
ATMCA = 50 M ATMCA = 50 M
Guanosine-5’monophosphate (GMP) Cytosine
N
N
NH2
OH
O
H
HHHHOH
OP-OO
O-
NH
N
N
O
NH2N
SELF-ASSEMBLED chemosensors: ATMCA·Zn(II) (nucleobases and nucleotides)

pKa = 12.2
pKa = 9.9 pKa = 9.4
pKa = 9.3
N
NN
N
NH2
R
NH
N
N
O
NH2N
R
N
N
NH2
O
R
HN
N
O
O
R
HN
N
O
O
R
O
H
HHHH
OH
OP-O
O
O-
R = H: Cytosine (no binding)R = A: CMP (no binding)
R = H: Thymine (3.6; 30%)R = A: TMP (4.5; 25%)
R = H: Uracyl (3.6; 31%)R = A: UMP (4.0; 30%)
R = H:Guanine (not soluble)R = A: GMP (4.2; 53%)
R = H: Adenine (not soluble)R = A: AMP (no binding)
A=
blu = logKbred = % of quenching
H2NNH2
NHOMe
OMeMeO
Zn2+N-
N
O
H3C
O
R
Binding and quenchingappear to be related to thepresence of an acidicamide (imide) proton andto stacking
N
N NH
NHHNZn2
+
Kimura et al. J. Am. Chem. Soc. 1994, 116, 3848.
SELF-ASSEMBLED chemosensors: ATMCA·Zn(II) (nucleobases and nucleotides)

O-
O
-O
O
Other dicarboxylic acids (malonic,succinic), monocarboxylic acids andamino acids do not bind to ATMCA.
H2NNH2
NH
OMe
OMeMeO
Zn2+O-
O
-O
O
The formation of a 5 atoms chelateappears to be crucial for binding andsignalling.
0
0.2
0.4
0.6
0.8
1
1.2
0 2 4 6 8# of equivalents
I/I0
logKb = 4.3
ATMCA = 50 MpH = 7.2
SELF-ASSEMBLED chemosensors: ATMCA·Zn(II) (carboxylic acids)

0
0.2
0.4
0.6
0.8
1
0 1 2 3
# of equivalents
I/I0
HN
N
O
O
H
COOH
[orotic acid] = 25 MpH = 7.2
H2N NH2NH
OMeMeO
OMe
Zn
N OO
O
O
NH
Orotic acid conjugates an acidicamide proton with theformation of a 5 atoms chelateand stacking.The result is a strong binding(logKb = 6.6) and total quenchof the fluorescence emission.
SELF-ASSEMBLED chemosensors: ATMCA·Zn(II) (vitamin B13)

Sistema autoassemblato mediante interazioni ione-ione: l’analita rimpiazza il rilevatore
chemosensing ensemble
NHNH
NNHN
NH
HNNH
N
OO O
CO2
CO2
HO
OO O
O
OO
NHNH
NNHN
NH
HNNH
N
OO O
CO2
CO2
HO
OO O
O
OO
Citrate Receptor Sensing EnsembleE.V. Anslyn, 1998
“Chemosensing ensemble”

Sistema autoassemblato mediante interazioni ione-metallo:stesso principio del “chemosensing ensemble”
NH
N
NHNH
Cu
NH
N
NHNH
Cu
para
meta
ortho
The approach is general and it has been applied to the detection of severalsubstrates (tartrate, gallic acid, heparin, phosphates, carbonate, amino acids andshort peptides).
Fabbrizzi et al. Angew. Chem. 2004, 43, 3847.
O
OO
OO
N
N
O O-
OO-

Figure 1 (A) Ligands and indicators used to construct sensor array. Absorbance spectra for (B) 1 [35 mM], Cu(OTf)2 [157 M], CCR [75 M], and Val [200 M]; (C) 3 [1.2 mM], Cu(OTf)2 [393 M], CAS [36 M], and Val [2.5 mM]; (D) N,N'-tetramethylethylenediamine [4.5 mM], Cu(OTf)2 [200 M], CAS [55 M], and Val [200 M]. (E) Colorimetric output for 1 [35 mM], Cu(OTf)2 [235 M], CAS [35 M], and amino acid [200 M]. All studies carried out in 1:1 MeOH:H2O, 50 mM HEPES buffer, pH = 7.8.
Pattern-Based Discrimination of Enantiomeric and Structurally Similar Amino Acids
I complessi con Cu(II) deileganti chirali 1-3 con icromofori interagisconocon ammino acidi (L e D)dando gradi diversi disostituzione e variazioni dicolore caratteristiche perciascun sistema
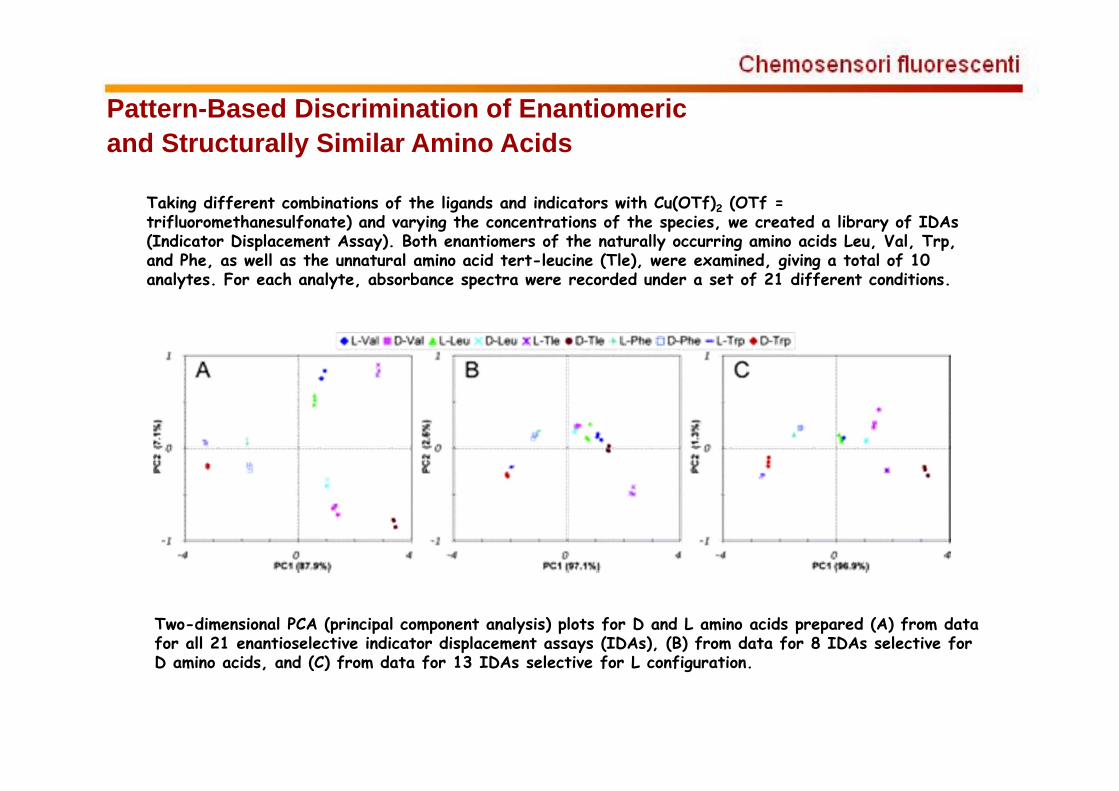
Taking different combinations of the ligands and indicators with Cu(OTf)2 (OTf = trifluoromethanesulfonate) and varying the concentrations of the species, we created a library of IDAs(Indicator Displacement Assay). Both enantiomers of the naturally occurring amino acids Leu, Val, Trp, and Phe, as well as the unnatural amino acid tert-leucine (Tle), were examined, giving a total of 10 analytes. For each analyte, absorbance spectra were recorded under a set of 21 different conditions.
Two-dimensional PCA (principal component analysis) plots for D and L amino acids prepared (A) from data for all 21 enantioselective indicator displacement assays (IDAs), (B) from data for 8 IDAs selective for D amino acids, and (C) from data for 13 IDAs selective for L configuration.
Pattern-Based Discrimination of Enantiomeric and Structurally Similar Amino Acids

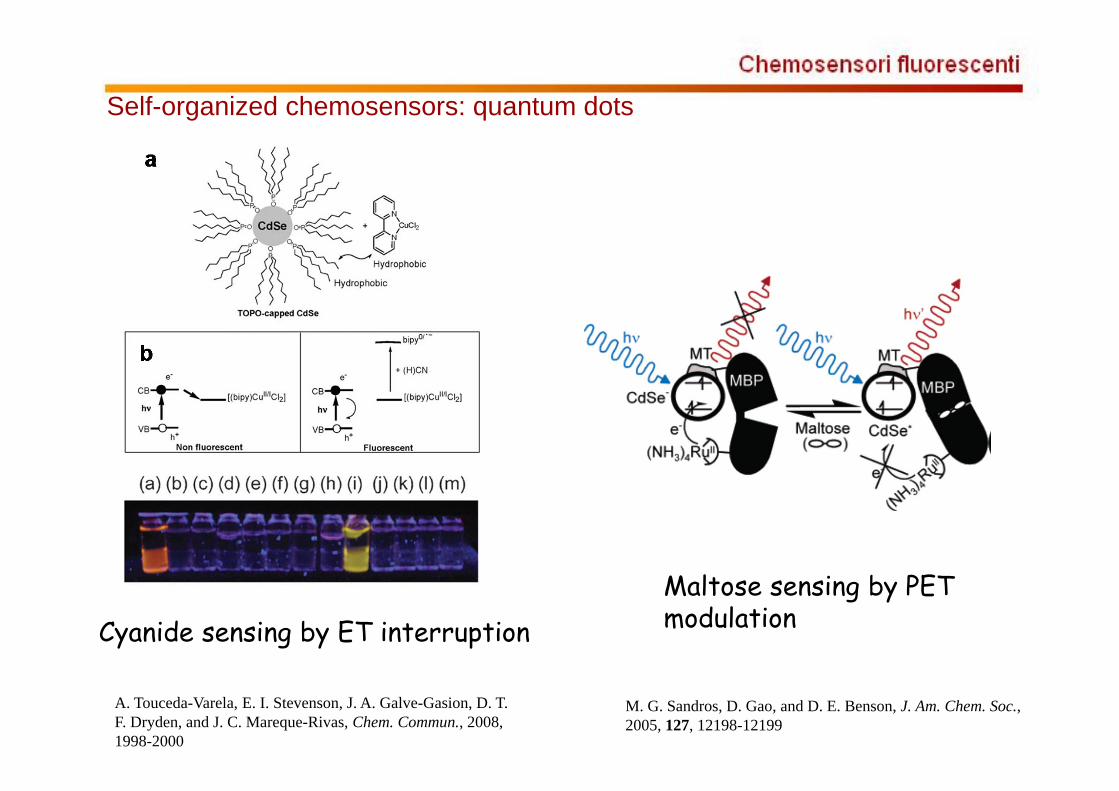
Self-organized chemosensors: quantum dots

Self-organized chemosensors: quantum dots
Analyte induced modulation of surface excitons recombination
Self-organization of binding sites
K. Konishi and T. Hiratani, Angew. Chem. Int. Ed., 2006, 45, 5191-5194
T. Jin, F. Fujii, H. Sakata, M. Tamura, and M. Kinjo, Chem. Commun., 2005, 4300-4302
Self-organized chemosensors: quantum dots
Cyanide sensing by ET interruptionMaltose sensing by PET modulation
A. Touceda-Varela, E. I. Stevenson, J. A. Galve-Gasion, D. T. F. Dryden, and J. C. Mareque-Rivas, Chem. Commun., 2008, 1998-2000
M. G. Sandros, D. Gao, and D. E. Benson, J. Am. Chem. Soc., 2005, 127, 12198-12199

Self-organized chemosensors: quantum dots
Chemosensing ensamble with a quencher, OFF-ON TNT detection
Chemosensing ensamble with a dye, FRET ratiometric sugar/dopamine detection
E. R. Goldman, I. L. Medintz, J. L. Whitley, A. Hayhurst, A. R. Clapp,H. T. Uyeda, J. R. Deschamps, M. E. Lassman, and H. Mattoussi, J.Am. Chem. Soc., 2005, 127, 6744-6751. R. Freeman, L. Bahshi, T. Finder, R. Gill, and I. Willner, Chem.
Commun., 2009, 764-766

Sensori autoassemblati
Vantaggi: preparazione, ottimizzazione e modificazione sono relativamente semplici
Punti deboli: trovare un meccanismo di trasduzione del segnale , diffocltà di progettazione del recettore
Struttura: recettore e unità attiva non solo non sono elettronicamente isolati ma addirittura non sono legati l’uno all’altro; si devono autoassemblare in soluzione
chemosensing ensemblechemosensing ensemble
template assisted chemosensor
templatetemplate templatetemplatetemplate
templateself-organization

Sensori organizzati da un opportuno agente templante
L’approccio si basa sull’autoassemblaggio (o l’autoorganizzazione) di unamolecola fluorescente e del recettore su di un opportuno agente templante così daformare un sistema organizzato. In questo sistema assemblato le due subunitànon interagiscono direttamente e la comunicazione tra substrato complessato emolecola fluorescente è garantita dalla loro vicinanza spaziale.
template template
self-organization
Agenti templanti:• Aggregati di tensioattivi• Monostrati• Superfici di vetro• Nanoparticelle

Self-Organized ChemosensorsIn Surfactant Micellar Aggregates
surfactant+
H2O+
+
+
+
+
+
+
+
+
+
highfluorescence
+
+
+
+
lowfluorescence
Cu(II)
ligand = C10GlyGLy
C10H21 NH HN
HO
O
O
C10H21 NH N
O
O
OCu
Cu(II)
- 2H+ 2+
PhNH SO3
fluorescent dye = ANS
ligand
fluorescent
selforganization
Angew. Chem. Int. Ed. 1999, 38, 3061-3064Langmuir 2001, 17, 7521-7528.

Cu2+ sensing and sensitivity tuning
0.0 1.0x10⁻⁴ 2.0x10⁻⁴ 3.0x10-40
20
40
60
80
100
I/I0
[Cu2+], M
[CTABr] = 0.94 mM
[CTABr] = 0.46 mM
[CTABr] = 0.23 mM
[ANS] = 0.5 mM[Hepes] = 0.01 mM, pH = 7exc = 375 nm, em = 500 nm[CTABr]/[C10GG] = 2
0.0 4.0x10⁻⁵ 8.0x10⁻⁵ 1.2x10⁻⁴ 1.6x10-40
25
50
75
100 [C10GG] = 2.23 x10⁻⁴ M
[CTABr]/[L] = 5
[CTABr]/[L] = 2
I/I0
[Cu2+], M
[CTABr]/[L] = 10
10% Emission decrease at6.5×10-8 M Cu2+ concentration

Trito
n X
-100
Brij
35
DM
MA
PS
CTA
Br
ANS
1-NAFOSF
ACA
DANSA
0
20
40
60
80
100
II0-1/%
COOH
O P
OH
O
OH
SO2NH2
NH3C CH3
ACA
1-NAFOSF
DANSA
NHPh
SO3H
ANS
n-C12H25(OCH2CH2)23OH
Brij 35
(OCH2CH2)10OH
CH3
CH3
CH3
CH3
H3C
Triton X-100
n-C16H33 N
CH3
CH3
(CH2)3SO3
DMMAPS
n-C16H33 N
CH3
CH3
CH3
Br
CTABr
Fluorophores
Surfactants
Sensing in Micellar Aggregates: combinatorial screening
H2NO
HN O
HNO
H2NN
HN
NHO
C17H35
OH2N
NHO
C17H35
HN
SO
O
NA B
water subphase
air
B
B
B/A
B/A
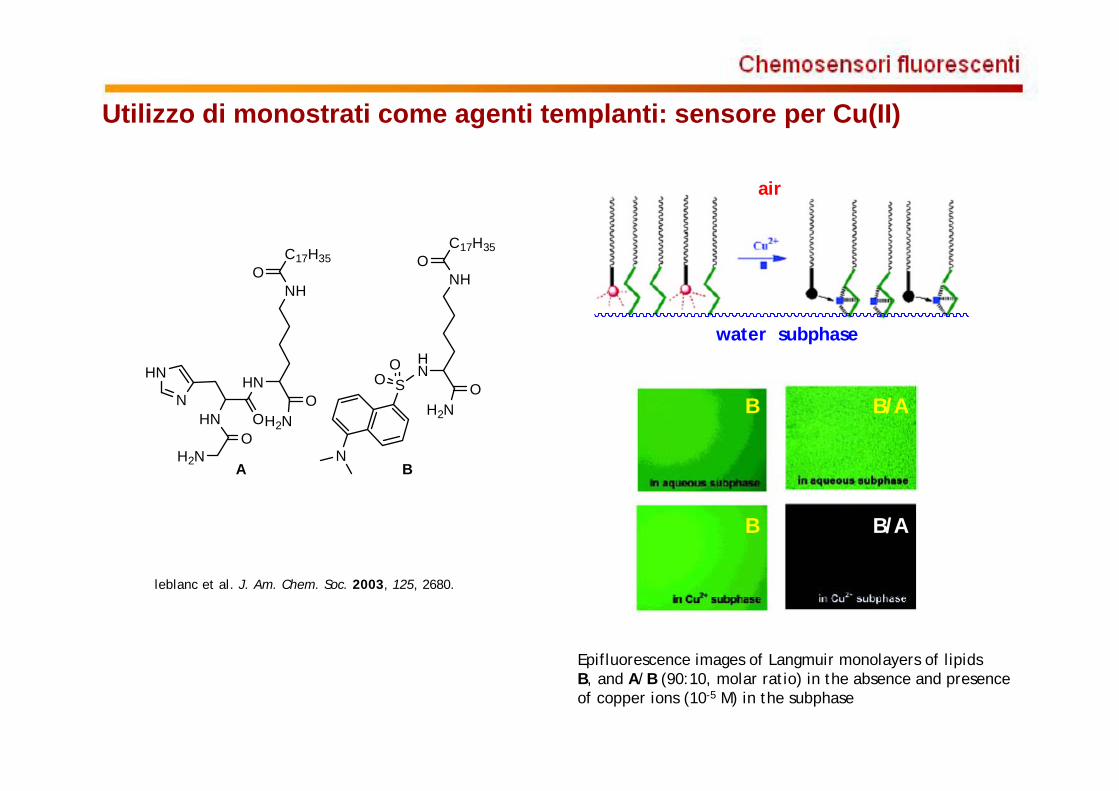
Epifluorescence images of Langmuir monolayers of lipidsB, and A/B (90:10, molar ratio) in the absence and presence of copper ions (10-5 M) in the subphase
leblanc et al. J. Am. Chem. Soc. 2003, 125, 2680.
Utilizzo di monostrati come agenti templanti: sensore per Cu(II)

Self-Organized ChemosensorsIn Surfactant Micellar Aggregates
Advantages:• Prepared just by mixing components (no synthesis)
• Tuning of sensitivity just by variation of components ratio
• Modification of the system just by substitution of one component
Limitations:• Sensitivity to environmental conditions (temperature, ionic strength)
• Concentration limit (c.m.c.)

Self-Organized Chemosensors on SiO2 nanoparticlesSynthesis
SO
ONH
Si OMeOMe
OMeNH
Si OMeOMe
OMeON
NOO
O OO O OO OSiO2
Ludox
H2O/EtOH/AcOH60° C, 16 h
Chem. Commun. 2003, 3026-3027
NNH
O+ Cu2+, -H+
NN
O
Cu2+-

0
50
100
0 0.1 0.2
[Cu2+], mM
I/I0
%
= 0
= 0.15
= 0.40
= 0.58
= 0.91
][][][
LFL
Spectrofluorimetric titration of CSNs (0.03 mg/ml) with Cu(NO3)2 in 10% water/DMSO, HEPES buffer 0.01 M pH 7, 25 °C.
Self-Organized Chemosensors on SiO2 nanoparticlesCu2+ detection
10% Emission decrease at4×10-6 M Cu2+ concentration
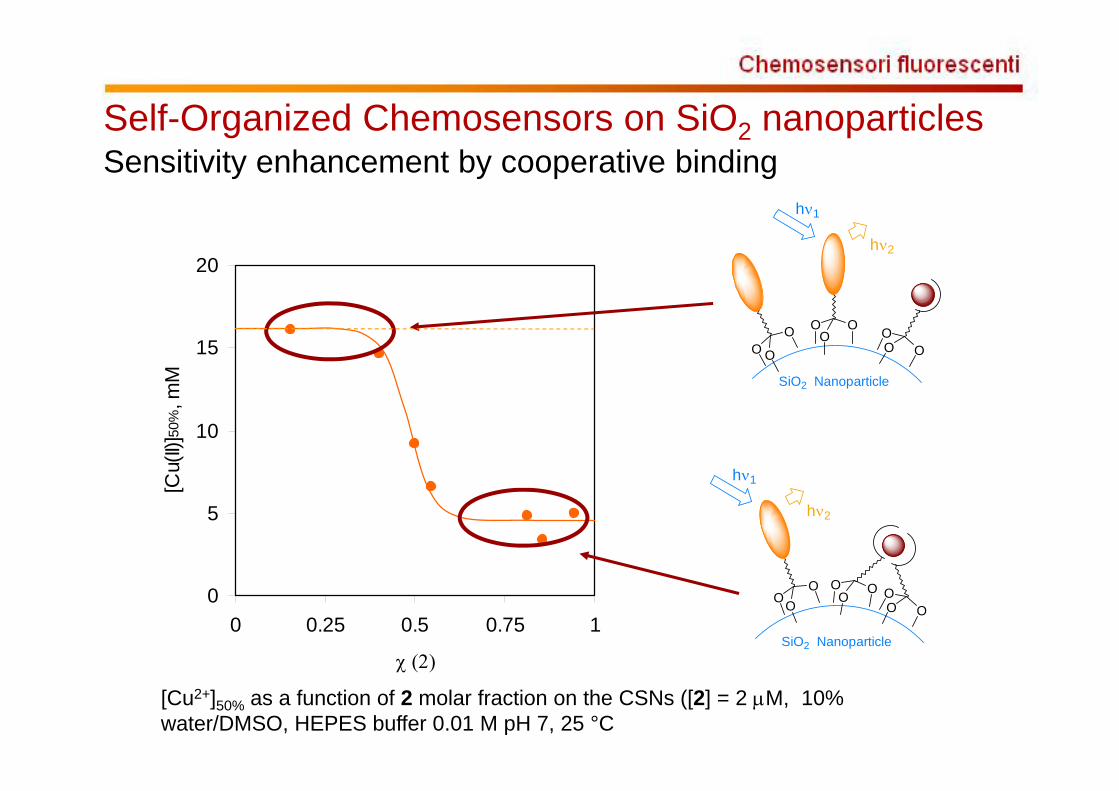
[Cu2+]50% as a function of 2 molar fraction on the CSNs ([2] = 2 M, 10% water/DMSO, HEPES buffer 0.01 M pH 7, 25 °C
0
5
10
15
20
0 0.25 0.5 0.75 1
[Cu(
II)]50
%, m
M
O O
O OO
O OO O
h1
h2
SiO2 Nanoparticle
OOO O
O O OO O
SiO2 Nanoparticle
h1
h2
Self-Organized Chemosensors on SiO2 nanoparticlesSensitivity enhancement by cooperative binding
300 400 500 600
0.6
0.8
1.05 4687
I, ar
bitra
ry u
nits
, nm
5
HN Si OEt
OEt
OEtN
ON
O2NHN Si OEt
OEt
OEt
SO2
N
NH
Si OEt
OEt
OEt
OO
N Si OEt
OEt
OEtO
O
3 4
5 6
NH
Si OEt
OEt
OEt
O
O
7
NHO
O
O8
Si OEt
OEt
OEt
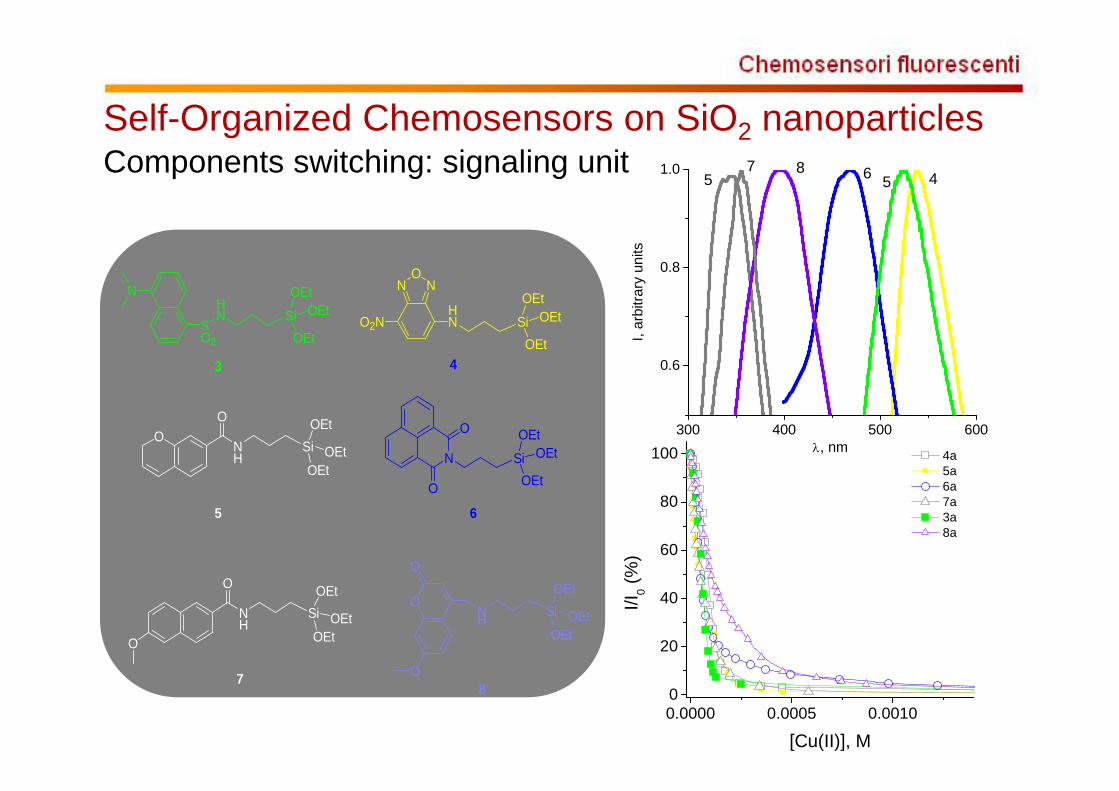
Self-Organized Chemosensors on SiO2 nanoparticlesComponents switching: signaling unit
0.0000 0.0005 0.00100
20
40
60
80
100 4a 5a 6a 7a 3a 8a
I/I0 (%
)
[Cu(II)], M

Conditions: DMSO/acqua 9:1, HEPES 0.01 M pH 7, 25 °C, exc=340 nm, em=520 nm.
0.00 0.05 0.10 0.15 0.20 0.25 0.300
20
40
60
80
100
I/I0 (
%)
[Cu(II)], mM0.000 0.0050
20
40
60
80
100
I/I0 (%
)
[Cu(II)], mM
NNH
O
Si OEt
OEt
OEt
1
NNH
O
HN Si OEt
OEt
OEt
2
10% Emission decrease at3.0×10-8 M Cu2+ concentration
Self-Organized Chemosensors on SiO2 nanoparticlesComponents switching: binding unit
J. Mat. Chem. 2004, 15, 2687-2696

0.0 0.2 0.4 0.6 0.820
40
60
80
100
I/Io %
(CCu(II)-CCu(II)CALC)/CDNS
O O
O OO
O OO O
SiO2 Nanoparticle
L:F=1:10.00 0.02 0.04 0.06 0.08 0.100
20
40
60
80
100
I/Io
%
(CCu(II)-CCu(II)CALC)/CDNS
O O
O OO
O OO O
SiO2 Nanoparticle
L:F=50:1
Self-Organized Chemosensors on SiO2 nanoparticlesSelectivity

SiO
OO
SiO
OO
fluoroforo
ligando
ione metallico
h1 h1
h2h2
QU
AR
TZ
Si
O
O
O
Si
O
O
O
Si
O
O
O
Si
O
O
O
QU
AR
TZ
Si
O
O
O
Si
O
O
O
Si
O
O
O
Si
O
O
O
SiO O
O
NH
HNR
SiO O
O
NH
HN
X
SiO O
O
NH
HNR
SiO O
O
NH
HNX
SiO O
O
NH
HNR
X or
O O
CO
N
=
R = H, COCH3, or CONHC6H13
N
SO2
N
SO2
GLASS
(H3CO)Si NH
NH2 SiO O
O
NH
H2N
SiO O
O
NH
H2N
SiO O
O
NH
H2N
SiO O
O
NH
H2N
SiO O
O
NH
H2N
Cl
1)
2) capping agent
sensitivity for Pb2+ in the 0.1 mM range
Crego-Calama and Reinhoudt Adv. Mater. 2001, 13, 1171
Superfici di vetro come agenti templanti: un sensore per ioni metallici

Crego-Calama, Reinhoudt and al. J. Am. Chem. Soc. 2004, 126, 7293
Superfici di vetro come agenti templanti: selezione combinatoria del sistema migliore

Sensori autorganizzati su/in nanoparticelle: PEBBLES
A. Burns, P. Sengupta, T. Zedayko, B. Baird, and U. Wiesner, Small, 2006, 2, 723-726

Core-shell silica nanoparticles for Pb2+ detection
0.0 5.0x10⁻⁵ 1.0x10-40
25
50
75
100
I/I0 (
%)
[Pb2+], M
250 nm
SiEtO
OEt
OEtEtO
TEOS
NH3/H2O
EtOH, 25 °C8 h
SiO2NH3/H2O
EtOH, 25 °C16 h
TEOS,NH3/H2O
EtOH, reflux3 h
MPS, TEOS S
SH
S
HSSH
SHSH
HS
HS
SS
S
S
SH
SH
np0
np1
np2
np2
Langmuir 2007, 23, 8632-8636
S
SH
S
HSSH
SHSH
HS
HS
SS
S
S
SH
SH
Pb2+
Pb2+
Pb2+

Ratiometric sensing
SiEtO
OEt
OEtEtO
TEOS
NH3/H2O
EtOH, 25 °C16 h
SiO2NH3/H2O
EtOH, 25 °C16 h
TEOS,NH3/H2O
EtOH, reflux3 h
MPS, TEOS S
SH
S
HSSH
SHSH
HS
HS
SS
S
S
SH
SH
N
S OOHN
SiEtO OEtEtO
DNS
O
ONH
SiEtOEtO
OEt
MNC
300 400 500 6000
200
400
600
800
emis
sion
, a.u
.
nm
0.0 2.0x10⁻⁵ 4.0x10⁻⁵ 6.0x10⁻⁵ 8.0x10-50.0
0.2
0.4
0.6
0.8
1.0
I 390/I 50
0
[Pb2+], M
S
SH
S
HSSH
SHSH
HS
HS
SS
S
S
SH
SH
Pb2+
Pb2+
Pb2+

Ratiometric sensing
300 400 500 6000
25
50
75
100
emis
sion
, a.u
.
wavelenght, nm0.0 1.5x10⁻⁵ 3.0x10⁻⁵
0.2
0.4
0.6
0.8
I 390/I 50
0
[Pb2+], M
S
SH
S
HS
SH
SHSH
HS
HS
SS
S
S
SH
SH
Pb2+
Pb2+
Pb2+
TEOS
NH3/H2O
EtOH, 25 °C4 h
NH3/H2O
EtOH, 25 °C4 h
TEOS,NH3/H2O
EtOH, reflux3 h
MPS, TEOSS
SH
S
HS
SH
SHSH
HS
HS
SS
S
S
SH
SH
NH3/H2O
EtOH, 25 °C16 h
TEOS,
np3

a
b
c
FRET QI 87%Brightness 1000-fold
Active PEBBLES for O2 sensing
Single particle oxygen detection
C. F. Wu, B. Bull, K. Christensen, and J. McNeill, Angew. Chem. Int. Ed., 2009, 48, 2741-2745.

Other sensing schemes
Carboxylate detection
Eparin (polyanion) detectionP. Calero, E. Aznar, J. M. Lloris, M. D. Marcos, R. Martinez-Manez, J. V. Ros-Lis, J. Soto, and F. Sancenon, Chem. Commun., 2008, 1668-1670.
P. Calero, E. Aznar, J. M. Lloris, M. D. Marcos, R. Martinez-Manez, J. V. Ros-Lis, J. Soto, and F. Sancenon, Chem. Commun., 2008, 1668-1670.

NANO-HPLC
TEM micrograph of PLA-coated mesoporous MSN nanoparticles
Fluorescence increase by PLA-coated mesoporous MSN nanoparticles after addition of Dopamine (a), Tyrosine (b) and Glutamic acid (c)
a
b
c
V. S.-Y. Lin et al., JACS, 2004, 126, 1640-1641

Why zinc?: Zinc is only moderately abundant in nature, ranking 23rd of the elements. Zinc is, however, following iron, thesecond most abundant transition metal in the body. In total, the adult human body contains 2 –3 g zinc. The pronounced Lewisacid characteristics of the Zn2+ ion, its single redox state, and the flexibility of its coordination sphere with respect to geometryand number of ligands associated, combined with the kinetic lability of coordinated ligands, are responsible for its broad utilitywithin proteins. Thousands of proteins contain zinc. Zinc proteins can be divided into several groups according to the roleplayed by zinc. In the catalytic group (e.g.,carbonic anhydrase and carboxypeptidase A), zinc is a direct participant in thecatalytic function of the enzyme. In enzymes with structural zinc sites (e.g.,protein kinase C), one or more metal ions ensureappropriate folding for bioactivity. Enzymes in which zinc serves a co-catalytic function (e.g., superoxide dismutase), one orseveral zinc ions may be used for catalytic, regulatory, and structural functions. In addition, there are a large number oftranscription factors that utilize zinc, the so-called zinc fingers.While the total concentration of zinc in a cell is relatively high, the concentration of “free ”zinc, that is, the fraction of Zn2+ notstrongly bound to proteins, is extremely low and tightly controlled. Total cellular zinc can be determined by standardanalytical techniques such as AAS or ICP-MS, but the determination of the “free ”or “available ” Zn2+ concentrationshas proved difficult using classic techniques. This is because cell fractionation can readily lead to cross-contamination ofthe kinetically labile metal ion between intracellular sites. Thus, the knowledge gap between the structural chemistry of zinc andzinc homeostasis and action is, at least in part, due to the lack of techniques for tracking Zn2+ in biological systems. This led tothe emergence of zinc specific molecular sensors, which can make zinc “visible ”in tissue or even in live cells.
Spectroscopically silent zinc: The d10 electron configuration of the Zn2+ ion, the only zinc ion found in biological systems,has a number of practical implications for its detection. Zn2+ is colorless as it is devoid of d –d transitions. The Zn2+ ion is verystable and undergoes redox reactions only under extreme conditions, excluding the occurrence of ligand-to-metal charge-transfer bands in its complexes. These effects render UV-visible spectroscopy unsuitable for the detection of “free ”orcomplexed Zn2+. Zinc is also diamagnetic in all its compounds, prohibiting, for instance, EPR spectroscopy or magnetometricmeasurements.The d10 ion is not subject to ligand field stabilization effects, making it extremely flexible with respect to thecoordination geometries it can adopt in its complexes, and rendering it kinetically labile, allowing for rapid ligand exchangereactions. Finally, the major naturally occurring isotopes have zero nuclear spin, they are NMR silent.Much of what is known about the structure and function of Zn2+ containing proteins has been gleaned from X-ray crystalstructures, X-ray absorption data (EXAFS), and iso- morphous substitution experiments in which the Zn2+ was replaced bytraceable metal ions. None of these techniques are suitable for the tracking of Zn 2+ in cells and organisms. The use of the zincradioisotope 65Zn has allowed cell studies on bulk zinc uptake and egress, but this does not permit the direct observation of thetemporal and spatial distribution of zinc in live cells and questions of isotope equilibration with internal pools arise. Onetechnique to spectroscopically visualize zinc is the use of zinc-specific fluorescent molecular sensors.
Fluorescence chemosensors: the case of zinc

Desired optical properties: The ideal chemosensor for zinc is nonfluorescent in the free form and highlyfluorescent when coordinated to zinc; possibly, the response should be ratiometric. Moreover, the excitation wavelengthshould be as longer as possible to avoid UV-induced cell damage and to penetrate tissue better and with less scattering(giving rise to higher resolution imagesand), and to avoid UV-grade optics in the fluorescence microscopes used to observebiological samples.
Intrinsic chemosensors: the case of zinc
Determinazione della concentrazione di Zn(II) all’interno di cellule tumorali.
JACS 2004,126, 712-713.
N HN
HN
NH
NH

I > 300; ex 369 nm; em 535 nm
N
MeO
SO2
Me
HN N
O
SO2
Me
HN
EtO2C
MeN
MeO
SO2
Me
HNMe
TSQ ZINQUIN 2-Me-TSQ
ZINPYR-1
I > 3; ex 509 nm; em 525 nm
Intrinsic chemosensors: the case of zinc
Microscopy images of mouse fibroblast cells by fluorescence in the presence of 10 mm 2-Me-TSQ.Nasir et al. J. Biol. Inorg. Chem. 1999, 4, 775.

Selectivity: Zinc is a borderline hard/soft metal with a variety of known coordination numbers, geometries, and donor atom sets. This makes the design of zinc-selective chelates somewhat difficult, but the number and concentration of competing metal ions in biological systems is limited, simplifying the task in practice.
In addition to zinc, the other divalent ions of Group 12 elicit a fluorescence response. Also, the soft-ion Pb2+ is found to bind. However, none of these toxic ions are expected to be present in any significant amount, excluding a false positive signal forzinc.The ions occurring in relatively large concentrations, such as Ca2+, Mg2+ (and Na+, K+) do not bind to cyclen, and therefore do not induce any fluorescence, even when present in a large molar excess.
Transition metals such as Mn2+, Fe2/3 +, and Cu2+ bind to many cyclen but they do not give a false positive fluorescence response as these paramagnetic ions quench fluorescence. In a refined and more relevant experiment, it is necessary to investigate how Zn2+ ions directly compete with varying concentrations of other transition-metal ions for the sensor bindingsite.
Intrinsic chemosensors: the case of zinc

Affinity for zinc: a fluorescence titration of a given sensor with Zn2+ identifies the zinc concentration range in which the sensor can be used to measure relative concentrations of zinc. If the zinc concentration is too low, no enhanced fluo-rescence is measured because no significant binding takes place. In the upper limit range, the sensor is saturated andcannot give any information about relative concentration changes of zinc. Thus,every sensor is characterized by a useful working range of zinc concentrations.The ideal dissociation constant K d of the sensor for the analyte should be a value close enough to the projected concentration of the analyte to allow monitoring of changes in its concentration.
Binding kinetics: if the temporal resolution of changing zinc concentrations is desired, it is obligatory that the reversiblemetal binding event to the sensor is adequately fast. For instance, the binding of Zn2+ to the cyclen-based sensor 5 isvery slow (t1/2 =60 min). This is presumably due to the reorganization required to accommodate the metal in its convoluted binding site. Most sensors utilize non-macrocyclic polydentate chelates with fast binding kinetics. Rapidly binding sensors havebeen successfully used in time-resolved studies.
pH dependence: protons potentially compete with zinc for the lone pair(s) of the Lewis basic metal binding site. If the lone pair responsible for the PET process gets protonated, it becomes also less available for the quenching process, and fluorescence is switched on even in the absence of the metal ion. Hence the working pH range for any chemosensor needs to be determined to allow a judgment whether the sensor can operate within the pH range expected in the biological system studied.
Intrinsic chemosensors: the case of zinc

Intrinsic chemosensors: the case of zinc
Biodistribution properties : Ideally, the chemosensor is taken up by the cell or tissue, thus avoiding microinjection techniques. An indication whether endocytotic mechanisms or passive diffusion through the cell membrane is responsiblefor the uptake of the sensor can be derived by observing the temperature-dependence of its uptake. If incubation of thecells with the sensor at 4 °C results in cell uptake, it provides a strong indication for a passive diffusion mechanism, sinceendocytosis at this temperature is greatly inhibited. Once in the cell, the sensor may be excreted or metabolized, leading togradually diminishing fluorescence.
Sensor triacid 6 does not stain cells, whereas the triester 5 is taken up readily
ZINQUIN

Intrinsic chemosensors: the case of zinc
Cell-impermeable zinc chemosensors: it is known that insulin and Zn2+ are co-stored in pancreatic -cells in secretory vesicles and are co-released by exocytosis.This process can be visualized by using the non-cell-permeable chemosensor FluoZin-3.The Figure shows the burst of fluorescence following the addition of glucose to pancreatic -cells. The time-lapse images following the burst show the fluorescence decrease due to diffusional dilution of the zinc concentration.

Intrinsic chemosensors: the case of zinc
Single-wavelength excitation ratiometric zinc chemosensors: The signal derived from a fluorescence microscopy image of a cell stained with a zinc-specific chemosensor allows the determination of the presence of zinc. Relative emission increases can reasonably be correlated with increases of [Zn2 +] free but the fluorescence quantum yield of the sensor is in most cases solvent-dependent. Since the solvent properties of the local environments in which the sensors accumulate are not known,the absolute l emission measured cannot be correlated directly with the concentration of zinc. However, the measurement ofabsolute [Zn2+] free can be achieved by using a ratiometric sensor.
In a ratiometric sensor the binding of analyte the results in a shift of its max-emission, which may or may not be concomitant with an increase in l emission .This max-emission shift should be enough to distinguish the max-emission of the co-existing Zn 2 +-free and Zn 2 + -bound species, allowing the determination of their emission ratio.

Intrinsic chemosensors: the case of zincSingle-wavelength excitation ratiometric zinc chemosensors
Images of live COS cells stained with ZNP1 acetate. The pseudocolors depict the ratio of the fluorescence intensities at the twoemission wavelengths at 612 and 526 nm. The larger the ratio, the more zinc is present. In resting cells, little if any, “free endogenous zinc is present (A). Figure B shows the result of the addition of nitrosocyctein, an NO-delivery agent.The ratio in-creased, indicating the intracellular NO-triggered release of zinc.The cytosolic zinc was then chelated by TPEN, resulting in the complete loss of imageable zinc in the cells (C). TPEN = N ,N ,N ’N ’tetra(2-picolyl)ethylenediamine.
12-I12-II

Dual-wavelength excitation ratiometric zinc chemosensors
Phase contrast (A) and fluorescence (B, C) microscopy images of HeLa cells incubated with Coumazin-1 with the addition of ZnCl2 and sodium pyrithione. Fluorescence images were acquired with excitation at 400 –440 nm, band-pass of 475 nm (B) or with excitation at 460 –500 nm, band-pass of 510 –560 nm (C).
Intrinsic chemosensors: the case of zinc

PEBBLES and Zn(II)
Chem. Eur. J 2007, 8, 2238-2245
SiEtO
OEt
OEtEtO
NH3/H2O
EtOH, 25 °C16 h
TEOS
TSQ
N
O
NHS
O
O
NH
HN
O
Si(OEt)3
O O
O
NH
(EtO)3Si
CUM
Zn2+
13 nm
Pebbles: Kopelman et al. Curr. Opin. Che. Biol. 2004, 8, 540-546

PEBBLES and Zn(II)