
CHEMICAL SENSORS AND INSTRUMENTATION POWERED BY MICROBIAL FUEL CELLS by
59
CHEMICAL SENSORS AND INSTRUMENTATION POWERED BY MICROBIAL FUEL CELLS by Raaja Raajan Angathevar Veluchamy A thesis submitted in partial fulfillment of the requirements for the degree of Master of Science in Chemical Engineering MONTANA STATE UNIVERSITY Bozeman, Montana November 2007
Transcript of CHEMICAL SENSORS AND INSTRUMENTATION POWERED BY MICROBIAL FUEL CELLS by

CHEMICAL SENSORS AND INSTRUMENTATION POWERED
BY MICROBIAL FUEL CELLS
by
Raaja Raajan Angathevar Veluchamy
A thesis submitted in partial fulfillment of the requirements for the degree
of
Master of Science
in
Chemical Engineering
MONTANA STATE UNIVERSITY Bozeman, Montana
November 2007

ii
©COPYRIGHT
by
Raaja Raajan Angathevar Veluchamy
2007
All Rights Reserved

ii
APPROVAL
of a thesis submitted by
Raaja Raajan Angathevar Veluchamy
This thesis has been read by each member of the thesis committee and has been found to be satisfactory regarding content, English usage, format, citation, bibliographic style, and consistency, and is ready for submission to the Division of Graduate Education.
Dr. Joseph Seymour
Approved for the Department Chemical and Biological Engineering
Dr. Ron Larsen
Approved for the Division of Graduate Education
Dr. Carl A. Fox

iii
STATEMENT OF PERMISSION TO USE
In presenting this thesis in partial fulfillment of the requirements for a
master’s degree at Montana State University, I agree that the Library shall make
it available to borrowers under rules of the Library.
If I have indicated my intention to copyright this thesis by including a
copyright notice page, copying is allowable only for scholarly purposes,
consistent with “fair use” as prescribed in the U.S. Copyright Law. Requests for
permission for extended quotation from or reproduction of this thesis in whole or
in parts may be granted only by the copyright holder.
Raaja Raajan Angathevar Veluchamy November 2007

iv
ACKNOWLEDGEMENTS
I acknowledge the financial support from the US Office of Naval Research
and the W.M KECK foundation. I also like to thank my research advisors Dr.
Zbigniew Lewandowski and Dr. Haluk Beyenal for their expertise advice and
suggestions. My special thanks to Dr. Joe Seymour (Thesis Committee
Chairman) and Dr. Ron Larsen (Head of the Chemical and Biological
Engineering Department) for their support. I thank CCS, Inc. for supplying the C
compiler for the microcontroller free of charge. I would like to thank Microchip Inc,
Texas Instruments Inc and Maxim Integrated Products for supplying the free
samples of their products.

v
TABLE OF CONTENTS
1. INTRODUCTION .......................................................................................................... 1
Project Background .......................................................................................... 1 Purpose............................................................................................................ 2 Goal.................................................................................................................. 6 Challenges ....................................................................................................... 7 Tasks................................................................................................................ 7 Strategy............................................................................................................ 8 Microbial Fuel Cells .......................................................................................... 8 Sensor Theory................................................................................................ 10 Sensor Instrumentation Theory ...................................................................... 11 Increasing the Potential Output by the Microbial Fuel Cell ............................. 12 Storing Energy................................................................................................ 13
2. MATERIALS AND METHODS................................................................................. 14
Overall Functional Description of the System................................................. 14 Potentiostat .................................................................................................... 15 Microbial Fuel Cell .......................................................................................... 16 Electrochemical Sensor.................................................................................. 17 Detailed Controller Circuit Description............................................................ 18
Analog to Digital Conversion.................................................................... 18 Digital to Analog Conversion.................................................................... 19 Analog Section......................................................................................... 19 EEPROM ................................................................................................. 20 Reference Voltage Generator .................................................................. 21 Charge Pump........................................................................................... 22 Power Management................................................................................. 22
Controller Circuit Board Construction ............................................................. 24 Wireless Transmitter ...................................................................................... 31 Storing Energy and Capacitor Selection......................................................... 31 Deployment Site ............................................................................................. 33 Current Consumption Determination .............................................................. 34 Runtime of the System ................................................................................... 34
3. RESULTS AND DISCUSSION ................................................................................ 36
Implications of the Described System ............................................................ 41 Conclusions.................................................................................................... 42
REFERENCES CITED ....................................................................................... 44

vi
LIST OF TABLES
Table Page
1. List of components used to construct the controller board. .................... 27

vii
LIST OF FIGURES
Figure Page
1. Pictorial representation of microbial fuel cells connected in series. ........... 3
2. Pictorial representation of the complete system used for testing the controller. The controller consists of potentiostat circuitry, a wireless transmitter and power management circuitry. The probe consists of a sensor, a microbial fuel cell and the controller. The data transmitted by the probe is received by the base station receiver and then sent to the satellite using a Stalink® wireless transmitter. The data sent to the satellite can be accessed from a database server using a computer............................................................. 6
3. A. Simplified block diagram of the probe; B. Simplified block diagram of the base station........................................................................ 7
4. The scan potential verses time plot shows the potential applied by the potentiostat on the working electrode with respect to the reference electrode. Mn+ is any metal ion present in the water sample. Response current verses time plot shows the response current corresponding to the scan potential generated by the potentiostat. Current peaks from copper and lead are shown as examples. ................................................................................................ 11
5. Detailed block diagram of the complete system consisting of the probe (A) and the base station (B). (RE = Reference electrode, WE= Working electrode, CE= Counter electrode, PC=Potential controller, F=Voltage follower, CF=Current follower). .............................. 14
6. ASV sensor assembly.............................................................................. 18
7. Circuit diagram of the analog to digital conversion section of the potentiostat. ............................................................................................. 19
8. Circuit diagram of digital to analog conversion section. ........................... 20
9. Analog section of the potentiostat. ........................................................... 21
10. Wiring diagram of EEPROM to the µC1................................................... 21
11. Detailed circuit diagram of the reference voltage generator..................... 22
12. Detailed circuit diagram of the charge pump............................................ 23

viii
LIST OF FIGURES - CONTINUED
Figure Page
13. Detailed circuit diagram of the power management circuitry.................... 24
14. Complete circuit diagram of the base station. .......................................... 26
15. PCB layout of the controller. .................................................................... 30
16. PCB layout of the base station circuitry. .................................................. 30
17. Prototype of the controller........................................................................ 36
18. ASV response curves obtained from the commercial potentiostat. Scan Rate = 25mV/s. Deposition time=60s. ............................................ 37
19. ASV response curves obtained from the custom made sensor circuitry. Scan Rate = 25mV/s. Deposition time=60s. .............................. 37
20. Calibration curves obtained for lead using the commercial potentiostat and the custom made sensor circuitry. The current values were extracted from the lead peaks in Figure 19 and Figure 20. The data points from commercial potentiostat and custom made sensor circuitry overlap...................................................... 38
21. Calibration curves obtained for copper using the commercial potentiostat and the custom made sensor circuitry. The current values were extracted from the copper peaks in Figure 19 and Figure 20. The data points from commercial potentiostat and custom made sensor circuitry overlap...................................................... 38
22. Voltage across the super capacitor connected to the microbial fuel cell and controller during the deployment in the field. ....................... 39
23. Plot of voltage across the capacitor and the current drawn during different functional phases of the controller. Different functional phases of the controller are shown above the time axis. ......................... 40

ix
NOMENCLATURE
R J K-1 mol-1 Universal gas constant
T Kelvin Temperature
[Red] mol m-3 Concentration of the reduced species
[Ox] mol m-3 Concentration of the oxidized species
n Number of electrons transferred in the half-reaction
E0 V Standard half cell potential
E’ V Half cell potential
E’pH=7.2 V Half cell potential based on a pH of 7.2
VSCE V
Potential of the half cell with respect to the saturated
calomel electrode
Q C Charge accumulated in the capacitor
C F Capacitance of the capacitor
I A Average discharge current of the capacitor
t s Total discharge time
V V
Voltage across capacitor terminals at any instance of
time t
Vt=0 V
Terminal voltage of the capacitor before start of
discharge
a Integration constant
tc s Lapse time after the controller starts operating

x
Iavg A Average current consumed
Ic A Current drawn by the controller
Eavg Wh Average energy consumption
tlifetime H Lifetime of the probe
CMg Ah/Kg
Capacity of the magnesium alloy based on manufacturer
specification. (1111Ah/Kg)
WMg Kg Total weight of the magnesium anode used (10.8Kg)
IActive A
Average current drawn by the controller while active
(0.163A)
ISleep A
Average current drawn by the controller while in sleep
mode (0.0043A)
xi
ABSTRACT
The use of microbial fuel cells to power electronic devices is inhibited by
their low voltage and current outputs, therefore they cannot be used directly to power electronic devices without appropriate power management. The goal of the thesis is to power chemical sensors but currently there are no available sensor circuitries which can be operated at the low potential and current delivered by a microbial fuel cell. In this thesis, novel sensor circuitry and power management circuitry have been developed. The sensor circuitry can be programmed to operate any generic amperometric sensor and the data is accessible using wireless communication. The power management circuitry boosts the low potential and current outputs of a microbial fuel cell to the higher level required for powering the sensor circuitry. For testing purposes, the sensor circuitry was programmed to operate a chemical sensor measuring copper and lead concentrations in water. This work has demonstrated that by adopting the proposed power management and sensor circuitry, the energy from a microbial fuel cell can be used for powering electronic devices, including chemical sensors deployed at remote locations.

1
INTRODUCTION
Project Background The Biofilm Structure and Function Group at the Center for Biofilm
Engineering at Montana State University-Bozeman was funded by the Office of
Naval Research to perform research on the application of microbial fuel cells for
powering remote sensors. In the initial phase of this project, microbial fuel cells
were studied in the lab [1] which led to the development of a field deployable
microbial fuel cell [2]. Although the microbial fuel cell developed by the research
group was a reliable power source, its usefulness could not be realized since the
existing chemical sensors could not be directly powered by the microbial fuel
cells due to the low voltage and current output from the microbial fuel cell. The
powering of a simple temperature sensor using a microbial fuel cell was first
researched by Avinash Shantaram, one of the members of the Biofilm Structure
and Function Group [3]. In Avinash Shantaram’s thesis an off-the-shelf DC-DC
converter and super capacitor were used to power a simple off-the-shelf
temperature sensor. This off-the-shelf temperature sensor was able to wirelessly
transmit the data over a few meters to a laptop. The power management was
carried out by using a voltage comparator in the DC-DC converter chip. When
the voltage across the super capacitor reached certain level, the voltage
comparator was configured to enable the 5V output of the DC-DC converter.
Once the 5V output of the DC-DC converter was enabled the temperature sensor

2
starts transmitting data periodically. In an effort to demonstrate that a more
sophisticated sensor could be powered by using the power management strategy
proposed by Avinash Shantaram, the potentiostat circuitry developed by the
research group was powered by using the power management circuitry
developed by Avinash Shantaram. But since the current requirements of the
potentiostat were higher than the simple temperature sensor, changes in the
power management strategy and the sensor circuit design were required in order
to power the potentiostat circuitry using the microbial fuel cells.
Purpose
Over the last decade, microbial fuel cells have evolved from a conceptual
lab device [4-9] to a practical power source that could be used to power sensors
at remote locations [2]. Microbial fuel cells are high energy capacity devices
which could provide low power output for many years without maintenance. This
high energy capacity and reliability are highly desirable requirements for any
power source, but microbial fuel cells have major drawbacks due to their low
power output and their inability to be used in series configuration to obtain higher
operating voltages. Series configuration does not work in the case of the
microbial fuel cells deployed in the natural water systems due to the common
electrolyte shared by the individual microbial fuel cells. Because of the common
electrolyte (water), the anode and cathode interconnection between individual
fuel cells, used in the series configuration, acts as a short circuit instead of

3
serving the intended purpose of adding the voltages from the individual fuel cells
(Figure 1). These major drawbacks render microbial fuel cells less attractive for
powering remote sensor electronics that are specifically designed for operation
using a battery power source.
Cel
l1: A
node
Cel
l1: C
atho
de
Cel
l2: A
node
Cel
l2: C
atho
de
Cel
l3: A
node
Cel
l3: C
atho
de
Cel
l4: A
node
Cel
l4: C
atho
de
Figure 1. Pictorial representation of microbial fuel cells connected in series.
Since batteries are limited by the amount of energy they can store,
researchers have mainly focused on designing sensor electronics which require
low power for their operations and hence can be operated for longer durations
using batteries. The design of these sensor electronics which consume low
power also enables the deployment of these sensors at remote locations for
longer durations with the need for less frequent visits to change batteries. Yun et
al. developed a low power remote environmental monitoring system capable of

4
wirelessly transmitting the heavy metal concentration data to a base station [10].
That research group has used a wireless transmitter with a range of few meters
and the type of power source used was not mentioned. Steinberg et al.
developed a potentiostat that consumes very low power for its operation and
could be used to operate analytical sensors [11]. Kwakye et al. developed an
embedded system for usage in portable electrochemical analysis [12]. The
embedded system developed was designed to operate on a 1.5V battery power,
and the authors have claimed that it can be operated for 2 hours every day for up
to 6 months. Although that system consumes low power, it does not find very
much usefulness for remote environmental monitoring systems largely due to its
requirement for a personal computer to log the data output by the sensor system.
Using a personal computer indirectly implies that utility power is required, which
totally voids the purpose of developing a low power remote sensor. Serra et al.
have reported the design and construction of an amperometric biosensor with
wireless capabilities [13]. That amperometric biosensor requires a battery pack
for its operation and can transmit the data up to 30m. Beni et al. developed a
portable sensor that measures the concentration of copper in the soil [14]. The
runtime of that sensor was limited by the laptop used for the data logging. Reay
et al. have reported an electrochemical analysis system to measure the
concentration of lead and cadmium in aqueous solutions [15]. That system can
be powered by batteries and is portable. The majority of the portable and remote
sensor systems developed so far were operated using batteries, which was the

5
factor limiting their runtime. Also, in an effort to save energy consumption, the
capabilities of the sensor systems were highly reduced. For example, most of the
researches have resorted to using low power output wireless transmitters that
can transmit data only a few meters. The bottom line is that the capabilities of the
sensor system developed so far have been highly limited, mainly due to the
power source constraints. Though these systems can technically be called
remote sensors, their real world applications are very limited.
Since microbial fuel cells can be setup at remote locations where water
resources exist, they are a convenient power source for remote environmental
sensors. To make use of a reliable power source such as microbial fuel cells, in
this work the design and development of the remote sensor circuitry which could
be directly powered by microbial fuel cells is reported. The sensor circuitry can
operate any generic amperometric sensor and transmit the response current data
wirelessly to the base station. The sensor circuitry was tested by operating a
sensor which could detect copper and lead concentrations in water samples. The
sensor circuitry consists of a potentiostat circuitry, a power management circuitry,
and a wireless transmitter. The potentiostat circuitry, power management circuitry
and the wireless transmitter together, are referred to as a “controller” in the
remaining part of this thesis. The controller, the microbial fuel cell and the sensor
are collectively referred to as a “probe”. In this work, the main focus is on the
design, construction, and testing of the potentiostat and the power management
circuitry. Figure 2 shows the pictorial representation of the system used to test

6
the controller developed in this work. Figure 3 is the simple block diagram
version of the complete system shown in Figure 2.
SATLINK
Base Station Receiver
Satellite
Computer
MnOOHMnO2
Mn2+2e-
Cathode
Anode
PROBE
Microbial deposition byManganese Oxidizing Bacteria
Biofilm
Controller
Mg Mg 2e + 2+ -
e-e-
Wireless data transmission Wireless data transmission
Wireless data transmission
Figure 2. Pictorial representation of the complete system used for testing the controller. The controller consists of potentiostat circuitry, a wireless transmitter and power management circuitry. The probe consists of a sensor, a microbial fuel cell and the controller. The data transmitted by the probe is received by the base station receiver and then sent to the satellite using a Stalink® wireless transmitter. The data sent to the satellite can be accessed from a database server using a computer.
Goal Develop and test a controller which can be powered by a microbial fuel cell.

7
Figure 3. A. Simplified block diagram of the probe; B. Simplified block diagram of the base station.
Challenges
1. Microbial fuel cells cannot output the current and voltage required to
operate the electronic components used in the controller.
2. There is no potentiostat circuitry available which can be powered by a
microbial fuel cell.
To overcome these challenges, the following tasks and strategies were
employed.
Tasks
1. Design potentiostat circuitry.
2. Design power management circuitry.
3. Construct thin film mercury electrode which can be used to perform anodic
stripping voltammetry.

8
4. Operate the thin film mercury sensor using a commercial potentiostat and
the potentiostat developed in this thesis.
Strategy
1. Use super capacitor to store the electrical energy output by the microbial
fuel cell and to supply the high current required to operate the sensor
circuitry.
2. Use DC-DC converter to step up the voltage of the microbial fuel cell.
3. Use a supervisory microcontroller to periodically monitor the amount of
energy accumulated in the super capacitor and turn on the potentiostat
when enough energy is accumulated to perform one full anodic stripping
voltammetry (ASV) sequence.
4. To conserve power, use a separate DC-DC converter for powering the
potentiostat and the power management circuitry. In this arrangement, the
DC-DC converter powering the potentiostat can be completely turned off
which lowers the continuous power requirement considerably.
5. Integrate the custom designed potentiostat with a long range wireless data
transmitter.
Microbial Fuel Cells
A microbial fuel cell is an electrical power source which uses microbes as
a catalyst to convert chemical energy into electrical energy [16]. Microbial fuel

9
cells can be configured in different ways depending on the type of anodic and
cathodic reaction. The microbial fuel cell used in this work consisted of a
sacrificial anode combined with cathodic reduction of biomineralized manganese
oxide [2]. The sacrificial anode used was an alloy composed mainly of
magnesium. The other metals present in the alloy help passivate the magnesium
and therefore lower its dissolution rate to prolong its life. The anodic and cathodic
reactions occur according to Equation 2 and Equation 3, respectively. Equation 3
occurs in two steps; first, biomineralized manganese dioxide is reduced to
produce manganese oxyhydroxide (Equation 4), and then the manganese
oxyhydroxide is further reduced to produce divalent magnesium ions (Equation
5). The divalent magnesium ions (Equation 5) are electrodeposited by microbial
action. The potentials in Equation 2 to Equation 5 were calculated using Nernst
equation (Equation 1).
]Ox[]d[Reln
nFRTEE 0
' −= Equation 1
Mg ⇒ Mg 2+ + 2e- E’ pH=7.2 = -2.105 VSCE Equation 2
MnO2(s) + 4H+ + 2e- ⇒ Mn 2+ + 2H2O E’p H=7.2 = +0.36 VSCE Equation 3
MnO2(s) + H+ +e- ⇒ MnOOH(s) E’pH=7.2 = +0.383 VSCE Equation 4
MnOOH(s) + 3H+ +e- ⇒ Mn2+ +2H2O E’pH=7.2 = +0.336 VSCE Equation 5

10
Sensor Theory
The sensor used in this work was operated using anodic stripping
voltammetry (ASV), which is a well known electroanalytical technique commonly
used for determining heavy metal concentrations in water samples [17-22]. Using
precision instrumentation measuring low level currents, concentration levels of
parts per billion of metal ions present in the water samples can be determined.
ASV consists of two discreet steps (Figure 4). First, the metal ions present in the
water sample are electrodeposited on a thin film of mercury by applying a
negative potential at the working electrode with respect to the reference
electrode. Then, the potential of the working electrode is scanned towards a
positive potential with respect to the reference electrode. During the scanning
peaks are observed at certain stripping potentials. Each metal has different
stripping potential. The stripping potentials for copper and lead are 185mVSCE
and -430mVSCE respectively. A calibration curve can be prepared by measuring
the peak current for different concentrations of the metal present in the water
sample. Initially, ASV was carried out using a dropping mercury electrode [23] as
the working electrode, but the latest advancements involve a thin film mercury
electrode [24] and ultramicroelectrodes as the working electrode [25]. This
reduces the mercury requirement and also makes it an attractive option for
environmental water pollution monitoring. For this research, thin film mercury
11
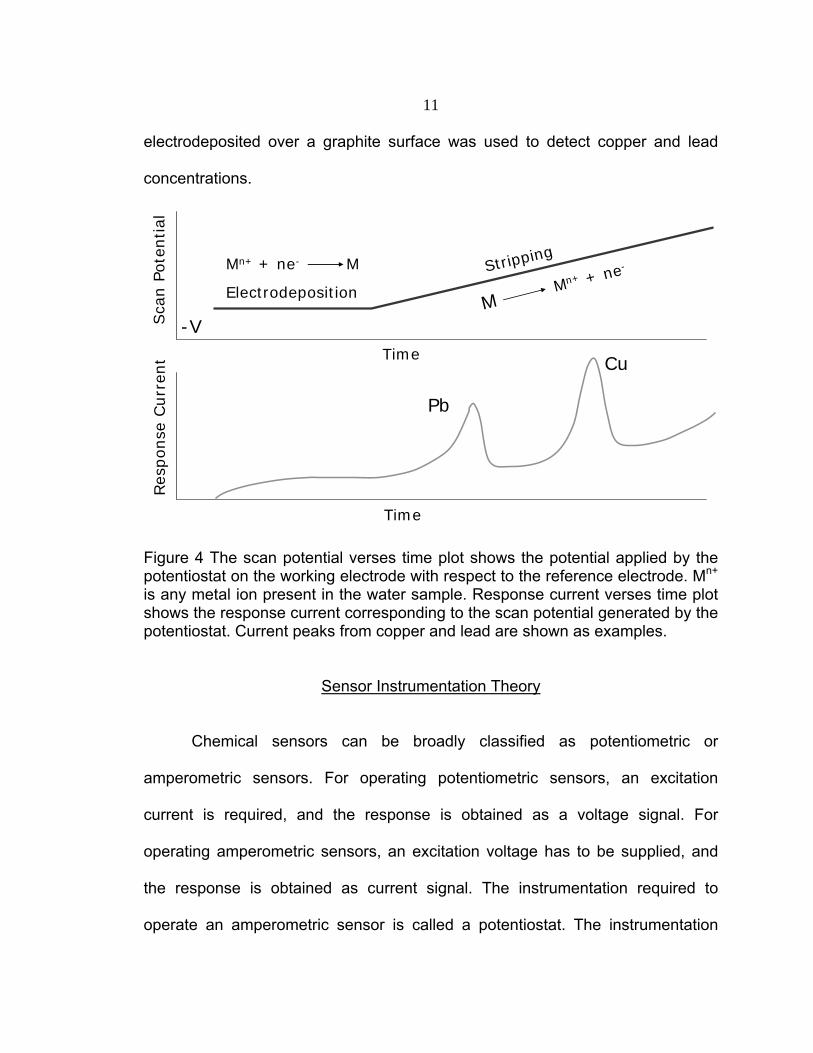
electrodeposited over a graphite surface was used to detect copper and lead
concentrations.
-VSca
n Po
tent
ial
Res
pons
e Cur
rent
Time
Pb
Cu
Electrodeposition
StrippingMn+ + ne- M
MMn+ + ne-
Time
Figure 4 The scan potential verses time plot shows the potential applied by the potentiostat on the working electrode with respect to the reference electrode. Mn+ is any metal ion present in the water sample. Response current verses time plot shows the response current corresponding to the scan potential generated by the potentiostat. Current peaks from copper and lead are shown as examples.
Sensor Instrumentation Theory
Chemical sensors can be broadly classified as potentiometric or
amperometric sensors. For operating potentiometric sensors, an excitation
current is required, and the response is obtained as a voltage signal. For
operating amperometric sensors, an excitation voltage has to be supplied, and
the response is obtained as current signal. The instrumentation required to
operate an amperometric sensor is called a potentiostat. The instrumentation

12
required to operate a potentiometric sensor is called a galvanostat. In this work,
the type of sensor instrumentation developed is a potentiostat that could be
programmed to operate amperometric sensors. In order to operate the ASV
sensor used in this thesis, the potentiostat’s microcontroller was loaded with a
program that performs ASV sequence. By changing the program loaded in the
potentiostat’s microcontroller, different types of amperometric sensors can be
operated by the potentiostat. Measuring very low concentrations of heavy metal
ions using ASV requires high precision instrumentation. In this work, by using a
combination of high precision analog and digital integrated circuits, the
potentiostat developed was able to perform ASV with a high degree of accuracy.
The response current values from ASV were digitized. This facilitated the
wireless transfer of data to the base station using digital mode. Use of digital data
transmission increased reliability over longer distances when compared to analog
data transmission.
Increasing the Potential Output by the Microbial Fuel Cell
Integrated circuit chips used in the controller required a minimum of 5V for
operation. The useful operating voltage of the microbial fuel cell used in this work
can range anywhere between 0.8 V and 2.1 V. The effect of high electrical
resistance of natural water combined with variations in microbial activity is the
main factor affecting the operating voltage output by the microbial fuel cell. For
stepping up the voltage of the microbial fuel cell, a DC-DC converter circuit was

13
used. This DC-DC converter was able to output the 5V required for the operation
of the sensor instrumentation, the wireless transmitter, and the power
management microcontroller.
Storing Energy
The power requirements of the potentiostat and the wireless transmitter
were met by storing energy in a super capacitor. A capacitor which has very high
storage capacity and very low leakage current is called a super capacitor. When
the sensor is not operational, the electrical energy produced accumulates in the
capacitor. Super capacitors can output a current that is many times greater than
the microbial fuel cell’s output current. With the super capacitor being the major
contributor, the current output by the super capacitor and microbial fuel cell
together is used to operate the controller. Use of the super capacitor makes it
possible to calculate the amount of energy accumulated by knowing the terminal
voltage. This makes it easier for the power management circuitry to determine if
enough energy has been accumulated in the super capacitor to perform one full
ASV sequence and wireless transmission.

14
MATERIALS AND METHODS
Overall Functional Description of the System
The detailed block diagram of the sensor system consisting of the probe
and the base station is shown in Figure 5. The master microcontroller in the
power management circuitry (Figure 5 A) determines when to turn on the
potentiostat circuitry (Figure 5 A.f). The master microcontroller constantly
monitors the voltage across the super capacitor (Figure 5 A.b). Whenever the
R16 bit DAC
Microcontroller Master
64Kb EEPROM
Wire
less
Tr
ansm
itter
Ele
ctro
chem
ical
Sen
sor
WE
CE
REF
R24 bit Σ-∆- ADC
R
Mic
roco
ntro
ller
Sla
ve
Charge Pump(+/- 10V output)
DC-DC Converter No. 2
(+5V output)
Potentiostat
DC-DC ConverterNo. 1
(+5V output)
Enable/Diasable
Super Capacitor(0 to 2.1 V output)Microbial Fuel Cell
(0 to 2.1 V output)
Power Management
64Kb EEPROM
Wireless reciever
Microcontroller
Satlink® Satellite Transmitter
PC
CFe
f
ag
c
bd
Probe Base Station
A B
Digital section
Analog section
Figure 5. Detailed block diagram of the complete system consisting of the probe (A) and the base station (B). (RE = Reference electrode, WE= Working electrode, CE= Counter electrode, PC=Potential controller, F=Voltage follower, CF=Current follower).

15
super capacitor accumulates enough charge to perform one ASV scan and
wireless transmission, the master microcontroller turns on the power to the
potentiostat circuitry by enabling the DC/DC converter No.2 (Figure 5 A.a). Once
powered up, the potentiostat circuitry starts performing the ASV sequence and
then transmits the data wirelessly using the wireless transmitter (Figure 5 A.e).
To conserve power, the wireless transmitter stays in sleep mode unless enabled
by the potentiostat circuitry for the wireless data transmission. After the wireless
transmission, the slave microcontroller in the potentiostat informs the master
microcontroller (Figure 5 A.b) that the ASV data transmission is finished. The
master microcontroller shuts down the power to the potentiostat circuitry and
waits until the super capacitor accumulates enough charge for performing
another ASV scan and wireless transmission. The microcontroller at the base
station (Figure 5 B) receives the data from the wireless receiver and delivers it to
the data buffer memory of the satellite transmitter. The satellite transmitter sends
the data to the satellite at the programmed time window every day. The data can
be accessed from the central satellite database website.
Potentiostat
The potentiostat circuitry (Figure 5 A.a) has a digital and analog section.
The analog section (Figure 5 A.g) was constructed using high precision
operational amplifiers [23]. The digital section (Figure 5 A.f) was composed of an
analog to digital converter (ADC), digital to analog converter (DAC), and slave
16
microcontroller. The function of the potential control (PC) operational amplifier is
to maintain the potential between the reference electrode and the working
electrode equal to the potential output by the DAC. The PC carries out this
function by varying the current flowing through the working electrode and the
counter electrode. The PC is used in a potential adder configuration. The voltage
follower (F) serves as a buffer so that only very small current is drained from the
reference electrode. The operational amplifier configured as a voltage amplifier
and inverter serves as a current to voltage converter (CF). CF makes it possible
to read current in terms of voltage. The voltage output by the CF is proportional
to the current flowing through the counter electrode and the working electrode.
The voltage output by the voltage follower, which is equal to the response
current, is converted to digital codes by the ADC. These digital data are
sequentially stored in the electrically erasable programmable read only memory
(EEPROM). Once the ASV sequence is finished, the response current data
stored in the EEPROM are transmitted to the base station.
Microbial Fuel Cell
The microbial fuel cell was deployed in the Hyalite Creek, in Bozeman,
MT. Twelve magnesium-alloy rods (Farwest Corrosion Control Company,
Gardena, CA 90248) connected in parallel were used as anodes. The anodes
were partly buried at the bottom of Hyalite Creek. The magnesium-alloy anode
developed a potential of -1.6VSCE in the Hyalite Creek water. The cathode was

17
made up of 316L stainless steel wire. Stainless steel wire balls were enclosed in
a wooden frame and then immersed in the water stream. This arrangement was
left in the water for several days so that microbial activity could develop at the
cathode. The stainless steel wires developed an open circuit potential of about
428mVSCE when deployed in Hyalite Creek water.
Electrochemical Sensor
The working electrode was fabricated by electrodepositing mercury on a
glassy carbon electrode (3mm X 150mm Sigma Aldrich 496545-60G, CAS 7782-
42-5). The glassy carbon electrode was masked using Teflon tape so that the
mercury electrodeposition occurred over 40mm length of the electrode. Solution
containing 1ppm of Hg2+ was used as the electrolyte for the mercury
electrodeposition. The electrolyte was prepared by dissolving mercurous nitrate
dihydrate (Sigma Aldrich #230413, CAS 7782-86-7) in deionized water
containing 5% (w/w) concentrated nitric acid. Electrodeposition was carried out
by applying a potential of -0.9 VSCE on the glassy carbon electrode using a
Princeton Research EG&G 237A potentiostat for 1 minute. A glassy carbon
electrode was used as the counter electrode.
The ASV sensor was assembled by fixing the thin film mercury electrode,
saturated Ag/AgCl reference electrode, and graphite counter electrode in a
rubber stopper with appropriate holes drilled (Figure 6). The whole assembly was

18
enclosed in a PVC tube with an open end. The sensor was deployed by
submerging the open end of the PVC casing in the water.
Controller
Counter Electrode
Reference Electrode
Working Electrode
Glassy carbon rod masked with Teflon
tape
Un-masked glassy carbon rod with thin
film of mercury electrodeposited
Figure 6. ASV sensor assembly.
Detailed Controller Circuit Description Analog to Digital Conversion
Figure 7 shows the detailed circuit diagram of the analog to digital
conversion section of the potentiostat. The ADC (Figure 7) was supplied with the
voltage signal from the current follower (Figure 9: I_TO_V), and the voltage
signal was converted to a 24bit digital code. Since the voltage signal output by
the current to voltage converter was in the range of -4V to +4V, a voltage level
converter (Figure 7: ADC_BIP_CONV) was used to convert it to the 0 to 4V
range. For analog to digital conversion to occur, the ADC had to be supplied with
19
a clock signal (CLK). The clock signal was generated using the µC3 micro
controller (Figure 7).
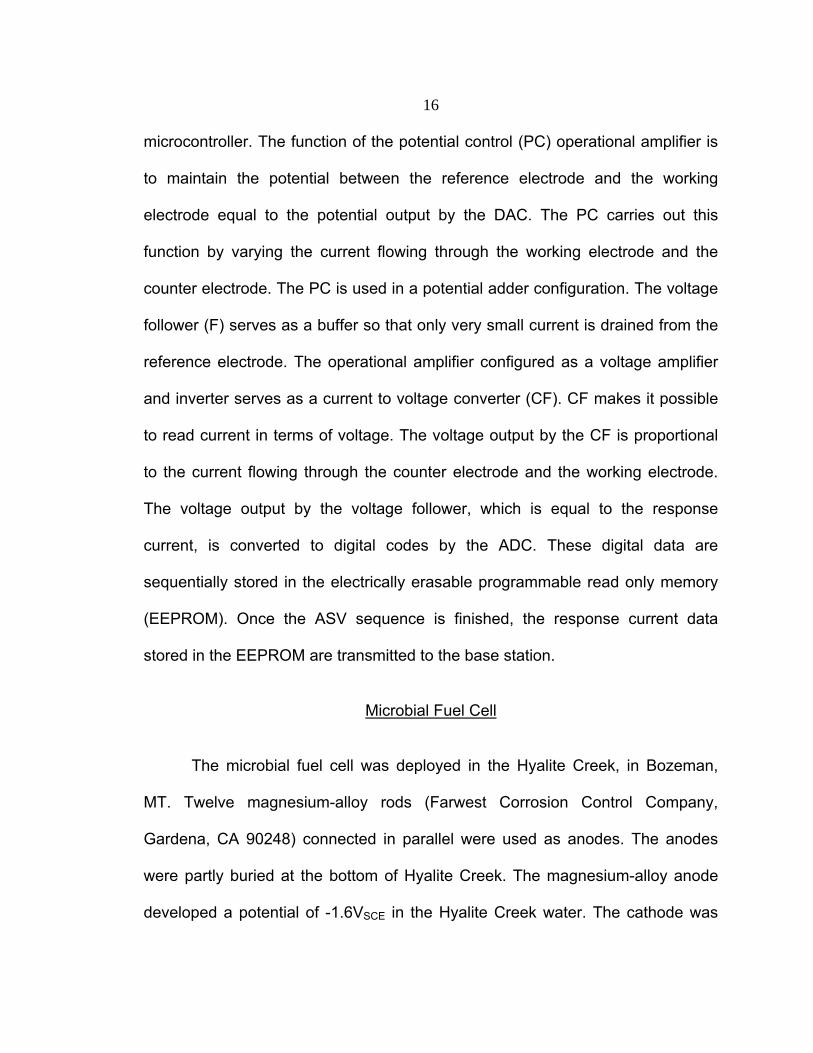
Figure 7. Circuit diagram of the analog to digital conversion section of the potentiostat. Digital to Analog Conversion
The 16bit digital code supplied to the digital to analog converter (Figure 8:
DAC) was converted to an analog signal in the range of 0 to 5 V. Since the ASV
scanning process involved negative and positive potentials, the DAC was
coupled with operational amplifier (Figure 8: ADC_BIP_CONV) to generate -2.5V
to +2.5V bipolar outputs.
Analog Section
The analog section of the potentiostat was constructed using operational
amplifiers. To minimize the amount of current drawn from the reference
electrode, the REF_BUF (Figure 9) was wired as a voltage follower. The I_TO_V

20
(Figure 9) was wired as a current follower, which performed the function of
converting the response current to equivalent voltage signal. The ADDER,
configured as a potential adder, performed the function of maintaining the
potential between the reference electrode and the working electrode equal to the
voltage output by the DAC. The detailed circuit diagram of the analog section of
the potentiostat is shown in Figure 9.
Figure 8. Circuit diagram of digital to analog conversion section. EEPROM
Figure 10 shows the wiring diagram of the EEPROM to the µC1
microcontroller. During the ASV sequence, response current values were stored
in the EEPROM1 (Figure 10). Current values stored in the EEPROM1 were
delivered to the wireless transmitter after the ASV sequence was finished.

21
Figure 9. Analog section of the potentiostat.
Figure 10. Wiring diagram of EEPROM to the µC1.
Reference Voltage Generator
The DAC and the ADC required stable accurate reference voltage for
proper functioning. This reference voltage was generated using the circuit given

22
in Figure 11. A REC3140 (Figure 11) generated the highly stable voltage that
was coupled with the voltage buffer to produce a highly stable reference voltage.
Figure 11. Detailed circuit diagram of the reference voltage generator. Charge Pump
Figure 12 shows the detailed circuit diagram of the charge pump. Two
charge pumps were wired in parallel to generate ±10V and up to 20mA of
current. The voltage output of the charge pumps was used to operate the
operational amplifiers in the analog section of the potentiostat.
Power Management
Figure 13 shows the detailed circuit diagram of the power management
section of the controller. The electrical energy produced by the microbial fuel cell
was stored in the super capacitor (SC). The voltage across the SC gradually
increased with increases in the amount of energy stored. The comparator in DC1

23
Figure 12. Detailed circuit diagram of the charge pump. (Figure 13) was configured to enable its output as soon as the voltage across the
SC reached 1.1V. The voltage at which the DC1 would enable its output was set
using the VR2 (Figure 13). When the DC1 enabled its output (5V), the µC2
(Figure 13) was powered up and started the execution of the ASV sequence
program stored in its flash memory. The program in µC1 (Figure 13) constantly
polled the voltage across the super capacitor. When the voltage across the super
capacitor reached 1.4V, the DC2 (Figure 13) output was enabled by sending
signal high to the SHDN pin of the DC2, and then the program in the µC2
stopped execution until Pin10 went high. Once the DC2 powered the µC1, the
program stored in the µC1 was executed. The program in µC1 performed the
ASV sequence, the data transmission using wireless transmitter, and then sent
the high signal to Pin10. As soon as Pin10 went high, the program in the µC2
disabled the DC1 output and then waited for 24 hours before enabling the DC1
output.

24
Figure 13. Detailed circuit diagram of the power management circuitry.
Controller Circuit Board Construction
The circuit layout and the PCB layout was done using ExpressSCH and
Express PCB respectively, both supplied by www.expresspcb.com . In order to
reduce the PCB fabrication cost and also to make a compact PCB, a two sided
PCB design was used. The components were placed in a manner to make a
smaller PCB. Once the component placement was finished the circuit layout file

25
was linked to the PCB layout file. This linking helped in connecting the
components using the connection aid feature present in the ExpressPCB
software. Most of the PCB tracks connecting the components were placed on the
component side. Those tracks, which cannot be laid without crossing the other
tracks, were placed on the bottom side of the PCB layout. The complete
controller circuit diagram and the controller PCB layout are shown in
Figure 15 and Figure 16 respectively. The detailed base station circuitry
and the base station PCB layout are given in Figure 14 and Figure 17
respectively. Once the PCB layout was finished, it was submitted online to
www.pcbexpress.com for fabrication. Figure 16 shows the PCB layout of the
controller created using ExpressPCB software.
Figure 17 shows the PCB layout of the base station circuitry. Green on the
PCB layout represents the bottom side of the PCB. Red represents the top side
(component side) of the PCB.
The microcontrollers were mounted to the circuit board using a socket for
easy removal and insertion. This helped in the developmental phase when the
microcontroller had to be removed for software updates. The electronic
components were mounted on the PCB using low temperature solder (300oC). All
of the integrated circuits (IC) used were surface mounted except for the
microcontrollers which were mounted using sockets. Once the circuit layout was
finished, the first step in the PCB layout was to decide the placement of the
active components.

26
Figure 14. Complete circuit diagram of the base station.
The master and slave microcontrollers (PIC12F688) were supplied by
Microchip Technology Inc, Arizona, USA. The DC-DC converters were based on
MAX1797 supplied by Maxim Integrated Products, Sunnyvale, CA. The ADC
(ADS1252, Texas Instruments) had a resolution of 24bits and was supplied by
Texas Instruments, Dallas, TX. The DAC was based on MAC5442 (Maxim) which
had a resolution of 16 bits. The analog section was constructed based on ultra
low offset voltage operational amplifiers MAX400 supplied by Maxim Integrated
Products, Sunnyvale, CA. The charge pump used to generate the ±10V supply
voltage for the analog section was based on MAX865 (Maxim). A more
comprehensive list of components used is given in Table 1.

27
Table 1. List of components used to construct the controller board.
Component Name Abbreviation Component
Part Number/ Datasheet Reference
Source
DAC Digital to Analog Converter
MAX54444 [26]
DC1, DC2 DC-DC Converter MAX1797 [27]
CP1, CP2 Charge Pump MAX865 [28]
DAC_BIP_CONV, ADDER, REF_BUF, I_TO_V
Operational Amplifier MAX400 [29]
Maxim Integrated Products, Inc., Sunnyvale, CA USA
ADC_BIP_CONV Operational Amplifier OPA2350 [30]
Texas Instruments Inc., Dallas, Texas, USA
ADC Analog to Digital Converter
ADC1252 [31]
µC1, µC2, µC4 Micro Controller PIC16F688 [32]
Microchip Technology Inc., Chandler, Arizona, USA
EEPROM1, EEPROM2
Electrically Erasable Programmable Read Only Memory
25AA320 [34]

28
Table 1-Continued
TX, RX Radio Modem 9XTend
MaxStream, Inc., Lindon, Utah, USA
SC Super Capacitor BCAP0350
Maxwell Technologies Inc., San Diego - USA
C1, C2, C4, C22, C9, C12, C11, C14, C10, C16
Capacitor 0.1µF Generic
C20, C3, C21, C15 Capacitor 47 µF Generic
C18, C19, C5, C6, C8, C7 Capacitor 3.3µF Generic
C13 Capacitor 10µF Generic
R1, R2, R8, R6, R7, R3 Resistor 10KΩ Generic
R9 Resistor 68KΩ Generic
R4 Resistor 20KΩ Generic
R5 Resistor 1MΩ Generic
VR1 Variable resistor( 10 turn) 1MΩ Generic
VR2 Variable resistor(10 turn) 100KΩ Generic
L1, L2 Inductor (surface mount) 22µH Generic
µC3 Micro Controller PIC12F675 [33]

29
Figu
re 1
5. S
chem
atic
repr
esen
tatio
n of
the
cont
rolle
r circ
uit.

30
Figure 16. PCB layout of the controller.
Figure 17. PCB layout of the base station circuitry.

31
Wireless Transmitter
The radio modem used for wireless transmission and reception of the data
from the potentiostat to the base station was based on the long range OEM RF
module 9XTend (Maxstream Inc, Lindon, UT). To conserve power, the radio
modem in the potentiostat was configured to the “transmission only” mode, while
the radio modem in the base station was configured to the “receiver only” mode.
The data were sent to the satellite using Satlink2 Multi-Satellite transmitter
manufactured by Sutron Corporation, Sterling, VA. The Satlink2 module had 4 kb
of transmit buffer memory. Data received by the Satlink2 were temporarily stored
in the transmit buffer until the next transmission time window. Data transmitted to
the satellite were cleared after the transmission. The data received by the
environmental satellite were sent to the file transfer protocol (FTP) server. The
data from the FTP could be accessed using the FTP client program supplied by
Sutron Corporation, Sterling, VA. The FTP program collected and saved the data
as text files.
Storing Energy and Capacitor Selection
The correct size (Farad) of the super capacitor had to be used for
accumulating the energy output by the MFC. An oversized capacitor would take a
long time to get charged up to the operating voltage of the sensor circuitry. An
undersized capacitor would not have enough charge to deliver the required

32
current/potential for the length of time the controller required power. The
discharge current of a capacitor is related to the rate of removal of charge from
the capacitor according to the Equation 6. The amount of charge (Q)
accumulated in the capacitor is related to the voltage and the capacitance
according to the Equation 7. Substituting for Q from Equation 7 into Equation 6
we get Equation 8. Equation 8 upon rearrangement and integration yields
Equation 10. The value of the integration constant can be obtained by setting t=0
and V=Vt=0. Substituting Equation 11 into Equation 10 and rearranging yields
Equation 12. Further simplification of Equation 12 yields Equation 13.
dtdQI = Equation 6
VCQ = Equation 7
dt)CV(dI ×
−= Equation 8
dtdVCI −= Equation 9
aVCtI +×−=× Equation 10
0tVCV =×= Equation 11
CtIVC
V 0t ×−×= = Equation 12
CtIVV 0t
×−= = Equation 13
The capacitor size can be estimated using Equation 13. To estimate the
capacitor size, Vt=0 is set to 1.5V, the voltage at which the ASV sequence is

33
started by the sensor circuitry. V is set to 1V, which is slightly higher than the
minimum voltage required for the proper functioning of the sensor circuitry.
Average discharge current (I) is set to the average current drawn by the sensor
circuitry, 0.5A. Total discharge time (t) is set to 160s, the time required to perform
one complete ASV sequence and data transmission. For the selected parameter
values, the value of capacitance of the capacitor (C) equals 266F. The super
capacitor available from Maxwell technologies in this range has a capacity of
350F, which was used in the power management circuitry described in this
paper. The leakage current for the capacitor selected is 300µA. Equation 13 does
not take into account the voltage drop (IxRint) due to the internal resistance of the
capacitor, where Rint is the internal resistance of the super capacitor. In the case
of the super capacitor, Rint is very small, and thus, the voltage drop due to
internal resistance can be neglected.
Deployment Site
The sensor system was deployed at Hyalite Creek in Bozeman, MT. This
is the site where the Biofilm Structure and Function group’s microbial fuel cell has
been deployed for the past 4 years. Since there were no detectable levels of
metal ion concentration in the creek water, the system was tested by immersing
the sensor in a beaker containing water from the creek and adding different
amounts of copper and lead.

34
Current Consumption Determination
The current drawn by the power management circuitry and the
potentiostat from the super capacitor has a pulsating nature. This makes it
difficult to measure the current consumption by the controller. To calculate the
current drawn by the circuitry, an indirect method was used. In this method, the
controller was operated by using a charged super capacitor. While the controller
was operating, the potential across the super capacitor was logged using the HP
34970A data acquisition/switch unit with a logging interval of 1 second. The
current drawn by the controller, at any instant of time during the operation, was
calculated using Equation 14 (since the logging interval is 1 sec Δt =1). The
average current and power drawn by the controller was calculated using
Equation 15 and Equation 16, respectively.
tVIC Δ
Δ=
Equation 14
∑∑ ×
=t
tII avg
Equation 15
∑∑ ××
=t
tIVE avg
Equation 16
Runtime of the System
The runtime of the probe was calculated based on the anode lifetime. The
lifetime of the magnesium anode used depends on the amount of current drawn

35
by the controller. Equation 17 was used to calculate the runtime of the controller
developed in this work.
SleepActive
MgMglifetime II
WCt
+
×=
Equation 17

36
RESULTS AND DISCUSSION
Figure 18 shows the photograph of the controller that was developed. It
was connected to the telemetry system, microbial fuel cell, super capacitor, and
sensor before operation.
Figure 18. Prototype of the controller. Figure 19 and Figure 20 show the results of the ASV performed on
various known concentrations of copper and lead ion in the creek water, using
the commercial (EG&G 273A) potentiostat and the controller, respectively. Both
instruments demonstrated similar peaks. The maximum currents for copper and
lead were observed at 185mVSCE and -430mVSCE, respectively. By using the
peak current values at these potentials calibrations curves were generated and

37
are shown in Figure 21 and Figure 22 for lead and copper, respectively. The data
in Figure 21 and Figure 22 demonstrated that the custom designed potentiostat
was able to produce results similar to that of the commercially potentiostat.
-300
-100
100
300
500
700
900
1100
-1000 -500 0 500
Cur
rent
(µA
)
Potential (mV) vs Ag/AgCl
0.1 ppm0.2 ppm0.3 ppm0.4 ppm0.5 ppm0.6 ppm
Pb and Cu
Pb Peaks
Cu Peaks
Figure 19. ASV response curves obtained from the commercial potentiostat. Scan Rate = 25mV/s. Deposition time=60s.
-300
-100
100
300
500
700
900
1100
-1000 -500 0 500
Cur
rent
(µA
)
Potential (mV) vs Ag/AgCl
0.1 ppm0.2 ppm0.3 ppm0.4 ppm0.5 ppm0.6 ppm
Pb Peaks
Cu Peaks
Pb and Cu
Figure 20. ASV response curves obtained from the custom made sensor circuitry. Scan Rate = 25mV/s. Deposition time=60s.

38
0
100
200
300
400
500
0 0.1 0.2 0.3 0.4 0.5 0.6 0.7
Pb (ppm)
Pea
k re
spon
se c
urre
nt (u
A)
Custom potentiostat Commercial potentiostat
Figure 21. Calibration curves obtained for lead using the commercial potentiostat and the custom made sensor circuitry. The current values were extracted from the lead peaks in Figure 19 and Figure 20. The data points from commercial potentiostat and custom made sensor circuitry overlap.
0
200
400
600
800
1000
0 0.1 0.2 0.3 0.4 0.5 0.6 0.7
Cu (ppm)
Pea
k re
spon
se c
urre
nt (u
A)
Custom potentiostat Commercial potentiostat
Figure 22 Calibration curves obtained for copper using the commercial potentiostat and the custom made sensor circuitry. The current values were extracted from the copper peaks in Figure 19 and Figure 20. The data points from commercial potentiostat and custom made sensor circuitry overlap.

39
Figure 23 shows the potential across the capacitor during the deployment
of the sensor system in the Hyalite creek. The capacitor was charged using the
microbial fuel cell. It took about 42 hrs to charge the capacitor up to a voltage of
1.4V. When a voltage of 1.4V was reached the ASV sequence was started and
then the data were transmitted wirelessly. By the end of the wireless
transmission the voltage across the capacitor was about 1.2V. It took about
20hrs for the capacitor to be charged back to a voltage of 1.4V. According to the
setup used (size of the electrode, capacitor size, transmission power, etc.) a
minimum of one transmission per day was achieved.
0
0.5
1
1.5
2
2.5
0 10 20 30 40 50 60 70 80
Pot
entia
l acr
oss
supe
r cap
acito
r (V
)
Time (hours)
No load potential
First transmissionSecond transmission
Figure 23. Voltage across the super capacitor connected to the microbial fuel cell and controller during the deployment in the field.

40
Figure 24 shows the discharge voltage and current of the 350F super
capacitor powering the controller. The capacitor potential was 1.4V before being
connected to the controller. Using the data from Figure 24 and Equation 16, the
average energy consumed by the controller was calculated as 9.3mWh for one
complete cycle starting with the deposition until the end of the wireless
transmission. The average energy consumed by the controller in the sleep mode
was calculated as 1.45µWh. Using Equation 15, the average current consumed
by the controller was calculated to be 163mA and 4.4mA while active and in
sleep mode, respectively. Using Equation 17 the runtime of the controller
powered by the microbial fuel cell was calculated to be 71720 hrs (11.27 years).
-0.2
0.0
0.2
0.4
0.6
0.8
1.0
1.2
1.10
1.15
1.20
1.25
1.30
1.35
1.40
1.45
0 20 40 60 80 100 120 140
Cur
rent
dra
wn
by th
e co
ntro
ller (
A)
Volta
ge a
cros
s M
FC (V
)
Time (s)
PotentialCurrent
deposition scan sleep
transmission
Figure 24. Plot of voltage across the capacitor and the current drawn during different functional phases of the controller. Different functional phases of the controller are shown above the time axis.

41
Implications of the Described System
This research focused on the development of a controller which can be
powered by a microbial fuel cell. The electrochemical sensor used in this study
was able to measure heavy metal concentration as low as 0.1 ppm. Measuring
concentrations of heavy metals lower than 0.1 ppm can be more attractive since
it can help detect early stages of contamination due to heavy metals. Lower
concentrations of heavy metals can be measured by using ASV sensor based on
microelectrodes [25]. The sensor instrumentation developed in this work can be
easily adapted to work with other sensors (microelectrode array, etc.) by
changing the gain using VR1 (Figure 9). Thus, measuring lower concentration of
heavy metals is still possible by selecting a different sensor while keeping the
same system configuration used in this work.
The endurance of the thin film ASV sensors has to be assessed by
performing long-term studies. Other research groups are trying to improve the
ruggedness of these sensors by coating the thin film mercury with protective
membranes [35]. The microbial fuel cell used for testing the sensor system
employs a sacrificial magnesium anode. To fully realize the environmentally
friendly remote sensor system, it is necessary to power the controller using
microbial fuel cells [36-40] which uses microbial reactions at both anode and
cathode. Microbial fuel cells using microbial reactions at both anode and cathode
develop lower operating voltages than the microbial fuel cell used in this work. A

42
solution to use the currently designed controller with microbial fuel cells with
lower operating voltage is by adding a voltage booster stage to the power
management circuitry, based on a charge pump which accepts input voltages as
low as 300mV and outputs voltage greater 1V. Another key issue that has to be
studied is the effect of back feeding of the current from the super capacitor to the
microbial fuel cell. Back feeding of the current into the microbial fuel cell occurs
when the voltage of the microbial fuel cell falls lower than the voltage of the super
capacitor. Voltage of the microbial fuel cell can go lower than the typical
operating voltage depending on various factors such as changes in the microbial
activity, resistance of the electrolyte (water system), etc. One of the methods
used commonly in electronic circuitry to avoid back feeding is by using a diode.
But diodes cannot be used to stop the back feeding of the current to the microbial
fuel cell, due to a large voltage drop (0.7V) across the diode.
Conclusions
In this thesis the development and testing of a controller powered by a
microbial fuel cell was carried out successfully. The controller was programmed
to perform ASV and transmit copper and lead concentration data wirelessly to a
base station. The microbial fuel cell powered potentiostat was able to operate
identically to a commercially available high power requiring potentiostat. The
probe deployed was able to operate and transmit the data to the base station

43
every 24 hours. The average current consumption of the controller was 163 mA
and 4.4 mA in the active and sleep mode, respectively.
Using the controller developed in this work, any generic amperometric
sensor can be operated in the field. Since the wireless transmitter used in the
controller can transmit over a long distance, the base station can be situated
miles away from the sensor deployment site. This facilitates the possibility of
deploying many sensors over a large radius surrounding the base station.
Modifications to the microcontroller program loaded in the potentiostat and the
base station have to be made in order to receive data from multiple controllers
using one central base station. By developing the proposed power management
circuitry and the potentiostat circuitry, this work has demonstrated that microbial
fuel cells can be a solution to the problems associated with the power sources
used in the prevailing remote sensors.

44
REFERENCES CITED
1. Rhoads, A., H. Beyenal, and Z. Lewandowski. "Microbial fuel cell using anaerobic respiration as an anodic reaction and biomineralized manganese as a cathodic reactant." Environmental Science & Technology 39.12 (2005): 4666-71.
2. Shantaram, A. et al. "Wireless sensors powered by microbial fuel cells."
Environmental Science & Technology 39.13 (2005): 5037-42. 3. Avinash Shantaram. "Power Management for Microbial Fuel Cells - MS
Thesis." Montana State University - Library (2005).
4. Kim, N. et al. "Effect of initial carbon sources on the performance of microbial fuel cells containing Proteus vulgaris." Biotechnology and Bioengineering 70.1 (2000): 109-14.
5. Cooney, M. J. et al. "Physiologic studies with the sulfate-reducing
bacterium Desulfovibrio desulfuricans: Evaluation for use in a biofuel cell." Enzyme and Microbial Technology 18.5 (1996): 358-65.
6. Ter Heijne, A., H. V. M. Hamelers, and C. J. N. Buisman. "Microbial fuel
cell operation with continuous biological ferrous iron oxidation of the catholyte." Environmental Science & Technology 41.11 (2007): 4130-34.
7. Gil, G. C. et al. "Operational parameters affecting the performance of a
mediator-less microbial fuel cell." Biosensors & Bioelectronics 18.4 (2003): 327-34.
8. Min, B. K., S. A. Cheng, and B. E. Logan. "Electricity generation using
membrane and salt bridge microbial fuel cells." Water Research 39.9 (2005): 1675-86.
9. Oh, S., B. Min, and B. E. Logan. "Cathode performance as a factor in
electricity generation in microbial fuel cells." Environmental Science & Technology 38.18 (2004): 4900-04.
10. Yun, K. S. et al. "A miniaturized low-power wireless remote environmental
monitoring system based on electrochemical analysis." Sensors and Actuators B-Chemical 102.1 (2004): 27-34.
11. Steinberg, M. D. and C. R. Lowe. "A micropower amperometric
potentiostat." Sensors and Actuators B-Chemical 97.2-3 (2004): 284-89.

45
12. Kwakye, S. and A. Baeumner. "An embedded system for portable
electrochemical detection." Sensors and Actuators B-Chemical 123.1 (2007): 336-43.
13. Serra, P. A. et al. "Design and construction of a low cost single-supply
embedded telemetry system for amperometric biosensor applications." Sensors and Actuators B-Chemical 122.1 (2007): 118-26.
14. Beni, V. et al. "Development of a portable electroanalytical system for the
stripping voltammetry of metals: Determination of copper in acetic acid soil extracts." Analytica Chimica Acta 552.1-2 (2005): 190-200.
15. Reay, R. J. et al. "Microfabricated electrochemical analysis system for
heavy metal detection." Sensors and Actuators B-Chemical 34.1-3 (1996): 450-55.
16. Allen, R. M. and H. P. Bennetto. "Microbial Fuel-Cells - Electricity
Production from Carbohydrates." Applied Biochemistry and Biotechnology 39 (1993): 27-40.
17. Batley, G. E. and T. M. Florence. "Evaluation and Comparison of Some
Techniques of Anodic-Stripping Voltammetry." Journal of Electroanalytical Chemistry 55.1 (1974): 23-43.
18. Garnier, C. et al. "Voltammetric procedure for trace metal analysis in
polluted natural waters using homemade bare gold-disk microelectrodes." Analytical and Bioanalytical Chemistry 386.2 (2006): 313-23.
19. Baldo, M. A. et al. "Remote stripping analysis of lead and copper by a
mercury-coated platinum microelectrode." Electroanalysis 16.5 (2004): 360-66.
20. Tanaka, T. et al. "Simultaneous determination of trace copper, lead,
cadmium and zinc in iron and steel by stripping analysis." Tetsu to Hagane-Journal of the Iron and Steel Institute of Japan 89.9 (2003): 906-13.
21. Konvalina, J., E. Khaled, and K. Vytras. "Carbon paste electrode as a
support for mercury film in potentiometric stripping determination of heavy metals." Collection of Czechoslovak Chemical Communications 65.6 (2000): 1047-54.

46
22. Matysik, F. M. and G. Werner. "Trace-Metal Determination in Tears by Anodic-Stripping Voltammetry in A Capillary-Flow Injection System." Analyst 118.12 (1993): 1523-26.
23. Larry R.Faulkner and Allen J.Bard. "Electrochemical Methods:
Fundamentals and Applications." Wiley.ISBN: 978-0-471-04372-0 (2004).
24. Florence, T. M. "Anodic Stripping Voltammetry with A Glassy Carbon Electrode Mercury-Plated In-Situ." Journal of Electroanalytical Chemistry 27.2 (1970): 273-&.
25. Wehmeyer, K. R. and R. M. Wightman. "Cyclic Voltammetry and Anodic-
Stripping Voltammetry with Mercury Ultramicroelectrodes." Analytical Chemistry 57.9 (1985): 1989-93.
26. Data sheet: MAX54444 +3V/+5V, Serial-Input, Voltage-Output, 16-Bit
Digital to Analog Converters. Maxim Integrated Products Rev 1; 6/01 (2001).
27. Data sheet: MAX1797 Low Supply Current, Step-Up DC-DC Converters
with True-Shutdown. Maxim Integrated Products 19-1798; Rev 0; 12/00 (2000).
28. Data sheet: MAX865 Compact, Dual-Output Charge Pump. Maxim
Integrated Products 19-0472; Rev 1; 7/97 (1997).
29. Data sheet: MAX400 Ultra-Low Offset Voltage Operational Amplifier. Maxim Integrated Products 19-3001; Rev 1; 12/03 (2003).
30. Data sheet: OPA2350 - High-Speed, Single-Supply, Rail-to-Rail
OPERATIONAL AMPLIFIERS MicroAmplifierSeries. Texas Instruments SBOS099C (2005).
31. Data sheet: ADC1252 - 24-Bit, 40kHz ANALOG-TO-DIGITAL
CONVERTER. Texas Instruments SBAS127D (2006).
32. Data sheet: PIC16F688 14-Pin Flash-Based, 8-Bit CMOS Microcontrollers with nanoWatt Technology. Microchip Technology Inc. DS41203B (2004).
33. Data sheet: PIC12F629/675 14-Pin Flash-Based, 8-Bit CMOS
Microcontrollers with nanoWatt Technology. Microchip Technology Inc. DS41190C (2003).

47
34. Data sheet: 25AA320/25LC320/25C320 - 32K SPI™ Bus Serial EEPROM. Microchip Technology Inc. DS21227E (2004).
35. Hoyer, B., T. M. Florence, and G. E. Batley. "Application of Polymer-
Coated Glassy-Carbon Electrodes in Anodic-Stripping Voltammetry." Analytical Chemistry 59.13 (1987): 1608-14.
36. He, Z., H. B. Shao, and L. T. Angenent. "Increased power production from
a sediment microbial fuel cell with a rotating cathode." Biosensors & Bioelectronics 22.12 (2007): 3252-55.
37. Lowy, D. A. et al. "Harvesting energy from the marine sediment-water
interface II - Kinetic activity of anode materials." Biosensors & Bioelectronics 21.11 (2006): 2058-63.
38. Ryckelynck, N., H. A. Stecher, and C. E. Reimers. "Understanding the
anodic mechanism of a seafloor fuel cell: Interactions between geochemistry and microbial activity." Biogeochemistry 76.1 (2005): 113-39.
39. Tender, L. M. et al. "Harnessing microbially generated power on the
seafloor." Nature Biotechnology 20.8 (2002): 821-25.
40. Reimers, C. E. et al. "Harvesting energy from the marine sediment-water interface." Environmental Science & Technology 35.1 (2001): 192-95.


![Hybrid Solar-Wind Energy Harvesting for Embedded ...gsharma/papers/HadiHybSolarWindH… · range can be powered from piezoelectric [21], thermal [22], microbial [23], RF [24], wind](https://static.fdocuments.in/doc/165x107/5f203788f639433c210df263/hybrid-solar-wind-energy-harvesting-for-embedded-gsharmapapershadihybsolarwindh.jpg)