Charis Grape Seed Oil Extraction Contact: [email protected].
Upload
trannguyetCategory
view
217download
0
Food Chemistry 170 (2015) 271–280
Contents lists available at ScienceDirect
Food Chemistry
journal homepage: www.elsevier .com/locate / foodchem
Chemical investigation of commercial grape seed derived productsto assess quality and detect adulteration
http://dx.doi.org/10.1016/j.foodchem.2014.08.0840308-8146/� 2014 Elsevier Ltd. All rights reserved.
⇑ Corresponding authors at: New Use Agriculture and Natural Plant ProductsProgram, Department of Plant Biology and Pathology, Rutgers University, NewBrunswick, NJ 08901, United States. Tel.: +1 848 932 6239; fax: +1 732 932 9441(J.E. Simon). Tel.: +1 848 932 6238; fax: +1 732 932 9441 (Q. Wu).
E-mail addresses: [email protected] (J.E. Simon), [email protected] (Q. Wu).
Tom S. Villani a,b, William Reichert a, Mario G. Ferruzzi c, Giulio M. Pasinetti d,e, James E. Simon a,b,⇑,Qingli Wu a,b,⇑a New Use Agriculture and Natural Plant Products Program, Department of Plant Biology and Pathology, Rutgers University, New Brunswick, NJ 08901, United Statesb Department of Medicinal Chemistry, Ernest Mario School of Pharmacy, Rutgers University, Piscataway, NJ 08854, United Statesc Department of Food Science, Purdue University, West Lafayette, IN 47907, United Statesd Department of Neurology, Mount Sinai School of Medicine, New York, NY 10029, United Statese Geriatric Research, Education and Clinical Center, James J. Peters Veterans Affairs Medical Center, Bronx, NY 10468, United States
a r t i c l e i n f o
Article history:Received 5 March 2014Received in revised form 28 July 2014Accepted 5 August 2014Available online 26 August 2014
Keywords:Grape seed extractLC–MSPolyphenolProanthocyanidinsAdulterationQuality control
a b s t r a c t
Fundamental concerns in quality control arise due to increasing use of grape seed extract (GSE) and thecomplex chemical composition of GSE. Proanthocyanidin monomers and oligomers are the majorbioactive compounds in GSE. Given no standardized criteria for quality, large variation exists in thecomposition of commercial GSE supplements. Using HPLC/UV/MS, 21 commercial GSE containingproducts were purchased and chemically profiled, major compounds quantitated, and compared againstauthenticated grape seed extract, peanut skin extract, and pine bark extract. The antioxidant capacity andtotal polyphenol content for each sample was also determined and compared using standard techniques.Nine products were adulterated, found to contain peanut skin extract. A wide degree of variability inchemical composition was detected in commercial products, demonstrating the need for developmentof quality control standards for GSE. A TLC method was developed to allow for rapid and inexpensivedetection of adulteration in GSE by peanut skin.
� 2014 Elsevier Ltd. All rights reserved.
1. Introduction
Grapes and grape-derived products are rich in numerous bioac-tive dietary polyphenols which have been attributed to improvinghealth and nutrition (Castaneda-Ovando, Pacheco-Hernández,Páez-Hernández, Rodríguez, & Galán-Vidal, 2009; Welch, Wu, &Simon, 2008). Polyphenols from grape-derived products have beenassociated with the prevention of numerous diseases includingcardiovascular diseases, neurodegenerative diseases such asAlzheimer’s disease, as well as several forms of cancers (Aziz,Kumar, & Ahmad, 2003; Bertelli & Das, 2009; Ho et al., 2013;Pasinetti & Ho, 2010; Renaud & de Lorgeril, 1992). Epidemiologicaland experimental evidence supports the hypothesis that specificgrape polyphenols may serve as disease preventative agents(Aziz et al., 2003; Bertelli & Das, 2009; Jang et al., 1997; Pasinetti
& Eberstein, 2008; Renaud & de Lorgeril, 1992). These compoundsinclude proanthocyanidin monomers and oligomers such ascatechin, epicatechin, and proanthocyanidin dimers, which arethe major constituents in extracts of grape seed (Bertelli & Das,2009; Fuleki & da Silva, 1997; Ho, Yemul, Wang, & Pasinetti,2009; Wang et al., 2008).
Proanthocyanidins (PACs) are oligomeric conjugates of anycombination of the four isomers (±)-catechin and (±)-epicatechin(Fuleki & da Silva, 1997). Two distinct classes of PACs can bedefined based on chemical structure, known as A-type (Lou et al.,1999) and B-type PACs (Manach, Williamson, Morand, Scalbert, &Rémésy, 2005). A-type PACs (not found in GSE) contain a 4b ? 8C–C bond and a 2b ? O ? 7 C–O bond between the two monomerunits, whereas the B-type PACs contain only the 4b ? 8 bond,and occasionally the 4b ? 6 bond (Passos et al., 2007) (Fig. 1).Proanthocyanidin oligomers containing (�)-epicatechin also occurwith differing degrees of galloylation (Rasmussen, Frederiksen,Struntze Krogholm, & Poulsen, 2005). While proanthocyanidinscome with a wide range of degree of polymerization (DP), interestis focused on the proanthocyanidin monomers and dimers (DP < 3)because researchers have found that only the monomers anddimers are absorbed into human intestinal tissue and into
12022905.D: UV Chromatogram, 280
A
B
C
GAC
EC
B2P2
P2G1P3
P1G1 P3
C EC
B2
P2
P2G1P3
A2
5 10 15 20 25 30 Time [min]
High weight oligomer “bulge”
High weight oligomer “bulge”
P2
A2
P1G1
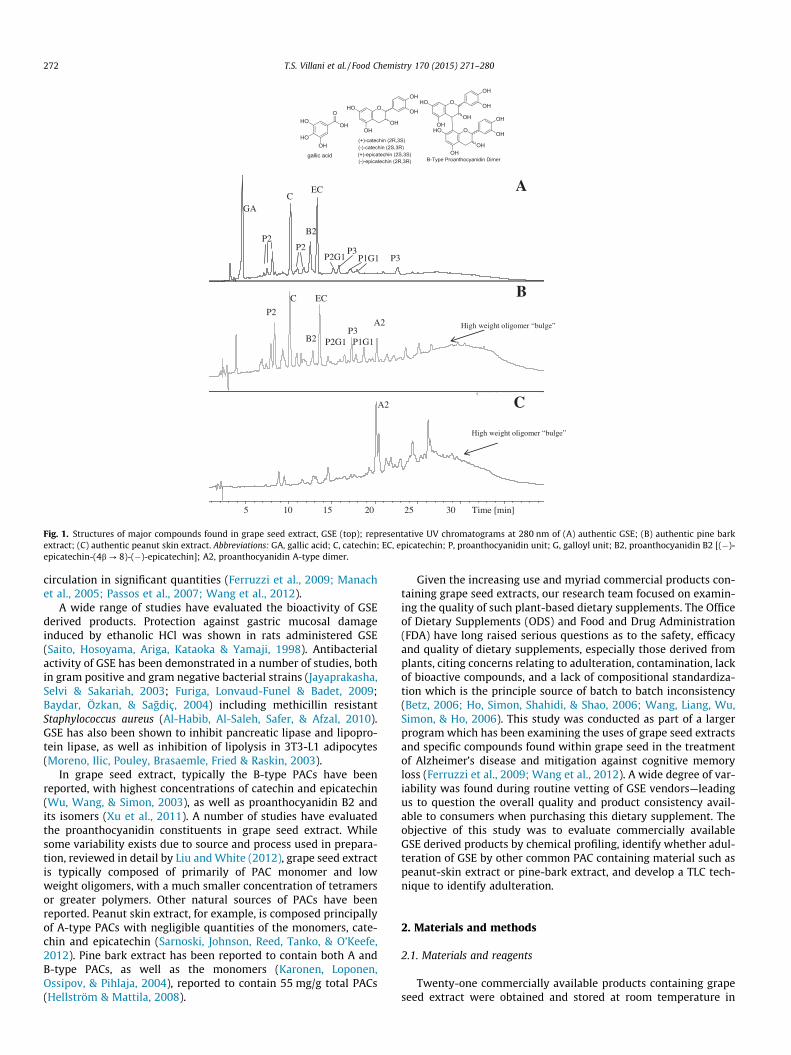
Fig. 1. Structures of major compounds found in grape seed extract, GSE (top); representative UV chromatograms at 280 nm of (A) authentic GSE; (B) authentic pine barkextract; (C) authentic peanut skin extract. Abbreviations: GA, gallic acid; C, catechin; EC, epicatechin; P, proanthocyanidin unit; G, galloyl unit; B2, proanthocyanidin B2 [(�)-epicatechin-(4b ? 8)-(�)-epicatechin]; A2, proanthocyanidin A-type dimer.
272 T.S. Villani et al. / Food Chemistry 170 (2015) 271–280
circulation in significant quantities (Ferruzzi et al., 2009; Manachet al., 2005; Passos et al., 2007; Wang et al., 2012).
A wide range of studies have evaluated the bioactivity of GSEderived products. Protection against gastric mucosal damageinduced by ethanolic HCl was shown in rats administered GSE(Saito, Hosoyama, Ariga, Kataoka & Yamaji, 1998). Antibacterialactivity of GSE has been demonstrated in a number of studies, bothin gram positive and gram negative bacterial strains (Jayaprakasha,Selvi & Sakariah, 2003; Furiga, Lonvaud-Funel & Badet, 2009;Baydar, Özkan, & Sagdiç, 2004) including methicillin resistantStaphylococcus aureus (Al-Habib, Al-Saleh, Safer, & Afzal, 2010).GSE has also been shown to inhibit pancreatic lipase and lipopro-tein lipase, as well as inhibition of lipolysis in 3T3-L1 adipocytes(Moreno, Ilic, Pouley, Brasaemle, Fried & Raskin, 2003).
In grape seed extract, typically the B-type PACs have beenreported, with highest concentrations of catechin and epicatechin(Wu, Wang, & Simon, 2003), as well as proanthocyanidin B2 andits isomers (Xu et al., 2011). A number of studies have evaluatedthe proanthocyanidin constituents in grape seed extract. Whilesome variability exists due to source and process used in prepara-tion, reviewed in detail by Liu and White (2012), grape seed extractis typically composed of primarily of PAC monomer and lowweight oligomers, with a much smaller concentration of tetramersor greater polymers. Other natural sources of PACs have beenreported. Peanut skin extract, for example, is composed principallyof A-type PACs with negligible quantities of the monomers, cate-chin and epicatechin (Sarnoski, Johnson, Reed, Tanko, & O’Keefe,2012). Pine bark extract has been reported to contain both A andB-type PACs, as well as the monomers (Karonen, Loponen,Ossipov, & Pihlaja, 2004), reported to contain 55 mg/g total PACs(Hellström & Mattila, 2008).
Given the increasing use and myriad commercial products con-taining grape seed extracts, our research team focused on examin-ing the quality of such plant-based dietary supplements. The Officeof Dietary Supplements (ODS) and Food and Drug Administration(FDA) have long raised serious questions as to the safety, efficacyand quality of dietary supplements, especially those derived fromplants, citing concerns relating to adulteration, contamination, lackof bioactive compounds, and a lack of compositional standardiza-tion which is the principle source of batch to batch inconsistency(Betz, 2006; Ho, Simon, Shahidi, & Shao, 2006; Wang, Liang, Wu,Simon, & Ho, 2006). This study was conducted as part of a largerprogram which has been examining the uses of grape seed extractsand specific compounds found within grape seed in the treatmentof Alzheimer’s disease and mitigation against cognitive memoryloss (Ferruzzi et al., 2009; Wang et al., 2012). A wide degree of var-iability was found during routine vetting of GSE vendors—leadingus to question the overall quality and product consistency avail-able to consumers when purchasing this dietary supplement. Theobjective of this study was to evaluate commercially availableGSE derived products by chemical profiling, identify whether adul-teration of GSE by other common PAC containing material such aspeanut-skin extract or pine-bark extract, and develop a TLC tech-nique to identify adulteration.
2. Materials and methods
2.1. Materials and reagents
Twenty-one commercially available products containing grapeseed extract were obtained and stored at room temperature in

T.S. Villani et al. / Food Chemistry 170 (2015) 271–280 273
the dark until use. These 21 products were obtained from a varietyof sources including vitamin supplement retailers, supermarkets,and online vendors in order to gather a representative samplingof the products available to consumers. All products purchasedwere also well within their lot expiration dates as provided bythe manufacturer. To ensure no bias introduced based on productbranding, sample codes were assigned to each product to obfuscatethe identity of the commercial products; this code was assigned bya researcher not involved in subsequent analysis. The productswere capsules containing GSE powder; some of the products con-tained excipients, binders, and/or flow agents which wasaccounted for in quantitative analysis by normalizing by the ratioof the labeled GSE to mass of powder in each capsule (shown inTable 1). Three of the products (01, 02 and 10) contained labeledresveratrol. Authenticated reference materials were provided byBannerBio Nutraceuticals Inc. (Shenzhen, China). HPLC grade ace-tonitrile (ACN), methanol (MeOH), ethanol, formic acid (FA), aceticacid, hydrochloric acid, toluene, acetone and HPLC grade waterwere obtained from Fisher Scientific Co. (Fair Lawn, NJ). Trolox,ABTS, potassium persulfate, and sodium carbonate were obtainedfrom Sigma Aldrich (St. Louis, MO). Folin Ciocalteau PhenolReagent was obtained from MP Biomedicals LLC (Solon, OH). Van-illin and gallic acid were obtained from Acros Organics (Geel, Bel-gium). Silica XG TLC plates, 200 lm thickness, with UV254
indicator, were obtained from Sorbent Technologies (Norcross,GA) and stored sealed and dry until use.
2.2. Sample preparation
Samples were prepared and analyzed by adapting a methoddeveloped previously by our group for the analysis of grape derivedproducts (Xu et al., 2011). All samples were capsules containingpowdered material. 10–20 capsules were opened, powder com-bined, and the capsule shells discarded. Approximately 50 mg ofthe sample was weighed and placed into a 25.00 mL volumetricflask. 70% methanol (aqueous) with 0.1% acetic acid was added tothe flask, and the flask was sonicated for 30 min, conditioned toroom temperature, and brought back to volume. Grape seedextract, pine bark extract, and peanut skin extract reference mate-rials were prepared in the same fashion. While authentic grapeseed extract is soluble at this concentration, a number of commer-cial samples contained insoluble material. HPLC samples were pre-pared by filtering each extract through a 0.45 lm nylon syringefilter into an amber HPLC autosampler vial. Samples were storedat �20 �C until analysis. These solutions were also used for TLCanalysis.
2.3. HPLC–UV–MS conditions
HPLC separation was performed on a Polaris amide-C18 col-umn, 250 � 4.6 mm, 5 lm (Varian Inc., Palo Alto, CA). For LC–MSanalysis, a Hewlett Packard Agilent 1100 Series LC/MS (AgilentTechnologies, Waldbronn, Germany) equipped with autosampler,quaternary pump system, DAD detector, degasser, MSD trap withan electrospray ion source (ESI) was applied, and software for dataprocessing was HP ChemStation, Bruker Daltonics 4.2 and DataAnalysis 4.2.
HPLC separation was performed with the mobile phase contain-ing solvent A (0.1% formic acid in water) and B (0.1% formic acid inacetonitrile) in gradient: 0–20 min, linear gradient from 10% to 20%B; 20–30 min, linear gradient from 20% to 30% B; 30–40 min, iso-cratic elution at 30% B; 40–50 min, linear gradient from 30% to50%; 50–60 min, linear gradient from 50% to 60%. The flow ratewas set at 1.0 mL/min with a 1:10 splitter after the output of theUV detector leading �100 lL/min to the ESI-MS. The UV detectorwas set at 254, 280, 370, 520 nm. The eluent was monitored by
electrospray ion mass spectrometer (ESI-MS) scanned from m/z100 to 1200. ESI was conducted by using a needle voltage of±3.5 kV (positive and negative mode). High purity nitrogen(99.999%) was used as dry gas at a flow rate of 8 L/min and capil-lary temperature was at 350 �C. Nitrogen was used as nebulizer at45 psi, and helium as collision gas.
2.4. Identification and quantification of compounds
Gallic acid, as well as proanthocyanidins monomers and oligo-mers were quantitated or estimated. The identities of catechin, epi-catechin, gallic acid, and proanthocyanidin B2 were confirmed bycomparison to standard compounds. PAC derivatives weredetected at 280 nm and the tentative structures assigned by ana-lyzing the MS and UV data. Quantitation of catechin, epicatechin,and gallic acid was achieved by construction of a calibration curveby serial dilution of standardized reference materials, obtainedfrom ChromaDex (Irvine, Ca.). Quantitation of PAC dimers wasachieved by comparison of response to authenticated proanthocy-anidin-B2 [(�)-Epicatechin-(4b ? 8)-(�)-epicatechin] referencematerial, obtained from ChromaDex (Irvine, Ca.). Stock solutionsof known concentration were prepared in 70% methanol with0.1% acetic acid and stored in amber vials at �20 �C until use. Toestimate the quantity of the proanthocyanidin dimers (P2) ofunknown stereochemical configuration, and O-galloylated deriva-tives of monomer (P1G1) and dimer (P2G1) the calibrationresponse for catechin (for P1G1) or proanthocyanidin B2 (forP2G1 and PAC trimer P3) was adjusted by the ratio of the molecu-lar weights of the derivative to PAC B2. Final results are expressedas a combined measure of stereo/regioisomers.
2.5. Statistical analysis
Statistical clustering techniques to reduce the dimensionality oflarge sets of collected data, which allows for detection of emergentpatterns in underlying data sets (Jackson, 2004) is common inquality control analysis of natural products. Clustering analysis isa valuable technique used in the analysis of complex sample matri-ces, allowing for a grouping of samples based on compositionalsimilarity (Lawaetz, Schmidt, Staerk, Jaroszewski, & Bro, 2009;Xie et al., 2006; Liang, Xie, & Chan, 2004). We hypothesized thatthis technique could be applied to allow for the differentiationbetween products containing authentic grape seed extract, andproducts adulterated with pine bark and/or peanut-skin basedthe differences in quantitative composition. Clustering analysiswas accomplished using R mathematical programming language(R Development Core Team, 2011). Each sample was treated as alinearly independent vector whose dimensions are spanned bythe vector-space described by the quantitative data gatheredthrough HPLC analysis. The data was normalized for each individ-ual analyte. Clustering analysis was performed using the Wardclustering method, using the Euclidean distance.
2.6. Assay methods
The method for determination of total antioxidants was used asdescribed (Zululeta, Esteve, & Frígola, 2009) with minor modifica-tions, based on the capacity of a sample to inhibit the ABTS radicalcompared with to Trolox�(water-soluble vitamin E derivative). TheABTS radical was generated by single electron oxidation by potas-sium persulfate (K2S2O8), accomplished by preparing a solutioncontaining 7.46 mM ABTS and 2.44 mM K2S2O8, in deionized H2O.This solution was allowed to stand in darkness at room tempera-ture for 12–16 h (the time required for formation of the radical).The working solution was prepared by taking a volume of the pre-vious solution and diluting it in ethanol until its absorbance at

Table 1Quantitative composition, antioxidant capacity and total phenol content of commercial grape seed extract (GSE) samples and reference materials.a
GA (mg/g) C (mg/g) EC (mg/g) P2 (mg/g) P1G1 (mg/g) P2G1 (mg/g) P3 (mg/g) Total PACs (mg/g) TEAC (mmol/g) GAE (mg/g) Labeled content ofGSE/capsule (mg/g)
01 102.0 ± 5.84 16.7 ± 1.31 12.6 ± 0.48 43.6 ± 1.67 N.D. 70.3 ± 0.03 7.2 ± 0.11 252.5 3773.5 ± 70.91 167.6 ± 2.54 16002 N.D. 39.9 ± 0.48 20.4 ± 0.35 4.1 ± 0.09 N.D. N.D. N.D. 64.4 8410.2 ± 9.42 211.5 ± 12.58 60003 N.D. 7.9 ± 0.17 4.0 ± 0.02 7.1 ± 0.26 6.2 ± 0.51 N.D. 8.2 ± 0.82 33.2 4813.9 ± 153.85 102.7 ± 11.42 67004 N.D. 22.2 ± 0.04 18.3 ± 1.32 28.8 ± 1.57 12.0 ± 0.10 20.7 ± 0.8 10.3 ± 0.15 112.3 3978.6 ± 68.92 96.6 ± 6.96 96505 N.D. 2.6 ± 0.05 N.D. 1.5 ± 0.02 N.D. N.D. N.D. 4.2 5512.5 ± 43.64 138.2 ± 5.62 98206 N.D. 16.7 ± 1.38 10.3 ± 0.46 21.4 ± 2.01 N.D. N.D. N.D. 48.4 6416.2 ± 166.98 179.4 ± 8.36 95907 22.1 ± 1.63 15.9 ± 0.33 21.1 ± 0.01 125.9 ± 10.81 N.D. N.D. N.D. 185.0 11490.8 ± 184.03 1052.8 ± 35.1 95108 N.D. 2.7 ± 0.02 3.3 ± 0.12 15.8 ± 0.6 N.D. 5.7 ± 0.03 3.2 ± 0.20 30.6 4145.2 ± 61.84 779.3 ± 24.12 96409 N.D. 4.4 ± 0.01 6.8 ± 0.51 51.9 ± 0.91 4.1 ± 0.00 N.D. 23.1 ± 0.87 90.2 12061.4 ± 110.88 461.1 ± 4.24 95910 N.D. 79.7 ± 5.54 46.2 ± 3.12 N.D. N.D. N.D. N.D. 125.9 4618.3 ± 11.93 120.3 ± 3.28 25011 N.D. 17.2 ± 0.23 14.3 ± 0.75 24.3 ± 1.04 3.3 ± 0.25 15.6 ± 0.06 8.1 ± 0.07 82.9 6166.2 ± 15.48 88.1 ± 16.11 95312 N.D. 3.0 ± 0.12 N.D. 6.6 ± 0.23 N.D. N.D. N.D. 9.6 10308.1 ± 93.19 543.6 ± 6.06 96813 N.D. 3.7 ± 0.14 N.D. 5.5 ± 0.14 N.D. N.D. N.D. 9.2 5381 ± 51.35 105.8 ± 13.55 99114 N.D. 4.0 ± 0.09 N.D. 2.2 ± 0 N.D. N.D. N.D. 6.2 6865.4 ± 51.35 204.8 ± 5.60 98415 N.D. 19.8 ± 0.32 14.0 ± 0.49 11.2 ± 0.2 N.D. N.D. N.D. 44.9 5210.9 ± 131.75 194.7 ± 3.00 95816 N.D. N.D. N.D. N.D. N.D. N.D. N.D. 0.0 5991.5 ± 159.2 134.8 ± 13.10 84017 N.D. 1.6 ± 0.15 N.D. 5.4 ± 0.12 N.D. N.D. N.D. 7.1 4317.3 ± 42.33 74.4 ± 9.75 96218 11.5 ± 0.69 34.9 ± 0.8 26.5 ± 1.18 98.0 ± 4.4 25.0 ± 1.88 55.6 ± 4.78 12.2 ± 0.89 263.7 10721.4 ± 52.66 713 ± 23.49 97219 10.9 ± 0.55 34.1 ± 0.78 31.6 ± 1.29 154.5 ± 7.56 N.D. 22.9 ± 1.05 23.2 ± 1.64 277.1 11480.8 ± 52.17 731.9 ± 19.55 97520 N.D. 19.2 ± 1.33 16.3 ± 0.72 103.5 ± 7.46 N.D. 7 ± 0.3 11.6 ± 0.69 157.6 3612.2 ± 62.75 91.2 ± 3.24 87021 29.7 ± 1.97 37.0 ± 0.09 36.1 ± 3.39 68.6 ± 4.14 N.D. 137.5 ± 6.96 22.1 ± 1.68 331.0 8363.8 ± 73.52 96.9 ± 8.80 984GSE1 35.5 ± 0.77 58.6 ± 0.94 68.4 ± 3.74 154.0 ± 4.95 17.5 ± 1.35 32.0 ± 0.05 31.6 ± 1.10 397.6 14555.1 ± 21.42 955.4 ± 48.45 -GSE2 0.4 ± 0.01 54.1 ± 0.83 66.0 ± 1.11 166.5 ± 11.03 14.7 ± 0.68 29.1 ± 0.72 28.4 ± 2.71 359.1 12272.8 ± 20.55 936.7 ± 45.45 –GSE3 0.7 ± 0.02 61.1 ± 2.34 64.0 ± 2.79 148.3 ± 3.58 21.6 ± 0.39 48.4 ± 4.25 49.6 ± 2.85 393.7 13981.2 ± 27.37 961.1 ± 46.85 –Peanut N.D. N.D. N.D. N.D. N.D. N.D. N.D. 252.5 11695.1 ± 61.07 933.2 ± 42.81 –Pine N.D. 19.7 ± 1.95 8.9 ± 0.68 16.1 ± 1.12 15.5 ± 1.33 N.D. 20.4 ± 1.69 64.4 10203.6 ± 36.24 791.8 ± 62.26 –
a GA = gallic acid, C = catechin, EC = epicatechin, P = proanthocyanidin unit, G = galloyl unit, TEAC = Trolox equivalent anti-oxidant capacity, GAE = total phenolics as gallic acid equivalents, N.D. = not detected. Values reported arethe average of at least 3 measurements.
274T.S.V
illaniet
al./FoodChem
istry170
(2015)271–
280

T.S. Villani et al. / Food Chemistry 170 (2015) 271–280 275
k = 734 nm was 0.70 ± 0.02. The measuring was done using an Agi-lent G1111AA UV–Vis spectrophotometer. For this purpose, 990 llof the ABTS radical was added to the cuvette; the absorbance wasmeasured, and 10 ll of sample or standard solution were addedimmediately. The final absorbance was measured. There is a quan-titative relationship between the reduction of the absorbance andthe concentration of antioxidants present in the sample. A calibra-tion curve was prepared using Trolox at a range of 0.0359–1.65 mM in ethanol. Trolox Equivalent Anti-oxidant Capacity(TEAC) was expressed as the content in mmol Trolox/g samplerequired to achieve the same response as measured in the sample.
The concentration of total phenolics was measured by adaptingthe method reported previously (Kim, Jeong, & Lee, 2003), origi-nally described by Singleton and Rossi. A serial dilution serieswas prepared using gallic acid at a concentration ranging from31.2 lg/mL to 4.00 mg/mL. A reagent blank using ddH2O was pre-pared. Folin–Ciocalteau reagent was diluted to 10% in water. 40 lLeach sample was added to an Eppendorf tube. 900 lL 10% Folin–Ciocalteau reagent was added. After 5 min, 400 lL of 15% Na2CO3
solution was added with mixing. After incubation for 90 min atroom temperature, the absorbance versus prepared blank was readat 750 nm. Total phenolic contents were expressed as mg gallicacid equivalents per gram sample material.
Sample solutions were prepared as described in Section 2.2,except without the addition of 0.1% acetic acid to the solvent.The concentrations were adjusted such that the sample results fellwithin the calibration range of each assay. All samples were ana-lyzed in triplicate.
2.7. Thin layer chromatography
Developing solvent consisting of a ratio of 3:1:3 acetone/aceticacid/toluene was selected (Sun, Leandro, Ricardo da Silva, &Spranger, 1998), and prepared fresh before development. 50 lLeach sample solution (as prepared in Section 2.2) was spotted ontothe origin of the plate. Plates were thoroughly dried before devel-opment. After development 8–10 cm, plates were removed fromdeveloping chamber and allowed to dry thoroughly at room tem-perature. Plates were visualized by spraying with (or submergingin) vanillin stain (10 g vanillin dissolved in 50 mL concentratedHCl), followed by gently heating with a heat-gun.
2.8. Price analysis
Prices for each product were obtained from multiple retail out-lets and internet retailers. Prices from at least three different retail-ers were used in the calculation of the average prices for eachproduct. Since each bottle contained a varying number of capsuleswith a variable content of GSE, the total quantity of GSE per bottlewas obtained by multiplying the number of capsules by the self-reported content of GSE in each capsule. This allowed for the calcu-lation of a unit price representing the ratio of price to quantity GSEclaimed used in further analyses.
3. Results and discussion
Twenty-one commercial products containing grape seed extractwere analyzed for their profile and content of PAC monomers anddimers. The samples were chemically profiled, and major PAC con-stituents were estimated as described above. Under the optimizedLC–MS conditions and on the basis of analysis of the MS and UVdata and in comparison with the authenticated standards andreported data, the major constituents were successfully separated,identified, and quantitated/estimated (Fig. 1). Results of quantita-tive analysis are shown in Table 1. Six different proanthocyanidin
B-type dimers were found, including Proanthocyanidin B2 ([�]-epicatechin dimer), which was the major PAC dimer detected bymolecular ion [M�H]� at 577 m/z, [M+H]+ at 579 m/z, with majorfragment at 291 m/z. The sum of all six isomers for each sampleis reported in Table 1. Three galloylated proanthocyanidin mono-mers were detected by [M�H]� ion detected at 441 m/z in negativemode, [M+H]+ ion detected at 443 m/z in positive mode, with astrong fragment peak at 291 m/z; stereochemical or regiochemicalconfiguration was not determined. Proanthocyanidin trimer (P3)was detected by molecular ion [M�H]� at 865 m/z. A-type dimerwas detected in peanut skin extract and pine bark extract bymolecular ion [M�H]� at 575 m/z, and [M�H]+ at 577 m/z. Massspectral data for selected compounds is shown in the Supplemen-tary material (S1).
The average total content of the major components found inGSE contained by the three authentic grape seed reference stan-dards was found to be 383.5 ± 21.13 mg/g, with proanthocyanidinB dimers (P2) making up 41%, and catechin and epicatechin cumu-latively representing 32% of the total content detected by HPLC(Table 1). Many of the components contained in GSE were alsodetected in authentic pine bark extract reference material. Pinebark extract contained only 80.6 ± 6.77 mg/g of the seven majorcomponents found in GSE, with only 20% accounted for by PAC Bdimers (P2). This result is consistent with results found in the lit-erature (Hellström & Mattila, 2008). Gallic acid and O-galloylatedB dimers (P2G1) were not detected. Proanthocyanidin trimers(P3) were a major constituent of pine bark extract, embodying25% by mass, compared to only 6% found in GSE. None of the majorcompounds detected in GSE were detected in peanut skin extract.A comparison of the 280 nm UV chromatograms for authentic GSE,pine bark extract, and peanut skin extract is shown in Fig. 1. Theseresults show that GSE and pine bark extract contain a number ofPAC B dimers and galloylated derivatives, whereas peanut skinextract contains mostly high-weight oligomers and PAC A-dimers.
To understand more specific relationships about the variation ofcomponents across the population of commercial and authenticGSE, the coefficient of correlation (R value) was calculated for eachpair of components in the GSE sample population. As expected, thetwo isomers catechin and epicatechin, have the strongest correla-tion (R = 0.8461). Epicatechin content is also correlated with PACdimer (P2) content (R = 0.7770), which is reasonable to expectsince the major PAC dimer is PAC B2, a dimer of epicatechin. Thesame logic follows for the correlation between epicatechin andPAC trimer (P3). Unsurprisingly, P2 content was correlated to P3content (R = 0.7568), since PAC dimers are obviously precursorsto PAC trimers.
A comparison of the relative and absolute compositions ofauthentic GSE, commercial GSE, and pine bark is shown in Fig. 2aand b, respectively. The average composition of the commercialGSE samples reveals a large degree of inhomogeneity, the averageof the total GSE constituents was 101.7 ± 103.9 mg/g—a relativestandard deviation of 102%. The data also shows that the averagerelative composition of the commercial samples is very similar tothat of authentic GSE reference material and the absolute quantitycontained in the commercial samples is on average 73% less thanthe quantity in authentic GSE. The relative composition of pinebark extract is significantly different from that of GSE referencematerials.
Very few of the commercial GSE samples contained an overallcontent of PACs and catechins at a level comparable to authenticGSE, which raises a serious concern. As can be seen in Fig. 2c, thereare 9 commercial samples containing less than 50 mg/g GSE PACs—less than 15% of the content contained in samples of authentic GSE.Five samples contain less than 10 mg/g of major compounds foundin GSE. In sample 16, none of these compounds which should bepresent in GSE were even detected. Overall, six of the commercial

A
B
C
Fig. 2. (A) Relative and (B) absolute content of grape seed extract (GSE) reference material, the average of commercial GSE samples (n = 21) and pine bark extract; (C)quantitative results of Table 1, sorted by total content (mg/g).
276 T.S. Villani et al. / Food Chemistry 170 (2015) 271–280
samples could be considered seriously adulterated, perhaps coun-terfeit, while another five samples contained considerably lessPACs and catechins than the remaining commercial samples.
Scrutiny of the chromatograms from the six worst quality sam-ples, with the smallest content of GSE compounds (16, 5, 14, 17, 13and 12) in comparison to peanut skin extract, demonstrates thatthese samples are likely adulterated with peanut skin extract. Acomparison of the 280 nm chromatograms of 16 to authentic GSEand peanut skin extract show remarkable similarity (data shownin the Supplementary material S2). Examination of 280 nm chro-matograms and MS data for samples, 15, 6 and 3, show that theycontain PAC A-type dimers, suggesting that these three samplesare a mixture of GSE and peanut skin extract. In summation, ninesamples out of 21 have evidence of adulteration with peanut skinextract. This result was surprising and represents a concern rela-tive to food safety and human health.
A number of samples contained PACs and catechins at a levelmore similar to pine bark extract than to GSE; samples 9, 11, and3 show a high degree of similarity to authentic pine bark extract.A comparison of the 280 nm UV chromatogram of sample 3 toauthentic GSE and pine bark extract is shown in the Supplemen-tary material (S3). Two samples, 2 and 10, contain only catechinand epicatechin, likely a result of extraction of white grape varietyseeds, which have been shown to contain principally PAC mono-mers (Freitas & Glories, 1999); however the reported content inwhite grape seed extract is 4–5� higher than detected for 2 and10. A comparison of the 280 nm UV chromatograms for a numberof representative samples is included in the Supplementary mate-rial (S4).
There were six samples which contained concentrations of GSEPACs at a high level. Samples 01, 18, 19 and 21 each containedgreater than 200 mg/g GSE PACs. Samples 07, 20 contained greaterthan 150 mg/g. More importantly, each of these samples containedthe diversity of components expected in GSE—greater than twicethe concentration in pine bark extract. It is troubling to note thewide degree of variation in the total content among the testedproducts; variation can be accounted for by differing sources ofgrape seeds, grape variety, and extraction techniques. Such wide-spread variation in product composition creates difficulty for con-sumers who intend to use GSE for specific pharmacological effects.
In order to group the commercial samples and reference mate-rials according to their underlying compositional similarities, clus-tering analysis was applied to the normalized quantitative resultsobtained from HPLC analysis. Clustering analysis is amenable toquality control of natural products due to the complexity of naturalproducts. This technique allows for establishing groups based onsimilarity, permitting the reduction of the overall complexity ofthe data for analysis. Results of clustering analyses are shown inFig. 3a. The samples split into three major clusters: the first con-taining the authentic GSE (outlined in green) and samples high inPAC content, the second containing authentic pine bark extract(outlined in yellow) and commercial GSE samples with a lowercontent of PACs, and the last containing peanut skin extract (out-lined in red). The grouping of the samples is congruent with theinterpretations of the HPLC data offered in the preceding discus-sion. The samples which group with authentic GSE are the samesix samples containing the highest content of GSE PACs. The sam-ples which grouped in the cluster with peanut skin extract are the

17 12 13 16 25 5 14
10 94 112 26 6 15 3 8
1 2122 23 24
18 19 7 20
020
040
060
080
010
00
Hei
ght
A
B
Fig. 3. (A) Cluster dendrogram with corresponding quantitative data. Height of a branch indicates degree of similarity among the nodes on that branch; a large height meansthe branches are significantly different. Samples group into three major clusters. Only six samples group with the reference grape seed extract (GSE). (B) Representation of thequantitative composition of each sample from HPLC. Black outlines denote cost per gram of GSE reported. As can be seen, there is little correlation between price and content.Abbreviations: GA, gallic acid; C, catechin; EC, epicatechin; P, proanthocyanidin unit; G, galloyl unit.
T.S. Villani et al. / Food Chemistry 170 (2015) 271–280 277
same samples which contain less than 10 mg/g GSE PACs, reinforc-ing the argument that these samples are of unacceptably poorquality.
The most difficult cluster to interpret is the central cluster (out-lined in yellow). The samples that fall into this cluster can bedivided into two categories: those which may contain pine barkextract, and those that contain low levels of GSE PACs with respectto authentic GSE. Pine bark extract is found in this cluster due to itssimilarity to these samples, suggesting that these samples maypossibly contain pine bark extract. It should be noted, however,that GSE and pine bark extract contain a remarkably similar qual-itative profile of PAC monomers and dimers, and as such it is diffi-cult to distinguish between samples containing pine bark extract,and those with a low content of GSE compared to the referencestandards selected for this analysis. The samples contained in thiscluster differ significantly than the high-content GSE cluster whichcontains the authentic GSE selected for this study. The variationmay be accounted for due to differences in grape variety, whitevs. red grape seeds, or extraction technique. The samples in thiscluster, while they may be authentic GSE, contain a far lower over-all content of PACs than the samples contained in the green cluster.
To better understand the relationship between the price of theproduct and its quality, vis-à-vis its value to the consumer, com-prehensive pricing data for each product was compiled for analysis.This relationship was described by using the unit cost ($USD/g)GSE as paid for by the end consumer. To calculate the total massin each bottle purchased for this study, the number of capsuleswas multiplied by the mass GSE reported for each capsule on the
product label. For the mass to cost ratio, an average of at least 3prices offered at retail stores or through ecommerce were used.Detailed pricing data used for this study is contained in the Supple-mentary material (S5). The unit price ($/g) is shown in Fig. 3b. Thisdata is shown with the bar-graph representing the quantities ofeach compound detected by HPLC and below the clustering dia-gram in Fig. 3a. The content of GSE detected in the product, a mea-sure of the intrinsic quality, does not correlate with the price paidfor each product. This is further demonstrated in Fig. 4a, a correla-tion scatter plot between the unit price ($/g) and the total contentGSE determined by HPLC (mg/g), where the coefficient of determi-nation (R2) is 0.0116, suggesting that there is no correlationbetween price and quality as determined by HPLC. These resultsindicate that relative to commercial GSE products and their associ-ated label claims; consumers are paying an arbitrary price withregard to quality.
The complexity of the chemical composition of grape seedextract and its primary adulterants demonstrate the difficultyinvolved in the elucidation of the quality of GSE in manufacturing.A major problem which may contribute to the high proportion ofadulterated and low-quality GSE is the analytical techniques avail-able to the herbal products industry. Typically, due to cost and thelack of expertise in commercial analytical labs, and the industryemploys rapid, lower cost screens such as simple colorimetricand spectrophotometric assays. These assays are used to estimatetotal phenolic content or anti-oxidant activity, and therefore as ascreen for content/activity. The two major methods used are theFolin–Ciocalteau total polyphenol (FCTP) assay (Nakamura, Tsuji,

R² = 0.7703
- 2,000 4,000 6,000 8,000
10,000 12,000 14,000
0 500 1000 1500
mm
ol T
EAC
/ g
mg GAE / g
R² = 0.1244
0 200400600800
10001200
0 100 200 300 400
GA
E (m
g/g)
HPLC Total Content (mg/g)
R² = 0.3085
0
5000
10000
15000
20000
0 200 400
TEA
C m
mol
/g
HPLC content (mg/g)
R² = 0.0116
$0.00
$1.00
$2.00
$3.00
$4.00
$5.00
0 100 200 300 400
$ /
g
Total content (mg/g) determined by HPLC
D
E F
C
A B
Fig. 4. Correlation diagrams for (A) HPLC content to amount per dollar (mg/$); (B) correlation between TEAC assay (mmol/g) and FCTP assay (mg/g) (C) TEAC (mmol/g) toHPLC content; (D) total phenolics in GAE (mg/g) to HPLC content; (E) TEAC mmol/g to amount per dollar (mg/$); (F) total phenolics in GAE mg/g to amount per dollar (mg/$).
278 T.S. Villani et al. / Food Chemistry 170 (2015) 271–280
& Tonogai, 2003; Zululeta et al., 2009; Škerget et al., 2005), and theTrolox Equivalent Antioxidant Capacity (TEAC) assay (Prior & Cao,2000; Singleton & Rossi, 1965). The Folin–Ciocalteau assay pro-vides approximated quantitative measure of phenols as a broadclass, a major drawback being a lack of selectivity to other reduc-ible components and compounds other than phenols that reactwith the reagent. The Trolox Equivalent Antioxidant Capacity assaymeasures the absorption of the ABTS (2,20-azino-bis(3-ethylbenz-thiazoline-6-sulphonic acid) radical cation by substrates relativeto absorption by Trolox (a water soluble Vitamin E derivative).These assays are commonly employed in industry for quality con-trol. Yet, as these assays cannot discriminate between differenttypes of phenols and compounds, it would not be possible to detectadulteration of grape seed extract with peanut skin extract, or anyphenol containing adulterant for that matter.
A standing hypothesis was that the results of the Trolox Equiv-alent Antioxidant Capacity and Total Phenol content for theauthentic samples of GSE would fall in the same order of magni-tude as pine bark extract and peanut skin extract. This hypothesiswas confirmed (Table 1): authentic GSE ranged from 12,272.8–14,555.1 TEAC lmol/g, peanut skin at 11,695.1 TEAC lmol/g, andpine bark extract at 10,203.6 TEAC lmol/g. The results for theFolin–Ciocalteau assay were similar: 936.7–961.1 GAE mg/g forauthentic GSE, 933.2 GAE mg/g for peanut skin, and 791.8 GAEmg/g. Given that these assays show no selectivity over the compo-nents of GSE, pine bark, and peanut skin, they cannot be employedas a method for screening for adulteration and should only be usedas a preliminary indicator of quality. It is not therefore surprising
that the commercial samples showed a great degree of inhomoge-neity with respect to TEAC and GAE content, averaging6840.0 ± 2836.24 TEAC lmol/g and 299.5 ± 290.11 mg GAE/g. Asexpected, there was a strong correlation (R2 = 0.7703) betweenTEAC and GAE content for the all results of these assays (Fig. 4b),which can be accounted for by the well-known radical-scavengingactivity of polyphenols (Kim et al., 2003).
To examine whether the results of FCTP and TEAC assays ofcommercial GSE can be correlated to the content of GSE PAC mono-mers and dimers, the results from these assays for each samplewere plotted against the corresponding HPLC data (Fig. 4c, 4d).As expected, the FCTP and TEAC assays were poorly correlated toHPLC results (R2 = 0.1244 and R2 = 0.1594, respectively. This canbe accounted for due to the selectivity of HPLC allowing for thequantitation of specific components related to GSE, compared tothe indirect assays like the FCTP and TEAC assays. It can be inferredthat the antioxidant capacity and polyphenol content of the sam-ples had little to do with the overall PAC content of compoundsin commercial GSE, suggesting that there are other componentsthan PACs in the commercial samples that are responsible for anti-oxidant capacity and/or polyphenol content.
It was hypothesized that a relationship may exist between theunit cost ($USD/g) and the TEAC and FCTP results. To examine this,the results of each assay were correlated to the unit price of eachcommercial GSE sample. There is a slightly negative correlation(R2 = 0.2219) between anti-oxidant capacity and unit price(Fig. 4e). The total phenol content had almost no correlation(R2 = 0.0738) to unit price, as shown in Fig. 4f.

Fig. 5. TLC results. Lanes ordered corresponding to cluster groupings given by Fig. 3a. Grape seed extracts (GSE) exhibits a bright spot for catechin/epicatechin, as well as PACB2 isomers. PAC A2 dimers were found only in peanut-skin containing samples. Pine bark extract contains more dilute content of catechin and PAC dimer. Identity of B2 wasconfirmed by cospot with reference standard (data not shown). The identity of A2 was confirmed by heavily spotting a fresh TLC plate, visualizing with UV, and scraping thespot of the plate. The scraped silica was extracted with 0.1% acetic acid in methanol, filtered through 0.45 lm syringe filter, and injected directly into ESI-MS in positive mode.Abbreviations: C, catechin; PAC, proanthocyanidin; A2, proanthocyanidin A-type dimer; B2, proanthocyanidin B-type dimer.
T.S. Villani et al. / Food Chemistry 170 (2015) 271–280 279
TLC was evaluated as a rapid, simple, and inexpensive tech-nique to be used to distinguish authentic GSE from its adulterants.A TLC method was applied to separate the PACs and visualized con-comitantly using a simple vanillin/HCl stain and allows for therapid differentiation between high quality GSE and adulteratedGSE (Fig. 5). The TLC lanes are organized in the same order as inthe cluster dendrogram and data shown in Fig. 3. Examining thefirst cluster, outlined in red, depicts the poor-quality samples adul-terated with peanut skin. Here, it can be readily seen that thesesamples contain PAC A2 dimers, whereas authentic grape seedsamples (outlined in green) contain only PAC B dimers. As such,TLC has been demonstrated as a rapid and effective method todetect adulteration of GSE by peanut skin extract. However, itremains difficult to detect the difference between pine bark extractand GSE due to the similarity in composition.
4. Conclusion
In conclusion, adulteration of grape seed extract in commercialproducts is a significant problem. Out of the 21 commercial prod-ucts analyzed blind—without the researcher’s knowledge of theproduct source, six samples contained no detectable quantities ofgrape seed extract, and were composed primarily of peanut skinextract as determined by comparison to authentic peanut skin.PAC A-dimers were detected in 3 additional samples, suggestingadulteration with peanut skin. Adulteration with peanut skinextract represents a significant concern to safety with regards toallergens. Researchers have found by telephone survey that 1.3%of 4855 U.S. households self-report an allergy to either peanutsor tree-nuts (Sicherer, Muñoz-Furlong, Godbold, & Sampson,2010). With the increasing development and sale of herbal reme-dies and natural products, adulteration with a common allergenrepresents a considerable risk to public safety.
Adulteration can occur purposefully and/or inadvertently. Themotivation behind purposeful adulteration in commercial productsis for economic gain. Peanut skin extract, which is a high-volumebyproduct of the peanut industry, is less expensive and typicallyavailable at a much greater volume than grape seed extract. Thus,a bulk distributor of grape seed extract or another manufacturer oractor along the value chain can take advantage of the chemicalsimilarity between GSE and peanut skin extract since the simplerassays typically used in industry cannot discriminate betweenthe two. Due to reliance on inferior proximate assays across thevalue-chain, adulteration can then go undetected by others
downstream in the commodity chain, such as those involved indistribution, packaging, wholesale, and retail sales. The inherentproblem is that many of these manufacturers, relying on inferiorquality control procedures, do not know their products may beadulterated or counterfeit, leading to the perpetuation of low qual-ity products in the market-place. Consumers of the commercialproduct rely on label claims and other information provideddirectly from the supplier. This is one of many examples of theissues that dominate the international marketplace due to a lackof standardized quality control methodology, allowing for adulte-ration to perpetuate and go undetected (Betz, 2006; Foster, 2011;Ho et al., 2006; Wang et al., 2006).
Economic adulteration may have significant impact to the con-sumers of grape seed extract, as well as the distributors of highquality, legitimate grape seed extract. Ultimately, consumersexpect to the product which is purchased to be labeled accurately.The purpose of this study is to demonstrate the necessity of chro-matographic techniques (TLC, HPLC, etc.) for the screening of grapeseed extract for quality and adulteration. Only with chromato-graphic techniques can one differentiate between the componentscommon to GSE, and peanut skin extract. Clearly, for the benefit ofthe consumers, as well as the distributors, more rigorous methodsfor quality control need to be applied to the GSE industry.
Acknowledgements
This work was supported by the National Institute of Healthgrant PO1AT004511. We also thank the Rutgers New Use Agricul-ture and Natural Plant Products Program and the New Jersey Agri-cultural Experiment Station, Rutgers, The State University of NewJersey for their partial funding and support. We thank XiaoyouZhang in BannerBio Nutraceuticals Inc. (Shenzhen, China) for pro-viding the authenticated reference materials. We thank PaulCoates, Joe Betz, Gordon Cragg and others at the NIH ODS for theirinterest in this work. We thank Ray Fatto, Wendy Wang, and GraceLin for their invaluable help in this work.
Appendix A. Supplementary data
Supplementary data associated with this article can be found, inthe online version, at http://dx.doi.org/10.1016/j.foodchem.2014.08.084.
280 T.S. Villani et al. / Food Chemistry 170 (2015) 271–280
References
Al-Habib, A., Al-Saleh, E., Safer, A. M., & Afzal, M. (2010). Bactericidal effect of grapeseed extract on methicillin-resistant Staphylococcus aureus (MRSA). The Journalof toxicological sciences, 35(3), 357–364.
Aziz, M. H., Kumar, R., & Ahmad, N. (2003). Cancer chemoprevention by resveratrol:In vitro and in vivo studies and the underlying mechanisms (review).International Journal of Oncology, 23(1), 17.
Baydar, N. G., Özkan, G., & Sagdiç, O. (2004). Total phenolic contents andantibacterial activities of grape (Vitis vinifera L.) extracts. Food Control, 15(5),335–339.
Bertelli, A. A., & Das, D. K. (2009). Grapes, wines, resveratrol, and heart health.Journal of Cardiovascular Pharmacology, 54(6), 468–476.
Betz, J. M. (2006). Botanical quality initiatives at the Office of Dietary Supplements,National Institutes of Health. In Wang, M. S. Sang, L. S. Hawang, & C. T. Ho (Eds.),Herbs: Challenges in chemistry and biology. American chemical society symposiumseries 925 (pp. 2–13). Washington, D.C. USA: American Chemical Society.
Castaneda-Ovando, A., Pacheco-Hernández, M. D. L., Páez-Hernández, M. E.,Rodríguez, J. A., & Galán-Vidal, C. A. (2009). Chemical studies of anthocyanins:A review. Food Chemistry, 113(4), 859–871.
Ferruzzi, M. G., Lobo, J. K., Janle, E. M., Cooper, B., Simon, J. E., Wu, Q. L., et al. (2009).Bioavailability of gallic acid and catechins from grape seed polyphenol extract isimproved by repeated dosing in rats: Implications for treatment in Alzheimer’sdisease. Journal of Alzheimer’s Disease, 18(1), 113–124.
Foster, S. (2011). A brief history of adulteration of herbs, spices, and botanical drugs.HerbalGram, 92, 42–57.
Freitas, V. A. P. D., & Glories, Y. (1999). Concentration and compositional changes ofprocyanidins in grape seeds and skin of white Vitis vinifera varieties. Journal ofthe Science of Food and Agriculture, 79(12), 1601–1606.
Fuleki, T., & da Silva, J. M. R. (1997). Catechin and procyanidin composition of seedsfrom grape cultivars grown in Ontario. Journal of Agricultural and FoodChemistry, 45(4), 1156–1160.
Furiga, A., Lonvaud-Funel, A., & Badet, C. (2009). In vitro study of antioxidantcapacity and antibacterial activity on oral anaerobes of a grape seed extract.Food chemistry, 113(4), 1037–1040.
Hellström, J. K., & Mattila, P. H. (2008). HPLC determination of extractable andunextractable proanthocyanidins in plant materials. Journal of Agricultural andFood Chemistry, 56(17), 7617–7624.
Ho, L., Ferruzzi, M. G., Janle, E. M., Wang, J., Gong, B., Chen, T. Y., et al. (2013).Identification of brain-targeted bioactive dietary quercetin-3-O-glucuronide asa novel intervention for Alzheimer’s disease. The FASEB Journal, 27(2), 769–781.
Ho, C. T., Simon, J. E., Shahidi, F., & Shao, Y. (2006). Dietary supplements: Anoverview. In C. T. Ho, Y. Shao, & J. E. Simon (Eds.), Dietary supplements. Americanchemical society symposium series 925 (pp. 2–8). Washington, D.C. USA:American Chemical Society.
Ho, L., Yemul, S., Wang, J., & Pasinetti, G. M. (2009). Grape seed polyphenolic extract(GSE) as a novel therapeutic reagent in tau-mediated neurodegenerativedisorders. Journal of Alzheimer’s Disease, 16, 433–439.
Jackson, J. E. (2004). Frontmatter, in a user’s guide to principal components. Hoboken,NJ, USA: John Wiley & Sons Inc [doi: 10.1002/0471725331.fmatter].
Jang, M., Cai, L., Udeani, G. O., Slowing, K. V., Thomas, C. F., Beecher, C. W., et al.(1997). Cancer chemopreventive activity of resveratrol, a natural productderived from grapes. Science, 275(5297), 218–220.
Jayaprakasha, G. K., Selvi, T., & Sakariah, K. K. (2003). Antibacterial and antioxidantactivities of grape (Vitis vinifera) seed extracts. Food Research International,36(2), 117–122.
Karonen, M., Loponen, J., Ossipov, V., & Pihlaja, K. (2004). Analysis of procyanidins inpine bark with reversed-phase and normal-phase high-performance liquidchromatography–electrospray ionization mass spectrometry. Analytica ChimicaActa, 522(1), 105–112.
Kim, D. O., Jeong, S. W., & Lee, C. Y. (2003). Antioxidant capacity of phenolicphytochemicals from various cultivars of plums. Food Chemistry, 81(3),321–326.
Lawaetz, A. J., Schmidt, B., Staerk, D., Jaroszewski, J. W., & Bro, R. (2009). Applicationof rotated PCA models to facilitate interpretation of metabolite profiles:Commercial preparations of St John’s wort. Planta Medica, 75(3), 271–279.
Liang, Y. Z., Xie, P., & Chan, K. (2004). Quality control of herbal medicines. Journal ofchromatography B, 812(1), 53–70.
Liu, S., & White, E. (2012). Extraction and characterization of Proanthocyanidinsfrom grape seeds. Open Food Science Journal, 6, 5–11.
Lou, H., Yamazaki, Y., Sasaki, T., Uchida, M., Tanaka, H., & Oka, S. (1999). A-typeproanthocyanidins from peanut skins. Phytochemistry, 51(2), 297–308.
Manach, C., Williamson, G., Morand, C., Scalbert, A., & Rémésy, C. (2005).Bioavailability and bioefficacy of polyphenols in humans. I. Review of 97bioavailability studies. The American Journal of Clinical Nutrition, 81(1),230S–242S.
Moreno, D. A., Ilic, N., Poulev, A., Brasaemle, D. L., Fried, S. K., & Raskin, I. (2003).Inhibitory effects of grape seed extract on lipases. Nutrition, 19(10), 876–879.
Nakamura, Y., Tsuji, S., & Tonogai, Y. (2003). Analysis of proanthocyanidins in grapeseed extracts, health foods and grape seed oils. Journal of Health Science, 49(1),45–54.
Pasinetti, G. M., & Eberstein, J. A. (2008). Metabolic syndrome and the role of dietarylifestyles in Alzheimer’s disease. Journal of Neurochemistry, 106(4), 1503–1514.
Pasinetti, G. M., & Ho, L. (2010). Role of grape seed polyphenols in Alzheimer’sdisease neuropathology. Nutrition and Dietary Supplements, 2010(2), 97.
Passos, C. P., Cardoso, S. M., Domingues, M. R. M., Domingues, P., Silva, C. M., &Coimbra, M. A. (2007). Evidence for galloylated type-A procyanidins in grapeseeds. Food Chemistry, 105(4), 1457–1467.
Prior, R. L., & Cao, G. (2000). Analysis of botanicals and dietary supplements forantioxidant capacity: A review. Journal of AOAC International, 83(4), 950–956.
Rasmussen, S. E., Frederiksen, H., Struntze Krogholm, K., & Poulsen, L. (2005).Dietary proanthocyanidins: Occurrence, dietary intake, bioavailability, andprotection against cardiovascular disease. Molecular Nutrition & Food Research,49(2), 159–174.
R Development Core Team. (2011). R: A language and environment for statisticalcomputing. 3-900051-07-0. Vienna, Austria: R Foundation for StatisticalComputing [URL: http://www.R-project.org/].
Renaud, S. D., & de Lorgeril, M. (1992). Wine, alcohol, platelets, and the Frenchparadox for coronary heart disease. The Lancet, 339(8808), 1523–1526.
Saito, M., Hosoyama, H., Ariga, T., Kataoka, S., & Yamaji, N. (1998). Antiulcer activityof grape seed extract and procyanidins. Journal of Agricultural and FoodChemistry, 46(4), 1460–1464.
Sarnoski, P. J., Johnson, J. V., Reed, K. A., Tanko, J. M., & O’Keefe, S. F. (2012).Separation and characterisation of proanthocyanidins in Virginia type peanutskins by LC–MSn. Food Chemistry, 131(3), 927–939.
Sicherer, S. H., Muñoz-Furlong, A., Godbold, J. H., & Sampson, H. A. (2010). USprevalence of self-reported peanut, tree nut, and sesame allergy: 11-yearfollow-up. Journal of Allergy and Clinical Immunology, 125(6), 1322–1326.
Singleton, V. L., & Rossi, J. A. (1965). Colorimetry of total phenolics withphosphomolybdic-phosphotungstic acid reagents. American Journal of Enologyand Viticulture, 16(3), 144–158.
Škerget, M., Kotnik, P., Hadolin, M., Hraš, A. R., Simonic, M., & Knez, Z. (2005).Phenols, proanthocyanidins, flavones and flavonols in some plant materials andtheir antioxidant activities. Food Chemistry, 89(2), 191–198.
Sun, B., Leandro, C., Ricardo da Silva, J. M., & Spranger, I. (1998). Separation of grapeand wine proanthocyanidins according to their degree of polymerization.Journal of Agricultural and Food Chemistry, 46(4), 1390–1396.
Wang, J., Ferruzzi, M. G., Ho, L., Blount, J., Janle, E. M., Gong, B., et al. (2012). Brain-targeted proanthocyanidin metabolites for Alzheimer’s disease treatment. TheJournal of Neuroscience, 32(15), 5144–5150.
Wang, J., Ho, L., Zhao, W., Ono, K., Rosensweig, C., Chen, L., et al. (2008). Grape-derived polyphenolics prevent Ab oligomerization and attenuate cognitivedeterioration in a mouse model of Alzheimer’s disease. The Journal ofNeuroscience, 28(25), 6388–6392.
Wang, M., Liang, C. P., Wu, Q. L., Simon, J. E., & Ho, C. T. (2006). Instrumental analysisof popular botanical products in the U.S. market. In Wang, M. S. Sang, L. S.Hawang, & C. T. Ho (Eds.), Herbs: Challenges in chemistry and biology. Americanchemical society symposium series 925 (pp. 39–54). Washington, D.C. USA:American Chemical Society.
Welch, C. R., Wu, Q., & Simon, J. E. (2008). Recent advances in anthocyanin analysisand characterization. Current Analytical Chemistry, 4(2), 75.
Wu, Q. L., Wang, M., & Simon, J. E. (2003). Determination of proanthocyanidins ingrape products by liquid chromatography/mass spectrometric detection underlow collision energy. Analytical Chemistry, 75(10), 2440–2444.
Xie, P., Chen, S., Liang, Y. Z., Wang, X., Tian, R., & Upton, R. (2006). Chromatographicfingerprint analysis—a rational approach for quality assessment of traditionalChinese herbal medicine. Journal of Chromatography A, 1112(1), 171–180.
Xu, Y., Simon, J. E., Welch, C., Wightman, J. D., Ferruzzi, M. G., Ho, L., et al. (2011).Survey of polyphenol constituents in grapes and grape-derived products.Journal of Agricultural and Food Chemistry, 59(19), 10586–10593.
Zululeta, A., Esteve, M. J., & Frígola, A. (2009). ORAC and TEAC assays comparison tomeasure the antioxidant capacity of food products. Food Chemistry, 114(1),310–316.