Chemical fingerprinting of Black Reef Conglomerate...
28
Chemical fingerprinting of Black Reef Chemical fingerprinting of Black Reef Conglomerate Gold at the East Rand Conglomerate Gold at the East Rand – – A A comparison with Witwatersrand and Lode comparison with Witwatersrand and Lode Gold in South Africa Gold in South Africa CDK Gauert CDK Gauert 1 1 , E Cook , E Cook 2 2 , M Schannor , M Schannor 3 3 , L Hecht , L Hecht 4 4 1. Department of Geology, University of the Free State, South Africa, 2. Gold One Intern. Pty Ltd., Consolidated Modderfontein Operation, 3. Inst. für Geowissenschaften, Freie Universität Berlin, Germany, 4. Museum für Naturkunde Berlin, Humboldt Universität, Germany. Corresponding Author: CDK Gauert; [email protected] 8th Inkaba yeAfrica Workshop Cape Town, South Africa 28 August – 2 September 2011
Transcript of Chemical fingerprinting of Black Reef Conglomerate...

Chemical fingerprinting of Black Reef Chemical fingerprinting of Black Reef Conglomerate Gold at the East Rand Conglomerate Gold at the East Rand –– A A comparison with Witwatersrand and Lode comparison with Witwatersrand and Lode
Gold in South Africa Gold in South Africa CDK GauertCDK Gauert11, E Cook, E Cook22, M Schannor, M Schannor33, L Hecht, L Hecht44
1. Department of Geology, University of the Free State, South Africa, 2. Gold One Intern. Pty Ltd., Consolidated Modderfontein Operation,3. Inst. für Geowissenschaften, Freie Universität Berlin, Germany,4. Museum für Naturkunde Berlin, Humboldt Universität, Germany.
Corresponding Author: CDK Gauert; [email protected]
8th Inkaba yeAfrica Workshop Cape Town, South Africa
28 August – 2 September 2011

KEYWORDS: Black Reef, gold, chemical fingerprint, provenance
228 August – 2 September 20118th Inkaba yeAfrica Workshop – CTICC – Cape Town, SA From Eriksson in Johnson et al., 2006
Vryburg Fm in
Griqualand west
Background:
ConsModderKlerksdorp
West Rand
Randfontein
Figure 1. Locality map of the Black Reef sections under investigation in the Transvaal Supergroup of NE-South Africa. Boxes indicate areas of investigation being sampled (modified after Eriksson et al., 2006)
• The Palaeoproterozoic (2642-2584 Ma) Black Reef Formation (BR) is a widespread thin small pebble unit at the base of the Transvaal Supergroup.• In the East Rand, Randfontein and Klerksdorp areas the unit contains considerable gold, less U, as well as minor associated PGE mineralization, • Henry and Master (2008) identified shortcomings in our understanding of the genesis of Au mineralization, and the occurrence of Au, U and PGEs hosted by the Black Reef (BR), and their provenance. • The source of gold in these reefs has long been a matter of speculation.

Motivation as introduction
• Extensive sedimentological evidence , suggests a strictly detrital origin . The gold associated with the sulphides, such as pyrite, has been described as “in situ” hydrothermal deposition with the underlying Kimberley Reefs of the Central Rand Group proposed as the source (Hoffmann et al., 1977).
• However, mineralogical and geochemistry studies performed by Barton and Hallbauer (1996) on the pyrite grains of the Black Reef argue against this.
• Debated possible sources of BR gold : a) from reworked conglomeratic upper Witwatersrand reefs, b) from epithermal gold of granite-greenstone terrain hinterland, and c) from underlying pyrite-associated gold of Archaean VMS deposits.
• To solve the Au provenance question, geochemical fingerprinting of Au using electron microprobe (FE-EMPA), Synchrotron micro-XRF (SR-µ-XRF), time-of-flight secondary ion mass spectrometry (TOF-SIMS) and laser ablation inductively coupled plasma mass spectrometry (LA-ICP-MS) has been carried out.
31 – 5 November 20108th Inkaba yeAfrica Workshop – CTICC – Cape Town, SA

Mass spectral fingerprints for three adjacent gold mines (AARL, 1999)
•• It is a method for identifying native It is a method for identifying native gold based on the impurities or gold based on the impurities or trace elements it contains.trace elements it contains.
•• Laser ablation inductively coupled Laser ablation inductively coupled plasma mass spectrometry (LAplasma mass spectrometry (LA--ICPICP--MS) is used to fingerprint the MS) is used to fingerprint the sample (Au, pyrite) by mineralizing sample (Au, pyrite) by mineralizing event and to a particular mine or event and to a particular mine or bullion source.bullion source.
•• This technique has been used to This technique has been used to lay claim to stolen or relocated lay claim to stolen or relocated gold. Even gold that has gold. Even gold that has undergone salting can be identified undergone salting can be identified as to its multiple sources.as to its multiple sources.
Multivariate discrimination diagram showing that the Black Reef detrital and concretionary pyrite are geochemicallydistinct both from each other and from the average Witwatersrand pyrite (Barton & Hallbauer, 1996)
Gold fingerprintingGold fingerprinting

Schematic geological Schematic geological section through an eroded section through an eroded
Black Reef channel at Black Reef channel at Consolidated Consolidated
ModderfonteinModderfontein Mine Mine (modified after Barton et (modified after Barton et
al., 1996)al., 1996)
Black Reef facies types at Consolidated Modderfontein, East Rand

61 – 5 November 20108th Inkaba 8th Inkaba yeAfricayeAfrica Workshop Workshop –– CTICC CTICC –– Cape Town, SACape Town, SA 28 August 28 August –– 2 September 20112 September 2011
• A detailed investigation of the mineralogy of the mineralization in selected profiles of the arenitic to conglomeratic BR reveals:
• Mineralogy: Chromite, sphalerite, chalcopyrite, galena, uraninite, cassiterite,
tourmaline, carbon, Pt-Ni-As minerals and Ni-Co-sulpharsenides such as cobaltiteand gersdorffite next to abundant pyrite, as well as free gold.
• Late-stage hydrothermal fluids possibly overprinted BR rocks and remobilized
Au grains into their present form, as evidenced by the associated alterationminerals such as chlorite, pyrophyllite and sericite.

Slabs of BR pyrite leader -blanket facies
728 August – 2 September 20118th Inkaba yeAfrica Workshop – CTICC – Cape Town, SA

B-Reef Harmony - Tshepong
829 August – 2 September 20118th Inkaba yeAfrica Workshop – CTICC – Cape Town, SA
55 10mm10mm00

91 – 5 November 20107th Inkaba yeAfrica Workshop - GFZ Potsdam, Germany
BSE-images of Gold particles
Black Reef B-Reef Wits

Sheba Gold Mine Barberton
1029 August – 2 September 20118th Inkaba yeAfrica Workshop – CTICC – Cape Town, SA
Au particles of MRC-1 ore body
Au particles ZK-1 ore body

Analytical equipment
111 – 5 November 20108th Inkaba yeAfrica Workshop – CTICC – Cape Town, SA
JXA-8530F Field Emission Electron Probe Microanalyzer (EPMA), WD/ED Combined System for Ultra Micro AnalysisFeaturing a field emission (FE) electron gun, high vacuum system, ultra micro area analysis. Parameters: 30 kV, 100 nA, 200 s count time on peak; 3nm secondary electron resolution.
Element Ag Au Hg Cu
conc (ppm) 267 570 355 107
Element S Ti Pb Fe
conc (ppm) 72 75 175 81
Element Th Cd U Co
conc (ppm) 120 88 152 87
Element Sn Ni
conc (ppm) 85 100
← Avg. detection limits as calculated by Jeolsoftware compared to LA-ICP-MS (small table↓)
Element Ag Au Hg Cu
conc (ppm) 4.3 55 1000 10
Element Pt Ti Pb Fe
conc (ppm) 0.2 10 1.5 4.2
Element Pd Cd Sb Co
conc (ppm) 0.3 0.1 0.5 0.25
Element Sn Ni Cr Mn
conc (ppm) 5 5 10 10
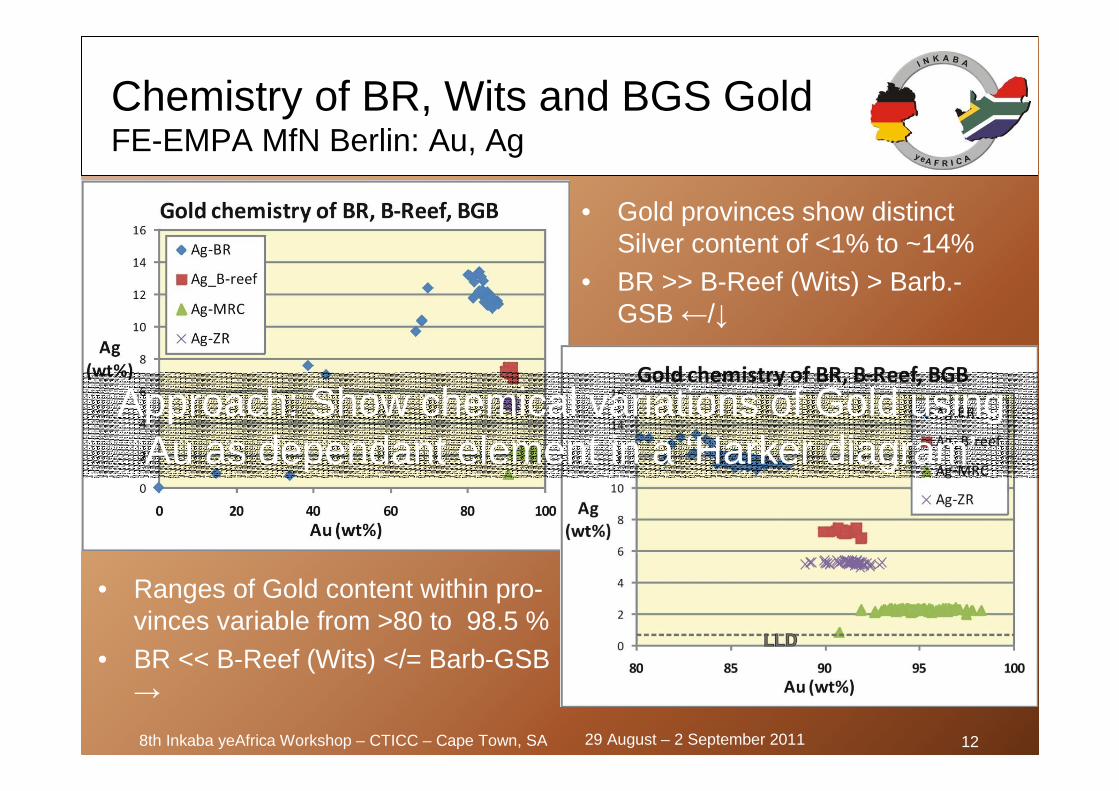
Chemistry of BR, Wits and BGS GoldFE-EMPA MfN Berlin: Au, Ag
• Gold provinces show distinct Silver content of <1% to ~14%
• BR >> B-Reef (Wits) > Barb.-GSB ←/↓
1229 August – 2 September 20118th Inkaba yeAfrica Workshop – CTICC – Cape Town, SA
• Ranges of Gold content within pro-vinces variable from >80 to 98.5 %
• BR << B-Reef (Wits) </= Barb-GSB →
Approach: Show chemical variations of Gold using Au as dependant element in a ‘Harker diagram’

Chemistry of BR, Wits and BGS GoldFE-EMPA MfN Berlin: Hg, Cu
1329 August – 2 September 20118th Inkaba yeAfrica Workshop – CTICC – Cape Town, SA
• ← Gold provinces show distinct Mercury content of on avg. <0.3% to ~2.2%, max. 7.2%
• B-Reef (Wits) > BR >> Barb-GSB
• Copper content high in Wits-Reef→and Barb-GSB from 0.06-0.08 %
• BR << B-Reef (Wits) </= Barb-GSB

Ternary Gold classification
141 – 5 November 20107th Inkaba yeAfrica Workshop - GFZ Potsdam, Germany

Chemistry of BR, Wits and BGS GoldFE-EMPA MfN Berlin: S, Fe
1529 August – 2 September 20118th Inkaba yeAfrica Workshop – CTICC – Cape Town, SA
• Gold provinces show distinct iron content of <0.02 % to ~0.98% (max. 5.4%, pyrite inclusion?)↓
• BR >> B-Reef (Wits) >/= Barb-GSB
• S contents range from on avg. 1.4 to 0.008% (max. ~18% Pyr incl.) ↑
• BR >> B-Reef (Wits) >/= Barb-GSB• Strong Fe-S correlation (pyrite)

Chemistry of BR, Wits and BGS GoldFE-EMPA MfN Berlin: Th, U (Th variability)
1629 August – 2 September 20118th Inkaba yeAfrica Workshop – CTICC – Cape Town, SA
• ↑ Th contents range from on avg. 0.3 to 0.022% (max. ~3.6% uraninite inclusion);
• BR >/= Barb-GSB >> B-Reef (Wits)• High Th variability
• Gold provinces show distinct U content of <0.09 % to ~0.8% (max. 7.1%, uraninite inclusion?)↓
• BR > Barb-GSB > B-Reef (Wits)
?

Chemistry of BR, Wits and BGS GoldFE-EMPA MfN Berlin: Co, Fe vs. Ag
1729 August – 2 September 20118th Inkaba yeAfrica Workshop – CTICC – Cape Town, SA
• Avg. Ag content of gold provinces very distinct: BR: 11.1%, B-Reef (Wits): 7.2% and Barb-GSB: 2.2-5.2% ↓
• ↑ Co contents range from on avg. 0.01 to 0.005% (max. ~0.33%); BR >/= B-Reef (Wits) > Barb-GSB

Principle component analysis
181 – 5 November 20107th Inkaba yeAfrica Workshop - GFZ Potsdam, Germany
Taking into consideration: Au, Ag, Hg, Cu, S, Fe, Th, Co

Cluster analysis of all EMP Au data
191 – 5 November 20108th Inkaba yeAfrica Workshop – CTICC – Cape Town, SA
BR Gold
Wits B-
Reef
Gold
BR
Gold
BGB-ZK GoldBRGold
BGB-MRC Gold
BR
Gold
Taking into consideration: Au, Ag, Hg, Cu, S, Fe, Th, Co

Conclusions and summary
2029 August – 2 September 20118th Inkaba yeAfrica Workshop – CTICC – Cape Town, SA
Gold Province High conc., major to minor element
Low conc., (u) trace element
Remarks
Black Reef -East Rand(Cons. Modder)
Ag (max. 17.5%), Hg, Cu , Th, Co, Ni Supergene enrichment
U (avg. 0.8, max. 7.1%),
FeCr, As, Pb, Pt, Pd, Sn, Sb, Ta
Uraninite inclusions, PGEs
(EMP, SR-µ-XRF, LA-ICP_MS)
(EMP, SR-µ-XRF,LA-ICP_MS)
Pyrite, Ni-Co-sulphars. association
Free State Witwatersrand Gold fields
Ag (avg. 7.1 %),Hg, Cu Co, Ni, Pb, Ti Uraninite inclusions
Fe Pd, Ru, Se-Te, U?(EMP, µ-XRF, LA-ICP_MS)
(EMP, µ-XRF, LA-ICP_MS)
Barberton Greenstone Belt(Sheba Mine)
Ag (5.2-2.2 %), (ZK), Cu U, Th, Co, Hg Arsenopyrite, (chalco-) pyrite association
Fe (MRC)
(EMP, LA-ICP_MS) (EMP, LA-ICP_MS)

Conclusions and summary
2129 August – 2 September 20118th Inkaba yeAfrica Workshop – CTICC – Cape Town, SA
• EMP analyses show a fineness of BR gold between 825 and 882, as well as elevated Hgcontents, minor conc. of Fe, S, Co and Ni , and detectable copper values (max.450 ppm).
• Synchrotron micro-XRF spectra of BR gold reveal the presence of Cr, Ni and Ta at higher concentrations than in Witwatersrand gold, whereas Wits gold contains more Cu confirming the EMP results.
• In favour of a reworked Witwatersrand gold origin of the BR gold argues the very similar heavy mineral content .
• Against a Witwatersrand origin argues the frequency of concretionary pyrite with a unradio-genic Pb isotope composition (Barton&Hallbauer), the less abundantly occurring Ni-Co-Fe-sulpharsenides in the Witwatersrand reefs, however its frequent appearance in BR.
• The gold in the BR has a lower fineness, lower Hg and Cu content compared to Witwatersrand gold, whereas its Fe, S, Ti and Ni concentrations are higher.
• Greenstone Gold has lowest Ag, Hg , and Th, S, Fe conc. of the Au prov., however high Cu.
• It is important to understand the genesis and provenance of Au, U and PGE mineralization in the Black Reef because it has exploration significance, are underlying Wits and/or greenstone terrains necessary for the BR to potentially host an orebody?

Acknowledgements:Acknowledgements:
•• Michael Michael BraunsBrauns -- CurtCurt--EngelhornEngelhorn--Centre Mannheim Centre Mannheim
•• Evan Cook Evan Cook -- Gold One Pty Ltd.Gold One Pty Ltd.
•• Dept. of Geology, University of the Free StateDept. of Geology, University of the Free State
•• David Batchelor, Rolf Simon, ANKA, KITDavid Batchelor, Rolf Simon, ANKA, KIT
THANK YOU FOR YOUR ATTENTION THANK YOU FOR YOUR ATTENTION –– QUESTIONS?QUESTIONS?

Conclusions and summary
2329 August – 2 September 20118th Inkaba yeAfrica Workshop – CTICC – Cape Town, SA
• Black Reef and Witwatersrand gold can be most effectively distinguished by true fineness, by Hg and Cu concentrations, possibly also by U, Fe, S, and Co trace element content (~ 400 analyses).
• Sources of BR gold at Consolidated Modderfontein: 1. reworked conglomeratic upper Witwatersrand reefs, 2. epithermal gold of granite-greenstone terrains, 3. from underlying Archaean gold-bearing VMS deposits.
• EMP analyses show a fineness of BR Gold between 825 and 882, as well as elevated Hg contents, minor concentrations of Fe, S, Co and Ni, whereas detectable copper values are low (max. 450 ppm). Synchrotron micro-XRF spectra of BR Gold reveal the presence of Cr, Ni and Ta at higher concentrations than in Witwatersrand Gold, whereas Wits gold contains more Cu confirming the EMP results.
• In favour of a reworked Witwatersrand gold origin of the BR gold argues the very similar heavy mineral content. Against a Witwatersrand origin argues the frequency of concretionary pyrite with a unradiogenic Pb isotope composition, the less frequently occurring Ni-Co-Fe-sulpharsenides in the Witwatersrand reefs, however its frequent appearance in BR.
• The gold in the BR at Consolidated Modderfontein has a lower fineness, lower Hg and Cu content compared to Witwatersrand gold, whereas its Fe,S,Ti and Ni concentrations are higher.
• Our understanding of the genesis of Au, U and PGE mineralization hosted by the Black Reef (BR), and its provenance is important because it has exploration significance. The fertile versus barren BR discussion has to answer the question if BR has to be underlain by Wits and/or greenstone terrains to potentially host an orebody.

• Remobilisation strong at B-Reef (carbon-linked)
• Make sure comparable particles• Enlarge database
• Compare with EMP with ICP-MS and SRµXRfdata

Synchrotron micro-XRF spectra (30 keV): Black Reef vs B-Reef Gold. K- and L-lines at 30 keV, Si(Li) detector, beam 100-250 µm2
Witwatersrand
Energy (keV)5 10 15 20 25
Ti Kα
V, C
r Kα
Zr,
Nb
Kα
?
Ru
Kα
?
Pd
Kα
?
Cd
Kα
?Cu
Kα
, Ta?
Zn
Kα
, ReLα
?
Au LαAu Lß
Au L γ
Ag
Lα
Ag KαAg Kß
S Kα
Fe
Kß
Fe Kα
Pb
Lα
Pb
Lß1,
2

B- Reef sections
100100 200200µµ00
Black Reef pyrite leader sections

271 – 5 November 20107th Inkaba yeAfrica Workshop - GFZ Potsdam, Germany
Ternary Gold classification
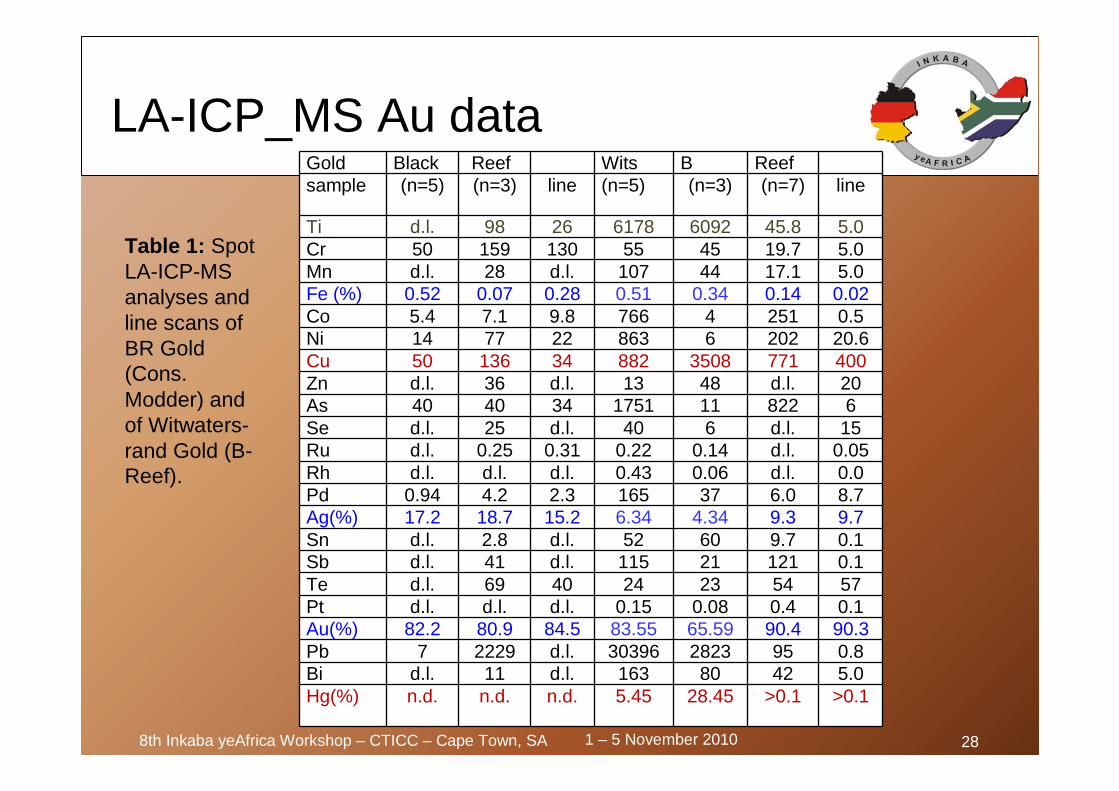
LA-ICP_MS Au data
281 – 5 November 20108th Inkaba yeAfrica Workshop – CTICC – Cape Town, SA
Gold Black Reef Wits B Reefsample (n=5) (n=3) line (n=5) (n=3) (n=7) line
Ti d.l. 98 26 6178 6092 45.8 5.0Cr 50 159 130 55 45 19.7 5.0Mn d.l. 28 d.l. 107 44 17.1 5.0Fe (%) 0.52 0.07 0.28 0.51 0.34 0.14 0.02Co 5.4 7.1 9.8 766 4 251 0.5Ni 14 77 22 863 6 202 20.6Cu 50 136 34 882 3508 771 400Zn d.l. 36 d.l. 13 48 d.l. 20As 40 40 34 1751 11 822 6Se d.l. 25 d.l. 40 6 d.l. 15Ru d.l. 0.25 0.31 0.22 0.14 d.l. 0.05Rh d.l. d.l. d.l. 0.43 0.06 d.l. 0.0Pd 0.94 4.2 2.3 165 37 6.0 8.7Ag(%) 17.2 18.7 15.2 6.34 4.34 9.3 9.7Sn d.l. 2.8 d.l. 52 60 9.7 0.1Sb d.l. 41 d.l. 115 21 121 0.1Te d.l. 69 40 24 23 54 57Pt d.l. d.l. d.l. 0.15 0.08 0.4 0.1Au(%) 82.2 80.9 84.5 83.55 65.59 90.4 90.3Pb 7 2229 d.l. 30396 2823 95 0.8Bi d.l. 11 d.l. 163 80 42 5.0Hg(%) n.d. n.d. n.d. 5.45 28.45 >0.1 >0.1
Table 1: SpotLA-ICP-MS analyses and line scans of BR Gold (Cons.Modder) and of Witwaters-rand Gold (B-Reef).