Chemical equilibrium of hydrogen and aqueous solutions of l'l ...
29
University of Groningen Chemical equilibrium of hydrogen and aqueous solutions of 1 Engel, D.C.; Versteeg, Geert; Swaaij, W.P.M. van Published in: Fluid Phase Equilibria DOI: 10.1016/S0378-3812(97)00059-9 IMPORTANT NOTE: You are advised to consult the publisher's version (publisher's PDF) if you wish to cite from it. Please check the document version below. Document Version Publisher's PDF, also known as Version of record Publication date: 1997 Link to publication in University of Groningen/UMCG research database Citation for published version (APA): Engel, D. C., Versteeg, G. F., & Swaaij, W. P. M. V. (1997). Chemical equilibrium of hydrogen and aqueous solutions of 1: 1 bicarbonate and formate salts with a common cation. Fluid Phase Equilibria, 135(1), 109- 136. DOI: 10.1016/S0378-3812(97)00059-9 Copyright Other than for strictly personal use, it is not permitted to download or to forward/distribute the text or part of it without the consent of the author(s) and/or copyright holder(s), unless the work is under an open content license (like Creative Commons). Take-down policy If you believe that this document breaches copyright please contact us providing details, and we will remove access to the work immediately and investigate your claim. Downloaded from the University of Groningen/UMCG research database (Pure): http://www.rug.nl/research/portal. For technical reasons the number of authors shown on this cover page is limited to 10 maximum. Download date: 15-02-2018
Transcript of Chemical equilibrium of hydrogen and aqueous solutions of l'l ...

University of Groningen
Chemical equilibrium of hydrogen and aqueous solutions of 1Engel, D.C.; Versteeg, Geert; Swaaij, W.P.M. van
Published in:Fluid Phase Equilibria
DOI:10.1016/S0378-3812(97)00059-9
IMPORTANT NOTE: You are advised to consult the publisher's version (publisher's PDF) if you wish to cite fromit. Please check the document version below.
Document VersionPublisher's PDF, also known as Version of record
Publication date:1997
Link to publication in University of Groningen/UMCG research database
Citation for published version (APA):Engel, D. C., Versteeg, G. F., & Swaaij, W. P. M. V. (1997). Chemical equilibrium of hydrogen and aqueoussolutions of 1: 1 bicarbonate and formate salts with a common cation. Fluid Phase Equilibria, 135(1), 109-136. DOI: 10.1016/S0378-3812(97)00059-9
CopyrightOther than for strictly personal use, it is not permitted to download or to forward/distribute the text or part of it without the consent of theauthor(s) and/or copyright holder(s), unless the work is under an open content license (like Creative Commons).
Take-down policyIf you believe that this document breaches copyright please contact us providing details, and we will remove access to the work immediatelyand investigate your claim.
Downloaded from the University of Groningen/UMCG research database (Pure): http://www.rug.nl/research/portal. For technical reasons thenumber of authors shown on this cover page is limited to 10 maximum.
Download date: 15-02-2018

/ m l l E L S E V I E R Fluid Phase Equilibria 135 (1997) 109-136
Chemical equilibrium of hydrogen and aqueous solutions of l ' l bicarbonate and formate salts with a common cation
D.C. Enge l ", G.F. Vers teeg , W . P . M . van Swaai j
Department <?f Chemical Engineering. Unicersi O" ~?]'Twente. P.O. Box 217, 7500 AE Enschede, Netherlands
Received 26 March 1996; accepted 5 February 1997
Abstract
The chemical equilibrium of hydrogen and aqueous solutions of I:1 bicarbonate and formate salts with a common cation has been investigated in an intensively stirred batch reactor:
MHCO,(aq) + H2(aq) ~, MOOCH(aq) + H20(I )
This was accomplished for the sodium (M = Na), potassium (M = K) and ammonium (M = NH a) systems by measuring the equilibrium composition. This reaction was allowed to proceed from both sides of the equilibrium in a suspension of Pd /C and P d / y - A I 2 0 3 catalyst particles, and was carried out at 20, 40 and 60°C lbr hydrogen pressures ranging from 0.5 to 10 bar. The total salt concentration in the reaction mixture was varied up to the solubility limit. The experimental equilibrium data were interpreted by taking the nonideality of the aqueous electrolyte solution into account according to the multicomponent, extended Pitzer model. Calculation of the activity coefficients was based on parameters of the single electrolyte subsystems. From the experimental results, the values of the standard Gibbs energy and enthalpy change of the reaction could be derived, namely -0 .72 and -20 .5 kJ tool ~, respectively. Determination of the standard Gibbs energy and enthalpy of lk)rmation of the aqueous formate ion yielded values of. successively, -350.5 and -426.7 kJ mol k. The thermodynamic chemical equilibrium constant of the hydrogenation reaction was correlated by the equation K l = exp (2.22 × 10³(T/K) i). In the range of process conditions studied, both the equilibrium conversion and the solubility of the electrolyte mixture were predicted within 5% error on the basis of the thermodynamic model used. © 1997 Elsevier Science B.V.
Kevwords: Chemical equilibria; Hydrogenation reaction; Enthalpy; Gibbs energy; Aqueous mixture; Formate/bicarbonate salts
" Corresponding author. Present address: Shell Research and Technology Centre, P.O. Box 38000, 1030 BN Amsterdam, Netherlands.
0378-3812/97/517.(X) © 1997 Elsevier Science B.V. All rights reserved. PII S0378-3812(97)00059-9
110 D.C. Engel et al. / kluid f'ha.~e Equilihria 135 ( 1997~ 109-136
1. Introduction
The conversion of a bicarbonate to the corresponding tbrmate compound and water is one of the few reactions where an aqueous electrolyte can be reduced with hydrogen
M(HCO3),,.~(aq) + uxH2(g ) ~ M(OOCH),, (aq) + uxH~O(l ) (1)
The counterion M is preferably one of the univalent inorganic cations as they generally form stable anhydrous bicarbonate and formate salts [1].
Since the reduction represented by reaction ( 1 ) is regarded to be the key step in a number of newly proposed routes [2-9], the economy of these routes will strongly depend on both the maximum conversion and the solubility of the bicarbonate/formate mixture as a function of the process conditions that may be applied. Despite the substantial number of papers that has been published on possible applications of reaction (1), the experimental information available about its chemical equilibrium is rather limited, especially with regard to the specific influence of temperature and electrolyte concentration. Besides, no thorough theoretical study on the description of the chemical equilibrium has been presented so far.
An important aim of this study is to clarify the ambiguities raised in the literature on the thermodynamics of the chemical equilibrium. Simultaneously, the thermodynamic nonideality of the aqueous electrolyte mixture will be examined by determining the influence of pressure, temperature and concentration on the equilibrium conversion up to saturated salt solutions.
For determination of the thermodynamic equilibrium constant of a heterogeneously catalysed reaction, the equilibrium composition and the thermodynamic nonideality of the system should be known. Determination of the nonideality requires accurate experimental information about the ionic activity coefficients as a function of temperature and concentration. Unfortunately, data are only available for the single electrolyte subsystems [10-24]. However, if an appropriate multicomponent, electrolyte activity coefficient model is selected, it is possible to predict the thermodynamic behaviour of the aqueous bicarbonate/formate mixture on the basis of data obtained from these single electrolyte subsystems.
Here, the chemical equilibrium is measured by allowing the reaction to proceed from either side in the presence of palladium on activated carbon and on y-alumina supports. This is done in an intensively stirred, batch slurry reactor at 20, 40 and 60°C for hydrogen pressures ranging from 0.5 to 10 bar. The total salt content in the reaction mixture is varied up to the solubility limit. In handling the experimental data thus obtained, the nonideality of the aqueous liquid phase was described according to the extended Pitzer model [14,25].
2. Previous work
An early attempt to bring the experimentally determined value of the Gibbs energy change into agreement with the value calculated from thermodynamic data was carried out by Woods [26]. The Gibbs energy change at the standard state, defined at molality m #' = 1 mol kg- ~ tk)r the solutes and at the pure liquid state for the water solvent (Table !), is related to the thermodynamic equilibrium constant, according to
ArG'b(T) = - R T I n K ( T ) = - R T I n ] a''¢'°¢~)--aH'-'' ] (2) P ~
E l L / I l l ' ( ) ' - - PH,

D.C. En.qel et al. / I- luid Plla.~e Equ i l ibr ia 135 ¢ 1997) 109 - 136 I 11
T a b l e I
l . i t e ra ture v a l u e s u sed in the p re sen t s tudy for the s t and a rd e n t h a l p y and G i b b s e n e r g y o f f o r m a t i o n at 298 K of the spec i e s
c o m p r i s i n g r eac t ion ( 1 )
i . ~ ,G '~ i (298 K ) / ( k J m o l - I ) k l H, 4 '(298 K ) / ( k J mol i) Ref.
HC()~ (aq) - 5 8 6 . 8 9 - 6 9 1 . 9 9 [27.28]
H C O O (aq) - 351 .0 - 425 .55 [27]
H ~O (1) - 2 37 .14 - 285 .83 [25 .27 .28]
By measuring the equilibrium concentrations of the ionic components at a hydrogen partial pressure of approximately 0.9 bar and a ionic strength of about 0.05 molal, assuming ideal solution behaviour. Woods calculated K(298 K) = !.33, corresponding to 'k,G't'(298 K) = - 0 . 7 kJ tool
Next, a number of more recent papers [6,7,29-31] reported that the equilibrium conversion observed at 25°C and 1 aim partial pressure of hydrogen is about 50%. This indicates that the equilibrium constant has to be approximately 1, corresponding to A,G~"(298 K) = 0 kJ mol-~, which is in good agreement with the result of Woods. In addition, Wu et al. [32] found an experimental value of - 1.3 kJ mol-~ In order to determine the standard Gibbs energy change experimentally, Wiener et al. approached the equilibrium from both sides at total potassium salt concentrations of 1 and 4 molar respectively. The equilibrium constant was estimated to be about 40 tool 1-~ arm- which, according to these authors yields A~(298 K) = - 9.2 kJ mol- i. This result must, however, be incorrect, since the equilibrium constant was not made dimensionless in the calculation. The standard state of water was based on its concentration in the pure liquid phase, which is about 55 molar. The resulting dimensionless equilibrium constant is thus estimated to be 40/55 p'~ = 0.73. Starting from their assumption of ideal solution behaviour, this corresponds to A,G't'(298 K ) = +0.8 kJ tool- which is similar to the value Woods reported. In addition to this, Wiener et al. [33] gave a value of + 15.1 kJ mol -j tk)r the standard Gibbs energy change of the transformation on the basis of data tabulated by Rossini et al. [34]. This value was not in accordance with the one obtained from consulting a more recent edition of the NBS tables of chemical thermodynamic properties, - 1.3 kJ mol-~ [27]. The disagreement appears to be principally due to the inaccurate value reported by Rossini et al. [34] for the standard Gibbs energy of formation of the formate ion. The experimental and calculated standard Gibbs energy change values obtained from various literature sources are summarized in Table 2.
T a b l e 2
V a l u e s r epo r t ed in l i te ra ture for the s t and a rd e n t h a l p y and G i b b s e n e r g y c h a n g e o f reac t ion ( 1 ) at 298 K
a~G(~e(298 K)/ .5~G~I',,(29g K)/ a~ H~t~p(298 K)/ a r H~{'a(298 K)/ (kJ mo l i ) (kJ m o l - i ) (kJ mol i ) (kJ m o l - i)
Ref.
- 0.7 - 3.1 - 22 .6 - 12.0 [26]
- 1 . 3 - 19.4 [271
- 1.3 . . . . . [ 3 2 1
0.8 " + 15. I - - 4.8 [33]
" R e in t e rp r e t ed ba sed on ideal so lu t ion b eh av io u r .

112 D.C. l:'ngel et al. / Fluid t'hase Equilihria I.¢5 (1997) 109-136
The temperature dependence of the thermodynamic equilibrium constant is given by the well-known van't Hoff equation [35]
- R [ a[ln K(T)] (3)
If the temperature dependence of A~H'~(7 ") is assumed to be negligible, it follows that
- R l n K ( T ) = - R l n K(298 K) + A ~ H " ~ [ ( T / K ) ' - 298- ' ] (4)
Woods [26] derived the value of A H #' in this way from the experimentally determined equilib- rium constant at 25.0 and 37.6°C, which yielded A H 't' = - 2 2 . 6 kJ mol-~. This result was compared with the value calculated from known thermodynamic data, being - 12.0 kJ mol ~, and it was stated that the discrepancy between the two values might be attributed to the temperature dependence of the data used, which had been disregarded. This explanation, however, seems questionable, since the influence of temperature on calorimetric data over such a small temperature difference is usually less pronounced. Moreover, Wiener et al. [33] reported an entirely different value of - 4.8 kJ mol- t based on the tables published by Rossini et ai. [34]. see also Table 2. Both calculated values are not in accordance with the one obtained from more recent data [27], - 19.4 kJ mol-~, which is close to the experimental value observed by Woods. Similar to the Gibbs energy data, the main source of deviation is obviously caused by the experimental uncertainty in the values taken for the standard enthalpy of formation of the aqueous formate and bicarbonate ion.
3. System description
3.1. Chemical equilibria
An aqueous solution of both strong and volatile weak electrolytes results in a complex mixture of many components, which are able to react with one another. For the catalysed bicarbonate/formate system eight independent, reversible reactions are assumed to proceed, which are given in Appendix A. In order to obtain the values for thc respective equilibrium constants K, as a function of temperature, an equation of the fbllowing form is applied
In X~ = k, . , (T/K) -~ + k,:_ + k,.~(T/K) + L~41n(T/K) (5)
Table 3 shows the known parameter values for the equilibrium constants K 2 - K ~.
T a b l e 3
P a r a m e t e r v a l u e s fl)r t h e e q u i l i b r i u m c o n s t a n t s K 2. K s a c c o r d i n g to Eq . ( 5 )
K , / - 10 3 k c l / K 10 ~-k, . , / - - iOZk , .~ /K t k i . . ~ / _ R e f .
K , - 1 3 . 4 4 5 9 + 1 . 4 0 9 3 2 0 - 2 2 . 4 7 7 3 [36 ]
K 3 + 5 . 7 1 9 8 9 - 0 . 3 8 6 5 6 5 - 2 . 7 9 8 4 2 + 7 . 9 7 1 1 7 [37 ]
K 4 + 4 . 3 0 8 6 4 - 0 . 2 4 1 9 4 9 - 2 . 2 4 5 6 2 + 4 . 3 6 5 3 8 [37 ]
K 5 - 2 . 6 1 5 4 1 + 0 . 0 8 9 3 3 3 - 2 . 9 5 3 8 8 0 [38 ]
K~, - 5 . 9 1 4 0 8 + 0 . 9 7 9 7 1 5 - I . 1 0 0 8 0 15.(k640 [37 ]
K 7 - 0 . 6 0 4 1 2 + 0 . 2 0 1 5 2 1 - 0 . 5 0 3 1 0 - 4 . 0 1 7 2 6 [37 ]
K s " - 1 . 2 9 9 4 7 0. I I I 127 0 0 [39 ]
E s t i m a t e d at / ~ 0 .5 .
D.C. En,gel et al. / Fluid Phase Equilibria 135 ~ 1997; 109-136 I 13
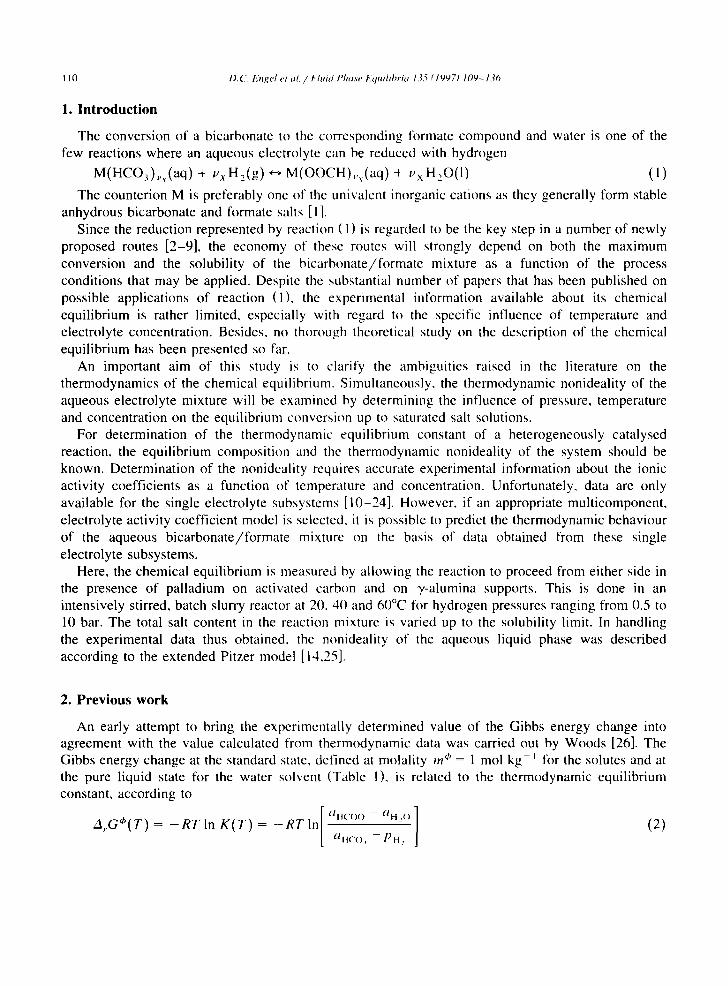
3.2. Phase equilibria
3.2.1. Vapour- l iquid in the electrolyte system under consideration, hydrogen, carbon dioxide, ammonia and water are
expected to occur significantly in the vapour phase. Although formic acid is volatile as well, its vapour pressure will be small owing to the basic character of the solution and the small value of the Henry coefficient in the temperature range of interest [41].
The expressions Ibr the vapour-liquid equilibrium of the solutes i (H 2, CO 2, NH 3) and the solvent (H 20) are, respectively:
Pi = Hiai = H i Y i m J m~' i = H2 ,CO2,NH3 (6)
PH,o = aH.,,P,'~,,, = TH.oXH.oP,*~.O (7)
The temperature dependence of the Henry coefficients is represented by
In H, = h , . , ( T / K ) - ' + h,2 + h , . ~ ( r / K ) + h,4 In ( T / K ) (8)
The parameter values for calculation of the Henry coefficients of hydrogen, carbon dioxide and ammonia in pure water are given in Table 4.
According to Daubert and Danner [43], the saturation pressure of pure water PH,O as a function of temperature can be determined from
In(p~.a:,/Pa) = 72.55 - 7.2067 × 1 0 ' ( T / K ) - ' - 7.1385 In(T/K) + 4.046 × 10 ~'(T/K) 2
The total pressure P, is related to the partial pressures of the vapour species according to
Pt = E P i = P H : + P c ' ( ) , + P N H ~ + P H , o i
(9)
(10)
3.2.2. L iquid-so l id Since the solubility of formate and carbonate alkali metal salts in water is much higher than the
solubility of the corresponding bicarbonate salts [44-46], the latter will be limiting. As long as the bicarbonate salt is the only solid compound present, no inclusion of water molecules in the crystal lattice will take place [47]. As a result, the phase transformation can be represented by
MHCO3(s ) *-* M ~ (aq) + HCO~- (aq) (11)
Table 4
Parameter va lues tbr the Henry coeff ic ients o f hydrogen, carbon dioxide and a m m o n i a in pure water according to Eq. (8)
t t , / P a I 0 - ~ h , . I / K 10- 2hi2 / - lOe h,.~ / K - i h,.a / - ReL
H u , - 6 .99354 + 1.87564 ~ 1.50431 - 26.3121 [42]
Hc.o2 - 17.0607 + 4 .41705 +- 6.59891 - 68 .3160 [37]
HNH 3 -- 7 .57995 + 1.07745 + 0 .85970 - 13.5886 [37]

114 I).C. Engel et al. / I-luid Ptmse Equilihria 135(1997) 109-136
Table 5
Literature values used for the standard enthalpy and Gibbs energy of lornta t ion at 298 K of the cation and salt species represented in Eq. (11)
i A,G,' t ' (298 K ) / ( k J r n o l i) -~, H it'(298 K ) / ( k J tool ' ) Ref.
N a ' (aq) - 261.90 - 240.12 [25,27,28]
K + (aq) - 282.49 - 252.38 [25.28]
NH.~- (aq) - 7 9 . 3 1 132.51 [27]
N a H C O 3 (s) - 851.32 - 948.93 [47]
K H C O 3 (s) - 863.5 -- 963.2 [27]
NH 4 HCO3 (s) - 665.9 849.4 [27]
If it is further assumed that the bicarbonate salt is pure and of unit activity, the phase equilibrium can simply be described by the solubility product
K~ = a M + ~IHCO~ = ~/lk'l -~- T H ( ' ( ) , - DIM q- III11c(), (12)
Analogous to Eqs. (2)-(4), the relationship between the thermodynamic solubility product constant K~ and the enthalpy changes caused by the phase transition is given by
In K~(T) = -A~G~"(298 K ) / ( R 298) - A~H"'(298 K ) / R [ ( T / K ) " - 298- ' ] (13)
K~(T) can either be estimated from published data on the standard enthalpy and Gibbs energy of formation of the constituent species (a) [25,27,28,47], or can be obtained from multiplication of the square values of the solubility [44-46] and the mean stoichiometric activity coefficient of the dissolved bicarbonate salt (b) [17-22,24]. In Table 5 the literature values of the standard thermody- namic properties of formation for the cation and salt species comprising reaction Eq. (I l) are presented. Table 6 shows the results of the two approaches at three different temperatures for sodium, potassium and ammonium bicarbonate. It can bc observed that only for the sodium salt is the agreement of the two estimation methods satisfactory. The (b) values of K,(T) have been used for the calculations presented in this paper, as they were considered more accurate.
3.3. Liquid phase model
3.3.1. Acth, ity coefficient The prediction of the nonideal behaviour of an aqueous electrolyte solution is normally based on a
suitable model for the solvent activity and the ionic activity coefficients of the solutes. A number of
Table 6 Calculated values for the thermodynamic solubility t'~rodt,ct cons tan t o f sodium, potassium and ammonium bicarbonate, see text for explanation
t / ° C K,.N~HC.O~ / -- K, KnCO~ / -- K .Nil411(.() 3 / --
(a) (b) (a) (b) (a) (b)
20 (I.32 0.36 9.4 1.3 0.95 1.7
41) 0.50 0.61 15 2.7 1.8 -
60 0.74 0.95 24 6.2 6.2 -
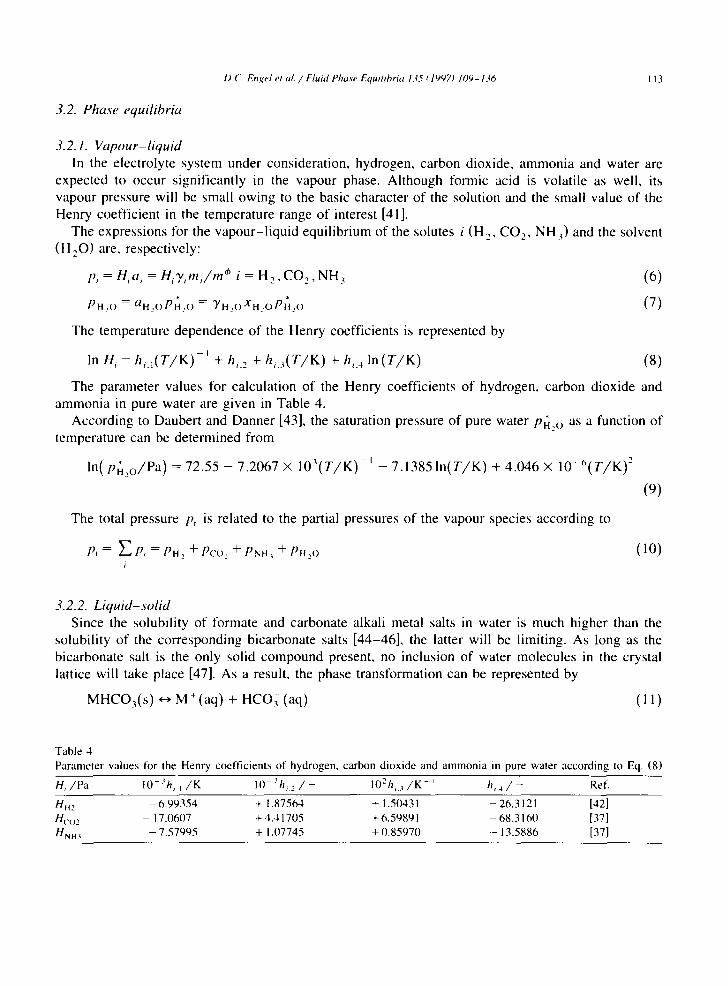
D.C. Engel et al. / I-'luid Pha.~e Equilibria I.¢5 (1997) 109-136 115
authors [48-51] have treated and compared the most widely applied electrolyte activity coefficient models in extensive reviews. Semi-empirical models are usually preferred when equilibria in aqueous systems of electrolytes are considered. If the multicomponent ionic solutions are of limited concentra- tion, i.e. its ionic strength does not exceed 6 molal, the semi-empirical model lk)rmulated by Pitzer [13,25,52,53] gives one of the best representations of the experimental data in pure, as well as in mixed, strong 1:1 and 2:1 electrolytes [54-56]. For a detailed description of the Pitzer model• the reader is referred to Harvie et al. [57] and Pitzer [25,53].
The Pitzer equation incorporates the pure electrolyte ion interaction parameters /3 C°), /3 ~) and C ~', which have been tabulated by Pitzer and coworkers for many electrolytes [13,53]. The ion difference parameters 0 and ~, which are characteristic for each aqueous mixed electrolyte system, will be assumed to be negligible. This is equivalent to saying that single electrolyte solutions of equal ionic strength mix ideally. The validity of this assumption for the description of mixed aqueous electrolytes with a common ion has been demonstrated previously by Kumar and Patwardhan [58]. The temperature dependence of the interaction parameters is considered to be negligible. This corresponds with the assumption that the temperature influence on the activity coefficients is the same for each component.
The equation of Bradley and Pitzer [59] was used for calculation of the relative dielectric constant of pure water. SiShnel and Novotny [60] gave a suitable equation for calculating the density of water in the temperature range of 5-100°C
p~ , - - 999.65 + 0 .20438( t /°C) - 6.1744 × 10 2( t / °C) 3/2 (14)
On the basis of the expected relative concentrations of the various components in solution, the following ion-ion and ion-molecule binary interactions are assumed to be significant
C O . , - (_'O~ (_ 'O,- M" N H ~ - HCOO t1" CO~ I 1 ' - N H , C O O - M ' - HCOO
CO, ILL'() Nil - C()] N H ~ - NH,COO H ' -- IICO~ M * - HCO~ M ' - O1t
(30: I-ICOO N t i s - |tCO.~ N H ~ - NH~ H ' - HCOO M ' - C( )~ NH~. - NH.~C(.)O
Owing to the basic character of the bicarbonate/formate solution, the H + concentration will be small. According to several authors [14-20•22,61], it appeared unnecessary to take the H + - X - binary interactions into account for a proper description of the bicarbonate/carbonate/carbamate subsys- tems. In addition, Pawlikowski et al. [61] and Edwards et al. [62] stated that the NH~-NH 4 CO2-NH 4, CO2-HCO ~ and CO2-CO~- binary interactions are negligibly small. Based on the determination of the solubility of CO 2 in aqueous NaOOCH solutions (results not shown), it could further be concluded that the C O 2 - H C O O - binary interaction is of no importance.
The parameter values concerning the M + - H C O O - binary and ternary interactions were determined from the corresponding single electrolyte solutions by regression of the literature activity coefficient data at 25°C up to 6.0 mol kg ~ for NaOOCH [10,11,13,23] and a maximum molality of 1.1 for KOOCH [10] respectively, see Table 7. In the latter case the ternary interaction parameter C + was set to zero because of the relatively low concentration limit of the presented data. In the model calculations• this parameter was taken equal to the value obtained for NaOOCH. For the remaining interactions, the parameter values were taken from the work of Pawlikowski et al. [61], Pitzer and

116 D.C. Engel et al. / I'luid Pha.se Equilibria 135 (1997) 109 136
Table 7 Estimated Pitzer parameter values at 298 K of the binary and ternar~ species interactions for the osmotic and activity
coefficient calculation
Interaction 10- '( /3c°).A)/(kg tool i) 10/3 ~1 ' / ( k g mo l - i) 103C~6/(kg-" mol 2)
CO, - - K - + 9.46 ~ - -
Na*- - HCOO + 7.25 + 3.21 - 2.99
K * - H C O O " + 5.40 + 4.66 - 2.99 b
NH 4 - H C O O ~ + 5.40 ~4.66 - 2.99
Estimated on the basis of Pitzer and Peiper [17] and Schumpe [63].
b Taken equal to the value given for the Na salt.
Taken equal to the values given for the K salt.
Peiper [17], Roy et al. [19,21,22] and Clegg and Brimblecombe [40]. Most of these parameter values have also been tabulated by Pitzer [53].
3.3.2. Volume For the calculation of the volumetric properties of aqueous electrolyte solutions, the Pitzer model
avoids some of the restrictions or assumptions required by previous models like, for example, the intrinsic limitation to low or moderate concentrations or the extrapolation of the properties of a binary solution beyond the solubility limit of the salts in pure water [64].
3.3.2.1. Electrolyte. For a molal solution containing I kg water and one or more electrolytes, the liquid volume occupied is equal to
V = vw+ )--'~ m,V,4' + V E (15) i
where uw is the specific volume of pure water and V,4> is the standard partial molal volume of solute i. The excess volume, V E, can be derived by taking the pressure derivative of Pitzer's Gibbs excess energy equation for a multicomponent solution of ,stron,,~ electrolytes
V E = FV+ RTY'~ Y'~m~m~(2B!, + ZC~I,) (16) C £1
The expressions for F", B v and C ' are presented by Monnin [64] and contain the pure electrolyte ion interaction parameters /3 (°)'v, /3 I])' and C +'. In the present study, binary solution density data have been used to fit all salts across several isotherms. The temperature dependence of the interaction parameters was determined according to the relation
y = y, + Y2(T/K) + y 3 ( T / K f Y = V~',[3,,,,,,[3 (' ,.,,C,~., (17)
For the numerical regression of the various subsystems, use has been made of the density data reported by Timmermans [45], S~Shnel and Novotny [60], Hershey et al. [65], Liihdemann [66], Rashkovskaya and Chernen'kaya [67] and Watson and Felsing [68]. The results for the coefficients of Eq. (17) are given in Table 8.
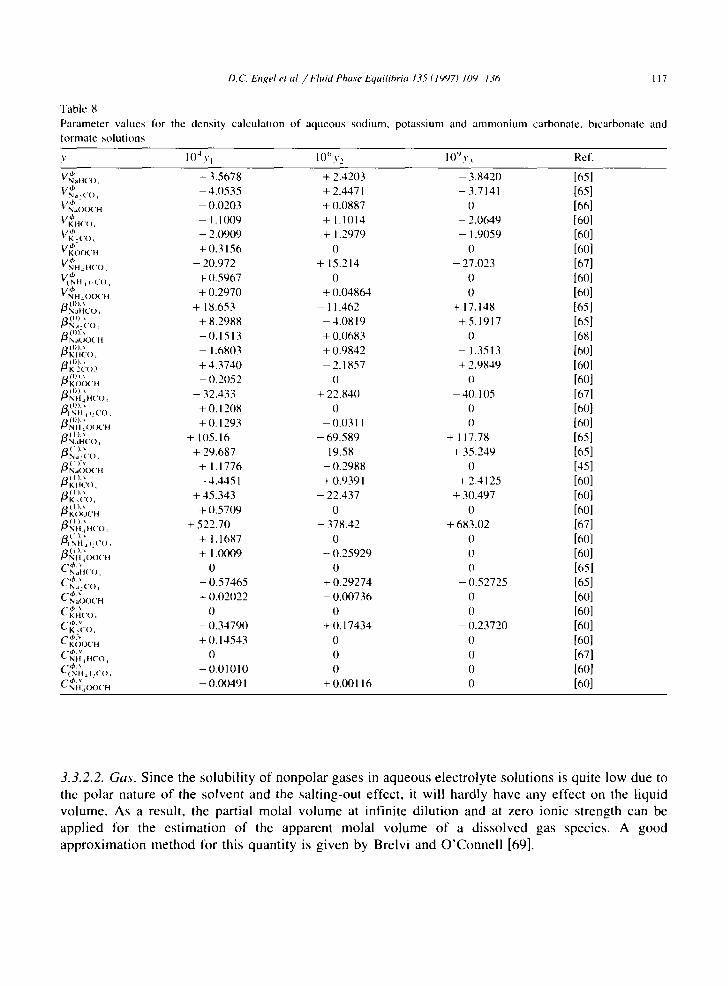
D. C_ I:)lgel et al. / I-7uid Phase I:~tuilihria 135(1997) 109 1.¢6 II 7
"Fable 8
Parameter values for the density calculation o f aqueous sodium, potass ium and a m m o n i u m carbonate, bicarbonate and
tormate solut ions
v l ()~ Y l l ( / ' y 2 I 0" v~ Ref.
V (b Nail('(), V 4,
NJ,('O~ V,.~- NaO(N.'H
4, VKH( 'O , I / [~" ( ' ( )
4)" VKO(K- H
VNH ~ It('(') ~ 4,
V(NIt i ).,CO, d,
VNH .O(X' I t /~ (i)). ~
N JH¢-'O,
N~I-('O, j~ (r))?,,
N~,(W.X'H
K I ('O, /3 (O).v
K2('o~ (0 I,',
[~KO(X' I t /3 H)). v
NH4H(70~
NaHCO,
~ (I)., N~,('(): /j (l )N N.J()(X'II
/3 (I).'. K t IC( )
K. O, /3 ( 13.~
K(X.)('H
~ ( I ),', N I ~ l i ( 'O ,
/311 ),~' (NH~): ( 'O
NI Ia(X)( ' t t
( N a i l ( ' ( ) ;
(~ N a, C(.), ~.~" CNaOO('H
(" K t t ( 'o , ,~b.v C K , ( ' ( ) ,
CKO(Y. 'H
NHa IICO -&b.~ f
~( NIl a ):CO,
(~ N t l a O O ( ' H
- 3 . 5 6 7 8 + 2 . 4 2 0 3 - 3 . 8 4 2 0 [65]
- 4 . 0 5 3 5 + 2 . 4 4 7 1 - 3 . 7 1 4 1 [65]
- 0 . 0 2 0 3 + 0 . 0 8 8 7 0 [66]
- I. I (X)9 + I. 1 0 1 4 - 2 . 0 6 4 9 [6(/]
- 2 . 0 9 0 9 + 1 . 2 9 7 9 - 1 . 9 0 5 9 [60]
+ 0.3156 0 0 [60] - 2 0 . 9 7 2 + 1 5 . 2 1 4 - 2 7 . 0 2 3 [67]
+ 0 . 5 9 6 7 0 0 [60]
+ 0 . 2 9 7 0 + 0 . 0 4 8 6 4 0 [60]
+ 18.653 - 11.462 + 17.148 [65]
+ 8.2988 - 4 .0819 + 5.1917 [65]
- 0 . 1 5 1 3 + 0 . 0 6 8 3 0 [68]
- 1 . 6 8 0 3 + 0 . 9 8 4 2 - 1 .3513 [60]
+ 4 . 3 7 4 0 - 2 . 1 8 5 7 + 2 . 9 8 4 9 [60]
- 0 . 2 0 5 2 0 0 [60]
- 3 2 . 4 3 3 + 2 2 . 8 4 0 - 4 0 . 1 0 5 [67]
+ 0 .1208 0 0 [60]
+ 0 . 1 2 9 3 - 0 . 0 3 1 1 0 [60]
+ 1 0 5 . 1 6 - 6 9 . 5 8 9 + 1 1 7 . 7 8 [65]
+ 2 9 . 6 8 7 - 1 9 . 5 8 + 3 5 . 2 4 9 [65]
+ 1 . 1 7 7 6 - 0 . 2 9 8 8 0 [45]
- 4 . 4 4 5 1 + 0 . 9 3 9 1 + 2 . 4 1 2 5 [60]
+ 4 5 . 3 4 3 - 2 2 . 4 3 7 + 3 0 . 4 9 7 [60]
+ 0 . 5 7 0 9 0 0 [60]
+ 5 2 2 . 7 0 - 3 7 8 . 4 2 + 6 8 3 . 0 2 [67]
+ 1 . 1 6 8 7 0 0 [60]
+ 1 . 0 0 0 9 - 0 . 2 5 9 2 9 0 [60]
0 0 0 [651
- 0 . 5 7 4 6 5 + 0 . 2 9 2 7 4 - 0 . 5 2 7 2 5 [65]
+ 0 . 0 2 0 2 2 - 0 . 0 0 7 3 6 0 [60]
o o o [60] - 0 . 3 4 7 9 0 + O. 1 7 4 3 4 - 0 . 2 3 7 2 0 [60]
+ 0 . 1 4 5 4 3 0 0 [60]
0 0 0 [67] - 0.01010 0 0 [60]
- 0.0O491 + 0.00116 0 [60]
3.3.2.2. Gas. Since the solubility of nonpolar gases in aqueous electrolyte solutions is quite low due to the polar nature of the solvent and the salting-out effect, it will hardly have any effect on the liquid volume. As a result, the partial molal volume at infinite dilution and at zero ionic strength can be applied for the estimation of the apparent molal volume of a dissolved gas species. A good approximation method for this quantity is given by Brelvi and O'Connel l [69].
I 18 I).C. Engel ct .I. / I"luid I'ha.~e Equilibria 135 (1997) 109-. 136
3.3.2.3. Catalyst. The extra w~lume occupied by the catalyst can be calculated from
V~ = '°" (l - ~) (18) P~
where • denotes the porosity of the catalyst support, which is usually activated carbon. The solid density of the activated carbon support, &. is estimated to be 1850 kg m- 3.
3.4. Model solution
Apart from the description of the thermodynamic nonideal behaviour of the liquid phase, in the previous sections maximally 18 independent equations have been obtained, resulting in 19 unknown variables. If the formate concentration is measured, the set of equations has a unique solution. The multidimensional Newton-Raphson method has been used for solving the model, since it has the virtue of dealing directly and clearly with the set of equations that have been formulated.
4. Experimental
4. I. Equipment
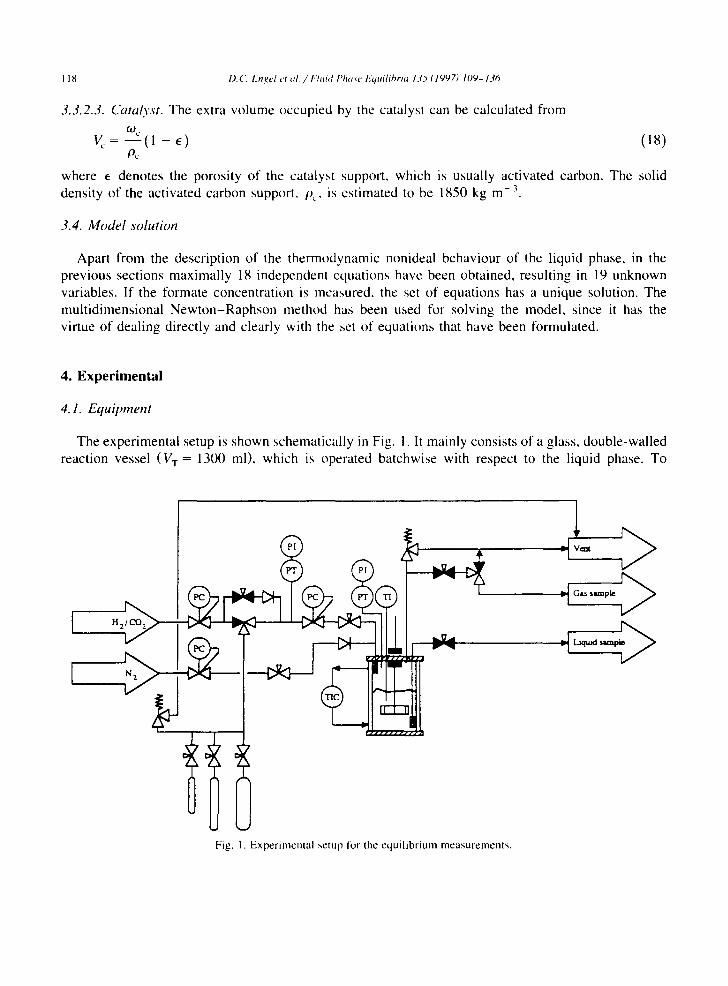
The experimental setup is shown schematically in Fig. 1. It mainly consists of a glass, double-walled reaction vessel (V T = 1300 ml), which is operated batchwise with respect to the liquid phase. To
[ "=;%
N~
-1
"J Gas s~mp~ -1
Fig. I. E×perimental setup for the equilibrium measurements.

D.C. En~el et al. / Fluid Phase Equilibria 135 f /997J 109-136 119
obtain a favourable gas-liquid mass transfer rate, a gas-inducing agitator is used. Pure hydrogen or carbon dioxide can be withdrawn from various supply vessels. The reactor is equipped with a nitrogen teed line and a gas-discharge pipe for flushing and gas-sampling purposes. A catalyst-free liquid sample can be taken from the reaction mixture via a microporous metal filter. In this way, the reverse path of reaction (1) is avoided.
The reactor was held at constant pressure by a pressure regulator. The reactor and supply pressure were monitored digitally by two identical Druck DPI 260 indicators, which had an accuracy of about 5 mbar. The reactor temperature was kept constant within 0.2 with the aid of a Tamson TI000 oil bath. The liquid temperature of the reaction mixture was determined with a thermocouple within an experimental uncertainty of 0.1 °C.
4.2. Determination of the concersion
The most reliable way to evaluate the conversion due to reaction ( l ) is to analyse the liquid phase for the amount of formate present. The conversion of bicarbonate into formate, s c. is defined as
m l i ( . o o ~ - - - ( 1 9 )
m M ,
The hydroxyl and hydrogen ion concentrations in the electrolyte solution are negligible compared to that of the other ionic species. It follows then from the electroneutrality equation Eq. (A9)
I n l l C O 0 .. = (20)
/ nH( .O , ' -f- 2mco ~ + t a t t o o 0 + / n N I t , C O O-
The conversion can thus be derived from a combined measurement of the lormate concentration and the total concentration of the anions in solution. This has been accomplished by conducting a standard aqueous acid-base titration procedure, which is described below in more detail.
4.3. Operating procedure
At the start of each experiment the reactor was filled with salt solution of known composition. The amount of solvent, varying from 0.35 to 0.90 kg demineralized water, was determined using a Mettler PM 4600 balance, which had an accuracy of 10 mg. The solid weight was measured with the aid of a Mettler AE 200 balance with a precision of 0.1 mg.
Since it was expected that an appreciable loss of carbon dioxide could occur if the reaction vessel was degassed by means of evacuation, the system was flushed several times instead with successively nitrogen and hydrogen. Before the start of an experiment, the hydrogen pressure was established at the desired value. Then, the stirrer was started and the pressure change was followed as a function of time. For the equilibrium approach from the formate side, the experiment was carried out with a closed gas supply system. Depending on the process conditions and the amount of catalyst (0.2-2.3 wt%), an experiment typically took 1-4 days. After reaching the state of equilibrium, the stirrer was switched off and the reactor was held at constant pressure by the supply of hydrogen. Catalyst-free liquid samples of 5 ml were titrated with standard HCI solution using a Mettler DL25 automatic titrator. During each titration, three successive equivalence points were observed. In order of

120 I). C. l','ngel et al. / I"luid Phase Equilibria 135 (1997) 109-136
decreasing basicity, they could be identified as: the conversion of carbonate into bicarbonate, bicarbonate to carbon dioxide, and the reaction of formate to formic acid. In this way, the formate concentration as well as the total concentration of anions could be determined with an experimental accuracy of 5 mmol 1- ~. The experimental formate conversion ,~xp was then calculated with Eq. (20).
The carbon dioxide formed by the titration was desorbed afterwards by leading nitrogen through the solution for approximately 5 minutes. The resulting solution was then titrated back with NaOH solution to check the released quantity of formic acid. After exposure to air for several hours at a temperature of 60°C, no change in the formate concentration could be measured in the liquid samples.
High purity hydrogen ( > 99.999%) was supplied by Hoek Loos. The bicarbonate and formate salts were purchased from Merck, Janssen Chimica and Fluka in varying purities (97% up to > 99.5%). Water was identified as the main source of impurity. Therefore, all salts were used as received. The titrants (0.5, 1 and 5 mol 1-J Titrisol +') were obtained from Merck. The catalysts were supplied by Engelhard (5 wt% Pd /C , ESCAT 10 and 101) and Janssen Chimica (1 wt% and 5 wt% Pd /C , 5 wt% Pd/T-A1203).
5. Results
5.1. Sodium system
Fig. 2 shows the temperature dependence of the thermodynamic equilibrium constant K, plotted according to Eq. (4). The data (57 in total) were obtained by solving the entire electrolyte model, given ~:cxp, P,, 7" and the initial amounts of sodium bicarbonate/formate, water and catalyst. Reference is made to Tables 9 and 10 for tabulation of all original experimental data. The standard enthalpy change for reaction (1) was calculated from the slope of the straight line, which resulted in A~H += - 2 0 . 5 kJ mol -~. This is close to the experimentally determined value of Woods [26], - 2 2 . 6 kJ mol -~. On the basis of Wagman et al. [27], A,.H ~' was found to be - 19.4 kJ tool- ~, which agrees well with both values.
- R In K
~j m o l - l K I
10
)
-5 ~"
2.9 I0 3
N a - s y s t e m
3.1 10 a
e, . - i) 5 molal
<, o.5 - 4 mo:al
.-~..
' " " ' " [
3.3 10"; 3.5 10 '~
1/-r (K I )
Fig. 2. Temperature dependence of the thermodynamic equilibrium constant according to Eq. (4).
I). C. I-ngel et al. / I"luid Phase t~quilihria 135 f 1997) 109-136 121
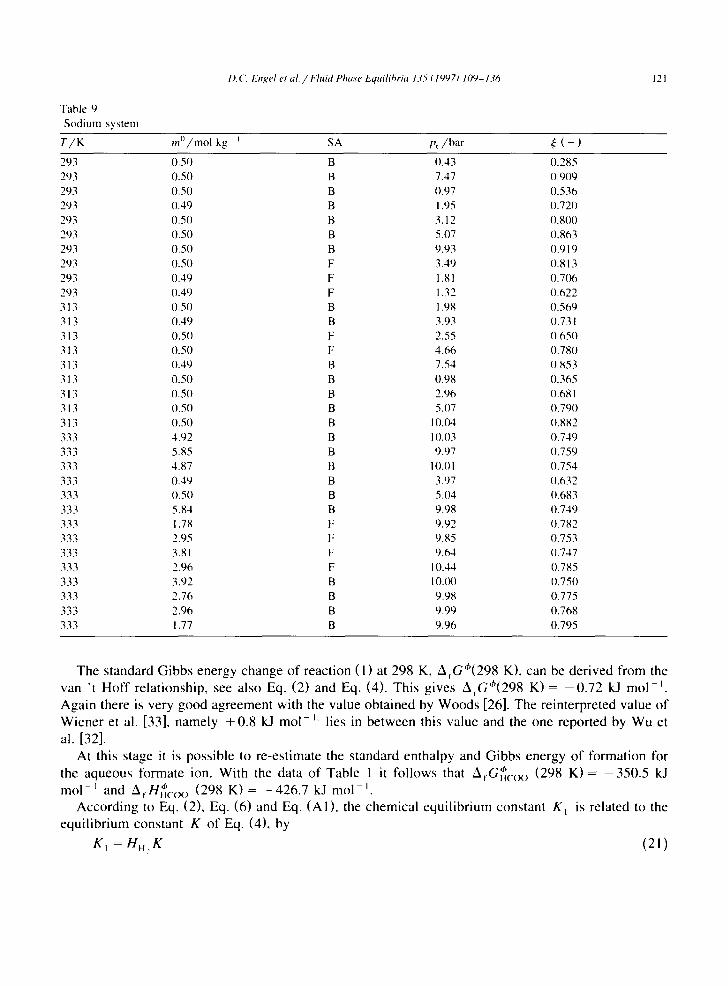
Table 9 Sodium system
T/K m~)/mol kg i SA p~/bar ~ ( - )
293 0.50 B 0.43 0.285 293 0.50 B 7.47 0.909 293 0.50 B 0.97 0.536 293 0.49 B 1.95 0.720 293 0.50 B 3.12 0.800 293 0.50 B 5.07 0.863 293 0.50 B 9.93 0.919 293 0.50 F 3.49 0.813 293 0.49 F 1.81 0.7(~5 293 0.49 F 1.32 0.622 313 0.50 B 1.98 0.569 313 0.49 B 3.93 0.73 I 313 0.50 F 2.55 0.650 313 0.50 F 4.66 0.780 313 0.49 13 7.54 0.853 313 0.50 B 0.98 0.365 313 0.50 B 2.96 0.68 I 313 0.50 B 5.07 0.790 313 0.50 B 10.04 0.882 333 4.92 B 10.03 0.749 333 5.85 B 9.97 0.759 333 4.87 B I0.01 0.754 333 0.49 B 3.97 0.632 333 0.50 B 5.04 0.683 333 5.84 B 9.98 0.749 333 1.78 F 9.92 0.782 333 2.95 F 9.85 0.753 333 3.81 F 9.64 0.747 333 2.96 F 10.44 0.785 333 3.92 B 10.(X) 0.750 333 2.76 B 9.98 0.775 333 2.96 B 9.99 0.768 333 1.77 B 9.96 0.795
The standard Gibbs energy change of reaction (1) at 298 K, ArG't'(298 K), can be derived from the van 't Hoff relationship, see also Eq. (2) and Eq. (4). This gives ArG+(298 K ) = - 0 . 7 2 kJ mol -~ Again there is very good agreement with the value obtained by Woods [26]. The reinterpreted value of Wiener et al. [33], namely + 0.8 kJ mol - ~ lies in between this value and the one reported by Wu et al. [321.
At this stage it is possible to re-estimate the standard enthalpy and Gibbs energy of formation for the aqueous formate ion. With the data of Table I it follows that ' "+ AfGHc(× ) (298 K ) = - 3 5 0 . 5 kJ
,b mol - l and At.HHc(~ o (298 K ) = - 4 2 6 . 7 kJ mol - I
According to Eq. (2), Eq. (6) and Eq. (AI). the chemical equilibrium constant K l is related to the equilibrium constant K of Eq. (4), by
K I = H H K (21)
122
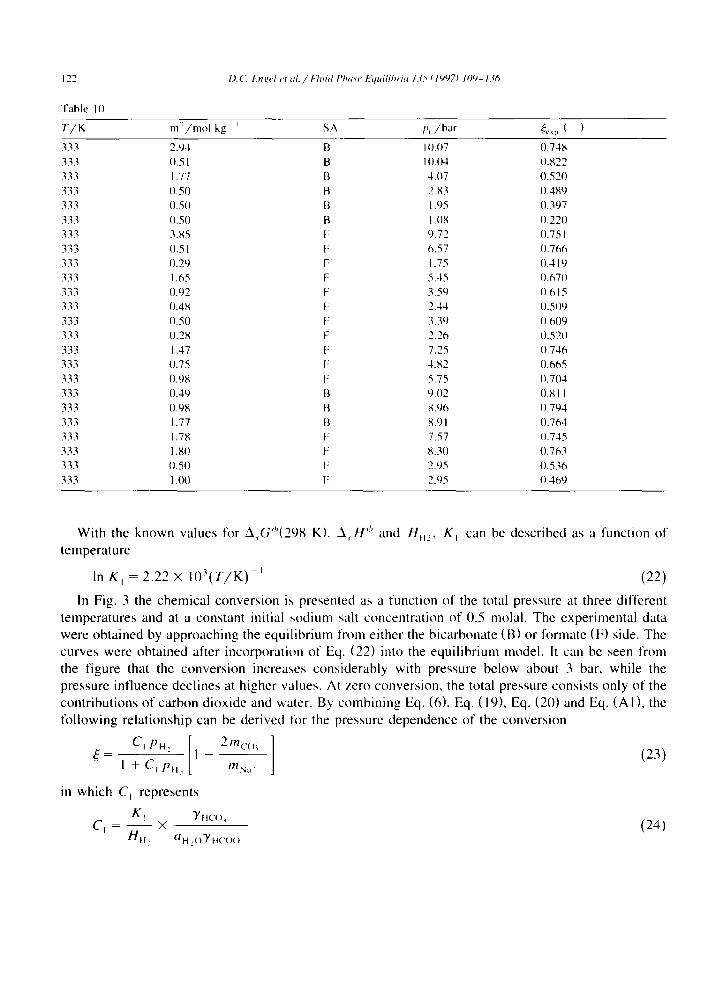
Fable 10
I).('. I:'nk, el et al. / k l m d I'ha.~e Equilihria 1.75 t 19971 109- 136
T / K m"/mol kg i SA p, /bar ~.,p ( )
333 2.94 B IO.O7 0.748 333 0.51 B IO.O4 0.822 333 1.77 B 4.07 0.520 333 0.50 B 2.83 0.489 333 0.50 I'1 1.95 0.397 333 0.50 B 1.08 0.220 333 3.85 F 9.72 0.75 I 333 0.51 F 6.57 0.766 333 0.29 F 1.75 0.419 333 1.65 F 5.45 0.670 333 I).92 F 3.59 O.615 333 0.48 F 2.44 O.5(19 333 0.50 F 3.39 0.609 333 0.28 F 2.26 0.520 333 1.47 F 7.25 0.746 333 0.75 F 4.82 0.665 333 0.98 F 5.75 0.704 333 0.49 B 9.02 0.81 I 333 (I.98 B 8.96 (I.794 333 1.77 B 8.91 0.764 333 1.78 F 7.57 0.745 333 1.80 F 8.30 (I.763 333 0.50 F 2.95 0.536 333 1 .OO F 2.95 0.469
With the known values for ArG'!'(298 K). k, H'" and HH2, K~ can be described as a function of temperature
In K, = 2.22 × 10³(T/K) - ' (22)
In Fig. 3 the chemical conversion is presented as a function of the total pressure at three different temperatures and at a constant initial sodium salt concentration of 0.5 molal. The experimental data were obtained by approaching the equilibrium from either the bicarbonate (B) or formate (F) side. The curves were obtained after incorporation of Eq. (22) into the equilibrium model. It can be seen from the figure that the conversion increases considerably with pressure below about 3 bar, while the pressure influence declines at higher values. At zero conversion, the total pressure consists only of the contributions of carbon dioxide and water. By combining Eq. (6). Eq. (19), Eq. (20) and Eq. (AI), the following relationship can be derived for the pressure dependence of the conversion
[ 2mc°i ] Ci Pu. I - - (23) - 1 + C t P~l. mn;,'
in which C~ represents
KI YHco, C, - × (24)
HII. (IH ,()'Y H('()()

D. ('. l".nk, el et al. / Fluid t'hase I:'quilibria 135 ( 19971 109 136 123
0.8 ~ ~" ..... j - '
/ i r / ~ .- i
b , 0 . 6 - ., . • . 4
0 . 4 " ' ' "• '
0 . 2 ,' m( l la l I
0 " '
0 2 4
Na-system I i N i i
....... - t . . . . . . ... • -
• 13, 2 0 C
l
• B . 4 ( I (_"
: F
• B.f~)'(" I
F
. . . . cal. 2(YC
cal, 4[ 1"(
cal, @Y'("
I ! [ - - - ' I
f-, 8 IO 12
P l ( b a r l
!
L i
Fig. 3. Equilibrium convers ion as a function of pressure and temperature for the sodium system at 0.5 molal.
At a certain temperature and sodium concentration, C~ is virtually constant. Moreover, if the sodium concentration and the ratio VL/V t is not too stnall, the term on the right hand side of Eq. (23) is close to 1 and a Langmuir-type equation is obtained.
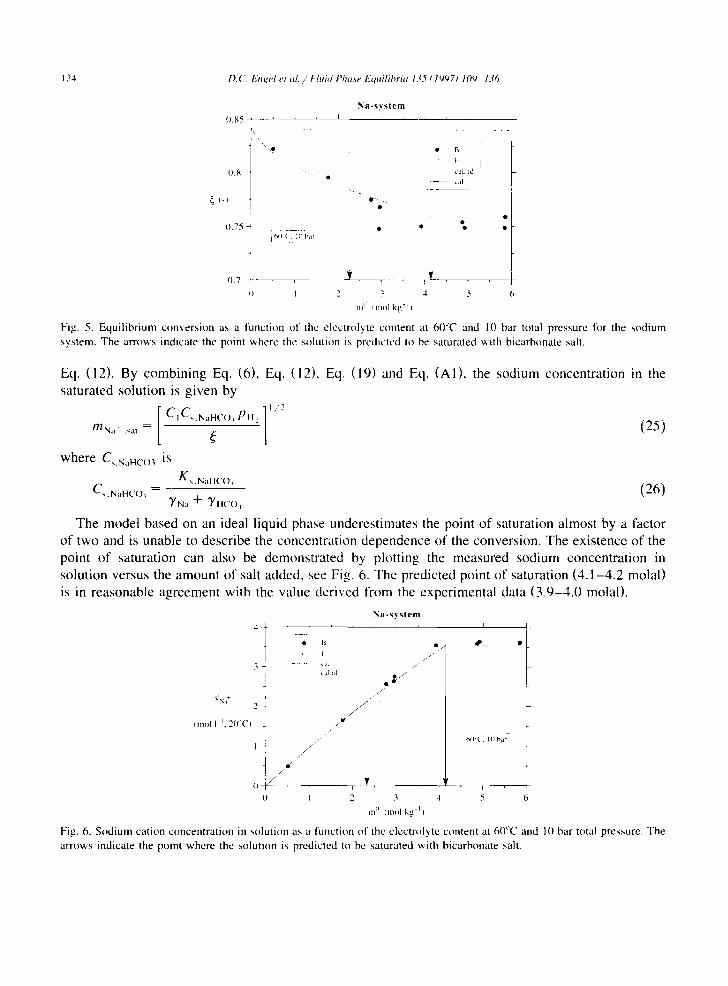
in Fig. 4, the theoretical and experimental results of the concentration influence on the equilibrium conversion are presented at 60°C. Only at low conversions does there appear to be some effect. although this is partly due to the rising contribution of the carbon dioxide pressure at increasing bicarbonate concentration. In order to determine the influence of the electrolyte concentration above the solubility limit of pure sodium bicarbonate, Fig. 5 shows the equilibrium conversion at 10 bar total pressure and 60°C.
The agreement between the experimental data and the model predictions is satisfactory only if the nonideal behaviour of the liquid phase is taken into account. The experimental conversion gradually decreases with rising initial sodium salt concentration up to the point of saturation (marked by an arrow), above which it further remains constant. This point is determined by the solubility product,
0 . 6
~ 0 . 4
0 . 2
o
I I N a - s y s t e m
I
t~ )"( 7
. i - Fi . ; - : - : : ' ' ,7~ i ;5 . - - / " -
.': 5 -
/ /
, , / i /
q •
o 2
' 1
c . . . :.z : :L , - - - IF
f • B, 0 5 mokd ]
F:
• B, I t ) mt~lM
:+ F !
i B, I ; [mqal i
[ i [; cal, 0 5 mo la l
- - - c a [ , [ , ( ) m o l a ? •
• - - cal. 1 7 rnolal "
g IO 12 i
4 6
PE f b a r )
Fig. 4. Equilibrium convers ion as a function of pressure and concentration for the sodium system at 6(PC.
124 I).('. Encel et al. / HuM Pha,w, l:'quilibria 135 ~ /997) 109 136
0.85 ~
/ , ,
\ \ o
{}.g
, ~ ( - ]
0.75 i6(') ( ~ ' ( ' i ' t ....
Na-system
° O
• R
• F
cal. ~d - - . caJ
o.7 .-- ~' ,__.. ~ T_ , o 2 3 4 5 6
m c (nlol k g - :
Fig. 5. Equilibrium convers ion as a function of thc electrolyte content at 6(FC and 10 bar total pressure for the sodium system. The arrows indicate the point ,.,,'here the sohntion is predicted to be saturated with bicarbonate sail.
Eq. (12). By combining Eq. (6), Eq. (12), Eq. (19) and Eq. (AI), the sodium concentration in the saturated solution is given by
[ C I C ~ I ';aH('O, I '~tt: ]1 /2 ,nn,.., , , ,= " ~ (25)
where Q.N,,nco3 is
Ks.g:a]co, C~.N,,.CO ' = (26)
Y N a + T H("O,
The model based on an ideal liquid phase underestimates the point of saturation almost by a factor of two and is unable to describe the concentration dependence of the conversion. The existence of the point of saturation can also be demonstrated by plotting the measured sodium concentration in solution versus the amount of salt added, see Fig. 6. The predicted point of saturation (4.1-4.2 molal) is in reasonable agreement with the value derived from the experimental data (3.9-4.0 molal).
N a - s y s t e m I I I .
• B • .... •
I
~ al.',d OJ o. Ir
//
" .j/ - i "-
. . - '" NV(.'. Ig} har I -~ j
i " / i /
0 - ~ - r -¥ . . , , 0 I 2 3 4 5 6
m II HllOl k g -I1
CN+ a
fmol
t 3 -
i
n
2 ,
I, 2f)':(" ~
Fig. 6. Sodium cation concentration in solution as a function of the electrolyte content at 60°C and 10 bar total pressure. The arrows indicate the point where the solution is predicted to be saturated with bicarbonate salt.
D.C. Et gel et al / F l u i d Pha~'e Equilibria 135 (1997) 109-136 125
Na-svs tem
1.6 I ...... I I - t
1.4 . . . • " " I , , ~ 7 ( - ~
12 2 . - g ° - _• ~ • -:;•<" ~Oeo ~
1 , - ~ - . . . . . . . .
- c 't~
Kca/Kex p (-I
( ) . 8 - - K c a l / K c a l a d -
Kcal = Kcxp i ' O. 6 - • 13
:-: F . . . . . .
0 .4 i , - I 0 . 3 4
m~i ~- (mol kg-I~
Fig. 7. Dependence of the electrolyte concentration on the determined thermodynamic equilibrium constant for the sodium system, see text for explanation.
1.6
1.4~
1.2~ a
K:al/Kc× p (-) I
O . 8 -
0 . 6
0 . 4
Na-system I i A I 1
• B
~" F
" - - - - K c a I = Ke~ p
~ • i D
I I , -'--'--T--"
0.2 o 4 0 .6 o ~
Fig. 8. Dependence of the equilibrium conversion on the determined thermodynamic equilibrium constant for the sCKlium system, see text for explanation.
I - 5.,e~pl~.a t
(-) -0.1
-0.2
-0.3
Na-system 0.3 I I
c 0.2 ~ I ""
o . . . . . . . . . . . . J . / . ~
4 • cal. presen t stud~,
i z, cal. id • ca l , W ( x . M s [ 2 6 ]
0 0.2 0.4 0.6 0.8 = (.) ~exp
Fig. 9. Relative deviation between the measured and calculated equilibrium conversion for the s(Ktium system. Included are the data of Woods [26].

126 D.C. Kneel et al. / l"luid fJlut,~e l:'quilihria 135 ¢ 19971 109 136
N a - s y s t e m 0 . 2 i , i I
0 l
1 - ( " + / ¢ + ' " 1 ~ N;i.exp N a.c,a • ! !
O . . . . . . ~ - I </ • " • 2 , , , ' ;
" t -0.1 - t
i -0.2 . . . . . . . l I
0 1 2 3 4
c , , , , :+ imol 1 -~. 2 0 C 1
Fig. 10. Relative deviation between the measured and calculated sodium cation concentration in solution.
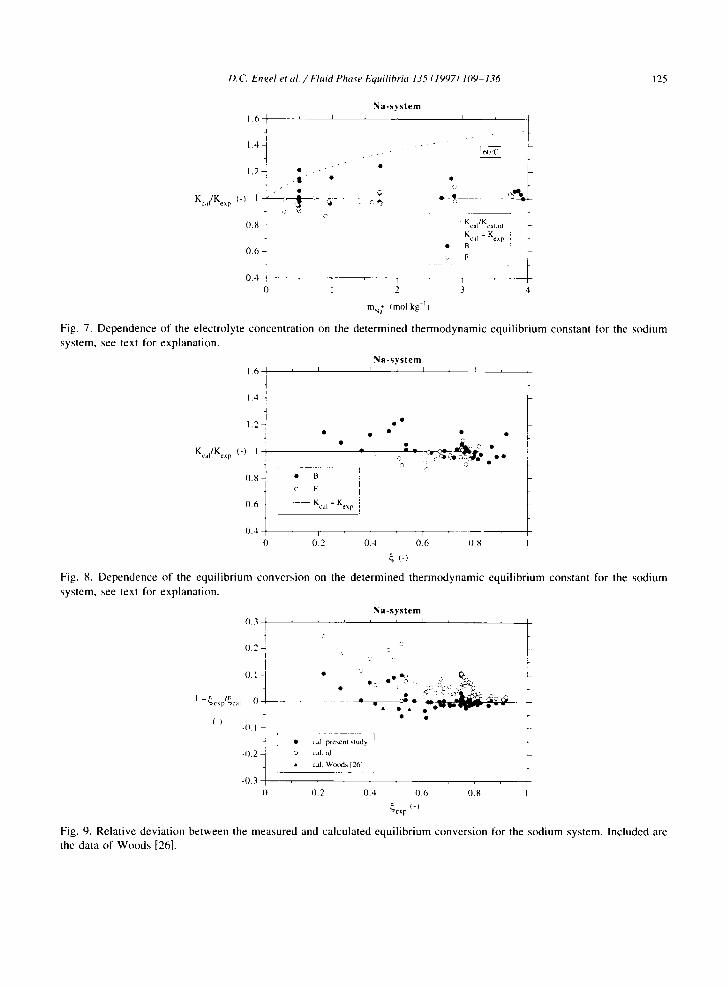
To verify if there is any dependence of either the electrolyte concentration or the conversion on the thermodynamic chemical equilibrium constant. Fig. 7 and Fig. 8 show the ratio of calculated, i.e. by using Eq. (22), and measured K I values. Considering the appreciable scatter of the experimental data, no general trends can be recognized. The dashed curve in Fig. 7 represents the quotient of two equilibrium constants, which were obtained assuming an ideal and nonideal liquid phase, respectively. In fact, this quotient is equal to the activity coefficient ratio (¢dlt,C)'YHC,CX) /'YH('O, )'
In Fig. 9, the measured and calculated conversions are compared for the data obtained in the present study and those of Woods [26]. If the nonideal liquid phase behaviour is taken into account, the majority of the calculated points show a deviation of less than 5%. On the other hand, if an ideal liquid phase is assumed, the model predictions are systematically too high.
According to Eq. (AI0), the elemental carbon balance can be checked by comparison of the measured and calculated sodium ion concentration (see Fig. 10). It can be concluded that for all
K - s y s t e m ] , . . I I
t . . . . . . . _ L . . . . . I 0 .8 " .... _ . . e
/ 0 . 6 ~ , / _ . . . . . . . . . . --
(-I t ' ¢ . . • B. 2o ("
t e" • F 0 4 • B. 6(l'C --
' i 1 ) . 2 - ~ .' • I I ~ n ) M a l - . . . . . va l l . 2 ( l ' ( . "
. . . . ~a [ . 611"(." l
0 / , ' . . . . ~ • - . - . :... ! . C) 2 4 6 8 I 0
Pl Ihar)
Fig. l I. Equilibrium conversion as a function of pressure and temperature for the potassium system at 0.5 molal.

D.('. Engel et al. / Fluid Pha.~e Equilibria 135 (1997) 109 136 127
Table 1 I Potassium system
T / K ,n° /mol kg ' SA p , / b a r .E~I, ( - )
293 0.50 B 0.49 0.326 293 0.50 B 0.97 0.531 293 0.49 }: 1.45 0.632 293 0.51 B 2.98 0.759 293 0.50 B 7.55 0.909 293 0.50 B 9.98 0.91 I 313 0.49 B 4.03 0.755 313 0.98 B 3.99 0.717 313 1.95 B 4.00 0.673 313 4.00 B 3.97 0.570 333 0.50 F 1.02 0.213 333 0.50 B 2.10 0.429 333 0.49 B 2.61 0.501 333 0.49 B 5.00 0.669 333 0.51 B 7.01 0.747 333 0.50 F 9.99 0.821
experiments the agreement is within five percent, which indicates that the adsorption of ions on the catalyst surface is negligible compared with the amount of electrolyte present in the solution.
5.2. Potassium system
By analogy with Fig. 3, Fig. I ! gives the pressure dependence of the conversion for the potassium system. Data are given in Table 11. The calculated curves have been obtained using Eq. (22) in the equilibrium model, which was derived independently from the potassium system. It can be noticed that the influence of both variables is essentially the same.
In studying the electrolyte concentration dependence of the equilibrium composition, Fig. 12 shows some typical results at 40°C and 4.0 bar total pressure. It is observed that the conversion gradually
K-system
i
O. 7 -i ~'~-'~'~- i
~-~ .........
4()~L ", ,10 b a r 0 . 6 ' "
0.5 I I
0 1 2
m ° ¢mol k g - I )
• B
. . . . . cal, id
- - -. c , l l
- . . .
T I t
3 4
Fig. 12. Equilibrium conversion as a function of the electrolyte content at 40°C and 4.0 bar total pressure for the potassium system.

128 D.C. Engel et al. / Fluid I'ha,se Equilibria 135 (1997) 109-136
K - s y s t e m
0 . 3 , I I
0 . 2
0 . 1
1 -- ~ c x p / Q a l 0
( - ] - 0 . 1
- 0 . 2
- 0 3
c
• "11 . . . . . i t . . . . . •
• ,. "'o" • "
• ;.'al. prc,.a:nl ~lud? t. : : .
c a i , k l :.
• ". cal . ,~(lu:lla t'l ai 16.7.311
Cd], %1* It'iICI t'[ al 4 q
0 0 2 0 . 4 0 6 ( J . 8 I
'= ( _ ) ~ c ' , p
Fig. 13. Relative deviation between the measured and calculated equilibrium conversion for the potassium system. Included are the data of Souma et al. [6,7,31] and Wiener et al. [33].
falls from about 0.77 to 0.58 by increasing the salt concentration from a situation of infinite dilution to a concentration of 4 mol kg- i. Even though the temperature and conversion are lower than in the case of the sodium system in Fig. 5, the concentration range was still below salt saturation, see also Eq. (12) and Table 6.
Fig. 13 presents a relative comparison of the collected data from various sources for the potassium system. Obviously, the largest deviation appears at the highest electrolyte concentration. If the experimental results of Wiener et al. [33] are considered, the model predictions are within 5% error and the apparent discrepancy these authors reported between the obtained results starting from 1 mol 1-~ KHCO~ and 4 mol 1 ' KOOCH has been eliminated. On the other hand, the predictions based on the investigations of Souma et al. [6,7,31 ] are somewhat too low, but the accuracy of the experimental data will be limited, because the authors determined the equilibrium composition on the basis of an
0 . 8
0 . 6
~(-~
0 . 4
02
0
t . . i v * " . -
/ / . /
/ A /
i i
i . @
• " i ? .
N H 4 - s y s t e m
. . j . . . . . . . . . . _- : , . . • . . . ~ -
7
• | ] , 20"C • "e
• I L 4 0 " C
.~ F • B . 60'C
-- ca l , 20"(7
0 5 t l l o l . a l cal . . I (J 'C cal , fTl'{"
I 1 " - ~ - - - - I
2 4 6 g 10
p: ( b a r )
Fig. 14. Equilibrium conversion as a function of pressure and temperature for the ammonium system at 0.5 molal.
D.C. Engel et al. / Fluid Phase Equilibria 1,75 [ 1997) 109 136 129
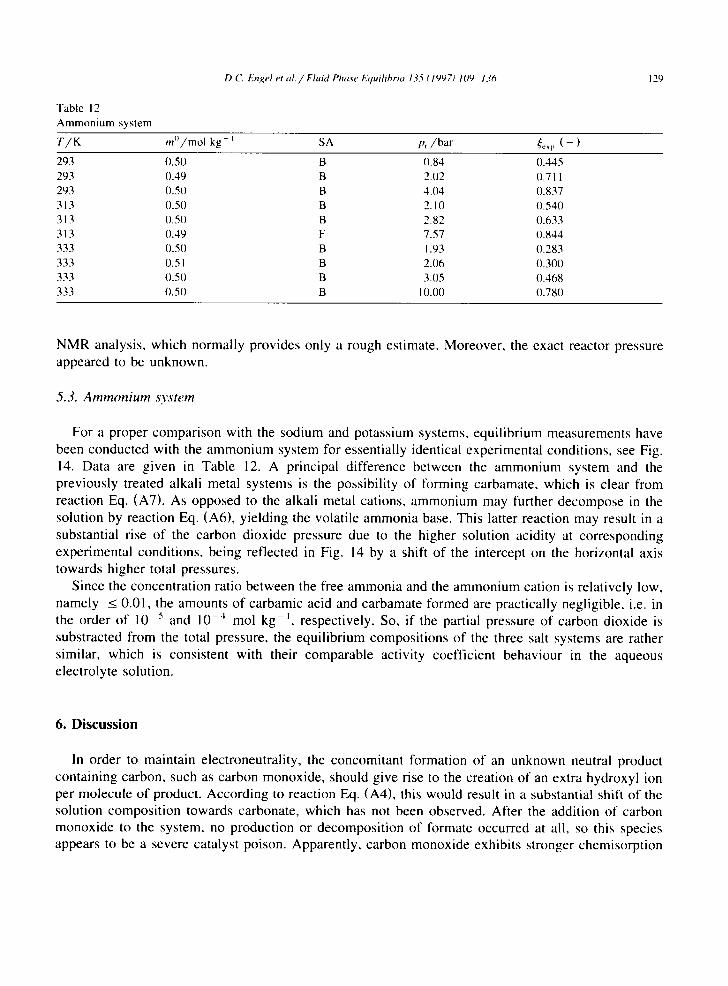
Table 12 Ammonium system
T / K m~/mol kg- i SA p,/bar .~.~p ( - )
293 0.50 B 0.84 0.445 293 0.49 B 2.02 0.71 I 293 0.50 B 4.04 0.837 313 0.50 B 2. I 0 0.540 313 0.50 B 2.82 0.633 313 0.49 F 7.57 0.844 333 0.50 B 1.93 0.283 333 0.51 B 2.06 0.300 333 0.50 B 3.05 0.468 333 0.50 B 10.00 0.780
NMR analysis, which normally provides only a rough estimate. Moreover, the exact reactor pressure appeared to be unknown.
5.3. A m m o n i u m s y s t e m
For a proper comparison with the sodium and potassium systems, equilibrium measurements have been conducted with the ammonium system for essentially identical experimental conditions, see Fig. 14. Data are given in Table 12. A principal difference between the ammonium system and the previously treated alkali metal systems is the possibility of forming carbamate, which is clear from reaction Eq. (A7). As opposed to the alkali metal cations, ammonium may further decompose in the solution by reaction Eq. (A6), yielding the volatile ammonia base. This latter reaction may result in a substantial rise of the carbon dioxide pressure due to the higher solution acidity at corresponding experimental conditions, being reflected in Fig. 14 by a shift of the intercept on the horizontal axis towards higher total pressures.
Since the concentration ratio between the free ammonia and the ammonium cation is relatively low, namely < 0.01, the amounts of carbamic acid and carbamate formed are practically negligible, i.e. in the order of 10 5 and 10 -4 mol kg-~, respectively. So, if the partial pressure of carbon dioxide is substracted from the total pressure, the equilibrium composit ions of the three salt systems are rather similar, which is consistent with their comparable activity coefficient behaviour in the aqueous electrolyte solution.
6. Discussion
In order to maintain electroneutrality, the concomitant formation of an unknown neutral product containing carbon, such as carbon monoxide, should give rise to the creation of an extra hydroxyl ion per molecule of product. According to reaction Eq. (A4), this would result in a substantial shift of the solution composit ion towards carbonate, which has not been observed. After the addition of carbon monoxide to the system, no production or decomposit ion of formate occurred at all, so this species appears to be a severe catalyst poison. Apparently, carbon monoxide exhibits stronger chemisorption

130 I).( ' . l-n£,el et al. / f"1 li 1 I'ha~'e Izquil ihria I ¢g 1997) 109 136
on palladium surfaces than hydrogen or formate, which is in accordance with earlier observations [70]. However, as the determined equilibrium constant is virtually independent of the side from which the equilibrium is approached, the amount of carbon monoxide formed cannot be significant. Nevertheless, in basic aqueous solution, carbon monoxide may arise primarily from the following hypothetical mechanism for water ,gas shift reaction catalysis [71]
a¢.oaoH HCOO- ~ CO + OH- K,~ - (27)
~l tt('~ )()
Consistent with such a pathway is the fact that in strong alkaline solution, the uncatalysed reaction of carbon monoxide to give formate is facile at elevated temperature, i.e. between about 120 and 180°C [72]. If the value of the molality-based equilibrium constant K,~ is considered at the temperature range of 20-60°C, namely 10-~e-10 ~3, it appears that the equilibrium is very unfavourable with respect to the lormation of carbon monoxide. Furthermore, a mixture of 0.25 molar NaOH and 0.48 tool 1-t NaOOCH decomposed at 60°C under the influence of P d / C into 0.24 mol 1-~ Na_,CO~, 0.05 mol 1-i NaHCO~, 0.20 tool I ~ NaOOCH and H e up to a total pressure 2.66 bar.
For all experiments, the conversion estimated on the basis of the hydrogen consumption proved to be within 5% error. From a combined GC-IR and GC-MS analysis, no species other than water or carbon dioxide were proven to be present in the gas and liquid phase. After evaporating the solvent at 110°C, the solid phases obtained were identified as being the formate, bicarbonate and carbonate salt of the alkali metal used [73].
7. Conclusions
The values of the experimental equilibrium conversion obtained in previous investigations [6,7,29- 31] were confirmed in the present study. Satisfactory agreement was found between the standard enthalpy and Gibbs energy change values of the reaction determined here and the results reported by Woods [26]. On the basis of the NBS tables of thermodynamic properties [27], the standard entbalpy and Gibbs energy of formation for the aqueous tonnate ion could be re-estimated, resulting in values of -350.5 and -426.7 kJ mol-J, respectively. ]'he bicarbonate conversion increased with rising hydrogen pressure according to a Langmuir-type of saturation behaviour. Owing to a negative heat of reaction (ArH + = -20 .5 kJ mol- ~), the conversion decreased with rising temperature. At constant pressure and rising electrolyte concentration, a lowering of the equilibrium conversion was observed. However, the concentration influence declined at higher conversions, which can be explained in terms of the hydrogen pressure effect. The maximum attainable electrolyte concentration in the solution was limited by the solubility product of the bicarbonate salt, as has been reported before [33]. At constant temperature, the solubility of the aqueous electrolyte mixture depended on the equilibrium conversion, which is in agreement with the common cation effect. In the range of process conditions studied, the developed equilibrium model based on the Pitzer equations, gives a good prediction (within 5% error) of both the experimentally determined equilibrium conversion and the point of saturation of the solution. In case of assuming an ideal liquid phase, a significant deviation was observed in the prediction of the point of saturation, i.e. about 50%.
As a result of the universal framework of the proposed model, it can be utilized for all members of the alkali or alkaline earth metals, because only the system-dependent interaction parameters are

D.C. Engel et al. / k lu id Pha~'e l-quilihria 135 f 1997) 109-. 136 131
needed to give a good estimation of the thermodynamic nonideal behaviour of the liquid phase. The present work shows that lk)r the description of the electrolyte system under consideration, the use of a multicomponent thermodynamic model provides a better insight into the effects of the various process parameters involved.
8. List of symbols
B C
C Ca C~ C~t, F v
AG h~ Hi A H !
ki K K, m
tl
P R !
T I"
V l,l"
A"
V
2
Z
8.1. Greek letters
3(0),( I )
E catalyst porosity
activity binary interaction function or second virial coefficient/kg tool-J liquid phase concentration/mol 1-~. tool m- ternary interaction function or third virial coefficient/kg-" tool- -~ parameter defined in Eq. (24)/Pa-~, bar--t parameter defined in Eq. (26) ternary cation-anion interaction parameter/kg- mol - Debye-Hi]ckel term for the electrolyte vo lume/m 3 k g J Gibbs energy change/kJ tool i Henry coefficient parameter of species i Henry coefficient of species i/Pa, bar enthalpy change/kJ tool-i ionic strength/tool kg equilibrium constant parameter for reaction i thermodynamic equilibrium constant of reaction ( 1 ), as defined in Eq. (2) thermodynamic chemical equilibrium or dissociation constant for reaction i molali ty/mol kg- i molar mass of water /kg tool-i number of moles absolute pressure/Pa, bar universal gas constant/J mol-~ K temperature/°C absolute temperature/K specific vo lume/m ~ kg i vo lume/m ~ kg- i weight /kg liquid phase mole fraction ternperature dependent parameter, Eq. (17) valency total char,,e~_ molali ty/mol kg-
binary cation-anion interaction parameters/kg tool activity coefficient
132 D.C. Engel et al. / I'luid Pha.~e l:'quilihria 135 (1997) 109-136
binary neutral-ion interaction parameter/kg mol-I chemical conversion defined in Eq. (19) densi ty/kg m
8.2. Indices and abbret'iations
a
aq b B C
C
cal E exp f F g i id I,L M b'
r S
S
s a t
SA t,T V
X 0
~b
anion aqueous, hydrated bicarbonate equilibrium approach from bicarbonate side carbon cation calculated excess quantity experimental formation equilibrium approach from formate side gas phase species i ideal liquid phase liquid phase cation of electrolyte MX stoichiometric number reaction solid phase solubility product saturated salt solution side of equilibrium approach total pressure derivative anion of electrolyte MX initial pure species standard state
Acknowledgements
The authors are indebted to the Engelhard company, who kindly provided a large number of the catalyst samples used. We gratefully acknowledge B. Knaken, S. Kuipers, W.J. l,eppink, R. Miiller, A. Schanssema and A.H. Pleiter |k~r technical assistance and guidance. Thanks are further due to L.B.M. van Kessel for providing the software required to solve the equations numerically. We finally would like to thank H.J. Oldenhof l'rom Akzo Basic Chemicals Division for performing the GC-MS and GC-1R liquid phase analyses.
D. C Engel et al. / Fluid Phase Equilibria 135 (1997) lOq- /36 133
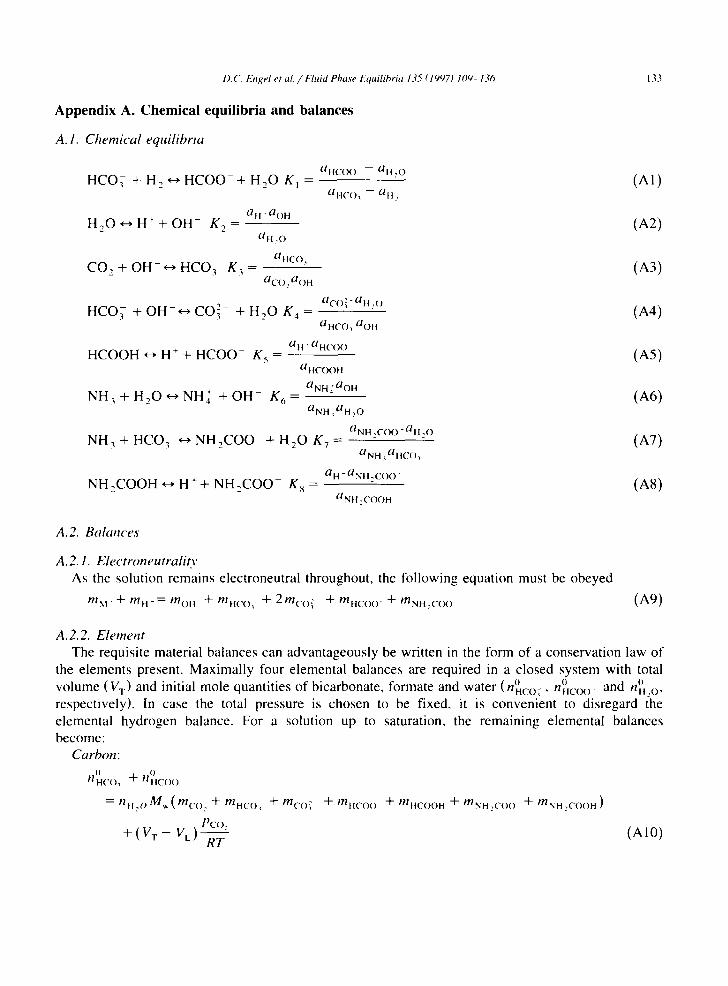
Appendix A. Chemical equilibria and balances
A. 1. Clwmical equilibria
HCO.~- + H~ ~ H C O 0 - + H , O K~ =
H 2 0 , ~ H~ + O H - K 2 - al l . aoH
aH ,c)
CO 2 + O H - o HCO~ K 3 -- all£O,
aco , aoH
alt(_.cx ) -- aH~ O
al . t ( .o , - - a l l `
a c o ~ - a , , o HCO 3 + O H - o CO~- + H ~O K 4 -
aHCO, a o t l
all "aRC(×.) H C O O H o H + + H C O O - K s -
aIIC(XIH
aNH2aOH N H ~ + H 2 0 ~ N H 4 + O H - K 6 -
aNH,aH.O
aNH 2COO -all ,O N H ~ + H C O ; ~ N H 2 C O O - + H 2 0 K 7=
~/NH ~allCO, a H -aNII.COO-
NH~COOH ~ H * + N H 2 C O O - K s = ('/Nil ,COOH
(A I )
(A2)
(A3)
(A4)
(AS)
(A6)
(A7)
(AS)
A.2. Balances
A.2. I. Electroneutralitv As the solution remains electroneutral throughout, the following equation must be obeyed
rn~a. + /71H - = moll + mHC() , -'{'- 2moo ( + m H C ( X ) + m N H : ( - ( × ) (Ag)
A.2.2. Element The requisite material balances can advantageously be written in the form of a conservation law of
the elements present. Maximally four elemental balances are required in a closed system with total o o and n ° volume (V T) and initial mole quantities of bicarbonate, formate and water (nHCO;, nHcc× ) . , : o ,
respectively). In case the total pressure is chosen to be fixed, it is convenient to disregard the elemental hydrogen balance. For a solution up to saturation, the remaining elemental balances become:
Carbon: 0 0
I /H( , ( ) ' "[- IlllC(.)O
= nil, o m,~ (rnco" + rnm, o, + moo i + mHcoo + mHCOOH + m.xH2c'oo + rnNH,COOH )
PCO, (Al0) + ( V T - - VL) RT

134 D.C. I'n~,,el et al. / l"luid t'h,,~e Equilibria 135 ( It)97~ 109. 136
Nitrogen:
r io + o tlCO~ R IIC()O
Oxygen: 0 0 3nHco, + 2nHCOO + t{~l,o
= I1H, O "-t'- n H , o m w ( m o H + 3muco, + 3moo.
+ 2mH(:OOH + 2mNII~C'(X) + 2mNt l ,('OOH ) + ( V ' l - V l . )
Metal:
ii + o = n i t ( )M, , . t n M r/i-t(:'O~ nil(:()() , ,
P Nit =- n, , .oM,, (mNH; + mY,,, + mNH.CO¢, + mNH .COO,,) + (VT + Vt.)-"-'~'~-
+ 2moo ' + 2mHcoo
2 Pco. + PH.¢)
RT
(Al l )
(AI2)
(AI3)
References
[1] A. Stalder, l:)ber die Reduktion yon Alkalicarbcmaten mit Wasserstoft, Dissertation, ETH Ztirich, 1953. [2] H. Wiener, B. Zaidman, Y. Sasson. Int. J. Hydrogen Energy 11(5)(1986) 341-347. [3] H. Wiener, S. Vandel, Y. Sasson, US Pat. 4 792 625 (1988). [4] H. Wiener, B. Zaidman, Y. Sasson, Sol. I-nergy 43(5) (1989) 291 296. [5] H. Wiener. B. Zaidman, Y. Sasson, Int. J. Itydrogen Energy 14(6)(1989) 365-370. [6] Y. Souma, Y.S. Negi, H. Sano, J. lyoda, E. lshii, Osaka Kogyo Gijutsu Shikensho Kiho 39(3) (1988) 147-150. [7] Y. Souma, M. Fujiwara, M. Tanaka, Chem. Express 7(4) (1992) 353-356. [8] O.T. Onsager, PCT-IA WO 88/05422 (1988). [9] D.C. Engel, G.F. Versteeg, W.P.M. ','an Swaaij, EP-A 597 151 (1992).
[10] (i. Scatchard, S.S. Prentiss, J. Am. Chem. Soc. 56 (1934) 807. 81 I. [I I] E.R.B. Smith. R.A. Robinson, Trans. I"araday Soc. 38 (1942) 70-78. [12] S.T. Hart, L.J. Bernardin, Tappi 41(9) (1958) 540-544. [13] K.S. Pfizer, G. Mayorga, J. Phys. Chem. 77(19) (1973) 2300 -2308. [14] C.C. Chen, H.I. Britt. J.F. Boston, I,.B. Evans, AIChl- J. 25(5) (1979) 820-831. [15] C.C. Chert, H.I. Britt, J.F. Boston, L.B. I-vans, AIChE J. 26(5)(1980) 879. [16] K.S. Pitzer. J.C. Peiper, J. Phys. Chem. 84(19) (19:40) 2396- 2398. [17] K.S. Pitzer, J.C. Peiper, J. Chem. Thermodyn. 14 (1982) 613-638. [Ig] M. Sarbar, A.K. Covington, R.L. Nuttall, R.N. Goldberg. J. Chem. Thermodyn. 14 (1982) 967--976. [19] R.N. Roy, J.J. Gibbons, R.W. Williams, l,. Godwin, G. Baker, J.M. Simonson, K.S. Pitzer, J. Chem. Thermodyn. 16
(1984) 303-315. [20] R.N. Roy, J.J. Gibbons. M.D. Wood, R.W. Williams. J.C. Peiper, K.S. Pitzer, J. Chem. Thermodyn. 15 (1983) 37-47. [21] R.N. Roy, K Hufford, P.J. Lord, D.R. Mrad, I,.N. Roy, D.A. Johnson. J. Chem. Thermodyn. 20 (1988) 63-77. [22] R.N. Roy, J.M. Simonson, J.J. Gibbons, J. Chem. ling. Data 32 (19:47)41-45. [23] O.D. Bonner, J. Sohnion Chem. 17(10) (19:48) 999- 1002. [24] A. Apelblat, J. Chem. Therm¢×tyn. 26 (1994) I-3. [251 K.S. Pilzer, in: I.S.E. Cannichael. H.P. Eugster (Eds.). Thermodynamic Modeling of Geological Materials: Minerals,
Fluids and Melts. (1987)97-142. [26] D.D. Woods, Biochem. J. 30 (1936) 515-527. [27] D.D. Wagman, W.H. Evans, V.B. Parker. R.H. Schumm. I. Halow, S.M. Bailey, K.L. Churney, RL. Nuttall, J. Phys.
Chem. Ref. Dala, Suppl. 11(2) (1982). [28] J.H. Weare. in: I.S.E. Carmichael, H.P. Eugster (Eds.). Ttmrmodynamic Modeling of Geological Materials: Minerals,
Fluids and Melts, (1987) 143-176.

D. ('. l-n~el et al. / 1"Tuid Phuse Equilihria 135 f 1997J 109-136 135
[29] A.M. Klibanov, B.N. Albcrti. S.E. Zale. Biotechnol. Bioeng. 24 (1982)25-36. [30] C.J. Slalder, S. Chao. D.P. Summers, M.S. Wrighton, J. Am. Chem. Soc. 105 (1983) 6318-6320. [31] Y. Souma, Y.S. Negi. H. Sano, J. lyoda. E. Ishii, Chem. Express 3(5)(1988) 255--258. [32] W.-M. Wu, R.F. Hickey, M.K. Jain. J.G. Zeikus, Arch. Microbiol. 159 (1993) 57 -65. [33] It. Wiener, J. Blum, H. Feilchenfeld, Y. Sasson, N. Zalmanov, J. Calal. I I0 (1988) 184-190. [34] F.D. Rossini, D.D. Wagner. W.H. Levine, I. Jaffe, National Bureau of Standards Circular 500, Part I. Washington D.C.
(1952). [35] GN. l,ewis, M. Randall. Thermodynamics, 2nd edn. (revised by K.S. Pitzer, L. Brewer). McGraw- Hill, New York,
1961. [36] r.J. Edwards, J. Newman. J.M. Prausnitz, AIChE J. 21(2) (1975) 248-259. [37] K. Kawazuishi, J.M. Prausnitz, Ind. Eng. Chern. Res. 26(7)(1987) 148642-1485. [38] J.L.S. Bell. D.J. Wesolowski. [).A. Palmer, J. Solution Chem. 22(2)(1993) 125-136. [39] F. Chrislensson. H.C.S. Koefocd, A.C. Petersen. K. Rasmussen, Acta Chem. Stand. A32( 1 ) (1978) 15- 17. [40] S.L. Clegg. P. Brimblecombe, J. Phys. Chem. 93 (1989) 7237 7248. [41] S.L. Clegg, P. Brimblecombe, ACS Symp. Ser. 416 (1990) 58-73. [42] E. Wilhehn, R. Baltino. R.J. Wilcock, Chem. Re','. 77(2) (1977) 219-262. [43] T.E. Daubert, R.P. Danner (Eds.), Data Compilation Tables of Properties of Pure Compounds, Design Institute for
Physical Properly Data Publication. AIChE, New York, 1985, p. 1-3. [44] W.F. Linke, A. Seidell. Solubilities-Inorganic and Metal-Organic Compounds I, 11. American Chemical Society,
Washington, DC. Vol. [, 1958: Vol. II, 1965. [45] J. "rimmermans, The Physico-Chemical Constants of P, inary Systems in Concentrated Solutions, Vol. 3, lnterscience
Publishers Inc., New York, 1960. [46] H. Stephen, T. Stephen, Solubilities of Inorganic and Organic Compounds I, Binary Systems. Part I, Pergamon Press,
Oxlk~rd, U.K. 1963. [47] T.P. Whale),, in: A.F. Trotman-Dickenson, R. Nyholm, H.J. Emeh~us, J.C. Bailar, Jr. (Eds.), Comprehensive Inorganic
Chemistry I. ()xford, 1973. p. 453-467.xxx [48] G. Maurer, Fluid Phase Equilib. 13 (1983) 269-296. [49] A.L. Horvath, Handbook of Aqueous Electrolyte Solutions: Physical Properties, Estimation and Correlation Methods,
Ellis Horwood. Chichester, 1985. [5(I] H. Renon. Fluid Phase Equilib. 30 (1986) 181-195. [5 I] J.F. Zemaitis, Jr., D.M. Clark, M. Rafal, N.C. Scrivner. Handbook of Aqueous Electrolyte Thermodynamics. DIPPR
Publication, AIChE, New York, 1986. [52] K.S. Pitzer, J. Phys. Chem. 77(2) (1973) 268-277. [53] K.S. Pitzer. (Ed.), Activity Coefficients in Electrolyte Solutions, CRC Press, Boca Raton, FI,, 1991. [54] H. Renon, H. Planche, W. Fiirst. F.-X. Ball, in: S.A. Newman (Ed.), Chemical Engineering Thermodynamic,;. Ann
Arbor Science, Ann Arbor. Michigan, 1983, p. 379-390. [55] M.S. Ananth, S. Ramachandran, AIChE J. 36(3) (1990) 37(I-386. [56] X. l,u. G. Maurer, AIChE J. 39(9) (1993) 1527-1538. [57] C.E. Harvie, N. Moller, J.H. Weare, Geochim Cosmochim. Acta 48 (1984) 723-751. [58] A. Kumar, V.S. Patwardhan. AIChE J. 38(5)(1992)793-796. [59] D.J. Bradley, K.S. Pitzer. J. Phys. (?hem. 83(12) (1979) 1599-1603. [60] (). Siihnel, P. Novotny. Densities of Aqueous Solutions of Inorganic Substances, Elsevier Science, Amsterdam, 1985. [61] E.M. Pawlikowski, J. Newman, J.M. Prausnitz, Ind. Eng. Chem. Process. Des. Dev. 21(4) (1982) 764-770. [62] T.J. Edwards. G. Maurer, J. Newman, J.M. Prausnitz, AIChE J. 24(6) (1978) 966-976. [63] A. Schumpe, Chem. Eng. Sci. 48(I)(1993) 153-158. [64] C. Monnin. Geochim. Cosmochim. Acta 53(6) (1989) 1177-1188. [65] J.P. Hershey, S. Sotolnngo, F.J. Millero. J. Solution Chem. 12(4)(1983) 233-254. [66] R. 15,ihdemann. Z. Phys. Chem. (Leipzig) B29 (1935) 133-149. [67] E.A. Rashko`,'skaya, E.I. Chernen'kaya. J. Appl. Chem. USSR (Engl. Transl.) 4('X2) (1967) 289-295. [68] G.M. Watsnn, W.A. Felsing, J. Am. Chem. Soc. 63(2)(1941)410-412. [69] S.W. Brelvi. J.P. O'Connell. AIChE J. 18(6) (1972) 1239- 1243.
136 D.(7 l'.'ngel et al. / Fluid Phase l-quilihria 135 f 1997) 109-1.76
[70] K.W. Frese, Jr.. in: B.P. Sullivan, K. Krist. II.E. Guard (Ed~,.), Electrochemical and F, lectrocatalytic Reactions of Carbon Dioxide, Elsevier Science, Amsterdam. 1993, p. 145-216.
[71] P.C. Ford, in: B.P. Sullivan, K. Krist, H.E. Guard (l-ds.), Electrochemical and Electrocatalytic Reactions of Carbon Dioxide, l-lsevier Science. Amsterdam. 1993, p.68 ~,~3.
[72] A. Aguilo, Th. Horlenko. Hydrocarbon Process,. ( I I ) (1980) 120 -- 130. [73] H.C. Oldenhof, Analytical Report No. 43.225, l)ix~i~,ion Salt and Basic Chcmicals, Akzo Hcngclo (O), The Netherlands.
1991.


![Chapter 16: Aqueous ionic equilibriumwebs.anokaramsey.edu/aspaas/1062/notes/ch16blank.pdf · Chapter 16: Aqueous ionic equilibrium ch16blank Page 1 . pH = pKa+ log [base] [acid] This](https://static.fdocuments.in/doc/165x107/5e79dfbe28d72078ac4bffd0/chapter-16-aqueous-ionic-chapter-16-aqueous-ionic-equilibrium-ch16blank-page-1.jpg)