CHEMICAL DEVELOPMENT 8o RDEC-CR- CENTER CLEARING OF ...
44
AD-A21 3 167 CHEMICAL RESEARCH, DEVELOPMENT 8o ENGINEERING RDEC-CR- CENTER CLEARING OF MILITARY SMOKES AND AEROSOLS Greg Hogan GEO-CENTERS, INC. Newton Centre, MA 02159 Glenn 0. Rubel, Ph.D. RESEARCH DIRECTORATE D i L CT, August 1939 OCT u 989 U.S. ARMY ..m. ARMAMENT Ii !---- .--. _'..... I IUNmONS ! A ~i.r+-h, . l ,, -CHEMICAL COMMAND Aberdeen Proving Ground. Maryland 21010-5423 89 10 3 113
Transcript of CHEMICAL DEVELOPMENT 8o RDEC-CR- CENTER CLEARING OF ...
AD-A213 167CHEMICAL
RESEARCH,DEVELOPMENT 8oENGINEERING RDEC-CR-CENTER
CLEARING OF MILITARY SMOKES AND AEROSOLS
Greg Hogan
GEO-CENTERS, INC.Newton Centre, MA 02159
Glenn 0. Rubel, Ph.D.
RESEARCH DIRECTORATE
D i L CT, August 1939
OCT u 989
U.S. ARMY..m. ARMAMENTIi !---- .--._' ..... I IUNmONS
! A ~i.r+-h,. l ,, -CHEMICAL COMMAND
Aberdeen Proving Ground. Maryland 21010-5423
89 10 3 113
Disclaimer
The findings in this report are not to be construed as anofficial Department of the Army position unless so designetedby other authorizing documents.
Distribution Statement
Approved for public release; distribution is unlimited.

UNCLASF!FIEDSECURITY CLASSIFICATION OF THIS PAGE
Form Approved
REPORT DOCUMENTATION PAGE oMB No. 0704-0188
Ia. REPORT SECURITY CLASSIFICATION lb RESTRICTIVE MARKINGS
UNCLASSIFIED2a. SECURITY CLASS!FICATION AUTHORITY 3 DISTRIBUTION/AVAILABILITY OF REPORT
Approved for public release; distribution2b. DECLASSIFICATION/DOWNGRADING SCHEDULE is unl imited.
4. PERFORMING ORGANIZATION REPORT NUMBER(S) S. MONITORING ORGANIZATION REPORT NUMBER(S)
CRDEC-CR-0406a. NAME OF PERFORMING ORGANIZATION 6b. OFFICE SYMBOL 7a. NAME OF MONITORING ORGANIZATION
(If applicable)
6c. ADDRESS (City, State, and ZIP Code) 7b. ADDRESS (City, State, and ZIP Code)
Ba. NAME OF FUNDING/SPONSORING 8b. OFFICE SYMBOL 9. PROCUREMENT INSTRUMENT IDENTIFICATION NUMBERORGANIZATION (if applicable)
CRDEC SMCCR-RSP-B DAAA15-88-C-00508c. ADDRESS (City, State, and ZIP Code) 10. SOURCE OF FUNDING NUMBERS
PROGRAM PROJECT TASK WORK UNITELEMENT NO. NO. NO. ACCESSION NO.
Aberdeen Proving Ground, MD 21010-5423 I
11. TITLE (Include Security Classification)
Clearing of Military Smokes and Aerosols12. PERSONAL AUTHOR(S)
Hogan, Greg (Geo-Ceiters, Inc.), and Rubel, Glenn 0., Ph.D. (CRDEC)13a. TYPE OF REPORT 13b. TIME COVERED 14. DATE OF REPORT (Year, Month, Day) 115. PAGE COUNT
Contractor FROM 88 Aug TO 89 Feb 1989 AugustJ 42
16. SUPPLEMENTARY NOTATION
COR: Dr. G. Rubel, SMCCR-RSP-B, (301) 671-2395
17. COSATI CODES 18. SUBJECT TERMS (Continue on reverse if necessary and identify by block number)
FIELD GROUP SUB-GROUP Smoke scavenging07 04 Particle charge distribution conductors
Triboelectrification (continued on reverse);9. ABSTRACT (Continue on reverse if necessary and identify by block number)
new device has been developed to measure the charge distribution of candidatesmoke scavenger materials that are advertently charged with corona fields and by
triboelectrification. It was shown that particle saturation charge can be achievedwith triboelectrification and that conductors charged more easily than dielectrics.
It is also shown that particle shape has an influence on maximum particle charge.A phase II study is proposed that will attempt to extend the particle chargemeasurements to millimeter-sized scavenger particles.
20. DISTRIBUTION/AVAILABILITY OF ABSTRACT 21. ABSTRACT SECURITY CLASSIFICATION
)UNCLAS1FIED/UNLIMITED 0 SAME AS RPT. 0 OTIC USERS UNCLASSIFIED22a. NAME OF RESPONSIBLE INDIVIDUAL 22b TELEPHONE (Include Area Code) 22c. OFFICE SYMBOL
SANDRA J. JOHNSON (301) 671-2914 SMCCR-SPS-T
DO Form 1473, JUN 86 Previous editions are obsolete. SECURITY CLASSIFICATION OF THIS PAGE
UNCLASSIFIED

UNCLASSIFIED
6. NAME OF PERFORMING ORGANIZATION
Geo-Centers, Inc.7 Wells AvenueNewton Centre, MA 02159
CRDECSMCCR-RSB-BAberdeen Proving Ground, MD 21010-5423
18. SUBJECT TERMS (continued)
DielectricsCorona
2 UNCLASSIFIED

PREFACE
The work described in this report was authorizedunder Contract No. DAAA5-88-C-0050. This work was started inAugust 1988 and completed in February 1989.
The use of trade names or manufacturers' names inthis report does not constitute an official endorsement of anycommercial products. This report may not be cited for purposesof advertisement.
Reproduction of this document in whole or in part isprohibited except with permission of the Commander, U.S. ArmyChemical Research, Development and Engineering Center, ATTN:SMCCR-SPS-T, Aberdeen Proving Ground, Maryland 21010-5423.However, the Defense Technical Information Center and theNational Technical Information Service are authorized toreproduce the document for U.S. Government purposes.
This report has been approved for release to thepublic.
Accesslon Fcr
NTiS
D = t' but Ion,___Avnrlabji1t7 Co13
IAvall i or -
D-1 t
3

Blank
4

CONTENTS
Page
1. INTRODUCTION .................................... 9
2. THEORY OF SCAVENGER CHARGE MEASUREMENT ............ 11
3. THEORY OF SCAVENGER PARTICLE CHARGING ............. 13
4. EXPERIMENTAL METHOD AND RESULTS .................... 18
4.1 Description of the Experimental Setup ...... 184.2 Particle Charge Distribution Experiments ... 194.3 Active Corona Discharge Particle Charqinq .. 354.4 Triboelectric Particle Charging .............. 394.5 Terminal Velocity Experiments ................ 39
5. CONCLUSIONS AND RECOMMENDATIONS .................... 41
REFERENCES ...................................... 42
--- - . m mm nm mmm ia-

LIST OF FIGURES AND TABLE
Figures
1. Schematic of Particle and Forces in ElectrostaticBalance ................. *................ ..... 12
2. Schematic of Phase I Apparatus for Entraining,Changing and Measuring Charge of CdndidateScavenger Particles ............................ 14
3. Distortion of Electric Field Around UnchargedParticle ....................................... 16
4. Distortion of Electric Field Around PartiallyCharged Particle ......................... 16
5. Charge Distribution for Aluminum (particle size22p). The Corona Discharge was Off and theInitial Electrostatic Balance Plate Voltage was25 volts .............................. .... .. 21
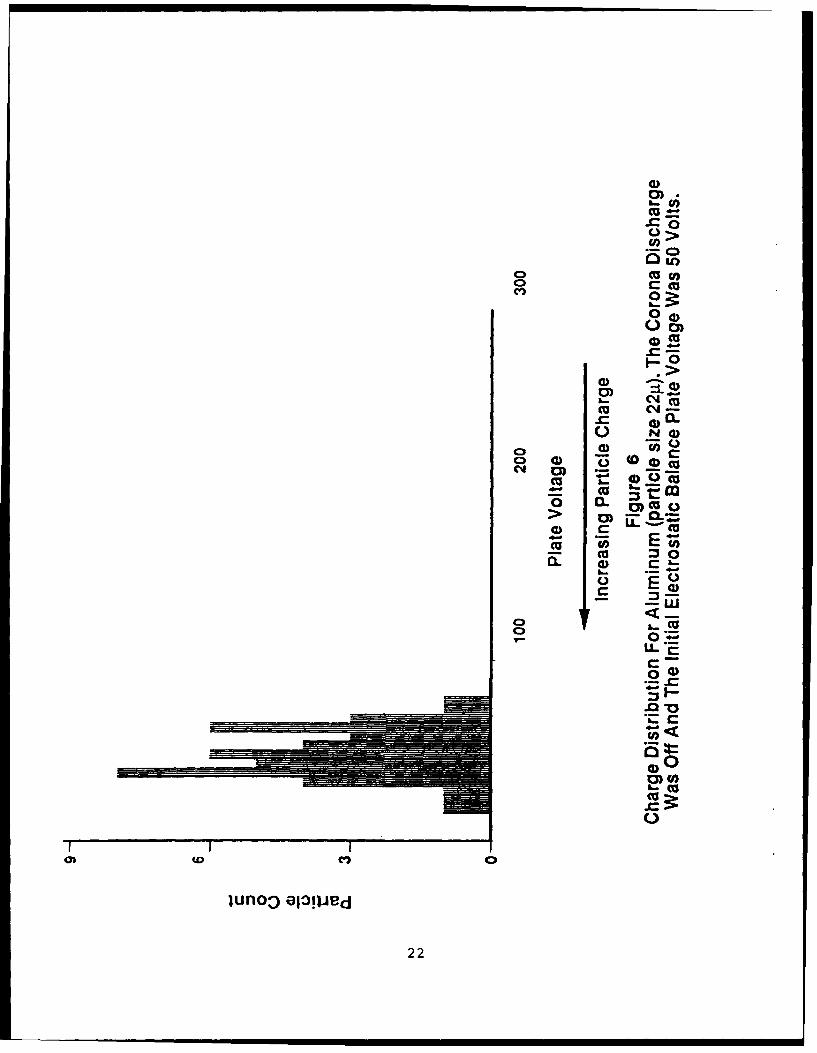
6. Charge Distribution for Aluminum (particle size22u). The Corona Discharge was Off and theInitial Electrostatic Balance Plate Voltage was50 Volts ............................. ......... 22
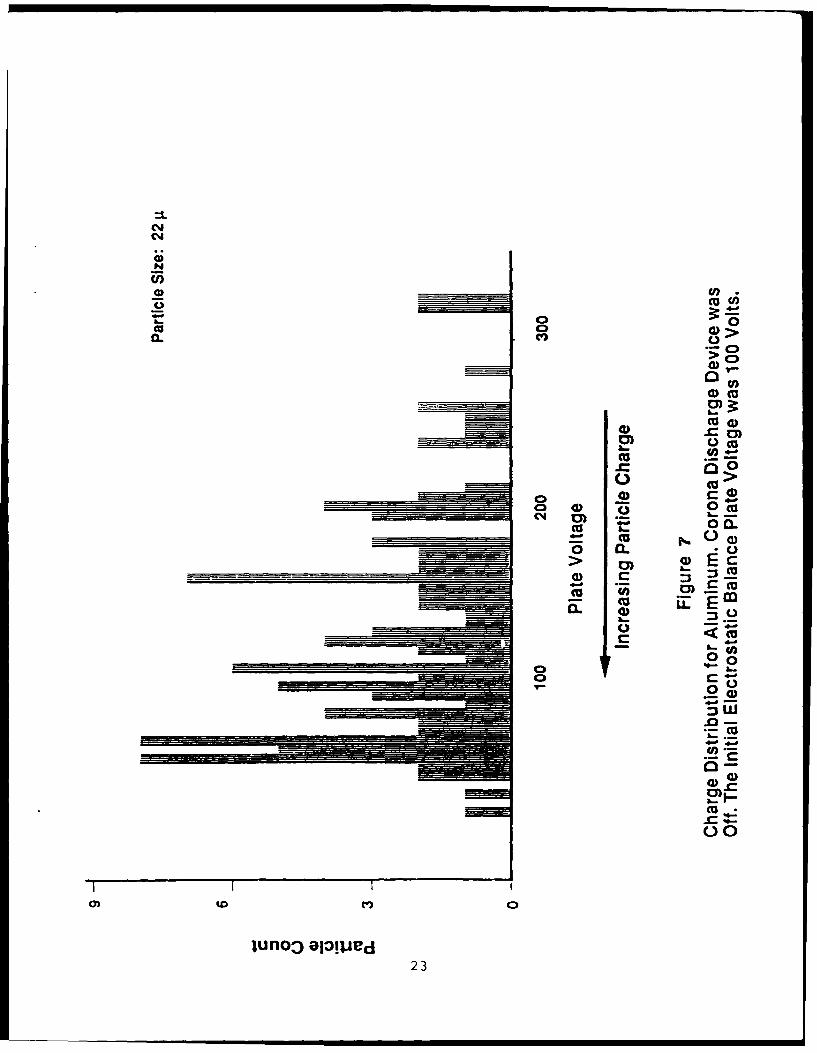
7. Charge Distribution for Aluminum. CoronaDischarge Device was Off. The InitialElectrostatic Balance Plate Voltage was100 Volts .......................... 23
8. Charge Distribution for Aluminum (particle size22p). The Corona Discharge was Off and theInitial Electrostatic Balance Plate Voltage was150 Volts ........ ............................. 24
9. Charge Distribution for Aluminum (particle size22p). The Corona Discharge was Off and theInitial Electostatic Balance Plate Voltage was200 Volts ............... o...................... 25
10. Charge Distribution for Aluminum (particle size22p). The Corona Discharge was Off and theInitial Electrostatic Balance Plate Voltage was400 Volts ...................................... 26
11. Charge Distribution for Aluminum. CoronaDischarge Device was Off. The InitialElectrostatic Balance Plate Voltage was100 Volts ... o ...... .......... ..... 27
6

12. Charge Distribution for Copper. CoronaDischarge Device was Off. The InitialElectrostatic Balance Plate Voltage was100 Volts ...................................... 28
13. Charge Distribution for Iron. CoronaDischarge Device was Off. The InitialElectrostatic Balance Plate Voltage was
100 Volts ...................................... 29
Il. Charge Distribution for Lead. CoronaDischarge Device was Off. The InitialElectrostatic Balance Plate Voltage was100 Volts ...................................... 30
15. Charge Distribution for Magnesium. CoronaDischarge Device was Off. The InitialElectrostatic Balance Plate Voltage was100 Volts ...................................... 31
16. Charge Distribution for Glass Micro-Sphere.Corona Discharge Device was Off. The InitialElectrostatic Balance Plate Voltage was100 Volts ...................................... 32
17. Charge Distribution for Graphite. CoronaDischarge Device was Off. The InitialElectrostatic Balance Plate Voltage was100 Volts ...................................... 33
18. Charge Distribution for Aluminum (particle size22p). The Corona Discharge was Active and theInitial Electrostatic Balance Plate was100 Volts ...................................... 36
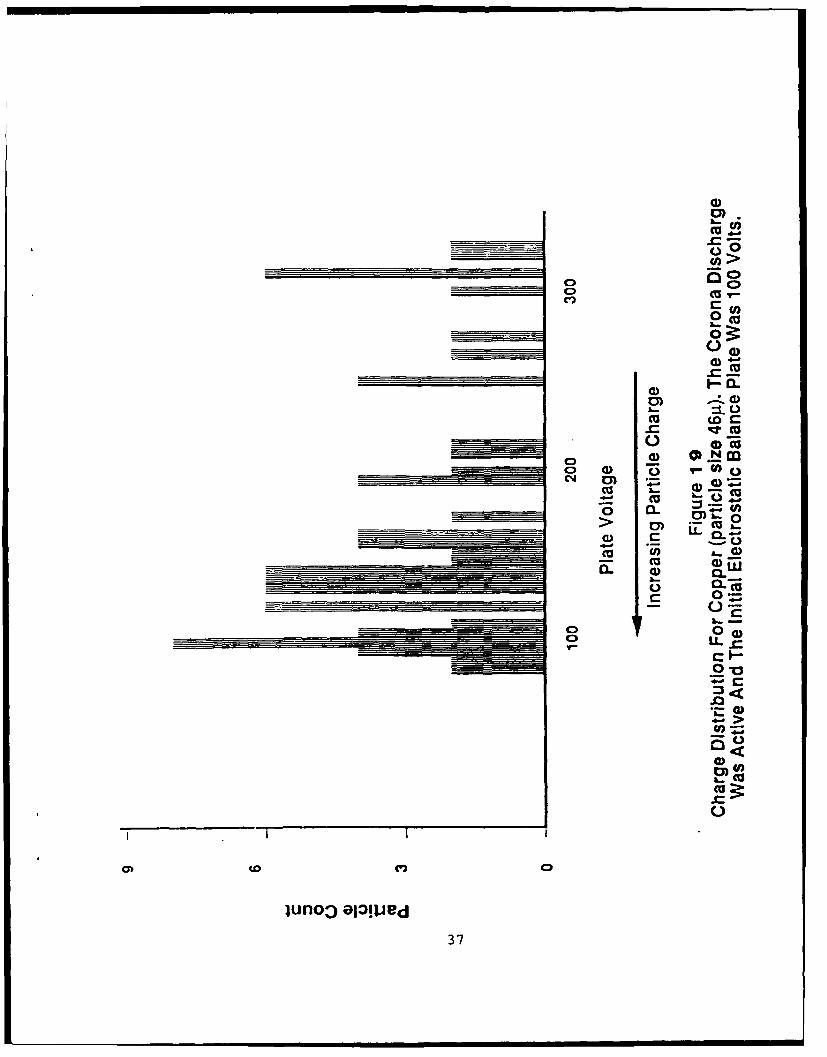
19. Charge Distribution for Copper (particle size46p). The Corona Discharge was Active and theInitial Electrostatic Balance Plate was100 Volts ...................................... 37
20. Charge Distribution for Glass (particle size22y). The Corona Discharge was Active and theInitial Electrostatic Balance Platewas 100 Volts ........................................ 38
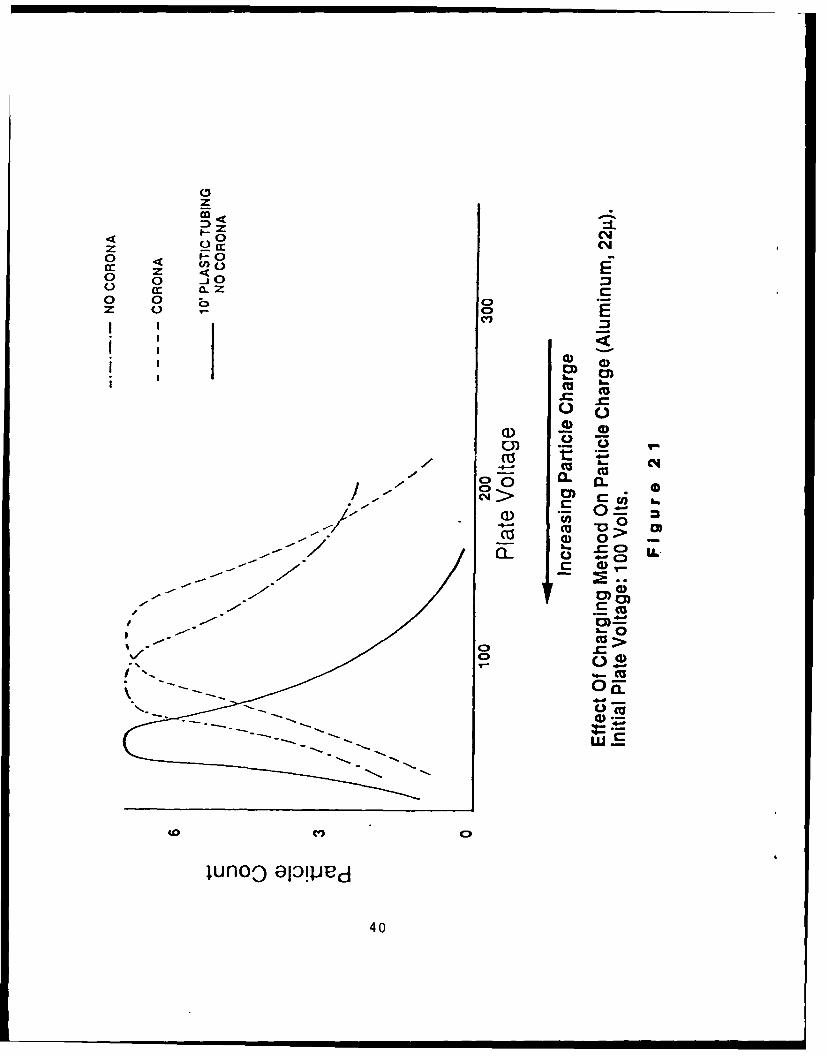
21. Effect of Charging Method on Particle Charye(Aluminum, 22 q). Initial PlateVoltage: 100 Volts ............................ 40
7

TABLE
1. Maximum Observed and Theoretical Particle ChargeFor Al, Cu, Fe, Pb, Mg, Graphite and Glass, asCalculated From Equations I and 7and Figures 11-17 ................................ 34
8
CLEARING OF MILITARY SMOKES AND AEROSOLS
1. INTRODUCTION
The clearing of military smokes and aerosols to improve
vis,' ility in a battlefield situation, whether it be large area
clearing or line of sight, is of great interest and decidedly
important for tactical and reconnaissance purposes. One of the
most effective methods to remove smoke and aerosol particles is a
technique known as Smoke Particle Deposition on Scavengers
(SPADES). SPADES is a technique to remove smoke particles by
employing scavengers which drop through the obscuring cloud and
deposit rapidly to the ground. The primary mechanism for the
removal of particles is by inertial impaction enhanced by
electrostatic attraction.
The removal efficiency of the clearing material can be greatly
enhanced by increasing the charge on the scavenging material. The
development and deployment of a charged scavenger smoke and aerosol
clearing system requires the determination of scavenger total
charge, and an evaluation of its ability to acquire and retain
charge. Under this Phase I SBIR effort, GEO-CENTERS, INC. has
determined the characteristic charge for a number of potential
scavenger materials and has identified a low cost particle charging
method.
The technical objectives as stated in the Phase I proposal
were:
1. Literature Search - A literature search will
be performed to identify additional, feasible
candidate scavengers and identify techniques/
methods for charging particles that are
appropriate for obscuration clearing.
9

2. Experiments - The experimental portion is
subdivided into three sub-tasks:
a. Set-up of the characteristic charge/
terminal velocity experimental apparatus
and calibrate with aluminum scavenging
particles. The aluminum scavengers are
selected as a reference to adjust the
corona discharge parameters (electrode gap
and potential) and electrostatic balance
potentials.
b. Identification of appropriate scavenging
materials and determination of their
charge density.
c. Determination of net charge and terminal
velocity on scavenger materials as a
function of particle size.
In this Phase I program, all of the technical objectives have
been met. GEO-CENTERS, INC. has evaluated characteristic charge
distributions for a number of potential scavenger materials
including conductors (aluminum, copper, lead, iron, graphite) and
a dielectric (glass), and found the conductors of the same size to
have up to 5-10 times higher characteristic particle charge than
the dielectric. In addition, a significant increase in conductor
charging (aluminum) was produced by passing the scavenging material
through a ten foot length of plastic tubing. This triboelectric
charging mechanism represents a potentially simple, rugged, low
cost and low power method for both charging scavenger material and
introducing the material into the environment for smoke and aerosol
clearance.
10

This technical report is divided into four subsections:
Theory of Scavenger Charge Measurement, Theory of Scavenger
Particle Charging, Experimental Method and Results, and Conclusions
and Recommendations.
The first two subsections describe the theoretical basis for
determining the charge resident on observed scavenger particles and
an active, corona discharge method of charging those scavenger
particles. Experimental Method and Results includes a presentation
of the characteristic charge distributions for selected scavenger
materials and a comparison of these values with the theoretical
values. In addition, experimental results for the corona discharge
device are presented for each scavenger particle tested. Finally,
the triboelectric charging and terminal velocity results are
presented and discussed. Conclusions drawn from this research
effort and recommendations for Phase II research and development
are presented in the last section.
2. THEORY OF SCAVENGER CHARGE MEASUREMENT
The theory for determining observed scavenger particle charge
is based on the original apparatus developed by Robert Millikan to
measure charge on oil droplets. In this apparatus, the charged
particle in question is electrostatically balanced between two
conducting plates with an applied potential. When the particle is
suspended between the plates with net zero velocity, the gravita-
tional downward force is balanced by the upward electrostatic force
as shown in Figure 1. The balancing equation is:
Eq = mg
11

qE
mg
Figure 1. Schematic of Particle and Forcesin Electrostatic Balance
12

where E is the electric field between the plates and can be written
as V/h where V is the applied plate voltage and h is the plate
separation. The particle charge is q and m is its mass which is
calculated knowing material density, p, and volume. Assuming that
scavenger particles are approximately spherical, the volume is
simply equal to 4/3 r(d/2) 3 where d is particle diameter. Once a
scavenger particle is balanced with an applied voltage, V, its
charge is :
p • vol • g - hq = (i)
V
3, THEORY OF SCAVENGER PARTICLE CHARGING
Utilization of electrical force is considered the most
feasible mechanism for effective smoke and aerosol removal byIscavengersI . Increasing the charge on the scavenging material
greatly enhances its scavenging efficiency. GEO-CENTERS, INC. has
examined two particle charging methods: an active mechanism,
corona discharge, and a passive mechanism, triboelectric charging.
The corona discharge device and particle entrainment arrange-
ment is depicted in Figure 2. A constant discharge potential is
maintained between the anode needle and the cathode plate. The
scavenger particles ace charged as they pass through the corona
field, Ec.
For a given corona field strength, the saturation charge
represents the maximum charge a particle can attain for that field
strength. Using the derivation of Reist2 , the saturation charge
is determined below.
13

Nitrogen Drying Tube
Nitrogen ParticleEntrainment
Plastic Tubing (3" or 10')
ScavengerMaterial
CoronaDischarge
High iDeviceVoltage
Electrostatic
- - Microscope BalanceI,Light
Source
Figure 2. Schematic of Phase I Apparatus for Entraining,Changing and Measuring Charge of CandidateScavenger Particles
14

The normal component of the electric field, E, at any point
on the surface of a spherical particle placed in an initially
uniform electric field is:
E1 = PEc cosO (2)
where p = 3c/(c+2) and c is the dielectric constant of the sphere.
The value of p will generally be between 1.5 and 2 for dielectric
particles and will be 3 for conducting particles (c = c0). The
initially uniform field near the particle will be distorted as
shown in Figure 3. The corona-generated ions follow the field
lines that intercept the particle surface, thereby charging the
particle. The accumulation of charge on the sphere creates a
secondary electric field which acts to retard the accumulation of
additional charge. The repelling field E2 is derived by Gauss' law
and is given by
- 4qE2 d2 4- - - (3)
The presence of E2 alters the field pattern and consequently
reduces the charging rate. Figure 4 shows the field configuration
when half the saturation charge on the particle is reached. Note
that the electric flux, O(q), defined as E-ds, has changed.J
The total electric flux entering the particle is:Go 4q 2
O(q) = 2 [ (pEc cos -------- ) (---)d sine do (4)Jo d24rco 2
which on integration becomes:
rd2 q 2O(q) = p Ec (I q 2 (5)
4 PEcrcod
15
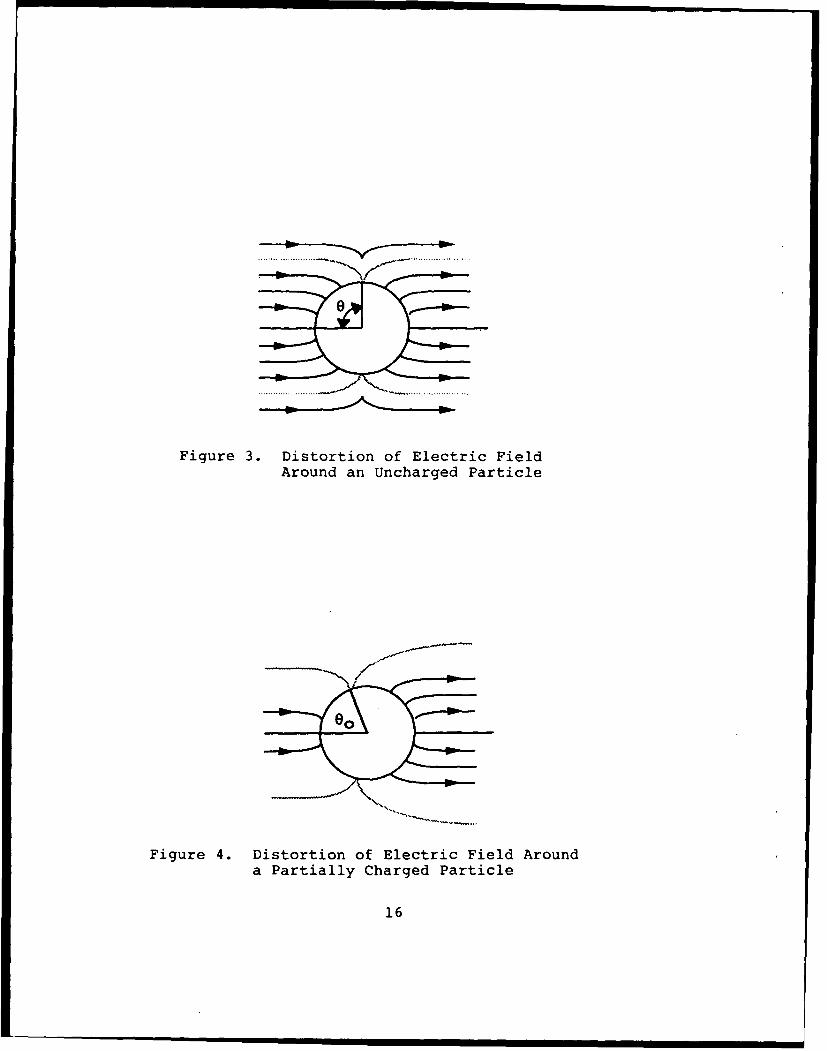
Figure 3. Distortion of Electric FieldAround an Uncharged Particle
Figure 4. Distortion of Electric Field Arounda Partially Charged Particle
16

The limiting or saturation charge (qs) occurs when O(q) = 0.
Replacing q with qs and solving equation 5 for qs gives
qs = pEcd 2rco (6)
The maximum field generated before breakdown of the air by the
corona device is approximately 10 kv/cm which corresponds to a
particle saturation charge of
qs = pd2 (2.8 x 10- 5 ) coulombs (7)
It should be noted that the value of 10 kv/m is the maximum
electric field that can be supported in air by any field generating
method, not just the corona discharge apparatus. Therefore,
equation 7 represents the saturation charge, based on a Gaussian
surface argument, that a particle can attain in air regardless of
the charging mechanism. Particle charge saturation is not an
instantaneous event. It has been shown that the charge, q,
acquired after t seconds is
tq = qs (8)
t+ T
The particle charging time constant, r, is the time required to
reach half the saturation charge. The particle attains 91% of its
limiting or saturation value in lOr seconds.
17

4. EXPERIMENTAL METHOD AND RESULTS
4.1 Description of the Experimental Setup
A schematic of the experimental apparatus for measuring
particle charge is shown in Figure 2. The experiment can be
divided into three separate steps: particle entrainment, particle
charging, and measurement of the particle charge.
The particles are transported through the apparatus by
entrainment in a nitrogen flow. The nitrogen carrier gas is first
passed through a drying tube (Supelco, INC.) and the flow is then
directed into a container which holds the sample particles. The
inflow of the nitrogen provides sufficient agitation to entrain the
particles in the outflow. The entrainment of the particles is
further facilitated by periodic manual agitation of the chamber
containing the particles.
Both active and passive methods are employed to charge the
particles in this experiment. Active charging of the particles
involves the introduction of the particles into a field of free
electrons produced by an active corona inside the discharge device.
The corona is produced by increasing the potential difference
between a point-anode and a grounded plate (held at a fixed
separation of approximately 1cm) until electrical breakdown of the
gas occurs. The breakdown of the gas in this region and the
resulting cascade of electrons to the plate produces a corona,
which is characterized by a blue glow in the gap between the point
and plate. With a gap of approximately 1cm, a corona is achieved
with an applied voltage of approximately 10 kV. Care is taken not
to exceed this voltage which would result in a catastrophic
breakdown of the gas and corresponding spontaneous discharge across
the gap, which would carbonize the plate and interfere with
subsequent corona generation.
18

Passive charging of the particles is accomplished by passing
the entrained particles through 10 feet of plastic tubing with thecorona field off. The actual charging mechanism is believed to betriboelectrification, but this has not been confirmed.
An electrostatic balance (Central Scientific) is used to
measure the charge resident on the particles after either passiveor active charging of the particles. The electrostatic balanceconsists of an insulated chamber with conducting plates on the top
and bottom which are charged with opposite polarity. A microscope
and a high intensity light source are inserted through ports in thewall of the chamber to facilitate observation of the particles.
A potential across the balancing plates is produced by either a
Kepco Power Supply, which is used when large voltages (up to1,000V) are required, or a Leader Power Supply, which is used whenvoltages of less than 100 volts are needed. The voltage across the
plates is monitored by a Fluke digital multimeter. Following the
principles of electrostatic balancing outlined in the TheorySection (2.0), a selected initial voltage is applied across theplates just after a particle enters the balance through a hole inthe top plate. The initial voltage is adjusted until the selected
particle is balanced between the plates. The final voltage across
the plates is recorded as the balancing voltage for the particle.
4.2 Particle Charge Distribution Experiments
Experiments were performed to determine the characteristic
charge of potential scavenger materials. A number of materialswere considered, including conductors (Al, Cu, Fe, Pb, Mg and
graphite), dielectrics (glass, poly-mag 80), and carbon fibers and
chaff (aluminized mylar). All materials were characterized except
19

for the chaff which we were unable to procure in time, and the
poly-mag 80. The poly-mag 80 was supplied as a filter consisting
of stiff fibers several inches in length. Efforts to reduce the
fiber size to 10's of microns for evaluation in our apparatus were
unsuccessfu'
Each material is sieved to produce a discrete range of
particle sizes (20-25 and 45-47 gm) and the characteristic charge
distribution is experimentally determined initially with the corona
device inactive (not passive, 10' tubing experiment). Figures 5-
10 show characteristic charge distributions for aluminum over a
range of initial plate voltages, 25, 50, 100, 150, 200 and 400
volts. This suite of initial voltage settings illustrates the
dependency of the mean charge distribution on the initial setting.
The broad range in particle charge for aluminum is also observed
for the other materials tested. Plate voltage and particle charge
are inversely proportional. Therefore, measurement of the charge
distribution for more highly charged particles is performed with
an initial value of 100 volts. This initial voltage setting is
chosen to ensure the capture of higher momentum particles.
Figures 11-17 show characteristic charge distributions for Al,
Cu, Fe, Pb, Mg, Glass and Graphite. Individual particle electrical
charge can be calculated using Equation 1. The maximum particle
charge and the mean charge of the distributions are listed in Table
I. Also, the theoretical maximum charge for each particle that
could be obtained via a corona device in air is reported. Finally,
the ratio of observed charge to maximum theoretical charge is
calculated.
Text continues on page 35.
20

0
0>5 )
OGt)
00
03) ccJga 0
o 0 10 0Caoo 0
cc cy 0 C12 IL
000).C
0l 0CD U
UL.Co0
owVCA
Cccc0g
ZEE0
cvo 011I~
21
0
')40 03 U)
o C ca0 2
0)0)M
0)0
CN c
C.) c
4d ) ) coca-l b
cc ~ &
0 a. C'-
cc0
-w
C C
V 00a -g
04
tDn CD)
22
U)
0 0
04
U C
C13 a -m 0
0 003
0a04) 0 (a
o 0-
CM0C 0 CL
0 C L
&- Cu.
0. 0
ClC
.2o
Cuno 0111~
23

0-)
CV) 00>
QU)
oocv) 00
-A0 C004.6
4- -
0
E-cou N3-0
oo C)fl
___o 0)01A~
24(f

-0-Ccc
0
oQ0>
, c,
A0 B0)
C.)00)
oto 0 0o
... CM-) 0) C
.._
C14 c cc
0 0*->~C
lunom a-'=l~e25
cc 000
(0C Cc
25

cDc
____ ____ ____ ____ C o
0>
o1 C4 l
0)
co ) 4
0)0)
o 0000
LL
00
oc-C
C- t
junoo a~l.I00
26I

cJ2
Cl 00a c4) 01
gC)T-
a))0cc
00
m 0)_ _ _ _ _ _ _. o>)- ~0
(D 0)0 0o
04 0. C
0 - 0> E4
CCc
.2
.0-
U-0C~a)
00
)uflo3 eailled27

=L
* 0o Cl
0.2>
0,0o
C0 C)c0 ) 0.
C14 Rcu
o c 0 40 -C
4-~C Cu4
0~ C o
Co CUCl 4-
V- ~ 00
C) *
juno3 03.11-.
28-

N
U)
Cc0
00
&-'c 0(
0
0 0i ~ C100)
CU 0)
0 ccN~ 0)
0 O0L-
~~C 0)O
0 C..'
juno3 031.l-029.

C.4
C)3
U)V
0
Cl.)
0B >U
CM CD
______0 CL)-C
01) * 04>
0 a C4U() 0)
C3CC) m
0 U)
* -
L..
a)-
-CUOH
)uflo3 OP!)Jed30

=L
U)
0 cu >
0u)0a--Cua
oc
Cu a
Cu *o
0)0
juo 0)00)Jc31u E~

:1LC%4C14
04
00
00.
L-40
Q ~Cca) QLO.
Cu O_D__) C.) 0.)
00
o o E uOLu
0) 0Cu
a- C
owaC:
32o

=L
ClD
0)0
C~Cl
b- 0 c~4)00
aa)0) Cc3O
o tm d) ccu
C~J 00Cu t
CCco 0--
C) 00
C)no al3. ])cd
33.K2

LO Qn oD C%40D 0
CIODC) LL
a a)
Om iO
Um ~~L CV) L ~ Cfc
Ui
Cl4 )
ILO 00) L)LLO co
00 c' _Dd
Xcc
(Ucu~C E aa)L
t, vm ( D.0
CL Xc 0 , "m 0uE o mr o ~ 0
M- I- ( 00)0 x0 LLL L) ) 00 E iv a &-
> L.. V34

From Table 1 it is evident that the conductors and the
graphite have higher characteristic charge and higher observed-to-
theoretical ratios than does the glass dielectric, suggesting
dielectrics may not be as good scavengers as non-dielectrics. A
possible explanation may be shape effects. The dielectric glass
particles were truly spherical whereas all the conductors were
ellipsoidal with a wide range of aspect ratios.
4.3 Active Corona Discharge Particle Charging
Charge distributions have been measured for three materials:
Al, Cu, and glass, after they pass through the corona discharge
device. The distributions are shown in Figures 18-20. There is
essentially no statistical difference between the active and
passive (10 feet plastic tubing) particle charge distributions.
There are two possible explanations for these results.
First, the amount of charge on the particles may be close to
saturation. Using Equation 7, the maximum particle charge that can
be attained theoretically in air (i.e., electric field of IX10 4
volt/cm) was calculated and is shown in Table 1. The ratio of
observed charge to theoretical charge is also shown. For the
conductors, this ratio is very close to unity and in the case of
copper, greater than 1, which implies that little additional charge
could be imparted by the corona field.
A second possible reason for the absence of charging in the
corona field is the short resident time in the corona. Equation
8 relates particle charge to resident time in the corona field.
For the particle to attain a saturation change, the residence time
in the corona must be much greater than the particle charging time
35

Co
U-'53>
CV)l
Cl) o1- CIOL
4 Cc
42 Co
ClU
a, W_ _ _ _ _ _ _ _ _ _ m
> 0
______ ____E La
0 2~40
____(A 0
cuC
31co
CO) 0
juno3D 01pi1Je~36
04Cl) cU
00a
0
0) 4
oc
0 0 0 )OCU 0 CU
co
I.-
I- LL
.0-
4->
C30
37

U)
oX 0
c~cc
o Co
0) -0
C:3 4-
co __o 0) CU
____ 0
Co
V)
C400
Co 0
)UflO3epZ;,o38C
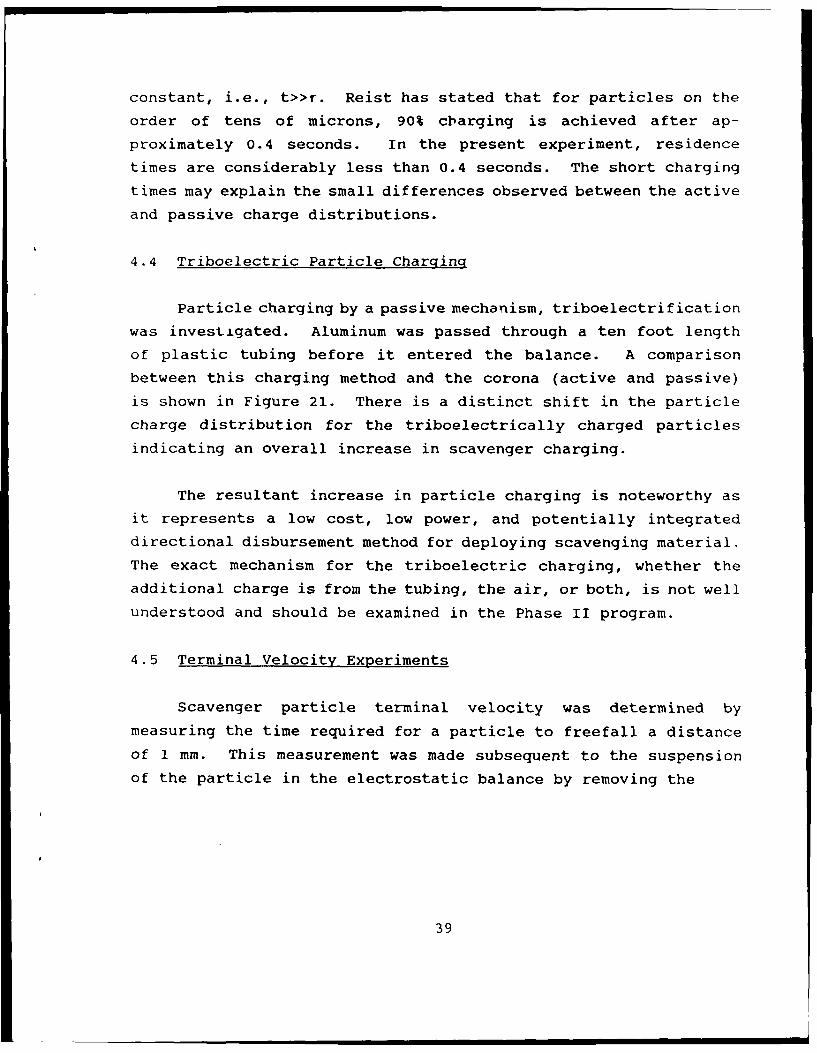
constant, i.e., t>>r. Reist has stated that for particles on the
order of tens of microns, 90% charging is achieved after ap-
proximately 0.4 seconds. In the present experiment, residence
times are considerably less than 0.4 seconds. The short charging
times may explain the small differences observed between the active
and passive charge distributions.
4.4 Triboelectric Particle Charging
Particle charging by a passive mechanism, triboelectrification
was investigated. Aluminum was passed through a ten foot length
of plastic tubing before it entered the balance. A comparison
between this charging method and the corona (active and passive)
is shown in Figure 21. There is a distinct shift in the particle
charge distribution for the triboelectrically charged particles
indicating an overall increase in scavenger charging.
The resultant increase in particle charging is noteworthy as
it represents a low cost, low power, and potentially integrated
directional disbursement method for deploying scavenging material.
The exact mechanism for the triboelectric charging, whether the
additional charge is from the tubing, the air, or both, is not well
understood and should be examined in the Phase II program.
4.5 Terminal Velocity Experiments
Scavenger particle terminal velocity was determined by
measuring the time required for a particle to freefall a distance
of 1 mm. This measurement was made subsequent to the suspension
of the particle in the electrostatic balance by removing the
39
0 ,*
oz C
o 0 0
z C.) E
cva
0U)
Cj
-cs>C)
0)0
Co C
0uo 0.11~
40

voltage across the plates and measuring the time required for the
particle to traverse a distance of 1 mm across a grid in the
microscope field of view.
Terminal velocity measurements were performed using aluminum
particles (20 microns in diameter) and glass microspheres (45
microns in diameter). It was observed that under our experimental
conditions, and with such small particles, there wa. turbulene in
the flow stream making our data inconclusive. In a future chamber
design, horizontal electrostatic confinement may solve this
problem.
5. CONCLUSIONS AND RECOMMENDATIONS
In the Phase I program "Clearing of Military Smokes and
Aerosols", GEO-CENTERS, INC. has designed, fabricated, and employed
an apparatus to evaluate characteristic particle charge distribu-
tions for candidate scavenger materials. Particle characteristic
charge distributions were measured and charging mechanisms were
evaluated. It was demonstrated that, (1) the particle saturation
charge can be achieved with a rather simple transport system
consisting of tygon tubing; and, (2) conductors attained charge
more easily than dielectrics. Although no quantitative relation-
ship between particle surface shape (assuming similar surface
areas), and maximum particle charging was demonstrated, these
results suggest that this is an important effect.
Charge distribution results indicate that several of the
materials investigated may be suitable scavengers. A passive
particle charging mechanism has been identified that promises to
be low cost, low power, rugged, and can be integrated to act as a
41
directional deployment method. Having successfully demonstrated
the feasibility of charging particles to maximum extent using a
rather low power, low cost and rugged system, the following
recommendations are offered.
1. Extend the charge measurements to largescavenger particles (1mm) concentrating onoptimum materials identified in Phase I.
2. Evaluate efficiency of triboelectric chargingmethod for large scavenger particles.
3. Design and construct prototype particlecharging and dissemination system capable ofoperating with the materials identified in task1.
4. Evaluate efficiency of the prototype chargedscavenger system for the clearing of MilitarySmokes and Aerosols under the environmentalconditions and operational constraints of anoutdoor test site.
REFERENCES
1. Podzimek, Josef, "Investigation of a Complex Technique ofSmoke Particle Deposition on Scavengers", (CRDEC-CR-87057,1987), p.7 .
2. Reist, Parker C., Introduction to Aerosol Science, MacMillanPublishing Company, New York, pp. 148-150.
42