Chemical Composition of PM and PM and Associated ...
12
ABSTRACT The chemical compositions of PM 2.5 and PM 10 and associated high-molecular-weight polycyclic aromatic hydrocarbons (PAHs) were investigated during win- ter and summer at a roadside and an urban back- ground site in Saitama, Japan. The average concen- trations of PM 2.5 exceeded the United States Envi- ronmental Protection Agency standards during both periods. Carbonaceous components were abundant in both the observed and calculated (by means of a mass closure model) chemical composition of PM 2.5 . Traffic-related pollutants (elemental carbon and high- molecular-weight PAHs) were strongly associated with PM 2.5 rather than with larger particles. The mass concentrations of PM 2.5 , as well as those of EC and PAHs associated with the particles, at the two sites were strongly correlated. Comparison of our data with source profile ratios indicates that diesel-pow- ered vehicles were probably the main source of the measured PAHs. The PAHs concentrations were af- fected by meteorological conditions during our study. Our results highlight the need for the establishment of standards for PM 2.5 in Japan. Key words: Diesel exhaust particles, PAHs, Traffic- related pollutants, Source profile ratio, PM 2.5 1. INTRODUCTION During the last decade, increasing attention has been paid to fine particles in the urban atmosphere, owing to the various harmful effects these particles have on human health. Many studies reported that PM 2.5 (particles with a 50% cut-off aerodynamic diam- eter ⁄2.5 μm) is more strongly related to daily mortal- ity than are coarse particles (Schwartz et al., 2002; Schwartz et al., 1996; Dockery et al., 1993). PM 2.5 can penetrate more deeply into the lungs and may reach the alveoli, causing serious respiratory diseases (WHO, 2003). Motor vehicles exhaust is the main source of PM 2.5 in the urban environment (Harrison et al., 1999; Schauer et al., 1996). Diesel exhaust con- tains substantially more particulate matter than gaso- line-fueled vehicle exhaust, and the use of diesel- powered vehicles is leading to the deterioration of air quality in urban areas. The mass-weighted size distri- bution of diesel exhaust particles (DEPs) is mainly distributed between fine (PM 2.5 ) and ultrafine (~ 0.1 μm) particles (Kittelson et al., 1988). These particles have the following characteristics: a) Large surface area, which makes them excellent carriers for adsorbed organic and inorganic compounds. b) High proportion (50-75%) of elemental carbon (EC, which is commonly used as a tracer for the ex- haust of diesel-powered vehicles, and recently found to alter pulmonary endothelial function, which is an important factor in the development of hypertension and heart failure, Shah et al., 2008; Fujita et al., 1998). c) High levels of certain polycyclic aromatic hydro- carbons (PAHs) (Zielinska, 2005; USEPA, 2002). Because of these unique characteristics, more atten- tion should be paid to the contribution of DEPs to par- ticulate matter in urban environments. Adsorbed PAHs play an important role in the carci- nogenicity of DEPs, especially at low exposure levels. In the atmosphere, PAHs are present in both the gase- ous phase and the particulate phase (Ligocki and Pan- kow, 1989). PAHs with 2 rings are found in the gase- ous phase, those with 3 or 4 rings can be found in both phases, and PAHs with 5 or more rings tend to exist as solids adsorbed on fine particulate matter (Baek et al., 1991; Yang et al., 1991). Most high-molecular- weight PAHs are classified as possibly carcinogenic to humans by the International Agency for Research on Cancer (IARC, 2003). Benzo[a]pyrene (BaP) is classified as a highly carcinogenic compound. Inves- Asian Journal of Atmospheric Environment Vol. 2-2, pp.90-101, December 2008 Chemical Composition of PM 2.5 and PM 10 and Associated Polycyclic Aromatic Hydrocarbons at a Roadside and an Urban Background Area in Saitama, Japan Tarek Mohamed Naser, Yuji Yoshimura 1) , Kazuhiko Sekiguchi, Qingyue Wang and Kazuhiko Sakamoto* Department of Environmental Science and Technology, Graduate School of Science and Engineering, Saitama University, 255 Shimo-okubo, Sakura-ku, Saitama City, Saitama 338-8570, Japan 1) Japan Environmental Sanitation Center, 10-6 Yotsuyakamicho, Kawasaki-ku, Kawasaki-shi, Kanagawa 210-0828, Japan *Corresponding author. Tel: +81-48-858-3519, E-mail: [email protected]
Transcript of Chemical Composition of PM and PM and Associated ...

ABSTRACT
The chemical compositions of PM2.5 and PM10 andassociated high-molecular-weight polycyclic aromatichydrocarbons (PAHs) were investigated during win-ter and summer at a roadside and an urban back-ground site in Saitama, Japan. The average concen-trations of PM2.5 exceeded the United States Envi-ronmental Protection Agency standards during bothperiods. Carbonaceous components were abundantin both the observed and calculated (by means of amass closure model) chemical composition of PM2.5.Traffic-related pollutants (elemental carbon and high-molecular-weight PAHs) were strongly associatedwith PM2.5 rather than with larger particles. The massconcentrations of PM2.5, as well as those of EC andPAHs associated with the particles, at the two siteswere strongly correlated. Comparison of our datawith source profile ratios indicates that diesel-pow-ered vehicles were probably the main source of themeasured PAHs. The PAHs concentrations were af-fected by meteorological conditions during our study.Our results highlight the need for the establishmentof standards for PM2.5 in Japan.
Key words: Diesel exhaust particles, PAHs, Traffic-related pollutants, Source profile ratio, PM2.5
1. INTRODUCTION
During the last decade, increasing attention hasbeen paid to fine particles in the urban atmosphere,owing to the various harmful effects these particleshave on human health. Many studies reported thatPM2.5 (particles with a 50% cut-off aerodynamic diam-eter ⁄2.5 μm) is more strongly related to daily mortal-ity than are coarse particles (Schwartz et al., 2002;Schwartz et al., 1996; Dockery et al., 1993). PM2.5
can penetrate more deeply into the lungs and mayreach the alveoli, causing serious respiratory diseases(WHO, 2003). Motor vehicles exhaust is the mainsource of PM2.5 in the urban environment (Harrison etal., 1999; Schauer et al., 1996). Diesel exhaust con-tains substantially more particulate matter than gaso-line-fueled vehicle exhaust, and the use of diesel-powered vehicles is leading to the deterioration of airquality in urban areas. The mass-weighted size distri-bution of diesel exhaust particles (DEPs) is mainlydistributed between fine (PM2.5) and ultrafine (~0.1μm) particles (Kittelson et al., 1988). These particleshave the following characteristics:
a) Large surface area, which makes them excellentcarriers for adsorbed organic and inorganic compounds.
b) High proportion (50-75%) of elemental carbon(EC, which is commonly used as a tracer for the ex-haust of diesel-powered vehicles, and recently foundto alter pulmonary endothelial function, which is animportant factor in the development of hypertensionand heart failure, Shah et al., 2008; Fujita et al., 1998).
c) High levels of certain polycyclic aromatic hydro-carbons (PAHs) (Zielinska, 2005; USEPA, 2002).
Because of these unique characteristics, more atten-tion should be paid to the contribution of DEPs to par-ticulate matter in urban environments.
Adsorbed PAHs play an important role in the carci-nogenicity of DEPs, especially at low exposure levels.In the atmosphere, PAHs are present in both the gase-ous phase and the particulate phase (Ligocki and Pan-kow, 1989). PAHs with 2 rings are found in the gase-ous phase, those with 3 or 4 rings can be found in bothphases, and PAHs with 5 or more rings tend to existas solids adsorbed on fine particulate matter (Baek etal., 1991; Yang et al., 1991). Most high-molecular-weight PAHs are classified as possibly carcinogenicto humans by the International Agency for Researchon Cancer (IARC, 2003). Benzo[a]pyrene (BaP) isclassified as a highly carcinogenic compound. Inves-
Asian Journal of Atmospheric Environment
Vol. 2-2, pp.90-101, December 2008
Chemical Composition of PM2.5 and PM10 and AssociatedPolycyclic Aromatic Hydrocarbons at a Roadside and an Urban Background Area in Saitama, Japan
Tarek Mohamed Naser, Yuji Yoshimura1), Kazuhiko Sekiguchi, Qingyue Wang and Kazuhiko Sakamoto*
Department of Environmental Science and Technology, Graduate School of Science and Engineering, Saitama University, 255 Shimo-okubo, Sakura-ku, Saitama City, Saitama 338-8570, Japan1)Japan Environmental Sanitation Center, 10-6 Yotsuyakamicho, Kawasaki-ku, Kawasaki-shi, Kanagawa 210-0828, Japan
*Corresponding author. Tel: +81-48-858-3519, E-mail: [email protected]
tigation of the levels and behaviors of high-molecular-weight PAHs is urgently needed for assessment of therisk associated with these compounds. In Japan, manyresearchers have investigated PAHs in the urban envi-ronment (Hagino et al., 2007; Kawanaka et al., 2004;Ohura et al., 2004; Hayakawa et al., 2002; Koyano etal., 2002). However, there have been few studies thathave investigated both the levels of particulate PAHsand the chemical composition of the particulate mat-ter on which they are adsorbed, particularly near majorroads and highways, where potential risk of humanexposure is strongly suspected to be high.
In this study, we investigated the chemical compo-sition of PM2.5 and PM10 (particles with a 50% cut-offaerodynamic diameter ⁄10 μm) and their associatedhigh-molecular-weight PAHs at a roadside and anurban background site in Saitama, Japan. The contri-bution of the chemical components of the DEPs, andtheir associated toxic agents, to airborne particulatematter is discussed in this paper. We focused on ECand PAHs because they are typical constituents ofDEPs.
2. MATERIALS AND METHODS
2. 1 Sampling Sites Our study was conducted at two sites in the city of
Saitama, which is located in the central Kanto regionof Japan (Fig. 1); the city is the seat of Saitama Prefec-ture and has a population of more than 1 million. The
two sites were chosen to represent a roadside and anurban background area. Route 57 (a main prefecturalroad with high traffic volumes of both diesel- andgasoline-powered vehicles, around 21,000 vehiclesper weekday) was chosen as the roadside site. Sam-ples were collected at curbside on a street corner nearSaitama University at a height of 1.5 m above theground. The urban background site was on the cam-pus of Saitama University, about 250 m northeast ofthe roadside site. At this site, samples were collectedat about 15 m above the ground, on the roof of a four-story building (Department of Applied Chemistry, Sai-tama University).
2. 2 Sampling ProtocolsAirborne particulate matter was sampled during two
periods at each site: winter (December 16-28, 2004)and summer (July 20-August 2, 2005). During theseperiods, samples of PM10 and PM2.5 were collectedusing a pair of Federal Reference Method (FRM, Par-tisol sequential air sampler model 2025, Rupprecht &Patashnick Co., Inc., East Greenbush, NY, USA) airsamplers and cyclone separators; the flow rate wasmaintained at 16.7 L/min for 12 h. Quartz fiber filters(47 mm diameter, Pallflex, 2500 QAST; Shibata Sci-entific Technology) were used as collecting media.Prior to sampling, the filters were heated at 800�C for2 h to eliminate organic species, kept at 20�C and 50%relative humidity for 48 h, and then weighed. The fil-ters were shielded from direct sunlight and rain. Back-ground contamination was measured using operational
Chemical Composition of PM2.5 and Their Associated PAHs 91
Fig. 1. Locations of sampling sites: roadside (dashed arrow) and urban background site (dotted arrow).
Tochigi
Ibaraki
Saitama
Tokyo
Kanagawa Chiba
Gunma
N
200 km
50 km
100 m
Kanto region
blanks (unexposed filters), which were processedsimultaneously with the field samples. In the labora-tory, all filters were kept at 20�C and 50% relativehumidity for 48 h, reweighed, and then stored in therefrigerator (-40±5�C) until they were chemicallyanalyzed.
At the roadside, traffic volume was recorded onvideotape for later manual counting of the numbersof diesel- and gasoline-powered vehicles. Vehicleswere counted for 10 min at each hour, and the totalvolumes of vehicles in both directions were counted.During the sampling period, meteorological parame-ters (ambient temperature, relative humidity, windspeed, and wind direction) were monitored at the road-side with an EDO MET-9800 system (Shibata Scien-tific Technology).
During the winter, the data for nitrogen oxides (NOx)and ozone (O3) were obtained with an ambient air-quality monitoring station at a height of about 20 mabove the ground, on the roof of the Saitama Instituteof Public Health, which is 450 m away from SaitamaUniversity on northeast direction. In the summer, NOx
and O3 were monitored at the roadside using a nitro-gen oxides analyzer (DKK Corporation, Tokyo, Japan)and a UVAD-1000 O3 analyzer (Shimadzu Corpora-tion, Kyoto, Japan), respectively. Prior to monitoring,both analyzers were multipoint calibrated with a NOgas cylinder (Japan Fine Products Corporation, Kana-gawa, Japan). The obtained calibration curves repre-sent the best fits for all the data points (R2==1.00 andR2==0.998 for NO, and O3 respectively).
2. 3 Chemical AnalysisAll samples were analyzed for EC and organic car-
bon (OC) using a thermal optical carbon analyzer (DRImodel 2001, Sibata Scientific Technology) with theIMPROVE thermal/optical reflectance protocol re-ported by Chow et al. (1993). Briefly, a 0.503 cm2 (8mm diameter) punch aliquot of a sample quartz filterwas heated at 120 (OC1), 250 (OC2), 450 (OC3), and550 (OC4)�C in a helium atmosphere, and at 550(EC1), 700 (EC2), and 800 (EC3)�C in an oxidizingatmosphere of 2% oxygen and 98% helium. The analy-sis was repeated three times for each sample for betteraccuracy. For analysis of ions, an area of 1.90 cm2 ali-quot of each filter was extracted with 0.3 M NaHCO3
and deionized water during the analysis of anions(NO3
-, SO42-, and Cl-) and cations (K++, Na++, NH4
++,and Ca2++), respectively. All extracts were analyzedusing an ion chromatograph (Dionex-100 IC) equip-ped with an electric conductivity detector. Mixed stan-dards of five concentrations within the ranges of 0.1-2.5 ppm (w/v) for anions and 0.05-0.8 ppm (w/v) forcations were used to draw standard calibration curves.
The residual filter area remaining after the analysisof carbonaceous components and ions was used forextraction of PAHs. The residual area was cut intosmall pieces, which were ultrasonically extracted twicewith 3.0 mL of acetonitrile (HPLC grade, Wako PureChemical Industries, Japan) for 1 h. The combinedextracts were centrifuged at 2,500 rpm for 10 min andthen filtered through a 0.2-μm syringe filter. The vol-ume of the filtrate was reduced to 0.5 mL using a gen-tle stream of nitrogen gas (N2), and the residue wastransferred to 1-mL vials and analyzed by high-perfor-mance liquid chromatography (Shimadzu LC-10Avpseries, Shimadzu Corporation, Kyoto, Japan). Table 1summarizes the chromatographic conditions usedduring the analysis. The chromatographic peaks ofthe samples were identified by comparison of theirretention times to those of standards. Selected PAHswere quantified by comparison of the measured peakareas with those of standards of known concentration.The quantified compounds were pyrene (PYR), benzo[a]anthracene (BaA), benzo[a]pyrene (BaP), benzo[b]fluoranthene (BbF), benzo[k]fluoranthene (BkF),indeno[1,2,3-cd]pyrene (IndP), and benzo[ghi]perylene(BghiP). PAH concentrations are reportedly lowerduring summer than during winter (Hayakawa et al.,2002; Smith and Harrison, 1996). For that reason andbecause of the time required for extraction and analy-sis, only samples collected during winter were analyz-ed for selected PAHs as described above. Finally,WRPLOT View software (Lakes Environmental Soft-ware Inc., Ontario, Canada) was used for drawing therose diagrams of wind direction.
3. RESULTS AND DISCUSSION
3. 1 Contribution of PM2.5 to PM10
During all the sampling periods, the mass concentra-tions of PM10 were below the air quality standards forsuspended particulate matter in Japan (SPM, whichcorresponds to PM7, 100 μg/m3) and in the UnitedStates (PM10, 150 μg/m3 daily average). In contrast, theaverage concentrations of PM2.5 exceeded the United
92 Asian Journal of Atmospheric Environment, Vol. 2(2), 90-101, 2008
Table 1. Conditions for HPLC analysis of PAHs.
Column Wakosil-PAHs, 4.6*250 mm(Wako Pure Chemical Industries)
Column temperature 40�CEluent CH3CN : H2O (DIa) 85 : 15Detector Fluorescence detectorFlow rate 1 mL/min.Retention time 0-20 min.Injection volume 20 μLaDeionized water

Chemical Composition of PM2.5 and Their Associated PAHs 93
Table 2. Average mass concentrations (arithmetic mean±SD) of PM2.5, PM10 and carbonaceous components, as well as EC/TC,and PM2.5/PM10 ratios and correlations between sites.
Roadside (μg/m3) Urban background (μg/m3)
PM2.5 PM10 PM2.5 PM10
Winter Summer Winter Summer Winter Summer Winter Summer
Mass 31±7 34±6 37±9 43±6 23±7 27±5 28±8 33±5EC 5.3±3.2 6.5±2.4 6.4±4.1 7.1±2.4 2.9±2.0 3.3±0.9 3.0±2.3 3.8±0.9OC 9.5±4.9 9.9±1.8 11.0±6.3 11.4±2.1 7.0±3.3 8.5±1.9 7.3±3.8 9.3±1.7TC 14.8±7.8 16.4±3.9 17.4±9.9 18.5±3.9 10.0±5.4 11.8±2.7 11.3±6.2 13.1±2.4EC/TC 0.35±0.1 0.40±0.1 0.36±0.1 0.39±0.1 0.29±0.1 0.28±0.0 0.26±0.1 0.29±0.0
PM2.5/PM10
Winter Summer Winter Summer
0.83±0.0 0.74±0.1 0.81±0.0 0.64±0.1
Pearson correlation coefficients (r) between both sitesa
PM2.5 PM10
Winter Summer Winter Summer
Mass 0.94 0.94 0.90 0.86EC 0.93 0.84 0.83 0.55OC 0.88 0.87 0.87 0.70TC 0.93 0.83 0.87 0.66ap⁄0.01, n==24 for winter, and p⁄0.01, n==22 for summer
Fig. 2. Temporal variationof PM2.5 and PM10 mass con-centrations during winter andsummer at the roadside andthe urban background site.
100
80
60
40
20
0
100
80
60
40
20
0
Date
(a) Roadside
(b) Urban background
Winter
Winter
Summer
Summer
PM2.5
PM10
PM2.5
PM10
Mas
s co
ncen
trat
ion
(μg/
m3 )
Mas
s co
ncen
trat
ion
(μg/
m3 )
12/16
/04
12/17
/04
12/18
/04
12/19
/04
12/20
/04
12/22
/04
12/23
/04
12/24
/04
12/25
/04
12/26
/04
12/27
/04
12/28
/04
07/20
/06
07/21
/06
07/22
/06
07/23
/06
07/24
/06
07/25
/06
07/28
/06
07/29
/06
07/30
/06
08/01
/06
08/02
/06
States Environmental Protection Agency (USEPA)standard for PM2.5 (15 μg/m3, annual average, Table2). Moreover, the USEPA daily average standard forPM2.5 (35 μg/m3) was exceeded at both sites on a fewdays (25% and 18% of PM2.5 data during winter andsummer, respectively). The concentrations of PM2.5
and PM10 showed identical temporal variations (Fig.2) and were strongly correlated (Pearson correlationcoefficients: r==0.98 and 0.94 at the roadside and r==0.98 and 0.93 at the urban background site during thewinter and summer periods, respectively). The aver-age values of the PM2.5/PM10 ratio during winter were0.83 and 0.81, whereas the values were 0.74 and 0.64during summer at the roadside and the urban back-ground site respectively. These values agree with thosereported by Sasaki and Sakamoto (2006) for PM2.5/PM10 at Saitama sampling sites. These results indicatethat PM2.5 makes up the largest fraction of PM10 atvarious places in Saitama.
Many other urban areas in Japan are affected byhigh concentrations of PM2.5. Saitoh et al. (2002) re-ported an average concentration of 27.9 μg/m3 forPM2.5 measurements carried out from December 26,1998, to January 9, 1999, at Shinjuku, Tokyo; andPM2.5 was the major contributing fraction of PM10.Ma et al. (2004) reported three high-concentrationepisodes for PM2.5 (¤65 μg/m3) in the Kansai area.
3. 2 Carbonaceous ComponentsTable 2 lists average mass concentrations of EC,
OC, and total carbon (TC) observed during winter andsummer. As expected, the concentrations of carbona-
ceous components were higher at the roadside than atthe urban background site during each sampling peri-od. However, the concentrations at the two sites werestrongly correlated, especially for the PM2.5 fraction(see Table 2).
The EC/TC ratios for PM2.5 and PM10 were verysimilar during the two study periods at both the road-side and the urban background. This observation seemsto indicate that EC was associated with PM2.5 ratherthan with larger particles. To confirm that this was thecase, we investigated the correlation between the massof particulate matters (PM2.5 & PM10) and the ECconcentrations in both fractions. At both sites, PM2.5
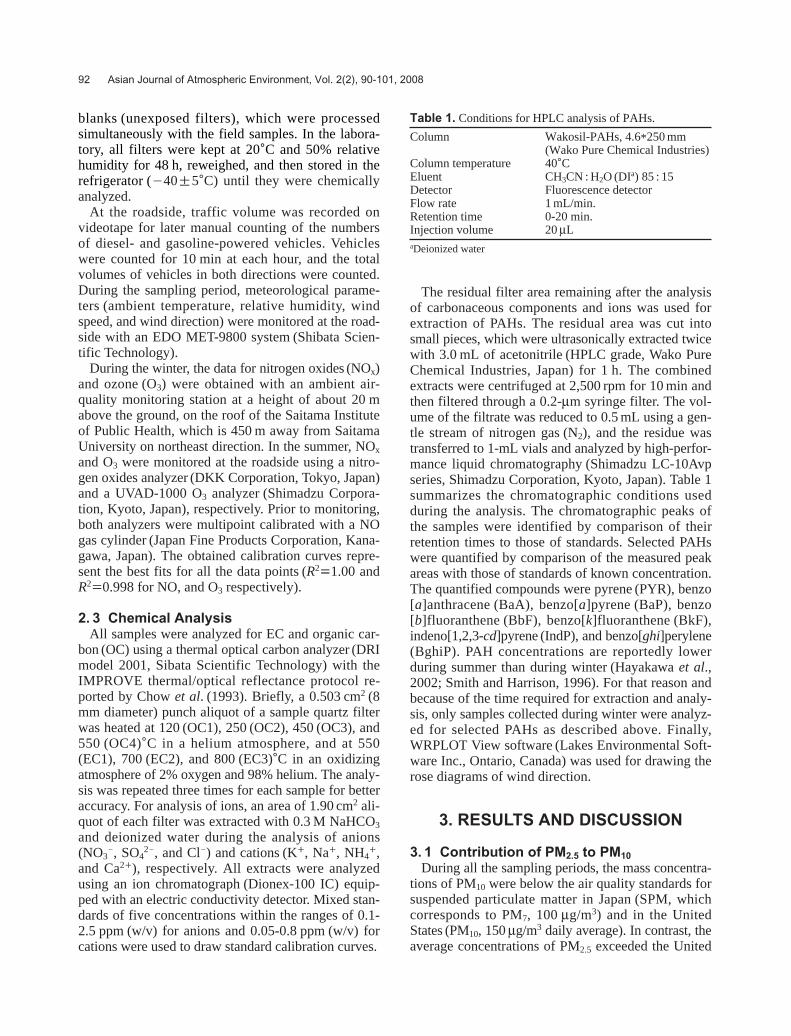
and EC were strongly correlated (Pearson correlationcoefficients: r==0.88 and r==0.83, p⁄0.01, n==24 atthe roadside and the urban background site, respec-tively) during winter (Fig. 3). However, they were onlymoderately correlated during summer. As for the rela-tion between PM10 and the EC, the correlation coeffi-cients were: r==0.73 and r==0.72, p⁄0.01, n==24 atthe roadside and the urban background site, respec-tively. These findings indicate that EC, which is main-ly emitted from combustion sources (diesel-poweredvehicles in the current study area), was associated withPM2.5 at both sites.
During winter, the contribution of TC to the massof PM2.5 was 47% (EC: 17%, OC: 30%) at the road-side, whereas it was 43% (EC: 13%, OC: 30%) at theurban background site. Similar percentages were ob-served during summer. Moreover, at both sites thetemporal variations of TC were similar to those ofPM2.5. The high levels of carbonaceous components
94 Asian Journal of Atmospheric Environment, Vol. 2(2), 90-101, 2008
Fig. 3. Correlation between PM2.5 and ECPM2.5 mass concentrations at the roadside and the urban background site during winterand summer.
16
12
8
4
0
10
8
6
4
2
0
(a) Roadside (b) Urban background
y==0.10x++3.11r==0.63p⁄0.01, n==22
y==0.05x++1.86r==0.62p⁄0.01, n==22
: Summer : Summer
: Winter : Winter
y==0.15x++0.69r==0.88p⁄0.01, n==24
y==0.10x++0.17r==0.83p⁄0.01, n==24
0 20 40 60 80
PM2.5 (μg/m3)
0 20 40 60 80
PM2.5 (μg/m3)
EC
PM2.
5(μ
g-C
/m3 )
EC
PM2.
5(μ
g-C
/m3 )

could be attributable to traffic emissions. Particularly,the higher EC concentrations observed at the roadsidecompared with those observed at the urban backgroundsite are attributable to the exhaust of diesel-poweredvehicles. This is supported by the observation that ECwas significantly correlated (r==0.50, p⁄0.02, n==24and r==0.45, p⁄0.05, n==22 during winter and sum-mer, respectively) with the percentage of diesel-pow-ered vehicles traveling on the road. However, the nar-row range of the diesel-powered vehicles percentage(19-32%) as well as the meteorological conditionscould explain the moderate correlation coefficientsthat were obtained. Furthermore, EC was strongly
correlated (r==0.91, n==22, p⁄0.01) with the NO/NOx
ratio measured at the roadside during summer (Fig. 4).The NO/NOx ratio represents the primary emitted NOx
which are mainly emitted by diesel-powered vehicles.These correlations indicate that diesel-powered vehi-cles traveling on the road may have been the majorsource of EC measured during our study.
3. 3 Chemical Composition of PM2.5
Calculated with the Mass Closure ModelUsing the analytical data for the chemical compo-
nents measured, we constructed a mass closure model(Harrison et al., 2003) for the chemical compositionof the particulate matter measured at the two sites.We focused on the chemical composition of PM2.5.The model is described briefly as follows:
Sulphate : Sulphate concentrations were increasedto the equivalent mass of ammonium sulphate using afactor of 1.38. A further 29% increase was applied toallow for water content.
Nitrate : Nitrate concentrations were increased tothe equivalent mass of ammonium nitrate using a fac-tor of 1.29. A further 29% increase was applied toallow for water content.
Chloride : Chloride concentrations were increasedto the equivalent mass of ammonium chloride using afactor of 1.51. A further 32% increase was applied toallow for water content.
EC : EC mass was unchanged because EC exists inthe form of graphitic carbon.
OC : Factors of 1.3 and 1.7 were used to convertcarbon masses to organic compound masses at theroadside and the urban background site, respectively.
Harrison et al. (2003) used a factor of 1.4 to convert
Chemical Composition of PM2.5 and Their Associated PAHs 95
Fig. 4. Correlation between NO/NOx and ECPM2.5 at the road-side during summer.
Fig. 5. Observed mass concentration of PM2.5 plotted against calculated mass concentration at the roadside and the urban back-ground site during winter and summer.
16
12
8
4
00 0.2 0.4 0.6 0.8
NO/NOx
EC
PM2.
5(μ
g-C
/m3 )
y==2.17x-1.19r==0.91p⁄0.01n==22
80
60
40
20
0
80
60
40
20
00 20 40 60 80
Observed mass (μg/m3)
0 20 40 60 80
Observed mass (μg/m3)
Cal
cula
ted
mas
s(μg
/m3 )
Cal
cula
ted
mas
s(μg
/m3 )
y==0.98xr==0.99p⁄0.01n==22
y==1.12xr==0.93p⁄0.01n==22
y==1.00xr==0.98p⁄0.01n==24
y==1.01xr==0.99p⁄0.01n==24
: Summer : Summer
: Winter : Winter
(a) Roadside (b) Urban background
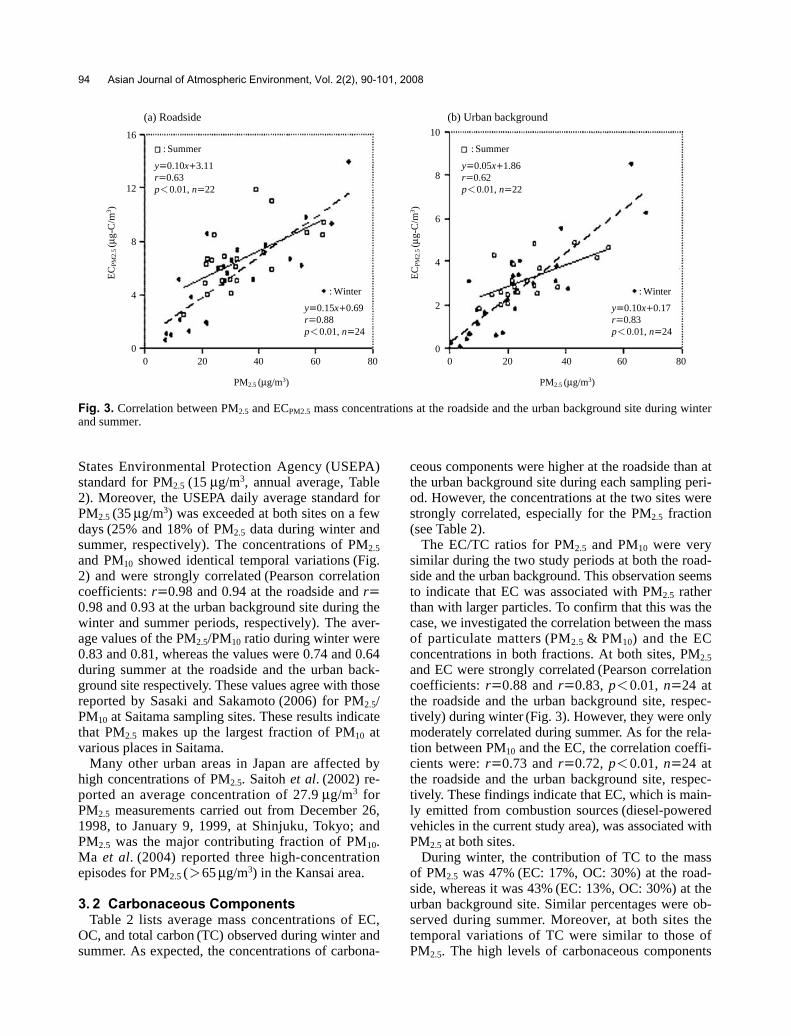
OC to organic compounds for the background site intheir study. However, in our study we used a factor of1.7, which was applied during a similar study in Japan(Takahashi et al., 2008). This factor was derived fromthe observation of a study conducted in Tokyo byTakegawa et al. (2005). For soil particles, Harrison etal. (2003) assumed the contribution from soil parti-cles and road dust on the basis of Fe analysis. How-ever, in our study we did not analyze Fe. Therefore,we multiplied PM2.5 mass concentrations by the fac-tors mentioned by Takahashi et al. (2008) to estimatethe contribution of soil particles to PM2.5 (0.051 and0.010 during winter and summer, respectively). InFig. 5, the mass concentrations calculated with themodel are plotted against the measured mass concen-trations during both winter and summer. The goodagreement between the calculated and observed con-centrations of PM2.5 at the investigated sites indicatesthe validity of our model. The chemical compositionof PM2.5 was quite similar at both sites. Fig. 6 showsthe chemical composition of PM2.5 at both the road-side and the urban backgrounds site. The most abun-dant components were OC, EC, sulphate, and nitrate.Carbonaceous compounds showed high contributionsto the calculated chemical composition of PM2.5 (onaverage 56% at the roadside and 55% at the urbanbackground site). Sulphate and nitrate were associatedwith carbonaceous components. However, during cer-tain periods (July 29-30, 2005), sulphate was moreabundant than the other components. In contrast, nit-rate contributions were lower on the same dates. Thewind direction on these dates was not stable, but ittended to parallel the road. Usually, high sulphate
concentrations and low nitrate concentrates indicatethat an aerosol has traveled long distances (Hagino etal., 2007; Baek and Aneja, 2004). Therefore, we sus-pect that an air mass that included pollutants from otherareas passed through the atmosphere at our investiga-tion area on those dates.
The highest contribution of carbonaceous compo-nents was observed during days when the wind wascoming mainly from the southwest, that is, from theroadside toward the urban background site. Therefore,we strongly believe that at the latter site, the contri-bution of carbonaceous components can be attributedto motor vehicle emissions. Moreover, at the roadside,the concentrations of several chemical componentssuch as EC and OC were markedly lower on the week-end than during the week. This reduction was associ-ated with the reduction in the number of diesel-pow-ered vehicles on the weekend. The difference betweendata for the weekday and weekend was marked in thecase of the EC concentration, whereas for the OC, theweekend concentrations were closer to the weekdayconcentrations.
3. 4 PAHs
3. 4. 1 Association with PM2.5
Table 3 lists the average concentrations (arithmeticmean±SD) and total concentrations of the selectedPAHs during winter. At the roadside, the average totalPAH concentrations were 3.37±2.90 ng/m3 in PM2.5
and 3.46±2.81 ng/m3 in PM10. The average PM2.5/PM10 ratios for the individual PAHs were 0.95 and0.81 at the roadside and the urban background site,respectively. For example, the ratio for BaP rangedfrom 0.83 to 0.98 (average 0.93) at the roadside, where-as the ratio ranged from 0.59 to 0.97 (average 0.82) atthe urban background site. The concentrations of indi-vidual PAHs (except for PYR) in the PM2.5 fractionand their concentrations in the PM10 fraction werestrongly correlated (Table 4). Thus, we can conclude
96 Asian Journal of Atmospheric Environment, Vol. 2(2), 90-101, 2008
Fig. 6. Calculated chemical composition of PM2.5 at the road-side (R) and the urban background site (U.B.), along with thedifference between the two (R-U.B.) on July 25, 2005.
Table 3. Average concentrations (arithmetic mean±SD) ofmeasured PAHs at the investigated sites in winter.
PM2.5 (ng/m3) PM10 (ng/m3)
Roadside Urban Roadside Urbanbackground background
PYR 0.27±0.29 0.17±0.10 0.20±0.14 0.18±0.11BaA 0.41±0.41 0.22±0.21 0.44±0.45 0.25±0.22BaP 0.52±0.47 0.36±0.38 0.57±0.52 0.45±0.46BkF 0.27±0.20 0.21±0.18 0.29±0.22 0.25±0.20BbF 0.57±0.46 0.43±0.39 0.57±0.48 0.50±0.47BghiP 0.77±0.64 0.58±0.56 0.80±0.68 0.64±0.60IndP 0.62±0.52 0.48±0.36 0.59±0.51 0.51±0.41
Total 3.37±2.90 2.33±2.08 3.46±2.81 2.70±2.33
35
30
25
20
15
10
5
0
-5
Soil Calcium Ammonium Chloride
Nitrate Sulphate OC EC
Potassium Sodium
PM2.5 R PM2.5 U.B. R-U.B.
Con
cent
ratio
n(μ
g/m
3 )
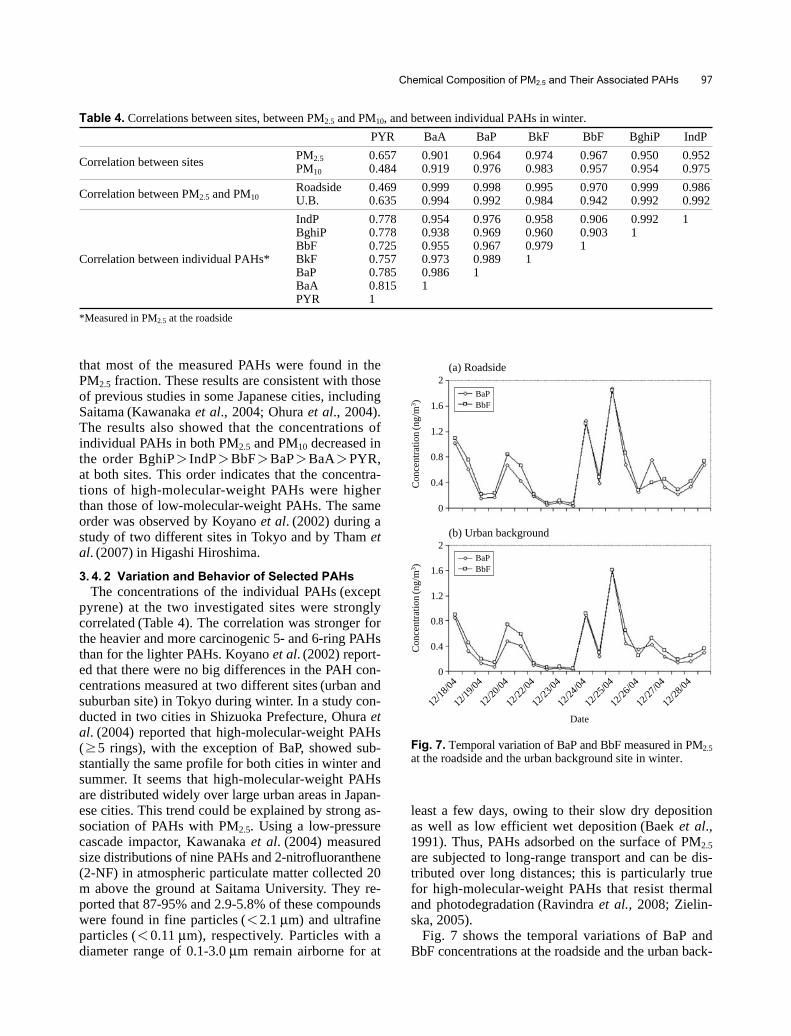
that most of the measured PAHs were found in thePM2.5 fraction. These results are consistent with thoseof previous studies in some Japanese cities, includingSaitama (Kawanaka et al., 2004; Ohura et al., 2004).The results also showed that the concentrations ofindividual PAHs in both PM2.5 and PM10 decreased inthe order BghiP¤IndP¤BbF¤BaP¤BaA¤PYR,at both sites. This order indicates that the concentra-tions of high-molecular-weight PAHs were higherthan those of low-molecular-weight PAHs. The sameorder was observed by Koyano et al. (2002) during astudy of two different sites in Tokyo and by Tham etal. (2007) in Higashi Hiroshima.
3. 4. 2 Variation and Behavior of Selected PAHs
The concentrations of the individual PAHs (exceptpyrene) at the two investigated sites were stronglycorrelated (Table 4). The correlation was stronger forthe heavier and more carcinogenic 5- and 6-ring PAHsthan for the lighter PAHs. Koyano et al. (2002) report-ed that there were no big differences in the PAH con-centrations measured at two different sites (urban andsuburban site) in Tokyo during winter. In a study con-ducted in two cities in Shizuoka Prefecture, Ohura etal. (2004) reported that high-molecular-weight PAHs(›5 rings), with the exception of BaP, showed sub-stantially the same profile for both cities in winter andsummer. It seems that high-molecular-weight PAHsare distributed widely over large urban areas in Japan-ese cities. This trend could be explained by strong as-sociation of PAHs with PM2.5. Using a low-pressurecascade impactor, Kawanaka et al. (2004) measuredsize distributions of nine PAHs and 2-nitrofluoranthene(2-NF) in atmospheric particulate matter collected 20m above the ground at Saitama University. They re-ported that 87-95% and 2.9-5.8% of these compoundswere found in fine particles (⁄2.1 μm) and ultrafineparticles (⁄0.11 μm), respectively. Particles with adiameter range of 0.1-3.0 μm remain airborne for at
least a few days, owing to their slow dry depositionas well as low efficient wet deposition (Baek et al.,1991). Thus, PAHs adsorbed on the surface of PM2.5
are subjected to long-range transport and can be dis-tributed over long distances; this is particularly truefor high-molecular-weight PAHs that resist thermaland photodegradation (Ravindra et al., 2008; Zielin-ska, 2005).
Fig. 7 shows the temporal variations of BaP andBbF concentrations at the roadside and the urban back-
Chemical Composition of PM2.5 and Their Associated PAHs 97
Table 4. Correlations between sites, between PM2.5 and PM10, and between individual PAHs in winter.
PYR BaA BaP BkF BbF BghiP IndP
Correlation between sites PM2.5 0.657 0.901 0.964 0.974 0.967 0.950 0.952PM10 0.484 0.919 0.976 0.983 0.957 0.954 0.975
Correlation between PM2.5 and PM10Roadside 0.469 0.999 0.998 0.995 0.970 0.999 0.986U.B. 0.635 0.994 0.992 0.984 0.942 0.992 0.992
IndP 0.778 0.954 0.976 0.958 0.906 0.992 1BghiP 0.778 0.938 0.969 0.960 0.903 1BbF 0.725 0.955 0.967 0.979 1
Correlation between individual PAHs* BkF 0.757 0.973 0.989 1BaP 0.785 0.986 1BaA 0.815 1PYR 1
*Measured in PM2.5 at the roadside
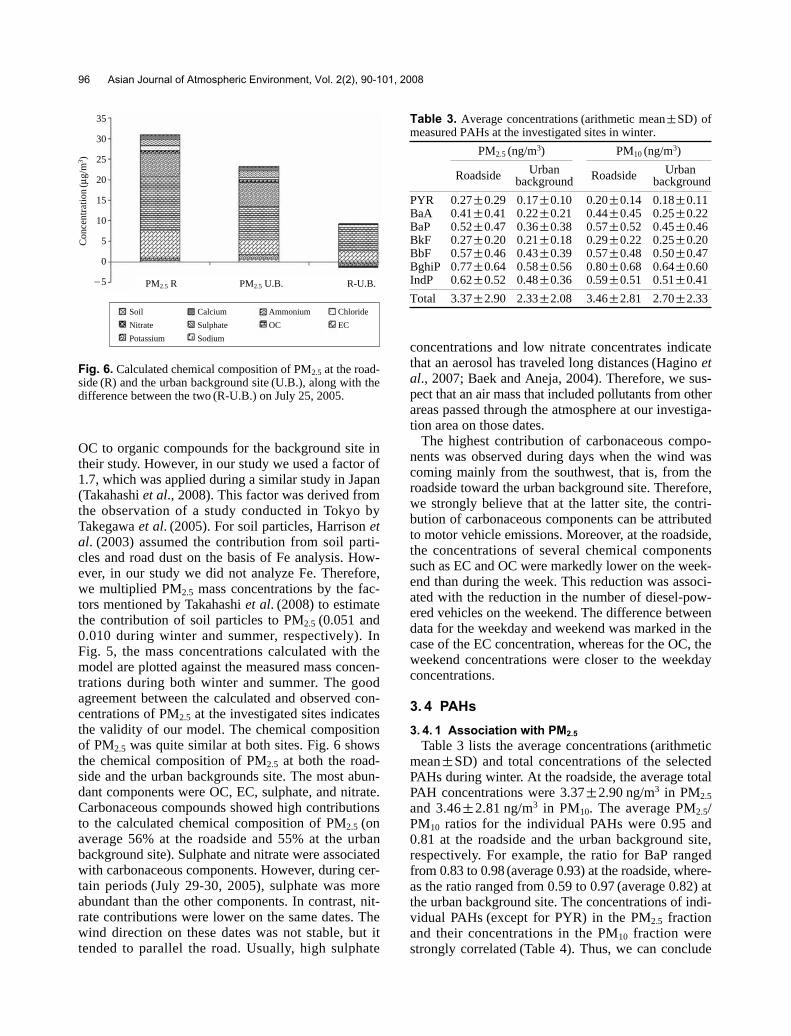
Fig. 7. Temporal variation of BaP and BbF measured in PM2.5
at the roadside and the urban background site in winter.
2
1.6
1.2
0.8
0.4
0
2
1.6
1.2
0.8
0.4
0
Date
12/18
/04
12/19
/04
12/20
/04
12/22
/04
12/23
/04
12/24
/04
12/25
/04
12/26
/04
12/27
/04
12/28
/04
BaPBbF
BaPBbF
(a) Roadside
(b) Urban background
Con
cent
ratio
n(n
g/m
3 )C
once
ntra
tion
(ng/
m3 )
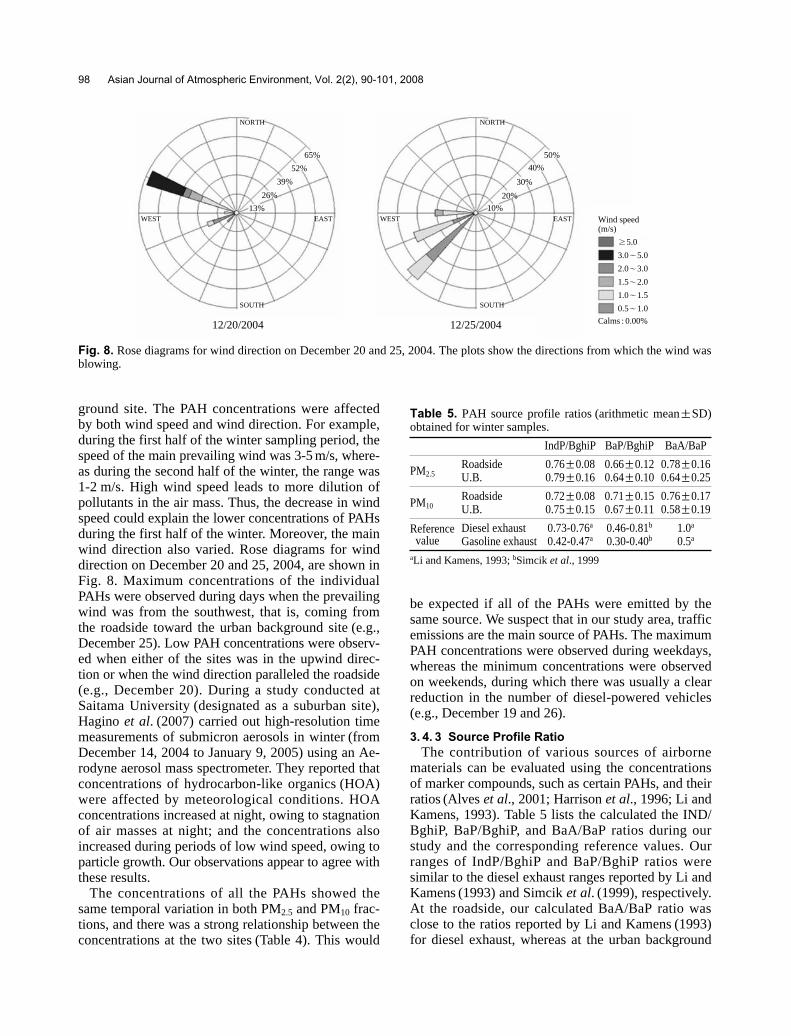
ground site. The PAH concentrations were affectedby both wind speed and wind direction. For example,during the first half of the winter sampling period, thespeed of the main prevailing wind was 3-5 m/s, where-as during the second half of the winter, the range was1-2 m/s. High wind speed leads to more dilution ofpollutants in the air mass. Thus, the decrease in windspeed could explain the lower concentrations of PAHsduring the first half of the winter. Moreover, the mainwind direction also varied. Rose diagrams for winddirection on December 20 and 25, 2004, are shown inFig. 8. Maximum concentrations of the individualPAHs were observed during days when the prevailingwind was from the southwest, that is, coming fromthe roadside toward the urban background site (e.g.,December 25). Low PAH concentrations were observ-ed when either of the sites was in the upwind direc-tion or when the wind direction paralleled the roadside(e.g., December 20). During a study conducted atSaitama University (designated as a suburban site),Hagino et al. (2007) carried out high-resolution timemeasurements of submicron aerosols in winter (fromDecember 14, 2004 to January 9, 2005) using an Ae-rodyne aerosol mass spectrometer. They reported thatconcentrations of hydrocarbon-like organics (HOA)were affected by meteorological conditions. HOAconcentrations increased at night, owing to stagnationof air masses at night; and the concentrations alsoincreased during periods of low wind speed, owing toparticle growth. Our observations appear to agree withthese results.
The concentrations of all the PAHs showed thesame temporal variation in both PM2.5 and PM10 frac-tions, and there was a strong relationship between theconcentrations at the two sites (Table 4). This would
be expected if all of the PAHs were emitted by thesame source. We suspect that in our study area, trafficemissions are the main source of PAHs. The maximumPAH concentrations were observed during weekdays,whereas the minimum concentrations were observedon weekends, during which there was usually a clearreduction in the number of diesel-powered vehicles(e.g., December 19 and 26).
3. 4. 3 Source Profile Ratio
The contribution of various sources of airbornematerials can be evaluated using the concentrationsof marker compounds, such as certain PAHs, and theirratios (Alves et al., 2001; Harrison et al., 1996; Li andKamens, 1993). Table 5 lists the calculated the IND/BghiP, BaP/BghiP, and BaA/BaP ratios during ourstudy and the corresponding reference values. Ourranges of IndP/BghiP and BaP/BghiP ratios weresimilar to the diesel exhaust ranges reported by Li andKamens (1993) and Simcik et al. (1999), respectively.At the roadside, our calculated BaA/BaP ratio wasclose to the ratios reported by Li and Kamens (1993)for diesel exhaust, whereas at the urban background
98 Asian Journal of Atmospheric Environment, Vol. 2(2), 90-101, 2008
Fig. 8. Rose diagrams for wind direction on December 20 and 25, 2004. The plots show the directions from which the wind wasblowing.
Table 5. PAH source profile ratios (arithmetic mean±SD)obtained for winter samples.
IndP/BghiP BaP/BghiP BaA/BaP
PM2.5Roadside 0.76±0.08 0.66±0.12 0.78±0.16U.B. 0.79±0.16 0.64±0.10 0.64±0.25
PM10Roadside 0.72±0.08 0.71±0.15 0.76±0.17U.B. 0.75±0.15 0.67±0.11 0.58±0.19
Reference Diesel exhaust 0.73-0.76a 0.46-0.81b 1.0a
value Gasoline exhaust 0.42-0.47a 0.30-0.40b 0.5a
aLi and Kamens, 1993; bSimcik et al., 1999
NORTH
SOUTH
NORTH
SOUTH
65% 50%
40%
30%
›5.0
3.0~5.0
2.0~3.0
1.5~2.0
1.0~1.5
0.5~1.0
Wind speed(m/s)
Calms : 0.00%
20%
10%
52%
39%
26%
12/20/2004 12/25/2004
13%WEST EAST WEST EAST
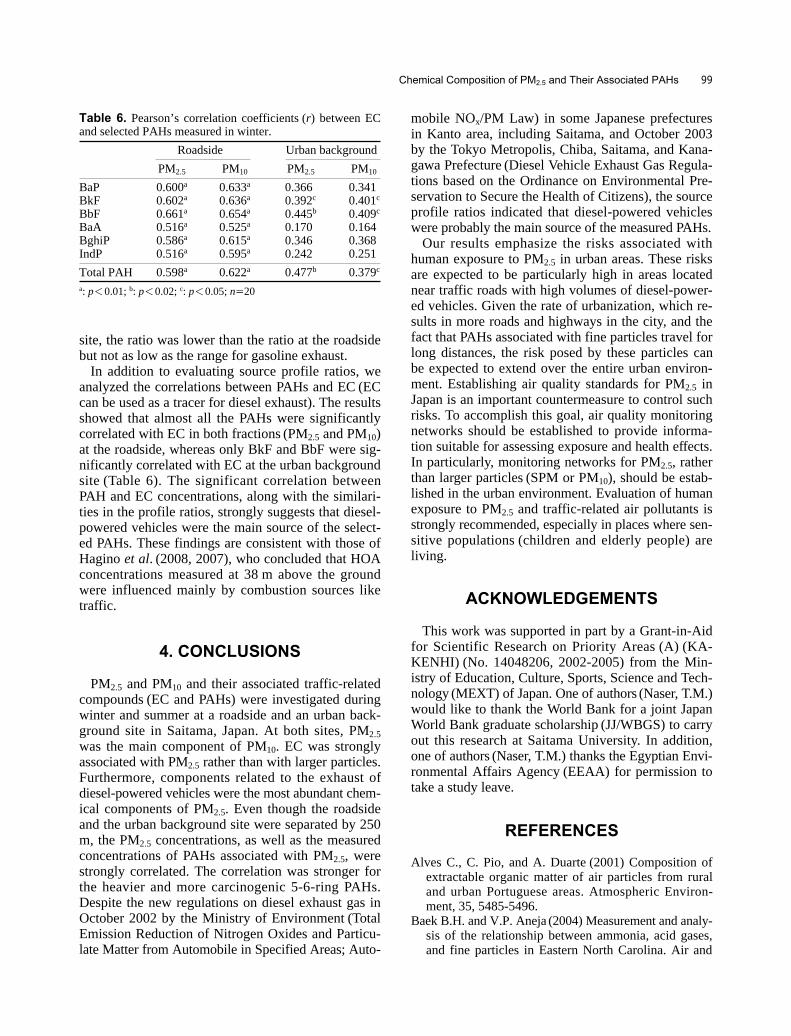
site, the ratio was lower than the ratio at the roadsidebut not as low as the range for gasoline exhaust.
In addition to evaluating source profile ratios, weanalyzed the correlations between PAHs and EC (ECcan be used as a tracer for diesel exhaust). The resultsshowed that almost all the PAHs were significantlycorrelated with EC in both fractions (PM2.5 and PM10)at the roadside, whereas only BkF and BbF were sig-nificantly correlated with EC at the urban backgroundsite (Table 6). The significant correlation betweenPAH and EC concentrations, along with the similari-ties in the profile ratios, strongly suggests that diesel-powered vehicles were the main source of the select-ed PAHs. These findings are consistent with those ofHagino et al. (2008, 2007), who concluded that HOAconcentrations measured at 38 m above the groundwere influenced mainly by combustion sources liketraffic.
4. CONCLUSIONS
PM2.5 and PM10 and their associated traffic-relatedcompounds (EC and PAHs) were investigated duringwinter and summer at a roadside and an urban back-ground site in Saitama, Japan. At both sites, PM2.5
was the main component of PM10. EC was stronglyassociated with PM2.5 rather than with larger particles.Furthermore, components related to the exhaust ofdiesel-powered vehicles were the most abundant chem-ical components of PM2.5. Even though the roadsideand the urban background site were separated by 250m, the PM2.5 concentrations, as well as the measuredconcentrations of PAHs associated with PM2.5, werestrongly correlated. The correlation was stronger forthe heavier and more carcinogenic 5-6-ring PAHs.Despite the new regulations on diesel exhaust gas inOctober 2002 by the Ministry of Environment (TotalEmission Reduction of Nitrogen Oxides and Particu-late Matter from Automobile in Specified Areas; Auto-
mobile NOx/PM Law) in some Japanese prefecturesin Kanto area, including Saitama, and October 2003by the Tokyo Metropolis, Chiba, Saitama, and Kana-gawa Prefecture (Diesel Vehicle Exhaust Gas Regula-tions based on the Ordinance on Environmental Pre-servation to Secure the Health of Citizens), the sourceprofile ratios indicated that diesel-powered vehicleswere probably the main source of the measured PAHs.
Our results emphasize the risks associated withhuman exposure to PM2.5 in urban areas. These risksare expected to be particularly high in areas locatednear traffic roads with high volumes of diesel-power-ed vehicles. Given the rate of urbanization, which re-sults in more roads and highways in the city, and thefact that PAHs associated with fine particles travel forlong distances, the risk posed by these particles canbe expected to extend over the entire urban environ-ment. Establishing air quality standards for PM2.5 inJapan is an important countermeasure to control suchrisks. To accomplish this goal, air quality monitoringnetworks should be established to provide informa-tion suitable for assessing exposure and health effects.In particularly, monitoring networks for PM2.5, ratherthan larger particles (SPM or PM10), should be estab-lished in the urban environment. Evaluation of humanexposure to PM2.5 and traffic-related air pollutants isstrongly recommended, especially in places where sen-sitive populations (children and elderly people) areliving.
ACKNOWLEDGEMENTS
This work was supported in part by a Grant-in-Aidfor Scientific Research on Priority Areas (A) (KA-KENHI) (No. 14048206, 2002-2005) from the Min-istry of Education, Culture, Sports, Science and Tech-nology (MEXT) of Japan. One of authors (Naser, T.M.)would like to thank the World Bank for a joint JapanWorld Bank graduate scholarship (JJ/WBGS) to carryout this research at Saitama University. In addition,one of authors (Naser, T.M.) thanks the Egyptian Envi-ronmental Affairs Agency (EEAA) for permission totake a study leave.
REFERENCES
Alves C., C. Pio, and A. Duarte (2001) Composition ofextractable organic matter of air particles from ruraland urban Portuguese areas. Atmospheric Environ-ment, 35, 5485-5496.
Baek B.H. and V.P. Aneja (2004) Measurement and analy-sis of the relationship between ammonia, acid gases,and fine particles in Eastern North Carolina. Air and
Chemical Composition of PM2.5 and Their Associated PAHs 99
Table 6. Pearson’s correlation coefficients (r) between ECand selected PAHs measured in winter.
Roadside Urban background
PM2.5 PM10 PM2.5 PM10
BaP 0.600a 0.633a 0.366 0.341BkF 0.602a 0.636a 0.392c 0.401c
BbF 0.661a 0.654a 0.445b 0.409c
BaA 0.516a 0.525a 0.170 0.164BghiP 0.586a 0.615a 0.346 0.368IndP 0.516a 0.595a 0.242 0.251
Total PAH 0.598a 0.622a 0.477b 0.379c
a: p⁄0.01; b: p⁄0.02; c: p⁄0.05; n==20
Waste Management Association, 54, 623-633.Baek S.O., R.A. Field, M.E. Goldstone, P.W. Kirk, J.N.
Lester, and R. Perry (1991) A review of atmosphericpolycyclic aromatic hydrocarbons: source, fate andbehavior. Water, Air and Soil Pollution, 60, 279-300.
Chow J.C., J.G. Watson, L.C. Pritchett, W.R. Pierson,C.A. Frazier, and R.G. Purcell (1993) The DRI thermal/optical reflectance carbon analysis system: description,evaluation and application in US air quality studies.Atmospheric Environment, 27A, 1185-1201.
Dockery D.W., C.A. Pope, X. Xu, J.D. Spengler, J.H.Ware, M.E. Fay, B.G. Ferris, and F.E. Speizer (1993)An association between air pollution and mortality insix U.S. cities. New England Journal of Medicine, 329(24), 1753-1759.
Fujita E., J.G. Watson, and J.C. Chow (1998) NorthernFront Range Air Quality Study, volume C: Source Ap-portionment and Simulation Methods and Evaluation;Prepared for Colorado State University, CooperativeInstitute for Research in the Atmosphere, by DesertResearch Institute, Reno, NV.
Hagino H., T. Takada, H. Kunimi, and K. Sakamoto (2007)Characterization and source presumption of wintertimesubmicron organic aerosols at Saitama, Japan, usingthe Aerodyne aerosol mass spectrometer. AtmosphericEnvironment, 41, 8834-8845.
Hagino H., T. Takada, H. Kunimi, and K. Sakamoto (2008)Case analysis of organic aerosol mass spectra by posi-tive matrix factorization. Journal of Japan Society forAtmospheric Environment, 43, 161-172.
Harrison R.M., A.M. Jones, and R.G. Lawrence (2003) Apragmatic mass closure model for airborne Particulatematter at urban background and roadside sites. Atmos-pheric Environment, 37, 4927-4933.
Harrison R.M., D.J.T. Smith, and L. Luhana (1996) Sour-ce apportionment of atmospheric polycyclic aromatichydrocarbons collected from an urban location in Bir-mingham, U.K. Environmental Science and Technolo-gy, 30, 825-832.
Harrison R.M., J.P. Shi, and M.R. Jones (1999) Continu-ous measurements of aerosol physical properties in theurban atmosphere. Atmospheric Environment, 33, 1037-1047.
Hayakawa K., N. Tang, K. Akutsu, T. Murahashi, H. Ka-kimoto, R. Kizu, and A. Toriba (2002) Comparison ofpolycyclic aromatic hydrocarbons and nitropolycyclicaromatic hydrocarbons in airborne particulates collect-ed in downtown and suburban Kanazawa, Japan. At-mospheric Environment, 36, 5535-5541.
IARC, International Agency for Research on Cancer (2003)Evaluations of carcinogenicity to humans. Retrievedfrom website: http://www.iarc.fr.
Kawanaka Y., E. Matsumoto, K. Sakamoto, N. Wang,and S. Yun (2004) Size distributions of mutagenic com-pounds and mutagenicity in atmospheric particulatematter collected with a low-pressure cascade impactor.Atmospheric Environment, 38, 2125-2132.
Kittelson D.B., P.A. Kadue, H.C. Scherrer, and R.E. Lov-
rien (1988) Characterization of Diesel Particles in theAtmosphere. Coordinating Research Council AP-2Project Group Final Report.
Koyano M., O. Endo, M. Katoh, R. Valdivia, M. Marileo,M. Morita, S. Goto, and H. Matsushita (2002) Polynu-clear aromatic hydrocarbon concentration and mutage-nicity of airborne particles in urban air: Comparison ofTokyo area and Santiago. Journal of Health Science,48, 256-262.
Li C.K. and R.M. Kamens (1993) The use of polycyclicaromatic hydrocarbons as sources signatures in recep-tor modeling. Atmospheric Environment, 27A, 523-532.
Ligocki M.P. and J.F. Pankow (1989) Measurements ofthe gas/particle distributions of atmospheric organiccompounds. Environmental Science and Technology,23, 75-83.
Ma C.-J., Y. Oki, S. Tohno, and M. Kasahara (2004) As-sessment of wintertime atmospheric pollutants in anurban area of Kansai, Japan. Atmospheric Environment,38, 2939-2949.
Ohura T., T. Amagai, T. Sugiyama, M. Fusaya, and H.Matsushita (2004) Characteristics of particle matterand associated polycyclic aromatic hydrocarbons inindoor and outdoor air in two cities in Shizuoka, Japan.Atmospheric Environment, 38, 2045-2054.
Ravindra K., R. Sokhi, and R.V. Grieken (2008) Atmos-pheric polycyclic aromatic hydrocarbons: Source attri-bution, emission factors and regulation. AtmosphericEnvironment, 42, 2895-2921.
Saitoh K., K. Sera, K. Hirano, and T. Shirai (2002) Chem-ical characterization of particles in winter-night smogin Tokyo. Atmospheric Environment, 36, 435-440.
Sasaki K. and K. Sakamoto (2006) Diurnal characteristicsof suspended particulate matter and PM2.5 in the urbanand suburban atmosphere of the Kanto Plain, Japan.Water, Soil, and Air Pollution, 171, 29-47.
Schauer J.J., W.F. Rogge, L.M. Hildemann, M.A. Mazu-rek, G.R. Cass, and B.R.T. Simoneit (1996) Sourceapportionment of airborne particulate matter usingorganic compounds as tracers. Atmospheric Environ-ment, 30, 3837-3855.
Schwartz J., D.W. Dochery, and L.M. Neas (1996) Is dailymortality associated specifically with fine particles?Journal of Air Waste Management Association, 46,927-939.
Schwartz J., F. Laden, and A. Zanobetti (2002) The con-centration-response relation between PM2.5 and dailydeaths. Environmental Health Perspectives, 110, 1025-1029.
Shah A.P., A.P. Pietropaoli, L.M. Frasier, D.M. Speers,D.C. Chalupa, J.M. Delehanty, L.S. Huang, M.J. Utell,and M.W. Frampton (2008) Effect of inhaled carbonultrafine particles on reactive hyperemia in healthyhuman subjects. Environmental Health Perspectives,116, 375-380.
Simcik M.F., S.J. Eisenreich, and P.J. Lioy (1999) Sourceapportionment and source/sink relationships of PAHs
100 Asian Journal of Atmospheric Environment, Vol. 2(2), 90-101, 2008
in the coastal atmosphere of Chicago and Lake Michi-gan. Atmospheric Environment, 33, 5071-5079.
Smith D.J.T. and R.M. Harrison (1996) Concentrations,trends and vehicle source profile of polynuclear aro-matic hydrocarbons in the U.K. atmosphere. Atmos-pheric Environment, 30, 2513-2525.
Takahashi K., H. Minoura, and K. Sakamoto (2008) Chem-ical composition of atmospheric aerosols in the gen-eral environment and around a trunk road in the Tokyometropolitan area. Atmospheric Environment, 42, 113-125.
Takegawa N., Y. Miyazaki, Y. Kondo, Y. Komazaki, T.Miyakawa, and J.L. Jimenez (2005) Characterizationof an Aerodyne aerosol mass spectrometer (AMS): in-tercomparison with other aerosol instruments. AerosolScience and Technology, 39, 760-770.
Tham Y.W.F., N. Ozaki, and H. Sakugawa (2007) Poly-cyclic aromatic hydrocarbons (PAHs) in the aerosol ofHigashi Hiroshima, Japan: pollution scenario and sour-ce identification. Water, Air and Soil Pollution, 182,
235-243.USEPA, Health Assessment Document for Diesel Engine
Exhaust (2002) U.S. Environmental Protection Agen-cy, Office of Research and Development, National Cen-ter for Environmental Assessment, Washington Offi-ce, Washington, DC, EPA/600/8-90/057F. Retrievedfrom http://cfpub.epa.gov/ncea.
WHO, Health Aspects of Air Pollution with ParticulateMatter, Ozone and Nitrogen Dioxide (2003) Copen-hagen; WHO Regional Office for Europe (EUR/03/5042688).
Yang S.Y.N., D.W. Connell, D.W. Hawker, and S.I.Kayal (1991) Polycyclic aromatic hydrocarbons in air,soil and vegetation in the vicinity of an urban roadway.Science of Total Environment, 102, 229-240.
Zielinska B. (2005) Atmospheric transformation of dieselemissions. Experimental and Toxicological Pathology,57, 31-42.
(Received 17 July 2008, accepted 7 November 2008)
Chemical Composition of PM2.5 and Their Associated PAHs 101