
Chemical characteristics, with particular reference to ... papers/KitakaRivers.pdf · The loss of...
15
Hydrobiologia 488: 57–71, 2002. D.M. Harper, R. Boar, M. Everard & P. Hickley (eds), Lake Naivasha, Kenya. © 2002 Kluwer Academic Publishers. Printed in the Netherlands. 57 Chemical characteristics, with particular reference to phosphorus, of the rivers draining into Lake Naivasha, Kenya Nzula Kitaka 1,2 , David M. Harper 1,2,∗ , Kenneth M. Mavuti 3 & Nic Pacini 1,4 1 Department of Biology, University of Leicester, LE1 7RH, U.K. 2 Department of Zoology, Egerton University, Box 536, Njoro, Kenya 3 Department of Zoology, Nairobi University, Box 30197, Nairobi, Kenya 4 Present address: Ministry of the Environment, Rome, Italy ∗ Author for correspondence. E-mail: [email protected] Key words: phosphorus, suspended solids, conductivity, seasonality, El Niño Abstract The loss of phosphorus from the catchment of Lake Naivasha, Kenya, was 0.2 kg ha −1 ann −1 , 76% of it particulate in a ‘normal’ year of wet and dry periods. It rose to a mean of 1.8 kg ha −1 ann −1 , 90% of which was particulate, in the months following the extreme rainfall which followed the 1997–1998 El Niño event in the Southern Atlantic. Total and particulate phosphorus were positively correlated with suspended solids and with discharge, and con- ductivity was negatively correlated with discharge. The magnitude of losses pose both threats to the water quality of Lake Naivasha and to the sustainable soils resources of the catchment. Introduction The extent of soil degradation, the losses of poten- tial agricultural production (Dregne, 1990) and the decrease in water quality (Calamari, 1987; Dejoux, 1988) are relatively poorly known for Africa. Yet its human population growth makes the necessity for an agricultural production increase essential (Fardeau & Frossard, 1991). Knowledge of the negative con- sequences of this, then becomes paramount. In many regions of the tropics, a sustainable level of food production is possible only by achieving bet- ter agricultural yields with the current land resources and not by extending cultivation on marginal lands (Dregne, loc.cit.; Downing et al., 1990). This means that for a large part of Africa, an increase in agricul- tural output is possible only if pathways of phosphorus cycling are changed by a greater P uptake by crops (Fardeau & Frossard, loc.cit). Phosphorus is low in Kenyan soils and is commonly the primary limiting nutrient (Hinga, 1973; Nyandat, 1981). It is lost from cultivated land mainly in particulate form, where the phosphate adsorption capacity is dependent on particles’ surface area and on their content of hydrated metal compounds (Fe, Al, Mn); most particles with these characteristics are clays (Viner, 1987). Their iron content depends on particle size and a strong relation- ship exists between available P, Fe content and the size of different clay fractions (Viner, loc. cit.). Organic matter also plays a significant role in the transport of particulate phosphorus. Organic particulates trans- port a larger fraction of adsorbed P than inorganic particulates (Sharpley & Smith, 1990). Conditions of intensive weathering in the tropics are associated with the leaching of Ca (Uriyo & Singh, 1978) and cor- relates with high abundance of amorphous Fe and Al (Wolf et al., 1985). Total phosphorus and suspended solids (SS) gen- erally increase in parallel during rain events when erosional processes in the catchment and in the chan- nel are active. Discharge is initially positively cor- related to TP and SS concentrations. Most of the particulate matter is mobilised during the rising limb of the hydrograph. Its concentration may decrease be- fore the peak in discharge is reached. Alternatively peaks of SS and TP concentration can be observed during the falling limb of the hydrograph when the mobilisation of sediments continues after the peak in
Transcript of Chemical characteristics, with particular reference to ... papers/KitakaRivers.pdf · The loss of...

Hydrobiologia 488: 57–71, 2002.D.M. Harper, R. Boar, M. Everard & P. Hickley (eds), Lake Naivasha, Kenya.© 2002 Kluwer Academic Publishers. Printed in the Netherlands.
57
Chemical characteristics, with particular reference to phosphorus,of the rivers draining into Lake Naivasha, Kenya
Nzula Kitaka1,2, David M. Harper1,2,∗, Kenneth M. Mavuti3 & Nic Pacini1,4
1Department of Biology, University of Leicester, LE1 7RH, U.K.2Department of Zoology, Egerton University, Box 536, Njoro, Kenya3Department of Zoology, Nairobi University, Box 30197, Nairobi, Kenya4Present address: Ministry of the Environment, Rome, Italy∗Author for correspondence. E-mail: [email protected]
Key words: phosphorus, suspended solids, conductivity, seasonality, El Niño
Abstract
The loss of phosphorus from the catchment of Lake Naivasha, Kenya, was 0.2 kg ha−1 ann−1, 76% of it particulatein a ‘normal’ year of wet and dry periods. It rose to a mean of 1.8 kg ha−1 ann−1, 90% of which was particulate, inthe months following the extreme rainfall which followed the 1997–1998 El Niño event in the Southern Atlantic.Total and particulate phosphorus were positively correlated with suspended solids and with discharge, and con-ductivity was negatively correlated with discharge. The magnitude of losses pose both threats to the water qualityof Lake Naivasha and to the sustainable soils resources of the catchment.
Introduction
The extent of soil degradation, the losses of poten-tial agricultural production (Dregne, 1990) and thedecrease in water quality (Calamari, 1987; Dejoux,1988) are relatively poorly known for Africa. Yetits human population growth makes the necessity foran agricultural production increase essential (Fardeau& Frossard, 1991). Knowledge of the negative con-sequences of this, then becomes paramount.
In many regions of the tropics, a sustainable levelof food production is possible only by achieving bet-ter agricultural yields with the current land resourcesand not by extending cultivation on marginal lands(Dregne, loc.cit.; Downing et al., 1990). This meansthat for a large part of Africa, an increase in agricul-tural output is possible only if pathways of phosphoruscycling are changed by a greater P uptake by crops(Fardeau & Frossard, loc.cit). Phosphorus is low inKenyan soils and is commonly the primary limitingnutrient (Hinga, 1973; Nyandat, 1981). It is lostfrom cultivated land mainly in particulate form, wherethe phosphate adsorption capacity is dependent onparticles’ surface area and on their content of hydrated
metal compounds (Fe, Al, Mn); most particles withthese characteristics are clays (Viner, 1987). Their ironcontent depends on particle size and a strong relation-ship exists between available P, Fe content and the sizeof different clay fractions (Viner, loc. cit.). Organicmatter also plays a significant role in the transportof particulate phosphorus. Organic particulates trans-port a larger fraction of adsorbed P than inorganicparticulates (Sharpley & Smith, 1990). Conditions ofintensive weathering in the tropics are associated withthe leaching of Ca (Uriyo & Singh, 1978) and cor-relates with high abundance of amorphous Fe and Al(Wolf et al., 1985).
Total phosphorus and suspended solids (SS) gen-erally increase in parallel during rain events whenerosional processes in the catchment and in the chan-nel are active. Discharge is initially positively cor-related to TP and SS concentrations. Most of theparticulate matter is mobilised during the rising limbof the hydrograph. Its concentration may decrease be-fore the peak in discharge is reached. Alternativelypeaks of SS and TP concentration can be observedduring the falling limb of the hydrograph when themobilisation of sediments continues after the peak in

58
discharge. The concentration of TP generally correl-ates with the concentration of sediments (Pacini &Harper, 1999).
P export is maximal in storm events as the P carriedby high discharge during periods of increased surfacerunoff represents the highest losses of total and dis-solved phosphorus (TP and DP). Once in the river,dissolved and adsorbed P forms behave differently inrelation to discharge. The concentration of DP is oftenreported to be higher in baseflow and to decrease dur-ing storms as a consequence of dilution by high waterlevels. Some studies have shown the opposite: higherDP export during surface runoff has been observed andexplained as a reduction in contact time between thepercolating water and the soil constituents which res-ults in less P adsorption of the DP carried by surfacewaters (Sharpley & Syers, 1976).
The irregular flow regimes of tropical rivers arerelated to the particular rainfall pattern characterizedby short rainy seasons with intense peaks, which gen-erate a very high response in runoff (Jones, 1979;Viner, 1981). In the Orange river (South Africa) asmuch as 90% of the suspended and dissolved yearlyload is mobilized during one rainy season. In Mo-rocco, short-term monitoring revealed that four hoursof flood could yield 98% and 74% of the annual TPand TN loads, respectively (Viner, 1981). These ex-amples point out the challenge represented by attemptsto monitor sediment and TP in tropical catchments.Roseboom & Lotriet (1993) found, after a detailedanalysis of sediment export studies in South Africa,that a minimum of 8 years of continuous monitoringwould be necessary to obtain reasonable estimates ofsuspended sediment export from a single catchment.A recent sediment yield map for South Africa was stillbased on simplifying assumptions defining broad re-gions of similar SS export potential, however, despiteseveral decades of sediment monitoring and a detailedsurvey of reservoir sedimentation across the country,(Roseboom & Lotriet, 1993).
In Kenya, information on the physical and biolo-gical processes characterizing the cycle of phosphorusis scarce and fragmentary. Data are periodically col-lected by soil scientists (Hinga, 1973; Nyandat, 1981),by limnologists (Talling & Talling, 1965; Kilham,1972; Gaudet, 1976, 1977, 1979; Melack, 1976,Peters & McIntyre, 1976; Melack et al., 1982; Nju-guna, 1988; Melack & McIntyre, 1993; Hecky, 1993)and by agriculturists (Smaling & Bouma, 1992). Therehave been no surveys, however that would integratedifferent compartments of the P cycle and no quant-
itative estimates of annual P losses through runoff.Melack & McIntyre (1991) reviewed the available dataon P in surface waters in tropical Africa and its poten-tial for the limitation of aquatic ecosystems. A largepart of their data concerns lakes and rivers in Kenya. Intheir analysis, they stressed the diversity of chemicalcomposition of surface waters in the country and thelack of data on P in rivers during a full hydrologicalcycle.
A study of the major sources and sinks of P andother nutrients in different agro-ecological zones inKenya (Smaling, 1993) suggested that human inter-vention in nutrient cycles in modern tropical Africamay be a cause of excessive enrichment in surfacewaters. This is supported by reports of on-going eu-trophication in Lake Victoria (Hecky, 1993) and byconcern expressed about the impact of increasing in-tensive agricultural land use around Lake Naivasha(Harper et al., 1993).
This study examines the sources and quantity ofphosphorus in the rivers of the Lake Naivasha catch-ment, particularly the river which carries the maininput, the Malewa. It was carried out from September1997 to March 1998, when heavy rains fell over thecountry, believed to be a consequence of ‘El Niño’ inthe southern Atlantic, and this period was then com-pared with a more ‘normal’ period, between 1998 and1999.
Methods
Sampling stations were established on a range of head-water rivers and streams and the three major riversflowing into lake Naivasha; the Malewa, Gilgil andKarati (Fig. 1). The positions of the sampling stationswere on road access to the river, in most cases, belowbridges.
Instantaneous river discharge at the time ofsampling was estimated using a mechanical flow meterof General Oceanics, model 2030R to give meancolumn velocity at 60% water depth, at 1 m interval instations with more than 10 m width and 0.5 m intervalsin stations with less than 10 m width. Discharge wascalculated by the velocity area method. In the lowerreaches and in rainy seasons, the meter could not besafely used; water velocity was estimated by timingan orange flowing through a known distance from abridge or vantage point. The values obtained duringlow flows were calibrated using graduated gauges po-sitioned at the riverbank and in the middle of the river

59
Figure 1. The lake Naivasha catchment showing sample stations.
channel by the Kenyan Ministry of Water at the lower,M4 and G2 stations. The gauge height values (GHT)were calibrated using Ase et al. (1986).
Water samples were collected by dipping an acid-washed polyethylene bottle a few centimetres belowthe water surface in the middle of the river channel.During high water level, samples were collected bylowering down an acid-washed plastic bucket tied ona rope from the bridge to the middle of the river.The water was then transferred into an acid-washedpolyethylene sample bottle. The samples for dissolvednutrients were filtered immediately after collection inthe field using an acid-washed 60 ml syringe and a
Swinnex filter holder with a GF/C glass microfibrefilter. The samples were transported in a cool box tothe laboratory for analysis. The water samples wereanalysed the same day of collection or, were stored inthe refrigerator for analyses the following day. Duringthe sample visit, conductivity, total dissolved solids(TDS) and temperature were measured by probe usinga portable Hach Conductivity/TDS meter whilst pHmeasurement was determined using an Orion SA 250model pH meter.
The alkalinity was determined by titrating a 50ml sample in the field using a Hach Digital Titratormodel 16900, with a 0.16N H2SO4 titration cartridge
60
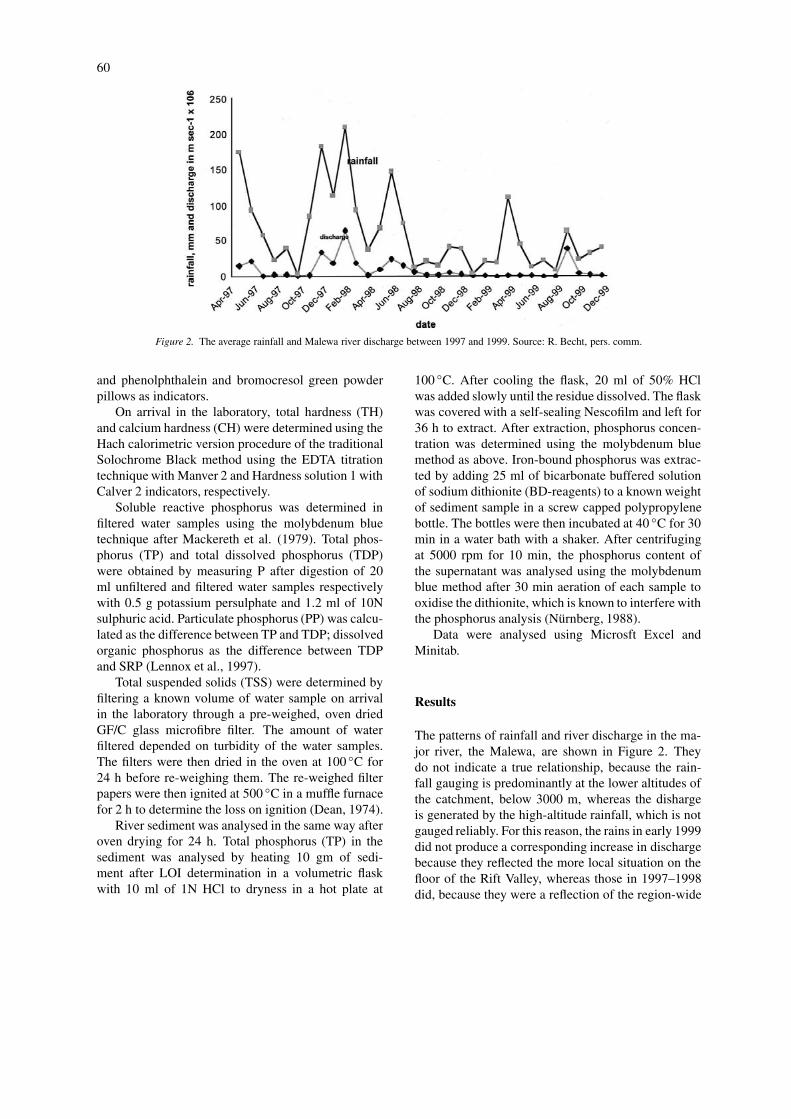
Figure 2. The average rainfall and Malewa river discharge between 1997 and 1999. Source: R. Becht, pers. comm.
and phenolphthalein and bromocresol green powderpillows as indicators.
On arrival in the laboratory, total hardness (TH)and calcium hardness (CH) were determined using theHach calorimetric version procedure of the traditionalSolochrome Black method using the EDTA titrationtechnique with Manver 2 and Hardness solution 1 withCalver 2 indicators, respectively.
Soluble reactive phosphorus was determined infiltered water samples using the molybdenum bluetechnique after Mackereth et al. (1979). Total phos-phorus (TP) and total dissolved phosphorus (TDP)were obtained by measuring P after digestion of 20ml unfiltered and filtered water samples respectivelywith 0.5 g potassium persulphate and 1.2 ml of 10Nsulphuric acid. Particulate phosphorus (PP) was calcu-lated as the difference between TP and TDP; dissolvedorganic phosphorus as the difference between TDPand SRP (Lennox et al., 1997).
Total suspended solids (TSS) were determined byfiltering a known volume of water sample on arrivalin the laboratory through a pre-weighed, oven driedGF/C glass microfibre filter. The amount of waterfiltered depended on turbidity of the water samples.The filters were then dried in the oven at 100 ◦C for24 h before re-weighing them. The re-weighed filterpapers were then ignited at 500 ◦C in a muffle furnacefor 2 h to determine the loss on ignition (Dean, 1974).
River sediment was analysed in the same way afteroven drying for 24 h. Total phosphorus (TP) in thesediment was analysed by heating 10 gm of sedi-ment after LOI determination in a volumetric flaskwith 10 ml of 1N HCl to dryness in a hot plate at
100 ◦C. After cooling the flask, 20 ml of 50% HClwas added slowly until the residue dissolved. The flaskwas covered with a self-sealing Nescofilm and left for36 h to extract. After extraction, phosphorus concen-tration was determined using the molybdenum bluemethod as above. Iron-bound phosphorus was extrac-ted by adding 25 ml of bicarbonate buffered solutionof sodium dithionite (BD-reagents) to a known weightof sediment sample in a screw capped polypropylenebottle. The bottles were then incubated at 40 ◦C for 30min in a water bath with a shaker. After centrifugingat 5000 rpm for 10 min, the phosphorus content ofthe supernatant was analysed using the molybdenumblue method after 30 min aeration of each sample tooxidise the dithionite, which is known to interfere withthe phosphorus analysis (Nürnberg, 1988).
Data were analysed using Microsft Excel andMinitab.
Results
The patterns of rainfall and river discharge in the ma-jor river, the Malewa, are shown in Figure 2. Theydo not indicate a true relationship, because the rain-fall gauging is predominantly at the lower altitudes ofthe catchment, below 3000 m, whereas the dishargeis generated by the high-altitude rainfall, which is notgauged reliably. For this reason, the rains in early 1999did not produce a corresponding increase in dischargebecause they reflected the more local situation on thefloor of the Rift Valley, whereas those in 1997–1998did, because they were a reflection of the region-wide

61
Table 1. The characteristics of the Naivasha headwaters
Name of Drainage Altitude Catchment Stream Temp Condy pH Total Ca Alkalinitytributary region m.a.s.l area km2 order ◦C µs cm−1 hardness hardness ms l−1 as
mg l−1 as mg;−1 as CaCO3CaCO3 CaCO3
Nyambugi Bahati hills 2320–260 17 1 20.9 81 7.8 47 19 11Nyairoko Bahati hills 2160–2760 35 2 22.2 92 7.7 40 20 12Njangiri Nyandarua ranges 2360–3620 10.5 2 16.6 72 7.4 33 28 22Wanjohi Nyandarua ranges 2340–3800 137.5 3 13.2 76 8.2 58 30 22Engare Mugutyu Kipipiri 2469–2620 8 2 20.5 103 7.6 57 40 28Turasha Kipipiri 2000–2906 133.5 4 20.4 80 7.5 56 33 23Kasuku Kinangop plateau 2012–2316 <1 1 18.2 372 7.6 189 58 43Unnamed A Kinangop plateau 2012–2316 <1 1 20.1 384 8.0 213 40 36Unnamed B Kinangop plateau 2012–2316 <1 1 19.9 500 8.2 288 44 40Unnamed C Kinangop plateau 2012–2316 <1 1 19.7 462 8.1 218 54 48
heavy rains following the 1997 El Niño event in theSouthern Atlantic.
The chemical characteristics of the headwatersstreams are shown in Table 1. The streams on thenorth eastern part of the catchment draining the Bahatihighlands and the Nyandarua mountain ranges werethe most dilute, with conductivity below 100, slightlyalkaline with low alkalinities. The small streams drain-ing the southern part – the Kinangop plateau – wereapproximately 4 times richer and harder. This is anarea of older underlying rocks, with regosol, cal-careous, deep loam soils.
Total phosphorus was generally below 100 µg l−1
(Fig. 3) with the three exceptions, which were eitherinfluenced by cattle (Njangiri, evidenced by high am-
Table 2. The nutrient chemistry of the Naivasha headwaters
Tributary SRP/TP PP% Mean Mean
ratio of NH4-N NO3-N
TP µg l−1 µg l−1
Nyambugi 0.4 59.2 82.9 ± 35 0.1 ± 0.03
Nyairoko 0.2 75.7 8.6 ± 3 0.04 ± 0.01
Njangiri 0.1 89.6 604.3 ± 34 0.04 ± 0.01
Wanjohi 0.5 47.5 50 ± 2 0.11 ± 0.03
Engare Mugutyu 0.4 59.6 68.1 ± 9 0.56 ± 0.3
Turasha 0.6 50.1 40.8 ± 7 0.58 ± 0.1
Unnamed A 0.5 54.9 11.9 ± 3 0.13 ± 0.02
Unnamed B 0.5 49.7 36.6 ± 7 0.11 ± 0.03
Unnamed C 0.7 34.6 21.2 ± 4 0.17 ± 0.01
Kariundu 0.2 80.3 < detection 0.63 ± 0.2
Little Gilgil 0.6 63.7 26.5 ± 14 0.44 ± 0.07
monium, Table 2 and Kitaka, pers. obs.) or at loweraltitude and so more agricultural (Little gilgil) or urban(Gilgil, below the town of the same name). Nitrate wasgenerally low. The general chemical characteristics ofthe main rivers were otherwise similar (Tables 3–5).
The means hid considerable seasonal changes. TheTP of three headwater streams show (Fig. 4) that twoof them – the Little gilgil and the Turasha, had elev-ated levels three times higher than the means at thebeginning of the heavy rainy season (see Fig. 1) butless as the season progressed. The wet season broughta higher proportion of particulate phosphorus, as aconsequence of soil erosion and sediment transport.The regressions of TP and PP against TSS were strongfor the Little gilgil (TP R2 0.97, p < 0.0001; PP R2
0.98, p < 0.001), not significant at the Turasha (TP R2
0.15, n.s.; PP R2 0.27, n.s.), and non-existent for theNyambugi (Fig. 5), most likely because of high valuesof phosphorus at low discharges.
The effect of seasonal fluctuation of discharge onchemical composition is more clearly seen in the mainrivers. In the Malewa, suspended sediment increasedwith discharge (Fig. 6). Most phosphorus was boundinto the TSS (Fig. 7), because most of the phosphorusis particulate (Fig. 8).
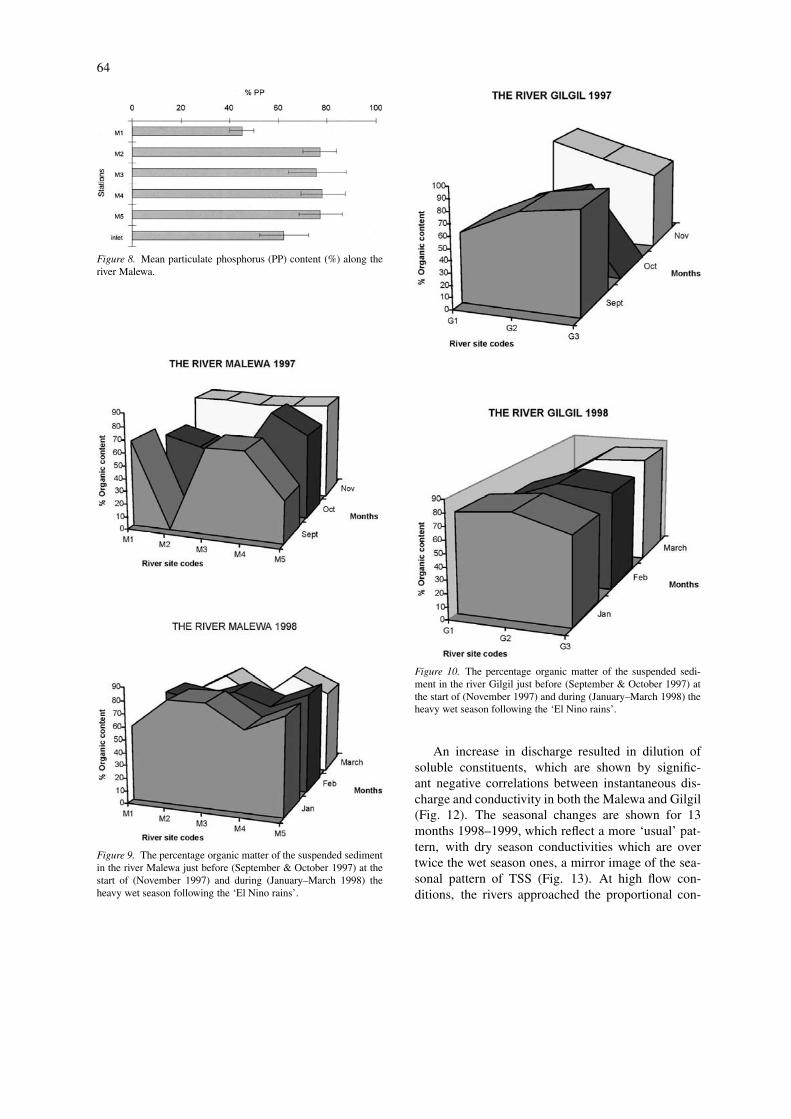
The TSS was mostly organic in all the three of themain rivers, with higher values at the start of the rainyseason than at its middle to end (Figs 9–11), Therewas an indication of higher organic content percent-ages in the upper and the middle-course stations in allthe three rivers. (The Karati in September and October1997 and the Gilgil in October were dry with pools inplaces).

62
Figure 3. Mean total phosphorus (TP) concentrations in the Naivasha headwater streams, together with the Malewa (M3) and Gilgil (G2) forcomparison.
Figure 4. Variation of TP and the percentage of PP in three of the headwater streams, before and during the heavy rainy season of 1997–1998.

63
Figure 5. Regressions between forms of phosphorus and suspended solids in three upper catchment streams.
Figure 6. The relationship between instantaneous discharge and TSS in the river Malewa.
Figure 7. The correlation of suspended solids (TSS) and PP in the river Malewa.
64
Figure 8. Mean particulate phosphorus (PP) content (%) along theriver Malewa.
Figure 9. The percentage organic matter of the suspended sedimentin the river Malewa just before (September & October 1997) at thestart of (November 1997) and during (January–March 1998) theheavy wet season following the ‘El Nino rains’.
Figure 10. The percentage organic matter of the suspended sedi-ment in the river Gilgil just before (September & October 1997) atthe start of (November 1997) and during (January–March 1998) theheavy wet season following the ‘El Nino rains’.
An increase in discharge resulted in dilution ofsoluble constituents, which are shown by signific-ant negative correlations between instantaneous dis-charge and conductivity in both the Malewa and Gilgil(Fig. 12). The seasonal changes are shown for 13months 1998–1999, which reflect a more ‘usual’ pat-tern, with dry season conductivities which are overtwice the wet season ones, a mirror image of the sea-sonal pattern of TSS (Fig. 13). At high flow con-ditions, the rivers approached the proportional con-

65
Table 3. Chemical characteristics of the Malewa river
Station Location Distance Altitude pH Alkalinity Total hardness Ca hardness
code km from (m.a.s.l.) mg l−1 as mg l−1 as mg l−1 as
lake CaCO3 CaCO3 CaCO3
M1 Upstream Ol Kalou 68 2360 7.98 ± 0.4 46 ± 10 26.2 ± 3.99 17.7 ± 2.7
M2 Gilgil pump house 35.5 2222 7.67 ± 0.3 49.8 ± 6.5 26.8 ± 2.6 18.1 ± 1.8
M3 Turasha ridge 30.5 2012 7.69 ± 0.3 48.4 ± 4.7 27.4 ± 2.4 17.4 ± 1.9
settlement
M4 Naivasha-Nakuru 10.5 1903 7.44 ± 0.2 57.8 ± 9.9 27.6 ± 2.1 19.0 ± 2.5
road bge
M5 Marula 2.5 1890 7.69 ± 0.2 50.6 ± 6.2 27.4 ± 2.0 19.2 ± 2.5
Mean ± standard error (n = 16).
Figure 11. The percentage organic matter of the suspended sedi-ment in the river Karati just before (September & October 1997) atthe start of (November 1997) and during (January–March 1998) theheavy wet season following the ‘El Nino rains’.
centration of the upper catchment streams; about 4–5times the concentration of rainwater in the catchment(mean conductivity 10.6 µS cm−1, n = 8).
The patterns of the phosphorus forms in the tworivers were dissimilar (Fig. 14). Total phosphorusmore closely followed the rainfall pattern (see Fig. 1)
than discharge, with dissolved phosphorus more oftenthe predominant form in low flows and particulate inhigh flows.
The daily loss of TP from the catchment reachedover 4 × 10³ kg day−1 at the beginning of the heavyrainy season in late 1997 (Fig. 15) and, althoughstrongly correlated with discharge (Fig. 16), fell ten-fold in the later part of the season in early 1998.At its height in 1997, this phosphorus loss was 75–95% particulate, but in the more normal dischargesof 1998–1999 the loss of soluble and particulate wasalmost equal (mean 41 and 42 kg day−1), respectively(Fig. 17). These gave an annual phosphorus loss of1.8 kg ha−1 ann−1, 90% particulate, in the ‘El Niño’year and 0.2 kg ha−1 ann−1, 76% particulate in the‘normal’ year.
Sediment phosphorus, from 8 headwater streams,averaged 0.47 TP mg g−1 dry wt sediment and ironcontent 51.3 mg g−1 dry wt., giving a mean ratio of109 Fe:P.
Discussion
The calculated catchment losses are derived from reg-ular samplings. They spanned a heavy rainfall periodby chance, but the sample frequency must be borne inmind when considering the annual loss estimate. Pa-cini (1994) found, from intensive study of a catchmentdraining eastwards from the Nyandarua, that a singleday exported 10% of the annual TP loss and about75% of the TP and SS losses occurred during the rainyevents.
The background composition of the river watermatches the scenario described for rivers drainingmature, leached tropical soils (Viner, 1975; Faniran

66
Table 4. Chemical characteristics of the Gilgil river
Station Location Distance Altitude pH Alkalinity Total Ca hardness
code km from (m.a.s.l.) mg l−1 as hardness mg l−1 as
lake CaCO3 mg l−1 as CaCO3
CaCO3
G1 Gilgil 3.0 2012 7.96 ± 0.2 38.7 ± 7.2 17.68 ± 2.0 11.05 ± 1.4
(0)
G2 North lake road 15.0 1950 7.54 ± 0.2 47.3 ± 5.4 21.85 ± 3.3 15.35 ± 3.4
(15.0)
G3 Marula 2.0 1890 7.48 ± 0.2 55.1 ± 3.3 24.44 ± 2.6 14.97 ± 1.4
(28.0)
Mean ± standard error (n = 16).
Figure 12. The relationship between instantaneous discharge and conductivity in the rivers Malewa (A) and Gilgil (B).
& Areola, 1978). The catchment lies in a volcanicarea consisting of trachytes, alkaline basalt and phon-olites with acid to alkaline soils (Odingo, 1971) andthe drainage chemistry similar to Kilham’s ‘common’African rivers (Kilham, 1972) in contrast with more
‘rain-dominated’ catchments such as found in theAmazon basin (Gibbs, 1970).
The Naivasha rivers and streams have more phos-phorus concentration than the 10 µg l−1 (SRP) or25 µg l−1 (TDP) calculated by Meybeck (1982)from unpolluted rivers world-wide. Phosphorus in the

67
Table 5. Chemical characteristics of the Karati river
Station Location Distance Altitude pH Alkalinity Total Ca Mg mg l−1 Ca mg l−1
code km from (m a.s.l.) mg 1−1 as hardness hardnesslake CaCO3 mg l−1 as mg l−1 as
CaCO3 CaCO3
K1 Karati Mission 33.5 2745 7.00 ± 0.3 85.5 ± 15.1 39.4 ± 5.5 25.5 ± 5.1 10.5 ± 2.1 15.2(0)
K2 Karati centre 15 2134 6.69 ± 0.4 96.8 ± 4.5 44.3 ± 6.8 33.3 ± 8.7 11.0 ± 1.7 17.8(18.5)
K3 Nakuru road 5.5 1903 7.27 ± 0.3 104.2 ± 13.5 48.9 ± 5.5 35.8 ± 5.8 10.6 ± 2.1 19.6(28.0)
K4 Delamere 0.5 1890 7.49 ± 0.4 140.2 ± 18.9 48.9 ± 8.2 35.8 ± 8.2 18.5 ± 3.6 19.6(33.0)
Mean ± standard error (n = 16).
Figure 13. The seasonal pattern of conductivity and TSS in the river Malewa, between 1998 and 1999. The rainy season and high dischargeswere at the beginning (the heavy rains) and end of this period (‘normal’ rains), the low discharge in the middle (see Fig. 1).

68
Figure 14. Seasonal pattern of TP and the different forms of phosphorus in the rivers Malewa and Gilgil (lower sites), 1998–99.
Figure 15. Daily losses of TP in kg, from the Malewa catchment, calculated for all days on which samples were analysed from the lower site,M5.

69
Figure 16. Correlation of daily TP with instantaneous discharge for the river Malewa.
Figure 17. Transport of the different forms of phosphorus in the river Malewa, kg day−1 1998–99.
Naivasha catchment has not previously been studiedand so comparisons are barely possible. Gaudet (1979)had measured the concentration of TP and PO4-P ofthe lower Malewa, as part of a large study of the chem-ical budget of the erstwhile C. papyrus North swamp,through which the river waters entered lake Naivasha.In 1975, his mean TP values were 40 µg l−1, soluble3 µg l−1. His study spanned a period of moderate riverdischarges (maximum monthly mean 24 m3 s−1) morecomparable with 1998–1999, when annual mean TPwas 3x Gaudet’s and SRP 6 × Gaudet’s PO4-P.
The rapid increase of TP at the start of the 1997rains yet decline during equally high discharge amonth or two later, suggests a phosphorus flush intothe rivers and streams as a result of surface erosion.Three quarters of the land in the catchment is cultiv-ated, intensively up to and even down the riverbanks.High surface runoff results in a rate of surface erosionincreased tenfold. The significant linear relationshipobtained between PP and TSS, as found elsewhere(Burwell et al., 1977; Nelson et al., 1979; Kronvang et
al., 1996), supports this. The importance of vegetationcover for reducing soil mobilization is indicated bythe lower TP and higher proportion of SRP in highercatchment streams, which compare with 62% SRPfrom grass watersheds on the southern plains area ofOklahoma and Texas (Sharply & Smith, 1990). In theKinangop plateau, only 1/4 of the land is pasture, car-rying livestock with a density estimated at 0.62 cowsper hectare, which is heavy (Simpson, pers. comm.).The lower catchment has a slightly lighter stockingdensity.
The TP export for the heavy rains (1997–1998) areat the upper end of figures produced for temperateagricultural land (Reckhow & Chapra, 1983) whilethe normal year (1998–1999) gave more acceptablelosses.
The catchment presently lies outside the desig-nated RAMSAR site of the lake, and outside anypresent land use management policies other thanKenya government advice to small farmers, which hasminimal environmental component. The future needs

70
of the lake basin can only be met if sustainable use ofthe catchment’s soil resource is an integral part of itsmanagement; the future needs of the rural populationcan only be met if they receive environmental as wellas economic advice for maintaining their agriculturalresource base. The two are identical and should betackled together.
Acknowledgements
This study formed past of the work of the Universityof Leicester research project at Lake Naivasha, whichsince 1987 has been authorised by the Office of thePresident, Government of Kenya under research per-mit to Dr D. M. Harper no. OP 13/001/12C 46. Theproject was funded by the Earthwatch Institute, Bo-ston U.S.A. and Oxford, England. The data collectionwould not have been possible without the assistance ofnumerous Earthwatch volunteers or the facilities at theerstwhile Elsamere Conservation Centre. Our sincerethanks go to the numerous colleagues in Kenya forlogistical help, in particular Jill & Angus Simpson andVelia Carn, and Chris Campbell Clause.
References
Ase, L-E., K. Sernbo & P. Syren, 1986. Studies of Lake Naivasha,Kenya and its Drainage Area. Forkningsrapporter 63, Stock-holms Universitet Naturgeografiska Institutionen, Stockholm: 75pp.
Burwell, R. E., G. E. Schuman, H. G. Heinemann & R. G. Spomer,1977. Nitrogen and phosphorus movement from the agriculturalwatersheds. J. Soil Wat. Conserv. 32: 226–230.
Calamari, D., 1987. Water quality problems in Africa: a brief report.Int. J. Environ. Studies 29: 3–8.
Dean, W. E., 1974. Determination of carbonate and organic matterin calcareous sediments and sedimentary rocks by loss on igni-tion. Comparison with other methods. Journal of SedimentaryPetrology 44: 242–248.
Dejoux, C., 1988. La Pollution des Eaux Continentales Africaines.Éditions de l’ORSTOM, Collection Travaux et documents no213, Paris: 513 pp.
Downing, T. E., S. Lezberg, C. Williams & L. Berry, 1990. Pop-ulation change and environment in central and eastern Kenya.Environ. Conserv. 17 (2): 123–133.
Dregne, H. E., 1990. Erosion and soil productivity in Africa. J. SoilWat. Conserv. 45 (4): 431–436.
Faniran, A. & O. Areola, 1978. Essentials of Soil Study (withspecial reference to tropical areas). Heinemann, London: 278 pp.
Fardeau, J. C. & E. Frossard, 1991. Processus de transformationsdu phosphore dans les sols de l’Afrique de l’ouest semi-aride:application du phosphore assimilable. In Tiessen H. & Frossard(eds), Phosphorus Cycling in Terrestrial and Aquatic Ecosys-tems, Proceedings of a SCOPE/UNEP Workshop (Nairobi 18–22March 1991). Vol. 4 Africa: 108–128.
Gaudet, J. J., 1976. Nutrient relationships in the detritus of a tropicalswamp. Archiv. Hybrobiol. 78: 213–239.
Gaudet, J. J., 1977. Natural draw-down of Lake Naivasha, Kenyaand the origin of papyrus swamps. Aquat. Bot. 3: 1–17.
Gaudet, J. J., 1979. Seasonal changes in nutrients in tropical swampwater. J. Ecol. 67: 953–981.
Gibbs, R., 1970. Mechanisms controlling world water chemistry.Science 170: 1088–1090.
Harper, D. M., G. Phillips, A. Clivers, N. Kitaka & K. M. Mavuti,1993. Eutrophication prognosis for Lake Naivasha, Kenya. Verh.int. Ver. für Theor. Ang. Limnol. 14: 192–195.
Hecky, R. E., 1993. The eutrophication of lake Victoria. Verh. int.Ver. für Theor. Ang. Limnol. 25: 39–48.
Hinga, G., 1973. Phosphate sorption capacity in relation to prop-erties of several types of Kenyan soil. East African Agriculturaland Forestry Journal 38: 400–404.
Jones, M. E., 1979. Rainfall intensities of East African storms. EastAfrican Agriculture and Forestry Journal 43: 261–264.
Kilham, P., 1972. Biogeochemistry of African Lakes and Rivers.PhD thesis, Duke University, Durham, North Carolina: 199 pp.
Kronvang, B., A. Laubel & R. Grant, 1996. Transport of sedimentand phosphorus in the Aarable Gelbaæk catchment, Denmark. InProceeding of Sediment and Phosphorus Workshop in Denmark.N.E.R.I Technical Report 178: 89–92.
Lennox, S. D., R. H. Foy, R. V. Smith & C. Jordan, 1997. Estim-ating the contribution from agriculture to the phosphorus loadin surface water. In Tunney, H. O. T. Caton, P. C. Brookes &A. E. Johnston (eds), Phosphorus Loss from Soil to Water. CABInternational: 55–75.
Mackereth, F. J. H., J. Heron & J. F. Talling, 1989. Water Analysis.Freshwater Biological Association, Windermere, U.K.: 120 pp.
Melack, J. M., 1976. Limnology and Dynamics of Phytoplankton inEquatorial African Lakes. PhD thesis, Duke University, Durham:453 pp.
Melack, J. M., P. Kilham & T. R Fisher, 1982. Responses ofphytoplankton to experimental fertilization with ammonium andphosphate in an African soda lake. Oecologia 52: 321–326.
Melack, J. M. & S. MacIntyre, 1991. Phosphorus concentrations,supply and limitation in tropical african lakes and rivers inPhosphorus cycling in terrestrial and aquatic ecosystems. In Tis-sen, H. & H. Frossard (eds), Proceedings of a SCOPE/UNEPWorkshop (Nairobi 18–22 March 1991). Vol. 4 (Africa): 1–17.
Meybeck, M., 1982. Carbon, nitrogen & phosphorus transport byworld rivers. Am. J. Sci. 282: 401–450.
Nelson, D. W., E. J. Monke, A. D. Bottcher & L. E. Sommers, 1979.Sediment and nutrient contributions to the Maumee River froman agricultural watershed. In: Loehr, R. G., D. A. Haith, M.F. Walter & C. S. Martin (eds), Best Management Practises ofAgriculture and Salviculture. Ann. Abor. New York: 491–505.
Njuguna, S. G., 1982. Nutrient-Productivity Relationship in Trop-ical Naivasha Basin Lakes, Kenya. PhD thesis, University ofNairobi: 300 pp.
Nürnberg, G. K., 1988. Prediction of phosphorus release rates fromtotal and reductant-soluble phosphorus in anoxic lake sediments.Can. J. Fish. aquat. Sci. 45: 453–462.
Nyandat, N., 1981. The primary minerals in some Kenya’s top-soil and their significance to inherent soil fertility. East AfricaAgriculture and Forestry Journal 46: 71–76.
Odingo, R. S., 1971. The Kenya Highlands: Land-use and Agricul-tural Development. East Africa Publishers House, Nairobi: 226pp.
Pacini, N., 1994. Coupling of Land and Water; Phosphorus Fluxesin the Upper Tana RiverCatchment, Kenya. Ph.D. Thesis. Uni-versity of Leicester. U.K.: 176 pp.

71
Pacini, N. & D. M. Harper, 1999. Phosphorus transport from a trop-ical catchment and implications for sustainable catchment man-agement. In Harper, D. M. & A. G. Brown (eds), The SustainableManagement of Tropical Catchments. Wiley, Chichester: 61–76
Peters, R. H. & S. MacIntyre 1976. Orthophosphate turnover in EastAfrican lakes. Oecologia (Berl) 25: 313–319.
Reckhow, K. H. & S. C. Chapra 1983. Engineering Approachesfor Lake Management: Vol.1. Data Analysis and EmpiricalModeling, Butterworth Publishers, Boston.
Roseboom & Lotriet, 1993 A new sediment yield map for southernAfrica, erosion and transport monitoring programmes in riverbasins. Proceedings of the Oslo Symposium, August 1992, IAHSPubl. No. 210: 527–538.
Sharpley, A. N. & S. J. Smith, 1990. Phosphorus transport in ag-ricultural runoff. The role of erosion. In Bardman, J., I. D. L.Foster & J. A. Dearing (eds), Soil Erosion on Agricultural Land.J. Wiley and Sons Ltd: 352–366.
Sharpley, A. N. & Syers, 1979. Phosphorus inputs into a streamdraining an agricultural watershed. Wat. Air Soil Poll. 11: 417–428.
Smaling, E. M. A., 1993. An Agro-ecological Framework for In-tegrated Nutrient Management with Special Reference to Kenya.Ph.D. Thesis, Agricultural University of Wageningen, Nether-lands.
Smaling, E. M. A. & J. Bouma, 1982. Bypass flow and leaching ofnitrogen in a Kenyan vertisol at the onset of the growing season.Soil Use and Management 8: 44–48.
Talling, J. F. & I. B. Talling, 1965. The chemical composition ofAfrican Lakes waters. Int. Rev. ges. Hydrobiol. 50: 421–463.
Viner, A. B., 1975. The supply of minerals to tropical rivers andlakes (Uganda). In Hasler, A. D. (ed.), Coupling of Land andwater systems. Springer Verlag, New York, Ecological Studies10: 227–261.
Viner, A. B., 1987. Nutrients transported on silt in rivers. Archiv.Hydrobiol. Beih. (Ergebnisse der Limnologie) 28: 63–71.
Wolf, A. M., D. E. Baker, H. B. Pionke & H. M. Kunishi, 1985.Soil tests for estimating labile, soluble, and algae-available phos-phorus in agricultural soils. J. Environ. Qual. 14 (3): 341–348.