
CHEMICAL APPLICATIONS OF INELASTIC X-RAY SCATTERING
75
BNL- 68406 CHEMICAL APPLICATIONS OF INELASTIC X-RAY SCATTERING H. Hayashi and Y. Udagawa Research Institute for Scientific Measurements Tohoku University Sendai, 980-8577, Japan J.-M. Gillet Structures, Proprietes et Modelisation des Solides UMR8580 Ecole Centrale Paris, Grande Voie des Vignes, 92295 Chatenay-Malabry Cedex, France W.A. Caliebe and C.-C. Kao National Synchrotron Light Source Brookhaven National Laboratory Upton, New York, 11973-5000, USA August 2001 National Synchrotron Light Source Brookhaven National Laboratory Operated by Brookhaven Science Associates Upton, NY 11973 Under Contract with the United States Department of Energy Contract Number DE-AC02-98CH10886
Transcript of CHEMICAL APPLICATIONS OF INELASTIC X-RAY SCATTERING

BNL- 68406
CHEMICAL APPLICATIONS OF INELASTIC X-RAY SCATTERING
H. Hayashi and Y. Udagawa Research Institute for Scientific Measurements
Tohoku University Sendai, 980-8577, Japan
J.-M. Gillet Structures, Proprietes et Modelisation des Solides UMR8580
Ecole Centrale Paris, Grande Voie des Vignes, 92295 Chatenay-Malabry Cedex, France
W.A. Caliebe and C.-C. Kao National Synchrotron Light Source Brookhaven National Laboratory
Upton, New York, 11973-5000, USA
August 2001
National Synchrotron Light Source
Brookhaven National Laboratory Operated by
Brookhaven Science Associates Upton, NY 11973
Under Contract with the United States Department of Energy Contract Number DE-AC02-98CH10886

DISCLAIMER
This report was prepared as an account of work sponsored by an agency of the United States Government. Neither the United States Government nor any agency thereof, nor any of their employees, nor any of their contractors, subcontractors or their employees, makes any warranty, express or implied, or assumes any legal liability or responsibility for the accuracy; completeness, or any third party’s use or the results of such use of any information, apparatus, product, or process disclosed, or represents that its use would not infringe privately owned rights. Reference herein to any specific commercial product, process, or service by trade name, trademark, manufacturer, or otherwise, does not necessarily constitute or imply its endorsement, recommendation, or favoring by the United States Government or any agency thereof or its contractors or subcontractors. Th.e views and opinions of authors expressed herein do not necessarily state or reflect those of the United States Government or any agency thereof.

CHEMICAL APPLICATIONS OF INELASTIC X-RAY SCATTERING
H. Hayashi*, Y. Udagawa Research Institute for Scientific Measurements, Tohoku University, Sendai, 980-8577, Japan
J.-M. Gillet Structures, PropriCtCs et Modelisation des Solides, UMR8580
Ecole Centrale Paris, Grande Voie des Vignes, 92295 Chatenay-Malabry Cedex, France
W.A. Caliebe, C.-C. Kao National Synchrotron Light Source, Brookhaven National Laboratory, Upton, New York 11973,
U.S.A.
I. INTRODUCTION . . . . . . . . . . . . . . . . . . . . . . . . . . . . . . . . . . . . . . . . . . . . . . . . . . . . . . . . . . . . . . . . . . . . . . . . . . . . . . . . . . . . . . . . . . . . . . . . . . . . . . . . . . . . . . . . . . . . . . . . ....................~. 2
II. THEORETICAL BACKGROUND . . . . . . . . . . . . . . . . . . . . . . . . . . . . . . . . . . . . . . . . . . . . . . . . . . . . . . . . . . . . . . . . . . . . . . . . . . . . . . . . . . . . . . . . . . . . . . . . . . . . . . . . . . ..~. 3
III. EXPERIMENTAL CONFIGURATIONS . . . . . . . . . . . . . . . . . . . . . . . . . . . . . . . . . . . . . . . . . . . . . . . . . . . . . . . . . . . . . . . . . . . . . . . ..*......................... 5
Iv. APPLICATIONS . . . . . . . . . . . . . . . . . . . . . . . . . . . . . . . . . . . . . . . . . . . . . . . . . . . . . . . . . . . . . . . . . . . . . . . . . . . . . . . . . . . . . . . . . . . . . . . . . . . . . . . . . . . . . . . . . . . . . . . . ................... 9
A. 1. 2. 3. 4.
B. 1. 2. 3. 4. 5.
C. 1. 2. 3. 4. 5.
X-RAY RAMAN SCATTERING ...................................................................................................................... .9 General description ..................................................................................................................................... 9 Excitations of inner shell electrons: X4NES, E;xAFS, polarization dependence.. .................................... 11 Excitations of valence electrons : Bethe su$aces and complete optical spectra of water.. ...................... 11 S(q;) and electron correlation effects.. ....................................................................................................... 13 ‘RESONANT RAMAN AND RESONANT INELASTIC SCATTERING ................................................................... 14 X-ray Resonant Raman Scattering.. .......................................................................................................... 14 Many electron efsects in XRRS .................................................................................................................. 16 Magnetic sensitivity in XRRS .................................................................................................................... 16 X-ray Resonant Inelastic Scattering .......................................................................................................... 17 Example: RlxS in NiO .............................................................................................................................. 18 COMPTON SCATTERING. ............................................................................................................................ 19 Theo y and approximations. ..................................................................................................................... 19 Sharp feature for valence electrons: relevance to chemical bonding ...................................................... .21 Kinetic energy. .......................................................................................................................................... 22 Technical issues in the interpretation of Compton proJi1e.s ...................................................................... .23 Examples and applications. ..................................................................................................................... .24
V. CONCLUSIONS . . . . . . . . . . . . . . . . . . . . . . . . . . . . . . . . . . . . . . . . . . . . . . . . . . . . . . . . . . . . . . . . . . . . . . . . . . . . . . . . . . . . . . . . . . . . . . . . . . . . . . . . . . . . . . . . . . . . . . . . . ................. 27
*Present address: National Synchrotron Light Source

I. Introduction
Inelastic x-ray scattering (IXS), complementary to other more established inelastic scattering probes, such as light scattering, electron scattering, and neutron scattering, is becoming an important experimental technique in the study of elementary excitations in condensed matters. Over the past decade, IXS with total energy resolution of few meV has been achieved, and is being used routinely in the study of phonon dispersions in solids and liquids as well as dynamics in disordered and biological systems. In the study of electronic excitations, IXS with total energy resolution on the order of 100 meV to 1 eV is gaining wider applications also. For example, IXS has been used to study collective excitations of valence electrons, single electron excitations of valence electrons, as well as core electron excitations.
In comparison with the alternative scattering techniques mentioned above, IXS has several advantages. First, IXS probes the full momentum transfer range of the dielectric response of the sample, whereas light scattering is limited to very small momentum transfers, and electron scattering suffers the effects of multiple scattering at large momentum transfers. Second, since IXS measures the bulk properties of the sample it is not surface sensitive, therefore it does not require special preparation of the sample. The greater flexibility in sample conditions and environments makes IXS an ideal probe in the study of liquids and samples under extreme temperature, pressure, and magnetic field. Third, the tunability of synchrotron radiation sources enables IXS to exploit element specificity and resonant enhancement of scattering cross sections. Fourth, IXS is unique in the study of dynamics of liquids and amorphous solids because it can probe the particular region of energy-momentum transfer phase space, which is inaccessible to inelastic neutron scattering. On the other hand, the main disadvantages of IXS are the small cross sections and the strong absorption of x-rays in high Z elements.
In the high momentum transfer limit, IXS evolves into the well-known Compton scattering regime. In this case, the inelastic scattering cross section, instead of providing information about excited states of the system, can be used to determine the ground state momentum distribution of the valence electrons. Compton profiles also provide rigorous tests on the accuracy of the wavefunctions obtained from advanced electronic structure calculations. With synchrotron sources, momentum resolution of 0.1 to 0.15 atomic unit (a.u.) can be achieved. Three dimensional momentum distributions of valence electrons of a number of solids have been reconstructed. Recently, momentum resolution of 0.01 a.u. has been demonstrated using lower energy x-rays. Although the relatively low photon energy limits the selection of samples to a few low Z elements, this unprecedented momentum resolution nevertheless provides a unique opportunity to the study of Fermi surfaces related features and electron correlation effects in Compton profiles.
There have been several reviews of IXS in the literature. For meV resolution and the study of phonon with x-rays, there is the review by Burke1 in 199 1 [Burkel91]. For the latest developments, the readers should look into recent works by Sette’s group at European Synchrotron Radiation Facility [Sette]. For electronic excitations, there is the review by Schulke in Vol. 3 of Handbook on Synchrotron Radiation in 1991 [Schulkeg 11. And, for Compton
2

scattering, the interested readers are advised to consult the reviews by [Cooper851 and [Schulke91], as well as the monograph edited by [Williams77].
Due to the development of high flux and brightness insertion devices and the construction of several dedicated IXS beamlines at several synchrotron radiation facilities around the world, there has been a rapid growth in experimental activities. These experimental works, in turn, have stimulated many theoretical works. The advantages of IXS mentioned above have also been exploited to address important issues in a growing list of scientific disciplines. It is the purpose of this chapter to review these recent developments in IXS and their applications. In this chapter, we will focus on the study of electronic excitations in condensed matter with total energy resolution of 100 meV to 1.0 eV. We will also review Compton scattering with an emphasis on its applications to chemical physics.
The rest of this chapter is organized as follows: the kinematics of IXS and the derivation of the double differential scattering cross section are given in section II. Experimental configurations for different types of IXS experiments are briefly summarized in section III. Applications of IXS are reviewed in section IV. This section is further divided into several subsections based on the approximations applicable in different momentum transfer and energy transfer regimes. In each subsection, the specific information, which can be obtained from IXS within those approximations, is illustrated using selected examples. Section V summarizes the present status and future prospect of IXS.
II. Theoretical background.
The kinematics of a typical IXS experiment is illustrated in figure 1. The incident x-ray beam with energy Ao, , momentum fiG1, and polarization Z1 is scattered by the sample. At scattering
angle 28, the intensity of the scattered x-ray beam, characterized by energy AU,, momentum
AC2 and polarization &, is measured. The energy transferred to the system, Aw , is given by
Aw = Ww, - Aw,, and the momentum transferred to the system, q, is given by 4’ = AK1 - fi~?~ . If the energy transfer is much smaller than the incident energy, i.e. Aw << Acol then the momentum transfer can be simplified by the following expression,
4flsin(8) 4= iI (1)
To derive the double differential scattering cross section (DDSCS), we start by describing the Hamiltonian for a system of charged particles in the presence of an electromagnetic field. Within Coulomb gauge, the Hamiltonian takes the following form [Cohen88]:
where Vcoul is the electrostatic interaction between the charge particles, and HR is the energy carried by the field. These two terms are intrinsic to the isolated subsystems. The charged particle-photon interactions are taken into account by the first two terms in the Hamiltonian, where
HM=- c
B$ Is,.@) (3) i
i
represents the magnetic interaction between the spin of the particles, $ and the magnetic
component of the radiation field, $7 (gi is the land&factor, qi is the charge of particle i with
the mass m,), and
is the kinetic energy part of the particles, 3 and pi being the electron position and
operators, respectively. The second interaction term, HI, is usually the dominant interaction Hamiltonian, and can be quadratic in vector potentiali,
(4)
momentum term in the
(5)
or linear in 2
(6)
Taking
where a, and a: are annihilation and creation photons operators respectively, quantization volume.
(7)
and L’ the
Restricting ourselves to linear processes, the following expression of DDSCS for inelastic x-ray scattering can be obtained [Blum85] [Schulke91]:
4
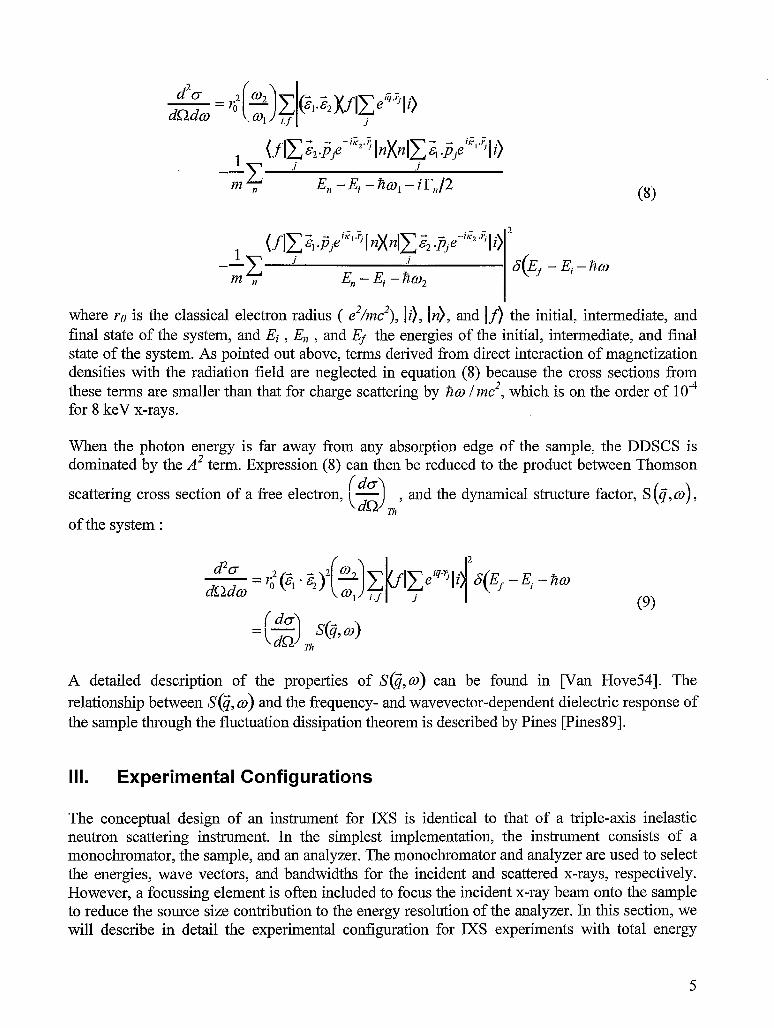
where ~0 is the classical electron radius ( e2/mc2), Ii), In), and If> the initial, intermediate, and final state of the system, and Ej , En , and Ef the energies of the initial, intermediate, and final state of the system. As pointed out above, terms derived from direct interaction of magnetization densities with the radiation field are neglected in equation (8) because the cross sections from these terms are smaller than that for charge scattering by Aw / mc2, which is on the order of 10m4 for 8 keV x-rays.
When the photon energy is far away from any absorption edge of the sample, the DDSCS is dominated by the A2 term. Expression (8) can then be reduced to the product between Thomson
scattering cross section of a free electron,
of the system :
and the dynamical structure factor, S (q, c.> ,
A detailed description of the properties of S(G,o) can be found in [van Hove54]. The
relationship between S(G, w) and the frequency- and wavevector-dependent dielectric response of the sample through the fluctuation dissipation theorem is described by Pines [Pines89].
III. Experimental Configurations
The conceptual design of an instrument for IXS is identical to that of a triple-axis inelastic neutron scattering instrument. In the simplest implementation, the instrument consists of a monochromator, the sample, and an analyzer. The monochromator and analyzer are used to select the energies, wave vectors, and bandwidths for the incident and scattered x-rays, respectively. However, a focussing element is often included to focus the incident x-ray beam onto the sample to reduce the source size contribution to the energy resolution of the analyzer. In this section, we will describe in detail the experimental configuration for IXS experiments with total energy
5

resolution of 0.1 to 1eV. Experimental configurations for IXS experiments with total energy resolution of few meV and high resolution Compton scattering will be discussed only briefly.
In the design of a high-energy resolution beamline for IXS, the most important factor to optimize is photon flux on the sample because of the small inelastic scattering cross section. With increasingly higher energy resolution, beam size on the sample also plays an important role. Energy stability is a third factor, especially for resonant Raman scattering and resonant inelastic scattering. On the other hand, momentum resolution requirement for IXS instrument is not as stringent as that for synchrotron high momentum resolution scattering instrument [Hastings78].
An example is X21 beamline at the National Synchrotron Light Source (NSLS). The radiation source of the beamline is a 27-pole hybrid wiggler. The beamline consists of a four-bounce Si(220) monochromator and a focusing mirror. A schematic of the monochromator and the mirror is shown in figure 2a. The monochromator is a dispersive Si(220) four-crystal arrangement with miscut angle of -16, 0, 0, +16 degrees, respectively, as shown in figure 2b. The particular choice of crystal arrangement, Si reflection, and miscut angles are results of optimization among the following conflicting factors: large vertical acceptance, wide energy tunability, and high-energy resolution. With these parameters, the tuning range of the monochromator is between 5 to 10 keV and the energy resolution is about 0.2 eV throughout the whole tuning range. The monochromatic beam is doubly focused by a one-meter long bent cylindrical mirror. The focal spot is 0.3mm (V) X 0.5mm (H) [Caliebe 97][Caliebe97a]. The tunability of the monochromator covers the K edges of most of the 3d transition elements and the L edges of most of the 4f rare earth elements. For meV resolution, similar monochromator design is used in many nuclear resonant scattering instruments [Hastings9 l] [Ishikawa92] [Seto95]. It has also been used in meV phonon dispersion experiments [Schwoerer-Bohning98]. However, most of the meV phonon instruments use monochromators operated at almost exact backscattering angle [Burke1911 [Sette] [B aronOO]. Finally, since the monochromator is the first optical element, the heat load on the monochromator crystal is a major concern. In many cases, especially undulator beamlines at third generation x-ray synchrotrons, a cryogenically cooled premonochromator or a water cooled diamond monochromator is added to remove the heat load on the high resolution monochromator.
As mentioned above, in the study of electronic excitations, incident x-ray energy between 5 to 10 keV is mostly used because the availability of analyzers with the appropriate bandwidth. Total energy resolution of 1 eV or fraction of an eV is routinely achieved. Energy resolution better than 100 meV has also been demonstrated recently [Krisch97]. In the following, two main types of optical arrangements are reviewed here. The first type of spectrometer is a Rowland circle focusing instrument. The second type of spectrometer is a cylindrical dispersive spectrometer.
In a Rowland circle spectrometer, the scattered x-rays, within a given energy bandwidth and solid angle, from the sample are collected and focused by a spherically bent crystal onto the detector. A schematic of this type of instrument is shown in figure 3. The inelastic scattering spectrum can be obtained by either scanning the incident energy or the analyzer energy.
The resolution of the spectrometer is a function of the crystal reflection, the Bragg angle, the source size, and lattice distortion. First, we consider the intrinsic resolution of the analyzer crystal and the source size contribution to the energy resolution. For perfect crystals, such as Si and Ge,
6
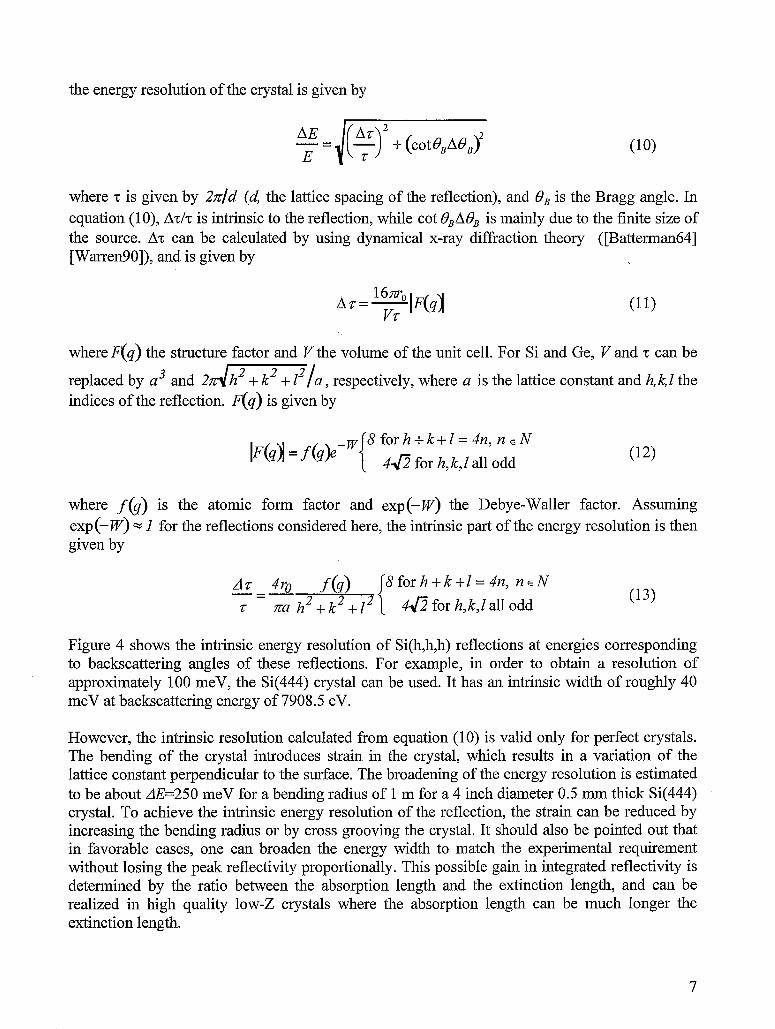
the energy resolution of the crystal is given by
2 +(cotB,A0,)2
where ‘c is given by 2x/d (d, the lattice spacing of the reflection), and 0, is the Bragg angle. In equation (lo), A& is intrinsic to the reflection, while cot &AL& is mainly due to the finite size of the source. Ar can be calculated by using dynamical x-ray diffraction theory ([Batterman64] [Warren90]), and is given by
where F(q) the structure factor and V the volume of the unit cell. For Si and Ge, V and -c can be
replaced by a3 and 2 r/ h + k + 2 a, respectively, where a is the lattice constant and h, k, I the indices of the reflection. flq) is given by
where f(q) is the atomic form factor and exp(-r) the Debye-Waller factor. Assuming exp(-w) = I for the reflections considered here, the intrinsic part of the energy resolution is then given by
AZ 4~ f(q) 8forh+k+-1=4n, neN -=- (13) z na h2+k2+li @ for h, k,l all odd
Figure 4 shows the intrinsic energy resolution of Si(h,h,h) reflections at energies corresponding to backscattering angles of these reflections. For example, in order to obtain a resolution of approximately 100 meV, the Si(444) crystal can be used. It has an intrinsic width of roughly 40 meV at backscattering energy of 7908.5 eV.
However, the intrinsic resolution calculated from equation (10) is valid only for perfect crystals. The bending of the crystal introduces strain in the crystal, which results in a variation of the lattice constant perpendicular to the surface. The broadening of the energy resolution is estimated to be about dE=250 meV for a bending radius of 1 m for a 4 inch diameter 0.5 mm thick Si(444) crystal. To achieve the intrinsic energy resolution of the reflection, the strain can be reduced by increasing the bending radius or by cross grooving the crystal. It should also be pointed out that in favorable cases, one can broaden the energy width to match the experimental requirement without losing the peak reflectivity proportionally. This possible gain in integrated reflectivity is determined by the ratio between the absorption length and the extinction length, and can be realized in high quality low-2 crystals where the absorption length can be much longer the extinction length.
7

Another important contribution to the total energy resolution of the spectrometer comes from the cot 6,AQ, term in equation (10). ABB in this case is determined by the source size ds and the distance between the sample and the analyzer crystal D , i.e. ABB = ds/D. Thus, it is clear that to achieve high-energy resolution one needs to operate the analyzer close to 90-degree Bragg angle and to reduce the source size on the sample by using focusing optics. For example, for a Bragg angle of 89”, a source size of 500 pm results in a contribution to the energy resolution of 70 meV at 8 keV, while the same source size would contribute 0.7 eV at 8 keV for a Bragg angle of 80 degree. Operating close to exact backscattering has also the benefit that the angular acceptance of a given reflection increases dramatically near 90 degree. These considerations are of particular importance for resonant inelastic scattering experiments since different reflections and crystals have to be used in order to work close to backscattering.
It is also important to consider momentum resolution of the spectrometer. Because of the low scattering cross section, IXS spectrometer is usually designed to optimize the solid angle of detection. Consequently, the momentum resolution is usually dominated by the size of the analyzer. Since the divergence of the incident beam has essentially no influence, focusing optics with large demagniflcations can be applied in the design of IXS beamlines. As an example, an analyzer diameter of 65 mm at a distance of 1 m accepts a solid angle of 0.26 msr. The momentum resolution is then given by
,kd 4
-;cote (14)
where d, is the diameter of the crystal analyzer, D the distance between the sample and the analyzer. The momentum resolution varies between Aq=O.275 a. u . at q=O.148 a. u . and Aq=O.O58 a. u , at q=4.14 a.u.. If the energy transfer of the experiment is not negligible in comparison with the incident energy then the contribution to momentum resolution from variation of either the incident energy or the scattered energy during the acquisition of the inelastic scattering spectrum has to be taken into account.
In contrast to the point to point focusing of the Rowland circle instrument, the whole inelastic spectrum can be recorded by a dispersive spectrometer, which typically uses a cylindrical analyzer in combination with a position sensitive detector (PSD). They are arranged so that both the axis of the cylinder as well as the PSD lie in the scattering plane. It has the advantage that the full inelastic scattering spectrum is recorded at the same time, and that there are fewer moving components. Depending on the choice of analyzer crystal, its distance to the sample, the Bragg angle, and the size of the position sensitive detector, the energy range covered by the dispersive spectrometer can be adjusted from several tens of eV [Larson961 to a few hundred eV [Tohji87]. Figure 5 shows a schematic of a dispersive spectrometer using cylindrical analyzer and a PSD lJJdagawa971. The same cylindrical analyzer and PSD can also be arranged so that both the axis of the cylinder as well as the PSD are perpendicular to the scattering plane. A schematic of this arrangement is shown in figure 6 [Hamalainen95]. In this case, smaller energy range is covered, but better energy resolution can be achieved.
For very high-resolution spectrometers, Rowland circle geometry is typically used. Cross- grooved analyzers are required in this case so that the intrinsic resolution of the analyzer crystal
8

can be obtained. However, the block size of the grooved analyzer also contributes to the geometric part of the total energy resolution, similar to source size consideration discussed before. Thus, in order to reduce the geometric contribution from the block size of the cross grooved analyzer, block size of 1 mm or less is typically used in combination. with a large bending radius. Bending radius ranging from 3 to 13 m has been used to achieve 7 meV to 1 meV total energy resolution [Schwoerer-Bohning981 [Burkel91][Sette].
For high resolution Compton scattering, incident energy of 30 to 90 keV is routinely used. Both dispersive type spectrometer and scanning type spectrometer have been developed for 0.1 to 0.15 a.u. resolution measurements. In the dispersive type spectrometer, because high energy x-rays are used, bent-crystal in the Laue geometry, the Cauchois-type bent-crystal, in combination with one or two dimensional position sensitive detectors is used [Sakurai92]~oupias80a]. In the scanning type spectrometer, bent cylindrical Bragg analyzer is used [Suortti99].
IV. Applications
A. X-ray Raman Scattering
1. General description
As described in section II, the dynamical structure factor S(q, W) in equation (9) can be related to the initial and the final states of the system by the following equation
(15)
where N is the total number of electrons and Efi is the energy difference between the initial and the final state.
Assuming that re is a measure of the spatial extent of the initial state wavefunction, then depending on the magnitude of qr,, different approximations can be made in the evaluation of the matrix elements in equation (15). These approximations also mean that IXS can be classified into different scattering regimes where different characteristic length scales probed by IXS. In the limit of qr, much larger than unity, the scattering is in the well-known Compton scattering regime [Williams771 , where single particle properties are probed. In this regime the overall spectrum is characterized by shifts with scattering angle. On the other hand, if qr, is much smaller than one, it is a good approximation to retain only the first non-vanishing term of the power-series expansion of the exponential in equation (15):
SG 4qr<<1 =+l$li~24~~-E~ * (16) This matrix element is the same as that obtained by making dipole approximation in photo- absorption or fluorescence processes except that polarization vector 2 is replaced by momentum transfer 4’. For isotropic systems, the scattering cross-section can be expressed after averaging over all orientations by
9
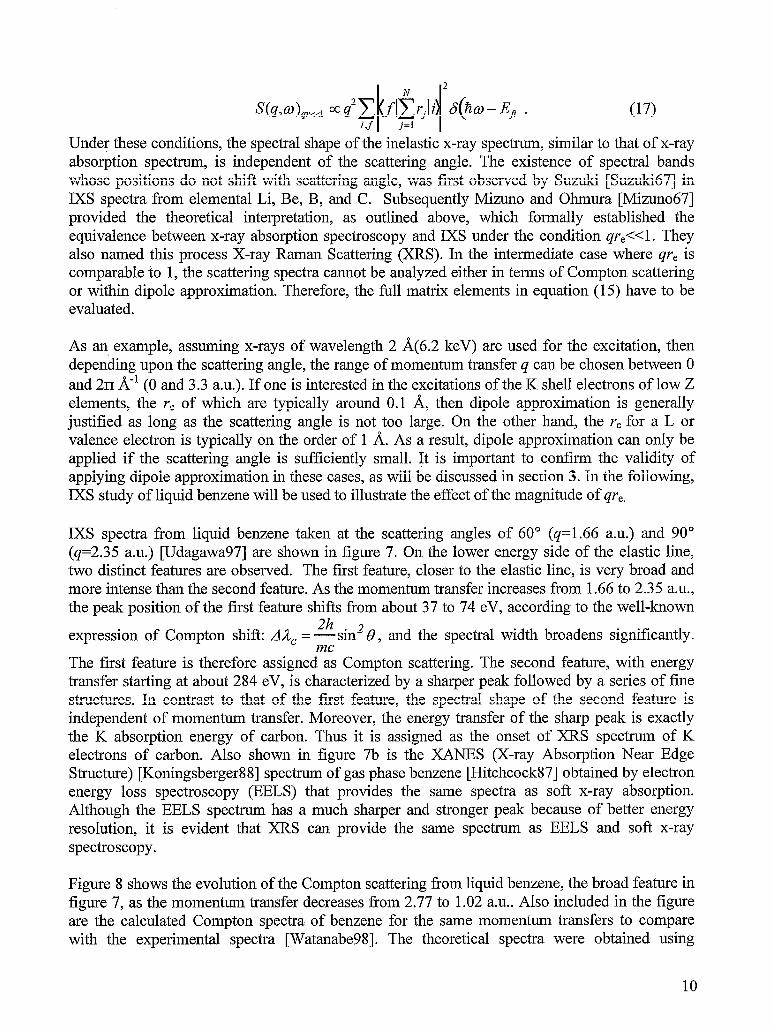
Under these conditions, the spectral shape of the inelastic x-ray spectrum, similar to that of x-ray absorption spectrum, is independent of the scattering angle. The existence of spectral bands whose positions do not shift with scattering angle, was first observed by Suzuki [Suzuki67] in IXS spectra from elemental Li, Be, B, and C. Subsequently Mizuno and Ohmura [Mizuno67] provided the theoretical interpretation, as outlined above, which formally established the equivalence between x-ray absorption spectroscopy and IXS under the condition qr,<<l. They also named this process X-ray Raman Scattering (XRS). In the intermediate case where qr, is comparable to 1, the scattering spectra cannot be analyzed either in terms of Compton scattering or within dipole approximation. Therefore, the full matrix elements in equation (15) have to be evaluated.
As an example, assuming x-rays of wavelength 2 A(6.2 keV) are used for the excitation, then depending upon the scattering angle, the range of momentum transfer q can be chosen between 0 and 21r A-i (0 and 3.3 a.u.). If one is interested in the excitations of the K shell electrons of low Z elements, the ye of which are typically around 0.1 A, then dipole approximation is generally justified as long as the scattering angle is not too large. On the other hand, the r, for a L or valence electron is typically on the order of 1 A. As a result, dipole approximation can only be applied if the scattering angle is sufficiently small. It is important to confirm the validity of applying dipole approximation in these cases, as will be discussed in section 3. In the following, IXS study of liquid benzene will be used to illustrate the effect of the magnitude of qr’,.
IXS spectra from liquid benzene taken at the scattering angles of 60” (q=1.66 a.u.) and 90” (q=2.35 a.u.) [Udagawa97] are shown in figure 7. On the lower energy side of the elastic line, two distinct features are observed. The first feature, closer to the elastic line, is very broad and more intense than the second feature. As the momentum transfer increases from 1.66 to 2.35 a.u., the peak position of the first feature shifts from about 37 to 74 eV, according to the well-known
expression of Compton shift: AL, = 2hsin2 0, and the spectral width broadens significantly.
The first feature is therefore assigned?: Compton scattering. The second feature, with energy transfer starting at about 284 eV, is characterized by a sharper peak followed by a series of fine structures. In contrast to that of the first feature, the spectral shape of the second feature is independent of momentum transfer. Moreover, the energy transfer of the sharp peak is exactly the K absorption energy of carbon. Thus it is assigned as the onset of XRS spectrum of K electrons of carbon. Also shown in figure 7b is the XANES (X-ray Absorption Near Edge Structure) [Koningsberger88] spectrum of gas phase benzene [HitchcockS obtained by electron energy loss spectroscopy (EELS) that provides the same spectra as soft x-ray absorption. Although the EELS spectrum has a much sharper and stronger peak because of better energy resolution, it is evident that XRS can provide the same spectrum as EELS and soft x-ray spectroscopy.
Figure 8 shows the evolution of the Compton scattering from liquid benzene, the broad feature in figure 7, as the momentum transfer decreases from 2.77 to 1.02 a.u.. Also included in the figure are the calculated Compton spectra of benzene for the same momentum transfers to compare with the experimental spectra [Watanabe98]. The theoretical spectra were obtained using
10
tabulated profiles [Eisenberger71]. Clearly, while the calculated spectrum reproduces the measured one at 2.77 a.u., noticeable deviation between the calculated and the measured spectrum can be observed at 1.96 a.u. already. Finally, the IXS spectrum at q=1.02 a.u. can no longer be considered as Compton scattering and must be analyzed in a different manner.
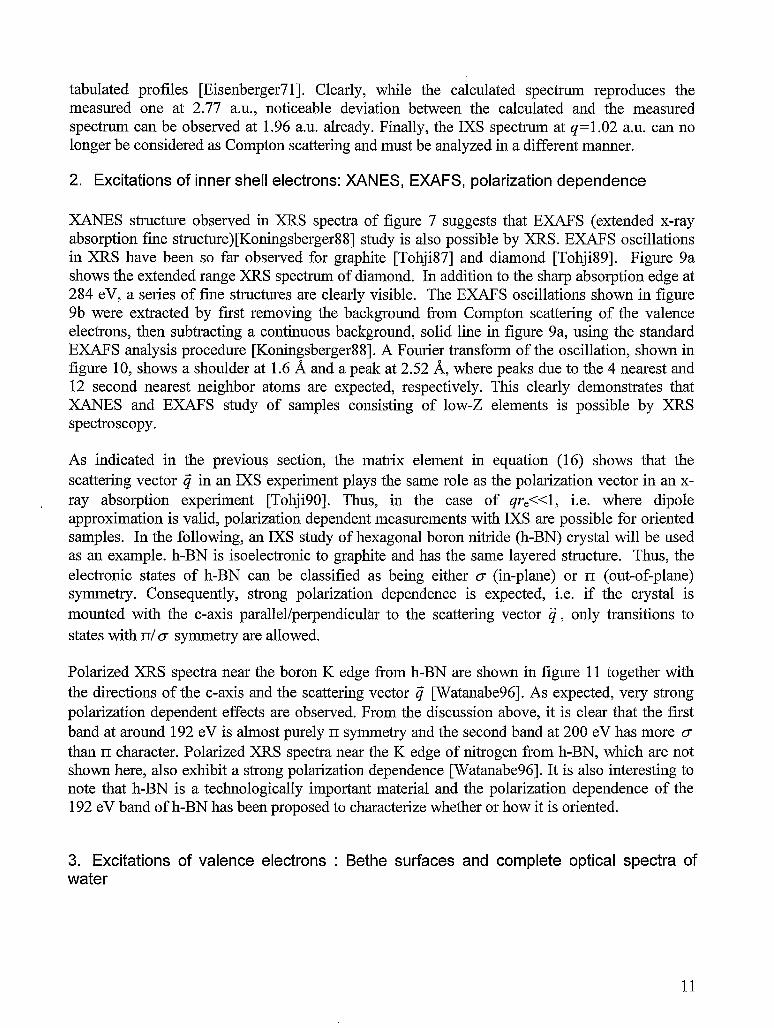
2. Excitations of inner shell electrons: XANES, EXAFS, polarization dependence
XANES structure observed in XRS spectra of figure 7 suggests that EXAFS (extended x-ray absorption fine structure)[Koningsberger88] study is also possible by XRS. EXAFS oscillations in XRS have been so far observed for graphite [Tohji87] and diamond [Tohji89]. Figure 9a shows the extended range XRS spectrum of diamond. In addition to the sharp absorption edge at 284 eV, a series of fine structures are clearly visible. The EXAFS oscillations shown in figure 9b were extracted by first removing the background from Compton scattering of the valence electrons, then subtracting a continuous background, solid line in figure 9a, using the standard EXAFS analysis procedure [Koningsberger88]. A Fourier transform of the oscillation, shown in figure 10, shows a shoulder at 1.6 A and a peak at 2.52 A, where peaks due to the 4 nearest and 12 second nearest neighbor atoms are expected, respectively. This clearly demonstrates that XANES and EXAFS study of samples consisting of low-Z elements is possible by XRS spectroscopy.
As indicated in the previous section, the matrix element in equation (16) shows that the scattering vector 4’ in an IXS experiment plays the same role as the polarization vector in an x- ray absorption experiment [Tohji90]. Thus, in the case of qr,<<l, i.e. where dipole approximation is valid, polarization dependent measurements with IXS are possible for oriented samples. In the following, an IXS study of hexagonal boron nitride (h-BN) crystal will be used as an example. h-BN is isoelectronic to graphite and has the same layered structure. Thus, the electronic states of h-BN can be classified as being either 0 (in-plane) or I-I (out-of-plane) symmetry. Consequently, strong polarization dependence is expected, i.e. if the crystal is mounted with the c-axis parallel/perpendicular to the scattering vector 2, only transitions to states with II/ 0 symmetry are allowed.
Polarized XRS spectra near the boron K edge from h-BN are shown in figure 11 together with the directions of the c-axis and the scattering vector 4’ [Watanabe96]. As expected, very strong polarization dependent effects are observed. From the discussion above, it is clear that the first band at around 192 eV is almost purely rr symmetry and the second band at 200 eV has more cr than n: character. Polarized XRS spectra near the K edge of nitrogen from h-BN, which are not shown here, also exhibit a strong polarization dependence [Watanabe96]. It is also interesting to note that h-BN is a technologically important material and the polarization dependence of the 192 eV band of h-BN has been proposed to characterize whether or how it is oriented.
3. Excitations of valence electrons : Bethe surfaces and complete optical spectra of water
11
Many important properties of matter can be extracted from the dynamical structure factor S(q’, o) , especially if S(g, GL)) is available over a wide range of energy and momentum transfers.
Most importantly, S(q,w) can be related to the imaginary part of the inverse of the complex dielectric response function, which is often referred to as the loss function [Schtilke91]:
Im 1
- = -“$“c s(q,@) 4&W)
(18)
where n, is the electron density. The real part of the dielectric response function can then be calculated from equation (18) using the well-known tiamers-Kronig transformation:
(19)
where P stands for the Cauchy principal value. Once E(~,co) is determined experimentally over the whole energy and momentum range, the dielectric properties of the material, in principle, is then completely known. Furthermore E@, w) can be obtained in absolute scale by utilizing thef- sum rule [Pines89]:
00
s d(~,w)dw =% (20)
Since the integration extends from zer,” to infinity, wide enough energy range has to be measured to apply the sum rule. In atomic and molecular literature, equation (20) is often rearranged so that only the total number of electrons N is left on the right hand side of the equation. The normalized S(<, U) can then be used to generate a three dimensional contour, which is referred to as the Bethe surface [Inokuti71]. For isotropic samples the spherically averaged dynamical structure factor S(q,w) can be
transformed to generalized oscillator strength df(q, E)/dE :
4&E)= E. dE 2 Sk-4
Rboj (21)
where R is the Rydberg constant and a0 the Bohr radius. As is evident from equations (1 S) and (21), the dynamical structure factor, the loss function, and the generalized oscillator strength are closely related. They can also be used to calculate other optical properties of the material, such as reflectivity and index of refraction.
For example, the loss function of liquid water [Watanabe971 and benzene [Watanabe981 derived from IXS measurements are presented in figures 12 and 13, respectively. The data in these figures are normalized using the sum rule in equation (20). These data can be converted to generalized oscillator strengths and dielectric constants as mentioned before. Data like these can be used to retrieve parameters that are important in describing the interactions between charged particles and the particular material, such as mean excitation energy, inelastic mean free path, and the stopping power of the material [Inokuti7 l] [Williams9 11.
Another important application of the loss function is the special case where q is close to 0. In this case, the measured IXS spectrum is equivalent to the spectrum obtained from conventional optical spectroscopy. However, since L or valence electrons of low-Z elements do not satisfy the
12

condition r, << 1, the scattering angle 20 or the scattering vector q should be small enough in order for the dipole approximation to be valid. IXS spectra of liquid water [Hayashi98] taken over a range O.l9<q< 0.69 a.u. are shown in figure. 14. The scattering intensity decreases with decreasing q as is expected from equation (17). At the same time, the spectral shape also changes. Most notably, a peak at around 30 eV observed at large q vanishes at small q. It is also
expected from equations (17) and (18) that the loss function, which is essentially s(q,w)/q2, should be independent of q when dipole approximation is valid. The loss functions of liquid water divided by q2 are shown in figure 15. It indicates that for water, dipole approximation is applicable for q smaller than about 0.3 a.u.
It should be pointed out that most of the oscillator strength of valence electrons of water is distributed in the vacuum ultraviolet (VUV) region, and optical measurements in this spectral region are particularly difficult for volatile liquids such as water. Because of their importance in the simulation of the interactions of charged particles in biological systems [Inokuti71][Williams91], and the estimation of van der Waals forces in colloidal systems [HoughSO], a series of attempts have been made in the past to obtain VUV spectra of liquid water [Kerr721 [Heller74]. In those studies, reflectance spectra were measured on water cooled at 1°C through two stages of differential pumping, each equipped with a cryopump capable of pumping 80000 liters of water vapor per second. Nevertheless, the spectral range was still limited to below 26 eV, and even within this energy range the data ‘in the literature show considerable discrepancies. As a result, the complete optical spectrum of liquid water has not been measured reliably using conventional techniques, up to now.
As demonstrated in figure 15, small q (less than 0.3 a.u.) IXS spectra of liquid water are equivalent to its optical spectrum [HayashiOO]. To further check the accuracy of the measurements, figure 16 shows the real and the imaginary part of the dielectric function of liquid water computed using equations (18) and (19). [HayashiOO]. Comparison is made with several dielectric constants calculated from the well-documented refractive index of water. The agreement between the dielectric constants derived from x-ray measurements and those from refractive index further indicates that the complete optical spectrum of liquid water has been accurately measured.
4. S(q) and electron correlation effects
One of the central issues in solid state physics and quan@n chemistiy is the treatment of electron-electron correlation. Only few experimental observables can be directly related to electron correlation effects. Among them, the static structure (inelastic scattering) factor S(q) is a sensitive probe of correlated electron wave functions [Bonham74] because it is connected to the two-electron reduced density matrix T(F1,F2) :
(22)
where ( )n means the spherical average, and the elastic scattering factor F(G) is the Fourier
transform of the one-electron density p(F) ,
13

F(ij) = I
p(@?G , (23)
Traditionally, total (elastic+inelastic) x-ray scattering intensities have been used for the studies of electron correlations [Nishikawa87] because of small x-ray scattering cross sections. Once data like those shown in figures 12 and 13 are collected, it is straightforward to calculate S(q).
In the case of molecules with a limited nmnber of electrons, very precise calculations are possible. As an example, we compare in figure 17 experimental S(q) of benzene and water’ with various calculations including electron correlation effects [Watanabe99]. For convenience of
cotiparison, differences, K?(q), obtained by subtracting S(q)L”M-HF from the calculated S(q)‘s
are shown. S(q)IAMmHF is the value calculated from the independent atom model, which assumes that Hartree-Fock wave functions of atoms do not change by the formation of a molecule (promolecule model). Chemical binding effects in molecular systems should mostly be taken into
account by molecular Hartree-Fock (HF) calculations, but the deviation of S(q)HF from experimental values is still significant and should be attributed to correlation effects. The most popular way to take correlation into consideration is the configuration interaction (CI) method. It can be noticed from figure 17 that a CI calculation including all singly and doubly excited configuration (CISD) almost reproduces the observed S(q) f or water [WatanabegS], but there still exist some discrepancies for a larger molecule, benzene.
In order to further incorporate the correlation effects, a more advanced method, cluster expansion singles and doubles (CCSD) [BartlettSl], was adopted. Explicit formula for two-electron density matrix using CCSD wave fimctions are derived and employed to compute S(q)‘s of benzene. As is evident in figure 17, the difference from the experimental values is largely reduced by CCSD calculations [WatanabegB].
B. Resonanf Raman and Resonant Inelastic Scattering
1. X-ray Resonant Raman Scattering
From equation (8) in section II, the contribution of j.2 term2 to the total inelastic scattering cross section can be significantly enhanced by exploiting the resonant conditions in the matrix elements, i.e. tuning the incident photon energy near an absorption edge of the sample. In many cases, the resonant term can become the dominant term, and the DDSCS can then be simplified to:
’ It should be noted that the s(q) s h own in figure 17 were calculated from s(q,w ) of liquid benzene and water. However, by comparing gas phase EELS data with liquid phase IXS data, it was found that for q>O.5 a.u. intermolecular interactions are negligible [Watanabe971 [TakahashiOO]. ’ Since only the absorption is resonant, the dominant term is the second one in expression (8).
14

(24) “(Ef - Ei -ho,) .
It is usually referred to as x-ray resonant Raman scattering (XRRS) or resonant inelastic scattering (RIXS) to distinguish it from inelastic scattering processes originated from the A2 term in the interaction Hamiltonian. The first observation of x-ray resonant Raman scattering was reported by Sparks et al. in 1974 [Sparks74]. In the experiment, monochromatized Cu Ka radiation was used to excite a series of targets ranging from Ni to Ge, and the scattered radiation was energy-analyzed by a Si(Li) detector which had an energy resolution on the order of 100 eV. The high flux and tunability of synchrotron radiation make it an ideal source to study the energy, polarization, and momentum transfer dependence of XRRS with increasingly better energy and momentum resolution. As a result, over the last several years, a number of interesting threshold phenomena were revealed, and new ,applications of XRRS were developed. In this section, a review of these new developments is given.
Immediately after the first observation of XRRS, it was pointed out that resonant Raman spectra could contain information typically obtained in x-ray absorption measurements [Bannett75]. Within the one-electron picture, i.e. ignoring the interaction between the excited electron and the core-hole, it was predicted that both the near edge tine structures and the extended fine structures in the x-ray absorption spectra should be reflected in XRRS. Several experimental observations of absorption fine structures in XRRS spectra have been reported [Etelaniemi92]. However, the energy resolution of these works was significantly worse than that can be achieved in routine.x- ray absorption measurements. Only within the last few years, high resolution resonant Raman scattering has become routinely available to experimenters.
There are several advantages of measuring the x-ray absorption near edge fine structures using XRRS. The lifetime width of the core hole in the absorption spectrum is replaced by the narrower lifetime width of the shallower core hole in the final state in the XRRS process. Subsequently, the spectral features are better resolved in the XRRS spectrum. Both the incident and the scattered photon energies are below the absorption threshold, so that saturation effects and self-absorption effects are minimized. The signal-to-background ratio is then expected to be better.
In the following, an XRRS study of NiO will be used as an example. Figure 18 shows a series of resonant Raman spectra taken at incident photon energies near the Ni K absorption edge energy of NiO with the data plotted as a function of energy transfers. The energy range of the scattered spectra was chosen to be close to that of the Ni IQ3 fluorescent line at about 8265 eV. As the incident photon energy is tuned through the absorption edge, a set of spectral features emerges. Five distinct features can be identified in these spectra, and are labeled from A to E. Between incident energy 8334 eV to 8339 eV, these features show a clear linear dispersion with the incident energy as evident by the constant energy transfers of these features as a function of incident energy. On the other hand, the intensities of these features exhibit a very strong incident energy dependency. Both energy dependencies are characteristics of resonant Raman scattering
15

process, where linear dispersion of the peaks is the consequence of energy conservation, and the strong intensity variations reflect the resonant conditions. Furthermore, features A to E can be shown to correspond to the near edge fine structures in the Ni K absorption spectrum of NiO [Kao96a].
2. Many electron effects in XRRS The one-electron approximation mentioned in the previous section breaks down when the interaction between the excited electron and the core-hole cannot be neglected. In such cases, many-electron effects in the x-ray resonant Raman process need to be included.
X-ray absorption spectroscopy has played a very important role in the study of valence fluctuation behavior and magnetic properties of rare earth elements and their compounds. In particular, the L 2,3 absorption edges of rare earth ions are frequently used in these studies. These edges are typically, characterized by strong white lines, which correspond to dipole transitions exciting the 2p electrons to the empty 5d bands. Depending on the electronic configuration and local symmetry, they. also could. have: spectral, features corresponding to 2p to 4f transitions through electric, quadrupole transitions., However, .the weak ,quadrupole transition and the large lifetime broadening. of the--white line. have prevented the. direct ‘. observation of this excitation channel. It should be noted that the L2,3 absorption edges of rare earth ions have also been exploited in the last decade in resonant magnetic scattering studies of the magnetic structures and magnetic phase transitions in these system due to the large resonant enhancements of magnetic scattering cross sections [Gibbs881 [Hannon88].
A number of high-resolution XRRS experiments have been performed on these systems [Hamalainen95][Krisch95] [Bartolome97]. In most cases, the incident energies were tuned near the L3 absorption edge of the rare earth ion in the sample. The energy ranges of the scattered spectra were chosen to be close to that of the either 3d to 2p or 4d to 2p fluorescent lines of the rare earth ions. In the resonant Raman spectra, spectral features corresponding to the 3d94f”+’ and 3d94r”5d1 final states were clearly separated due to the large difference in the Coulomb energy for these two final states. This is a clear indication of the importance of the interaction between the excited electron and the core hole. Consequently, the 2p to 4f quadrupolar transition in the L3 absorption spectra, which cannot be resolved from the 2p to 5d dipolar transition in the normal x- ray absorption measurement due to large core hole lifetime, was uncovered.
3. Magnetic sensitivity in XRRS A further step in the direction of resonant inelastic magnetic scattering has been achieved recently by exciting XRRS from a magnetized sample with circularly polarized x-rays [Caliebe96] [Krisch96][Iwazumi97]. These studies were made possible by the progress in the development of elliptically polarized insertion devices as well as novel x-ray optical elements for the conversion and analysis of elliptically polarized x-rays. Figure 19 shows the spin-resolved XRRS spectra from a magnetized Gd metal film [Caliebe96]. The incident energy was tuned to the 2p to 4f quadrupolar transition in Gd. The energy range of the scattered spectra was again chosen to be close to that of the 3d to 2p fluorescent line of Gd. The two spectra shown in the
16

figure were measured with the magnetization of the sample either parallel or antiparallel to the direction of the circularly polarized x-ray, similar to the arrangement of the sample and the photon helicity in a magnetic circular dichroism (MCD) experiment. Although more theoretical work is needed, these results clearly demonstrated that the final states of the XRRS process, 3d94Pf’ and 3d94t”5d1, are strongly spin-polarized. This type of experiment, in principle, could provide information complementary to that obtained from MCD experiment and spin-resolved photoemission experiment.
4. X-ray Resonant Inelastic Scattering
So far most of the XRRS experiments involved resonant Raman processes in which both the intermediate states and the final states are localized core electron excitations. Recently, investigation of resonant Raman processes in which the final states correspond to elementary excitations of the conduction electrons or the valence electrons in condensed matters has become possible due to the development of high. flux insertion devices in synchrotron sources. These processes are often called resonant inelastic x-ray scattering (RIXS) in the literature to distinguish them from XRRS processes that lead to core excitations. This is an important step in the study of electronic excitations using IXS. As:pointed outbefore, up to.now .this technique has been limited to the study of low-Z materials dueto strong absorption of x-rays. in higher Z materials. Thus,. the large resonant enhancement ,of the inelastic scattering. cross section can significantly, extend the range of systems that can be probed by IXS.
RIXS was first proposed to interpret the strong excitation energy and orientation dependence of the valence band emission from diamond and Si [Ma92][Ma95]. Similar results were subsequently observed for graphite and hexagonal boron nitride [Jia96] [Carlisle96]]. By invoking a coherent second order optical process, these papers argued that momentum is conserved in the RIXS process, i.e. both temporal and spatial coherence are conserved between the x-ray absorption and the subsequent emission process. Thus, within one-electron band theory RIXS can be used to map out electronic band structures of wide band solids, similar to angle-resolved photoemission spectroscopy. Since it is a photon-in-photon-out technique, RIXS is less sensitive to surface conditions of the sample, which is an advantage if one is interested in the bulk electronic properties of the sample..
On the other hand, for narrow band solids, such as transition metal and rare earth compounds, the excitation energy dependence has usually been interpreted in terms of multi-electron satellites or correlation effects. However, several recent studies both in soft x-ray and hard x-ray range have demonstrated that RIXS can be used to probe elementary excitations in highly correlated electron systems. In the soft x-ray case, d-d excitations were observed in MnO by RIXS near the L2.3 absorption edge of Mn [ButoringBa], and in Sr2CuO2C12 by RIXS near the Cu 3p absorption edges [Kuiper98]. In the hard x-ray case, charge transfer excitations were first observed in NiO [Kao96] and Ce02 [Butorin96]. Since copper oxide based high temperature superconductors are
-also classified as charge transfer insulators, these works have prompted several experimental investigations in high Tc related compounds [Hi11981 [Abbamonte99].
17

5. Example: RIXS in NiO In the following, NiO will be used to illustrate the application of RIXS in the hard x-ray case [Kao96]. Curve (a) in figure 20 shows the Ni K edge absorption spectrum of a powdered NiO sample. The spectrum is characterized by a weak pre-edge peak marked by the short vertical line, and a series of small absorption features leading up to the main absorption peak, centered around 8350 eV. The pre-edge peak, located at 8334 eV, is usually assigned to 1s -+ 3d transition, while the main peak and the absorption features between the pre-edge peak and the main peak are assigned to transitions from the Ni 1 s core state to Ni 4p-like states [Tan93]. Curve (b) shows the inelastic scattering spectrum measured with the incident photon energy tuned to the main peak of the absorption spectrum. A new spectral feature, in addition to the valence band emission spectrum, appears in the spectrum with energy higher than that of the absorption threshold. The new feature can be roughly fitted with two peaks. The energy separations between the two peaks ’ and the elastic line are about 4.9 eV and 7.8 eV, respectively.
Figure 21 shows a series of inelastic scattering spectra taken with the incident energy tuned between 8340 eV and 8355 eV. The scattering intensity is plotted as a function of the energy transfer instead of the scattered photon energy. All spectra can also be roughly fitted with two broad peaks with strong variation in peak intensities but nearly constant energy transfers. The energy transfers are centered. around 4.9 eV and 7.8 eV, though small variation of the peak positions with the incident energy is clearly observed. The,strong variationof the scattering cross sections as a function of the incident energy is better illustrated with constant final state scans. In a constant final state scan, both the monochromator energy and the analyzer energy are scanned together while the energy transfer is kept constant. As a result, the intensity variation represents only the intermediate states that subsequently decay into the particular final states having the energy transfer being monitored. Figure 22 shows a constant final state scan with the energy transfer kept at 5.0 eV. The Ni K absorption spectrum is also included in the figure for comparison. The constant final state scan shows a series of resonances in the scattering cross section with resonant energies close to the local maxima in the absorption spectrum. The resonances in the constant final state scan are also better resolved than their counterparts in the total absorption spectrum.
The loss features and their resonant behavior are interpreted in terms of a cluster model. This approach was used by Tanaka and Kotani [Tanaka931 in their theoretical study of resonant soft-x- ray emission process, and has also been very successful in interpreting a wide range of spectroscopic data on the electronic structure of NiO and other highly correlated systems [Sawatzky84][Fujimori84][Zaanen85]. In the cluster description of NiO, in order to account for the covalence between the metal ion and the ligand, the ground state is represented by a linear combination of the following configurations, 3d*, 3dgI,, where L denotes a ligand hole at the center of the ligand band. The energies of the 3d9L configuration is given by A, where A is the anion-to-cation charge transfer energy (figure 23). The ground state is the bondin
if! state resulting
from the mixing of the 3d8 and 3d9L configurations, and is predominantly a 3d configuration. The intermediate state in the RIXS process is the same as the final state of the x-ray absorption process, which can be represented by c3d8k + c3d9L k, where c denotes the Ni 1 s core hole, and k the excited photoelectron. The order in energy for these configurations can be rearranged from that of the ground state due to the core-hole-valence-electron Coulomb interaction. In this particular case, from the parameters obtained from other core level spectroscopies, c3d9L k is
18

expected to have lower energy than that of c3d8k, which affects the distribution of the spectral weight in the intermediate state in favor of the former. Qualitatively, the lowering of the energy of the c3d9L k configuration can be thought of as screening of the core-hole by transferring an electron from the ligand to the metal ion. The intermediate state then decays into the final state through either radiative or Auger processes. In the case of radiative decay, the excited state can decay either by filling the core hole with valence electrons, resulting in the valence band emission in the presence of a spectator electron, or by direct recombination of the excited electron with the core hole. In the latter case, the system can return to either the ground state, which gives the elastic line observed in figure 20, or the excited 3d9L configuration, which gives the energy loss features observed in figure 21 and the energy loss would be the charge transfer energy.
This interpretation of RIXS in NiO is supported by the agreement between the energies of the loss features observed in the RIXS experiment and the charge transfer energies of NiO estimated from other experimental techniques [Sawatzky84] [vanElp92]. Figure 24 compares the charge transfer energy of NiO determined by photoemission and bremsstrahlung-isochromat (inverse photoemission) spectroscopy and that measured by RIXS. However, there are still many unresolved issues in the interpretation of RIXS. To address these issues, polarization and momentum dependent RIXS measurements have been reported recently [Hamalainengg] [Enkisch99]. Th ere are also several theoretical investigations of non-local effects [IdeOO], and the possibility of measuring dispersion of elementary excitations using RIXS [Tsutsui99].
Finally, the inelastic scattering cross sections for the charge transfer excitations observed in NiO shows very large resonant enhancement. The on-resonant cross section is estimated to be on the order of 100 times the off-resonant cross section. This large enhancement is very important because high energy resolution inelastic x-ray scattering is severely limited by the incident photon.
C. Comp ton Sea ttering.
1. Theory and approximations.
a) A phenomenological description. A simple picture of Compton scattering is the collision between a photon and an electron in classical mechanics terms [DuMond29] [DuMond33]. From the momentum and energy
conservation laws, the shift in wavelength between incoming (hc,, 4) and scattered @c2, il, photons is :
$ + a; - 24a2 ~0428) (25)
where 28 is the scattering angle, the z axis is taken along the scattering vector and 21 is the initial momentum of the electron. Assuming that the change in wavelength is small compared to ill, the above expression can be simplified to
19

A2- Al =~si~2(s>+~sin(0)=d/l, +Ajl~ . mc mc (26)
This expression is simply the quantum representation of the Doppler effect. The first term is called “ Compton shift “, which depends only on the geometry of the experiment. The second term is proportional to the projection of the initial momentum of the electron along the scattering vector, and referred to as the “ Doppler ” shift. In the case of an electron at rest, one would expect an infinitely sharp peak at Ail,. As the momentum distribution broadens, the sharp peak also gains finite width in the energy loss spectrum. Thus, provided that the spectrum is not perturbed by any other process, it would give a rather direct information on the electron density in momentum representation.
b) Impulse approximation and Compton profile. Far from any absorption edge, the Compton cross section can be described by equation 9 in section II. Using the approach to the dynamical structure factor proposed by Van Hove pan Hove541 :
2
S(G, CD) = C cflc e@‘?jl i x L$Ef - Ei - tl~)
i,f .i i
I =- 2&i clc
e-iCOt(ije -iq’.f;j (O),i4f.Fj(t)l i)dt
i j,l
N =-
2di cl
e-ifd~i~e-i~.f(0)ei~.P(t)~i~dt
i
+ N@J-8 2&i cl
e-ic(t(i[e-iii.~(0)ei~.~(t)[ i)dt
i (27)
The second term in the last expression implies a relationship between the positions of any two electrons in the target. It is therefore identified as a coherent contribution that yields the diffraction signal. In contrast, the first term involves a single electron, and constitutes the incoherent contribution. Consequently, it varies linearly with the number of scatterers, and is expected to be much weaker than the second term. However, for large momentum and energy transfer only a very small volume in the space-time (qr << 2n and wt << 2~ ) contributes to phase coherence. Since the repulsion prevents two particles of being so close the coherent term becomes very weak. In the case of a target consisting of bound electrons, the kinetic Ho and potential V operators usually do not commute [Eisenberger70] [Platzman77]. For a short interaction time, keeping terms up to the second order in t, the propagation operator becomes:
.Ht .Hd .E IHOJ]~ eL ZeTfiele 2h2 . (28)
20

The last exponent gives a negligible contribution if the potential felt by the electrons does not
change significantly [Ho, V(F)]= -iFz fl?) d uring the very short interaction time. In other
words, for energy transfer much greater than binding energies, the recoil electron is not affected by the relaxation of the system, and:
Ht i- .Hd .Vt
e h -e’h,zT (29) This is called “ Impulse Approximation “. Using the commutation properties:
Hot .Vt . vt ,@?(t) ~ eiA,I~,i@Pe-z~e
.I++ -z- .Hd Jot fi ~ ez~,i@F,-zR
(30) the cross-section now becomes :
where ~61, &,.., & is the N-electron wave function in the momentum representation of state
1 i) . Substituting the one-electron momentum density:
the Compton scattering cross-section, within the “Impulse Approximation” becomes:
(32)
The delta-function insures the energy and momentum overall conservation ,and is therefore equivalent to equation (26). It should be emphasized that the above formula for the cross-section is only valid within the impulse approximation limits: - the momentum transfer satisfies ql, >> I, where j, is the characteristic interparticle distance; - the incident energy is much higher than the binding energies; - the energy transfer is high to keep the interaction time short. In the remaining part of this section, we will only focus on the integral part of the cross section, the so-called directional Compton profile (DCP):
The directional Compton profile is then the probability of finding an electron with the component of its momentum along 4’ equal to pz , independent of the values of the two other components.
2. Sharp feature for valence electrons: relevance to chemical bonding4.. Diffraction has proved to be very efficient in describing the local electron distribution around each atom. However, delocalized electrons involved in chemical bonds have diffuse densities,
3 This expression is derived using relativistic energy and momentum conservation laws. 4 For a similar study see [Loupias86] or [Epstein77].
21
and as a consequence, their form factors are very sharp. Due to the discreteness of Bragg condition these delocalized electrons contribute only to few structure factors. Thus, very limited information on chemical bonding can be obtained from a typical diffraction experiment.
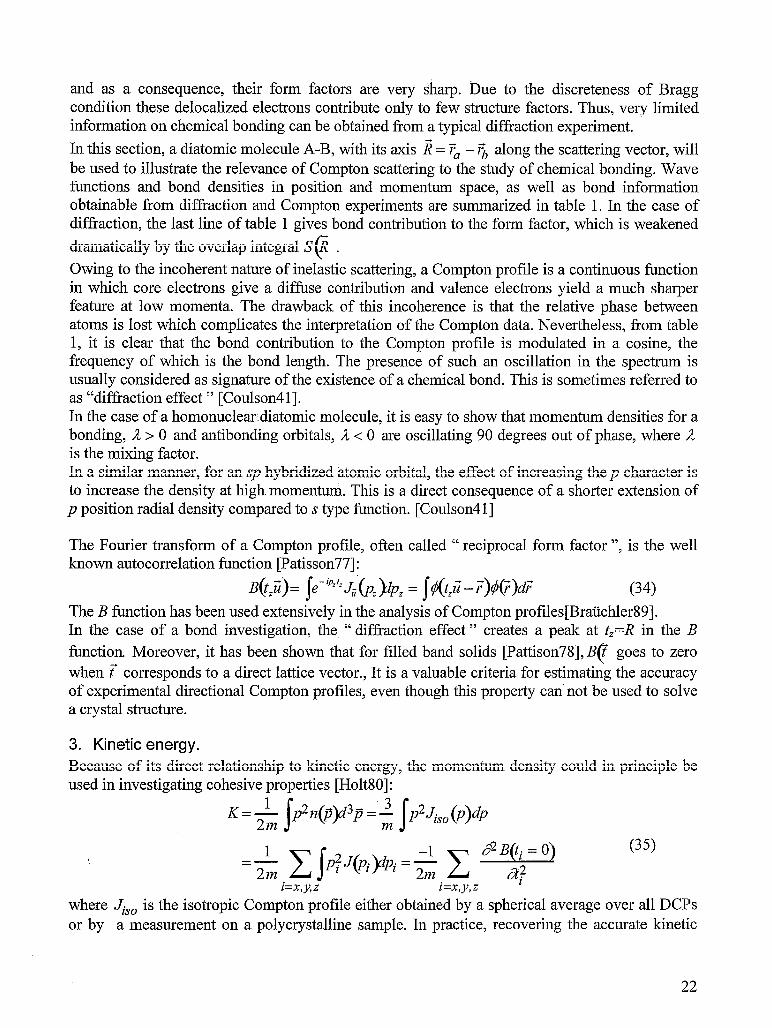
In this section, a diatomic molecule A-B, with its axis i = ?a - rZ, along the scattering vector, will be used to illustrate the relevance of Compton scattering to the study of chemical bonding. Wave functions and bond densities in position and momentum space, as well as bond information obtainable from diffraction and Compton experiments are summarized in table 1. In the case of diffraction, the last line of table 1 gives bond contribution to the form factor, which is weakened
dramatically by the overlap integral S@ .
Owing to the incoherent nature of inelastic scattering, a Compton profile is a continuous function in which core electrons give a diffuse contribution and valence electrons yield a much sharper feature at low momenta. The drawback of this incoherence is that the relative phase between atoms is lost which complicates the interpretation of the Compton data. Nevertheless, from table 1, it is clear that the bond contribution to the Compton profile is modulated in a cosine, the frequency of which is the bond length. The presence of such an oscillation in the spectrum is usually considered as signature of the existence of a chemical bond. This is sometimes referred to as “diffraction effect ” [Coulson4 11. In the case of a homonucleardiatomic molecule, it is easy to show that momentum densities for a bonding, jl> 0 and antibonding orbitals, ;1< 0 are oscillating 90 degrees out of phase, where il is the mixing factor. In a similar manner, for an sp hybridized atomic orbital, the effect of increasing the p character is to increase the density at high momentum. This is a direct consequence of a shorter extension of p position radial density compared to s type function. [Coulson41]
The Fourier transform of a Compton profile, often called “ reciprocal form factor “, is the well known autocorrelation function [Patisson77]:
B(tZEi)= f~-AC~i.G7; opt = I~t=~- r’)~(~)d~ (34) The B function has been used extensively in the analysis of Compton profiles[Bratichler89]. In the case of a bond investigation, the “ diffraction effect ” creates a peak at t,=R in the B function Moreover, it has been shown that for filled band solids [Pattison78], Bf goes to zero when t’ corresponds to a direct lattice vector., It is a valuable criteria for estimating the accuracy of experimental directional Compton profiles, even though this property can’ not be used to solve a crystal structure.
3. Kinetic energy. Because of its direct relationship to kinetic energy, the momentum density could in principle be used in investigating cohesive properties [Holt80]:
i=x,y,z i=x,y,z ’ where Ji~o is the isotropic Compton profile either obtained by a spherical average over all DCPs or by a measurement on a polycrystalline sample. In practice, recovering the accurate kinetic
22

energy from the above expressions is severely limited by the poor statistics at high q. In favorable cases, this problem can be overcome. This point will be discussed in the section treating the reconstruction methods.
4. Technical issues in the interpretation of Compton profiles.
a) Subtraction of core electrons contribution and multiple scattering correction.
As mentioned above, because diffuse components in the position space wave function contribute to sharp features in Compton profiles, DCPs are particularly useful for probing valence electron states. But, the incoherent nature of Compton scattering means that a given profile is the sum of contributions from all electrons of every atom in the target. Therefore, to recover the information on the valence electrons requires the subtraction of the contribution of the core electrons. In practice, core contribution can be calculated from atomic wave functions. However, if IA is not satisfied for the core electrons, corrections have to be included in the atomic calculation [Issolah88] & [IssolahBl]. Figure 25 shows a typical Compton profile with its calculated core contribution.
In the case of thick samples. or samples containing strong scatterers, multiple scattering effects need to be evaluated. Experimentally, one can estimate the effect of multiple scattering by performing measurement on, samples of different thickness and extrapolating to the zero- thickness limit. Alternatively, multiple scattering corrections can be simulated by a Monte-Carlo procedure proposed by Felsteiner pelsteiner741 [Chomilier85] in which all double and triple scattering processes are included.
b) Momentum density reconstruction. One of the major drawbacks of Compton scattering is that, just like X-ray diffraction, it doesn’t provide a direct access to the density function. Expression (10) shows that a DCP is a mere projection of the momentum density onto the scattering vector. Considering the weakness of the Compton signal, the measurements can usually be done on a very limited number of non- equivalent crystallographic directions. There is, therefore, an obvious need for an interpolation in the reconstruction process.
In principle the three dimensional momentum density n(i;) can be reconstructed from a finite set of DCPs. There are many approaches to the reconstruction [Mijnarends77] [Hansen801 [Hansen871 [Da&71 [Kontrym-Sznajd991 [Dobrzynski96] [PapoularOO] [peiterOO], in this section the analytic-Gaussian method [Gillet will be used as an example. A DCP is the projection of the momentum density along the direction of the scattering vector , equation (33). The back transformation can be expressed as:
Since only a limited number of DCP can actually be measured, making use of expression (38) implies an interpolation of Jls(q). I n tl le case of insulators, the following form was proposed:
23

with
where hl are the lattice harmonics. Expression (39) can be fitted to the experimental profiles with
the ay and a~ as adjustable parameters. The motivation for the choice of expression (40) is that
it provides an analytical expression for three dimensional momentum density as a simple gaussian contraction:
n(p) = ---$~izh~($,~i~ (
-
“)+ e’
j 2alj
(4 4
In order to test the method, a Hartree-Fock calculation was performed to generate both the momentum density and a set of Compton profiles for magnesium oxide. The momentum density reconstructed from those calculated DCP is then compared with that obtained from the HF calculation. Figure 26 (a) and (b) show the agreement in the anisotropy part of the reconstruction. Another important aspect is the quality of the isotropic component, which can be tested through the kinetic energy density function as shown in figure 26(c).
5. Examples and applications.
a) Qualitative interpretations of Compton profiles.
(1) Covalent nature of Hydrogen bond in Ice Ih.
The first example is a qualitative exploitation of the sensitivity of the autocorrelation function to the chemical bonding via the “ diffraction effect “. Recently, Isaacs et al [Isaacs99] have investigated the nature of hydrogen bond in the Ih phase of ice. In this hexagonal structure, there is a strong change in the DCPs depending on whether the scattering vector is aligned with the Z
axis or parallel to the (2, b’ pl ane. Roughly speaking, this can be understood by the fact that one
hydrogen bond out of four is aligned with the c’axis, the remaining three having an almost
isotropic distribution in the 2, b’ plane. The power spectrum, defined by the square of the (
difference between autocorrelation functions measured in the Z direction and in the 2, b’ plane, (
is shown in figure 27, along with the Compton anisotropies. The authors argue that the peaks observed at given distances in the power spectrum are coherent contributions from atoms linked by covalent bonds. The first small peak ,at about 1 A is assigned to the covalent 0 bond. The second peak, around 1.75 A is interpreted by the authors as an evidence of a partial sharing of electron in the hydrogen bond.
(2) Delocalisation of electrons in fullerenes compared to graphite.
Moscovici et al [Moscovici95] carried out Compton scattering measurements on c60 crystals for comparison with previous results on graphite. This experiment was expected to give important
24

insights for a better knowledge of the behavior of the most delocalised electrons in these systems that cannot be seen by X-ray diffraction. The most striking, shown in figure 28, is a higher electron density at low momenta in c60 (per carbon atom) than in graphite. It implies that
valence electrons in the insulating c6() are more delocalized than those in the semi-metalic graphite. This surprising result was confirmed by Hartree-Fock calculations [BClemlilga97]. It is shown that such an effect is not originating from solid state interaction, but can already be reproduced with a single c60 molecule calculation. A ‘bent graphite plane’ argument was
proposed by Becker5 to interpret this apparent larger delocalisation in c&j (figure 29): When a
graphite plane is bent, pz functions are no longer parallel to each other and become hybridized. As a result, outer z orbitals tend to be more delocalised since the hybridpZ functions from which they are constructed are more diffuse; while electrons from inner z orbitals, as they are more confined, experience more of the mutual repulsion and get partly expelled to the outer orbitals.
b) . Limitation of the rigid band model in Lithium-Graphite intercalation compounds. When lithium atoms are intercalated between graphite planes, an oversimplified approach is to describe the system using the unmodified graphite band structure with an increase in the population of the conduction band according to the number of transferred electrons. In their study of LiC, (n=6 or 12) Rabii et al [Rabii89] show that this “ rigid band model ” is not sufficient. Figures 30 (a) and (b) show the difference between Compton profiles of intercalated graphite and pristine graphite. In particular, the pz character of the pristine graphite conduction band implies a zero value of the calculated profile, which does not appear in the experimental data. On the other hand, a good agreement with the experimental profile is obtained from the full band structure calculation of lithium intercalated graphite.
c) Refinement of a local wavefunction model from a set of DCPs. Over the past 20 years, refinements of electron density in terms of “ multipoles on atoms ” from X-ray structure factors have become a well established technique. However, no similar refinement from Compton data has been developed. With the dedicated inelastic scattering spectrometers built on synchrotron storage rings, Compton spectra with good statistics and high resolution can be routinely obtained. Therefore, it is now feasible to exploit the possibility of refinement of wavefunction using a set of DCPs [Gillet95].
(1) Towards a general formalism for momentum density: the case of filled band systems.
In the LCAO approach, it is possible to write the Bloch function r+~~(i,F corresponding to a
given local orbital @p ( ) 7 centered on Jp in the unit cell as:
where
(41)
5 Private communication.
25

Setting X~ 6) as the Fourier transform of qjp (if), the Bloch function in momentum space is then
obtained as:
The momentum density is simply obtained by adding the contributions from every occupied band
and every state i up to the Fermi level if :
(44)
where f@ is the occupation distribution and the crystalline orbitals t@, p’ are constructed as:
(45)
In the case of filled band system, the momentum density takes the form:
where Pp,,, k c
is the population matrix and d,, the distance between two centers in a given unit
cell. Expression (46) underlines the fact that the momentum density does not dependent significantly as the phase factor only involves optical modes. The simplicity of this expression makes it very appropriate for a direct comparison with momentum density derived from experimental DCPs.
(2) Application to ionic solids: Localized orbitals approacl@.
In the following crystalline LiH will be used to illustrate the chemical information one can expect to retrieve from a refinement procedure based on expression (46). Owing to the strong ionic character of the compound, valence electrons are mostly localized around the hydrogen atoms. However, since H- is known to be very diffuse, a strong overlap between anions has to be taken into account, and a partial expulsion of the charges toward directions other than anion-anion nearest neighbors is expected. As a result, part of the charge could be found between hydrogen and the 6 closest lithium atoms. Hence, a small but significant covalency could be observed through the Compton measurements. In order to incorporate a small covalency, the pure hydrogen valence orbital is modified to, the so-called “ cluster valence orbital “:
where 4H is a Slater Is function, with an adjustable screening factor, and hi,, the cage function, is constructed as :
6 Pattison & Weyrich [Pattison also considered this problem by means of the autocorrelation function.
26

(48)
where the hybridization factor and the extension of the 2s and 2p functions are also refined. SHLi, is the overlap integral. Finally, 1, the mixing iono-covalency factor, is the key parameter to be refined. The results of the refinement are in table (2). The screening factors are very close to Slater-Zener theoretical values and hybridization is found to be negligible. As expected, a small covalency, of about lo%, has to be taken into account to describe the system accurately. To demonstrate the sensitivity of Compton data to the nature of chemical bonds, figure 3 1 compares the anisotropy calculated using the covalence factor set to zero with experimental and refined anisotropies.
V. Conclusions.
In this chapter, we reviewed the theoretical background and instrumentation of inelastic x-ray scattering. The use of IXS as an experimental probe in the study of electronic excitations, electron correlation effects and momentum density was illustrated with selected examples7.
Most of the experimental results presented in this review were obtained at NSLS, LURE and Photon Factory. With. high energy synchrotron radiation sources, ESRF, APS, Spring-8, two orders of magnitude gain in flux can be realized. X-ray photon energy greater than 100 keV is also available. It is then possible to study samples with higher Z elements.
For X-ray Rarnan scattering, the increased flux can also be used to improve the energy resolution. The total energy resolution in the range of 50 to 100 meV for incident energy between 5 to 10 keV can be achieved. This energy resolution is comparable to that achieved so far by high energy inelastic electron scattering and soft-x-ray grating monochromator and emission spectrometer Hence, the advantages of IXS in the flexibility of sample enviromnent can be fully exploited, especially for sample under extreme conditions.
The sensitivity of Compton scattering to the nature of chemical bonding has been demonstrated. The progress in reconstruction and refinement procedures is expected to provide more quantitative information on the behavior of the wave function of valence electrons. In particular, a better use of complementary information provided by diffraction and Compton data could be made through joint refinements.
Finally, with the construction of several dedicated IXS beamlines around the world, the wide variety of applications demonstrated in this review will soon be made available to large number of researchers to systematically study problems of chemical interest.
7 For applications in other fields, see the proceedings of “International Workshop On Inelastic x-ray Scattering” held in Montauk, New York 1998 J Phys. Chem. Solids 61, No.3 (2000)
27

Acknowledgments :
National Synchrotron Light Source is supported by department of energy under contract No. DE- AC02-98CH10886. The authors wish to thank G. Loupias, C. Bellin, K. HanrUinen, A. Shukla, J.B. Hastings, P. Becker and N. Watanabe, for many useful discussions. H.H. thanks JSPS for Postdoctoral Fellowships for Research Abroad (1998).
28

Figure 1

Figure 2a
Focusing mirror Monochromator
Figure 2b
lMtoriztd . . .

Figure 3
Rowland circle
i .
detector//--. /source
spherically bent

Figure 4
0 c
c
. . . . . , 3 O g
0
z
1
21 I
'2 3 4 5 6 78910
Energy [k&l
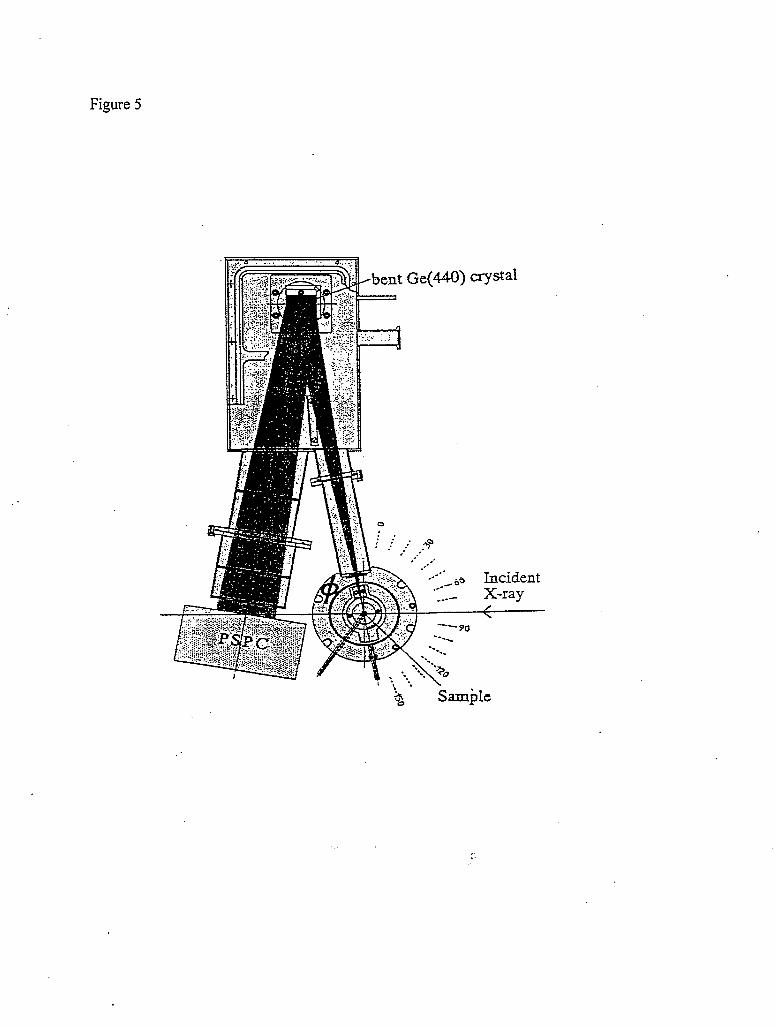
Figure 5
ggjJ/ bent Ge(440) crystal

Figure 6
linear position sensitive detector PSD) cylindrically
bent analyzer

a e = 60”
c K-edge
1 .
- COMPTON
i, ,
0 . 200 ENERGY LOSS[eV]
b
e = 90” .
0
ENERGY L(%&Vj
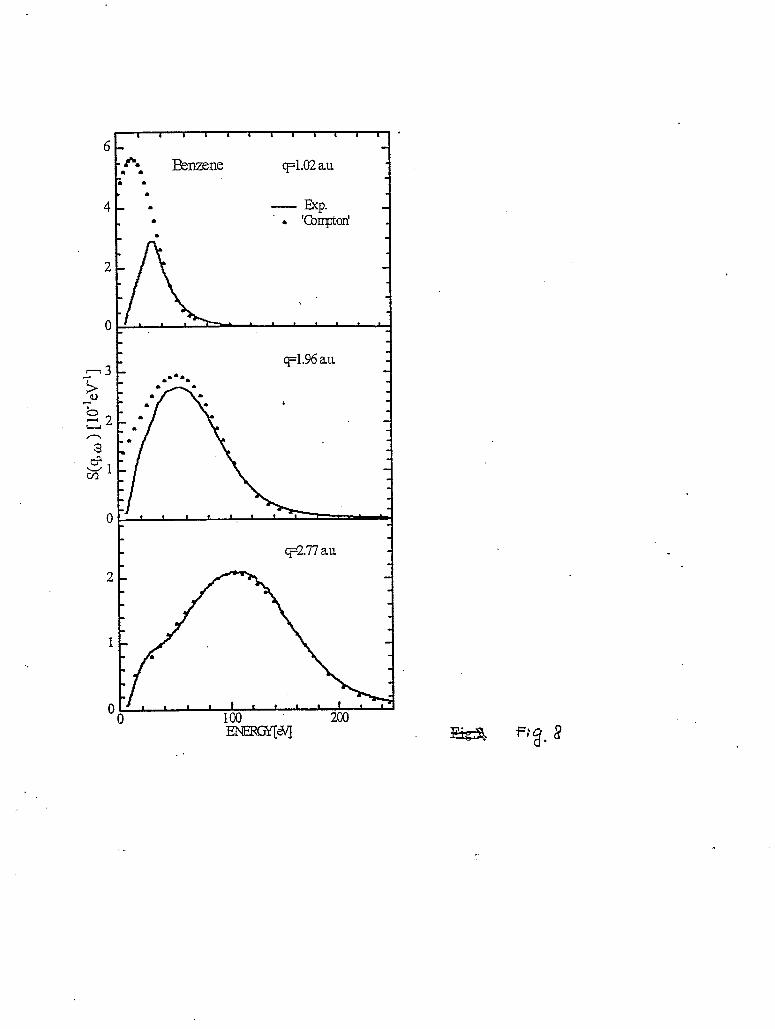
t-
A . . Benzene q=1.02 au l .
. 1
4 l
t .
- tip. . ‘coInpton’
r

I’NTF
NS
ITY
f co
unts
)
-_.
. . 1 : 1 . . . .
. .
. .
. :^
. .
..*

DIAMOND
2.528,
1 2 3 4 5 6
DISTANCE (A)
.
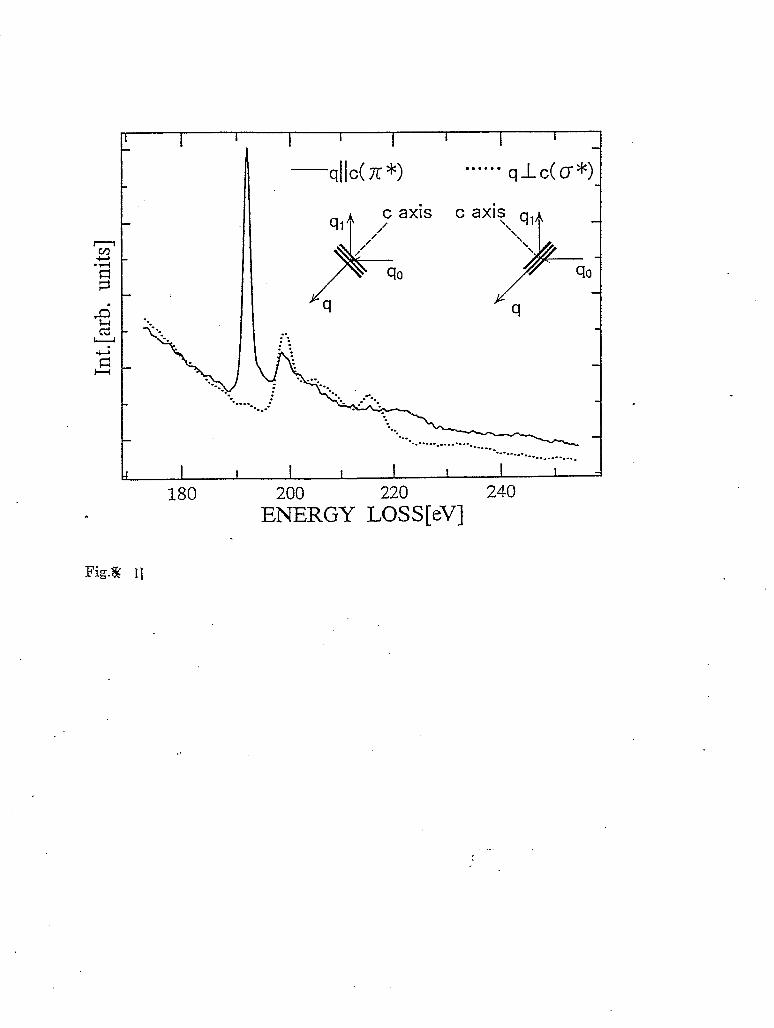
c ax+, q, \ \ \
i@-
\
(4,
c
Fig.8 II
240
ENERGY LOSS[eV]
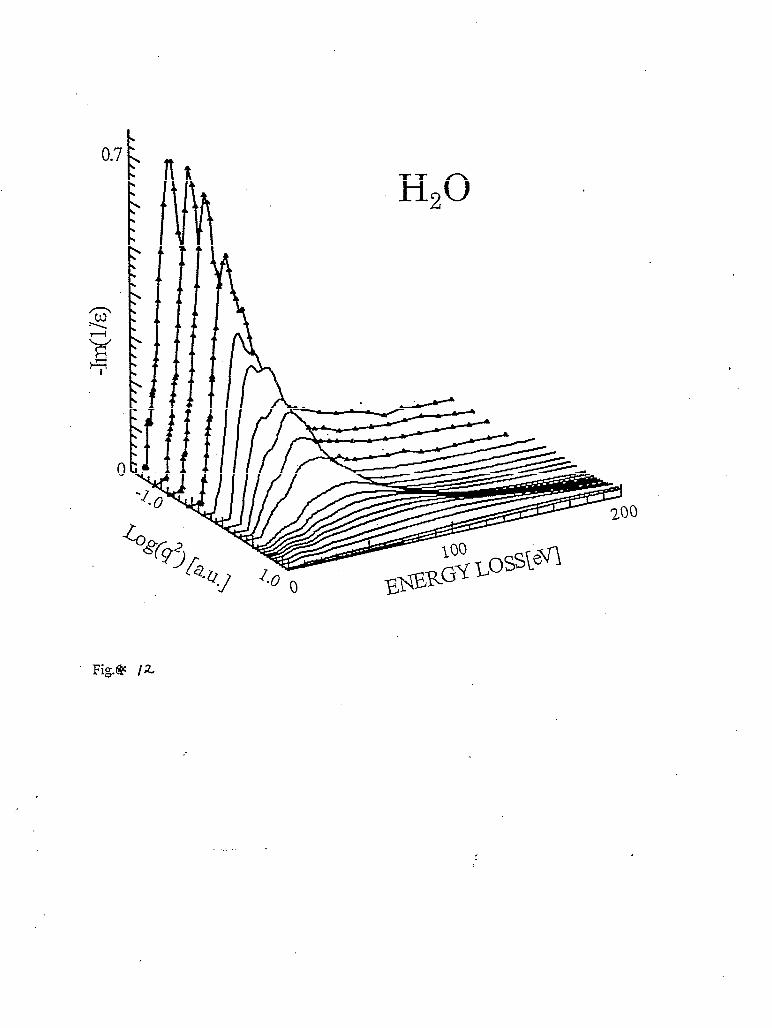
. 0.7 ; c . . \ . . . \ . . . \ . zj- F-l
zig I
Fig.@ /Z

0.8
'I
Fig.8 13

0.04
1
s- 2 0.02
0
I 1 I I i I I I I I 1
ep 0 Ivita
OH 0
J 0 A e.19 a-u.
v 0 q 07 028 a&l.
v 0 V 0 w” 0 037 au.
$ ",o V 0.53 a.u.
v ;oo. 8, v
0 0.69 au. O
100 EnergyLoss [ev
Fig. 14
1.. 1.

&--I
@. 19a.U
028
0.37 3
0.53
0.69

liq. Hz0
El -- %
Fig.H 16
.
,.. .-. , r 2

I I I ‘ I I I I , I I , I , I , , , - 00 w HF --CCSD -
- CISD d-
0 1 S&l
3 4
2- , , , , , , , r , , , , , , , , , , ,
- (b)C&. HF -- CCSD
- CISD
,_ . . . r

9
0
8339 eV
8338 eV
8337 eV
8336 eV
8335. eV
8334 eV
EDC?A \
30 I I I I I I
50 60 70 80 ho 1
- ha2 [eV] 90

Intensity [cps]
E2
0 0 Lo
s c\(
s -
- =:
00 0

0 8. .
0
8310 8320 8330 8340 8350 8360 8370 Photon Energy [eV]
._: I.

25
0
8355
8353
8350,
8348
8346 8344 8342 8340
2 4 Energy -Transfer [eV]
10 12
8325 8340 8355 Photon Energy [eV]
8370

g3dak f----
Intermediate State
Initial State Final State
I . .

25 .
0
Resonant Inelastic Scattering: NiO
GS . \
XPS(N-1) BIS(N+l)
dg
I .- I I 1 I 1
.- -
0 2.5 -5.0 -2.5 5.0 7.5 10.0
Energy Loss [eV]

0 2’ 4 6
4 @.u.>
‘7’ r; . . . .-
.:

0.05
g 0.02 Y
2 0 “a,
-0.02
-0.05
p (a.u.) .

(b)
0.05
0.02
0
-0.02
-0.05 :, , v 9 ’ ~ *
0 1 2 3 4
p (a-u.)

0.6
0.4
0.2
0 4 6 8 10
P (a-u*>

0.3
0.2 c3
-0.2
~l....“‘~.‘~““~““~~ t 0 1 2 3 4
da. u-1

0.8
0.6
0
1
0 1 2 3 4. 5 6 - t(angs.)

1.5
0.5
0 0 1 . 2
4 (a-u-> 3 4

(b)
I 2 3 4 . q (a.u.)
.


(4
0.08
0.04
0
-0.04
0.5 I I.5 2 2.5 3 q (a.u.) .

0.12 (b)
0.5 1 1.5 2 2.5 3 4 (a-u.)

0.08
0.06
0.04
0.02
0
-0.02
-0.04
-0.06
I \ \ \ \ -. \ . \ \
I+-- . . . . \ . . \’ . . . \.
. : : : : I l
:
1 :
:
:
:
:
:
:
0 0.5 1.5 2

Figure Captions
Figure 1. Kinematics of inelastic X-ray scattering.
Figure 2a Schematics of X21 beamline at the NSLS. Figure 2b Pour bounce monochromator of X21 beamline.
Figure 3 Rowland circle spectrometer.
Figure 4 Intrinsic resolution of Si reflections at backscattering energies.
Figure 5 Dispersive spectrometer.
Figure 6 High resolution dispersive spectrometer.
Figure 7. Inelastic x-ray scattering spectra from liquid benzene taken at the scattering angle of (a) 6O”(q=1.96 au.) and (b) 9O”(q=2.77 a.u.). The excitation energy is 7270 eV. Inserted in (b) is an electron energy loss spectrum of gas phase benzene [HitchcockX7].
Figure 8. Comparison of experimental S(q,w) with calculated Compton spectra at several 4 values.
Figure 9. (a) XRS(dots) obtained from Inelastic x-ray scattering spectrum by removing the Compton tail. The assumed smooth background (solid line) is subtracted to obtain the oscillations as shown in (b). The excitation energy is 8400 eV and the momentum transfer isl.96 a.u.
Figure 10. Fourier transform of the extracted oscillations of diamond. Phase factor has been taken into consideration.
Figure 11. Polarized inelastic x-ray scattering spectra from K electrons of boron in h-BN crystal. Inserted are the schematic of anisotropy measurements.
Figure 12. Bethe surface of liquid water (loss function Imc/&(q,w) . Data were collected at X21 of NSLS (triangles) and at BL16X of Photon Factory (solid line).
Figure 13. Bethe surface of liquid benzene. Data were collected at X21 of NSLS (triangles) and at BL16X of PF (solid line).
Figure 14. Normalized dynamical structure factors S(q,w) of liquid water for O.l91q10,69 a.u.
Figure 15. The loss function, Im(l/&,w) , of liquid water for O.l9sqsO,69 a.u.

Figure 16. Real &r and imaginary s2 parts of the dielectric function of liquid water. Closed squares are &r calculated from index of refraction.
Figure 17. As(q) f or water (a) and benzene (b). Measured values (dots) are compared with Hartree-Fock CI (dotted line) and CCSD (dashed line) calculations.
Figure 18. Resonant Rarnan spectra at the Ni K absorption edge of NiO.
Figure 19. Spin-resolved XRRS spectra from a magnetized Gd metal film.
Figure 20 (a) Ni K edge absorption spectrum of NiO powder. (b) Inelastic scattering spectrum with the incident photon energy tuned to the main peak of the absorption spectrum.
Figure 21 Series of inelastic scattering spectra for an incident energy between 8340 eV and 8355 eV.
Figure 22. Constant final state scan for the 5 eV energy transfer.
Figure 23. Energy levels involved in the cluster description of RIXS on NiO.
Figure 24. Charge transfer energy of NiO determined by photoemission (XPS) and bremsstrahlung-isochromat spectroscopy (BIS) compared with that measured by RIXS
Figure 25. Total Compton profile of C6() (solid line), the calculated core contribution (dashed) and valence contribution (dotted).
Figure 26. Result from analytical reconstruction (dotted line) compared with true density (solid line). Reconstructed anisotropies in direction 100 (a) and 110 (b). (c) is estimated kinetic energy density
Figure 27 Compton anisotropy (a) and power spectrum (b) of Ice Ih. Experimental data (black diamonds) is compared with DFT solid state calculation (solid line) and molecular calculation (dashed).
Figure 28. (a) Superposition of the valence profiles for ChO (solid line) and graphite (dotted). (b) Difference between the two profiles : Experiment (dotted) is compared to DFT calculation (solid line).
Figure 29. Illustration of “bent graphite plane” model.
Figure 30 Differences between Compton profiles of intercalated graphite LiCr2 (a) or LiC6 (b) and pristine graphite. Solid line shows the experimental results. It is compared with the rigid band model (dotted) and a full band calculation (dashed).
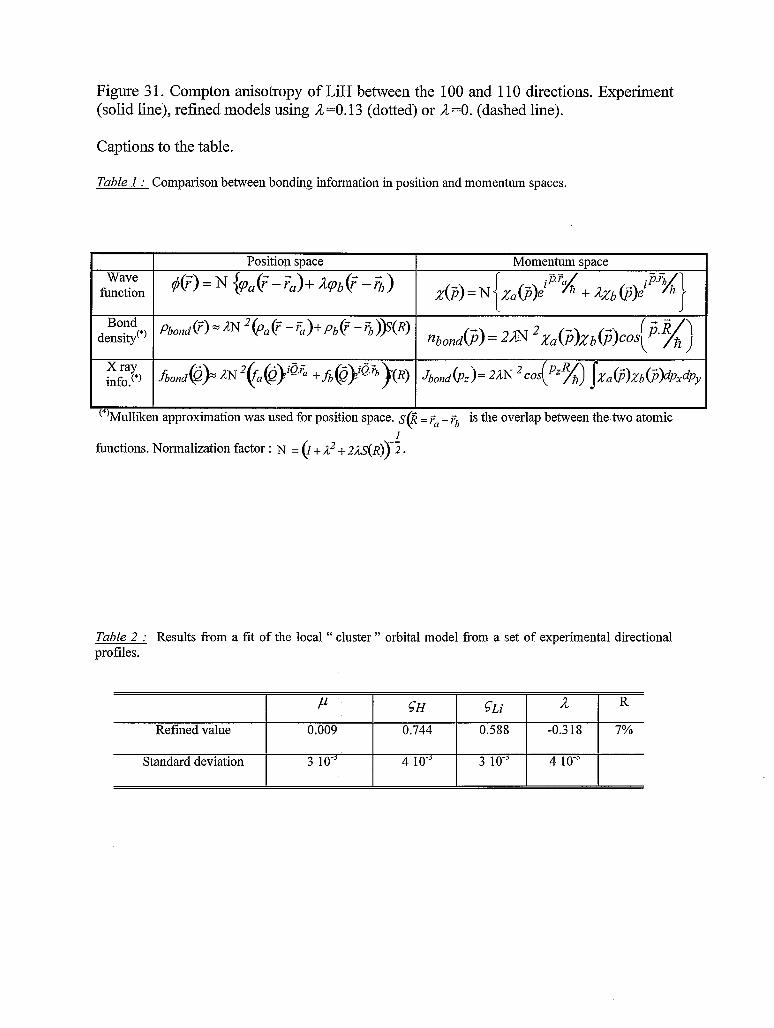
Figure 3 1. Compton anisotropy of LiH between the 100 and 110 directions. Experiment (solid line), refined models using 1 =O. 13 (dotted) or il =O. (dashed line).
Captions to the table.
Table 1: Comparison between bonding information in position and momentum spaces.
Position space Momentum space
Wave q$)=N {~a(?-~a)+Aip&-@,) function &) = N xajj)f% + AXb @);F.G n /
Bond density(*)
Pbolzd(~))CN2~~(~-r’,)+pb(~-It))S(R) nbond~)=~~.Q&j)xb~) co{ Fi)
@i/j
X ray info (*) j&,&)s ,lN2($a@)iQ~ +fh@j@+R) J&&&)= 2;2N *cos(pLRn ~,d.i%%(~~~~~~y
(*)Mulliken approximation was used for position space. $2 = F~ - F~ is the overlap between the two atomic
functions. Normalization factor : N = (I+ ;12 + &&$@)+.
Table 2 : Results ii-om a fit of the local “ cluster ” orbital model from a set of experimental directional profiles.
P 5H GLi a R
Refined value 0.009 0.744 0.588 -0.318 7%
Standard deviation 3 10” 4 lo-’ 3 10” 4 10”

References :
[Abbamonte99] P.A. Abbamonte, C. Burns, E.D. Isaacs, P.M. Platzman, L.L. Miller, S.W. Cheong, M.V. Klein, Phys. Rev. Lett. 83, 860 (1999).
[Bannett75] Y.B. Bannett, I. Freund, Phys. Rev. Lett. 34,372 (1975).
[Baron001 A.Q.R. Baron, Y. Tanaka, S. Goto, K. Take&a, T. Matsushita, T. Ishikawa, J: Phys. Chem. Solids 61,461-465 (2000)
[Bartlett811 R.J.Bartlett, Ann.Rev.Phys.Chem., 32,359 (1981)
[Bartolome97] F. Bartolome, J.M. Tonnerre, L. Seve, D. Raoux, J. Chaboy, L.M. Garcia, M. Krisch, C.-C. Kao, Phys. Rev. Lett., 79,3775 (1997).
[Batterman B. Batterman and H. Cole, Rev. Mod. Phys. 39 (1) 68 l-7 17 (1964)
[BClemlilga97] D. Belemlilga, ” Densites e’lectroniques etproprie’tes des cristaux mole’culaires : fullerenes et tetracyanoethylene ‘I, Thesis of Marne la Valle’e (1997)
[Blum85] M. Blume, J Appl. Phys. 57,36 15 (1985).
ponham74] R.A.Bonham and M.Fink, “High Energy Electron Scattering”, Van Nostrand- Reinhold, New York.
[Braiichler89] M. Bratichler, S. Lunell, I. Olovsson, W. Weyrich, Int. J Quantum Chem., 35, 895 (1989).
[Burke1911 E. Burkel, “Inelastic Scattering of X-Rays with Very High Energy Resolution”, Springer-Verlag (199 1).
[Butorin96] S.M. Butorin, D.C. Mancini, J.-H. Guo, N. Wassdahl, J. Norgren, M. Nakazawa, S. Tanaka, T. Uozumi, Y. Ma, K.E. Miyano, B.A. Karlin, D.K. Shuh, Phys. Rev. Lett. 77,574 (1996).
[Butorin96a] S.M. Butorin, J.-H.Guo, M. Magnuson, P. Kuiper, J. Norgren, Phys. Rev. B54, 4405 (1996).
[Caliebe96] W.A. Caliebe, C.-C. Kao, L.E. Berman, J.B. Hastings, M.H. Krisch, F. Sette, K. Hamalainen, J. Appl. Phys. 79,6509 (1996).
[Caliebe97] W.A. Caliebe, Dissertation, Kiel University.
[Caliebe97a] W.A. Caliebe, C.-C. Kao, M. Krisch, T. Oversluizen, P. Montanez, J.B. Hastings; The 10th National Conference on Synchrotron Radiation Instrumentation, Ithaca NY, July 1997, AIP Conference Proceedings 417,6, 1997.
1

[Carlisle961 J.A. Carlisle, E. L. Shirley, E.A. Hudson, L.J. Terminello, T.A. Callcott, J.J. Jia, D.L. Ederer, R.C.C. Perera, F.J. Himpsel, Phys. Rev. Lett. 75, 1234 (1996).
[ChomilierS5] J. Chomilier, G. Loupias, J. Felsteiner, N.LM, A235, 603 (1985)
[Cohen881 C. Cohen-Tannoudji, J. DuPont-Rot, and G. Grynberg, “Atom-Photon Interactions: Basic Processes and Applications” (Wiley, 1992; translated from the French edition, 1988).
[Cooper851 M.J. Cooper, Rep. Prog. Phys., 48,415 (1985)
[Coulson41] C.A. Coulson, Proc. Camb. Phil. Sot. 37,55 (1941)
[Da&71 G.P. Das, K.V. Bhagwat, V.C. Sabni, Phys. Rev. B36,2984 (1987)
[Dobrzynski96] L. Dobrzynski, A. Holas, Nucl. Inst. and Meth. in Phys. Res. A383,589 (1996)
[DuMond29] J.W.M. DuMond, Phys. Rev. 33,643 (1929)
puMond33] J.W.M. DuMond, Rev. Mod. Phys. 5, 1 (1933)
[Eisenberger70] P. Eisenberger, P.M. Platzman, Phys. Rev. A2,415 (1970)
[Eisenberger71] P.Eisenberger and W.C.Marra, Phys.Rev.Lett. 27, 1413(1971).
[Enkisch99] H. Enkisch, A. Kaprolat, W. Schulke, M.H. Krisch, M. Lorenzen, Phys. Rev. B60, 8624 (1999).
[Epstein771 I. R. Epstein, A.C. Tanner, Compton Scattering, Ed : B.G. Williams, McGraw-Hill, Great Britain (1977)
wtelaniemi921 V. Etelaniemi, K. Hamalainen, S. Manninen, P. Suortti, J. Phys. : Condens. Matter 4, 879(1992).
[Felsteiner74] J. Felsteiner, P. Pattison, M.J. Cooper Phil. Mug., 30, 537 (1974)
[FujimoriS4] A. Fujimori, F. Minami, Phys. Rev. B30,957 (1984).
[Gibbs881 D. Gibbs, D.R. Harshman, E.D. Isaacs, D.B. McWhan, D. Mills, C. Vettier, Phys. Rev. Lett. 61, 1241(1988).
[Gillet95] J.-M. Gillet, P.J. Becker, G. Loupias, Acta Cryst. A51,405 (1995)
[Gillet J.-M. Gillet, C. Fluteaux, P.J. Becker, Phys. Rev. B60,2345 (1999)
[Hamalainen95] K. Hamalainen, M. Krisch, F. Sette, C.-C. Kao, W.A. Caliebe, J.B. Hastings, Rev. Sci. Instrum. 66, 1525 (1995).
2

[HamalainenOO] K. Hamalainen, J.P. Hill, S. Huotari, C.-C. Kao, L.E. Berman, A. Kotani, T Ide, J.L. Peng, R.L. Greene, Phys. Rev. B61, 1836-1840 (2000).
[Hansen801 N. K. Hansen, Reconstruction of Electron Momentum Distribution j?om a set of Directional Compton ProJZes, Reports of the Hahn-Meitner-Institut, HMI B342 (1980)
[Hansen871 N.K. Hansen, P. Pattison, J.R. Schneider, 2. Phys. B66,305 (1987)
@annon J.P. Harmon, G.T. Trammell, M. Blume, D. Gibbs, Phys. Rev. Lett. 61, 1245(1988).
[Hastings781 J.B. Hastings, B.M. Kincaid and P. Eisenberger, NucZ. Intrum. Methods 152, 167 (1978)
[Hastings911 J.B. Hastings, D.P. Siddons, U. van Burck, R. Hollatz, U. Bergmann, Phys. Rev. Lett. 66,770 (1991).
[Hayashi98] H.Hayashi, N.Watanabe, Y.Udagawa, and C.-C.Kao, J Chem.Phys. 108,823 (1998).
[HayashiOO] H.Hayashi, N.Watanabe, Y.Udagawa, C.-C.Kao, Proc. NatZ. Acad. Sci. USA, in press (2000).
[Heller74] J.M.Heller,Jr., R.N.Hamm, R.D.Birkhoff, and L.R.Painter. J.Chem.Phys.60,3483 (1974).
[Hi1198] J.P. Hill, C.-C. Kao, W.A. Caliebe, M. Matsubara, A. Kotani, J.L. Peng, R.L. Greene, Phys. Rev. Lett. 80,4967 (1998).
[HitchcockS A.P.Hitchcock, J: phys. them. 91,53 1 (1987)
[HoltSO] R.S. Holt, M.J. Cooper, PhiZ.Mag. B41, 117 (1980)
[HoughSO] D.Hough and L.R.White, Adv. CoZZoid and Interface Sci. 14,3(1980).
[IdCOO] T. Ide and A. Kotani, to be published in j. phys. Sot. Jpn. (2000)
[Inokuti71] Inokuti, Rev. Mod. Phys. 43,297(1971).
[Isaacs99], E.D. Isaacs, A. Shukla, P.M. Platzrnan, D.R. Hamann, B. Barbiellini, C.A. Tulk, Phys. Rev. Lett., 82,600 (1999)
[Ishikawa92] T. Ishikawa, Y. Yoda, K. Izumi, C.K. Suzuki, X.W. Zhang, M. Ando, S. Kikuta, Rev. Sci. Instrum. 63, 1015 (1992).
[IssolahSS] A. Issolah, B. Levy, A. Beswick, G. Loupias Phys. Rev. A38,4509 (1988)
[Issolah91] A. Issolah, Y. Garreau, B. Levy, G. Loupias Phys. Rev. B44, 11029 (1991)
3

[Iwazumi97] T. Iwazumi, K. Kobayashi, S. Kishimoto, T. Nakamura, S. Nanao, D. Ohsawa, R. Katano, Y. Isozumi, Phys. Rev. B56, R14267 (1997).
[Jia96] J.J. Jia, T.A. Callcott, E. L. Shirley, J.A. Carlisle, L.J. Terminello, A. Asfaw, D.L. Ederer, F.J. Himpsel, R.C.C. Perera, Phys. Rev. Leg. 76,4054 (1996).
wao96] C.-C. Kao, W.A. Caliebe, J.B. Hastings, J.-M. Gillet, Phys. Rev. B54, 16361 (1996).
[Kao96a] C.-C. Kao, W.A. Caliebe, K. Hamalainen, M. Krisch, J.B. Hastings, Rev. Sci. Instrum. 67 (1996).
[Kerr721 G.D.Kerr, R.N.Hamm, M.W.Williams, R.D.Birkhoff, and L.R.Painter. Phys.Rev.AS, 2523(1972).
[KoningsbergerSS] D.C.Koningsberger and R.Prins, “X-ray Absorption”, John Wiley & Sons, New York, 1988.
Eontrym-Sznajd991 G. Kontrym-Sznajd, M. Samse1,R.N. West, Acta phys. PoZ. A95, 591 (1999)
[Krisch95] M.H. Krisch, C.-C. Kao, F. Sette, W.A. Caliebe, K. Hamalainen, J.B. Hastings, Phys. Rev. Lett. 74,493 1 (1995).
[Krisch96] M.H. Krisch, U. Bergmann, C. Masciovecchio, R. Verbeni, J. Goulon, W.A. Caliebe, C.-C. Kao, Phys. Rev. B54, R12673 (1996).
[Krisch97] M.H. Krisch, F. Sette, C. Masciovecchio, R. Verbeni, Phys. Rev. Lett. 78, 2843(1997).
[Kuiper98] P. Kuiper, J.-H. Guo, C. Sathe, L.-C. Duda, J. Norgren, J.J.M. Pothuizen, F.M.F. de Groot, G.A. Sawatzky, Phys. Rev. Lett. SO,5204 (1998).
[Larson961 B.C. Larson, J.Z. Tischler, E.D. Isaacs, P. Zschack, A. Fleszar, A.G. Eguiluz, Phys. Rev. Lett. 77, 1346 (1996).
[LoupiasSOa] G. Loupias, J. Petiau, J. Phys. 41,265 (1980).
[Loupias86] G. Loupias, J. Chomilier, 2. Phys. D2,297 (1986)
[Ma921 Y. Ma et al., Phys. Rev. Lett. 69,2598 (1992).
[Ma951 Y. Ma et al., Phys, Rev, Lett. 74,478 (1995).
[Mijnarends77] P.E. Mijnarends, Compton Scattering, ed : B.G. Williams, McGraw-Hill, Great Britain (1977)
4

@Wzuno67] Y. Mizuno, Y. Ohmura, J: Phys. Sot. Jpn. 22,445-449 (1967).
[Moscovici95] J. Moscovici, G. Loupias, S. Rabii, S. Erwin, A. Rassat, C. Fabre, Europhys. Lett., 31, 87 (1995)
[Nishikawa87] K.Nishikawa and T.Iijima, JChem.Phys. 87,3753(1987).
[PapoularOO] R. Papoular et al, submitted to Phys. Rev. Lett. (2000)
[Pattison P. Pattison, W. Weyrich, B. Williams, Solid St. Commun., 21,967 (1977)
pattison P. Pattison, J.R. Schneider, Solid St. Commun., 28, 581 (1978)
[Pattison P. Pattison, W. Weyrich, J. Phys. Chem. Solids, 40,213 (1979)
[Pines891 D. Pines and P. Nozieres, “The Theory of Quantum Liquids”, Vol. 1, Addison Wesley, Massachusetts, 1989.
[Platzman77] P.M. Platzman, N. Tzoar, Compton Scattering, Ed : B.G. Williams, McGraw-Hill, Great Britain (1977)
[RabiiSg] S. Rabii, J. Chomilier, G. Loupias, Phys. Rev. B40, 10105 (1989)
[ReiterOO] G. Reiter J. Mayers, J. Noreland, submitted to Phys.Rev. B (2000)
[Rubensson90] J.-E. Rubensson et al., Phys. Rev. Lett. 64, 1047 (1990);
[Sakurai92] Y.Sakurai, M. Ito, T. Urai, Y. Tanaka, N. Sakai, T. Iwazumi, H. Kawata, M. Ando, N. Shiotani, Rev. Sci. Instrum. 63, 1190 (1992).
[Sawatzl$34] G.A. Sawatzky, J.W. Allen, Phys. Rev. Lett. 53 (1984) 2339
[Schiilke91] W. Schtilke, Handbook on Synchrotron Radiation, 3, Ed : G. Brown and D.E. Moncton, Elsevier Science Publishers (199 1)
[Schulke95] W.Schulke, J.R.Schmitz, H.Schlte-Schrepping, and A.Kaprolat, Phys.Rev. B52, 11721(1995).
[Schwoerer-Bohning981 M. Schwoerer-Bohning, A.T. Macrander, P.M. Abbamonte, D.A. Arms, Rev. Sci. Instrum. 69,3 109 (1998).
[Set0951 M. Seto, Y. Yoda, S. Kikuta, X.W. Zhang, M. Ando, Phys. Rev. Lett. 74,3828 (1995).
[Sette] Phys. Rev. Lett. 83,5583(1999); Phys. Rev. Lett. 82, 1776(1999); Phys. Rev. Lett. 82,775(1999); Phys. Rev. Lett. 80,544(1998); Phys. Rev. Lett. 80,4205(1998); Phys. Rev. Len. 80,3515(1998); Phys. Rev. Lett. 80,2161(1998); Phys. Rev. Lett. 79, 1678(1997); Phys. Rev. Let?.. 78, 1715(1997); Phys. Rev. Lett. 78,2843(1997);Phys. Rev. Lett.
5

77,3835(1996); Phys. Rev. Lett. 77, 83(1996); Phys. Rev. Lett. 76,3356(1996); Phys. Rev. Lett. 75,850(1995);
[Shukla99] A. Shukla, B. Barbiellini, A. Erb, A. Manuel, T. Buslaps, V. Honkimaki, P. Suortti, Phys. Rev. B 59,12127 (1999)
[Sparks741 C. J. Sparks, Jr., Phys. Rev. Lett. 33,262 (1974).
[Suortti99] P. Suortti, T. Buslaps, P. Fajardo, V. Honkim&i, M. Kretzschmer, U. Lienert, J. E. McCarthy, M. Renier, A. Shukla, T. Tschentscher and T. Meinander, J. Synchrotron Rad. 6,69 (1999).
[Suzuki671 T.Suzuki, JPhys.Soc.Jpn. 22, 1139(1967).
[TakahashiOO] M. Takahashi, N. Watanabe, Y. Wada, S. Tsuchizawa, T. Hirosue, H. Hayashi, Y. Udagawa, J. Electron Spectrosc. Relat. Phenom., submitted (2000).
[Tan931 Z. Tan, S.M. Heald, S-W. Cheong, A.S. Cooper, A.R. Moodenbaugh, Phys. Rev. B47, 12356 (1993).
[Tanaka931 S. Tanaka, A. Kotani, J. Phys. Sot. Jpn., 62,464 (1993).
[TohjiS7] K.Tohji and Y.Udagawa, Phys.Rev B. 36,9410-9412 (1987).
[Tohji89] K.Tohji and Y.Udagawa, Phys. Rev B. 39,7590-7594 (1989).
[Tohji90] K.Tohji, Y.Udagawa, T.Matsushita, M.Nomura, and T.Ishikawa, J. Chem. Phys. 92, 3233-3235 (1990)
[Tsutsui99] T. Tsutsui, T.Tohyama, S. Maekawa, Phys. Rev. Len. 83,3705 (1999).
[Udagawa97] Y.Udagawa, J. dephys. N, Colloque C2,347(1997).
[vanElp92] J. van Elp, H. Eskes, P. Kuiper, G.A. Sawatzky, Phys. Rev. B45, 1612 (1992).
wanHove L. Van Hove, Phys. Rev. 95,249 (1954)
[Warren901 B.E. Warren, X-Ray dzfiaction, Dover Publications Inc., Mineola, N.Y. (1990)
Watanabe961 N.Watanabe, H.Hayashi, Y.Udagawa, K.Takeshita, and H.Kawata, AppZ. Phys. Lett. 69, 1370( 1996) and references therein.
[Watanabe971 N.Watanabe, H.Hayashi, Y.Udagawa, Bull. Chem. Sot. Jpn. 70,719( 1997).
Watanabe981 N.Watanabe, H.Hayashi, Y.Udagawa, S.Ten-no, and S.Iwata, JChem.Phys. 108, 4545-4553(1998).
6

[Watanabe991 N. Watanabe, S.Ten-no, S.Pal, S.Iwata, and Y.Udagawa, J. Chem. Phys. 111,827(1999).
milliams77] B.G. Williams, Compton Scattering, McGraw-Hill, Great Britain (1977)
[Williams911 Williams, E.T.Arakawa, and T.Inagaki, in “Handbook on Synchrotron Radiation, vol. 4”, p.95. ed. S.Ebashi, M.Koch, and E.Rubenstein, Elsevier Science Publishers B.V. 1991,
[ZannenS5] J. Zaanen, G.A. Sawatzky, J.W. Allen, Phys. Rev. Lett. 55,418 (1985).
7


![High resolution inelastic X-ray scattering from thermal collective … · 1 Note that resonant X-ray scattering can have very strong magnetic contributions [14], and inelastic experiments](https://static.fdocuments.in/doc/165x107/60a9022064d640760449217f/high-resolution-inelastic-x-ray-scattering-from-thermal-collective-1-note-that-resonant.jpg)