CHEMICAL AND BIOCHEMICAL APPLICATIONS OF LASERS › general › pdf › 953.pdf · cance in the...
44
Y -. CHEMICAL A N D BIOCHEMICAL APPLICATIONS OF LASERS FAR INFRARED LASER MAGNETIC RESONANCE * K. M. Evenson, R. J. Saykally , and D. A. Jennings National Bureau of Standards Boulder, Colorado R. F. Curl, Jr. Department of Chemistry Rice University Houston, Texas and J. M. Brown Department of Chemistry University of Southampton Southampton, England T. BASIC CONCEPTS Within the last few years, laser magnetic resonance (LMR) has emerged as a powerful technique for the detection of transient species in the gas phase and the study of their rotational spectra. The sensitivity of this method is con- ' siderably higher than those of most competing techniques, such as conventional optical and microwave spectroscopy and gas-phase EPR, while the resolution attainable is comparable _- with that of the latter two methods. The domain of appli- cability of LMR presently includes atoms, ground states of molecules with up to 5 atoms, and most recently, short lived Present address: Department of Chemistry University of California Berkeley, California 95 ISBN 0-12-505405-X
Transcript of CHEMICAL AND BIOCHEMICAL APPLICATIONS OF LASERS › general › pdf › 953.pdf · cance in the...
Y
- .
CHEMICAL AND BIOCHEMICAL APPLICATIONS OF LASERS
FAR INFRARED LASER MAGNETIC RESONANCE
* K . M . Evenson, R . J . S a y k a l l y , and D . A . J e n n i n g s
National Bureau of Standards Boulder, Colorado
R . F . C u r l , J r .
Department of Chemistry Rice University Houston, Texas
and
J . M . Brown
Department of Chemistry University of Southampton Southampton, England
T. BASIC CONCEPTS
Within the last few years, laser magnetic resonance (LMR) has emerged as a powerful technique for the detection of transient species in the gas phase and the study of their rotational spectra. The sensitivity of this method is con-
' siderably higher than those of most competing techniques, such as conventional optical and microwave spectroscopy and gas-phase EPR, while the resolution attainable is comparable
_ - with that of the latter two methods. The domain of appli- cability of LMR presently includes atoms, ground states of molecules with up to 5 atoms, and most recently, short lived
P r e s e n t a d d r e s s : Depar tmen t of C h e m i s t r y U n i v e r s i t y o f C a l i f o r n i a B e r k e l e y , C a l i f o r n i a
95 ISBN 0-12-505405-X
96 K. M. Evenson et al.
metastable molecular electronic states, and molecular ions. The only rigorous constraint on this applicability is that the species of interest must be paramagnetic.
While LMR had its inception and early development in the far-infrared (FIR) region of the spectrum (40-900 pm), it has recently been extended to include vibrational transitions in the mid-IR (9-10 pm) and near-IR (5-6 pm), where it similarly has exhibited substantial capabilities. The laser Stark analogue of this technique has been developed quite effec- tively in the mid- and near-IR regions, although not yet in the far-infrared. In this paper we focus on the magnetic resonance methods in the far-IR. cogent and concise summary of the important features of laser . magnetic resonance spectroscopy. First, we introduce the basic concepts of LMR, then the origin and development of the technique will be traced and salient results will be presented in Section 11. In Section 111, we describe the apparatus, and in Section IV, the dependence of sensitivity on the various experimental parameters will be elucidated. In Section V linear Zeeman theory will be used to assign a simple spectrum. Finally, the theoretical foundations for the analy- sis of LMR spectra are developed in Section VI.
electron paramagnetic resonance , (EPR) ,1 so successfully ex- ploited by Radford and by Carrington and his collaborators a decade ago. energy levels of an absorbing sample are tuned by a DC mag- netic field until their difference frequency equals that of a fixed-frequency source. these two experiments is that in EPR the relevant transition is between different magnetic sublevels (MJ) of the same angular momentum state (J), typically occurring in the micro- wave region for normally accessible laboratory magnetic fields (2 tesla); in LMR, the transitions are between rotational states in molecules or fine-structure levels in atoms, and the transitions occur in the far-infrared. In EPR, the tran- sition can in principle be tuned to coincidence with any fre- quency lower than its maximum tunability (10 GHz, on the average), but in LMR one must rely on a near coincidence between the laser frequency and the transition frequency to within about 1%, given the same tunability. In each experi- ment the sample is contained inside a resonant cavity. The increased sensitivity of LMR is mainly derived from operating at frequencies roughly 100 times higher than those of the microwaves normally used in EPR, since absorption coefficients normally increase with either the square or the cube of fre- quency for hv << kT and Av(homogeneous) > Av(Dopp1er). A l s o , by placing the absorbing sample inside the laser cavity,
It is our hope to present a
LMR is intimately related to the technique of gas-phase
In both experiments appropriate paramagnetic
The principal difference between

Far Infrared Laser Magnetic Resonance 97
additional sensitivity (up to 2 orders-of-magnitude) results from its interaction with the gain medium of the laser.
A schematic diagram of an LMR spectrometer is shown in Fig. 1. The laser oscillates between mirrors A and B in a
BEAM SPLITTER
F i g . 1. S c h e m a t i c d i a g r a m o f f a r i n f r a r e d e l e c t r i c a l d i s - c h a r g e l a s e r m a g n e t i c r e s o n a n c e s p e c t r o m e t e r s .
single longitudinal mode. The cavity resonance can be tuned to the center of the gain curve by cavity length adjustment of mirror B. The polyethylene or polypropylene membrane window separates the intracavity sample cell on the left from the lasing medium on the right. Earlier designs incorporate dis- charge excitation in H20, D20 etc. to generate cw lines in the 30 to 150 cm-I range. pumping CH30H, CH3F and other gases with C02 laser radiation
lines from roughly 50 different gases have been made to oscil- late in optically pumped FIR laser systems. These have been conveniently tabulated by Knight.2 The frequency of many of these lines have been measured with a precision near 0.3 MHz (a few parts in lo7). The intracavity absorption cell is located between the pole caps of a large electromagnet on which modulation coils have been wound. The cell is part of a flow system in which radicals are generated either directly in a 2450 MHz microwave discharge or by adding reactants to the products of a discharge close to the laser cavity. The beam splitter is set at the Brewster angle and polarizes the radiation. By rotation about the laser axis, transitions with either AM = 0 or 2 1 can be selected. A small fraction of the radiation can be coupled by reflection from the beam
Many more lines are now available by
- in place of the electric discharge. Indeed nearly 1000 cw
98 K. M. Evenson et al.
splitter to the detector, normally a helium cooled bolometer.
about 1 x lo6 1O1O cmm3, for optical absorption it is about 10l1 ~ m - ~ , and for uv resonance fluorescence with a water vapor discharge source it is 3 x lo9 ~ m - ~ . troscopic detection of OH radicals is obtained by laser in- duced fluorescence, 1 x lo6 cm-3 in ambient air, but can be improved with optimum conditions.
The resolution in LMR can be either Doppler or pressure- broadening limited, depending on the conditions. Normal op- erating pressures are near 133 Pascal (1 Torr), which will produce a pressure broadened linewidth of -10 MHz. The line- - -
width in Tesla also depends upon the magnetic tuning rate of the transition , which is typically -lo4 MHz/Tesla , giving linewidths of Tesla. The Doppler width for a molecule with molecular weight of 25 at a frequency of 1 THz is 1.2 MHz, so that at normal operational pressures Av(homogeneous) Av(Dopp1er). For suitably strong absorption signals, the
pressure broadening can be reduced well below the Doppler width, and sub-Doppler saturated absorption (inverse Lamb dip) spectra can be obtained as a result of the intracavity opera- tion of the spectrometer.
The detection limit for OH radicals by LMR is presently whereas for OH with EPR it is about 2 x
The highest sensitivity for spec-
11. DEVELOPMENT AND CHRONOLOGY
Professor M. Mizushima first pointed out the near coin- cidence of the N, J = 5, 5 + 3 , 4 magnetic dipole transition of 02 with the frequency of the HCN laser, and the possi- bility of Zeeman tuning these levels into coincidence with the laser. Subsequently, the first laser magnetic resonance signal was detected by Evenson, Broida, Wells, Mahler, and Mizushima3 in 1968, in the study of this rotational Zeeman spectrum of 02. The original spectrometer used the 337 um line of an HCN discharge laser in conjunction with a Fabry- Perot resonator absorption cell located outside of the laser cavity. This external Fabry-Perot consisted of a 10 cm long cylinder, 1.7 cm in diameter with one flat mirror and one 15 cm focal length mirror. Each mirror had a 0.75 mm coupling hole so as to facilitate operation as a transmission cavity, whose Q was near 5 x lo4. A Golay cell operating at 13.5 Hz was employed as the detector. Alignment and relative drift of the laser and the interferometer cavities constituted a serious experimental difficulty. Nevertheless, the N, J = 5, 5 f 3 , 4 magnetic dipole transition of the O2 ground state was detected with a reasonable signal-to-noise ratio, as shown
Far Infrared Laser Magnetic Resonance 99
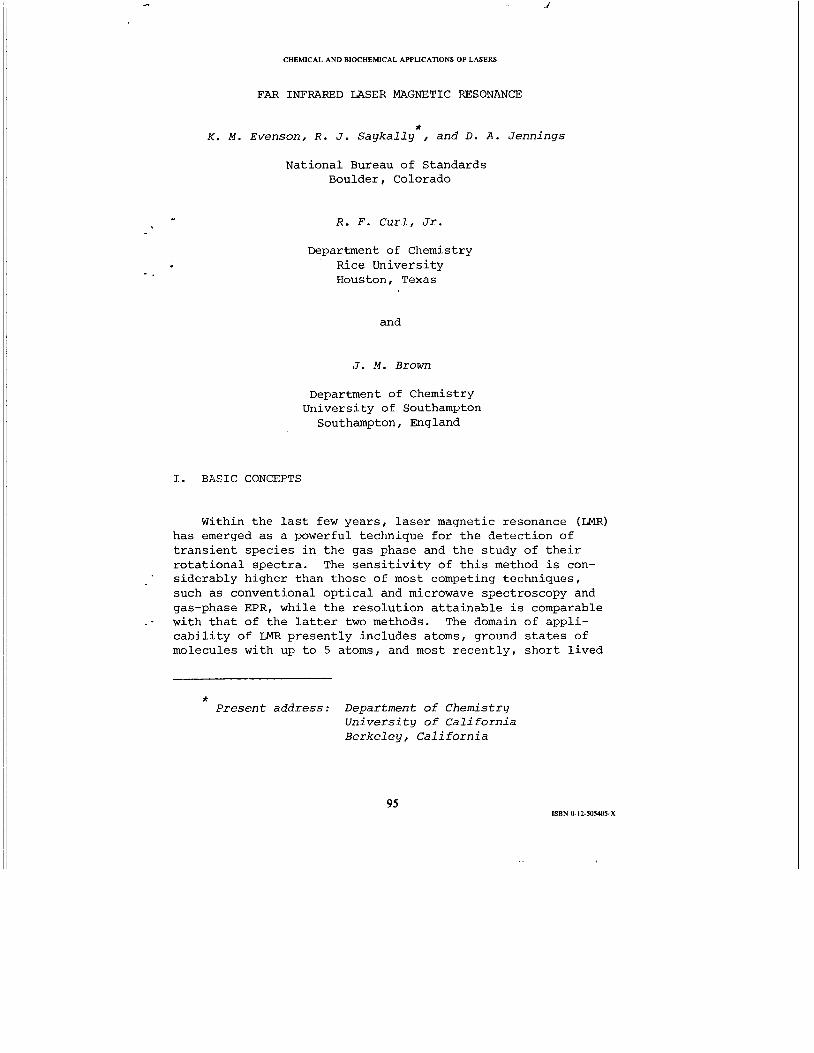
on the right side of Fig. 2. The first derivative of the absorption is recorded because an ac magnetic field is super- imposed on the dc field, and phase sensitive detection is employed.
161416
Magnetic Field (Gauss)
Fig. 2. (a) Trace of 0 2 lines using intracavity 891 GHz LMB spectrometer using a 1 sec time constant. (b) Trace of same 0 2 lines using external Fabry-Perot spectrometer and a 3 sec time constant. Both polarizations are present here.
Wells and Evenson* reported over an order-of-magnitude in- crease in the S/N ratio of this same O2 transition sometime
. later, effected by making the absorption cell an integral part of the laser cavity. This increase was realized for several reasons: the effective path length (EPL) increased by a factor of 2 because of the higher finesse of the HCN laser cavity; power at the Golay cell was increased by a factor of 25, thus reducing the effects of detector noise; and, as we now know, interaction with the gain medium produced an amplification. A comparison between the S/N ratios from the intracavity and external cavity spectrometers is given in Fig. 2 . This new spectrometer also incorporated the rotatable Brewster angle window dividing the laser discharge from the absorption cell, which produced the decided advantage of being able to select either cf or IT polarization.
operating on the 337 - and 311 um laser lines produced spectra Laser magnetic resonance experiments using the HCN laser

100 K. M. Evenson et al.
of both 02’ and NOZ.~ replaced the HCN laser with a water vapor laser, operating on the 78-, 79-, and 119 Pm lines of H20, and used this system to observe the first LMR spectra of a transient molecule -OH. The 79.1 pm line was used to detect the 2111/2, J = 1/2 f
2
observe J = 5/2 f 3/2 in the 2113/2 state. OH was formed by reacting atomic hydrogen, produced in a 2450 MHz discharge, with NO2 in a flow tube.
method occurred in 1971, when Evenson, Radford, and Moran8 used the 118.6 Pm H20 laser line to detect the J = 7/2 f 5/2, N = 3 + 2 pure rotational transition of the extremely elusive CH radical in a low-pressure oxyacetylene flame. While EPR had yielded spectra of many similar transient radicals with 211 ground states, all attempts to observe such spectra from CH had failed. Similarly, astronomical searches for the 10 cm lambda-doubling transition had resulted only in frustration. The successful detection of CH clearly demonstrated the high sensitivity of the LMR technique; CH in the ground vibrational and rotational state yielded signals 260 times noise for an absorption path of 5 cm - roughly 30 times the S/N reported for an optical absorption experiment!
Havin3 achieved this high level of sensitivity, LMR studies of NO and 021° 8
lished in 1972. In 1974, the detection of another important free radical - Hop, the hydroperoxyl radical, of great signifi- cance in the upper atmosphere - was reported by Radford, Even- son, and Howard.12 While poorly resolved electronic and vibra- tional spectra had been produced for Hop in earlier photolysis and matrix isolation studies, virtually nothing was known about its rotational spectra. LMR pure rotational transitions were observed in H02 with the three H20 laser lines, and at 72-, 84-, and 108 um with the D 2 0 laser. The analysis of these complicated LMR spectra without the availability of spectroscopic information from other sources,e.g., optical spectroscopy, presented a formidable challenge. Accordingly, Hougen13 developed a general approach for assigning laser magnetic resonance molecular spectra without having prior knowledge of the molecular structure of the species respon- sible for them, and Hougen, Radford, Evenson, and Howard14 analyzed the H02 LMR spectra in particular.
Even greater sensitivity had been effected with the water vapor laser system by replacing the ingenious but noisy Golay detector by a liquid helium cooled bolometer. The detection limit for OH was then determined to be 2 x lo8 cm-3 - better than any spectroscopic technique existing at that time.
In 1970, Evenson, Wells, and Radford7
n3/2, J = 3/2 transition, and the 118.6 um line was used to
Perhaps the single most important development of the LMR - -
The observed LMR spectrum of CH is shown in Figure 3.
using the three H20 laser lines, were pub-

Far Infrared Laser Magnetic Resonance 101
OH b OH
I I I 0 IO 20
kG
F i g . 3 . The 118.6 Ftm H 0 laser magnetic resonance spec- 2 trum of CH produced by a low-pressure oxyacetylene flame.
Shortly after this work, Cook, Evenson, Howard, and Curl reported the observation and analysis of the LMR spectrum of HCO, another nonlinear radical of considerable importance in flames. 108 pm D 2 0 laser line, with the HCO being generated by the reaction of atomic fluorine with formaldehyde.
Meanwhile, another group began to use an H20 laser system for magnetic resonance spectroscopy; in 1975,Davies, Russell, Thrush , and Wayne'' at Cambridge University reported detection of the amino radical (NH2) by laser magnetic resonance. In their work, three different pure rotational transitions were observed at 78-, 118.6-, and 108 pm, and assigned to the 2B1 ground state of NH2. Shortly afterward, this same group reported the LMR spectrum of the PH17 and PH218 radicals, formed by reacting F atoms with phosphine (PH3). The 64,3 f 5?,2 rotationa tions in the X C and a A states of PH were detected with the 118.6 pm line of the H20 laser.
ity, linearity, and versatility of LMR might make it a
15
The 82,6 f 71,7 transition was observed with the
2 transi ion of PH2 ( B1) and N = 5 + 4 transi- 5 - 5 By this point it had become clear that the high sensitiv-
102 K. M. Evenson et al.
powerful means by which the kinetics of certain very reactive intermediates could be studied. With a single water vapor oscillator, it would be possible to detect and measure quanti- tatively all of the free radicals nO HCO, OH, CHI NH2, PH2, 2 ' 02, NO, and NO samples. Howard and Evenson19 demonstrated that the peak-to- peak amplitude of the TNR signal was directly proportional to species concentration over large ranges if the total pres- sure and modulation amplitude were held constant during the - run. (Surprisingly, the signal was largely independent of laser power).
Thus, by combining well-known flow reactor techniques with the laser magnetic resonance detection system, it became prac' -
tical to study reactions involving unstable intermediates such as HCO and H02 by directly monitoring their concentrations. The chemistry of these two species in particular had remained uncertain for some time, precisely because such reactions had been studied only by inairect methods, in which the radicals themselves were not detected.
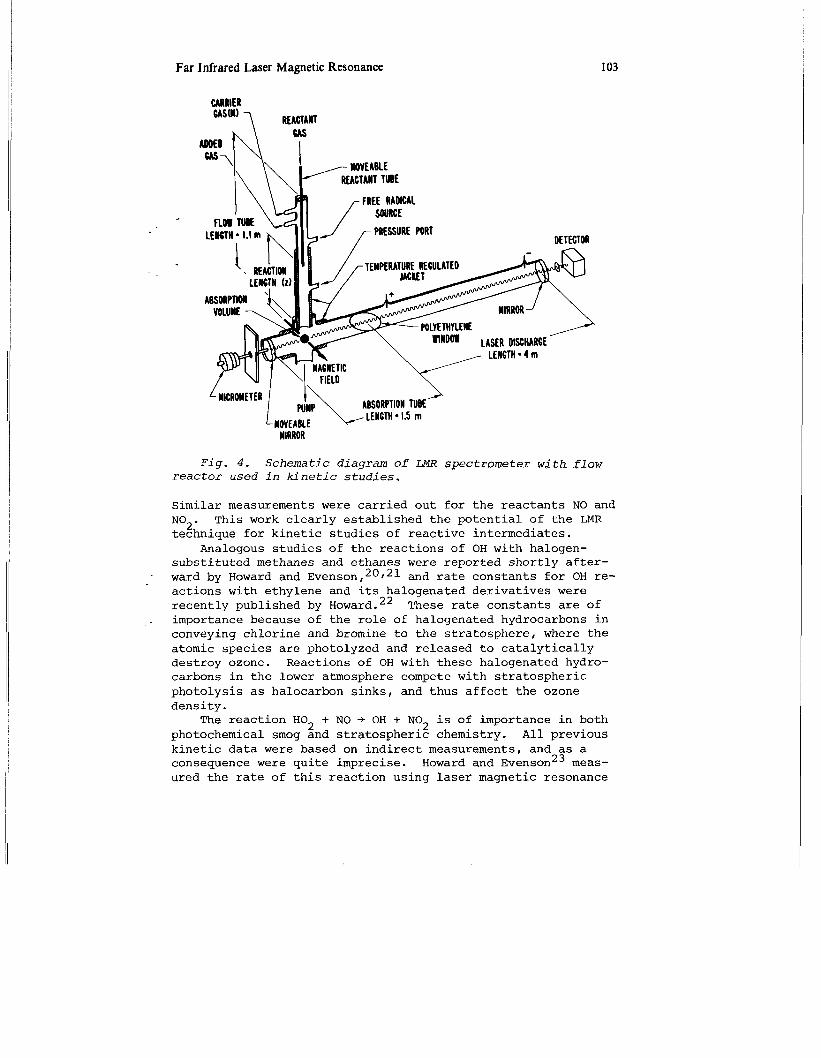
hydroxyl radical (OH) with CO, NO, and NO2. A diagram of the flow tube apparatus and the water vapor LMR detection system is shown in Fig. 4. In this work, OH was produced by the re- action of H atoms (from a 2450 MHz discharge) with NO in the main flow tube. region of the flow tube along with a large excess of carrier gas (He or Ar). Reactant gas (e.g. , CO) is added through the inner tube, which can be adjusted to a distance ( z ) from the detection volume. By monitoring the OH LMR signal and chang- ing z , and thus the reaction time, a plot of In [OH] vs z can be obtained. If the reactant gas (e.9. CO) is present in suf- ficient excess such that pseudo-first-order kinetics prevail,
dlnroH1 = -k[COl. The time in- then this plot is linear, and dz terval, dt, is given by dt = -, where is the average flow
velocity, in turn defined by v = - - - the flow tube radius, Pt is the total pressure, T is the ab- solute temperature, and Ft is the total flow rate in standard
at very low concentrations in mixed gas 2
Howard and Evenson19 tested the method on reactions of the
2 The OH radicals travel through the outer
dt
V where r is - 1 760 T
2 P 273 Ft' vr t
cm3/sec. - dln[OH]
Combining these expressions yields the relation
din[oHi is the slope of the plot of ln[OHl dz = -k [CO] ; V dz vs z, and the CO concentration can be obtained by the relation
[col = x P x const, where the constant is simply the
appropriate conversion factor. Therefore, the rate constant for the reaction OH + CO + C02 + H can be obtained directly.
E'
t Ft
Far Infrared Laser Magnetic Resonance 103
CARRIER
7 REACTANT
-FREE RADICAL .
MICROMETER 1 I'L ABSORPTION TUBE
LENGTH - 1.5 m MOVEABLE
MIRROR
Pig. 4. Schematic diagram of LMR spectrometer with flow reactor used in kinetic studies.
Similar measurements were carried out for the reactants NO and NO2. technique for kinetic studies of reactive intermediates.
Analogous studies of the reactions of OH with halogen- substituted methanes and ethanes were reported shortly after- ward by Howard and Evenson,20,21 and rate constants for OH re- actions with ethylene and its halogenated derivatives were recently published by Howard.22
_ _ importance because of the role of halogenated hydrocarbons in conveying chlorine and bromine to the stratosphere, where the atomic species are photolyzed and released to catalytically destroy ozone. Reactions of OH with these halogenated hydro- carbons in the lower atmosphere compete with stratospheric photolysis as halocarbon sinks, and thus affect the ozone density.
+ NO + OH + NO2 is of importance in both photochemical smog and stratospheric chemistry. All previous kinetic data were based on indirect measurements, and as a consequence were quite imprecise. Howard and EvensonZ3 meas- ured the rate of this reaction using laser magnetic resonance
This work clearly established the potential of the LMR
-
These rate constants are of
The reaction HO 2
104 K. M. Evenson et al.
detection of H02, NO , and OH. esting case, since a h 4 species involved in the reaction can be monitored by LMR. The measured rate constant was 40 times faster than the previously accepted value. As discussed in a later paper by Crutzen and Howard,24 the effect of this in- creased reaction rate was to increase the theoretical esti- mates of ozone depletions caused by continued use of indus- trial chlorocarbons while decreasing those expected from aircraft exhaust (which contains nitrogen oxides). In fact, . an increased concentration of ozone due to stratospheric aviation is now predicated as a result of this increased value for the rate constant!
+ NO2, and established the mechanism for this process. This reaction is also im ortant to atmospheric chemistry. Thrush, Harris, and Burrows" have reported measurement of the rate constant for the reaction of H02 with OH and 0, using the Cambridge water vapor laser system. Another group has also reported measure- ment of rate constants involving the H 0 2 radical by the LMR method. Institute in Gottingen studied the reactions OH + H02 -+ H20 + 02, and Hack, Preuss, Wagner, and Hoyermann28 studied the reaction of H with H02.
pheric significance by LMR include measurement of the rate constant and temperature dependence of the H02 + C10 reaction by Stimpfle, Perry, and Howard,29 (a significant achievement, considering the difficulty of studying radical-radical re- actions), measurement of temperature dependence of the rate constant for H02 + NO by Howard,30 and measurement of the rate constant for the ver
This was a particularly inter-
Howard2' also measured the reaction rate of HO - 2
Hack, Preuss , and Wagner ,27 of the Max Planck
Recent studies made on the kinetics of reactions of atmos-
important reaction of H02 with O3 by
Clearly the use of laser magnetic resonance to monitor chemical reaction rates has had a marked impact on atmospheric chemistry, and on chemical kinetics in general. Presently, another group, led by Anderson and Radford (Harvard), is developing LMR systems to expand this application.
The scope of LMR was dramatically expanded as a result of the invention of the optically pumped far-infrared laser by Chang and Bridges32 in 1970. quite evident from the experiments performed with H20 and HCN lasers, but because the method relies on a close coincidence between a cw laser line and a relevant molecular transition, the general application of LMR as a spectroscopic technique seemed quite limited in scope: the total number of convenient laser lines from HCN and H20 lasers is only 10: the wavelengths of all these lines were shorter than 337 um (891 GHz), ostensibly limiting applications mainly to para- magnetic hydrides. With the advent and rapid development of
Zahniser and Howard. 31
The capabilities of LMR were
Furthermore,

Far Infrared Laser Magnetic Resonance 105
C02-pumped FIR lasers, the number of useful cw laser lines has grown rapidly to the present total of nearly 1000 - many of these in the wavelength region from 500 to 1000 pm. A histo- gram showing the number and distribution of these optically pumped cw FIR lines is given in Fig. 5. We now have very
I101
THz Fig. 5. Density of FIR optically pumped laser lines.
impressive coverage over most of the far-infrared region, and the power of laser magnetic resonance has grown accordingly.
The incorporation of the optically pumped laser design into a laser magnetic resonance spectrometer was achieved by R a d f ~ r d ~ ~ in 1975. His system consisted of an optically pumped submillimeter gas laser 7.6 cm in diameter and 182.9 cm long, with one end being partitioned off with a Brewster window to form the intracavity absorption cell, located be- tween the pole faces of a 30 cm magnet. The radiation from a 20 watt cw C02 laser was admitted to the FIR laser through a 2 mm hole in one end mirror to longitudinally pump the FIR
. lasing gas. This design presented an experimental difficulty, in that pump powers higher than 5 W would melt the polypropy- lene Brewster window. Attenuation of the pump laser power to avoid destruction of the window in turn limited the number of lines that would oscillate in this system to those with pump- ing thresholds below 5 W, about 30 lines at that time.
With this new design, Radford and L i t ~ a k ~ ~ observed the imine (NH) radical LMR spectsa from the N = 1 + 0 transition with optically pumped laser lines at 302 pm (HCOOH) and 315 p n (CH3NH2). The NH radicals were generated by the reaction of F atoms with NH3. lished an extensive analysis of LMR spectra of four imine iso- topes. Radford also carried out additional measurements on the NH2 (2B1) LMR spectrum, previously studied at Cambridge. l6 The twelve additional laser spectra he observed with the CO -
~
Shortly afterward, Wayne and R a d f ~ r d ~ ~ pub-
2
106 K. M. Evenson et al.
pumped system were combined with the earlier results from Davies et al. ,16 and analyzed by Davies, Rtissell, Thrush, and Radford= in 1978.
In 1977, Radford and Russell36 observed another reactive molecule of substantial importance in flames and in atmos- pheric chemistry - the methoxy radical (CH30). This was the first definitive spectroscopic detection of CH301 which is extremely interesting from a spectroscopic point of view as well, since it exhibits several exotic effects characteristic of polyatomic molecules in degenerate electronic states, in-- cluding large Zeeman and hyperfine anisotropies and possible ' -
Jahn-Teller distortion. Spectra possessing characteristic fourfold or twofold line splittings, resulting from a configu- ration with three identical spin 1/2 nuclei, were observed with optically pumped laser lines at 392, 394, 406, 419, and 513 um. Methoxy was generated by reaction of F atoms with CH30H. underway.
spectrometer with transverse pumping was developed by Evenson, -- et al,37 which will be described in Section 111. has the advantage of accommodating higher C02 laser powers, and corlsequently operates on a larger number of FIR lines. Using this new system, Hougen et al.38 observed new CH spectra with 8 optically pumped laser lines and obtained an improved signal-to-noise ratio, resulting from a more intense source of CHI viz. a F atom/CH4 flame. They were able to make a rather complete analysis of six of the nine LMR spectra in this work, deducing values for the 4 hyperfine constants a, b, c, and d, as well as improved values for lambda doubling intervals in J = 3/2, 5/2, and 7/2 states.
A similar flame, F + CH3F, yielded spectra that were iden- tified as being due to CH2F by Mucha et al.39 The association of spectra detected on 4 laser lines with CH2F was made on the basis of chemical and spectroscopic arguments. CH2F was pro- . _ duced by reaction of F with CH3F, or by the reaction of F atoms with CH2N2. methane-F atom flame, although reduced by a factor of ten in - _ intensity.
LMR system of4fjhe Radford design. With this new spectrometer, Davies et al. detected the 3Pl - 3P0 fine-structure transi- tion in the ground state of oxygen atoms generated in a micro- wave discharge and flowed through the detection volume. They established the detection limit for 0 atoms by LMR to be 1-2 x 10¹². Most recently, Davies et al. have reported the detec- tion and assignment of LMR spectra from SH(SD)41 and SeH,42 produced by flowing H(D) atoms formed in a discharge over solid sulfur or selenium, respectively.
A detailed analysis of these complex spectra is still
In 1977, an improved design for an optically pumped LMR
This system
The same spectra were later observed in a
The Cambridge group also constructed an optically pumped

Far Infrared Laser Magnetic Resonance 1 07
The most recent results obtained by the Boulder group with the optically pumped LMR include detection of a series of radicals produced in methane-fluorine atom flames and meas- urement of the pure rotational spectrum of the metastable alA state of 0
tem by Mucha -- et a1.,43 who reported the detection of several hyperfine triplets. The identity of the carrier of these triplets was established as the 3B1 ground state of CH2 from a
Saykally , and H ~ u g e n ~ ~ have subsequently found several other sets of triplets, which have been shown to be from CH2. te'ntative assignment of the spectrum observed at 85.3 pm (l3CH,OH) has yielded a structure for the radical, which, however, must be viewed as extremely tentative because of the obvious perils of using only one observed transition as the basis for such a determination. Another interesting result obtained in this study was the observation of a series of triplets at 171.8 pm (l3CH30H) occurring in stimulated emission.
The detection of the ethynyl radical (CCH) by LMR was reported by Saykally and EvensonB5 in 1978. pure rotational transition in the X2C+ ground state was found using the 490 pm laser line of CD31. carrier was again established through isotopic substitution experiments. This work constituted the first spectroscopic detection of gaseous CCH in the laboratory, although the ob- servation of its microwave emission spectrum by radio astron- omy has established it as a ubiquitous constituent of inter- stellar clouds. 46
in the X211 state of the CF radical has also been reported by Saykally and E ~ e n s o n . ~ ~ tense yet found with the optically pumped spectrometer.
and 23P1 - 23P2 fine-structure transitions within the carbon atom ground state in the same CH4 + F flame that produced CCH, CH2, CH, CH2F, and CF spectra. measured with six different laser lines near 609 pm, while the J = 2 -+ 1 was measured with 4 lines near 370 pm. Mass shifts and hyperfine splittings were observed for the 13C isotope. Analysis of these measurements has yielded precise frequencies for the zero-field fine-structure transitions in both isotopic forms. detected in several interstellar sources using these labora- tory frequencies, as reported by Phillips et a1.77
alA
5
Methylene radical (CH ) was first observed in the LMR sys- 2 ' 2
_ . series of isotopic substitution experiments. Evenson,
A .
The N = 7 -+ 6
The identity of the
Observation and assignment of several spectra originating
These spectra are among the most in-
The same authors48 have also detected both the z3PO - 23P1
- The J = I + 0 transition was
The J = 1 f 0 transition of 12C has very recently been
Pure rotational magnetic dipole spectra of the long-lived metastable excited electronic state of O2 have been 9

108 K. M. Evenson et al.
observed in an afterglow of a 2450 MHz discharge through O2 by Scalabrin , Mizushima , Saykally , Radf ord and Evenson. 49 Four different rotational transitions have been detected with four laser lines. The results are being combined with those of earlier EPR and optical spectroscopy experiments to obtain the best set of molecular constants for this state of 0
In 1978 Saykally and Evenson5' reported the development of a new technique for studying transient species in a laser magnetic resonance system. In this system, the transverse iron core magnet has been replaced with a solenoidal magnet concentric with the laser axis, and the flame has been re- placed by the positive column of a glow discharge plasma run- ning along the magnetic field. The use of a live positive - column plasma, instead of a flame or an afterglow, to produce transient species had quite recently resulted in the observa- tion of three molecular ions (CO', HCO', HNN+)51-53 and several other very short-lived specie^^^-^^ by microwave spectroscopy. The incorporation of this feature in a laser magnetic resonance spectrometer was intended to permit the observation of molecular ions by LMR as well.
new results. Saykally and Evenson have now reported the de- tection of oxygen atoms , 50 metastable excited electronic states of CO and 02157 several ground-state radicals (OH, NH, HN2) I and the molecular ion HBr+,58 all generated in glow discharges through different gas mixtures.
The Z3P2 - 23P1 fine structure transition of atomic oxygen has been detected with the 63.1 um laser line of 13CH OH in a glow discharge through an 02/He mixture. tional transitions have been observed for the metastable a311 state of carbon monoxide in discharge through 10% CO in helium. The average radiative lifetime of this state is 7.5 msec - very much shorter than the other metastables observed by LMR ('A states of O2 and PH). The J = 9 + 8 transition of metastable a Ag 02, also observed in the afterglow study dis- cussed earlier, was detected in a discharge through pure O2 with 392 pm laser line of HCOOH. The signal-to-noise ratio on this transition was sufficiently high to allow a large reduc- . tion of the O2 pressure. then observed, providing linewidths about ten times less than the Doppler widths.
The first laser magnetic resonance spectra of a molecular ion have been observed b
21133/2 ground state were detected in glow discharges through a dilute (1%) mixture of HBr (DBr) in helium. For the hydrogen isotopes, the J = 5/2 + 3/2 transition was observed with laser lines at 251.1 pm (CH30H) and 253.7 I.rm (CD30H) , the J = 7/2 +
2 '
This spectrometer has in fact produced several interesting
3 Three pure rota-
1 ..
A series of saturation dips were
Saykally and Evenson. 58 Four iso- topic forms of HBr+ (H7 6 Br', D7'Br+, H81Br+, D8IBr+) in its

Far Infrared Laser Magnetic Resonance 109
5/2 transition was detected with the 180.7 pm line of CD30H. The J = 7/2 f 5/2 transition in v=l was found with the 186.2 pm line of CH30H. detected with the 496.1 pm line of CH3F. All of the spectra showed hyperfine lines from both bromine isotopes and exhibi- ted small lambda doublings. The proton hyperfine structure was not resolved. Fig. 6. On a single Zeeman component of this transition, a
The J = 5/2 f 3/2 transition of DBr+ was
The 180.7 pm spectrum of HBr+ is shown in
H Br'
B (Tesla) 0.245 0.345 0.445
I I I f 1
+ F i g . 6 . LMR spectrum of HBr taken with the 180.7 pm
l i ne of CD O H , E@ 1 B ~ . 3
signal-to-noise ratio of -100 was achieved with a 1 sec time constant on a single scan. In actuality this was quite a dif- ficult experiment, because of the highly specific conditions required to produce the spectra; nevertheless, given a signal of this magnitude, other molecular ions should be detectable
-. by the same method.
111. THE LMR SPECTROMETER
A schematic diagram of an optically pumped version of a laser magnetic resonance spectrometer is given in Fig. 7. This represents the current state-of-the-art in LMR spectrom- eter design; the earlier systems employing gas discharge lasers were similar in principle, and were shown in Fig. 1. In this optically pumped FIR LMR system, a suitable gas

110 K. M. Evenson et al.
FAR - IWRAED LASER
WAVELENGTH RANGE FAR - IR : 40-900 prn
CCr, LASER
F i g . 7 . S c h e m a t i c d i a g r a m o f a n o p t - , - a l l y pumpeL f a r i n f r a r e d LMR s p e c t r o m e t e r .
(e.g. CH OH) having a strong vibrational absorption line coin- cident with a C02 laser frequency is pumped nearly transverse- ly between parallel mirrors in the gain cell by a cw, grating and piezoelectrically tuned, CO laser operating single mode with a power output near 50 W. 2The population inversion in- duced between rotational states in the excited vibrational state by the pumping action produces the far-infrared lasing action between appropriate rotational levels. The far-infra- red radiation oscillates in the spectrometer cavity, defined by a fixed mirror at one end and a movable mirror attached to a micrometer drive at the other. single frequency and is tunable over a narrow bandwidth. Single frequency operation occurs because the mode spacing
( - z 150 MHz) is much wider than the laser gain profile
(-5 MHz). A n iris is used to eliminate off-axis modes. The gain cell of the laser, containing the optically
pumped lasing gas, is separated from the sample region of the cavity by a 13 pm thick polypropylene window, set at the Brewster angle. This window serves several purposes. (i) it
3
The laser operates on a
C 2R

Far Infrared Laser Magnetic Resonance 111
provides the vacuum seal between the gain cell and the sample region of the cavity, (ii) it restricts the polarization of the laser to a single linear configuration, which can be oriented either parallel ( T I or perpendicular (a) to the mag- netic field, and (iii) it can be used as a partial reflector to couple a fraction of the laser power out of the cavity onto a detector. The sample region of the laser cavity is posi- tioned between the pole faces of a 38.1 cm (15") magnet with 15 cm pole tips operating with a 7.2 cm air gap. Fields slightly over 2.0 T can be produced in the 2 cm3 detection volume defined by the intersection of the laser beam and the homogeneous magnetic field. A set of Helmholtz coils mounted
-5 x T over the detection volume.
a NEP near 6 x detector. Typical powers absorbed by the radicals range from 0.3 to about of the total laser power. A fraction of the laser power in the cavity is coupled out of the laser with a 45' copper mirror 4 mm in diameter on a small rod; the mir- ror is inserted a selected distance into the laser. The small fraction of the power reflected is directed through a poly- ethylene window located directly opposite the coupling mirror. With this scheme, the amount of power incident on the detector can be optimized for each individual laser line.
All of the species observed with this spectrometer are produced in various types of atomic and molecular flames re- acting inside the detection volume pumped by a 10 !L/s mechani- cal pump. A concentric flow tube mounted on the laser system above the plane of the diagram and extending just down to the detection volume is the source of the flame.
glow discharge is sustained in the sample region of the laser
:
- on the pole faces provide a 1 kHz modulation field of up to
A liquid helium cooled ermanium bolometer, operating with W Hz -ly2 at 6.5 kHz is used as the
In the LMR ion spectrometer, the positive column of a DC
, cavity, and the transverse magnetic field used in the pre- - viously described LMR experiments is replaced by a longitu-
dinal field, provided by a 7.6 cm diameter and 33 cm long liquid nitrogen cooled solenoid magnet. This magnet is capable of producing a 5 kG field with a 0.1% homogeneity over a 15 cm length. The optically pumped gain cell is essentially the same as in Fig. 1. The longitudinal magnetic field con- figuration readily accommodates the live intracavity discharge, although producing some visible plasma constriction, and also provides an increased detection volume (-20 cm3 instead of 2 cm3). the center of the laser cavity by operating the cathode at a long distance from the solenoid.
In operation it is essential to force the plasma down

112 K. M. Evenson et al.
IV. SENSITIVITY
In this section we consider the overall sensitivity of the LMR experiment and the adjustment of the experimental vari- ables for maximum sensitivity. The analysis of sensitivity is broken into four parts as follows:
1. Discussion of the sources of noise combined with noise measurements to obtain the minimum detectable -
change in power at the detector due to that noise. 2. Measurement of the sensitivity of the LMR spectrom-
eter in terms of a minimum absorption coefficient. 3 . The limiting concentration for a typical molecule. 4. Comparison with other techniques.
Noise and Minimum D e t e c t a b l e S i g n a l
The fundamental limitation on the minimum detectable signal which cannot be overcome by any improvement in detec- tor or source is the quantum noise limit,59 Pn. detectable power change at the detector is expressed by
This minimum
u 1 1/2 AP(min) = 4[PPn1 ,
where,
P is the total power on the detector, P is the laser noise, and B is the bandwidth of the detector. For the typical LNR experiment with v = 1.5 THz, T = 300 K, and a bandwidth, B, of 1 Hz, P is 4.7 x W. In LMR, a typical value of the power reaching the detector is 2.5 x 10⁻⁵ W which results in a value of 1.4 x W for AP(min) .
The quantum noise limit is never achieved in practice. Usually the limiting noise is either detector noise or source noise. For the Ge bolometer detector viewing the non-oscil- lating FIR laser, the NEP is about 6 x W for a 1 Hz band- width, so that detector noise is only a factor of 4 greater than the quantum noise limit. Source (or local oscillator) noise arises from various physical fluctuations which result in laser amplitude instability such as vibrations, ripple, power line fluctuations and plasma noise which may be present in either the FIR laser or the C02 pump laser. Because of the variety of origins for source noise, it must be estimated by experimental measurement. It is found experimentally that the
n
n

Far Infrared Laser Magnetic Resonance 113
amount of source noise observed depends on t h e IF ( i . e . , modulation) frequency and decreases with increasing I F frequency. The frequency response of t he bolometer de t ec to r (half-power po in t s a t 1 kHz) s e t s a maximum IF of about 6.5 kHz before t h e loss i n s igna l overcomes the reduction i n source noise . A t t he optimum IF frequency of about 6.5 kHz, t he noise a t t h e phase s e n s i t i v e de t ec to r output decreases by about one half when the FIR beam i s blocked on the s t ronger l a s i n g l i n e s . de t ec t ab le change i n power a t t h e de t ec to r is l imited by laser amplitude f luc tua t ions (source noise) and is about
dgtector noise f o r t he weaker l i n e s .
i n t he noise l e v e l of t he de t ec to r a f a c t o r of 7 might be gained i n o v e r a l l s e n s i t i v i t y ; howeverl s ince t h e noise l e v e l of each i s similar, both would have t o be improved t o e f f e c t t he increase i n s e n s i t i v i t y . We a r e q u i t e c lose t o the quantum l i m i t !
Thus with t h e present l a s e r s t h e minimum
W f o r t he s t ronger laser l i n e s but is l e s s than the
With improvement i n both the s t a b i l i t y of t h e laser and
Measured Sensitivity
Before report ing experimental measurements of t h e LMR spectrometer s e n s i t i v i t y it seems worthwhile t o b r i e f l y review some elementary r e l a t i o n s h i p s which a f f e c t t h e s i g n a l s i z e (see Reference 59 and references t h e r e i n ) .
t he FIR l a s e r cav i ty The power reaching t h e d e t e c t o r , Poutl i s coupled out of
- 'out - (3)
where C i s the output coupling and Pin i s t h e l e v e l of the . c i r c u l a t i n g power i n s i d e the l a s e r . Thus t h e change i n power
a t t h e de t ec to r on introduct ion of t he molecular absorption is proport ional t o the change i n t h e l e v e l of c i r c u l a t i n g power i n s i d e t h e l a s e r . The operat ing point of any o s c i l l a t o r is determined by the condition t h a t the gain (which i s a function of t he l e v e l of o s c i l l a t i o n ) equals t h e loss (which normally is independent of t h e l e v e l of o s c i l l a t i o n ) .
- -
G(Pin ) = L
Thus on introducing a small add i t iona l l o s s , we have
dP APout dP dG AL dG APin = AL- o r - = C- .
(4)
( 5 )

114 K. M. Evenson et al.
An adequate model of the FIR laser would be required in Several attempts were made in an order to calculate dP/dG.
effort to develop a model which explains the measured experi- mental parameters of the LMR spectrometer. Our efforts have not been successful. In lieu of theoretical expressions we offer instead, experimentally observed operating conditions
, (i.e. , the change in and empirical relationships,
The instrumental sensitivity, - output power when a small additionatl loss, AL, is introduced into the laser cavity) was directly measured by rotating a specially constructed beam splitter inside the laser cavity. The reflectivity of the 12.5 pm thick beam splitter for a 2' change was measured outside the cavity and agreed with the value calculated from the measured polypropylene index of refraction at 118.8 pm (n = 1.522). By measuring the laser output power, then rotating the beam splitter to introduce a known small additional reflection loss, the sensitivity was measured experimentally, and the minimum detectable one way
APout
was determined for both the AL = (- loss, ALmin I 'noise, APout 163.0 and 118.8 Um CH OH laser lines. First, however, the sensitivity was optimized by observing the S/N ratio for O2 LMR lines by varying the laser coupling, C02 laser pump power, methanol pressure, and foreign gas (He) pressure (in the gain cell). It was found that the best S/N was obtained with the maximum foreign gas pressure consistent with stable laser operation and with the maximum C02 laser power available. increasing both the foreign gas pressure and the C02 laser power, the S/N ratio levels off after an initial rapid in- crease so that it is not a sensitive function of these para- meters near the optimum operating conditions. The S/N of the O2 lines was also studied as a function of the output coup- ling, and was largest for the maximum coupling obtainable (overcoupled with respect to maximum power) with the small coupling mirror employed. Again the S/N was not found to be a particularly sensitive function of the output coupling once the laser noise became the dominating noise, for each in- creased as the coupling was increased. After optimizing the signal with each laser line, identical sensitivities of Ahin - summarized by the equation
3
In
- 2 ~ 1 0 - l ~ were obtained. The empirical behavior of the LMR spectrometer can be
CALp A' - L '
where AP is the LMR signal, measured as a change in power at the detector (not a fractional change), C is the coupling
Far Infrared Laser Magnetic Resonance 115
parameter, AL is the loss due to the paramagnetic sample, p is the foreign gas pressure (He) in the gain cell, and L is the total round trip loss of the FIR resonator. In general, one can say:
1. The coupling, C, should make the laser over coupled, but not so much as to make it unstable,
2. the foreign gas pressure should be high,(L00-300 Pascals) but again as in 1, not to decrease the laser power ta the point of instability, and
(usually it is about 2 to 4%).
AP, is nearly independent of the FIR power. This result is in agreement with earlier measurements made with the H 2 0 dis- charge LMR spectrometer.
one with some insights into the physical basis of the LMR experiment; however, another estimate of the sensitivity of LMR is provided from measurement of S/N ratios of absorption lines. O2 is a convenient reference substance in that it is paramagnetic, stable, and the weakly allowed magnetic dipole transitions are not susceptible to laser power saturation at the laser powers normally used. Therefore, the S/N ratios were measured for three weak O2 lines using the methanol laser lines at 118.8, 163.0 and 699.5 pm. The lines chosen were the lowest field lines with perpendicular polarization (i.e., the magnetic field of the laser is perpendicular to the Zeeman field) and are the weakest observed at each wavelength. The results of these measurements are given in Table 1 along with the magnetic fields of these calibration lines. These lines may be useful for sensitivity comparisons with other spectrom- eters.
If similar measurements of sensitivity were made in an external cell, Ahin would be simply the fractional laser noise: 4 x at one Hz. The increase in sensitivity by using intracavity absorption is obtained by dividing this number by Ahin for the cavity. The increase is thus 1000; a very significant improvement is obtained with the intracavity technique. The actual path length is determined by the length across the homogeneous magnetic field (about 1.5 cm); the effective path length is about 1500 cm. If an external passive Fabry-Perot cavity were used, R(eff) would be R(F/n)
where F, the finesse, is * and R = reflectivity of mirror
(20.98).
3. the overall loss, L, should be as low as possible
We have also found that well above threshold the signal,
The measurements and calculations described above provide
(1-R) Thus, .teff is given by:
- 2% - 'eff Round trip loss *

116 K. M. Evenson et al.
TABLE 1. Compar i son o f Minimum D e t e c t a b l e L o s s O b t a i n e d From Beam S p l i t t e r M e a s u r e m e n t s w i t h t h a t O b t a i n e d f r o m 0 A b s o r p t i o n 2
0 Measurement (1 Torr) 2 Beam
S p l i t ter
-1 d e yo (cm ) '=min ALmin
S/N M a g n e t i c a
F i e l d (1 O-4T) A (w)
118.8 3.933b
163.0 5.254
500 1 . 2 x 4 ~ 1 0 - ~ ~ 2xlO-'O '
-10 2 x 1 0 - 1 0 700 3.7 8 x 10
699.5 1.094 3160 40 x ~ O X ~ O - ~ ~ -
a
b
l i n e o f
c
d
Bw Bo
T h i s same t r a n s i t i o n i s o b s e r v a b l e on the 118.6 um H ~ O e 4.935 x ~ o - ~ T .
O n e s e c o n d t i m e c o n s t a n t .
yo i s the a b s o r p t i o n coe f f ic ien t c a l c u l a t e d f r o m E q . 7 c i n r e f e r e n c e 10.
e
here). L i s one way a b s o r p t i o n : AL = yo(R). (R 1.5 cm,
The round trip loss in the laser cavity is about 4%: and R would be 75 cm. It appears that the presence of the gain medium produces an enhancement of sensitivity by a factor of 20.
eff
R e l a t i o n s h i p o f I n t r a c a v i t y L o s s t o M o l e c u l a r C o n c e n t r a t i o n
In order to estimate the spectroscopic sensitivity of LMR, it is now necessary to relate the minimum detectable loss (Abin zz 4 x lo-'') to the properties and concentration of molecules. saturation effects which must be introduced in the integration over the sample volume. Fortunately the normal sample pres- sures (1 Torr) and intracavity intensities (<lo mW/cm2) are such that power saturation of the sample absorption is negli- gible when the laser power is decreased by the addition of helium in the gain cell. This both increases the sensitivity
This task could be greatly complicated by power

Far Infrared Laser Magnetic Resonance 117
and prevents saturation of the detector (about 25 pW is the optimum power). Lamb dips can be seen with this LMR apparatus but only when the pressure is reduced approximately tenfold. This tenfold reduction corresponds to a hundredfold increase in saturation.
In the absence of power saturation, the change in the cavity losses on introducing the molecular absorption for 71
transitions (AM = 0) is given by
(1-exp (-hV/kT) ) -MO M 2 n a AL = VS
J,T~~',T'''ci' J,T,M ( d i ~ ~ h )
' where Sa is the line strength for a rotational transi-
tion allowed by molecular dipole component, p a r nJlTIM is the number of molecules/unit volume in the lower state (J,T,M) of the transition, A is the HWHM of the line (here assumed Lorentzian), and the path length in the sample is R . The number density of molecules in the lower state of the transi- tion is related to the total number of molecules/unit volume
J,T,J' , T
by
where Q is the internal partition function. Introducing (9) into Eq. ( 8 ) , the result is
From the previous sections we have seen that the minimum detectable AL is approximately 4 x 10-l'. minimum detectable number density of molecules, N, in a
. typical case. The pathlength., R , over which the magnetic field is homogeneous is about 1.5 cm. For a polar molecule the permanent dipole moment component, ti, , is tvpicallv 1 Debye, a typical line strength (3JlL product is 0.5; a typical linewidth, A, at 1 Torr is 10 MHz. For a light molecule, Q, the partition function, is of the order of 200. be about kT, with T = 300 K. Upon introducing these'nhers, the minimum detectable number of molecules/unit volume becomes 5 x 10⁷/cm3 for a transition at 1.5 THz. cm-3 for OH has been measured in the water vapor spectrometer; this is in agreement with the above number since OH has a 3
Let us estimate the
EJ might
A sensitivity of lo6

118 K. M. Evenson et al.
times greater dipole moment and a smaller Q. Also, a somewhat longer path was provided by a more homogeneous magnet and the sensitivity of the water vapor laser may be somewhat different.
Compar i son of S e n s i t i v i t y of F I R LMR w i t h t h a t of Other T e c h n i q u e s
We now wish to compare the sensitivity of LMR in the fax-.. infrared with that achievable in other regions of the spec- trum. Firstly, absorption spectroscopy with incoherent sources in any region will exhibit far smaller sensitivities - than that obtained above because of the lack of brilliance of the source. Thus we can restrict our considerations to absorption spectroscopy with coherent sources. Secondly, many coherent sources are very noisy as the result of somewhat extraneous sources of noise such as vibration or plasma noise. Ion laser pumped cw dye lasers are such noisy sources. Be- cause this excess laser noise is not intrinsic to the visible, varies widely in similar sources, and is difficult to esti- mate, we choose to ignore it in our calculations, only noting the case in which it is present. Thirdly, for absorption spectroscopy inside the laser cavity dP/dG is not known so that reliable estimates of the minimum detectable peak absorp- tion coefficient are not available. The procedure adopted to make an estimate of the minimum detectable absorption coeffi- cient is to scale the well established values for the micro- wave and FIR LMR by the frequency dependence of maser noise. All that remains then is to introduce the frequency dependence of the absorption coefficient (Eq. 10) and the dependence of the transition moment on whether a rotational, vibrational, or electronic transition is being considered. The resulting estimates of sensitivity are given in Table 2. The reasons for the rather notable success of FIR LMR in detecting tran- sient species is quite evident from the table; it is probably the most sensitive absorption technique available! It is exceeded only by laser induced fluorescence, for which a con- centration of IO4 OH molecules/cm3 can be probably detected.
V. ASSIGNING A SIMPLE LMR SPECTRUM
A simple linear Zeeman theory will be used to indicate the general methods of assigning a spectrum of CH. section, we will develop a more general Zeeman theory used in the final analyses of LMR spectra.
In the next

Far Infrared Laser Magnetic Resonance 119
T a b l e 2 . Compar i son of E s t i m a t e d S e n s i t i v i t y of V a r i o u s A b s o r p t i o n S p e c t r o s c o p y T e c h n i q u e s for a T y p i c a l S m a l l M o l e c u l e
E s t i m a t e d E s t i m a t e d N ( m i n )
' i j (cm ) -3 a T e c h n i q u e V yo ( m i d
-1 WHz) (cm ) ( d e b y e )
10 b Microwave .03 3 x lo-'' 0.6= 3 x 10
F I R LMR 1.5
Mid-IR LMR 30
3 x
6 x 10 -1 oe
d 0.5
0.03
7 5 x 1 0
3 x 1 0 8
6 Visible cw f Dye L a s e r 500 30 x 10-l' 0.5' 7 x 1 0
a Assumed l i ne b r o a d e n i n g p a r a m e t e r 10 MHz/Torr, t o t a l p r e s s u r e = 1 Torr, T = 300 K and MW = 30 AMU.
A l t h o u g h h i g h e r sensit ivit ies a r e o f ten r e p o r t e d , the p a t h l e n g t h i s n e c e s s a r i l y short for free r a d i c a l s y s t e m s .
c A s s u m i n g J = 1 +- 0 t r a n s i t i o n . F o r l i g h t m o l e c u l e s , low f r e q u e n c y t r a n s i t i o n s u s u a l l y h a v e small l i n e s t r e n g t h s .
A s s u m i n g pa = 1 d e b y e , a n R-branch t r a n s i t i o n and the s t r o n g e s t M componen t .
e A s s u m i n g s e n s i t i v i t y s c a l e s a s the s q u a r e root of quan- t u m noise. T h e a c t u a l s e n s i t i v i t y d e p e n d s on the p r o p e r t i e s o f the mid - IR l a s e r .
A g a i n a s s u m i n g s c a l i n g a s the s q u a r e root of the quan tum noise. T h i s is a v e r y g e n e r o u s e s t i m a t e f o r a cw d y e l a s e r w h i c h i s v e r y n o i s y .
Even u s i n g s p e c i a l t e c h n i q u e s t o d e f e a t s o u r c e noise , s u c h a s p o l a r i z a t i o n s p e c t r o s c o p y , i t i s u n l i k e l y t h a t t h i s s e n s i t i v i t y w i l l be a p p r o a c h e d .
A s s u m i n g a n electronic t r a n s i t i o n moment of 1 d e b y e , a Franck-Condon f a c t o r of 0.1 a n d a l i ne s t r e n g t h of 15.
To a first approximation the Zeeman energy, E=, is

120 K. M. Evenson et al.
is t h e g f a c t o r of t he 'J
where ~ l g i s the Bohr magneton l e v e l , MJ is the p ro jec t ion of J on B, and B i s t h e magnetic f l u x dens i ty . LMR absorptions occur between l e v e l s of d i f - f e r e n t J, and t h e absorption occurs when t h e l e v e l s a r e tuned an amount AE equal t o t h e d i f f e rence i n energy between t h e laser and t h e r o t a t i o n a l t r a n s i t i o n .
from t h e upper, E; , we g e t By sub t r ac t ing the Zeeman energy of t h e lower l e v e l , E: ,
For TI t r a n s i t i o n s , M" = M ' , and t h e Zeeman tuning i s
AE may be e i t h e r p o s i t i v e o r negat ive, and depending on t h e s ign of g; - gi, e i t h e r t h e p o s i t i v e o r t h e negative values of M i may s a t i s f y t h i s equation. In e i t h e r case t h e number of
l i n e s usual ly expected is - . Solving f o r 1 / B , we ob ta in 2 J+l
One would expect a s e r i e s of LMR t r a n s i t i o n s t o f a l l on a s t r a i g h t l i n e with t h e 1/B i n t e r c e p t being e i t h e r 0 o r 1/2, depending on whether J i s in t ege r o r ha l f i n t ege r . Thus, t o i d e n t i f y t h e M values belonging t o t h e same s e t of l i n e s , one need only p l o t 1 /B v s a running number. In t h i s way, t h e M i assignments can be made (providing the Zeeman e f f e c t is l i n e a r ) . For (J t r a n s i t i o n s , M' = M j 2 1; the re fo re ,
J
and s i m i l a r l y ,
1 B H e r e , a p l o t of - vs running number should produce a s t r a i g h t
l i n e of t h e same slope as t h e corresponding 71 series ( i . e . , t he series with t h e same AE and (9; - g ; ) ) , but with d i f f e r - e n t i n t e r c e p t depending on t h e value of g ' . l i n e s expected depends on t h e value of gnJcompared with { g ; - g:} M:, and o f t en is t h e maximum number, 2J+1.
guishing between series of l i n e s ( l i n e s d i f f e r i n g only i n M ) :
The number of
J
For many s p e c t r a , t h e r e is another technique f o r d i s t i n -

Far Infrared Laser Magnetic Resonance 121
a "laser pulling experiment" is performed, i.e., Av/AB is measured. The FIR laser is tuned to the high frequency side of its gain curve (typically AV +2 MHz), and the shift, AB, in line center is measured. For a linear Zeeman effect, the same series of lines (differing only in M) "pull" in the same direction, i.e., AB has the same sign.
We will now apply this to the CH spectrum shown in Fig. 3 and listed in Table 3 . 1/B is plotted vs running number in
TABLE 3 . L a s e r M a g n e t i c R e s o n a n c e Data for CH
. P o l a r i - Line Line R e 1 a t i ve z a t i o n Center W i d t h S i g n a l A m p l i t u d e a
cr
IT 0.4258 0.6628 0.8242 1 .3221 1.7147 0.2316 0.2924 0.3968 0.4116 0.5275 0.6171 0.7377 1.2694 1.4173
47 62 58 93
140 21 29 36 33 33 48 47 83
1 1 3
9.3 1 3 . 0
9 .6 8.7 4.3 1 . 0 3.3 5.2 1 . 0 2 . 4 5 .3 3 .8 3.9 3.7
a E s t i m a t e d u n c e r t a i n t i e s a r e ?5 G for l i nes b e l o w 10 kG and + lo G for l ines a b o v e 10 k G (1 T = 10 k G ) . -
Measured b e t w e e n p e a k s of the d e r i v a t i v e l i n e s h a p e . Some of the n a r r o w e r lines may be somewhat m o d u l a t i o n b r o a d e n - e d . These f i e l d w i d t h s a r e consistent w i t h a f r e q u e n c y w i d t h of 21.5 MHz.
O s c i l l a t o r F r e q u e n c y : 2527.953 + 0.001 G H z . C -
Fig. 8 for both IT and CI lines. The predicted transition is J = 7/2 f 5/2 and two lambda doublets are expected. (In this case, "pulling experiments" were not done, but would have been very useful since one lambda doublet series would have pulled positive and the other negative). n o separate cr series which appear quite linear are indicated by a, and b,. The two IT se- ries which exhibit slopes most similar to the corresponding (5
slopes are shown by aIT and b,. These possess slopes slightly

122 K. M. Evenson et al.
Running Number
F i g . 8 . P l o t of 1 / B v e r s u s r u n n i n g number for CH s p e c t r u m of F i g . 3 .
different from those of a, and b, respectively, and do not have half integer intercepts. This is due to the non-linear effects. linear and IT slopes ai and b, are drawn through the most ap- propriate half integer points with the appropriate slope of either a, or b,. The divergence is quite obvious; however, a correct assignment of MJ can be made from these plots and the spectrum was assigned as is shown in Fig. 9. The complete de- tailed analysis is given in Ref. 8. A wide variety of spectra have been observed from one extreme to the other - some nicely .. linear, as in l A 02, and some still not assignable such as in CH2. attainable with LMR (about 2 1 MHz on the laser and 2 0.5 x
indicated in the next section.
The slopes at low yagnetic fields are the most
In any case a complete and accurate fit to the precision
T on the magnetic field) requires the considerations
VI. THEORETICAL CONSIDERATIONS, MAINLY OF THE ZEEMAN INTER- ACTION
A far infrared LMR spectrum contains information about

Far Infrared Laser Magnetic Resonance 123
F, J = 54
+7/2 + 5/2 + 3/2 + 1/2 -1/2 - 3/2 - 5/2
- 7/2
+ 7/2 + 5/2 + 3/2 + 1/2 - 1/2 - 3/2 -3/2
-7/2
- 1/2 - I/Z
1 I I I I I I 1
0 5 10 15 20 25 Field Strength, kG
-3/2
- 512
F i g . 9 . CH Zeeman e n e r g y levels for J = 5 / 2 and J = 7 / 2 levels b e t w e e n 0 and 25 kG. T h e 118.6 um o b s e r v e d t r a n s i t i o n s a r e i d e n t i f i e d for T - t y p e p o l a r i z a t i o n others a r e CI.

124 IC. M. Evenson et al.
several distinct types of molecular interactions. There are zero-field contributions from (i) the rotational energy, (ii) electron spin fine structure, and (iii) the nuclear hyperfine structure. These terms account for almost all of the transi- tion frequency and are, by and large, well documented in the literature. The zero-field Hamiltonian for diatomic molecules is covered in references (60) to (63) for example, while that for polyatomic molecules is given in references (64) and (65 ) . In this section, we concentrate instead on the Zeeman effect, that is, the interaction between a molecule and an external magnetic field. Although comparatively small in magnitude, this interaction lies at the very heart of LMR spectroscopy by providing the frequency tuning which is essential to the experiment. In consequence, a proper understanding of the Zeeman effect is vital to the conception, execution, analysis and interpretation of an LMR experiment. Our treatment covers both diatomic and polyatomic (non-linear) molecules.
The classical expression for the energy of interaction be- tween a magnetic dipole moment and an applied flux density - B is simply
Zeeman energy = -m E. ( 1 7 )
The magnetic moment f?. of a molecule arises from the motion of the charged particles of which it is constituted. The Zeeman Hamiltonian is obtained from equation (17) by making the appropriate quantum mechanical replacements. There are four distinct contributions, two from the "unpaired" electrons and two from the nuclei (see Table 4).
The operator expressions given in Table 4 are appropriate to a diatomic molecule but they apply equally well to a poly- atomic molecule with the exception of the rotational magnetic moment. In the latter case, the scalar rotational g-factor must be replaced by a 2nd rank tensor to take account of the anisotropic distribution of
where a,B stand for x, y or 4 that the electrons make a the nuclei (usually) make a
nuclear charge:
(18)
z . It should be noted from Table negative contribution to m_ while positive contribution; this is -
simply a reflection of the sign of the charge on the particle ~ concerned. While the electronic contributions to the magnetic moment predominate over those from the nuclei, they are pres- ent only if the molecule is in an open shell state; the nuclear contributions exist for any molecule. Perhaps the most important aspect of Table 4 is that, to a good

Far Infrared Laser Magnetic Resonance 125
TABLE 4. F i r s t O r d e r C o n t r i b u t i o n s t o the M a g n e t i c D i p o l e Moment,
O r i g i n Opera tor M a g n i t u d e
electron s p i n -9 lJ s S B- qs = 2.0023
electron o r b i t a l a n g u l a r momentum -gLpB&- gL = 1 .oooo
- r o t a t i o n a l a n g u l a r N N m m e n t um gr p B E
n u c l e a r s p i n gN - 1
p i s the Bohr magne ton (1.3996 MHz/gauss) and u i s the B N n u c l e a r magne ton (1-1 = 5 . 4 5 x l o q 4 p,) . S , &-, and I a r e the t o t a l electron s p i n y electron o r b i t a l , n u c l e a r r o t a t i o n and n u c l e a r s p i n a n g u l a r momenta, r e s p e c t i v e l y .
approximation, the magnitudes of the various contributions to m - depend simply on the particles concerned. A reliable pre- diction of the magnetic moment of a molecule in a particular state can therefore be made with some confidence; this is in marked contrast to the calculation of the electrical dipole moment,
T h e E f f e c t i v e H a m i l t o n i a n
In principle, the energy levels of a molecule in a magne- _. tic field can be calculated to any desired precision from the
Hamiltonian derived from Eqn. (17). In practice, however, this is a huge task because the operator has off-diagonal
states but also different vibrational and electronic states. A number of methods of averaging over the vibrational and electronic wavefunctions have been developed. We use the ef- fective Hamiltonian approach in which the effects of the off- diagonal matrix elements are projected onto the vibronic state of interest by use of perturbation t h e ~ r y . ~ ~ , ~ ~ dure modifies the coefficients of the terms in the Hamiltonian in a well-defined way. It has the advantage of separating the two stages of spectrum analysis, namely (i) the fit of the experimental data by varying the coefficients or parameters in
e matrix elements connecting not only different rotational
This proce-

126 K. M. Evenson et al.
the Hamiltonian, and (ii) the interpretation of the parameters in terms of electronic structure.
can be obtained by a study of the second order electronic terms. perturbation operator V to the zeroth order Hamiltonian H is given by the familiar expression
Some idea of how the effective Hamiltonian is constructed
The second order contribution to the energy from a
0
Consider the cross term arising from two parts of the pertur; bation V, the spin-orbit coupling H which can be written phenomenologically as SO
and the orbital Zeeman interaction
HZ = g )1 L E. (21) L B-
The effect of these two operators when substituted in Eq. (19) is to produce the anisotropic corrections to the electron spin g-factor. This is shown schematically below for a diatomic molecule.
The resultant term in the effective Hamiltonian is shown on the right; the matrix elements and energy denominators in the perturbation expression have been absorbed into the parameter g . Once again, the lower symmetry associated with a poly- atomic molecule can be accommodated by the use of a tensor g -E in the place of the scalar. There are a number of similar 2nd order contributions to the effective magnetic moment, all involving cross terms with part of the Zeeman Hamiltonian so as to produce an operator linear in the flux density, B.68 They are itemized below. - B are also generated at this stage of the calculation, for example, by substitution of Eqn. (21) only in Eqn. (19).
Contributions which are quadratic in

Far Infrared Laser Magnetic Resonance 127
These are the paramagnetic contributions to the molecular sus- ceptibility, a subject which has been so beautifully treated by Van Vle~k.~g The effect of the molecular susceptibility on the Zeeman energy is much smaller than the precision of any LMR experiment performed to date, however, and it can be ignored for the moment.
molecule is68 The resultant effective Zeeman Hamiltonian for a diatomic
In this Hamiltonian, g s is the electron spin g-factor, g; is the electron orbital g-factor, corrected for non-adiabatic and other small effects, gr is the rotational g-factor, N is the total mechanical angular momentum (E = &+E), gL describes the anisotropic corrections to the electron g-factor (see above), and gN is the nuclyar spin g-factor. The remaining two para- meters, g i and gre , are only required for molecules in TI states which show A-doubling; 4 is the electron orbital azimuthal angle and N letters x, y and z are used to indicate that the components are referred to a molecule-fixed axis system. A number of small details such as relativistic corrections, have been glossed over in the present treatment. They are described more fully in references 60 and 68.
able Zeeman parameters at the present level of approximation (the nuclear spin g factor can be regarded as known from NMR studies since chemical shift effects are much too small to be detected by LMR). One aim of the experiment should be to pro- vide sufficient data to determine all six of the parameters. The interpretation of these parameters in terms of electronic structure can then be effected by use of the expressions de- rived by perturbation theory.68 It is worth noting that the rotational g-factor in Eq. (22) has two separate contribu- tions ,
stands for (Nx 2 iNy), etc. Lower case
It can be seen from Eq. (22) that there are six determin-
-
The first term and the second
is the nuclear contribution given in Table 4 term is the electronic contribution which comes

128 K. M. Evenson et al.
from the second order perturbation treatment. As the nuclear framework of the molecule rotates, it drags the electrons around with it. The motion of the two types of particles together produces an approximate cancellation of their contri- butions to the magnetic moments, as implied by Eq. (23).
linear molecule is 70 The corresponding effective Zeeman Hamiltonian for a non-
The terms on the right hand side of Eq. (24) are analogous to those in Eq. (22). The scalar g-factors 911 and g have been replaced by second rank tensorial quantities to taEe account of the lower symmetry of the molecule. There is one respect in which the Zeeman effect for polyatomic molecules is simpler than that for diatomics. Unless the molecule has a 3-fold or higher axis of symmetry (e.g., CH3O), the orbital angular momentum is quenched and the effect of the second term in Eq. (24) vanishes. For the majority of problems, this term may therefore be omitted.
Most diatomic molecules studied so far by LMR are in 211 states. The "diagonal" part of the matrix representation of the effective Zeeman Hamiltonian for such molecules is given in Table 5 in a Hund's case (a), I-decoupled basis set.
Although other matrix elements, off-diagonal in J, MJ and MI, are required to give a completely faithful representation of the Zeeman Hamiltonian, the essential features y e contain- ed in the matrix of Table 5. For example, since gL = 0.5 gs, the magnetic moment of a molecule in the levels of the 2111/2 component is very small; also the Zeeman effect in the 'TI312 component decreases rapidly with J because of the [ J (J+1) 3 dependence. The anisotropic correction to the spin g-factor, g e l enters only in the off-diagonal element and thus may be rather difficult to determine unless there is significant mixing of the two spin components by molecular rotation. usually close to linear over the whole available range of lab- oratory fields. This is because there is a first order split- ting of the spin components by spin-orbit coupling which is much greater than the off-diagonal element of the matrix in Table 5.
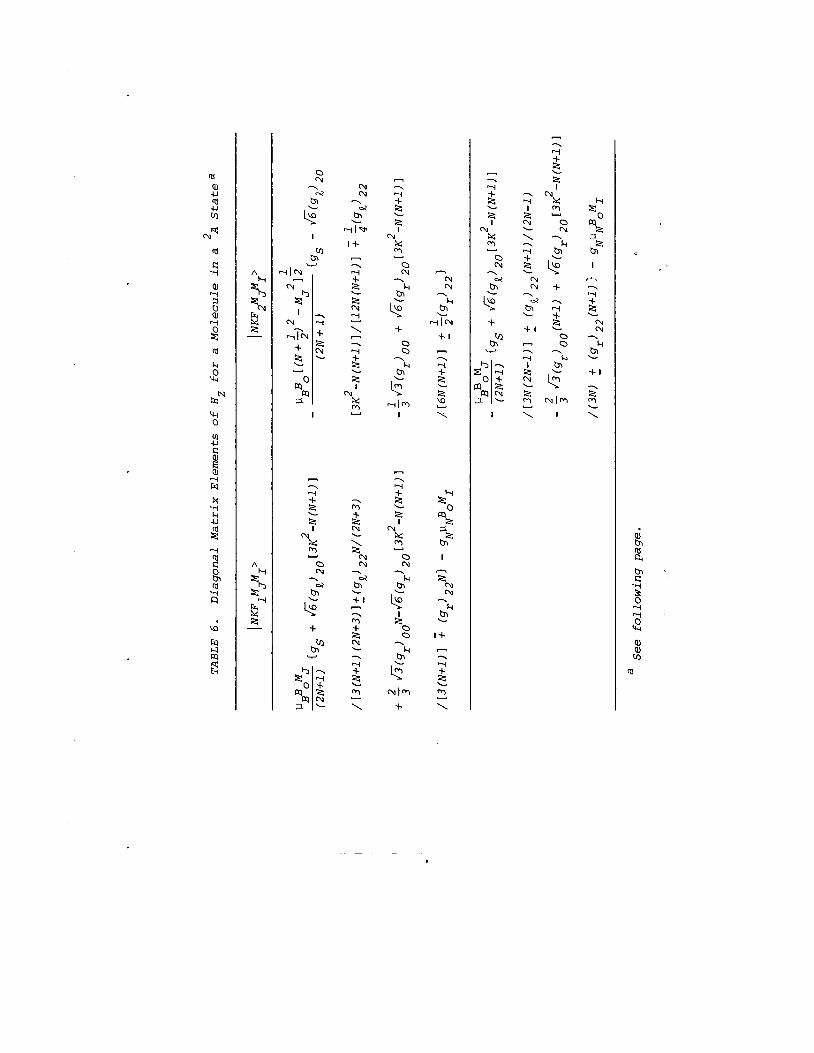
(24) in a Hund's case (b) basis set for a polyatomic molecule in a 2A state is given in Table 6; only the matrix elements diagonal in N are included. The dominant term in the matrix is that involving gs. form in the two spin components but the opposite sign.
The Zeeman effect for a molecule ill a 211 state is
The matrix representation of HZ in Eq.
It is interesting to note that it has exactly the same

Far Infrared Laser Magnetic Resonance I29
TABLE 5 . Diagonal Matrix Elements of the Zeeman Hamiltonian f o r a 211 State
a The upper and lower sign choices re fer t o e and f l e ve l s ,
respectively. T h e t h i r d quantum number i n the kets i s R , the projection of J on the internuclear axis .
The rotational Zeeman effect, on the other hand, contributes to the energies of both F1 and F2 components with the same sense; it becomes more important with increasing N. There is no first order spin-orbit coupling for this type of molecule. The F1 and F2 components are separated by second ordereffects, which manifest themselves as spin-rotation coupling. This splitting is quite small (-1 cm-l) for most of the molecules studied and the flux densities required for the off-diagonal element in the matrix of Table 6 to become comparable in mag- nitude are only a few tenths of a Tesla. In consequence the Zeeman effect is usually markedly non-linear, reflecting the progressive uncoupling of the electron spin from the molec- ular framework (the Paschen-Back effect). This behavior can be seen in Fig. 10. At very low fields, the splitting is lin- ear in MJ because S is well-coupled to E; at high fields, the Zeeman effect is linear in MS because here g is decoupled.
,
0 ru
?
ti! I
blQ v
I
Y -i + 2 2
- T Y
& L
? ru
% m Y
0 nr
?
b14
G +
ru ru o?
?
bl L
Ylcfl
I + - T Y
& L
2 ru Y
\
Y
Y - - h 9 L
r\l % m Y
2
2 h
2ru
be
k
h
\
ru ?
L
+ I
m - ?
2 T Y
L
m \ Y
h ru ru
?
blrc L
YlN + I - ?
Y
& L
2 ul
\ Y
h % % 1 bl I
2
h
2ru
tnrc
ru T
L
I + - T Y
h L
2 \

Far Infrared Laser Magnetic Resonance 131
a T h e s t a t c s l a b e l e d F and F 2 a r e the t w o s p i n compo- 1 nents of a g i v e n r o t a t i o n a l level N o f a m o l e c u l e i n a d o u b l e t s t a t e . The p a r a m e t e r c o m b i n a t i o n s a r e r e l a t e d t o those of Eq. ( 2 4 ) b y
zz xx Y Y JT(gr’oo = -‘qr + gr + gr )
ZZ xx - Y Y &7r”2* = 2gr - gr ’r
” ) , w i t h s i m i l a r ‘r = l / 2 ( g r X X - (’2 2 2
e x p r e s s i o n s for ( q ) . T h e t e r m s p r e c e d e d b y a + s i g n choice a r e i n c l u d e % kq f o r levels w i t h K = 1 o n l y ; the u p p e r and l o w e r s i g n choices r e f e r t o the u p p e r (b) and l o w e r ( a ) K d o u b l e t s , r e s p e c t i v e l y .
E s t i m a t i o n of Zeeman P a r a m e t e r s
There are many parameters in the Zeeman Hamiltonians given above. At the start of the analysis of a new LMR spectrum, none of the values of these parameters are known and the pre- diction of Zeeman splittings might seem a daunting task. Fortunately, this is not so for two reasons. First, the elec- tronic contributions ( g and g ) to the magnetic moment are predominant and estimates whicg are reliable to a few parts in lo3 can be made simply by setting gL = 1.000 and gs = 2.002. In other words, the gross effects are completely predictable. Secondly, reliable formulae for estimating some of the non- adiabatic corrections to the magnetic moment are available. The best known is Curl’s relation~hip71,~~ which allows the anisotropic corrections to the spin g-factor to be estimated from spin-rotation constants. The relationship is
L
for a diatomic molecule and
for a polyatomic molecule; y and eaa are the spin-rotation constants, B and Baa are the rotational constants. The form- ula has been tested for many molecules and has been found reliable, particularly if only first or second row elements are involved. Several relationships between the g-factors of

132
c "
24
20
N I \" 16 %
g F I c w f 12
2 Fp
8
.- c 0 -
4
I I I 2 4 6
K. M. Evenson et al.
MJ MN
312 I
112 0 -1/2 - I
-3/2 - I
-112 0
1/2 I
and
(28)
Finally, there is a relationship for estim$$ing the electronic
e' 9, -q/B.
contributions to the rotational g-factors:'>

Far Infrared Laser Magnetic Resonance 133
(29)
where 5 is an appropriately weighted (atomic) spin-orbit coupling parameter.
Zeeman effect a fairly straightforward procedure. Once the spectrum has been fitted, of course, the perturbation formulae can be used in reverse to reach conclusions about the elec- tronic structure. So far, a "complete" determination of Zeeman parameters has been achieved in only one case, the free radical OH in its X211 state.68 The results are reproduced in Table 7, along with theoretical values estimated from some of the formulae above and also from a simple theoretical model (pure precession) appropriate for OH. The formulae can be seen to be very reliable in this case.
The use of these various formulae make the prediction of
- *
2 TABLE 7 . Zeeman Parameters for OH in the X l'I State
Parameter Experimental Estimate2 CalculatedC a
1.00107 (15 )
2 .00152(36)
4.00 ( 5 6 )
gL
gS
1 0 9 g
1 0 gr 1 0 9c
3
3
3 1
1 0 3 gr e'
-0.633 (1 9 )
6.386 ( 3 0 )
2.0446 (23)
a Values taken from Ref. 6 8 . represent one standard deviation, decimal place.
Values calculated paper.
C Values calculated are in pure precession. taken as 1 - 3 0 x
Concl uding Remarks
..... 1.00093
..... 2.00206
3.20 4 .29
..... -0.55
6.347 8 .58
2.087 2.19
The numbers in parentheses in units of the last quoted
from Eqs. ( 2 5 ) , (27) and (28 ) of this
2 2 + assuming that the X TI and A C state The relativistic correction w a s
Some of the useful characteristics of the Zeeman inter- action have already been mentioned, namely its predictability and use as a source of information on electronic structure.

134 K. M. Evenson et al.
In addition, we note that parity is not destroyed by a mag- netic field which is advantageous in calculations of the Zeeman effect. Again the Zeeman patterns in LMR spectroscopy are highly personal signatures of the transitions involved. While they can at times be baffling, their interpretation is usually unambiguous. Although not fully established, another desirable characteristic of the Zeeman parameters is emerging from recent LMR studies, that is, their weak dependence on vibrational coordinates. This is not very surprising since we have seen that they are mainly electronic in origin. It means that large centrifugal distortion or vibrational depen- dencies of the Zeeman parameters are not to be expected.
It remains only to question mildly the reliability of the Zeeman Hamiltonian presented here. It must be remembered that it is good to second order in perturbation theory only. large spin-orbit effects are involved (heavy elements) , third and higher order contributions can be significant. 74 contributions not only modify existing second order parameters but also introduce terms of completely different operator form.75 data results from the indeterminacies in the molecular Hamiltonian. These have been investigated in some detail Tor diatomic molecules; 63 they can be eliminated by the applica- tion of appropriate similarity transformations. The transfor- mations also affect the Zeeman terms in the Hamiltonian. For example, if the data for a molecule in a 211 state are fitted to a Hamiltonian with AD constrained to zero, two of the g-factors become effective parameters given by:
If
These
Another difficulty in the interpretation of Zeeman
In addition, two other terms of completely different operator . form are generated in the Hamiltonian by the reduction pro- c e ~ s e s , ~ ~ Such effects, which are very small, have not yet been detected in an experimental study.
V I I . CONCLUSION
Laser Magnetic Resonance, with its high sensitivity and high resolution, has produced detailed spectroscopic informa- tion on a number of interesting transient species which have eluded detection by other high resolution techniques. These

Far Infrared Laser Magnetic Resonance 135
same qualities of LMR should make it possible to detect certain astrophysically important radicals for which only theoretical (ab initio) estimates of parameters are available. The recent detection of LMR spectra from short-lived meta- stable electronic states and a molecular ion demonstrates that these difficult classes of radicals are now amenable to study by this method. laser lines increases the probability of the near coincidences needed for LMR studies. Many exciting new results are likely to proceed from this area in the next few years.
The continued discovery of additional F I R
REFERENCES
1.
2.
3.
4.
5.
6.
7.
8.
9.
10.
- 11.
12.
13. 14.
15.
16.
Carrington, A., "Microwave Spectroscopy of Free Fadicals", Academic Press, New York (1974). Knight, D. J. E., National Physical Laboratory, Teddington, Middx. U . K . ; Report #QU 45, March, 1979. Evenson, K. M., Broida, H. P., Wells, J. S., Mahler, R. J., and Mizushima, M., Phys. Rev. Lett. 21 , 1038 (1968). Wells, J. S. and Evenson, K. M., Rev. Sci. Inst. 41, 227 (1970). Evenson, K. M. and Wells, J. S., I E E E J . Quantum Elec- tron. QE-6, 184 (1970). Curl, Jr., R. F., Evenson, K. M., and Wells, J. S., J. Chem. Phys. 56, 5144 (1972). Evenson, K. M., Wells, J. S., and Radford, H. E., Phys. Rev. Lett. 25, 199 (1970). Evenson, K. M., Radford, H. E., and Moran, Jr., M. M., Appl. Phys. Lett. 18, 426 (1971). Mizushima, M., Evenson, K. M., and Wells, J. S., Phys. Rev. A 5 , 2276 (1972). Evenson, K. M. and Mizushima, M., Phys. Rev. A 6, 2197 (1972). Tomuta, L., Mizushima, M., Howard, C. J., and Evenson, K. M., Phys. Rev. A 1 2 , 974 (1975). Radford, H. E., Evenson, K. M., and Howard, C. J., J. Chem. Phys. 60, 3178 (1974). Hougen, Jon T., J. Mol. Spectrosc. 54, 447 (1975). HOUgen, Jon T., Radford, H. E., Evenson, K. M., and Howard, C. J., J. Mol. Spectrosc. 56, 210 (1975). Cook, J. M., Evenson, K. M., Howard, C. J., and Curl, Jr., R. F., J. Chem. Phys. 64, 1381 (1976). Davies, P. B., Russell, D. K . , Thrush, €3. A . , and Wayne, F. D., J. Chem. Phys. 62, 3739 (1975).

136 K. M. Evenson et al.
17.
18.
19.
20.
21.
22. 23.
24.
25. 26.
27.
28.
29.
30. 31. 32.
33.
34.
35.
36.
37.
38.
39.
40.
41.
Davies, P. B., Russe l l , D. K . , and Thrush, B. A . , Chem. P h y s . Le t t . 36, 280 (1975). Davies, P. B. , Russe l l , D. K . , and Thrush, B. A . , Chem. P h y s . L e t t . 37, 43 (1976). Howard, C. J. and Evenson, K. M . , J. Chem. P h y s . 6 1 , 1943 (1974). H o w a r d , C. J. and Evenson, K. M . , J. Chem. P h y s . 6 4 , 4303 (1976). Howard, C. J. and Evenson, K. M . , J. Chem. P h y s . 6 4 , 197 (1976). Howard , C. J . , J. Chem. P h y s . 6 5 , 4771 (1976). Howard, C. J. and Evenson, K. M . , G e o p h y s . R e s . L e t t . 4 , : 437 (1977). Crutzen, P. J. and Howard, C. J . , P u r e A p p l . G e o p h y s . 2 2 6 , 497 (1978). Howard , C. J., J. Chem. P h y s . 6 7 , 5258 (1977) . Thrush, B. A. , Harris, G. W . , and Burrows, J. P., N a t u r e , 267, 233 (1977). Hack, W . , Preuss , A. W . , and Wagner, H. Gg., B e r . B u n s e n g e s . P h y s . Chem. 8 2 , 1167 (1978). Hack, W . , Preuss , A. W . , Wagner, H. Gg., and Hoyennann, K . , B e r . B u n s e n g e s . P h y s . Chem. 8 3 , 212 (1979). St impfle , R. M . , Perry, R. A . , and H o w a r d , C. J . , J. Chem. P h y s . 7 1 , 5183 (1979). H o w a r d , C. J . , J. Chem. P h y s . 7 1 , 2352 (1979). Zahniser, M. S. and Howard, C. J . , i n prepara t ion . Chang, T. Y. and Bridges, T. J . , O p t . Commun. I , 423 (1970). Radford, H. E. and Li tvak, M. M . , Chem. P h y s . L e t t . 3 4 , 561 (1975). Wayne, F. D. and Radford, H. E . , Mol. P h y s . 3 2 , 1407 (1976). Davies, P. B. , R u s s e l l , D. K. , Thrush, B. A. , and Radford, H. E . , P r o c . R. SOC. Lond. A , 353, 299 (1978). Radford, H. E. and R u s s e l l , D. K . , J. Chem. P h y s . 6 6 , 2223 (1977). Evenson, K. M . , Jennings, D. A . , Pe te rsen , F. R . , Mucha, J. A . , Jimenez, J. J . , Charl ton, R. M . , and Howard, C. J., IEEE J. Quantum E l e c t r o n . QE-13, 442 (1977). Hougen, J. T . , Mucha, J. A . , Jennings, D. A . , and Evenson, K. M . , J. M o l . Spectrosc. 7 2 , 463 (1978). Mucha, J. A . , Jennings, D. A . , Evenson, K. M . , and Hougen, J. T., J. M o l . Spectrosc. 6 8 , 1 2 2 (1977). Davies, P. B. , Handy, B. J. , Murray-Lloyd, E. K . , and Smith, D. R . , J. Chem. P h y s . 6 8 , 1135 (1978). Davies, P. B . , Handy, B. J., Murray-Lloyd, E. K . , and R u s s e l l , D. K . , Mol. P h y s . 36, 1005 (1978).

Far Infrared Laser Magnetic Resonance 137
42.
43.
44.
. 45.
46.
47 *
48.
49.
50.
51.
52.
53.
54.
; 55.
56.
57.
58.
59.
Davies, P. B., Handy, B. J., Murray-Lloyd, E. K., and Russell, D. K., J. Chem. Phys. 68, 3377 (1978). Mucha, J. A., Evenson, K. M., Jennings, D. A., Ellison, G. B . , and Howard, C. J., Chem. Phys. Lett. 66, 244 (1979). Evenson, K. M., Saykally, R. J. , and Hougen, J. T., "Far- Infrared Laser Spectra of Methylene", 34th Symposium on Molecular Spectroscopy, Columbus, OH: June, 1979: Paper TF-5. Saykally, R. J. and Evenson, K. M., "The Ethynyl Radical (CCH) Detected by Laser Magnetic Resonance'' , 33rd Symposium on Molecular Spectroscopy, Columbus, OH; June, 1978: Paper FB-8. Tucker, K. D., Kutner, M. L., and Thaddeus, P., Astro- phys. J. 193, L115 (1974). Saykally, R. J. and Evenson, K. M., "The Far-Infrared Laser Magnetic Resonance Spectrum of CF", 34th Symposium on Molecular Spectroscopy, Columbus, OH; June, 1979; Paper TF-4. Saykally, R. J. and Evenson, K. M., Astrophys. J. 238, L1 (1980). Scalabrin, A., Mizushima, M., Saykally, R. J., Radford, H. E. , and Evenson, K. M. , "Laser Magnetic Resonance Spectrum of the alA Saykally, R. J. and Evenson, K. M., J. Chem. Phys. 71, 1564 (1979). Dixon, T. A. and Woods, R. C., Phys. Rev. Lett. 34, 61 (1975). Woods, R. C., Dixon, T. A., Saykally, R. J., and Szanto, P. G., Phys. Rev. Lett. 35, 1269 (1975). Saykally, R. J., Dixon, T. A., Anderson, T. G., Szanto, P. G., and Woods, R. C., Astrophys. J. 205, LlOl (1976). Dixon, T. A. and Woods, R. C., J. Chem. Phys. 67, 3956 (1977). Saykally, R. J., Szanto, P. G . , Anderson, T. G., and Woods, R. C., Astrophys. J. 204, L143 (1976). Saykally, R. J., "Microwave Spectroscopy of Transient Molecular Species in Glow Discharges", Ph.D. Thesis, University of Wisconsin (1977). Saykally, R. J. and Evenson, K. M., "Far-Infrared Laser Magnetic Resonance Spectra of a311 CO", 34th Symposium on Molecular Spectroscopy, Columbus, OH: June, 1979; Paper TF-6. Saykally, R. J. and Evenson, K. M., Phys. Rev. Lett. 43, 515 (1979). Kimble, H. J., IEEE J. Quantum Electron. QE-16, 455 (1980) .
state of 02", in preparation. g

138 K. M. Evenson et al.
60.
61.
62.
63.
64.
65.
66. 67. 68.
69.
70.
71. 72.
73.
74. 75.
76. 77.
Carrington, A., Levy, D. H., and Miller, T. A., Adv. Chem. Phys. 18, 149 (1970). Frosch, R. A. and Foley, H. M., Phys. Rev. 88, 1337 (1952). Zare, R. N., Schmeltekopf, A. L., Harrop, W. J., and Albritton, D. L. , J. Mol. Spectrosc. 46, 37 (1973). Brown, J. M., Colbourn, E. A., Watson, J. K. G., and Wayne, F. D., J. Mol. Spectrosc. 74, 294 (1979). Watson, J. K. G., "Vibrational Spectra and Structure" (J. R. Durig, ed.), Vol. 6, Elsevier, Amsterdam, 1977. Brown, J. M. and Sears, T. J., J. Mol. Spectrosc. 75, 111 (1979). Pryce, M. H. L., Proc. Phys. SOC. A63, 25 (1950). Miller, T. A. , Mol. Phys. 16 , 105 (1969). Brown, J. M., Kaise, M., Kerr, C. M. L., and Milton, D. J., Mol. Phys. 36, 553 (1978). Van Vleck, J. H., "The Theory of Electric and Magnetic Susceptibilities", Oxford University Press, London (1932) . Bowater, I. C., Brown, J. M., and Carrington, A., Proc. Roy. Soc. A333, 265 (1973). Curl, Jr., R. F., Mol. Phys. 9, 585 (1965). Tinkham, M. and Strandberg, M. W. P., Phys. Rev. 97, 951 (1955). Barnes, C. E., Brown, J. M., Carrington, A., Pinkstone, J., Sears, T. J., and Thistlethwaite, P. J., J. Mol. Spectrosc. 72, 86 (1978). Miller, T. A., J. Chem. Phys. 54, 3156 (1971). Brown, J. M., Carrington, A., and Sears, T. J., Mol. Phys. 37, 1837 (1979). Brown, J. M., unpublished results. Phillips, T. G., Huggins, P. J., Kuiper, T. B. H., and Miller, R. E. , Astrophys. J. 238, L6 (1980).