Rocks and Minerals Rocks and Minerals Fourth Grade Fourth Grade.
Upload
phungnguyetCategory
view
241download
18
CHEMICAL ANALYSIS OF ROCKS AND MINERALS
NEW ANALYTICAL METHODS DEVELOPED FOR SOME MAJOR
AND MINOR COMPONENTS
Risto Saikkonen
Geological Survey of Finland
Espoo 1996

CHEMICAL ANALYSIS OF ROCKS AND MINERALSNEW ANALYTICAL METHODS DEYELOPED FOR SOME MAIOR
AND MINOR COMPONENTS
by
Risto Saikkonen
Academic Dissertation
To be presented with the permission of the Faculty of Science of the University of Helsinki
for public criticism in the Main l-ecture Hall A110 of the Department of Chemistry
(A.I. Virtasen aukio 1) at 12 noon on February zth, L996.
Geological Survey of Finland
Chemical Laboratory
Espoo 1996
CHEMICAL ANALYSIS OF ROCKS AND MINERALS
NEW ANALYTICAL l\1ETHODS DEVELOPED FOR SOl\1E MAJOR
AND MINOR COMPONENTS
by
Risto Saikkonen
Academic Dissertation
To be presented with the permission of the Faculty of Science of the University of Helsinki
for public criticism in the Main Lecture Hall AllO of the Department of Chemistry
CA.! . Virtasen aukio 1) at 12 noon on February 2th, 1996.
Geological Survey of Finland
Chemical Laboratory
Espoo 1996

Saikkonen, Risto 1996. Chemical analysis of rocks and minerals - new analytical
methods developed for some major and minor components. Espoo: Geological Survey
of Finland. 47 pages,2 figures, 5 tables and one appendix.
The snrdy examines a number of geological samples the chemical analysis of which requires in-depth
knowledge of preparation, decomposition and determination techniques. Rock, mineral and meteorite samples
were analysed with modified classical wet-chemical methods and more modern instrumental methods
(Publications I-D. The Summary presents the first published total analysis of the Malampaka meteorite (an
olivine-bronzite chondrite). Chemical analyses of some mineral samples are also presented for the frrst time.
In the course of the work, analytical methods were developed and studied for rocks, minerals and other
geological materials such as meteorites. To establish the accuracy, precision and detection limits of these
methods, they were compared with existing methods using domestic and international reference samples.
The development and investigation of analytical methods for water, ferrous iron and carbon are presented in
separate publications (VI-VIID. The determinations of these components are discussed in the Summary in
those respects not dealt with above. Determinations of halogens, sulphur and loss on ignition are discussed
on the basis of the literature and practical experience.
Key words (Georef Thesaurus, AGI): chemical analysis, wet methods, atomic absorption, emission
spectroscopy, infrared spectroscopy, rocks, minerals, meteorites, chemical elements, water, ferrous iron,
carbon, halogens, sulfur, loss on ignition.
Risto Saikkonen
Geological Survey of Finland
FIN-02150 Espoo
Finland
Y,ISBN 951-690-61 7-d1,".. ^--/i1<? L*'">' -l/nHelsinki 1996
o( t7 "'ry )Ytiopistopaino c/T1 /*e'?t'-t'FPikapaino
Saikkonen, Risto 1996. Chemical analysis of rocks and minerals - new analytical
methods developed for some major and minor components. Espoo: Geological Survey
of Finland. 47 pages, 2 figures, 5 tables and one appendix.
The study examines a number of geological sampies the chemical analysis of which requires in-depth
knowledge of preparation, decomposition and determination techniques . Rock, mineral and meteorite sampies
were analysed with modified classical wet-chemical methods and more modern instrumental methods
(Publications I-V) . The Summary presents the first published total analysis of the Malampaka meteorite (an
olivine-bronzite chondrite). Chemical analyses of some mineral sampies are also presented for the first time.
In the course of the work, analytical methods were developed and studied for rocks, minerals and other
geological materials such as meteorites. To establish the accuracy, precision and detection limits of these
methods, they were compared with existing methods using domestic and international reference sampies.
The development and investigation of analytical methods for water, ferrous iron and carbon are presented in
separate publications (VI-VIII) . The determinations of these components are discussed in the Summary in
those respects not dealt with above . Determinations of halogens, sulphur and loss on ignition are discussed
on the basis of the literature and practical experience.
Key words (Georef Thesaurus, AGI): chemical analysis, wet methods, atomic absorption, emission
spectroscopy, infrared spectroscopy, rocks, minerals, meteorites, chemical elements, water, ferrous iron,
carbon, halogens, sulfur, loss on ignition.
Risto Saikkonen
Geological Survey of Finland
FIN-02150 Espoo
Finland
~ .. crtL ISBN 951-690-617-6 (~J ~ () nf'f I'Y' ='")
Helsinki 1996 C/l..., . ~ Yliopistopaino Pikapaino

FOREWORD
INTRODUCTION
CHEMICAL ANALYSIS OF ROCKS AND MINERALS
AND CERTAIN SPECIAL SAMPLES
Sample preparation
Rock analysis
Mineral analysis
Analysis of special samples
ELEMENTS AND COMPONENTS REQIIIRING
INDIVIDUAL DETERMINATION
Determination of water
Determination of ferrous iron
Determination of carbon
Determination of halogens, sulphur and
loss on ignition
SUMMARY
ACKNOIü/LEDGEMENTS
REFERENCES
APPENDIX: chemical composition ....
4
L2
2.t
2.2
2.3
2.4
J
3.1
3.2
J.J
3.4
L2
L4
2L
22
24
24
26
29
30
35
38
4
39
1
2
2.1
2.2
2.3
2.4
3
3.1
3.2
3.3
3.4
4
3
CONTENTS
FOREWORD
INTRODUCTION
CHEMICAL ANALYSIS OF ROCKS AND MINERALS
AND CERTAIN SPECIAL SAMPLES
Sampie preparation
Rock analysis
Mineral analysis
Analysis of special sampies
ELEMENTS AND COMPONENTS REQUIRING
INDIVIDUAL DETERMINATION
Determination of water
Determination of ferrous iron
Determination of carbon
Determination of halogens, sulphur and
loss on ignition
SUMMARY
ACKNOWLEDGEMENTS
REFERENCES
APPENDIX: chemical composition ....
4
7
12
12
14
21
22
24
24
26
29
30
35
38
39

FOREWORD
This work comprises the following papers published previously:
I Laajoki, K. and Saikkonen, R., 1977 . On the geology and geochemistry
of the Precambrian iron formations in Väyrytänkylä, south Puolanka area, Finland.
Part Geochemistry. Geological Survey of Finland, Bulletin 292,78-723.
11 Danielsson, R. and Saikkonen, R., 1985. Chemical analysis of USGS-
W-2, USGS-DNC-I and USGS-BIR-I standard rocks. Geological Survey of Finland,
Report of Investigation 70. 13 p.
UI Lahti, S. and Saikkonen, R., 1985. Bityite 2Ml from Eräjärvi compared
with related LiBe brittle micas. Bulletin of the Geological Society of Finland 57, Part
r-2. 207-215.
W Lahti, S. and Saikkonen, R., 1986. Kunzite from the Haapaluoma
pegmatite quarry, western Finland. Bulletin of the Geological Society of Finland 58,
Part2,47-52.
V Kinnunen, K. A. and Saikkonen, R., 1983. Kivesvaara C2 chondrite:
silicate petrography and chemical composition. Bulletin of the Geological Society of
Finland 55, Part t,35-49.
VI Saikkonen, Risto J., 1990. Determination of water in silicate rock
samples by combustion and infrared absorption. Bulletin of the Geological Society of
Finland 62, Pat l,7l-77.
VII Saikkonen, Risto J. and Rautiainen, Irja A., 1993. Determination of
ferrous iron in rock and mineral samples by three volumetric methods. Bulletin of the
Geological Society of Finland 65, Part I, 59-63.
4
FOREWORD
This work comprises the following papers published previously:
I Laajoki, K. and Saikkonen, R., 1977. On the geology and geochemistry
of the Precambrian iron formations in Väyrylänkylä, south Puolanka area , Finland.
Part Geochemistry . Geological Survey of Finland, Bulletin 292, 78-123.
11 Danielsson, R. and Saikkonen, R., 1985. Chemical analysis of USGS
W-2, USGS-DNC-1 and USGS-BIR-1 standard rocks . Geological Survey of Finland,
Report of Investigation 70. 13 p.
111 Lahti, S. and Saikkonen, R., 1985. Bityite 2M1 from Eräjärvi compared
with related Li-Be brittle micas. Bulletin of the Geological Society of Finland 57, Part
1-2, 207-215 .
IV Lahti, S. and Saikkonen, R., 1986. Kunzite from the Haapaluoma
pegmatite quarry , western Finland. Bulletin of the Geological Society of Finland 58,
Part 2, 47-52.
V Kinnunen, K. A. and Saikkonen, R., 1983. Kivesvaara C2 chondrite:
silicate petrography and chemical composition. Bulletin of the Geological Society of
Finland 55 , Part 1, 35-49.
VI Saikkonen, Risto J., 1990. Determination of water in silicate rock
sampies by combustion and infrared absorption. Bulletin of the Geological Society of
Finland 62, Part 1, 71-77 .
VII Saikkonen, Risto J. and Rautiainen, Irja A., 1993. Determination of
ferrous iron in rock and mineral sampies by three volumetrie methods. Bulletin of the
Geological Society of Finland 65 , Part 1, 59-63 .

)
VIII Saikkonen, Risto J. and Rautiainen, Irja A., 1990. Determination oftotal carbon and non-carbonate carbon in rock samples by an infrared absorption
method. Bulletin of the Geological Society of Finland 62, Part 2, L49-156.
These publications are referred to in the Summary with Roman numerals I-VIII.
Publication I deals with the geochemistry of the Precambrian sedimentary iron
formations at Väyrylänkylä, Puolanka, with the aid of total rock, partial rock and
mineral analyses.
Publication II presents new, previously unpublished analytical data on three reference
rock samples of the USGS, i.e., W-2 diabase, DNC-I diabase and BIR-I basalt. The
analytical data obtained are compared with those reported by geolaboratories abroad.
Publication III examines in detail the bityite mineral, Cä,.sr lq.o: Nao.oz (Lir.re Als.os
M9o.rs Feq.13) (Alr53 Bez.z, Si4.26) ors.ro (oH)4.s4 F€0.,u, which occurs in a
pegmatite vein at Eräjärvi. The mineral had not previously been described from
Finland.
Publication IV describes a purple, transparent spodumene from Peräseinäjoki, Finland,
which turned out to be a gem-quality kunzite.
Publication V is a study on the Kivesvaara meteorite found in Paltamo, northern
Finland, in 1968. In chemical and mineralogical composition and in structure the
meteorite is a rare C2-class carbon-bearing chondrite.
Publication VI describes a new method for determining water in rock and mineral
samples based on infra-red absorption.
5
VIII Saikkonen, Risto J. and Rautiainen, Irja A., 1990. Determination of
total carbon and non-carbonate carbon in rock sampies by an infra red absorption
method. Bulletin of the Geological Society of Finland 62, Part 2, 149-156.
These publications are referred to in the Summary with Roman numerals I-VIII.
Publication I deals with the geochemistry of the Precarnbrian sedirnentary iron
formations at Väyrylänkylä, Puolanka, with the aid of total rock, partial rock and
mineral analyses .
Publication II presents new, previously unpublished analytical data on three reference
rock sampies of the USGS , Le., W-2 diabase, DNC-1 diabase and BIR-1 basalt. The
analytical data obtained are compared with those reported by geolaboratories abroad.
Publication III examines in detail the bityite mineral, Cal.93 Ko.o3 Nao.02 (Li1.l9 A13.68
MgO.35 Feo.13) (Al l.53 Be2.21 Si4.26 ) 019.30 (OH) 4.54 FeO.161 which occurs in a
pegmatite vein at Eräjärvi . The mineral had not previously been described from
Finland.
Publication IV describes a purple, transparent spodumene from Peräseinäjoki, Finland,
which tumed out to be a gem-quality kunzite.
Publication V is a study on the Kivesvaara meteorite found in Paltamo, northem
Finland, in 1968. In chemical and mineralogical composition and in structure the
meteorite is a rare C2-class carbon-bearing chondrite.
Publication VI describes a new method for determining water in rock and mineral
sampies based on infra-red absorption.

6
Publication VII examines three methods for determining ferrous iron and discusses
their accuracy and precision, and possible sources of error-
hrblication VIII reports the determination of total carbon with infra-red absorption
spectrometry and that of non-carbonate carbon in a chemically pretreated sample using
the same method.
6
Publication VII examines three methods for detennining ferrous iron and discusses
their accuracy and precision, and possible sources of error.
Publication VIII reports the detennination of total carbon with infra-red absorption
spectrometry and that of non-carbonate carbon in a chemically pretreated sampIe using
the same method.

INTRODUCTION
The chemical analysis of rocks and minerals determines the concentrations of elements
and certain components. Geological investigations, which are often an integral part of
exploration for resources of raw materials in bedrock, require increasingly detailed
information on the chemical composition of rocks and minerals. Although often
covered, bedrock occurs everywhere on the globe. It is composed of different
lithologies (rocks), which in turn are composed of minerals. Most minerals, of which
over 2000 species are known, are crystalline compounds. The majority are rare and
thus unimportant as rock-forming constituents. The major minerals of rock types
number only a few tens and these are mainly silicates.
The established practice in classical rock analysis is to determine the composition of
13-18 elements. This type of analysis is called total analysis. Chemical analyses of
rocks are usually expressed as weight percents of oxides for the major elements. It is
assumed, in the absence of oxygen determinations, that the major cations are
accompanied by a stoichiometrically equivalent amount of oxygen. Most rocks are
silicate rocks composed of silicate minerals; total analysis is then called silicate analysis
and includes the following major and minor components: silica, titanium dioxide,
aluminium oxide, manganese oxide, iron(III) oxide, iron(Il) oxide, calcium oxide,
magnesium oxide, sodium oxide, potassium oxide, phosphorus pentoxide, carbon
dioxide, constitutional water and moisnrre water. These components are analysed
because they are the ones used in petrochemical calculations of the rocks and because
it is easier to compare rock analyses with each other if the same components are
determined and if they are reported in the same order (Lightfoot 1983, Mueller &
Saxena 1977). Sulphur, fluorine and chlorine concentrations and loss on ignition are
also often determined. The concentrations of major components usually exceed l%,
and those of minor components are in the range 1-0.01 Vo. The consentrations of trace
components are less than 0.01% and are frequently reported in parts per million, PPD,
or nglg. All the components included in the total analysis of rocks or minerals may be
called major components. Today, an ever increasing number of trace elements can be
determined (Table 1). For silicate minerals, the concentrations of components are
reported in the same way as they are for silicate rocks. The components of non-silicate
minerals and rocks may differ and these are often reported in order of importance.
7
1 INTRODUCTION
The chemical analysis of rocks and minerals determines the concentrations of elements
and certain components . Geological investigations, which are often an integral part of
exploration for resources of raw materials in bedrock, require increasingly detailed
information on the chemical composition of rocks and minerals . Although often
covered, bedrock occurs everywhere on the globe. It is composed of different
lithologies (rocks), which in turn are composed of minerals . Most minerals , of which
over 2000 species are known, are crystalline compounds. The majority are rare and
thus unimportant as rock-forming constituents. The major minerals of rock types
number only a few tens and these are mainly silicates.
The established practice in classical rock analysis is to determine the composition of
13-18 elements . This type of analysis is called total analysis . Chemical analyses of
rocks are usually expressed as weight percents of oxides for the major elements. It is
assumed, in the absence of oxygen determinations , that the major cations are
accompanied by a stoichiometrically equivalent amount of oxygen. Most rocks are
silicate rocks composed of silicate minerals; total analysis is then called silicate analysis
and includes the following major and minor components: silica, titanium dioxide ,
aluminium oxide, manganese oxide, iron(lII) oxide, iron(ll) oxide, calcium oxide,
magnesium oxide, sodium oxide, potassium oxide, phosphorus pentoxide, carbon
dioxide, constitutional water and moisture water. These components are analysed
because they are the ones used in petrochemical calculations of the rocks and because
it is easier to compare rock analyses with each other if the same components are
determined and if they are reported in the same order (Lightfoot 1983 , Mueller &
Saxena 1977). Sulphur, fluorine and chlorine concentrations and loss on ignition are
also often determined. The concentrations of major components usually exceed 1 %,
and those of minor components are in the range 1-0.01 %. The concentrations of trace
components are less than 0.01 % and are frequently reported in parts per million, ppm,
or ng/g. All the components included in the total analysis of rocks or minerals may be
called major components . Today, an ever increasing number of trace elements can be
determined (Table 1). For silicate minerals, the concentrations of components are
reported in the same way as they are for silicate rocks. The components of non-silicate
minerals and rocks may differ and these are often reported in order of importance.

8
Mineral analyses are used to calculate the formula for the mineral being investigated,
to check the "purity" of the mineral, e.g. to establish the extent to which two minerals
are mixed with each other in solid solution, and to gauge large compositional variations
in minerals. The above also applies to special geological samples such as meteorites.
The elements determined at any one time depend on the purpose for which their
concentrations are used or needed (see Johnson & Maxwell 1981, Potts 1987).
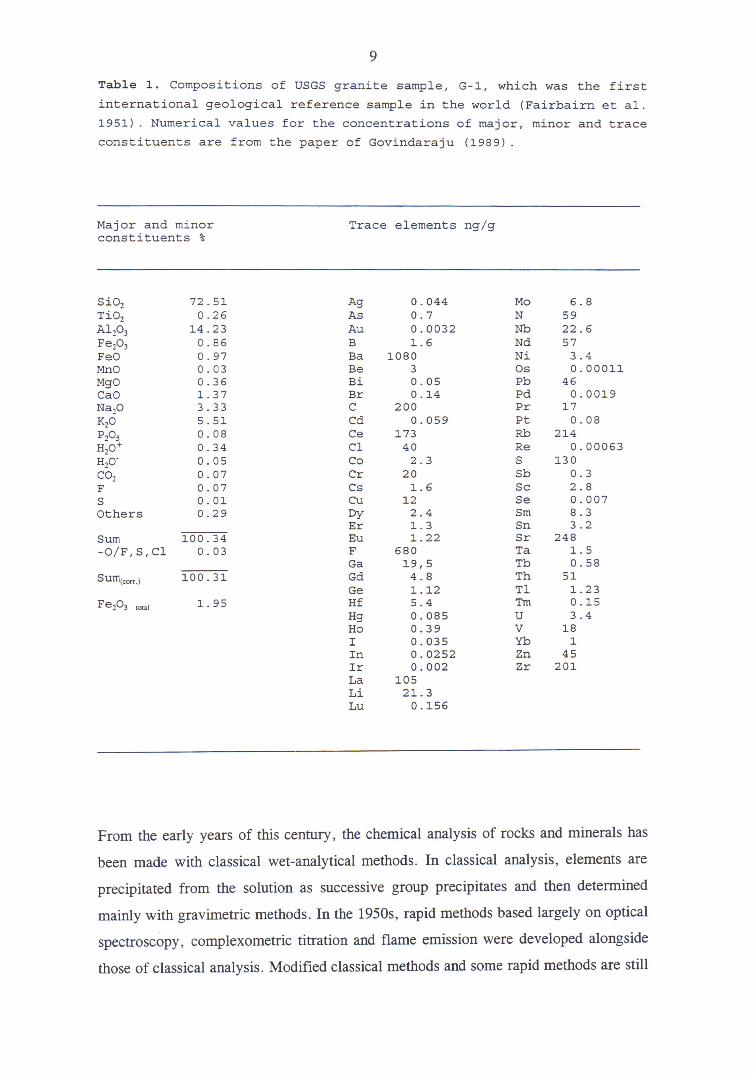
Table I gives the total composition and several trace element concentrations of a
silicate rock, granite G-I, which was the first international reference rock sample
(Fairbairn 1951). The components of the total analysis are summed. The sum is one of
the criteria of the success of total analysis. It does not, however, guarantee that the
data on the single components are correct. Opinions differ about the magnitude of the
sum of a good analysis but 100% + 0.5% is universally considered acceptable. The
analysis sum should be corrected by subtracting the amount of oxygen corresponding
to sulphide sulphur and fluorine and chlorine, because the elements that occur as
sulphides, fluorides or chlorides are reported as oxides. The sulphide correction can be
done only if the mineral composition of the sample is known (Jeffery & Hutchison
1983).
The analytical method used here includes chemical pretreatment of the sample and the
method of determination plus the output of data. Sample preparation with its various
stages takes place between the analytical procedure and sampling. The method of
determination includes the pretreatrnent technique of a portion of the sample, the
instrumental or other determination and the output of data. The quality of the
analytical methods depends on the quality of all the contributing factors. The quality of
the methods can be assessed with various parameters deduced from the analytical data
obtained (see Johnson 1993, Potts 1993). Thanks to the rapid progress made in
instrumentation, automatics and data processing, well-equipped laboratories can now
produce more and more rock analyses with an increasing number of trace elements.
Assuring the quality of analytical data has thus become increasingly important, and
laboratories are required to report on and interpret the quality and applicability of their
analytical data. Correct use and interpretation of analytical data help guarantee the
success of geological investigations and interpretations.
8
Mineral analyses are used to calculate the formula for the mineral being investigated,
to check the "purity" of the mineral, e.g. to establish the extent to which two minerals
are mixed with each other in solid solution, and to gauge large compositional variations
in minerals. The above also applies to special geological sampies such as meteorites.
The elements determined at any one time depend on the purpose for which their
concentrations are used or needed (see Johnson & Maxwell 1981, Potts 1987).
Table 1 gives the total composition and several trace element concentrations of a
silicate rock, granite G-I, which was the first international reference rock sampie
(Fairbairn 1951). The components of the total analysis are summed. The sum is one of
the criteria of the success of total analysis. It does not, however, guarantee that the
data on the single components are correcL Opinions differ about the magnitude of the
sum of a good analysis but 100% ± 0.5% is universally considered acceptable. The
analysis sum should be corrected by subtracting the amount of oxygen corresponding
to sulphide sulphur and fluorine and chlorine, because the elements that occur as
sulphides, fluorides or chlorides are reported as oxides. The sulphide correction can be
done only if the mineral composition of the sampie is known (Jeffery & Hutchison
1983) .
The analytical method used here includes chemical pretreatment of the sampie and the
method of determination plus the output of data. Sampie preparation with its various
stages takes place between the analytical procedure and sampling. The method of
determination includes the pretreatment technique of a portion of the sampie, the
instrumental or other determination and the output of data. The quality of the
analytical methods depends on the quality of all the contributing factors. The quality of
the methods can be assessed with various parameters deduced from the analytical data
obtained (see Johnson 1993, Potts 1993). Thanks to the rapid progress made in
instrumentation, automatics and data processing, well-equipped laboratories can now
produce more and more rock analyses with an increasing number of trace elements.
Assuring the quality of analytical data has thus become increasingly important, and
laboratories are required to report on and interpret the quality and applicability of their
analytical data. Correct use and interpretation of analytical data help guarantee the
success of geological investigations and interpretations.
9
Table 1. Compositions of USGS granite sample, G-1, which was theint,ernational geological reference sample in the world (FairbairnL951) Numerical values for the concentrations of major, minor andconstituents are from the paper of Govindaraju (1989) .
firsts^! ^1gL AI.
Erace
Major and mj-norconstituents ?
Trace elements nglg
sio2Ti02A12O3
Fe2O3
FeOMnOMgoCaONarOKzoPzosHzo*Hzo'UU2
!
öOthers
Sum-olF, s, c1
Sufl\con.)
FerO, ,oo,
72 .5Lv . zo
L4.23n cÄ
0.030.351.373.335.5L0.080 .340.050.070.070.0r-o -29
r.öö:-3"0.03
1oo. 31
a. vf
0 -044o.70.00321.5
108030. 050. l-4
2000. 059
]-.73402.3
201.6
L22.4l-. 3t -22
6801q q
4.8L.t25.40. 0850.390. 0350 .02520. 002
1052L.3
0.155
AgAS
BBaBeBiBrccdCec1
Cr
DyErEuF9d
GdGeHfHgHoIInIrT.t
LiLu
Mo 5.8N59Nb 22.6Nd 57Ni 3.4Os 0.00011-Pb 46Pd 0.0019Pr L7Pt 0.08Rb 2L4Re 0.00063s 130sb 0.3Sc 2.8se 0.007Sm 8.3Sn 3.2Sr 248Ta 1.5Tb 0.58Th 5r-T1 L.23Ttn 0. 15u 3.4v18Yb1Zn 45ZT 2OL
From the early years of this century, the chemical analysis of rocks and minerals has
been made with classical wet-analytical methods. In classical analysis, elements are
precipitated from the solution as successive group precipitates and then determined
mainly with gravimetric methods. In the 1950s, rapid methods based largely on optical
spectroscopy, complexometric titration and flame emission were developed alongside
those of classical analysis. Modified classical methods and some rapid methods are still
9
Table 1. Compositions of USGS granite sampIe, G-1, which was the first
international geological reference sampIe in the world (Fairbairn et al.
1951) . Numerical values for the concentrations of major, minor and trace
constituents are from the paper of Govindaraju (1989) .
Major and minor constituents %
Si02 72 . 51 Ti02 0.26 AlP3 14 . 23 Fep3 0 .8 6 FeO 0.97 MnO 0.03 MgO 0.36 CaO l. 37 Nap 3.33 K20 5.51 P20S 0.08 HzO + 0.34 Hp' 0.05 COz 0.07 F 0.07 S 0.01 Others 0 . 29
Sum 100.34 - O/ F,S,Cl 0.03
SUlI\corr.) 100.31
Fez0 3 tOlal l. 95
Trace elements ng/g
Ag 0.044 As 0 . 7 Au 0.0032 B l.6 Ba 1080 Be 3 Bi 0.05 Br 0.14 C 200 Cd 0.059 Ce 173 Cl 40 Co 2.3 Cr 20 Cs l.6 Cu 12 Dy 2 . 4 Er l.3 Eu l. 22 F 680 Ga 19,5 Gd 4 . 8 Ge l.12 Hf 5.4 Hg 0.085 Ho 0 . 39 I 0.035 In 0.0252 Ir 0.002 La 105 Li 2l.3 Lu 0.156
Mo 6.8 N 59 Nb 22 . 6 Nd 57 Ni 3.4 Os 0.00011 Pb 46 Pd 0.0019 Pr 17 Pt 0 . 08 Rb 214 Re 0 . 00063 S 130 Sb 0 . 3 Sc 2.8 Se 0.007 Sm 8.3 Sn 3 . 2 Sr 248 Ta l.5 Tb 0.58 Th 51 Tl l. 23 Tm 0 . 15 U 3 . 4 V 18 Yb 1 Zn 45 Zr 201
From the early years of this century, the chemical analysis of rocks and minerals has
been made with classical wet-analytical methods. In classical analysis, elements are
precipitated from the solution as successive group precipitates and then determined
mainly with gravimetric methods . In the 1950s, rapid methods based largely on optical
spectroscopy, complexometric titration and flame emission were developed alongside
those of classical analysis. Modified classical methods and some rapid methods are still

10
used for the total analyses of reference rock and mineral samples required by
instruments and other non-routine samples and for determining the concentrations of
some elements and components. Since the 1960s, X-ray fluorescence spectrometry
(wavelength dispersive and energy dispersive), instrumental neutron activation analysis
and flame atomic absorption and emission spectrometry and graphite furnace AA
spectrometry, since the 1970s, plasma atomic emission spectrometry and since the
1980s, plasma mass spectrometry, have replaced many of the classical and rapid
methods. Today, chemical analyses of rocks and minerals are made on instruments
capable of determining up to 30-40 elements simultaneously or in rapid succession.
Among the techniques now in common use are the X-ray fluorescence analysis (XRF,
in this study WD-XRF), flame atomic absorption spectrometry (AAS) and inductively
coupled plasma atomic emission spectrometry GCP-AES).
However, not all the components of total rock and mineral analyses can be determined
with these instruments. The determinations of elements or components that cannot be
made with the above instruments, or which for some other reason are made separately,
are here called individual determinations. Water, ferrous iron and carbon are the most
common components analysed in this way. For rocks and minerals, halogen and
sulphur concentrations and loss on ignition are also often measured as individual
determinations.
The water in rocks and minerals occurs as moisture and constitutional or essential
water. There are several methods for determining water, the most cornmon of which
are those based on gravimetry, titrimetry and infra-red (IR) spectrometry (Section 3.1,
vD.
In rock and mineral samples, iron mostly occurs in oxidation states +II and +III.After the concentration of ferrous iron has been determined, the concentration of ferric
iron can be calculated as a difference: Fe(total) - Fe (ferrous) : Fe (fenic). Iron(II)
is usually determined by titrimetry or spectrophotometry. There are very few methods
for determining iron(III) (Section 3.2, VII).
Carbon occurs in rocks and minerals as carbonate carbon and non-carbonate carbon,
both of which are measured as individual determinations. The methods used for
10
used for the total analyses of reference rock and mineral sampies required by
instruments and other non-routine sampies and for determining the concentrations of
some elements and components . Since the 1960s, X-ray fluorescence spectrometry
(wavelength dispersive and energy dispersive), instrumental neutron activation analysis
and flame atomic absorption and emission spectrometry and graphite furnace AA
spectrometry, since the 1970s, plasma atomic emission spectrometry and since the
1980s, plasma mass spectrometry, have replaced many of the classical and rapid
methods. Today , chemical analyses of rocks and minerals are made on instruments
capable of determining up to 30-40 elements simultaneously or in rapid succession.
Among the techniques now in common use are the X-ray fluorescence analysis (XRF,
in this study WD-XRF) , flame atomic absorption spectrometry (AAS) and inductively
coupled plasma atomic emission spectrometry (ICP-AES).
However, not all the components of total rock and mineral analyses can be determined
with these instruments. The determinations of elements or components that cannot be
made with the above instruments, or which for some other reason are made separately ,
are here called individual determinations. Water, ferrous iron and carbon are the most
common components analysed in this way. For rocks and minerals , halogen and
sulphur concentrations and loss on ignition are also often measured as individual
determinations .
The water in rocks and minerals occurs as moisture and constitutional or essential
water. There are several methods for determining water, the most common of which
are those based on gravimetry, titrimetry and infra-red (IR) spectrometry (Section 3.1,
VI) .
In rock and mineral sampies, iron mostly occurs in oxidation states +11 and + IH .
After the concentration of ferrous iron has been determined, the concentration of ferric
iron can be calculated as a difference: Fe(total) - Fe (ferrous) = Fe (ferric). Iron(H)
is usually determined by titrimetry or spectrophotometry . There are very few methods
for determining iron(III) (Section 3.2, VII) .
Carbon occurs in rocks and minerals as carbonate carbon and non-carbonate carbon,
both of which are measured as individual determinations. The methods used for

11
determining the total carbon concentration are based on combustion of the sample, in
the course of which the elemental carbon converts into carbon dioxide and the total
carbon can be measured as carbon dioxide. The carbon concentration in carbonate is
obtained by liberating and measuring the carbon dioxide from carbonates. Non-
carbonate carbon can be obtained from the difference between total and carbonate
carbons but can also be determined individually. Non-carbonate carbon is composed of
graphite and organic carbon (Section 3.3, VIII).
Halogens can be analysed by XRF although individual determinations are also
frequently made with an ion-selective electrode, ion-chromatography and spectro-
photometry. Neutron activation is also used (Section 3.4). The total sulphur in a sample
can also be analysed by XRF, but it is most commonly measured as an individual
determi- nation by combusting sulphur into oxide and measuring the amount of sulphur
dioxide thus formed. The sulphide and sulphate sulphurs in a sample can be analysed
individually with wet-chemical methods, too (Section 3.4). Loss on ignition (LOI) is
determined gravimetrically by igniting the sample at a high temperature (1000-120OC)
and measuring the loss in weight. LOI indicates the amount of volatile components in
the sample. These components include e.g. water (both moisture, HrO-, and essential
water, HrO*), carbon dioxide (COr, sulphur (S) and organic matter (Section 3.4).
CHEMICAL ANALYSES OF ROCK, MINERAL AND CERTAIN
SPECIAL SAMPLES
This section deals with the preparation and chemical analysis of rock and mineral
samples and certain special samples such as meteorites. An analytical package
containing modified classical methods and new methods is described, and a brief look
is taken at AAS, XRF and ICP-AES.
11
determining the total carbon concentration are based on combustion of the sample, in
the course of which the elemental carbon converts into carbon dioxide and the total
carbon can be measured as carbon dioxide. The carbon concentration in carbonate is
obtained by liberating and measuring the carbon dioxide from carbonates. Non
carbonate carbon can be obtained from the difference between total and carbonate
carbons but can also be determined individually. Non-carbonate carbon is composed of
graphite and organic carbon (Section 3.3, VIII).
Halogens can be analysed by XRF although individual determinations are also
frequently made with an ion-selective electrode, ion-chromatography and spectro
photometry. Neutron activation is also used (Section 3.4) . The total sulphur in a sampie
can also be analysed by XRF, but it is most commonly measured as an individual
determi- nation by combusting sulphur into oxide and measuring the amount of sulphur
dioxide thus formed . The sulphide and sulphate sulphurs in a sample can be analysed
individually with wet-chemical methods, too (Section 3.4). Loss on ignition (LOI) is
determined gravimetrically by igniting the sample at a high temperature (lOOO-1200"C)
and measuring the loss in weight. LOI indicates the amount of volatile components in
the sample. These components include e.g. water (both moisture , H20 ·, and essential
water, H20 +) , carbon dioxide (C02), sulphur (S) and organic matter (Section 3.4) .
2 CHEMICAL ANALYSES OF ROCK, MINERAL AND CERTAIN
SPECIAL SAMPLES
This section deals with the preparation and chemical analysis of rock and mineral
sampies and certain special sampies such as meteorites. An analytical package
containing modified classical methods and new methods is described, and a brief look
is taken at AAS, XRF and ICP-AES.
t2
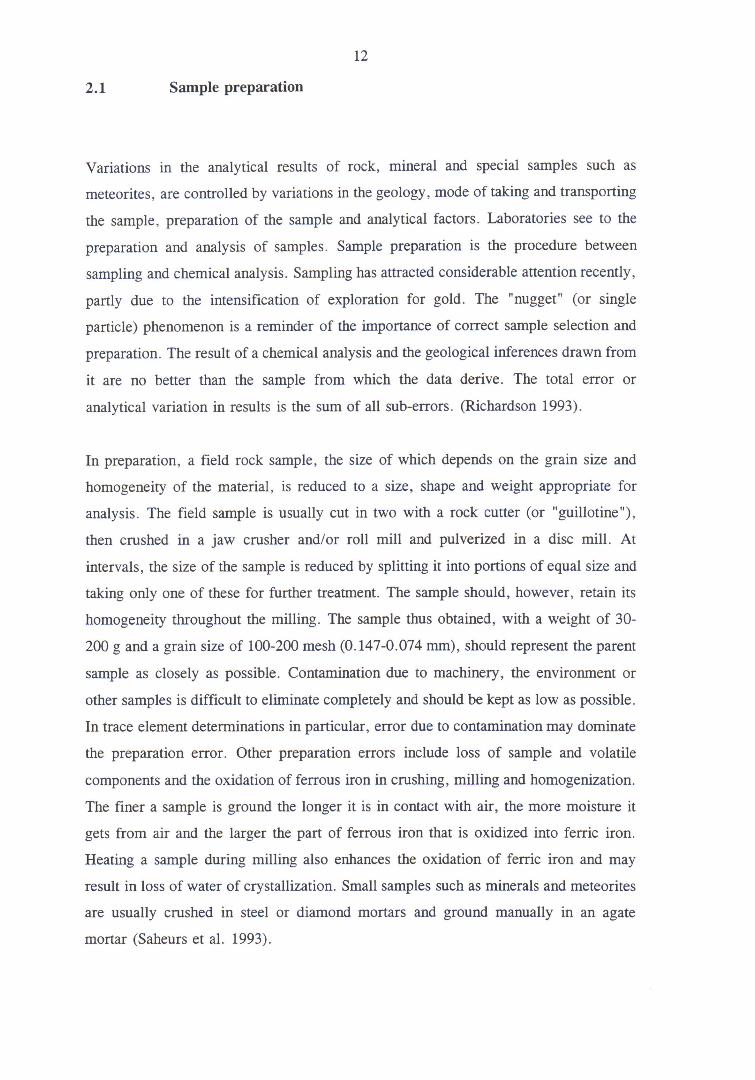
2.1 Sample preparation
Variations in the analytical results of rock, mineral and special samples such as
meteorites, are controlled by variations in the geology, mode of taking and transporting
the sample, preparation of the sample and analytical factors. Laboratories see to the
preparation and analysis of samples. Sample preparation is the procedure between
sampling and chemical analysis. Sampling has attracted considerable attention recently,
partly due to the intensification of exploration for gold. The "nugget" (or single
particle) phenomenon is a reminder of the importance of correct sample selection and
preparation. The result of a chemical analysis and the geological inferences drawn from
it are no better than the sample from which the data derive. The total error or
analytical variation in results is the sum of all sub-errors. (Richardson 1993).
In preparation, a field rock sample, the size of which depends on the grain size and
homogeneity of the material, is reduced to a size, shape and weight appropriate for
analysis. The field sample is usually cut in two with a rock cutter (or "guillotine"),
then crushed in a jaw crusher and/or roll mill and pulverized in a disc mill. At
intervals, the size of the sample is reduced by splitting it into portions of equal size and
taking only one of these for further treaftnent. The sample should, however, retain its
homogeneity throughout the milling. The sample thus obtained, with a weight of 30-
200 g and a grain size of 100-200 mesh (0.147-0.074 mm), should represent the parent
sample as closely as possible. Contamination due to machinery, the environment or
other samples is difficult to eliminate completely and should be kept as low as possible.
In trace element determinations in particular, error due to contamination may dominate
the preparation error. Other preparation errors include loss of sample and volatile
components and the oxidation of ferrous iron in crushing, milling and homogenization.
The finer a sample is ground the longer it is in contact with air, the more moisture it
gets from air and the larger the part of ferrous iron that is oxidized into ferric iron.
Heating a sample during milling also enhances the oxidation of ferric iron and may
result in loss of water of crystallization. Small samples such as minerals and meteorites
are usually crushed in steel or diamond mortars and ground manually in an agate
mortar (Saheurs et al. 1993).
12
2.1 SampIe preparation
Variations in the analytical results of rock, mineral and special sampIes such as
meteorites, are controlled by variations in the geology, mode of taking and transporting
the sampie, preparation of the sampie and analytical factors. Laboratories see to the
preparation and analysis of sampIes. SampIe preparation is the procedure between
sampling and chemical analysis. Sampling has attracted considerable attention recently,
partly due to the intensification of exploration for gold. The "nugget" (or single
particle) phenomenon is areminder of the importance of correct sampie selection and
preparation. The result of a chemical analysis and the geological inferences drawn from
it are no better than the sampie from which the data derive. The total error or
analytical variation in results is the sum of all sub-errors. (Richardson 1993).
In preparation, a field rock sampie, the size of which depends on the grain size and
homogeneity of the material, is reduced to a size, shape and weight appropriate for
analysis. The field sampie is usually cut in two with a rock cutter (or "guillotine"),
then crushed in a jaw crusher and/or roll mill and pulverized in a disc mill. At
intervals, the size of the sampie is reduced by splitting it into portions of equal size and
taking only one of these for further treatment. The sampIe should, however, retain its
homogeneity throughout the milling. The sampie thus obtained, with a weight of 30-
200 g and a grain size of 100-200 mesh (0.147-0.074 mm), should represent the parent
sampIe as closely as possible. Contamination due to machinery, the environment or
other sampIes is difficult to eliminate completely and should be kept as low as possible.
In trace element determinations in particular, error due to contamination may dominate
the preparation error. Other preparation errors include loss of sampIe and volatile
components and the oxidation of ferrous iron in crushing, milling and homogenization.
The finer a sampIe is ground the longer it is in contact with air, the more moisture it
gets from air and the larger the part of ferrous iron that is oxidized into ferric iron.
Heating a sampIe during milling also enhances the oxidation of ferric iron and may
result in loss of water of crystallization. Small sampies such as minerals and meteorites
are usually crushed in steel or diamond mortars and ground manually in an agate
mortar (Saheurs et al. 1993).
13
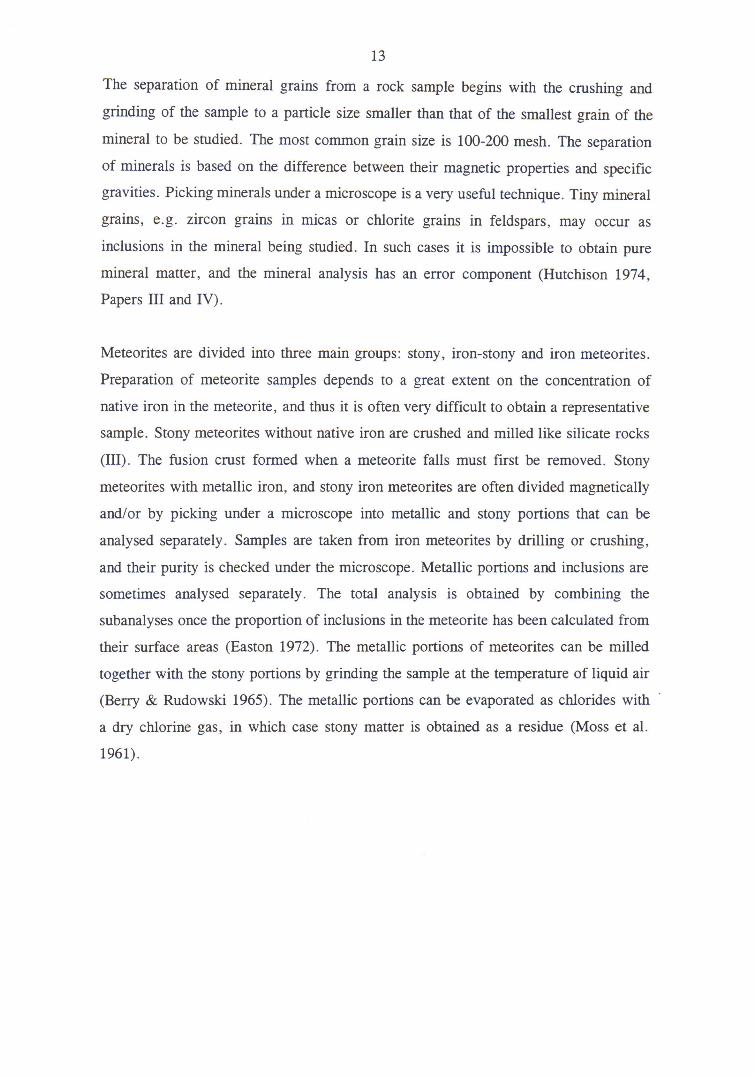
The separation of mineral grains from a rock sample begins with the crushing and
grinding of the sample to a particle size smaller than that of the smallest grain of the
mineral to be studied. The most common grain size is 100-200 mesh. The separation
of minerals is based on the difference between their magnetic properties and specific
gravities. Picking minerals under a microscope is a very useful technique. Tiny mineral
grains, e.g. zircon grains in micas or chlorite grains in feldspars, may occur as
inclusions in the mineral being studied. In such cases it is impossible to obtain pure
mineral maffer, and the mineral analysis has an error component (Hutchison L974,
Papers III and IV).
Meteorites are divided into three main groups: stony, iron-stony and iron meteorites.
Preparation of meteorite samples depends to a great extent on the concentration of
native iron in the meteorite, and thus it is often very difficult to obtain a representative
sample. Stony meteorites without native iron are crushed and milled like silicate rocks
(III). The fusion crust formed when a meteorite falls must first be removed. Stony
meteorites with metallic iron, and stony iron meteorites are often divided magnetically
and/or by picking under a microscope into metallic and stony portions that can be
analysed separately. Samples are taken from iron meteorites by drilling or crushing,
and their purity is checked under the microscope. Metallic portions and inclusions are
sometimes analysed separately. The total analysis is obtained by combining the
subanalyses once the proportion of inclusions in the meteorite has been calculated from
their surface areas (Easton 1972). The metallic portions of meteorites can be milled
together with the stony portions by grinding the sample at the temperature of liquid air
(Berrl' & Rudowski 1965). The metallic portions can be evaporated as chlorides with
a dry chlorine gas, in which case stony matter is obtained as a residue (Moss et al.
1961).
13
The separation of mineral grains from a rock sampIe begins with the crushing and
grinding of the sampie to a particle size smaller than that of the smallest grain of the
mineral to be studied. The most cornmon grain size is 100-200 mesh. The separation
of minerals is based on the difference between their magnetic properties and specific
gravities. Picking minerals under a microscope is a very useful technique. Tiny mineral
grains, e.g. zircon grains in micas or chlorite grains in feldspars, may occur as
inclusions in the mineral being studied . In such cases it is impossible to obtain pure
mineral matter, and the mineral analysis has an error component (Hutchison 1974,
Papers III and IV).
Meteorites are divided into three main groups : stony, iron-stony and iron meteorites.
Preparation of meteorite sampies depends to a great extent on the concentration of
native iron in the meteorite , and thus it is often very difficult to ob ta in a representative
sampie. Stony meteorites without native iron are crushed and milled like silicate rocks
(IH) . The fusion crust formed when a meteorite falls must first be removed. Stony
meteorites with metallic iron, and stony iron meteorites are often divided magnetically
and/or by picking under a microscope into metallic and stony portions that can be
analysed separately . Sampies are taken from iron meteorites by drilling or crushing,
and their purity is checked under the microscope. Metallic portions and inclusions are
sometimes analysed separately . The total analysis is obtained by combining the
subanalyses once the proportion of inclusions in the meteorite has been calculated from
their surface areas (Easton 1972). The metallic portions of meteorites can be milled
together with the stony portions by grinding the sampie at the temperature of liquid air
(Berry & Rudowski 1965). The metallic portions can be evaporated as chlorides with
a dry chlorine gas, in which case stony matter is obtained as a residue (Moss et al.
1961) .

L4
t, Rock analysis
For decades, the chemical analysis of rocks and minerals has been made with classical
wet methods in which the powdered sample is dissolved with the aid of fusion or acids.
In the classical analysis, elements are precipitated from the solute as successive groups
and their concentrations determined, commonly with gravimetric methods. Over the
years there have been many changes and refinements to the classical silicate analysis
(Dittler 1933, Hillebrand & al. 1953, Maxwell 1968, Jeffery & Hutchison 1983). In
the 1950s, rapid methods seeking to determine as many components as possible from
the same solute without separations and precipitations were developed parallel to the
classical analysis. These methods were largely based on optical spectroscopy,
complexometric titration and flame emission (Shapiro & Brannock 1956). Both classical
and rapid methods are still used for certain elements. Modified classical methods are
also used for the accurate total analyses of reference rock and mineral samples required
by analytical instruments. The first international reference rock samples were G-1,
granite and W-1, diabase (Fairbairn 1951). Today there ares over three hundred
international geological reference samples (rocks, minerals, soils, ores etc.)
(Govindaraju 1994). The Geological Survey of Finland (GSF) has participated in the
elaboration of many reference samples, with the author as a member the team of
chemists involved.
Figure 1 presents the modified classical methods employed in the chemical laboratory
of GSF and a scheme for the main component analysis of silicate rocks and minerals.
This scheme, which includes newer methods, has also been applied to other geological
samples, e.g. meteorites (I-V). Main component analysis consists of a main portion and
individual determinations. The procedure of the main portion is briefly as follows.
Powdered sample is dried at 110'C, and weighed to obtain the moisture (HzO-)
content. The sample is then fused with sodium carbonate in a platinum crucible at
1100"C. The fusion cake is dissolved in dilute hydrochloric acid, and silicon is
determined gravimetrically by separating it from the solute as silica hydrogel, which is
then ignited into silica for weighing. Mixed oxides, ammonia group or "R Or" are
precipitated from the filtrate with ammonia. The ignited and weighed oxide precipitate
(Al2O3, FeOr, TiO2, PrOr, etc.) is dissolved with pyrosulphate flux and the solution is
14
2.2 Rock analysis
For decades, the chemical analysis of rocks and minerals has been made with classical
wet methods in which the powdered sampie is dissolved with the aid of fusion or acids.
In the classical analysis, elements are precipitated from the solute as successive groups
and their concentrations determined, commonly with gravimetric methods. Over the
years there have been many changes and refinements to the classical silicate analysis
(Dittier 1933, Hillebrand & al. 1953, Maxwell 1968, Jeffery & Hutchison 1983) . In
the 1950s, rapid methods seeking to determine as many components as possible from
the same solute without separations and precipitations were developed parallel to the
classical analysis. These methods were largely based on optical spectroscopy ,
complexometric titration and flame emission (Shapiro & Brannock 1956). Both classical
and rapid methods are still used for certain elements. Modified classical methods are
also used for the accurate total analyses of reference rock and mineral sampies required
by analytical instruments. The first international reference rock sampies were G-1 ,
granite and W -1, diabase (Fairbairn 1951) . Today there ares over three hundred
international geological reference sampies (rocks, minerals , soils, ores etc .)
(Govindaraju 1994). The Geological Survey of Finland (GSF) has participated in the
elaboration of many reference sampies, with the author as a member the team of
chemists involved.
Figure 1 presents the modified classical methods employed in the chemical laboratory
of GSF and a scheme for the main component analysis of silicate rocks and minerals .
This scheme, which includes newer methods, has also been applied to other geological
sampies, e.g . meteorites (I-V). Main component analysis consists of a main portion and
individual determinations. The procedure of the main portion is briefly as follows .
Powdered sampie is dried at 110°C, and weighed to obtain the moisture (H20 ')
content. The sampie is then fused with sodium carbonate in a platinum crucible at
1100°C. The fusion cake is dissolved in dilute hydrochloric acid , and silicon is
determined gravimetrically by separating it from the solute as silica hydrogel , which is
then ignited into silica for weighing. Mixed oxides, ammonia group or "R20 3 " are
precipitated from the filtrate with ammonia. The ignited and weighed oxide precipitate
(AI2ü 3 , Fe2ü 3• Ti02 • P2Ü S' etc.) is dissolved with pyrosulphate flux and the solution is
15
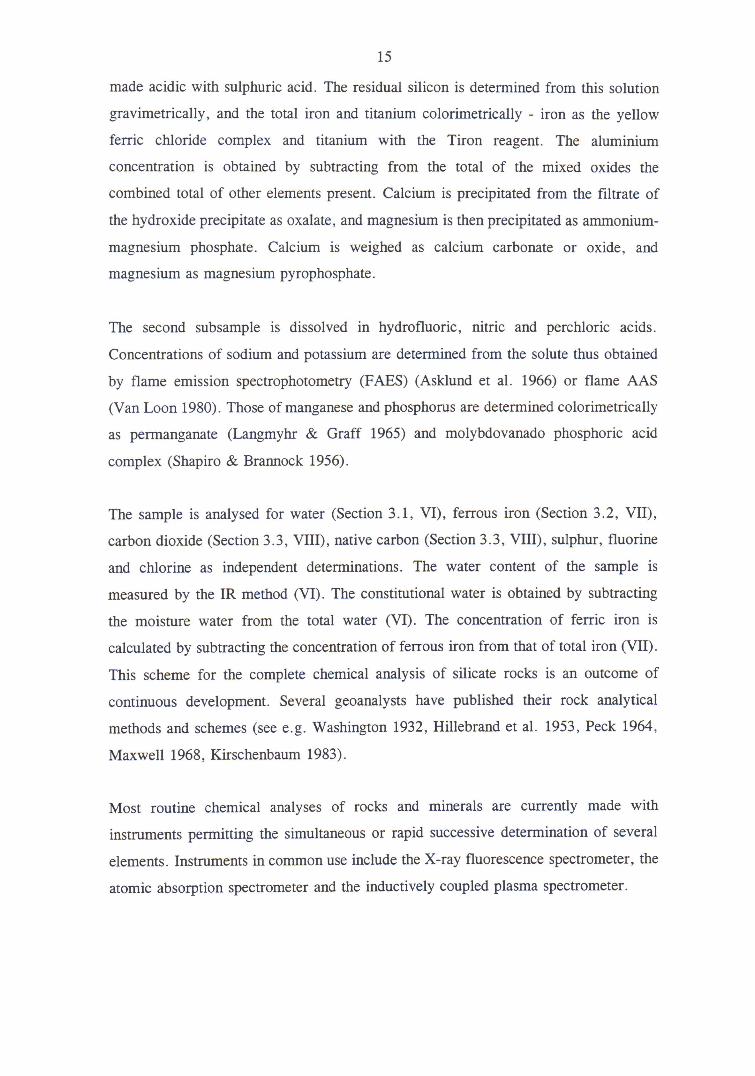
made acidic with sulphuric acid. The residual silicon is determined from this solution
gravimetrically, and the total iron and titanium colorimetrically - iron as the yellow
ferric chloride complex and titanium with the Tiron reagent. The aluminium
concentration is obtained by subtracting from the total of the mixed oxides the
combined total of other elements present. Calcium is precipitated from the filtrate of
the hydroxide precipitate as oxalate, and magnesium is then precipitated as ammonium-
magnesium phosphate. Calcium is weighed as calcium carbonate or oxide, and
magnesium as magnesium pyrophosphate.
The second subsample is dissolved in hydrofluoric, nitric and perchloric acids.
Concentrations of sodium and potassium are determined from the solute thus obtained
by flame emission spectrophotometry GAES) (Asklund et al. 1966) or flame AAS
(Van Loon i980). Those of manganese and phosphorus are determined colorimetrically
as pennanganate (Langmyhr & Graff 1965) and molybdovanado phosphoric acid
complex (Shapiro & Brannock 1956).
The sample is analysed for water (Section 3.1, VD, ferrous iron (Section 3.2, VII),
carbon dioxide (Section 3.3, VIII), native carbon (Section 3.3, VIII), sulphur, fluorine
and chlorine as independent determinations. The water content of the sample is
measured by the IR method (VD. The constitutional water is obtained by subtracting
the moisture water from the total water (VD. The concentration of ferric iron is
calculated by subtracting the concentration of ferrous iron from that of total iron (VII).
This scheme for the complete chemical analysis of silicate rocks is an outcome of
continuous development. Several geoanalysts have published their rock analytical
methods and schemes (see e.g. Washington 1932,Hillebrand et al. 1953, Peck 1964,
Maxwell 1968, Kirschenbaum 1983).
Most routine chemical analyses of rocks and minerals are culrently made with
instruments permitting the simultaneous or rapid successive determination of several
elements. Instruments in common use include the X-ray fluorescence spectrometer, the
atomic absorption spectrometer and the inductively coupled plasma spectrometer.
15
made acidic with sulphuric acid. The residual silicon is determined from this solution
gravimetrically, and the total iron and titanium colorimetrically - iron as the yellow
ferric chloride complex and titanium with the Tiron reagent. The aluminium
concentration is obtained by subtracting from the total of the mixed oxides the
combined total of other elements present. Calcium is precipitated from the filtrate of
the hydroxide precipitate as oxalate, and magnesium is then precipitated as amrnonium
magnesium phosphate. Calcium is weighed as calcium carbonate or oxide , and
magnesium as magnesium pyrophosphate.
The second subsampie is dissolved in hydrofluoric, nitric and perchloric acids .
Concentrations of sodium and potassium are determined from the solute thus obtained
by flame emission spectrophotometry (FAES) (Asklund et al. 1966) or flame AAS
(V an Loon 1980) . Those of manganese and phosphorus are determined colorimetrically
as permanganate (Langmyhr & Graff 1965) and molybdovanado phosphoric acid
complex (Shapiro & Brannock 1956).
The sampie is analysed for water (Section 3.1 , VI), ferrous iron (Section 3.2, VII) ,
carbon dioxide (Section 3.3, VIII) , native carbon (Seetion 3.3, VIII) , sulphur, fluorine
and chlorine as independent determinations. The water conte nt of the sampie is
measured by the IR method (VI) . The constitutional water is obtained by subtracting
the moisture water from the total water (VI). The concentration of ferric iron is
calculated by subtracting the concentration of ferrous iron from that of total iron (VII) .
This scheme for the complete chemical analysis of silicate rocks is an outcome of
continuous development. Several geoanalysts have published their rock analytical
methods and schemes (see e.g. Washington 1932, Hillebrand et al. 1953, Peck 1964,
Maxwell 1968, Kirschenbaum 1983) .
Most routine chemical analyses of rocks and minerals are currently made with
instruments permitting the simultaneous or rapid successive determination of several
elements. Instruments in cornmon use include the X -ray fluorescence spectrometer, the
atomic absorption spectrometer and the inductively coupled plasma spectrometer.

t6
Figure 1. The scheme for the main componenE analysis of sj-licate rocksanä minerals used at the Geological Survey of Fin1and. Conventional "mainportion" analysis and components requiring indj.vidual determination.NI4AIN PORTION" A}iIALYSIS :
Silicale rock or mineral
Heat at (10soc)
H"O-t-
Fuse t^titsh Na2CO3
DissolTe wigh concentrated HCL
Tvaporat'eDissolle in 1O? Hc1
Filter
fesidue
fouble dehydration
sioz
Tiltrate
lrecinitate with NH4oH
Filter
frecipitateI
R,O" ignitedt' 'Fuse with Potassium
I
Dissolve in diluteDehydrate,Edd H2o
I
FiLeer
fesidueResidual SiO2
PrecipiUat,efiltratelith
(NHo) rC2or
Pyrosulphate
H2SO1 (1+1),
K2S20?
Gravi-metri-ca1ly
Precipitatet-CaCrOrt--CaO
Preci.pitate
filtratePrecipi.tate with
fMo) tir"on
FiJ-E1ate
DiscardfirErateTtor (colorimet,rically)
Fe2o3,o, (colorimetrically)
AlrO, calculation:
3 RaO3-(ä recovered SiO2 + I Fe2O3 - + ? TiO2 + e" P2Q5 + others) = t AlzOr
COMPONE}{|S REQUIRING IITDIVIDUAT DETERMINATION :
Silicate rock or mineralDissolveHF-HNO3-Irel04
l'[s (mrol poo
Mgo
clNa2O FeOKzo
PzosIUnO
Hzo*c,sPyro-lyti-cally
Colori-metri-cally
FAAS Titri-or met,ri-FAES ca1ly
Ion- Colori-selective metri-electrode cally
16
Figure 1. The scheme for the main component analysis of silicate rocks and minerals used at the Geological Survey of Finland. Conventional "main portion" analysis and components requiring individual determination.
"MAIN PORTION" ANALYSIS:
~esidue
silicaTe rock or
Heat at (105°C) 1
H,O· 1-
Fuse wi th Na2C03 1
mineral
Dissolve with concentrated HCI 1
~vaporate
Dissolre in 10% HCI
Filter
liltrate
1 ~ouble dehydration
Si02 Precipitate with NHPH 1
lrecipitate
R203 igni ted 1
Filter
Precipitate
liltrate
wi th (NH4 ) 2CP4 1
Fuse with Potassium Pyrosulphate K2S20 7 1
Dissolve in dilute H2S04 (1+1) I
Dehydrate , add H,O 1 -
lrecipitate
CaC20 , 1 -
liltrate
Precipitate with (NH4 ) ,HP04 1 -
Filter
~esidue
Residual Si02
Al203 calculation:
CaO
liltrate precipttate
Ti02 (colorimetrically) 1
Fe203 '0' (colorimetrically)
~g (NH4 ) P04
MgO
% R~.o3 - (% recovered S i02 + % Fe203 "" + % Ti02 + % P20 S + others)
COMPONENTS REQUIRING INDIVIDUAL DETERMINATION:
Silicate rock or mineral Dissolve
I I I I HF-HN03-HCI04
I I I I P20 S Na20 FeO CO2 H2O+ F MnO K20 C, S
Colori - FAAS Titri- Gravi- Pyro- Ion-metri- or metri- metri- lyti- selective cally FAES cally cally cally electrode
Filtfate
Discard
I I Cl
Colori -metri-cally

17
Samples can be analysed for several major, minor and trace elements by XRF.
Powdered sample is converted into a glass disk by fusion or is compressed with a
binder into a briquette. Geological samples can be analysed by XRF for Si, Ti, Al,
Fe,o,, Mn, Mg, Ca, Na, K, P, S, F, Cl and many other elements (Table 2) (Potts 1993,
Longerich 1995).
For flame AAS and ICP-AES analyses, the sample is brought into solution. The
resulting solution is usually made with lithium metaborate fusion or acids. Samples are
analysed successively for Si, Al, Mn, Mg, Ca, Na and K by AAS from the same
sample solution (Table 2) (Angino & Billings 1972, Slavin 1982).
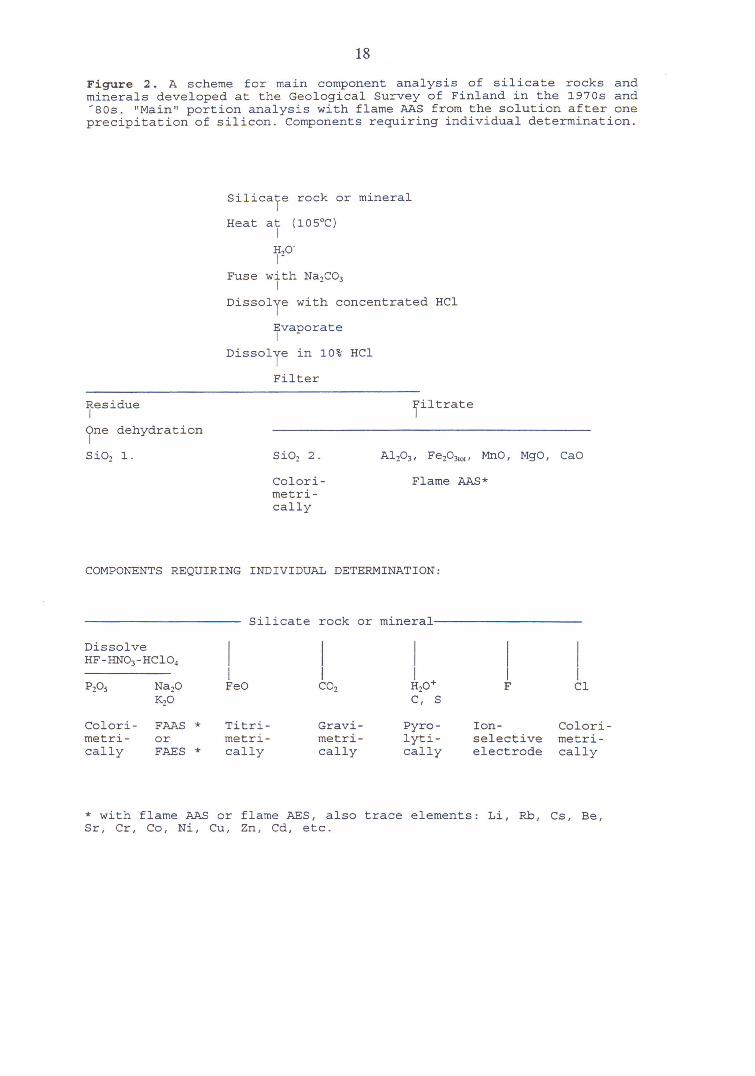
In the 1970s and '80s the present author and his colleagues in GSF developed an
analytical scheme for rock and mineral samples based on flame AAS (Fig. 2). In this
scheme the bulk of silicon is removed from the solution with a single precipitation, and
the filtrate (0.5 g1250 ml made acidic with HCI) is analysed colorimetrically for
residual silicon and by flame AAS for aluminium and manganese. Total iron, calcium
and magnesium often require dilution. In the same years the flame AAS or flame AES
methods for several elements, e.g. Li, Rb, Cs, Be, Sr, Cr, Co, Ni, Cu, Znand Cd, in
a filtrate and in HF-HNO3-HCIO4 solution were developed by the present author and
his colleagues. The standard solutions are made taking into account the interference
caused by the matrix and ionization (Saikkonen 1967, 1968, t969, L970a, 1970b and
Papers II, III, IV and V).
In ICP-AES analyses lithium metaborate is commonly used as flux. The fusion cake is
dissolved in dilute nitric or hydrochloric acid. Perhaps the most widely used method of
dissolution is the acid digestion using mixtures of HF-HCIO* and/or HNO3, HCl,
H2SO4 acids in an open vessel from which silicon evaporates as SiFo. Decomposition
is more effective when done in a closed vessel at pressure. Silicon then remains in
solution and so can be determined. The solute is directed into a hot plasma and, with
the aid of standard solutions, the concentrations of up to 40 elements are determined
simultaneously from the emitting radiation with a spectrometer. For total analyses,
samples can be analysed for Si, Ti, Al, Fe,o,, Mn, Mg, Ca, Na, K and P by ICP-AES
(Table 2) (Thompson & Walsh 1989, Jarvis & Jarvis 1992).
17
Sarnples can be analysed for several major, minor and trace elements by XRF.
Powdered sampie is converted into a glass disk by fusion or is compressed with a
binder into a briquette. Geological sampies can be analysed by XRF for Si , Ti , Al ,
Fe10l' Mn, Mg, Ca, Na, K, P, S, F , Cl and many other elements (Table 2) (Potts 1993 ,
Longerich 1995).
For flame AAS and ICP-AES analyses, the sampIe is brought into solution. The
resulting solution is usually made with lithium metaborate fusion or acids . Sampies are
analysed successively for Si , Al , Mn, Mg, Ca, Na and K by AAS from the same
sampie solution (Table 2) (Angino & Billings 1972, Slavin 1982).
In the 1970s and ' 80s the present author and his colleagues in GSF developed an
analytical scheme for rock and mineral sampies based on flame AAS (Fig. 2). In this
scheme the bulk of silicon is removed from the solution with a single precipitation, and
the filtrate (0.5 g/250 ml made acidic with HCI) is analysed colorimetrically for
residual silicon and by flame AAS for aluminium and manganese . Total iron, calcium
and magnesium often require dilution. In the same years the flame AAS or flame AES
methods for several elements , e .g. Li , Rb, Cs, Be, Sr, Cr, Co, Ni, Cu, Zn and Cd, in
a filtrate and in HF-HN03-HCI04 solution were developed by the present author and
his colleagues. The standard solutions are made taking into account the interference
caused by the matrix and ionization (Saikkonen 1967, 1968, 1969, 1970a, 1970b and
Papers II, III , IV and V) .
In ICP-AES analyses lithium metaborate is commonly used as flux . The fusion cake is
dissolved in dilute nitric or hydrochloric acid. Perhaps the most widely used method of
dissolution is the acid digestion using mixtures of HF-HCI04 and/or HN03 , HCI ,
H2S04 acids in an open vessel from which silicon evaporates as SiF4 . Decomposition
is more effective when done in a closed vessel at pressure. Silicon then remains in
solution and so can be determined. The solute is directed into a hot plasma and, with
the aid of standard solutions, the concentrations of up to 40 elements are determined
simultaneously from the emitting radiation with a spectrometer. For total analyses ,
sampies can be analysed for Si, Ti , Al , Fe101 ' Mn, Mg, Ca, Na, K and P by ICP-AES
(Table 2) (Thompson & Walsh 1989, Jarvis & Jarvis 1992).
18
Figure 2. A scheme for main component analysis of silicate rocks andminerals developed at the Geological Survey of Finland in the 1970s and-80s. ,'Main'r portion analysis with flame AAS from the solution after oneprecipitatj-on of silicon. ComponenEs requiring individual determination.
Silicale rock or mineral
Heat at (1-05"C)
HrO-t-
Fuse with Na2CO3
Dissolle wj-th concentrated HCI
fvaporateDissolle in L0? Hel
Filter
fesidue
ine dehVdration
sio2 1.
filtrate
sio2 2.
Colori-metri-ca1ly
COMPONENTS REQUTRING INDIVIDUAL DETERMINATION :
Silicate rock or mineraf
DissolveHF-HNO3-HCl04
A12O3, Fe2O36, l4nO, MgO, CaO
Flame AAS*
Pzos
Colori-metri-cally
Na20Kzo
FAASorFAES
Titri-metrr-cally
Gravi-metri-calIy
Hzo*crs
{rro-Iyti-cally
c1
Ion- Coloriselective meUri-electsrode cally
* with fl-ame AAS orSr, Cr, Co, Ni, Cu,
flame AES, alsoZt, Cd, etc.
18
Figure 2. A scheme for main component analysis of silicate rocks and minerals developed at the Geological Survey of Finland in the 1970s and '80s . "Main" portion analysis with flame AAS from the solution after one precipitation of silicon. Components requiring individual determination.
~esidue
?ne dehydration
Si02 1.
SilicaTe rock or
Heat at (105°C ) I
HO· 1
2
Fuse wi th Na2C03 I
mineral
Dissolie with concentrated HCl
fvaporate
DissOlie in 10% HCl
Filter
Colorimetrically
liltrate
Flame AAS*
COMPONENTS REQUIRING INDIVIDUAL DETERMINATION:
Silicate rock or mineral
Dissolve I I I I HF-HN03-HC104
I I I I PPs Nap FeO CO2 HP+ F
K20 C, S
Colori- FAAS * Titri- Gravi- Pyro- Ion-metri- or metri- metri- lyti- selective cally FAES * cally cally cally electrode
I I Cl
Colori-metri-cally
* with flame AAS or flame AES, also trace elements: Li, Rb, Cs, Be, Sr , Cr, Co, Ni, Cu, Zn, Cd, etc.

Table 2.referencemodif i-edStandard
t9
Element oxide concentrations (?) of t.he international rocksample !{-2 (diabase) ,' accordj.ng Eo tshe literature, with
classj-cal and some other methods, XRF, flame AAS and ICP-AES.deviations calculated from six successive determinat,ions.
CLASSb rcP-AESc
sio2
A1,;,Fe2O3,o.
Fe2O3
FeO
MnO
Mgo
r\q2v
Kzo
Pzos
Hzo*
Hzo-
\.v2
F
c1
52 .441 n4
L.528.31
10. 87
2 .1-4
0.620. r_3
0.55n ??
0.0679 ppm
205 ppm
190 ppm
52.60+0.101.04+0.01
15 .5]-t0. 13
10.75+0.031 .41+0 . 04
8.39t0.020.15+0.005 .63+0. 06
LO.74t0.022 .11+0 . 01
0.63+0.010.l-1+0.000 . 58r0. 02
0.15+0.00
52.95!O.t71 . 0610. 01
l-5.3910.1-9
10.85+0.09
0.15t0.006.28t0.07
11 .3310.022 .1110.030 .5510. 0l-
0 .1410. 0l-
52.47+O.45l-. 0610. 0l-
14 . 83+0. L4
10.60+0. 01
0.16+0.006.24+0.05
10. 98r0. 02
2 .18+0. 0l-
0 .6010. 0L
az -zz+u . zL
r-OStO.Or1-5 .4010 . 13
l-0.98i0.32
0.15+0. 00
5.0310.041-0.8010.01z.z1+u.u5^...^^^v. of +u. uz
0 -24+0 . 02
a. Potts et al. Lg92 b. GSF, analysed by the presenE auEhor (Paper
rI), c. faboratory usGsR/xRF (Flanagan 1984), d. laboratory BIo/AAS(Flanag:an 1984) , e. laboratory UIIID/ICP-AES (Flanagan ]-984) .
The compositions of and some information on rock and mineral samples analysed in the
chemical laboratory are stored in the database of GSF. The rock and mineral analysis
data base, KALTIE, contains 3274 chemical analyses of Finnish rocks and minerals,
which were obtained in L905-1992 with classical and instrumental methods. The
general information (number of sample and analysis, location, rock types, geologist,
analyst, publication) and the analysis information (main and trace constituents, method
of chemical analysis) on the rocks and minerals are stored in this relational database
(Gustafsson & Saikkonen 1994).
19
Table 2. Element oxide concentrations (%) of the international rock
reference sampIe W-2 (diabase); according to the literature, with
modified classical and some other methods, XRF, flame AAS and ICP-AES .
Standard deviations calculated from six successive determinations.
LIT . a CLASS b XRP< AASd ICP-AESe
SiOz 52.44 52.60±0.10 52 . 95±0.17 52.47±0.45 52.22±0 . 21
TiOz 1. 06 1. 04±0. 01 1.06±0.01 1 . 06±0 . 01 1.05±0.01
Alz03 15.35 15 . 51±0 . 13 15.39±0.19 14.83±0.14 15.40±0.13
FeZ03tot 10 . 74 10.75±0.03 10 . 85±0.09 10 . 60±0 . 01 10.98±0 . 32
FeZ03 1. 52 1. 41±0. 04
FeO 8.31 8.39±0 . 02
MnO 0.16 0.16±0.00 0.16±0.00 0.16±0.00 0.15±0 . 00
MgO 6 . 37 6.63±0.06 6 . 28±0.07 6.24±0.05 6 . 03±0 . 04
CaO 10.87 10.74±0.02 1l.33±0.02 10.98±0.02 10.80±0.01
NazO 2.14 2.11±0.01 2.11±0.03 2.18±0.01 2 . 24±0 . 05
KzO 0.62 0.63±0.01 0.65±0 . 01 0.60±0.01 0.61±0.02
P20S 0.13 0.11±0.00 0.14±0.01 0.24±0.02
H2O+ 0.55 0.58±0.02
H2O· 0 . 23 0 . 15±0.00
CO2 0.06
S 79 ppm
F 205 ppm
Cl 190 ppm
a. Potts et al. 1992 b . GSF, analysed by the present author (Paper
II), c . laboratory USGSR/XRF (Flanagan 1984), d. laboratory BIO/AAS
(Flanagan 1984), e. laboratory UIND/ICP-AES (Flanagan 1984).
The compositions of and some infonnation on rock and mineral sampies analysed in the
chemical laboratory are stored in the database of GSF. The rock and mineral analysis
data base, KALTIE, contains 3274 chemical analyses of Finnish rocks and minerals,
which were obtained in 1905-1992 with classical and instrumental methods. The
general infonnation (number of sampie and analysis, location, rock types, geologist,
analyst, publication) and the analysis information (main and trace constituents, method
of chemical analysis) on the rocks and minerals are stored in this relational database
(Gustafsson & Saikkonen 1994).

20
The main-portion analysis and the analysis of the components requiring individual
determination (Fig. 1) were tested and investigated in publication II. Agreement
between the results of this study and the "best estimates" given by F.J. Flanagan was
good (Flanagan 1984). The coefficient of variation of the data for ten constituents was
O.l-l% and for two constituents over l%. (Table 2).The precision of the classical
silicate analysis has also been assessed by Flanagan and Kirschenbaum (1984), who
analysed reference rock samples for 15 elements or components using classical
chemical methods. According to them, the variation of the determinations (CV : 0.2-
L%) wtll be the same for sample portions analysed as a group or analysed over some
time interval.
The precision of a technique depends upon many factors e.g. sample preparation,
matrix and interference effects and their correction, and instrumental drift during an
operation. The precision for an element is generally related to the concentration.
Comparison of the precision of different techniques is therefore difficult. The
precisions of XRF, flame AAS and ICP-AES presented here were taken from the
literature and so are comparable only to some degree.
The precisions of XRF rock analyses are about the same as those of the classical
silicate analysis (CV : 0.2-I%) for Si, Ti, Al, Fe,o,, Mn, Mg, Ca, Na and K, when
samples are made into glass disks after fusion with a specified lithium
tetraborate/metaborate flux (Ramsey et al. 1995). It is well known that the lightest
elements (particularly Na, Mg, Al, and Si) do not usually yield highly accurate and
precise results when from pressed pellets because of mineralogical effects. The
precisions for the heavy major elements, K, Ca, Ti, Mn, and Fe, are very similar to
those obtained with a more accurate and precise sample preparation by fusion
(Longerich 1995). According to the data obtained at the chemical laboratory of the
GSF, the coefficients of variation of XRF determinations are < I% for Si, Ti, Al, Fe,
Mg, Ca and Na, and 1-3 % for Mn, K and P (method code 175X: multi-element, over
40 elements, determination from powder pellets of sample) (Maija Hagel-Brunnström
1995, unpublished results).
For the AAS determinations, the coefficients of variation are about O.I-3% for major
elements analysed after fusion decomposition or an acid attack (Potts L987, Table 2).
20
The main-portion analysis and the analysis of the components requiring individual
determination (Fig. 1) were tested and investigated in publication 11 . Agreement
between the results of this study and the "best estimates" given by F.J. Flanagan was
good (Flanagan 1984) . The coefficient of variation of the data for ten constituents was
0.1-1 % and for two constituents over 1 %. (Table 2) .The precision of the classical
silicate analysis has also been assessed by Flanagan and Kirschenbaum (1984) , who
analysed reference rock sampies for 15 elements or components using classical
chemical methods . According to them, the variation of the determinations (CV = 0.2-
1 %) will be the same for sampie portions analysed as a group or analysed over some
time interval.
The precision of a technique depends upon many factors e.g. sampie preparation,
matrix and interference effects and their correction, and instrumental drift during an
operation. The precision for an element is generally related to the concentration.
Comparison of the precision of different techniques is therefore difficult. The
precisions of XRF, flame AAS and ICP-AES presented here were taken from the
literature and so are comparable only to some degree.
The precisions of XRF rock analyses are about the same as those of the classical
silicate analysis (CV = 0.2-1 %) for Si, Ti, Al, Felot , Mn, Mg , Ca, Na and K, when
sampies are made into glass disks after fusion with a specified lithium
tetraborate/metaborate flux (Ramsey et al. 1995). It is weH known that the lightest
elements (particularIy Na, Mg, Al , and Si) do not usually yield highly accurate and
precise results when from pressed pellets because of mineralogical effects. The
precisions for the heavy major elements, K, Ca, Ti, Mn, and Fe, are very similar to
those obtained with a more accurate and precise sampie preparation by fusion
(Longerich 1995). According to the data obtained at the chemical laboratory of the
GSF, the coefficients of variation of XRF determinations are < 1 % for Si, Ti, Al, Fe,
Mg, Ca and Na, and 1-3% for Mn, K and P (method code 175X: multi-element, over
40 elements, determination from powder pellets of sampie) (Maija Hagel-Brunnström
1995, unpublished results).
For the AAS determinations, the coefficients of variation are about 0.1-3% for major
elements analysed after fusion decomposition or an acid attack (Potts 1987, Table 2).

2l
In paper II the GSF's coefficients of variation are 0.7% for A1,0.2% for Mg,0.6%
for Ca, 0.3% for Na and 0.3% for K. The precision for the major elements is about
0.3-2% for ICP-AES with fusion and an acid attack (Jarvis & Jarvis 1992, Ramsey et
al. 1995). The GSF's coefficients of variation for ICP-AES with HF-HNO3-HCI-
HCIO4 attack (method code 311P) are < l% for Ti, Al, Fe, Mn, Mg and Ca, and >
t% for Na, K and P (Riitta Juvonen 1995, unpublished results).
As shown in Table 2, not all the components of the total analysis of rocks and minerals
can be analysed by XRF, flame AAS and ICP-AES. The analytical procedure of
individual determinations is dealt with in Section 3.
2.3 Mineral analysis
Mineral analyses are used to classify minerals and distinguish between them, to
calculate their formulae, identify them and compare separate analyses of the same
mineral. Several textbooks are available on the decomposition of minerals (e.g. Sulzek
& Povondra 1989, Bock 1979, Chao & Sandszolone 1992).
The chemical analysis of silicate minerals is similar to that of rocks although the
samples often have to be treated individually. The components analysed depend on the
number of elements the mineral contains, the purpose of the analysis and the amount
of material available. The components are reported in order of importance (Hey 1973,
Samchuk & Pilipenko 1987). A substantial proportion of mineral analyses are currently
made as microanalyses (electron probe microanalysis and ion microprobe analysis), in
which quantitative analysis on the surface of a polished thin section or the well-polished
surface of a sample yields data on the concentrations of major, minor and trace
elements, the accuracy of which depends on the reference and control samples available
(Potts 1993).
The present author has analysed over 100 mineral samples at the GSF, the data on
some of which have not been published before. The chemical analyses of 63 mineral
21
In paper II the GSF's coefficients of variation are 0.1 % for Al , 0.2% for Mg, 0.6 %
for Ca, 0 .3 % for Na and 0.3% for K. The precision for the major elements is about
0.3-2% for ICP-AES with fusion and an acid attack (Jarvis & Jarvis 1992, Ramsey et
al. 1995). The GSF ' s coefficients of variation for ICP-AES with HF-HN03-HCI
HCI04 attack (method code 311P) are < 1 % for Ti, Al, Fe, Mn, Mg and Ca, and >
1 % for Na, K and P (Riitta Juvonen 1995, unpublished results) .
As shown in Table 2, not all the components of the total analysis of rocks and minerals
can be analysed by XRF, flame AAS and ICP-AES. The analytical procedure of
individual determinations is dealt with in Section 3.
2.3 Mineral analysis
Mineral analyses are used to classify minerals and distinguish between them, to
calculate their formulae , identify them and compare separate analyses of the same
mineral. Several textbooks are available on the decomposition of minerals (e .g. Sulzek
& Povondra 1989, Bock 1979, Chao & Sandszolone 1992).
The chemical analysis of silicate minerals is similar to that of rocks although the
sampIes often have to be treated individually. The components analysed depend on the
number of elements the mineral contains, the purpose of the analysis and the amount
of material available. The components are reported in order of importance (Hey 1973 ,
Samchuk & Pilipenko 1987). A substantial proportion of mineral analyses are currently
made as microanalyses (electron probe microanalysis and ion microprobe analysis) , in
which quantitative analysis on the surface of a polished thin section or the well-polished
surface of a sampie yields data on the concentrations of major, minor and trace
elements, the accuracy of which depends on the reference and control sampies available
(Potts 1993).
The present author has analysed over 100 mineral sampIes at the GSF, the data on
some of which have not been published before. The chemical analyses of 63 mineral

2.4
22
samples are listed in tabular form in the Appendix. The determinations were made with
the modified classical methods described above, flame AAS and methods for individual
determination (I-VIII). Analyses of bityite and kunzite minerals are dealt with in Papers
III and IV.
Analysis of special samples
Meteorites are rather difficult to analyse chemically. Preparing a representative sample
tends to be a demanding task as meteorites are frequently very heterogeneous.
Powdered meteorites can be analysed for many major, minor and trace element
components with the classical and instrumental methods used for rock and mineral
samples (Jarosewich 1966, Saikkonen 1967, Fuchs et al. 1973, Hughes & Hannaker
1978, Adler 1986, Paper III). One of the developers of the analytical procedure for
chondrites (a group of stony meteorites) was the Finn, Birger Wiik (Wiik L956, L972).
Table 3 gives the chemical analysis of the Malampaka stony meteorite, an olivine-
bronzite chondrite in type, made by the present author (Graham et al. 1985). This
analysis has not been published before. The determination methods were very similar
to those used to analyse the Kivesvaara meteorite (Paper V).
The metallic iron of meteorites is analyed by dissolving the metal phase with
mercury(Il) chloride or copperfl) potassium chloride (Habashy 1961, Moss et aL. L967 ,
Fuchs et al. 7973). Iron, nickel, cobalt and copper can be determined from the
dissolved metal phase with various wet-chemical methods. In the analysis of the
Malanpaka meteorite, metallic nickel and cobolt were determined by flame AAS, and
metallic iron with colorimetric method.
Some chondrite meteorites contain metal, silicate, sulphide and phosphide phases and
other uncommon phases (Wedepohl 1978). These phases can be separated from each
other with successive dissolutions and analysed for their elements after ion exchange
separation (Shima 1974, Hughes & Hannaker 1978). Stony iron meteorites are often
divided magnetically into metal and stone phases before analysis.
22
sampies are listed in tabular fonn in the Appendix. The detenninations were made with
the modified classical methods described above, flame AAS and methods for individual
detennination (I-VIII). Analyses of bityite and kunzite minerals are dealt with in Papers
III and IV.
2.4 Analysis of special sam pies
Meteorites are rather difficult to analyse chemically. Preparing a representative sampie
tends to be ademanding task as meteorites are frequently very heterogeneous.
Powdered meteorites can be analysed for many major, minor and trace element
components with the classical and instrumental methods used for rock and mineral
sampies (Jarosewich 1966, Saikkonen 1967, Fuchs et al. 1973, Hughes & Hannaker
1978, Adler 1986, Paper III). One of the developers of the analytical procedure for
chondrites (a group of stony meteorites) was the Finn, Birger Wiik (Wiik 1956, 1972).
Table 3 gives the chemical analysis of the Malampaka stony meteorite, an olivine
bronzite chondrite in type , made by the present author (Graharn et al. 1985) . This
analysis has not been published before. The detennination methods were very similar
to those used to analyse the Kivesvaara meteorite (Paper V).
The metallic iron of meteorites is analyed by dissolving the metal phase with
mercury(II) chloride or copper(l) potassium chloride (Habashy 1961, Moss et al. 1967,
Fuchs et al. 1973). Iron, nickel, cobalt and copper can be detennined from the
dissolved metal phase with various wet-chemical methods . In the analysis of the
Malanpaka meteorite , metallic nickel and cobolt were detennined by flame AAS, and
metallic iron with colorimetric method.
Some chondrite meteorites contain metal, silicate, sulphide and phosphide phases and
other uncommon phases (Wedepohl 1978). These phases can be separated from each
other with successive dissolutions and analysed for their elements after ion exchange
separation (Shirna 1974, Hughes & Hannaker 1978) . Stony iron meteorites are often
divided magnetically into metal and stone phases before analysis.

23
Table 3. Analysis of the Malampaka stony meteorit,e (olivine-bronzitechondrite). Arralysed by the present autshor. Arralytical methods: modifiedclassical methods (gravimetric, titrimetsric, colorimetric), atomicabsorption spectrometry and other methods (see paper V and Graham et al.198s) .
Species wE ?' EIemenLs wt*
sio2Mgo
FeO
Af 2v3
CaO
Na20
Cr2O3
l,Ino
Hzo*
Pzos
vd
TiO2
Kzo
Total stsone
material
Fe
NiCo
Metallj-c grainsFeS
Sulphide StrainsTotal
35.4z5.o
LL.42.291. 55
1.00o -47
0.300.200.180.L2o.L20. r-0
76.7
F€-siMg
s
NiA1
Ca
Na
Cr
Mn
cK
Co
P
TiCu
H.
Part totalor
Totsa1
35 .3
L6.6L4.2r..89r_.88
L.20I.Il-
0.740.320.23o.L20-080 .080 .080. 07
0.010 .02
44.915.1
100 ?
16 .1t.760. 08
17.95.195. 19
>>.ö
*
f
calculated from H2O'
calculated 100 - part, total
In the analysis of iron
separately (Moss et al.
meteorites
1961).
the metal phase and its inclusions can be treated
23
Table 3. Analysis of the Malampaka stony meteorite (olivine-bronzite
ehondrite) . Analysed b y the present author . Analytieal methods : modified
elassieal methods (gravimetrie, titrimetrie, eolorimetrie), atomie
absorption speetrometry and other methods (see paper V and Graham et al.
1985) .
Species wt % Elements wt %
Si02 35.4 Fe tOl 36.3
MgO 23 . 6 Si 16.6
FeO 11. 4 Mg 14 . 2
A1203 2 . 29 S 1. 89
CaO 1. 55 Ni 1. 88
Na20 1. 00 Al 1. 20
Cr203 0 . 47 Ca 1.11
MnO 0 . 30 Na 0 . 74
HP+ 0 . 20 Cr 0.32
pps 0.18 Mn 0.23
Ctot 0.12 C 0 . 12
Ti02 0.12 K 0 . 08
Kp ~ Co 0.08
P 0 . 08
Total stone 7 6 . 7 Ti 0.07
material Cu 0.01
H· 0 . 02
Fe 16 . 1
Ni 1. 76 Part total 84 . 9
Co ~ 0# 15 . 1
Metallic grains 17.9 Total 100 %
FeS 2.:..ll Sulphide grains 5.19 * ealeulated from HP+
Total 99 . 8 # caleulated 100 - part total
In the analysis of iron meteorites the metal phase and its inclusions can be treated
separately (Moss et al. 1961).

24
Before 1969, meteorites were the only extraterrestrial material available for scientific
study. After the successful Apollo flights, samples from the Moon became available to
research teams. Among them was that of Birger Wiik, of which the present author was
a member (Wiik L975, 1986). The flrst flight, Apollo 11, was in 1969, and Finland
was the first country outside the USA to obtain lunar samples for chemical analysis
(Wiik & Ojanperä 1970).
3 ELEMENTS AND COMPONENTS REQTIIRING INDIVIDUAL
DETERMINATION
3.1 Determination of water
According to the constiütional classification, the water in rocks and minerals is bound
chemically and physically. The chemically bound water is constitutional water, or
water of crystallizltion. The water of crystallization occurs in minerals as bound water
or zeolite water. The physically bound water is adsorbed on mineral surfaces or
constitutionally absorbed, or it occurs in fluid inclusions within the mineral (Pyper
1985). In conventional rock and mineral analyses, a distinction is made between bound
water, here called water of crystallization, HzO*, and free water or moisture water,
HrO-. The temperature reported in the determination is usually 105-110"C. The water
liberated at this temperature is referred to as moisture water, HrO-; the remainder is
water of crystallization, HtO*. Note that the water of crystallization that may be
liberated at the above temperature is calculated as moisture water. Correspondingly, the
water liberated at high temperatures from fluid inclusions is calculated as water ofcrystallization. Total water is the sum of moisture and crystallization waters (HzO., :H2O- + HrO*).
24
Before 1969, meteorites were the only extraterrestrial material available for scientific
study. After the successful Apollo flights, sampies from the Moon became available to
research teams. Among them was that of Birger Wiik, of which the present author was
a member (Wiik 1975, 1986). The first flight, Apollo 11, was in 1969, and Finland
was the first country outside the USA to obtain lunar sampies for chemical analysis
(Wiik & Ojanperä 1970).
3 ELEMENTS AND COMPONENTS REQUIRING INDIVIDUAL
DETERMINATION
3.1 Determination of water
According to the constitutional c1assifIcation, the water in rocks and minerals is bound
chemically and physically. The chemically bound water is constitutional water, or
water of crystallization. The water of crystallization occurs in minerals as bound water
or zeolite water. The physically bound water is adsorbed on mineral surfaces or
constitutionally absorbed, or it occurs in fluid inc1usions within the mineral (Pyper
1985). In conventional rock and mineral analyses , a distinction is made between bound
water, here called water of crystallization, H20 +, and free water or moisture water,
H20 ". The temperature reported in the determination is usually lO5-110°e. The water
liberated at this temperature is referred to as moisture water, H20 "; the remainder is
water of crystallization, H20 +. Note that the water of crystallization that may be
liberated at the above temperature is calculated as moisture water. Correspondingl y, the
water liberated at high temperatures from fluid inc1usions is calculated as water of
crystallization. Total water is the sum of moisture and crystallization waters (H20 ror =
H20 " + H20 +).

25
Metamorphic and sedimentary rocks usually contain small amounts of elemental
hydrogen that, under oxidizing analytical conditions, are converted into water and
included in the water of crystallization. The hydroxide group (OH), which occurs in
several minerals such as amphiboles and micas, evaporates from the minerals on
heating as water (Baur 1978).
In most of the classical and more recent methods for determining concentrations of
total and crystallization waters, the sample is heated at high temperature with or
without a flux. As a rule, the water is liberated from rocks without a flux if the
temperature is sufficiently high, 1100oC, and the time of heating sufficiently long
(Skinner et al. 1981). Some minerals, e.g. talc, topaz, staurolite, chondrodite, epidote
and cordierite, need a flux and high temperature for water to evaporate (Riley 1958).
Flux must also be used for the analvsis of many micas and rocks rich in micas
(Kuzuhisa 1991).
Concentrations of total and crystallization waters are usually determined with
gravimetric, titrimetric or IRS methods. The gravimetric methods, including the
classical Penfield method still in common use (see publication VI), are based on
weighing the water expelled and collected from the sample on heating (Volborth 1969,
Delong 1981). Analytical methods based on Karl-Fisher titration are also frequently
used (Troll & Farzaneh 1980, Westrich 1987). A number of instruments and methods
based on IR detection of the water expelled from the sample on heating have been
developed (Din & Jones 1978, Skinner et al. 1981).
A new infrared absorption method for rock and mineral samples is described in
publication VI. To determine the total water, an air-dry powdered sample is ignited at
1100"C in a nitrogen aünosphere without a flux or with PrOr-flux. The water liberated
is directed through an IR cell for measurement. The water of crystallization is
determined in the same way but the sample is heated at 110"C before the measurement.
The moisture water is determined at 110"C. The results have been compared with
those of the Penfield method and found compatible. Similar results have been obtained
from international geological reference samples. The new method has several
advantages: operation is simple and unvarying; it is also faster than the old Penfield-
method; the carbon dioxide liberated from samples does not interfere with the
25
Metamorphie and sedimentary rocks usually contain small amounts of elemental
hydrogen that, under oxidizing analytical conditions, are converted into water and
included in the water of crystallization. The hydroxide group (OR), whieh occurs in
several minerals such as amphiboles and micas, evaporates from the minerals on
heating as water (Baur 1978).
In most of the classieal and more recent methods for determining concentrations of
total and erystallization waters, the sampie is heated at high temperature with or
without a flux . As a rule, the water is liberated from rocks without a flux if the
temperature is suffieiently high, 1l00°C, and the time of heating sufficiently long
(Skinner et al. 1981). Some minerals, e.g. tale , topaz, staurolite, chondrodite, epidote
and cordierite, need a flux and high temperature for water to evaporate (Riley 1958).
Flux must also be used for the analysis of many micas and rocks rieh in mieas
(Kutzuhisa 1991) .
Coneentrations of total and crystallization waters are usually determined with
gravimetrie, titrimetrie or IRS methods. The gravimetrie methods, including the
classieal Penfield method still in common use (see publication VI), are based on
weighing the water expelled and collected from the sampie on heating (Volborth 1969,
DeLong 1981). Analytieal methods based on Karl-Fisher titration are also frequently
used (Troll & Farzaneh 1980, Westrich 1987). A number of instruments and methods
based on IR detection of the water expelled from the sampie on heating have been
developed (Din & Jones 1978, Skinner et al. 1981) .
A new infrared absorption method for rock and mineral sampies is described in
publication VI. To determine the total water, an air-dry powdered sampie is ignited at
1100°C in a nitrogen atmosphere without a flux or with P20s-flux. The water liberated
is directed through an IR cell for measurement. The water of crystallization is
determined in the same way but the sampie is heated at 110°C before the measurement.
The moisture water is determined at 110°C. The results have been compared with
those of the Penfield method and found compatible. Similar results have been obtained
from international geological reference sampies. The new method has several
advantages: operation is simple and unvarying; it is also faster than the old Penfield
method; the carbon dioxide liberated from sampies does not interfere with the

26
determination; nor does fluorine cause error in the water results when the sample in the
combustion boat is covered with quartz powder (Paper VI, Saikkonen 1990).
3.2 Determination of ferrous iron
Iron occurs in rocks and minerals in oxidation states of +II and +III and in very small
amounts as native iron. Knowledge of ferrous and ferric iron concentrations is
important for geochemical and petrological studies, for instance, when calculating rock
nonns and investigating magmatic processes. Meteorites usually contain native iron; in
iron meteorites it is the main component (Mueller 1978).
For the determination of ferrous iron, the rock, mineral or special sample is usually
dissolved. With the Mössbauer spectrometer the ratio of ferrous to ferric iron can be
determined on a solid sample direct. However, the method needs refining, particularly
for rock samples (Bancroft et aI. t977). There are far fewer methods for determining
ferric than ferrous iron, and the ferric iron concentration is usually calculated as the
difference between total and ferrous irons. Several methods are available for
determining total iron, and the procedure is generally fatly easy. Detailed descriptions
of the analytical methods for ferrous, ferric and total iron and their history have been
published by Maxwell (1968) and Sulzec & Povondra (1989).
As a technical procedure, the determination of ferrous iron may be straightforward but
it may still pose an awkward analytical problem. Most analytical errors arise during the
preparation and decomposition of samples. Ferrous iron may be oxidized into ferric
iron in the course of grinding. To prevent oxidation, the grinding should be done in an
inert liquid, e.g. acetone, as this prevents air from reaching the sample and also
reduces heat generation. The metallic iron in grinding vessels causes an error by
reducing some of the ferric iron into ferrous iron. Such contamination can be avoided
by grinding the sample in an agate mortar. Tungsten carbide, which is often used in
grinders, also acts as a reductant, making the concentration of ferrous iron higher than
it is in reality. If the sample is ground mechanically, the grinding time should be as
26
determination; nor does fluorine cause eITor in the water results when the sampie in the
combustion boat is covered with quartz powder (Paper VI, Saikkonen 1990) .
3.2 Determination of ferrous iron
Iron occurs in rocks and minerals in oxidation states of + II and + III and in very small
amounts as native iron. Knowledge of ferrous and ferric iron concentrations is
important for geochemical and petrological studies, for instance, when calculating rock
norms and investigating magmatic processes. Meteorites usually contain native iran; in
iran meteorites it is the main component (Mueller 1978).
For the determination of ferrous iron, the rock, mineral or special sampie is usually
dissolved. With the Mössbauer spectrometer the ratio of ferrous to ferric iron can be
determined on asolid sampie direct. However, the method needs refining, particularly
for rock sampies (Bancraft et al. 1977). There are far fewer methods for determining
ferric than ferrous iron, and the ferric iron concentration is usually calculated as the
difference between total and ferrous irons. Several methods are available for
determining total iran, and the procedure is generally fairly easy. Detailed descriptions
of the analytical methods for ferrous, ferric and total iran and their history have been
published by Maxwell (1968) and Sulzec & Povondra (1989).
As a technical pracedure, the determination of ferrous iron may be straightforward but
it may still pose an awkward analytical problem. Most analytical errors arise during the
preparation and decomposition of sampies. Ferrous iron may be oxidized into ferric
iron in the course of grinding. To prevent oxidation, the grinding should be done in an
inert liquid, e .g. acetone, as this prevents air fram reaching the sampie and also
reduces heat generation. The metallic iron in grinding vessels causes an error by
reducing some of the ferric iron into ferrous iron. Such contamination can be avoided
by grinding the sampie in an agate mortar. Tungsten carbide, which is often used in
grinders, also acts as a reductant, making the concentration of ferrous iron higher than
it is in reality. If the sampie is ground mechanically, the grinding time should be as

27
short as possible to minimize oxidation. The grain size of the sample should be about
80 mesh, i.e. less than 0.175 mm, for the sample to dissolve in acids. A good grinding
vessel is one that prevents excessive heating (Rice 1982, Whipple et al. 1984, Paper
ur).
Ferrous iron is easily oxidized when a sample is dissolved in acids. To prevent this,
the sample should be dissolved in an inert atmosphere, e.g. oxygen-free nitrogen or
carbon dioxide gas. The effect of atmospheric oxygen can be minimized by painstaking
and careful work at all stages of decomposition. If a known amount of oxidant is used
in decomposition to oxidize the dissolving ferrous iron into ferric iron, no inert
affnosphere is needed. The oxidizing or reducing components in the sample alter the
true ferrous iron/ferric iron ratio during the decomposition. These oxidizing elements
include manganese (III), chromium (VI) and vanadium (V). Native iron, sulphur (II)
and organic matter are reducing agents (Fritz & Popp 1985, Kane & Skeen t993).
The weak point in acid decomposition is that some iron-bearing minerals dissolve
poorly in acids; not even prolonged leach in the much-used hydrofluoric-sulphuric acid
mixture can guarantee complete decomposition of the sample. Tourmaline, staurolite,
ilmenite, magnetite, chromite and a number of other less common minerals do not
dissolve at all, or only partially, during acid treatment. Prolonged boiling in acid easily
results in the oxidation of ferrous iron, as concentrated sulphuric acid is a very
effective oxidant. It might be advisable to repeat the acid decomposition and to try and
dissolve the residue once again. When the author used a decomposition bomb for rock
samples, a portion of ferrous iron oxidized, probably because the dissolution vessel was
not tight enough. A sample can also be brought into solution with a flux such as
sodium fluoroborate, lithium metaborate or lithium tetraborate. According to Kiss
(1984), the constitutional oxygen in the flux may act as an oxidizer for ferrous iron.
The concentration of ferrous iron in rock and mineral samples is usually determined
from dissolved sample. Exceptions to this rule are Mössbauer spectrometric
measurements, which use powdered sample (Dryar et al. 1987, Fudali 1988). The
concentration of ferrous iron in sample solute can be determined titrimetrically
(Whipple Ig74, Kiss 1977, Graff 1983), spectrometrically (Kiss 1984, Bruce & Bower
19g7, Endo etal. 1992, Flock & Koch 1993) or polarographically (Beyer etal. L975,
27
short as possible to minimize oxidation. The grain size of the sampie should be about
80 mesh, i.e. less than 0.175 mm, for the sampie to dissolve in acids. A good grinding
vessel is one that prevents excessive heating (Rice 1982, Whippie et al. 1984, Paper
VII).
Ferrous iron is easily oxidized when a sampie is dissolved in acids . To prevent this,
the sampie should be dissolved in an inert atmosphere, e .g. oxygen-free nitrogen or
carbon dioxide gas . The effect of atmospheric oxygen can be minimized by painstaking
and careful work at all stages of decomposition. If a known amount of oxidant is used
in decomposition to oxidize the dissolving ferrous iron into ferric iron, no inert
atmosphere is needed. The oxidizing or reducing components in the sampie alter the
true ferrous ironlferric iron ratio during the decomposition. These oxidizing elements
include mangane se (I1I) , chromium (VI) and vanadium (V). Native iron, sulphur (Il)
and organic matter are reducing agents (Fritz & Popp 1985, Kane & Skeen 1993).
The weak point in acid decomposition is that some iron-bearing minerals dissolve
poorly in acids; not even prolonged leach in the much-used hydrofluoric-sulphuric acid
mixture can guarantee complete decomposition of the sampie. Tourmaline, staurolite,
ilmenite, magnetite, chromite and a number of other less common minerals do not
dissolve at all, or only partially, during acid treatment. Prolonged boiling in acid easily
results in the oxidation of ferrous iron, as concentrated sulphuric acid is a very
effective oxidant. It might be advisable to repeat the acid decomposition and to try and
dissolve the residue once again. When the author used a decomposition bomb for rock
sampies, a portion of ferrous iron oxidized, probably because the dissolution vessel was
not tight enough. A sampie can also be brought into solution with a flux such as
sodium fluoroborate, lithium metaborate or lithium tetraborate. According to Kiss
(1984), the constitutional oxygen in the flux may act as an oxidizer for ferrous iron.
The concentration of ferrous iron in rock and mineral sampies is usually determined
from dissolved sampie . Exceptions to this rule are Mössbauer spectrometric
measurements , which use powdered sampie (Dryar et al. 1987, Fudali 1988). The
concentration of ferrous iron in sampie solute can be determined titrimetrically
(Whippie 1974, Kiss 1977, Graff 1983) , spectrometrically (Kiss 1984, Bruce & Bower
1987, Endo et al. 1992, Flock & Koch 1993) or polarographically (Bey er et al. 1975 ,

28
Moore L979). Great care must be taken to ensure that the oxidation state of ferrous
iron remains unchanged while the measuring solution is prepared and also during the
measurement.
Titration of ferrous iron is undertaken as a visual or potentiometric oxidation/reduction
procedure, most commonly using potassium dichromate solution as the titrant. If the
sample is dissolved in the presence of an excess oxidant, the residual oxidant can be
titrated with a ferrous iron solution of known strength. This solution is often titrated
with a potassium dichromate solution. The concentration of ferrous iron in the sample
can then be calculated from the data thus obtained.
It is still difficult to determine concentrations of ferrous iron in minerals that do nor go
readily into solution and in rocks containing these minerals, as there is no entirely
satisfactory analytical method for that purpose. One of the most useful available for
determining ferrous iron in small mineral samples is probably the micromethod
introduced by Kiss. In it a mineral sample weighing a few milligrams is placed in aquartz vessel and dissolved in cerium(IV)/phosphoric acid at 325"C. The concentration
of ferrous iron is then measured indirectly by potentiometric titration of the excess
cerium (IV) with ferrous iron solution (Kiss L9S7).
In contrast, several methods are available for the satisfactory determination of ferrous
iron in readily soluble rocks and minerals. All have high enough accuracy and
precision but their rapidity for the routine analysis of large series of samples could be
better.
Publication VII compares three titrimetric methods making use of 13 GSF and 3linternational geological reference samples. These are the method of Amonette & Scott
(1991), the modified method of Wilson (Wilson 1955, Whipple 1974) and the modified
method of Pratt (Jackson et al. 1987). All the methods are useful for samples that can
be dissolved in acids and do not contain oxidizing or reducing components. The
sulphur in acid-soluble sulphides in particular causes large errors in the method ofAmonette & Scott and also in that of Wilson. In Pratt-s procedure, soluble S(II) as
hydrogen sulphide gas does not interfere. The modified method of Pratt is the mosr
useful of the three for determining ferrous iron in unknown rock samples (Paper VII).
28
Moore 1979) . Great care must be taken to ensure that the oxidation state of ferrous
iran remains unchanged while the measuring solution is prepared and also during the
measurement.
Titration of ferrous iron is undertaken as a visual or potentiometric oxidationlreduction
procedure, most commonly using potassium diehromate solution as the titrant. If the
sampie is dissolved in the presence of an excess oxidant, the residual oxidant can be
titrated with a ferrous iron solution of known strength. This solution is often titrated
with a potassium diehromate solution. The concentration of ferrous iron in the sampie
can then be calculated from the data thus obtained.
It is still difficult to determine concentrations of ferrous iron in minerals that do not go
readily into solution and in rocks containing these minerals, as there is no entirely
satisfactory analytical method for that purpose . One of the most useful available far
determining ferrous iran in small mineral sampies is probably the micromethod
introduced by Kiss. In it a mineral sampie weighing a few milligrarns is placed in a
quartz vessel and dissolved in cerium(IV)/phosphoric acid at 325°C. The concentration
of ferrous iron is then measured indirectly by potentiometrie titration of the excess
cerium (IV) with ferrous iron solution (Kiss 1987) .
In contrast, several methods are available for the satisfactory determination of ferrous
iron in readily soluble rocks and minerals. All have high enough accuracy and
precision but their rapidity for the routine analysis of large series of sampies could be
better.
Publication VII compares three titrimetrie methods making use of 13 GSF and 31
international geological reference sampies . These are the method of Amonette & Scott
(1991), the modified method of Wilson (Wilson 1955, Whippie 1974) and the modified
method of Pratt (Jackson et al. 1987). All the methods are useful for sampies that can
be dissolved in acids and do not contain oxidizing or reducing components. The
sulphur in acid-soluble sulphides in particular causes large errors in the method of
Amonette & Scott and also in that of Wilson. In Pratt' s procedure, soluble S(II) as
hydrogen sulphide gas does not interfere . The modified method of Pratt is the most
useful of the three for determining ferrous iron in unknown rock sampies (Paper VII) .

3.3
29
Determination of carbon
Carbon, which is present in rocks and minerals in concentrations ranging from several
percent to a few ppm, most often occurs as a carbonate such as calcite, dolomite or
siderite. The amount of other carbon-bearing material, i.e. graphite and organic
carbon, is usually low, but in graphite schists the concentration of graphite carbon is
commonly several percent or even tens of percent (toukola-Ruskeeniemi 1992). Some
minerals have constitutional elemental carbon or CO or CN groups (Zemann 1978).
Fluid inclusions of metamorphic rocks often contain carbon dioxide and hydrocarbons
as gas or liquid (Roedder 1984).
In rock and mineral analyses, carbon is most often determined as carbonate carbon
(COt and total carbon. The concentration of non-carbonate carbon is obtained by
subtracting the concentration of carbonate carbon from that of total carbon. The non-
carbonate carbon is either graphite or other forms of element carbon derived from
organic matter (kventhal & Shaw 1980).
Most of the analytical methods are based on the decomposition of carbonates with acid,
ignition of the sample at high temperature or wet-oxidation of carbon, and the
gravimetric, titrimetric, colorimetric or IR spectrometric determination of the carbon
dioxide thus generated @aper WII, Saikkonen 1994). The carbonate and non-carbonate
carbons can be separated from each other by removing the carbonate carbon with acid
decomposition. Attempts have been made to separate the carbon phases with thermal
decomposition but the procedure is difficutt (Charles & Simmons 1986, Saikkonen
1993).
In the study discussed in Paper VIII, total and non-carbonate carbon were determined
with the IR carbon analyser, CR-12 (LECO Corporation). Before the non-carbonate
carbon was measured, the carbonate carbon was removed from the sample by acid
treatrnent. Twenty international geological reference samples and 13 GSF rock
reference samples were analysed for this study. The results were highly satisfactory,
particularly when compared with those reported for the 20 international reference
samples. The concentrations of carbonate and non-carbonate carbons obtained for the
29
3.3 Determination of carbon
Carbon, which is present in rocks and minerals in concentrations ranging from several
percent to a few ppm, most often occurs as a carbonate such as calcite, dolomite or
siderite. The amount of other carbon-bearing material , i.e. graphite and organic
carbon, is usually low, but in graphite schists the concentration of graphite carbon is
commonly several percent or even tens of percent (Loukola-Ruskeeniemi 1992) . Some
minerals have constitutional elemental carbon or CO or CN groups (Zemann 1978).
Fluid inclusions of metamorphic rocks often contain carbon dioxide and hydrocarbons
as gas or liquid (Roedder 1984) .
In rock and mineral analyses , carbon is most often detennined as carbonate carbon
(C02) and total carbon. The concentration of non-carbonate carbon is obtained by
subtracting the concentration of carbonate carbon from that of total carbon. The non
carbonate carbon is either graphite or other fonns of element carbon derived from
organic matter (Leventhal & Shaw 1980).
Most of the analytical methods are based on the decomposition of carbonates with acid ,
ignition of the sampie at high temperature or wet-oxidation of carbon, and the
gravimetric, titrimetrie , colorimetric or IR spectrometric detennination of the carbon
dioxide thus generated (Paper VIII, Saikkonen 1994). The carbonate and non-carbonate
carbons can be separated from each other by removing the carbonate carbon with acid
decomposition. Attempts have been made to separate the carbon phases with thennal
decomposition but the procedure is difficult (Charles & Simmons 1986, Saikkonen
1993).
In the study discussed in Paper VIII, total and non-carbonate carbon were determined
with the IR carbon analyser, CR-12 (LECO Corporation). Before the non-carbonate
carbon was measured, the carbonate carbon was removed from the sampie by acid
treatment. Twenty international geological reference sampies and 13 GSF rock
reference sampies were analysed for this study. The results were highly satisfactory,
particularly when compared with those reported for the 20 international reference
sampies . The concentrations of carbonate and non-carbonate carbons obtained for the

3.4
30
GSF reference samples were compatible with the gravimetric data. The precision of the
results, which was about L%,5% or l0% with a carbon concentration of about 10%,
I% or 0.1%, respectively, was good and consistent with the trend towards a relatively
low standard deviation at high concentrations but high deviation at low concentrations.
Once the CR-12 instrument is set up and has stabilized, the operation is easy. It is also
rapid: about 70 determinations of total carbon and 40 determinations of the non-
carbonate carbon can be made by one analyst daily, compared with 10 determinations
with the gravimetric method. The method is suitable for determining the carbon content
of ancient sediments and of igneous and metamorphic rock samples containing more
than 0.01 % C. A sample size of 0.5-1.0 g is recommended.
Determination of halogens, sulphur and loss on ignition
Determination of halogens
The mean concentrations of fluorine, chlorine, bromine and iodine in silicate rocks are
shown in Table 4. The most common fluorine-bearing minerals are biotite, apatite and
fluorite. Scapolite and sodalite are chlorine-bearing silicate minerals. Bromine is a
relatively rare element, but in marine sediments with organic component and in
sedimentary rocks its concentrations may exceed 100 ppm (Koljonen 1992).Iodine, the
rarest of the halogens, has the highest concentrations in marine sediments and
sedimentary rocks. It occurs in various minerals, most cornmonly as silver, copper
iodides, lead iodides and calcium iodate, or lauüarite, one of the most important iodine
minerals in sediments (Wedepohl 1978).
The detection limits of different methods for halogens in rocks and minerals are listed
in Table 5.
30
GSF reference sampies were compatible with the gravimetrie data. The precision of the
results, which was about 1 %, 5% or 10% with a carbon concentration of about 10%,
1 % or O. 1 %, respectively, was good and consistent with the trend towards a relatively
low standard deviation at high concentrations but high deviation at low concentrations .
Once the CR-12 instrument is set up and has stabilized, the operation is easy. It is also
rapid: about 70 determinations of total carbon and 40 determinations of the non
carbonate carbon can be made by one analyst daily, compared with 10 determinations
with the gravimetrie method. The method is suitable for determining the carbon content
of ancient sediments and of igneous and metamorphie rock sampies containing more
than 0.01 % C. A sampIe size of 0.5-1.0 g is recommended.
3.4 Determination of halogens, sulphur and loss on ignition
Determination of halogens
The mean concentrations of fluorine, chlorine, bromine and iodine in silicate rocks are
shown in Table 4. The most common fluorine-bearing minerals are biotite, apatite and
fluorite . Scapolite and sodalite are chlorine-bearing silicate minerals . Bromine is a
relatively rare element, but in marine sediments with organie component and in
sedimentary rocks its concentrations may exceed 100 ppm (Koljonen 1992). lodine, the
rarest of the halogens, has the highest concentrations in marine sediments and
sedimentary rocks. lt occurs in various minerals, most commonly as silver, copper
iodides, lead iodides and calcium iodate, or lautarite, one of the most important iodine
minerals in sediments (Wedepohl 1978).
The detection limits of different methods for halogens in rocks and minerals are listed
in Table 5.

31
Table 4. Mean halogen concentratsions (ppm) inHutchison l-983) and halogen concentrations insample, l4Ac-1 (marine mud) (Govindaraju 1989)
silicate rocks (Jeffery a
an inEernationaL reference
Ultra-mafic
Mafic InEer-mediate
Granitic Alkaline l,lAc- 1
FluorineChlorineBromineIodine
r- zv100-400o.L-20.1-0.4
300- 500
100-400o -L-20.1--0.4
500-r.000r.00-4000.2-20. L-0.4
200-2000L00 -4 00
o.5-20.1-0.4
500-2000 770
200-2000 3.1?252
380
Table 5. Detection timits of different methods for halogens (PPm inrock). Met,hods: ion-specific elecErode, IS; ion-chromatography, IC; XRF;
neutron activaEion, NAA,' spectrophotometry, CK; and "otshers", oTI{-
Samples were decomposed with fusion and trhe elements separated by
pyrohydrolyse or ion-exchange chromatography. XRF determinations were
made on briguetted samPles.
ISfusiona.
ICpyroh.
XRF
briq.NAA CK
pyroh. fusion
FluorineChlorineBromineIodine
20-4040-1000.1 h.
ztJ - 5u
20-5055 00
50
8
5k.
10 e.20 f. s
1 i. 0.00.04 1.
2.90.20.1
v-j.
a. Hoffstettser et a1., L99L b. HaJ-l et a}., 1985 c. Pottrs, L993 d-
Langenauer et a1., !g92 e. Fuge and Andrews, 1985 f. Hoffstetter etäf., 1991 s. separation by distillation and ion-specific electrode,Elsheimer, L98'7 h. separation by ion-exchange chromatography and ion-specific elecurode, Akaiva et a}., 1980 i. Pyen etr a1., 1980 j. mass
specgrometer, Heuman et aI, 1983 k. COSCrove, L97O 1. FUge et al.,t978 -
31
Table 4. Mean halogen concentrations (ppm) in silicate rocks (Jeffery &
Hutchison 1983) and halogen concentrations in an international reference
sample, MAG-1 (marine mud) (Govindaraju 1989) .
Ultra- Mafic Inter- Granitic Alkaline MAG-1 mafic mediate
Fluorine 1-20 300-500 500-1000 200-2000 500-2000 770 Chlorine 100-400 100-400 100-400 100-400 200-2000 3 . 1% Bromine 0.1-2 0 . 1-2 0 . 2-2 0.5-2 252 Iodine 0.1-0.4 0.1-0.4 0.1-0 .4 0.1-0.4 380
Table 5. Detection limits of different methods for halogens (ppm in
rock) . Methods: ion-specific electrode, I8; ion-chromatography, IC; XRF;
neutron activation, NAA; spectrophotometry, CK; and "others", OTH.
8amples were decomposed with fusion and the elements separated by
pyrohydrolyse or ion-exchange chromatography . XRF determinations were
made on briquetted samples.
Fluorine
Chlorine
Bromine
Iodine
I8
fusion
a.
20-40
IC
pyroh.
b .
20-50
40-100 20-50
0.1 h .
XRF
briq.
c.
5600
50
8
6 k.
NAA
pyroh.
d .
2 . 9
0.2
0 . 1
CK
fusion
10
20
1
e.
f.
i.
0.04 1.
OTH
5 g.
0.0 j.
a. Hoffstetter et al., 1991 b. Hall et al., 1986 c. Potts, 1993 d.
Langenauer et al., 1992 e. Fuge and Andrews, 1985 f. Hoffstetter et
al., 1991 g. separation by distillation and ion-specific electrode,
Elsheimer, 1987 h. separation by ion-exchange chromatography and ion
specific electrode, Akaiva et al., 1980 i. pyen et al., 1980 j. mass
spectrometer, Heuman et al, 1983 k. Coscrove, 1970 1. Fuge et al.,
1978.

32
Rocks and minerals can be analysed for fluorine and chlorine with a number of
methods. Normal silicate rock samples can easily be analysed with an ion-specific
electrode (Fabbri & Donati 1981, Stecher 1983, Yuchi et al. 1988, Rice 1988), by ion
chromatography (Conrad & Brownlee 1988, Hall et al. 1986, Kennedy et al. 1983,
Wilson & Kent L982, Ewarns et al. 1981, Gent & Wilson 1985), XRF (koni et al.
1982, Langenauer et al. 1992) or spectrophotometry (Fuge & Andrews 1985,
Adelantado et al. 1985, Hoffstetter et al. 1991). Low concentrations (<20 ppm) are
more difficult to determine; the sample must be bigger, and fluorine and chlorine must
be separated from the sample matrix and concentrated. Bromine and iodine can be
determined by spectrophotometry @yen et al. 1980, Fuge et al. 1978), XRF (Ullman
& Tisue 1983, Croscove 1970) or activation analysis (Langenauer et al. 1992).
In Chemical Laboratory of the GSF, fluorine concentrations of rocks and minerals are
determined with an ion-specific electrode from a solute produced with sodium
hydroxide fusion. The corresponding chlorine determinations are made by
spectrophotometry. The sample is dissolved with sodium carbonate fusion. Both
methods gave satisfactory results when compared with those reported for several GSF
and international reference samples (Rautiainen & Saikkonen, unpublished results).
Determination of sulphur
Sulphur occurs in rocks as sulphides, sulpho-salts, sulphates, native sulphur or organic
sulphur. Sulphide minerals such as pyrrhotite (Fe,-"S) and pyrite (FeSr) are presenr in
low abundances (0.01-0.1%) in almost all rocks. Many sulphide minerals form ores as
a result of various geological processes. Sulphate minerals, the most coürmon of which
are gypsum (CaSOo * 2H2O), alum (KAlSOo * 12 }lz0) and barite (BaSOo), are
abundant in marine sediments and sedimentary rocks. Soluble sulphates and gaseous
sulphur compounds occur in mineral inclusions. Elementary sulphur is formed through
32
Rocks and minerals can be analysed for fluorine and chlorine with a number of
methods. Normal silicate rock sampies can easily be analysed with an ion-specific
electrode (Fabbri & Donati 1981, Stecher 1983, Yuchi et al. 1988, Rice 1988), by ion
chromatography (Conrad & Brownlee 1988, Hall et al. 1986, Kennedy et al. 1983,
Wilson & Kent 1982, Ewans et al. 1981, Gent & Wilson 1985), XRF (Leoni et al.
1982, Langenauer et al. 1992) or spectrophotometry (Fuge & Andrews 1985 ,
Adelantado et al. 1985, Hoffstetter et al. 1991). Low concentrations «20 ppm) are
more difficult to determine; the sampie must be bigger, and fluorine and chlorine must
be separated from the sampie matrix and concentrated. Bromine and iodine can be
determined by spectrophotometry (Pyen et al. 1980, Fuge et al. 1978), XRF (Ullman
& Tisue 1983, Croscove 1970) or activation analysis (Langenauer et al. 1992) .
In Chemical Laboratory of the GSF, fluorine concentrations of rocks and minerals are
detennined with an ion-specific electrode from a solute produced with sodium
hydroxide fusion. The corresponding chlorine detenninations are made by
spectrophotometry. The sampie is dissolved with sodium carbonate fusion . Both
methods gave satisfactory results when compared with those reported for several GSF
and international reference sampies (Rautiainen & Saikkonen, unpublished results).
Determination of sulphur
Sulphur occurs in rocks as sulphides, sulpho-salts, sulphates, native sulphur or organic
sulphur. Sulphide minerals such as pyrrhotite (Fe1_xS) and pyrite (FeS2) are present in
low abundances (0.01-0.1 %) in almost all rocks. Many sulphide minerals fonn ores as
a result of various geological processes . Sulphate minerals, the most common of which
are gypsum (CaS04 * 2H20) , alum (KAIS04 * 12 H20) and barite (BaS04) , are
abundant in marine sediments and sedimentary rocks. Soluble sulphates and gaseous
sulphur compounds occur in mineral inclusions. Elementary sulphur is formed through
33
the bacterial reduction of sulphates or the oxidation of volcanic hydrogen sulphide gas.
Organic sulphur compounds (e.g. S-aminoacids) are formed through sulphate reduction
(Wuesch 1978).
The sulphur in rocks and minerals is determined from pulverized samples. Excessive
grinding may oxidize part of the sulphides into sulphur dioxide, which is then expelled
from the sample. Sulphide may oxidize into sulphate, causing an error in the
concentration of sulphide zulphur in the sample.
Selective leaches are used for quantitative determinations of different sulphur forms
(Rice et al. 1993). The success of the determination depends on the mineral
composition and grain size of the sample, the degree of crystallization of the sulphide
minerals, the concentration of ferric iron in the sample, and the degree of diagenesis
or metamorphism of sediments and sedimentary rocks. The sample must, therefore, be
thoroughly examined before analysis. Information on the mineral and elemental
composition of the sample also facilitates performance of the analysis (Canfield et al.
1986, Tuttle et al. 1986, Jackson et al. 1987). In rock and mineral analysis, it is often
sufficient to determine totat sulphur (S.) when the sulphur concentration is low,
<0.L%. If sulphate and sulphide sulphurs are measured independently, their
concentrations are given as sulphur trioxide and native sulphur. In general, total
sulphur is reported as native sulphur. Sulphide correction must then be made for the
oxides of the analysis by subtracting the amount of oxygen corresponding to the
amount of sulphur from the sum of the oxides if other elements occurring as sulphides,
e.g. iron, have been reported as oxides. The correction is unnecessary if the sulphate
sulphur is reported as SOr. The sulphide correction is feasible only if information is
available on the mineral composition and analytical conditions. Pyrite does not go into
solution in the conventional determination of ferrous iron with the Pratt method.
Therefore, the ferrous iron of pyrite is often erroneously reported in the analysis as
Fe3*. In the classical methods of sulphur determination, the sample is usually dissolved
by fusion with sodium carbonate, and the total sulphur is oxidized into sulphate and
precipitated as barium sulphate. This method is not suitable for low concentrations, as
the BaSOa precipitate may include impurities. Sample can also be heated at a high
temperature in oxygen or air flux, often in the presence of an oxidant. Sulphur is then
oxidized into sulphur dioxide and trioxide. The gases are absorbed into a suitable
33
the bacterial reduction of sulphates or the oxidation of volcanic hydrogen sulphide gas.
Organic sulphur compounds (e .g. S-aminoacids) are formed through sulphate reduction
(Wuesch 1978).
The sulphur in rocks and minerals is determined from pulverized sampIes. Excessive
grinding may oxidize part of the sulphides into sulphur dioxide, which is then expelled
from the sampIe. Sulphide may oxidize into sulphate , causing an error in the
concentration of sulphide sulphur in the sampIe .
Selective leaches are used for quantitative determinations of different sulphur forms
(Rice et al. 1993). The success of the determination depends on the mineral
composition and grain size of the sampIe , the degree of crystallization of the sulphide
minerals , the concentration of ferric iron in the sampIe, and the degree of diagenesis
or metamorphism of sediments and sedimentary rocks . The sampIe must, therefore, be
thoroughly examined before analysis. Information on the mineral and elemental
composition of the sampIe also facilitates performance of the analysis (Canfield et al.
1986, Tuttle et al. 1986, Jackson et al. 1987). In rock and mineral analysis, it is often
sufficient to determine total sulphur (StoJ when the sulphur concentration is low,
< 0.1 %. If sulphate and sulphide sulphurs are measured independently , their
concentrations are given as sulphur trioxide and native sulphur. In general, total
sulphur is reported as native sulphur. Sulphide correction must then be made for the
oxides of the analysis by subtracting the amount of oxygen corresponding to the
amount of sulphur from the sum of the oxides if other elements occurring as sulphides ,
e.g . iron, have been reported as oxides . The correction is unnecessary if the sulphate
sulphur is reported as S03' The sulphide correction is feasible only if information is
available on the mineral composition and analytical conditions . Pyrite does not go into
solution in the conventional determination of ferrous iron with the Prau method.
Therefore, the ferrous iron of pyrite is often erroneously reported in the analysis as
Fe3+. In the classical methods of sulphur determination, the sampIe is usually dissolved
by fusion with sodium carbonate, and the total sulphur is oxidized into sulphate and
precipitated as barium sulphate. This method is not suitable for low concentrations, as
the BaS04 precipitate may include impurities. SampIe can also be heated at a high
temperature in oxygen or air flux, often in the presence of an oxidant. Sulphur is then
oxidized into sulphur dioxide and trioxide . The gases are absorbed into a suitable

34
solution and the sulphur oxides determined spectrophotometrically, gravimetrically or
titrimetricalty (Johnson & Maxwell l98l).
The sulphur concentration of rocks and minerals is usually measured with more or less
automated analysers. An X-ray fluorescence spectrometer is useful for the rapid
determination of several elements simultaneously. The powdered sample to be analysed
is compressed into a briquette or converted into a glassJike fusion preparate. For the
briquette, the detection limit of sulphur in routine determinations is about 20 ppm
(Potts L993). The disadvantage of this preparate is that correct sulphur data cannot be
obtained unless the sample and standard sample are of similar sulphide mineral
composition (koni et al. 1982). When measured on the fusion preparate, the detection
limit of sulphur is about 120 ppm (Potts 1993).
In many analytical methods, sulphur is first separated by heating the sample under
oxidizing conditions. Sulphur oxidized into sulphur dioxide in pyrolysis can be
determined by IR spectrometry (Terashima 1988), ion chromatography (Hall et al.
1986) and iodometric (Bouvier et al. L972) or colorimetric titration (Atkin &Somerfield L994). Hall and Vaive (1989) have compared the zulphur determination
methods used by the Geological Survey of Canada, that is, pyrohydrolyse-ion
chromatography, pyrolyse-infra-red spectrometry and pyrolyse-titration.
Determination of loss on ignition
The reduction in the mass of the sample on ignition is reported as loss on ignition
(LOD. On ignition (usually for i h at 1000"C), water together with carbon in itsvarious forms is expelled from the weighed sample as are, either totally or partially,
sulphur, fluorine, chlorine and such rare elements as mercury and selenium. However,
the mass also increases during ignition, as ferrous oxide is oxidized into ferric oxide.
The mass increment can be calculated if the concentration of ferrous iron is known. Ifit is not, then total iron must be reported as FqOr; the plus error due to the expression
34
solution and the sulphur oxides determined spectrophotometrically, gravimetrically or
titrimetrically (Johnson & Maxwell 1981) .
The sulphur concentration of rocks and minerals is usually measured with more or less
automated analysers. An X-ray fluorescence spectrometer is useful for the rapid
determination of several elements simultaneously . The powdered sampie to be analysed
is compressed into a briquette or converted into a glass-like fusion preparate. For the
briquette, the detection limit of sulphur in routine determinations is about 20 ppm
(Potts 1993). The disadvantage of this preparate is that correct sulphur data cannot be
obtained unless the sampie and standard sampie are of similar sulphide mineral
composition (Leoni et al. 1982). When measured on the fusion preparate, the detection
limit of sulphur is about 120 ppm (Potts 1993).
In many analytical methods, sulphur is first separated by heating the sampie under
oxidizing conditions . Sulphur oxidized into sulphur dioxide in pyrolysis can be
determined by IR spectrometry (Terashima 1988), ion chromatography (Hall et al.
1986) and iodometrie (Bouvier et al. 1972) or colorimetric titration (Atkin &
Somerfield 1994). Hall and Vaive (1989) have compared the sulphur determination
methods used by the Geological Survey of Canada, that is , pyrohydrolyse-ion
chromatography, pyrolyse-infra-red spectrometry and pyrolyse-titration.
Determination of loss on ignition
The reduction in the mass of the sampie on ignition is reported as loss on ignition
(LOI) . On ignition (usually for 1 h at 1000°C), water together with carbon in its
various forms is expelled from the weighed sampie as are, either totally or partially,
sulphur, fluorine, chlorine and such rare elements as mercury and selenium. However,
the mass also increases during ignition, as ferrous oxide is oxidized into ferric oxide .
The mass increment can be calculated if the concentration of ferrous iron is known. If
it is not, then total iron must be reported as Fe:z03; the plus error due to the expression
l

35
of ferrous iron as ferric iron is then of the same magnitude as the minus error in the
weighed LOI. Thus the errors compensate for each other and do not affect the sum of
the oxides in total analysis. The determination of LOI complements the total rock
analysis. Measurement of the concentrations of volatile components expelled from the
sample on ignition can be used to test the accuracy of rock analyses by XRF and
plasma spectrometry if it is neither possible nor necessary to determine these
concentrations independently (kchler & Desilets 1987, King & Vivit 1988, Huka &
Rubeska 1993, Kane & Skeen 1993).
SI,]MMARY
This study investigated and developed chemical analytical methods for rocks, minerals
and other geological samples such as meteorites. With the aid of Finnish and
international geological reference samples the methods were compared with other
methods in use. Numerous rock, mineral, meteorite and other geological samples were
analysed with modified and classical wet-chemical and instrumental methods. The
results are presented in papers I-VIII.
The analytical method comprising modified old and new determination methods used
for this work is one of the most accurate available for the total analysis of many
geological samples. Normally the following major and minor components are
determined in total analysis: silica, titanium oxide, aluminium oxide, manganese oxide,
ferric iron oxide, ferrous iron oxide, calcium oxide, magnesium oxide, constitutional
water (HrO.) and moisture water (HrO) and often also fluorine, chlorine, sulphur and
native carbon. In the main-portion analysis of the method, silica, calcium oxide and
magnesium oxide as well as the oxide-group precipitate of all the elements that
precipitate with ammonia are determined gravimetrically. Titanium oxide and total
iron(Ill)oxide are measured from the oxide group precipitate spectro- photometrically'
Aluminium oxide is obtained by subtracting the weight of the other oxides from the
total weight of the oxide group precipitate. The main-portion analysis was tested and
investigated in Publication II.
35
of ferrous iron as ferric iron is then of the same magnitude as the minus error in the
weighed LOI. Thus the errors compensate for each other and do not affect the sum of
the oxides in total analysis. The determination of LOI complements the total rock
analysis . Measurement of the concentrations of volatile components expelled from the
sampie on ignition can be used to test the accuracy of rock analyses by XRF and
plasma spectrometry if it is neither possible nor necessary to determine these
concentrations independently (Lechler & Desilets 1987, King & Vivit 1988, Huka &
Rubeska 1993, Kane & Skeen 1993).
4 SUMMARY
This study investigated and developed chemical analytical methods for rocks , minerals
and other geological sampies such as meteorites. With the aid of Finnish and
international geological reference sampies the methods were compared with other
methods in use . Numerous rock, mineral, meteorite and other geological sampies were
analysed with modified and classical wet-chemical and instrumental methods . The
results are presented in papers I-VIII.
The analytical method comprising modified old and new determination methods used
for this work is one of the most accurate available for the total analysis of many
geological sampies. Normally the following major and minor components are
determined in total analysis: silica, titanium oxide , aluminium oxide, manganese oxide,
ferric iron oxide , ferrous iron oxide, calcium oxide, magnesium oxide, constitutional
water (H20 +) and moisture water (H20 ") and often also fluorine, chlorine , sulphur and
native carbon. In the main-portion analysis of the method, silica, calcium oxide and
magnesium oxide as well as the oxide-group precipitate of all the elements that
precipitate with ammonia are determined gravimetrically. Titanium oxide and total
iron(III)oxide are measured from the oxide group precipitate spectro- photometrically .
Aluminium oxide is obtained by subtracting the weight of the other oxides from the
total weight of the oxide group precipitate. The main-portion analysis was tested and
investigated in publication II .

36
The second subsample in the total analysis method is dissolved with hydrofluoric, nitric
and perchloric acids. Sodium and potassium are determined from the solute thus
obtained by flame photometry or flame AAs. Manganese and phosphorus
concentrations are measured colorimetrically as pennanganate and molybdo-vanado
phosphoric acid complex (Fig..1). Water, ferrous iron and carbon dioxide, and often
also native carbon, fluorine, chlorine and sulphur, are analysed as individual
determinations. The concentrations of total and constitutional waters in the sample are
determined with IR spectrometry. The water of crystallization in the sample can also
be obtained by subtracting the concentration of moisture water from that of total water.
The concentration of ferric iron is calculated by subtracting that of ferrous iron from
total iron (Fig. 1).
The above package of methods is suitable for analysing single samples requiring an
individual approach and analysis, e.g. rock and mineral reference samples, certain
mineral samples and meteorite samples. It cannot be used for analysing samples en
masse. Instruments suitable for this purpose are the X-ray fluorescence spectrometer,
atomic absorption spectrophotometer and plasma spectrometer. The precision and
accuracy of the analyses of many of the elements determined with XRF, that is, Si, Ti,Al, Fe,o,, Mn, Mg, ca, Na, K and P, are of the same order of magnitude as those
determined in total analysis as described above. The accuracies of flame AAS and ICp-AES analyses are equal to those of XRF for some elements. Many trace elements can
also be determined with XRF, AAS and ICP-AES instruments. But, as pointed out
above, in the total analysis of rocks and minerals by these instruments cannot analyse
all of the components (Table 2). For individual determinations a new subsample must
be taken from the sample powder, which then requires separate chemical pretreatment
(dissolution, separation, etc.) and measurement of concentration.
The objectives of the present work were to develop new and more rapid individual
determination methods that would be appropriate in other respects, too (e.g. accuracy,
precision and detection limit) for analysing rocks, minerals and other related geological
samples, and to improve existing methods for individual determination.
The method for determining water with IR absorption was investigated and refined inthe course of the work. It has several advantages. Operation with the RMC-100
36
The second subsampie in the total analysis method is dissolved with hydrofluoric, nitric
and perchloric acids. Sodium and potassium are determined from the solute thus
obtained by flame photometry or flame AAS. Manganese and phosphorus
concentrations are measured colorimetrically as permanganate and molybdo-vanado
phosphoric acid complex (Fig. ). Water, ferrous iron and carbon dioxide, and often
also native carbon, fluorine, chlorine and sulphur, are analysed as individual
determinations . The concentrations of total and constitutional waters in the sampie are
determined with IR spectrometry. The water of crystallization in the sampie can also
be obtained by subtracting the concentration of moisture water from that of total water.
The concentration of ferric iron is calculated by subtracting that of ferrous iron from
total iron (Fig . 1).
The above package of methods is suitable for analysing single sampies requiring an
individual approach and analysis, e.g. rock and mineral reference sampies, certain
mineral sampies and meteorite sampies. It cannot be used for analysing sampies en
masse. Instruments suitable for this purpose are the X-ray fluorescence spectrometer,
atomic absorption spectrophotometer and plasma spectrometer. The precision and
accuracy of the analyses of many of the elements determined with XRF, that is, Si , Ti,
Al, Felol , Mn, Mg, Ca, Na, K and P, are of the same order of magnitude as those
determined in total analysis as described above. The accuracies of flame AAS and ICP
AES analyses are equal to those of XRF for some elements. Many trace elements can
also be determined with XRF, AAS and ICP-AES instruments. But, as pointed out
above, in the total analysis of rocks and minerals by these instruments cannot analyse
all of the components (Table 2). For individual determinations a new subsampie must
be taken from the sampie powder, which then requires separate chemical pretreatment
(dissolution, separation, etc .) and measurement of concentration.
The objectives of the present work were to develop new and more rapid individual
determination methods that would be appropriate in other respects, too (e. g. accuracy,
precision and detection limit) for analysing rocks, minerals and other related geological
sampies, and to improve existing methods for individual determination.
The method for determining water with IR absorption was investigated and refined in
the course of the work. It has several advantages. Operation 'with the RMC-lOO

37
instrument is simple and unvarying. The total and crystallization waters of rocks and
minerals can clearly be determined more rapidly with this method than with the
gravimetric Penfield method and with equally good accuracy. This method is in use at
the chemical laboratory of GSF (Paper VI, Saikkonen 1990).
The analytical methods for ferrous iron were assessed by comparing ttree titrimetric
methods: the Pratt method, the Wilson method and the Amonette & Scott method. It
was concluded that the modified Pratt method is the most useful for determining of
ferrous iron in unknown samples. The Wilson method and the Amonette & Scott
method can be applied to samples of known mineral composition. The modified Pratt
method is in use at the chemical laboratory of GSF (Paper VII).
The method based on IR absorption and used for determining total carbon in geological
samples was studied and an IR method was developed for determining the
concentration of non-carbonate carbon, which is either graphite or other forms of
element carbon deriving from organic matter. The concentration of carbonate carbon
is obtained by subtracting the concentration of non-carbonate carbon from that of total
carbon. The methods described above are in use at the chemical laboratory of GSF
(Paper VItr).
Methods for determining halogens, sulphur and LOI were reviewed on the basis of the
literature and in the light of practical experience.
37
instrument is simple and unvarying. The total and crystallization waters of rocks and
minerals can clearly be determined more rapidly with this method than with the
gravimetrie Penfield method and with equally good accuracy. This method is in use at
the chemicallaboratory of GSF (Paper VI, Saikkonen 1990).
The analytical methods for ferrous iron were assessed by comparing three titrimetrie
methods: the Pratt method, the Wilson method and the Amonette & Scott method. It
was concluded that the modified Pratt method is the most useful for determining of
ferrous iron in unknown sampies. The Wilson method and the Amonette & Scott
method can be applied to sampies of known mineral composition. The modified Pratt
method is in use at the chemical laboratory of GSF (Paper VII).
The method based on IR absorption and used for determining total carbon in geological
sampies was studied and an IR method was developed for determining the
concentration of non-carbonate carbon, which is either graphite or other forms of
element carbon deriving from organie matter. The concentration of carbonate carbon
is obtained by subtracting the concentration of non-carbonate carbon from that of total
carbon. The methods described above are in use at the chemical laboratory of GSF
(Paper VIII).
Methods for determining halogens, sulphur and LOI were reviewed on the basis of the
literature and in the light of practical experience.

38
ACKNOWLEDGEMENTS
The work discussed in this thesis was carried out at the Geological Survey of Finland.
I would like to thank Professor Veikko Lappalainen, Director of the Geological
Survey, professor Marklu Mäkelä and professor Lauri Eskola for giving me the
opportunity to carry out this pröject, and for approving publication of this paper as an
issue of the GSF, Miscellaneous publications. GSF's chemical laboratory has provided
me with modern laboratories, instruments and equipment and also a good working
atrnosphere. I also express my gratitude to the former heads of the chemical laboratory:
Professor Birger Wiik and Pentti Noras, and to HarrJ'Sandström, the laboratory's
present head, and to Gustaf Wansen, the head of the Espoo laboratory and to all my
coworkers at the chemical laboratorv.
I am greatly indebted to my colleagues, Ringa Danielsson, Dr Kari Kinnunen,
Professor Kauko Laajoki, Dr Seppo Lahti and Irja Rautiainen for good co-operation.
Useful cotnments on many versions of the manuscript and papers were received fromDr Juha Karhu, Esko Kontas, Maija llmasti, Riitta Juvonen and Pentti Noras - thank
you! In addition, I want to acknowledge the assistance I received from Christer
Ahlsved, Juhani oinonen, Ari Puisto and Mervi wiik in the laboratorv.
The manuscript was reviewed by Dr. Tapio Koljonen and Dr. Esko Saari and I thank
them for their corrections and suggestions. I am particularly indebted to my supervisor,
Professor Markku I-eskelä, of Helsinki University, whose advice and critical reading
helped me to improve the manuscript.
This summary was translated into English by Gillian Häkli. The library staff and the
staff in the publications section gave their kind help. I am very grateful to all these
people, and to the many others who helped me at various stages of the work.
Last, but not least, I thank my wife Tuire and my children for their patience and
sympathy during this work.
38
ACKNOWLEDGEMENTS
The work discussed in this thesis was carried out at the Geological Survey of Finland.
I would like to thank Professor Veikko Lappalainen, Director of the Geological
Survey , professor Markku Mäkelä and professor Lauri Eskola for giving me the
opportunity to carry out this project, and for approving publication of this paper as an
issue of the GSF, Miscellaneous publications. GSF ' s chemicallaboratory has provided
me with modem laboratories , instruments and equipment and also a good working
atmosphere . I also express my gratitude to the former heads of the chemicallaboratory:
Professor Birger Wiik and Pentti Noras, and to Harry Sand ström , the laboratory ' s
present head , and to Gustaf Wansen, the head of the Espoo laboratory and to all my
coworkers at the chemical laboratory .
I am greatly indebted to my colleagues, Ringa Danielsson, Dr Kari Kinnunen,
Professor Kauko Laajoki, Dr Seppo Lahti and Irja Rautiainen for good co-operation.
Useful comments on many versions of the manuscript and papers were received from
Dr Juha Karhu , Esko Kontas , Maija Ilmasti , Riitta Juvonen and Pentti Noras - thank
you! In addition, I want 10 acknowledge the assistance I received from Christer
Ahlsved, Juhani o inonen , Ari Puisto and Mervi Wiik in the laboratory.
The manuscript was reviewed by Dr. Tapio Koljonen and Dr. Esko Saari and I thank
them for their corrections and suggestions. I am particularly indebted to my supervisor,
Professor Markku Leskelä , of Helsinki University , whose advice and critical reading
helped me to improve the manuscript.
This summary was translated into English by Gillian Häkli. The library staff and the
staff in the publications section gave their kind help . I am very grateful to all these
people, and to the many others who helped me at various stages of the work.
Last, but not least, I thank my wife Tuire and my children for their patience and
sympathy during this work.

39
REFERENCES
Adelantado, J. V. G., Martinez, V. P., Moreno, A. C. & Reig, F. B. 1985. Spectrophotometric
detern ination of fluoride in fluoride-bearing minerals after decomposition by fusion with sodium hydroxide.
Talanta 32,224-226.
Adler, I. 1986. The analysis of extraterrestrial materials. New York: John Wiley & Johns. 346 p.
Akaiwa, H., Kawamoto, H. & Hasegava, K. 1980. Determination of a trace amount of bromine in rocks by
ion exchange chromatography and direct potentiometry with an ion-selective electrode. Talanta 27,9O9-9IO.
Amonette, J.E. & Scon, A.D. 1991. Determination of ferrous iron in non-refractory silicate minerals. l. An
improved semi-micro oxidimetric method. Chemical Geology. 92, 329 -338.
Angino, E.E. & Bitling, G.K. 1967. Atomic absorption spectrometry in geology. Amsterdam: Elsevier
Scientific Publishing Co. 2O2 p.
Asklund, M.A., Grundulis, V & Rönnholm B. 1966. Vätkemisk analys av silikatbergarter. Sveriges
Geologiska Undersökning, Serie C 616, Arsbok 6l (L). 77 p.
Atkin, B. P. & Somerfield, C. 1994. The determination of total sulphur in geological materials by
coulometric tiuation. Chemical Geology 111, 131-134.
Bancroft, G. M., Sham, T.K., Riddle, C., Smith, T.E. & Turek, A. 1977.Fercic/ferrous-iron ratios in bulk
rock samples by Mössbauer spectroscopy - The determination of standard rock samples C-2, GA, W-l and
Mica-Fe. Chemical Geology 19, 277 -284.
Baur, w.H. 1978. Hydrogen, I A. In: Wedepohl, K.H. (ed.) Handbook of geochemistry II-1.
Berlin: Springer-Verlag. p. 1-A-1.
Berry,H.,&Rudowski,R. 1965.Thepreparationofchondriticmeteoritesforchemicalanalysis.Geochimicaet Cosmochimica Acta, 29, 1367 -1369.
Beyer, M. E., Bond, A. M. & Mclaughlin, R. J. W. 1975. Simultaneous polarographic determination of
ferrous, ferric and total iron in sUndard rocks. Analytical Chemistry 47 ' 479-482.
Bock, R.A. 1979. Handbook of decomposition methods in analytical chemistry' New York: John Wiley &
Sons. 444 p.
Bouvier, J., Sen Cupta, J. G. & Abbey, S. L972. Use of an "automatic sulphur titrator" in rock and mineral
analysis: determination of sulphur, total carbon, carbonate and ferrous iron. Geological Survey of Canada'
Paper 72-3L.23 p.
Bruce, C. B. & Bower, N.W. 1987. Spectrophotometric determination of ferrous iron in eighteen United
States geochemical reference sta:ndards. Geostandards Newsletter l l, 41 42 -
Canfield, D. E., Raiswell, R., Westrich, J. T., Reaves, C. M. & Berner, R. A. 1986' The use of chromium
reduction in the analysis of reduced inorganic sulfur in sediments and shales. Chemical Geology 54' 149-155'
Chao, T.T. & Sandszolone, R.F. 1992. Decomposition techniques. Journal of Geochemical Exploration,
Special Issue 44, 65-106.
Charles, M. J. & Simmons, M. S. 1986. Mettrods for determination of carbon in soils and sediments. A
review. Analyst 3, 385-390.
Conrad, V. B. & Brownlee, W. D. 1988. Hydropyrolytic-ion chromatographic determination of fluoride in
coal and geological materials- Analytical Chemistry 60,365-369'
39
REFERENCES
Adelantado, J. v. G., Martinez, v. P. , Moreno, A. C. & Reig, F. B. 1985 . Spectrophotometric determination of fluoride in fluoride-bearing minerals after decomposition by fusion with sodium hydroxide . Talanta 32, 224-226.
Adler, I. 1986. The analysis of extraterrestrial materials. New York: John Wiley & Johns. 346 p.
Akaiwa, H., Kawamoto , H. & Hasegava, K. 1980. Determination of a trace amount ofbromine in rocks by ion exchange chromatography and direct potentiometry with an ion-selective electrode . Talanta 27, 909-910.
Amonette , J.E. & Scott, A.D. 1991. Determination offerrous iron in non-refractory silicate minerals . 1. An improved semi-micro oxidimetric method. Chemical Geology. 92, 329-338 .
Angino , E.E. & Billing, G.K. 1967. Atomic absorption spectrometry in geology. Amsterdam: Elsevier Scientific Publishing Co. 202 p.
Asklund, M.A., Grundulis, V & Rönnholm B. 1966. Vätkemisk analys av silikatbergarter. Sveriges Geologiska Undersökning, Serie C 616, Ärsbok 61 (1). 77 p.
Atkin, B. P. & Somerfield, C. 1994. The determination of total sulphur 10 geological materials by coulometric titration. Chemical Geology 111, 131-134.
Bancroft, G. M., Sham, T.K., Riddle , C., Smith, T.E. & Turek, A. 1977. Ferric/ferrous-iron ratios in bulk rock sampies by Mössbauer spectroscopy - The determination of standard rock sampies G-2, GA, W-l and Mica-Fe . Chemical Geology 19, 277-284.
Baur, W.H. 1978. Hydrogen, 1 A. In: Wedepohl , K.H. (ed.) Handbook of geochemistry lI-I. Berlin: Springer-Verlag. p. l-A-1.
Berry, H., & Rudowski , R. 1965 . The preparation of chondritic meteorites for chemical analysis . Geochimica et Cosmochimica Acta , 29 , 1367-1369.
Beyer, M. E., Bond, A. M. & McLaughlin, R. J. W. 1975. Simultaneous polarographic determination of ferrous, ferric and total iron in standard rocks . Analytical Chemistry 47, 479-482.
Bock, R.A. 1979. Handbook of decomposition methods in analytical chemistry. New York: John Wiley & Sons. 444 p.
Bouvier, J ., Sen Cupta, 1. G. & Abbey, S. 1972. Use of an "automatic sulphur titrator" in rock and mineral analysis: determination of sulphur, total carbon, carbonate and ferrous iron. Geological Survey of Canada, Paper 72-31. 23 p.
Bruce, C. B. & Bower, N.W. 1987. Spectrophotometric determination of ferrous iron in eighteen United States geochemical reference standards. Geostandards Newsletter 11,41-42.
Canfield, D. E., Raiswell, R., Westrich, J. T., Reaves, C. M. & Berner, R. A. 1986. The use ofchromium reduction in the analysis ofreduced inorganic sulfur in sediments and shales. Chemical Geology 54, 149-155.
Chao, T .T. & Sandszolone , R.F. 1992. Decomposition techniques. Journal of Geochemical Exploration, Special Issue 44, 65-106 .
Charles, M. J. & Simmons, M. S. 1986. Methods for determination of carbon in soils and sediments. A review. Analyst 3, 385-390.
Conrad, V. B. & Brownlee, W. D. 1988. Hydropyrolytic-ion chromatographic determination of fluoride in coal and geological materials. Analytical Chemistry 60, 365-369.
40
Coscrove, M.E. 1970. Iodine in the biuminous Kimmeridge shales of the Dorser Coasr, England.Geochimica et Cosmochimica Acta 34, 830-833.
Delong, S.E. & Lyman, P. 1981. Water capture in rapid silicate analysis. Chemical Geology 35, 173-176.
Dinler, E. 1933. Gesteinanalytisches Praktikum. Berlin: walterde Gruyrer & co. ll1p.
Din, V.K. & Jones G.C. 1978. The determination of total carbon and combined warer in silicates using aC,H,N elemental analyzer. Chemical Geology 23,347-352.
Dyar, M.D., Naney, M.T. & Swanson, S.E. 1987. Effects of quench methods on Fe3*/Fe2* ratios: AMössbauer and wet-chemical study. America Mineralogist 72,792-8W.
Easton, A.J. 1972. Chemical analysis of silicate rocks. Amsrerdam: Elsevier Scientific Publishing Co.258 p.
Elsheimer, H. N. 1987. Application of an ion-selective electrode method to the determination of chloride in4l international geochemical reference materials. Geostandards Newslener ll, lL5-122.
Endo, M., Sasaki, I. & Abe, S. 1992. Kinetic spectrophotometric determination of iron oxidation states ingeological materials. Fresenius Journal Analytical Chemistry 343, 366-369.
Evans, K. L., Tarter, J. G. & Moore, C. B. 1981. Pyrohydrolytic-Ionchromatographic determination offluorine, chlorine and sulfur in geological samples. Analytical chemistry 53,925-928.
Fairbairn, H.w. 195i. A cooperative investigation of precision and accuracy in chemical, spectrochemicatand modal analysis of silicate rocks. U.S. Geological Survey, Bulletin 980. 7l p.
Fabbri, B. & Donad, F. 1981. Sample fusion at low temperature for the potentiometric determination offluorine in silicate materials. Analyst 106, 1338-1341.
Flanagan, F.J. 1984. Three USGS mafic rock reference samples, W-2, DNC-ISurvey, Bulletin 1623. 54 p.
and BIR-1. U.S. Geological
Flanagan, F.J. & Kirschenbaum, H. 1984. Precision of classical rock analysis. Geostandards Newsletter g.7-Lt.
Flock, J. & Koch, K. 1993. Spectrophotometric determination of iron(Il) and total iron with 2,4,6-uis-(2-pyridyl)-1,3,5-triazine in iron ores and related industrial products. Journal of Analytical Chemistry 346, 667-670.
Friu, S.F. & Popp, R.K. 1985. A single-dissolution technique for determining FeO and FerO. in rock andmineral samples. American Mineralogist 70, 961-968.
Fuchs, L.H., Olsen, E. & Jensen K.J. 1973. Mineralogy, mineral-chemistry, and composition of theMurchison (c2) meteorite. smithsonian contributions to the Earth Sciences 10. 39 p.
Fudali, R.F. 1988. Effects of quench Methods on Fe3*/Fe2* rarios: discussion. American Mineralogist 73.1478.
Fuge, R. & Andrews, M. J. 1985. The automated photometric determination of total fluorine in mineralexploration. Journal of Geochemical Exploration 23, 293-297 .
Fuge, R., Johnson, C.C. & Phillips, W.J. 1978. An automated method for the determination of iodine ingeochemical samples. Chemical Geology 23, 255-265.
Gent, A. C. & Wilson, A. S. 1985. The determination of sulfur and chlorine in coals and oil shales using ionchromatography. Analytical Leners 18 (A6), 729-740.
40
Coscrove, M.E. 1970. Iodine in the bituminous Kimmeridge shales of the Dorset Coast, England. Geochimica et Cosmochimica Acta 34, 830-833 .
DeLong, S.E. & Lyman, P. 1981. Water capture in rapid silicate analysis . Chemical Geology 35 , 173-176.
Dittler , E. 1933 . Gesteinanalytisches Praktikum. Berlin: Walter de Gruyter & Co. 111 p.
Din, V.K. & Jones G.C. 1978. The determination of total carbon and combined water in silicates using a C,H,N elemental analyzer. Chemical Geology 23 , 347-352.
Dyar, M.D ., Naney, M.T. & Swanson, S.E. 1987. Effects of quench methods on FeH/FeH ratios : A Mössbauer and wet-chemical study. America Mineralogist 72, 792-800.
Easton, A.J. 1972. Chemical analysis of silicate rocks. Amsterdam: Elsevier Scientific Publishing Co. 258 p.
Elsheimer, H. N. 1987. Application of an ion-selective electrode method to the determination of chloride in 41 international geochemical reference materials. Geostandards Newsletter 11, 115-122.
Endo, M. , Sasaki, I. & Abe, S. 1992. Kinetic spectrophotometric determination of iron oxidation states in geological materials. Fresenius Journal Analytical Chemistry 343, 366-369.
Evans, K. L. , Tarter, J. G. & Moore , C. B. 1981. Pyrohydrolytic-Ion chromatographie determination of fluorine, chlorine and sulfur in geological sampies. Analytical Chemistry 53 , 925-928.
Fairbairn, H .W. 1951. A cooperative investigation of precision and accuracy in chemical , spectrochemical and modal analysis of silicate rocks . V.S . Geological Survey, Bulletin 980. 71 p.
Fabbri , B. & Donati, F. 1981. Sampie fusion at low temperature for the potentiometric determination of fluorine in silicate materials . Analyst 106, 1338-134l.
Flanagan, F.J. 1984. Three VSGS mafic rock reference sampies, W-2, DNC-l and BIR-l. V .S. Geological Survey, Bulletin 1623 . 54 p.
Flanagan, F.J. & Kirschenbaum, H. 1984. Precision of c1assical rock analysis . Geostandards Newsletter 8, 7-1l.
Flock, J . & Koch, K. 1993. Spectrophotometric determination of iron(II) and total iron with 2,4,6-tris-(2-pyridyl)-I,3,5-triazine in iron ores and related industrial products . Journal of Analytical Chemistry 346 , 667-670.
Fritz, S.F. & Popp, R.K. 1985. A single-dissolution technique for determining FeO and Fe20 3 in rock and mineral sampies. American Mineralogist 70, 961 -968.
Fuchs, L.H., Olsen, E. & Jensen K.J. 1973. Mineralogy, mineral-chemistry, and composition of the Murchison (C2) meteorite . Smithsonian Contributions to the Earth Sciences 10. 39 p.
Fudali, R.F. 1988. Effects of quench Methods on FeH/FeH ratios : discussion. American Mineralogist 73 . 1478.
Fuge, R. & Andrews, M. J. 1985. The automated photometric determination of total fluorine in mineral exploration. Journal of Geochemical Exploration 23,293-297.
Fuge, R. , Johnson, C.c. & Phillips, W.J. 1978. An automated method for the determination of iodine in geochemical sampies. Chemie al Geology 23 , 255-265.
Gent, A. C. & Wilson, A. S. 1985. The determination of sulfur and chlorine in coals and oil shales using ion chromatography. Analytical Letters 18 (A6), 729-740.

4I
Govindaraju, K. 1989. 1989 compilation of working values and sample description for 272 geosandards.
Geostandards Newsletter 13, Special Issue. 113 p.
Govindaraju, K. 1994. 1994 compilation of working values and sample description for 383 geostandards.
Geostandards Newslener 18, Special Issue. 158 p.
Graff, P.R. 1983. Bestemmelse av FeO i geologisk materiale. Norges Geologiska Undersökelse 388, 9-12.
Graham, A.L., Bevan, A.W.R. & Hutchison, R. 1985. Catalogue of meteorites4. ed. Letchworth: BritishMuseum (Nanrral History), p.224.
Gustafsson, T. & Saikkonen, R. 1993. Kivi- ja mineraalianalyysitietokanta KALTIE, Käyttäjän opas,
Geologian tutkimuskeskus, Moniste 2. [Rock and mineral analysis data base, KALTIE, user's manual.
Geological Survey of Finlandl 11 p. and 7 app. (In Finnish).
Habasky, M.G. 1961. The quantitative determination of metallic iron oxides in treated iron ores and slags.
Analytica Chemistry 33, 586-588.
Hall, G. E. M., Maclaurin, A. I. & Valve, J. 1986. The analysis of geological materials for fluorine,
chlorine and sulphur using pyrohydrolysis and ion chromatography. Journal ofGeochemical Exploration 26,
177-186.
Hall, G. E. M. & Vaive, J. 1989. Comparison of the determination of sulfur in geological materials by
pyrohydrolysis and ion chromatography with other production - oriented methods. Geological Survey ofCanada, Paper 89-IF, 17-21.
Heumann, K. G., Schrödl, W. & Weiss, H. 1983. Massenspektrometrische und Elekuochemische Bromid-
Spurenbestimmung in geochemischen Standard-Referenzmaterialen. Analytical Chemistry 315, 213-216.
Hey, M.H. 1973. Mineral analysis and analysts. Mineralogical Magazine 39, 4-24.
Hillebrand, W.F., Lundell, G.E.F., Bright, H.A. & Hoffman, J.I. 1953. Applied inorganic analysis. 2nd ed.
New York: John Wiley & Sons. 814 P.
Hoffstener, A., Troll, G. & Matthies, D. 1991. Determination of trace amount of fluorine, boron and
chlorine from a single sodium carbonate fusion of small geological sample masses. Analyst 116, 65-67.
Hughes, T.C. & Hannaker, P. 1978. An analytical scheme for chondritic meteorites' Meteoritics 13' 89-100.
Huka, M. & Rubeska, l. lgg3. Relation between volatile components and loss on ignition as applied to the
analysis of USGS reference Devonian Ohio shale SDO-l and rare earth element analyses. U'S. Geological
Survey Bulletin 2046, ChaPter E.
Hutchison, C. S., 1974. Laboratory handbookof petrographictechniques. New York: JohnWiley & Sons.
311 p.
Jackson, L.L., Brown, F.M. & Neil, S.T. 198?. Major and minor elements requiring individual
determination, classical whole rock analysis, and rapid rock analysis. U.S. Geological Survey Bulletin 1770'
Chapter Gl.
Jarosewich, E. 1966. Chemical analysis of ten stony meteorites. Geochimica Cosmichimica Acta30,126l'
1265.
Jarvis, I. & Jarvis, K.E. lgg2. Inductively coupled plasma-atomic emission spectrometry in exploration
geochemistry. Journal Geochemical Exploration 44, L39-2O0'
Jeffery, p.G. & Hutchison, D. 1983. Chemical methods of rock analysis, 3nd ed. Oxford: Pergamon Press-
379 p.
Johnson, W.M. 1993. Quality control and quality assurance. In: Riddle, C. (ed.) Analysis of Geological
Materials. New York: Marcel Dekker lnc-'343-376.
41
Govindaraju, K. 1989. 1989 compilation of working values and sampie description for 272 geostandards. Geostandards Newsletter 13, Special Issue. 113 p.
Govindaraju , K. 1994. 1994 compilation of working values and sampie description for 383 geostandards. Geostandards Newsletter 18, Special Issue . 158 p.
Graff, P .R. 1983 . Bestemmeise av FeO i geologisk materiale . Norges Geologiska Undersökelse 388, 9-12 .
Graham, A.L., Bevan, A.W.R. & Hutchison, R. 1985. Catalogue of meteorites 4. ed. Letchworth: British Museum (Natural History), p. 224 .
Gustafsson, T. & Saikkonen, R. 1993. Kivi- ja mineraalianalyysitietokanta KALTIE, Käyttäjän opas, Geologian tutkimuskeskus, Moniste 2. [Rock and mineral analysis data base , KALTIE, user 's manual. Geological Survey of Finland] 11 p . and 7 app . (In Finnish) .
Habasky , M.G. 1961. The quantitative determination of metallic iron oxides in treated iron ores and slags. Analytica Chemistry 33 , 586-588 .
Hall, G. E. M., MacLaurin, A. I. & Valve , J. 1986. The analysis of geological materials for fluorine, chlorine and sulphur using pyrohydrolysis and ion chromatography. Journal of Geochemical Exploration 26, 177-186.
Hall, G. E. M. & Vaive, J. 1989. Comparison of the determination of sulfur in geological materials by pyrohydrolysis and ion chromatography with other production - oriented methods . Geological Survey of Canada, Paper 89-IF, 17-21.
Heumann, K. G., Schrödl, W. & Weiss, H. 1983. Massenspektrometrische und Elektrochemische BromidSpurenbestimmung in geochemischen Standard-Referenzmaterialen. Analytical Chemistry 315, 213-216.
Hey , M .H. 1973. Mineral analysis and analysts. Mineralogical Magazine 39, 4-24.
Hillebrand, W.F. , Lundell, G.E.F., Bright, H.A. & Hoffman, J.I. 1953 . Applied inorganic analysis. 2nd ed. New York: John Wiley & Sons. 814 p.
Hoffstetter, A., Troll, G. & Matthies , D. 1991. Determination of trace amount of fluorine , boron and chlorine from a single sodium carbonate fusion of small geological sampie masses. Analyst 116, 65-67.
Hughes, T.C. & Hannaker, P. 1978. An analytical scheme for chondritic meteorites. Meteoritics 13 , 89-100.
Huka , M. & Rubeska, I. 1993. Relation between volatile components and loss on ignition as applied to the analysis of USGS reference Devonian Ohio shale SDO-1 and rare earth element analyses . U.S. Geological Survey Bulletin 2046 , Chapter E.
Hutchison, C. S., 1974. Laboratory handbook of petrographic techniques. New York: lohn Wiley & Sons. 311 p.
Jackson, L.L. , Brown, F .M. & Neil , S.T. 1987. Major and minor elements requmng individual determination, classical whole rock analysis, and rapid rock analysis. U.S. Geological Survey Bulletin 1770, Chapter GI.
Jarosewich, E. 1966. Chemical analysis of ten stony meteorites. Geochimica Cosmichimica Acta 30, 1261-1265.
Jarvis, I. & Jarvis, K.E. 1992. Inductively coupled plasma-atomic emission spectrometry in exploration geochemistry. Journal Geochemical Exploration 44, 139-200.
Jeffery, P.G. & Hutchison, D. 1983. Chemical methods of rock analysis, 3nd ed. Oxford: Pergamon Press. 379 p.
Johnson, W.M. 1993. Quality control and quality assurance. In: Riddle, C. (ed .) Analysis of Geological Materials. New York: Marcel Dekker Inc. , 343-376.

42
Johnson, W.M. & Maxwell J.A. 1981. Rock and mineral analysis, 2nd ed. New York: John Wiley & Sons.489 p.
Kane, J.K. & Skeen, C.J. 1993. A study to determine sources of inter- laboratory variability in measured losson ignition (LOI) for Devonian Ohio shale SDO-I. U.S. Geological Survey, Bulletin 2046, Fl-8.
Kennedy, W. T., Hubbard, W. B. & Taner J. G. 1983. Rapid analysis of fluorine in geological samples withion chromatographic detection. Analytical Leners 16, l133-1148.
King, B-S. & Vivit, D. 1988. Loss-on-ignition corrections in the XRF analysis of silicare rocks. X-RaySpectrometry 17, 145-147.
Kirschenbaum, H. 1983. The classical chemical analysis of silicate rocks - the old and the new. U.S.Geological Survey Bulletin 1547. 55 p.
Kiss, E. 1977. Rapid potentiometric determination of the iron oxidation state in silicates. Analytica ChimicaActa 89. 303-314.
Kiss, E. 1984. Investigation of some asymmetric triazines as reagents for the spectrophotometricmicrodetermination of the iron oxidation state in silicates. Analydca Chimica Acta 16l, 231-244.
Kiss, E. 1987. Integrated scheme for micro-determination of iron oxidation state in silicates and refractoryminerals. Analytica Chimica Acta 193, 5l-60.
Kuzuhisa, Y. 1979. Determination of water content in muscovites containing large amounts of fluorine byKarl Fisher titration after fusion with silicon dioxide. Analytica Chimica Acta 110, 233-243.
Koljonen, T. L992. The geochemical atlas of Finland, Part2., Titl. Espoo: Geological Survey of Finland.2LB p.
Langenauer, M., Krägenbuhl, U., Furrer, V. & Wynenbach, A. 1992. Determinarion of fluorine, chlorine,bromine and iodine in seven geochemical reference samples. Geostandards Newsletter 16,4145.
Langmyr, F.J. & Graff, P.R. 1965. Contribution to the analytical chemistry of silicate rocks: a scheme ofanalysis for eleven main constituents based on decomposition by hydrofluoric acid. Norges GeologiskeUndersökelse 230, 128 p.
Lechler, P.J. & Desilets, M.O. 1987. A review of the use of loss on ignition as a measurement of totalvolatiles in whole-rock analysis. Chemical Geology 63,34I-344.
Leoni, L., Menichini, M. & Saitta, M. 1982. Determination of S, Cl and F in silicare rocks by X-Rayfluorescence analyses. X-Ray Spectrometry ll, 156-158.
Leventhal, J.S. & Shaw, E.V. 1980. Organic matter in Appalachian Devonian black shale: I Comparison oftechniques to measure organic carbon. II Short range organic carbon content variations. Journal ofSedimentary Petrology 50, 77 -8I.
Lightfoot, P.C. 1993. The interpretation of geoanalytical data in analysis of geological marerials. In: Riddle,C (ed.) Analysis of geological materials. New York: Marcel Dekker [nc.,377455.
Longerich, H.P. 1995. Analysis of pressed pellets of geological samples using wavelength-dispersive x-rayfluorescence spectrometry. X-Ray spectrometry 24, 123-L36.
Loukola-Ruskeeniemi, K. 1992. Geochemistry of Proterozoic metamorphosed black shales in eastern Finland.with implications for exploration and environment südies. Geological Survey of Finland, Miscellaneouspublications, 97 p. (Academic dissertation).
Maxwell, J.A. 1968. Rock and mineral analysis. New York: Interscience Publishers. 460 p.
42
Johnson , W .M. & Maxwell J.A. 1981. Rock and mineral analysis, 2nd ed. New York: John Wiley & Sons. 489 p.
Kane , J.K. & Skeen, C.J. 1993. A study to determine sources of inter- laboratory variability in measured loss on ignition (LOI) for Devonian Ohio shale SDO-1. U.S. Geological Survey, Bulletin 2046 , FI-8 .
Kennedy , W. T. , Hubbard, W. B. & Tarter J. G. 1983. Rapid analysis offluorine in geologie al sampIes with ion chromatographie detection. Analytical Letters 16, 1133-1148.
King, B-S . & Vivit, D. 1988. Loss-on-ignition corrections in the XRF analysis of silicate rocks . X-Ray Spectrometry 17 , 145-147.
Kirschenbaum, H. 1983 . The classical chemical analysis of silicate rocks - the old and the new. U.S. Geological Survey Bulletin 1547. 55 p.
Kiss, E. 1977. Rapid potentiometrie determination of the iron oxidation state in silicates . Analytica Chimica Acta 89, 303-314 .
Kiss , E. 1984. Investigation of some asymmetrie tnazmes as reagents for the spectrophotometric microdetermination of the iron oxidation state in silicates. Analytica Chimica Acta 161,231-244.
Kiss, E. 1987. Integrated sehe me for micro-determination of iron oxidation state in silicates and refractory minerals . Analytica Chimica Acta 193, 51-60.
Kuzuhisa, Y. 1979. Determination of water content in muscovites containing large amounts of fluorine by Karl Fisher titration after fusion with silicon dioxide . Analytica Chimica Acta 110, 233-243 .
Koljonen, T. 1992. The geochemical atlas of Finland, Part 2 ., Till . Espoo: Geological Survey of Finland. 218 p.
Langenauer, M. , Krägenbuhl, U., Furrer, V. & Wyttenbach, A. 1992. Determination offluorine, chlorine, bromine and iodine in seven geochemical reference sampies. Geostandards Newsletter 16, 41-45 .
Langmyr, F.J . & Graff, P.R. 1965 . Contribution to the analytical chemistry of silicate rocks : a sehe me of analysis for eleven main constituents based on decomposition by hydrofluoric acid. Norges Geologiske Undersökelse 230, 128 p.
LechIer, P .J. & Desilets, M.O. 1987. A review of the use of loss on ignition as a measurement of total volatiles in whole-rock analysis . Chemical Geology 63, 341-344.
Leoni, L., Menichini , M. & Saitta, M. 1982. Determination of S, CI and F in silicate rocks by X-Ray fluorescence analyses. X-Ray Spectrometry 11, 156-158.
Leventhal, J.S. & Shaw, E.V. 1980. Organic matter in Appalachian Devonian black shale : I Comparison of techniques to measure organic carbon. II Short range organic carbon content variations. Journal of Sedimentary Petrology 50, 77-81.
Lightfoot, P.C. 1993. The interpretation of geoanalytical data in analysis of geological materials. In: Riddle, C (ed.) Analysis of geological materials . New York: Marcel Dekker Inc . , 377-455.
Longerich, H.P . 1995. Analysis of pressed pellets of geological sampIes using wavelength-dispersive x-ray fluorescence spectrometry. X-Ray spectrometry 24, 123-136.
Loukola-Ruskeeniemi, K. 1992. Geochemistry ofProterozoic metamorphosed black shales in eastern Finland, with implications for exploration and environment studies. Geological Survey of Finland, Miscellaneous publications , 97 p. (Acadernie dissertation) .
Maxwell, J.A. 1968 . Rock and mineral analysis. New York: Interscience Publishers. 460 p.

43
Moore. W. M. 1979. Voltametric determination of iron (II) & iron (III) in standard rocks and other
materials. Analytica Chimica Acta 105, 99-107.
Moss, A.A., Hey, M.H. & Bothwell,D.I. 1961. Methods for the chemical analysis of meteorites. 1.
Siderite s. Mineralogical Magazine 32, 802-816.
Moss, A.A., Hey, M.H., Elliot, C.J. & Easton, A.J. 1967. Methods for the chemical analysis of meteorites.
2. The major and some minor constituents of chondrites. Mineralogical Magazine 36, 101-119.
Mueller, R.F. 1978. fuon,26 C. In: Wedepohl, K.H. (ed.) Handbook of Geochemistry II-3. Berlin: Springer-
Verlag. p.26 C-L.
Mueller, R.F. & Saxena, S.K. 1977. Chemical petrology. New York: Springer-Verlag. 491 p.
peck, L.C- 1964. Systemaric analysis of silicates. U.S. Geological Survey Bulletin L170. 120 p'
pons, P.J. 1987. A handbook of silicate rock analysis. Glasgow: Blackie & Sons Ltd. 670 p.
pons, p. J. 1993. Laboratory methods of analysis. In: Riddle, C. (ed.) Analysis of Geological Materials.
New York: Marcel Dekker, lnc., 123-220.
pons. p.J., Tindle, A.G. & Webb, P.C. 1992. Geochemical reference material compositions. Great Britain:
Whinles Publ. 146 P.
pons, p.J. & Webb, P.C. lgg2. X-ray fluorescence specrometry. Journal Geochemical Exploration, Special
Issue 44. 396 p.
pyen, G.S., Fishman, M.J. & Hedley, A.G. 1980. Automated colorimetric determination of bromide ions.
U. S. Geological Survey Professional Paper 1175, 245-246.
pyper, J.W. 1985. The determination of moisture in solids. A selected review. Analytica Chimica Acta 170,
159-175.
Ramsey, M.H., Potts, P.J, Webb, P.C., Watkins, P., Watson, J.S. & Coles, B-J. 1995. An objective
assessment of analytical method precision: comparation of ICP-AES and XRF for the analysis of silicate
rocks. Chemical GeologY 124, l-19.
Rice, T.D. 1982. Determination of iron(Il) in silicates by gravimetric titration. Analyst 107, 47-52.
Rice, T.D., 1988. Determination of fluorine and chlorine in geological materials by induction turnace
pyrohydrolysis and standard-addition ion-selective electrode measurement. Talanta 35, L73-178'
Rice, C.A., Tunle, M.L. & Reynolds, R.L. 1993. The analysisof formsof sulfur inancientsediments and
sedimentary rocks: comments and cautions. Chemical Geology 107' 83-95'
Richardson, J.M. 1993. A practical guide to field sampling for geological programs. In: Riddle, C. (ed.)
Analysis of Geological Materials. New York: Marcel Dekker lnc' 37-64'
Riley, J.p. 1958. Simultaneous determination of water and carbon dioxide in rocks and minerals. Analyst 83,
4249.
Roedder, E. 1984. Fluid inclusions. Reviews in mineralogy 12, Mineralogical Society of America,
Washington D.C. 644 P.
Saheurs, J-p.G., Sherwood, W.G. & Wilson, W.P. 1993. Sample preparation. In: Riddle, C. (ed-) Analysis
of Geological Materials. New York: Marcel Dekker lnc' 65-122'
Saikkonen, R. 1967. Sinkin määrääminen geologisesta materiaalista atomiabsorptiospektrofotometrillä.
Erikoistyön selostus. Helsingin Yliopisto, Kemian laitos. Manuscript, Universiry of Helsinki, Department of
Chemistry 12 p. (In Finnish).
43
Moore, W. M. 1979. Voltametric determination of iron (11) & ir on (III) in standard rocks and other materials. Analytica Chimica Acta 105, 99-107.
Moss, A.A., Hey, M.H. & Bothwell,D.I. 1961. Methods for the chemical analysis of meteorites . 1. Siderites. Mineralogical Magazine 32, 802-816.
Moss, A.A., Hey , M.H. , Elliot, C.l . & Easton, A.l. 1967. Methods for the chemical analysis of meteorites . 2 . The major and some minor constituents of chondrites . Mineralogical Magazine 36, 101-119.
Mueller, R.F. 1978 . Iron, 26 C. In: Wedepohl, K.H. (ed .) Handbook of Geochemistry 11-3. Berlin: SpringerVerlag . p. 26 C-l.
Mueller, R.F. & Saxena, S.K. 1977. Chemical petrology. New York: Springer-Verlag . 491 p.
Peck, L.C. 1964. Systematic analysis of silicates. U.S . Geological Survey Bulletin 1170. 120 p.
Potts , P.l . 1987. A handbook of silicate rock analysis . Glasgow: Blackie & Sons Ltd. 670 p .
Potts, P. 1. 1993 . Laboratory methods of analysis . In: Riddle, C. (ed .) Analysis of Geological Materials . New York : Marcel Dekker, Inc ., 123-220.
Potts, P.l ., Tindie, A.G. & Webb, P.C. 1992. Geochemical reference material compositions. Great Britain: Whittles Pub!. 146 p.
Potts, P.l . & Webb, P.C. 1992. X-ray fluorescence spectrometry. lournal Geochemical Exploration, Special Issue 44. 396 p.
Pyen, G.S. , Fishman, M.l. & Hedley, A.G. 1980. Automated colorimetric determination ofbromide ions. U. S. Geological Survey Professional Paper 1175, 245-246.
Pyper , l .W . 1985. The determination ofmoisture in solids . A selected review. Analytica Chimica Acta 170, 159-175.
Ramsey , M .H. , Potts , P.l, Webb, P.C. , Watkins, P., Watson, 1.S. & Coles, B.l. 1995. An objective assessment of analytical method precision: comparation of ICP-AES and XRF for the analysis of silicate rocks . Chemical Geology 124, 1-19.
Rice, T.D. 1982. Determination of iron(lI) in silicates by gravimetric titration. Analyst 107,47-52.
Rice, T.D., 1988. Determination of fluorine and chlorine in geological materials by induction furnace pyrohydrolysis and standard-addition ion-selective electrode measurement. Talanta 35 , 173-178.
Rice, C.A. , Tuttle, M.L. & Reynolds , R.L. 1993 . The analysis of forms of sulfur in ancient sediments and sedimentary rocks : comments and cautions. Chemical Geology 107, 83-95.
Richardson, 1.M. 1993 . A practical guide to fjeld sampling for geological programs. In: Riddle , C. (ed.) Analysis of Geological Materials. New York: Marcel Dekker Inc . 37-64.
Riley, 1.P. 1958. Simultaneous determination ofwater and carbon dioxide in rocks and minerals. Analyst 83, 42-49.
Roedder , E. 1984. Fluid inclusions. Reviews in mineralogy 12, Mineralogical Society of America, Washington D.C. 644 p.
Saheurs , l-P.G., Sherwood, W.G. & Wilson, W.P. 1993. Sampie preparation. In: Riddle, C. (ed.) Analysis of Geological Materials . New York: Marcel Dekker Inc . 65-122.
Saikkonen, R. 1967. Sinkin määrääminen geologisesta materiaalista atomiabsorptiospektrofotometrillä . Erikoistyön selostus. Helsingin Yliopisto, Kemian laitos. Manuscript, University of Helsinki, Department of Chemistry 12 p. (In Finnish) .

M
Saikkonen, R. 1968. Atomiabsorptiospektrofotometri silikaanianalyysissä. Unpublished master's thesis,University of Helsinki, Departrnent of Chemistry. 43 p. (In Finnish).
Saikkonen, R. 1969. Kivien litiumin määritys atomiabsorptiospektrofotometrillä. Unpublished paper. Espoo:Geological Survey of Finland, Chemical Laboratory, 6 p. (In Finnish).
Saikkonen, R. 1970a. Kivien strontiumin määritys atomiabsorptio- spektrofotometrillä. Unpublished paper.Espoo: Geological Survey of Finland, Chemical Laboratory, 5 p. (In Finnish).
Saikkonen, R. 1970b. Kivien rubidiumin määritys atomiabsorptiospektrofotometrillä. Unpublished paper.Espoo: Geological Survey of Finland, Chemical Laboratory, 6 p. (In Finnish).
Saikkonen, R.J. 1990. Determination of rhe combined water (HrO*) in 41 geological reference samples bya method using infrared absorption. Abstract. Geoanalysis 90, International Symposium Analysis ofGeological Material, Grandview, Canada. Geological Survey of Canada, Bulletin 451,6l-62.
Saikkonen, R. 1993. Kivinäytteiden hiili- ja vesipitoisuuden määritys koekäytössä olleella LECO RC412 ana-lysaauorilla. Espoo; Geologian tutkimuskeskus, Kemian laboratorio, raporfti 1193,5 p.,2 app. (In Finnish).
Saikkonen, R. 1994. Kivi- ja mineraalinäytteiden kemiallisiin analyyseihin liittyviä erillismääriryksiä.Unpublished licentiate thesis. Universiry of Helsinki, Department of Chemistry, 75 p. (In Finnish).
Samchuk, A.I. & Pilipenko A.T. 1987. Analytical chemistry of minerals. Utrecht: VNU Science Press.168 p.
Shapiro, L. & Brannock, W.W. 1956. Rapid analysis of silicate rocks. U.S. Geological Survey Bullerin1036-C, 19-56.
Shapiro, L. & Brannock, W.W. 1962. Rapid analysis of silicate, carbonate and phosphate rocks. U.S.Geological Survey Bulletin 1113, 343.
Shima, M. L974. The chemical compositions of the stone meteorites Yamato (a), O), (c) and (d), andNumakai. Meteoritics 9, L23-133.
Skinner, N.G., Brown, F.W. & Flanagan, F.J. 1981. The HrO* contents of some geochemical standardspredicted by a calibration line. Geostandards Newsletter 5, 3-ll.
Slavin, W. 1982. Atomic absorption spectroscopy, the present and the future. Analytical Chemistry 54, 685-694.
Stecher, O. 1983. Fluorine in twenty-two international reference rock samples and a compilation of fluorinevalues for the USGS reference samples. Geostandards Newslener 7 ,283-287.
Sulcek, Z. & Povondra, P. 1989. Methods of decomposition in inorganic analysis. Boca Raton, Florida: CRCPress Inc. 330 p.
Terashima, S. 1988. Determination of total carbon and sulfur in fifty-two geochemical reference samples bycombustion and infrared absorption spectrometry. Geostandards Newsletter 12,249-252.
Thompson, M. & Walsh, J.N, 1989. A handbook of inductively coupled plasmaspectrometry. Glasgow:Blackie Co. 320 p.
Troll, G. & Farzaneh, A. 1980. Determination of fluorine, chlorine and warer in eight USGS referencematerials. Geostandards Newsletter 4, 37 -38.
Tunle, M. L., Goldhaber, M. B. & Williamson, D. L. 1986. An analytical scheme for the determining formsofsulphur in oil shales and associated rocks. Talanra 33,953-961.
Ullman W. J. & Tisue G. T. 1983. Determination of bromine and iodine in USGS standard marine mud(MAG-l). Geostandards Newslener 7, 289-290.
44
Saikkonen, R. 1968. Atomiabsorptiospektrofotometri silikaattianalyysissä. Unpublished master 's thesis, University of Helsinki, Department of Chemistry . 43 p. (In Finnish) .
Saikkonen, R. 1969. Kivien litiumin määritys atomiabsorptiospektrofotometrillä. Unpublished paper. Espoo: Geological Survey of Finland, Chemical Laboratory , 6 p. (In Finnish) .
Saikkonen, R. 1970a. Kivien strontiumin määritys atomiabsorptio- spektrofotometrillä. Unpublished paper. Espoo: Geological Survey of Finland, Chemical Laboratory , 5 p. (In Finnish) .
Saikkonen, R. 1970b. Kivien rubidium in määritys atomiabsorptiospektrofotometrillä . Unpublished paper. Espoo : Geological Survey of Finland, Chemical Laboratory, 6 p. (In Finnish) .
Saikkonen, R.J. 1990. Determination of the combined water (H20+) in 41 geological reference sampies by a method using infrared absorption. Abstract. Geoanalysis 90 , International Symposium Analysis of Geological Material , Grandview, Canada. Geological Survey of Canada, Bulletin 451 , 61-62.
Saikkonen, R. 1993. Kivinäytteiden hiili- ja vesipitoisuuden määritys koekäytössä olleella LECO RC-412 analysaattorilla. Espoo : Geologian tutkimuskeskus, Kemian laboratorio , raportti 1193 , 5 p., 2 app . (In Finnish) .
Saikkonen, R. 1994. Kivi- ja mineraalinäytteiden kemiallisiin analyyseihin liittyviä erillismäärityksiä. Unpublished licentiate thesis . University of Helsinki , Department of Chemistry, 75 p. (In Finnish) .
Samchuk, A.I. & Pilipenko A.T. 1987. Analytical chemistry of minerals. Utrecht: VNU Science Press. 168 p.
Shapiro, L. & Brannock, W.W. 1956. Rapid analysis of silicate rocks . U.S . Geological Survey Bulletin 1036-C, 19-56.
Shapiro, L. & Brannock, W.W. 1962. Rapid analysis of silicate , carbonate and phosphate rocks. U.S. Geological Survey Bulletin 1113, 3-43 .
Shima, M. 1974. The chemical compositions of the stone meteorites Yamato (a), (b), (c) and (d), and Numakai . Meteoritics 9, 123-133.
Skinner , N.G. , Brown, F.W. & Flanagan, F.l . 1981. The H20 + contents of so me geochemical standards predicted by a calibration line . Geostandards Newsletter 5, 3-11.
Slavin, W. 1982. Atomic absorption spectroscopy, the present and the future . Analytical Chemistry 54, 685-694.
Stecher, O. 1983 . Fluorine in twenty-two international reference rock sampIes and a compilation of fluorine values for the USGS reference sampIes. Geostandards Newsletter 7 , 283-287.
Sulcek, Z. & Povondra , P. 1989. Methods of decomposition in inorganic analysis. Boca Raton , Florida: CRC Press Inc. 330 p.
Terashima, S. 1988. Determination of total carbon and sulfur in fifty-two geochemical reference sampIes by combustion and infrared absorption spectrometry. Geostandards Newsletter 12, 249-252.
Thompson, M. & Walsh, l.N . 1989. A handbook of inductively coupled plasmaspectrometry. Glasgow: Blackie Co. 320 p.
Troll , G. & Farzaneh, A. 1980. Determination of fluorine, chlorine and water in eight USGS reference materials . Geostandards Newsletter 4, 37-38.
Tuttle , M. L. , Goldhaber , M. B. & Williamson, D. L. 1986. An analytical sc he me for the determining forms of sulphur in oil shales and associated rocks. Talanta 33, 953-961.
Ullman W. l . & Tisue G. T. 1983. Determination of bromine and iodine in USGS standard marine mud (MAG-I) . Geostandards Newsletter 7, 289-290.

45
Volborth, A. 1969. Elernental analysis in geochemistry. Amsterdam: Elsevier Scientific Publication Co.373 p.
Van Loon, J.C. 1980. Analytical absorption spectroscopy. New York: Academic. 337 p.
Washington, H.S. 1932. The chemical analysis of rocks. New York: John Wiley & Sons. 334 p.
Wedepohl, K.H. (executive editor) 1978. Handbook of geochemistry I and II, Berlin: Springer-Verlag, l-5.
We strich, H.R. 1987. Determination of water in volcanic glasses by Karl-Fisher titration. Chemical Geology63,335-340.
Whipple, E. R. 1974. A Study of Wilson's determination of ferrous iron in silicates. Chemical Geology 14,
223-238.
Whipple, E.R., Speer, J.A. & Russel, C.W. 1984. Errors in FeO determinations caused by tungsten carbide
grinding apparatus. American Mineralogist 69, 987-988.
Wiik, H.B. 1956. The chemical composition of some stony meteorites. Geochimica et Cosmochimica Acta
9, 279-289.
Wiik, H.B. 1972. The chemical composition of the Haverö meteorite and the composition of the other five
ureilites. Meteoritics 7, 553-557 .
Wiik, H.W. 1975. Viisi vuotta Apollotutkimuksia. Tähtiaika 5, 4-15. (In Finnish).
Wiik, H.B. 1986. Geometric regulariry in the ratios of the stable isotopes. Commentationes Physico-
Mathematicae 77. L6 p.
Wiik, H.B. & Ojanperä, P. 1970. Chemical analyses of lunar samples 100L7, L0072 and, 10084. Science
167, 53r-532.
Wilson A.D. 1955. A new method for the determination of ferrous iron in rocks and minerals. Bulletin
Geological Survey of Great Britain 9, 56-58.
Wilson, S.A. & Gent, C.A. 1982. The Determination of fluoride in geological samples by ion
chromatography. Analytical Letters 15, 851-864.
Wuensch, B.J. 1978. Sultur, 16 A. In: Wedepohl, K.H. (ed.) Handbook of Geochemisty ll-2.Berlin: Springer-Verlag. p. 16-A-1.
Zemann, J. 1978. Carbon, 6 A. In: Wedepohl, K.H. (ed.) Handbook of Geochemistry II-1. Berlin: Springer-
Verlag. p. 6-A-1.
yuchi, A., Yanai, N., Wada, H. & Nakagawa, G. 1988. Tiron as a masking reagent for aluminium in the
determination of fluoride with an ion-selective electrode: equilibrium studies and application. Analyst 113'
1405-1408.
45
Volborth , A. 1969. Elemental analysis in geochemistry. Amsterdam: Elsevier Scientific Publication Co . 373 p.
Van Loon, I .C. 1980. Analytical absorption spectroscopy. New York: Academic. 337 p.
Washington, H.S. 1932. The chemical analysis of rocks. New York: lohn Wiley & Sons. 334 p.
Wedepohl , K.H . (executive editor) 1978. Handbook of geochemistry land II, Berlin: Springer-Verlag , 1-5 .
Westrieh, H.R. 1987. Determination of water in volcanic glasses by Karl-Fisher titration. Chemical Geology 63, 335-340.
Whippie , E. R. 1974. A Study of Wilson's determination of ferrous iron in silicates. Chemical Geology 14 , 223-238 .
WhippIe, E.R. , Speer, I .A . & Russel, C.W. 1984. Errors in FeO determinations caused by tungsten carbide grinding apparatus. American Mineralogist 69 , 987-988 .
Wiik , H.B. 1956. The chemical composition of some stony meteorites . Geochimica et Cosmochimica Acta 9,279-289 .
Wiik, H.B. 1972. The chemical composition of the Haverö meteorite and the composition of the other five ureilites . Meteoritics 7, 553-557 .
Wiik , H.W. 1975. Viisi vuona Apollotutkimuksia. Tähtiaika 5, 4-15 . (In Finnish) .
Wiik, H.B . 1986. Geometrie regularity in the ratios of the stable isotopes. Commentationes PhysicoMathematicae 77 . 16 p.
Wiik , H.B. & Ojanperä, P. 1970 . Chemical analyses of lunar sampies 10017, 10072 and, 10084. Science 167, 531-532 .
Wilson A.D. 1955. A new method for the determination of ferrous iron in rocks and minerals . Bulletin Geological Survey of Great Britain 9, 56-58.
Wilson, S.A. & Gent, C.A. 1982. The Determination of fluoride in geological sampies by ion chromatography . Analytical Leners 15 , 851-864.
Wuensch , B.I. 1978. Sulfur, 16 A. In: Wedepohl, K.H. (ed.) Handbook of Geochemistry 11-2. Berlin: Springer-Verlag . p. 16-A-1.
Zemann, I . 1978. Carbon, 6 A. In: Wedepohl, K.H. (ed.) Handbook of Geochemistry 11-1. Berlin: SpringerVerlag. p. 6-A-1.
Yuchi , A., Yanai , N. , Wada, H. & Nakagawa, G. 1988. Tiron as a masking reagent for aluminium in the determination of fluoride with an ion-selective electrode : equilibrium studies and application. Analyst 113, 1405-1408.

Appendix.choieIMp6itb!oldtni@|!rnpbm|y$dbyRir.s.irbß'AIr!yti5lfIId'nodifEdc|s5k'maio6gmiM.l!rinÜic'.dorimÜic)'mic'üdpthnd.nf!Fliicdn!.
SlOr TIO, ALOr FerOr FeO MnO MgO CaO NarO KrO pro, CO, HrO* HrO. F CI Li:O RbrO CsrO B€O SrO BaO CrrO, NiO BrO,
0.680.680.760.71
0.r3 0.t90.19 0.160.07 0.7114.07 0.100.10 0.340.1 I 0.960.04 L t00.10 0.9236.18 0.0411.02 t.700.03 0.040.0? 0. r00.lE 0.060.13 0.040.07 0.590.19 0.380.540.060.05I1.28 1.250.00 0.450.16 0.294.350.64 0.010.10 0.020.10 0.030.09 0.01
0.t20.140,120.23
9.42 0.008.44 0.079.66 0.030.16 0.00o.zt 0.010. t 8 0.000.06 0.030.23 0.030.0s 0.0s1.25 0.000.05 0.002.52 0.071.63 0.14t.46 0.130.13 0.000.26
0.03 0.0010.64 0.038.97 0.00
0.01 0.010.02 0.000.0t 0.130.02 0.02
2.04,1.59,
1.49,
l 3E,
0.00 1.650.00 3.28
3.64s.33
0.00 t.2t0.00 1.59
0.00 7.060.00 2.t20.00 0.160.00 r.26
0.00 I 1.550.00 t2.300.00 t2.440.00 0.08
0.00 4.063.91
0.00 2.50
t.57 5.271.90 4.823.13 4.893.27 4.800.87 4.881.48 4.911.83 5.04o.99 5.150.88 5.160.5t 4.940.77 5.200.54 5.ZO
0.I I 4.360.16 t.290.10 2.000.41 0.390.330.33 0.000. l50.100.000.08
0.06 0.00 0.020.ol 0.00 0.020.06 0.00 0.030.07 0.00 0.02t.l9 0.900.31 0.310.03 0.o22.32
0.30 0.00 0.020.15 0.01 0.00
7.49 0.00 0.00
0.01 0.00 0.000.0E 0.071.33 0.28 0.I I
t2.7913. l812.79
12.79
0.00 0.00.00 0.0
7.21
0.33
0.72
0.01
0.00
Silicates
l. Beryl2. Beryl3. Beryl4. Beryl5. Biotite6. Biotite7. Biothe8. Biryite9. Cordierite10. Cordieritell. Cordierite12. Cordierite13. Grossularite14. Hornblende
15. Kaolinile16. Kaolinite17. KaolinirelE. Kaolinite19. Kunzite
20. Kyanite2l. Kyanite22. Kyanite
23. Kyanite24. Margarite25. Muskovite26. Phengite
27. Pyrcpe28. Talc29. Talc
30. Talc
31. Talc32. Talc33. Talc
34. Talc
35. Talc36. Talc
37. Talc38. Talc
39. Talc
LOI Total
38.57
32.61
39.74
33.35
47.92
44.81
45.91
45.99
40.43
42.66
45.69
47.t246.4946.46
63.85
46.48
52.r435.43
38.47
30.464E.8546.4041.5658. l057.25
56.U56.17
5E.24
57.81
58.2959.6259.76
59.63
59.17
60.02
0.18t.7 |1.09
0.000.03
o.t70.060.05
0.322.68
|.280.050.100.13
0.01
0.540.280.03
0.03
0.05l.5l0.91
0.620.010.020.02
0.4
18.90 5.82t8.n 7.6tt7.40 0.3234.61
34.34 1.2033.1I |.5031.53 2.3731.52 2.t221.95 0.15,11.40 2.97
37.08 1.86,
36.64 0.8337.6 0.7738.01 0.6227.72 0.16,48.3 1.50,
4t .2 1.00,
62.20 0.40,59.16 0.4q5l.l? 0.t530.51 0.4026.73 t.2623.s9 L.sr0.69 0.061.00 0.430.7t 0.ll0.73 0.220.36 2.15,0.47 2.3410.49 2.39,0.51 1.41,
0.59 1.46,
0.57 t.42,0.76 r.44,0.64 1.38,
19.53 0.60 0.o224.53 0.34 0.22o.l2 0.00 26.t4|.23, 0.00 1.846.92 0.23 8.4115.72 t.Oz 0.89t0.45 1.91 3.5710.73 0.90 3.96
0.25 0.5616.04 0.20 9.03
0.00 0.05o.42 0.02 0.220.13 0.01 o.2r0.14 0.01 0.16
0.16 0.05
0.200.43
0.01 0.160.01 0.30
0.18 0.00 0.650.0t 3.07
5.63 0.16 2.706.81 O.32 20.ss2.26 0.01 30.972.26 0.01 3t.522.62 0.01 3t.392.4r 0.0t 31.40
30.39
30.88
31.33
3t.633l.6331.70
31.83
3t.33
0.000.29 0.440.l3 3.62
0.03
0.20 0.0
0.00 0.1E
0.00 0.03
0.0s 0.00
r.39
0.15 0.180.26 0.200.23 0.19
99.85
99.6810{J.24
t00.86l0t.3lr00.3999.59
100.51
100. l4100.29
t3.72 99.8099.65
99.68
99.73
100.34
98.29
98.42
9.49100.3E
99,79
100.70
99.64
99.68
100.05(8.09) 99.575.706.366.8r
0.000.000.02
Appendix. Chemieal eomposition of 63 mineral sam pies analysed by Risto Saikkonen. Analytieal methods: modified c1assical methods (gravimetrie, titrimetrie, colorimetrie), atOll1ie absorption and emission speetrometrie methods and other mcthods .
Silicates
I. Beryl 2. Beryl 3. Beryl 4 . Beryl 5. Biotite 6. Biolite 7. Biotite 8. Bityite 9. Cordierite 10. Cordierite 11. Cordierite 12. Cordierite 13 . Grossularitc 14 . Hornblende 15. Kaolinite 16. Kaolinite 17. Kaoli nite 18. Kaolinite 19. Kunzite 20. Kyanite 21. Kyanite 22 . Kyanite 23. Kyanite 24 . Margarite 25. Muskovite 26 . Phengite 27. Pyrope 28. Tale 29. Tale 30. Tale 31. Tale 32. Tale 33 . Tale 34. Tale 35. Tale 36. Tale 37 . Tale 38 . Tale 39 . Tale
510, TiO, AI,O, Fe,O, FeO MnO MgO CaO Na,O K,O P,O, CO, ",0' ",0- F
38.57 0. 18 18.90 5 .82 32.61 1.71 18.90 7.67 39.74 1.09 17.40 0 .32 33 .35 0.00 34 .61 47 .92 0 .03 34 .34 1.20 44 .81 0.17 33 . 11 1.50 45 .91 0.06 31.53 2.37 45 .99 0.05 31 .52 2.12 40.43 0.32 21.95 0.15, 42 .66 2.68 11 .40 2 .97 45 .69 1.28 37.08 1.86, 47 .12 0.05 36.64 0.83 46.49 0 .10 37.66 0.77 46.46 0.13 38.01 0 .62 63.85 0.01 27.72 0.16, 46.48 0.54 48 .3 1.50, 52.14 0.28 41.2 1.00, 35.43 0.03 62.20 0.40, 38.47 0.03 59.16 0.40, 30.46 0.05 51.17 0.15 48.85 1.51 30.51 0.40, 46.40 0.91 26.73 1.26 41.56 0 .62 23.59 1.51 58. 10 0.01 0.69 0.06 57 .25 0.02 1.00 0.43 56.44 0.02 0.71 0.11 56.17 0.02 0.73 0.22 58.24 0.36 2.15, 57.81 0.47 2 .34, 58.29 0.49 2.39, 59.62 0.51 1.41, 59.76 0.59 1.46, 59 .63 0.57 1.42, 59.17 0.76 1.44, 60.02 0.64 1.38,
19.53 0.60 0.02 24 .53 0 .34 0.22 0 .12 0.00 26.14 1.23, 0.00 1.84 6.92 0.23 8.41
15 .72 1.02 0 .89 10.45 1.91 3.57 10.73 0.90 3.96
0.25 0.56 16.04 0.20 9.03
0 .00 0 .05 0.42 0.02 0.22 0.13 0.01 0.21 0.14 0.01 0.16
0.16 0.05 0.20 0.43
0.01 0 .16 0.01 0.30
0.18 0.00 0.65 0.01 3.07
5.63 0.16 2.70 6.81 0.32 20.55 2.26 0.01 30.97 2.26 0.01 31.52 2.62 0.01 31.39 2.41 0 .01 31.40
30.39 30.88 31.33 31.63 31.63 31.70 31.83 31.33
0 .68 0 .68 0 .76 0 .71
0. 13 0 . 19 0 .19 0 .16 0.07 0 .71
14 .07 0 .10 0.10 0 .34 0 .11 0 .96 0.04 1.10 0 .10 0 .92
36.18 0.04 11.02 1.70 0.03 0 .04 0.07 0 .10 0.18 0.06 0.13 0.04 0 .07 0 .59 0.19 0.38 0 .54 0 .06 0 .05 11.28 1.25 0.00 0.45 0 .16 0.29 4.35 0.64 0.01 0 .10 0 .02 0.10 0 .03 0.09 0.01
0.12 0.14 0. 12 0.23 9.42 0 .00 8.44 0.07 9.66 0.03 0 .16 0.00 0 .21 0.01 0 .18 0.00 0.06 0.03 0.23 0.03 0.05 0.05 1.25 0.00 0 .05 0 .00 2.52 0.07 1.63 0.14 1.46 0.13 0 .13 0 .00 0 .26
0.03 0.00 10.64 0.03 8.97 0.00
0.01 0.01 0 .02 0.00 0.01 0.13 0.02 0.02
0.00 0.00
0 .00 0 .00 0.00 0 .00 0.00 0.00
0.00 0.00 0.00 0 .00
0.00
0.00
1.57 1.90 3.13 3.27 0.87 1.48 1.83 0.99 0.88 0.51 0.77 0 .54
2.04, 1.58, 1.48, 1.38, 1.65 3.28 3.64 5.33 1.27 1.59 2.06 2.12 0.16 1.26
11.55 12.30 12.44 0 .08
4.06 3.91 2.50
5.27 4 .82 4 .89 4.80 4.88 4.91 5.04 5.15 5. 16 4.94 5.20 5.20
0. 11 0. 16 0. 10 0.41 0.33 0.33 0 .15 0 .10 0 .00 0.08
0.00 0.00 0.02
0.00 0.29 0 .13
0 .03
4 .36 1.29 2.00 0 .39
0.00
0.44 3.62
Cl S Li,O Rb,O Cs,O BeO SrO BaO Cr,O, NiO B,O, LOI Total
0.06 0.04 0.06 0 .07 1.19 0.31 0.03 2.32
0 .30 0 .15
7.49
0.01 0.08 1.33
0 .00 0.02 0.00 0.02 0.00 0.03 0.00 0 .02 0.90 0 .31 0 .02
0.00 0.02 0 .01 0.00
0.00 0.00
0.00 0.00 0.07 0.28 0.11
12.79 13.18 12.79 12.79
7.21
0.33 0 .72
0.00
0.00 0.0 0 .00 0 .0
0.01
0 .20 0.0
0.00 0 .18
0.00
0.05
1.39
0 .15 0.26 0.23
0.03
0 .00
0 .18 0.20 0.19
99.85 99.68 100.24 100.86 101.31 100.39 99.59 100.51 100. 14 100.29
13 .72 99.80 99.65 99.68 99.73
100.34
98.29 98.42 99.49 100.38 99 .79 100.70 99.64 99.68 100.05
(8.09) 99.57 5.70 6.36 6.81

Appendix
Silicates40. Turmalin41. Turmalin42. Turmalirt43. Turnralin44. Turmalin45. Turmalin46. Turrnalin47. Vermiculite48. Zoisite
(Tanzanite)
Oxides49. Brokite50. Rutile
Phosphates
51. Antplygonile52. Apatite
53. Apatite54. Apatite
55. Apatite56. Apatile57. Apatite58. Apathe
59. Eosphorite
60. Herderile
61. Trifylite-litiofilite
62. Triplile
Sulfat€s63. Selestine
Nui|h.r sr{ in tü. drd* or OSF (GltritlM & S.ldom lta) (h Fioiitn):
Ahd|lmmimlg.Dl6'iIshi.h|.5dfd3o.@liMhrwb6le|'cdb,th.pE'aü.r'e,|bit6''l|Iit6''dlrpiB'a!{ik'bhtl6'b'ü'gkjB,dii6'itMiEr, trolinitd. l.oilolit6. merlta, miceliG, pkg@ldd, pyriB, queÄ, .idcd6, $.d'i|l1ß, Elc!, t !.u {d 6liB
sior Tio,
36.19 0.27
35.25 0.27
35.26 0.2235.13 0.1036.E2 0.m36.85 0.0238.38 0.03
38. 14 l.s3
39.99 0.05
Alro, Fero,
36.7't 8.96,35.28 13.26.37.99 10.94,
38.83 7.15,
f2.27 2.59,41.21 0.23,41.91 0.40,
16.59 0.30
34.24 0.06,
0.32 0.63,0.32 r.52,
34.70 0.001.11,
0.43,0.53,
0.36,0.66,
1.56,
0.23 1.05,
24.s0 0.220.19 0.17,
0.22 t.u0.09 1.66
0.10 L960.19 2.26l.5l t.740.38 |.740.14 | .76
1.41 0.33
24.40 0.09
K,o &q
0.06 0.000.06 0.000.06 0.000.06 0.000.06 0.m0.18 0.000.45 0.000.15 0.03
0.06 0.07
FeO MnO MgO CaO NerO
0.14 4.690.20 2s20.25 0.621.08 0.37
0. 14 I 1.03
r.26 0.12
0.41 0.43
0.11 0.01 23.09
0.04 0.04
0.01 0. t00.03 0.07
0.00 0.00 0.000.04 0.77
0.02 0.500.03 0.570.01 0.03
0.02 0.340.07 0.190.69
1.98 24.30 0.00o.29
29.37 t3.39 0.68t5.47 44.55 0.10
cq Hro'
0.00 2.590.00 2.6r0.00 2.840.00 2.740.00 z.ffi0.00 3.060.00 3.22
0.00 10.41
0.00 l.l5
HrO F Cl
0.03 0.150.l I 0.35
0.04 0.97
0.04 l.l80.04 0.53
0.08 1.04
0.09 0.93
7 .56 1.60
0.01 0.02
LitO RbrO CsrO BeO SrO BaO
0.01
0.05
0.59I .18
0.05
t.82L86 0.03 0.040.14 0.00
0.00
9.70
0.4Eo.4z0.550.720.700.550.32
t4.81
CrrO, NiO BrQ LOI
8.78
9. 16
8.m9.03
8.22
10. l29.77
0.00 0.00
0.11
0.01
0.000.000.000.000.000.00
Y2Ot:9.24n 1*.0,
2t2.
Total
100.44
lw.72100.33
99.54
98.3099.67
99.39100.65
9E.83
99.26
99.29
0,14 0.00
1.43
0.16 0.000.40
0.01 0.29 0.02 48.5 2.80 0.00 7.24
54.0 0.17 0.03 42.9 0.68
53.8 0.13 0.02 42.3 0.41
s3.t o.22 0.07 42.7 0.73
55.2 0.t4 0.03 42.9 1.00
s4.3 0. t6 0.03 42.3 0.76
53.7 0.17 0.01 41.2 0.7951.96 0.76 0.06 3E.71 0.19 l.& 0.18 2.43
0.06 0.t5 0.02 32.95 14.26 0.02 0.41
36.24 0.77 0.08 43.21 3.28 0.00 4.21
0.06 0.07 0.03 45.99 0.00 0.02 0.02
o.37 0.00 0.02 32.39 0.00 0.88 0.00 8.00
0.83
0.00
0.30
100.32
100.2
98.699.1
100.4
99.398.2
Tl,O = 0.53% 98.5
99.82
t00.85
0.12 0.01 0.08 0.48
0.00 0.12 0.t6 0.43
0.00 0.020.960.05
9.08
SO, = 43'55 54.69 0.22
t-
Appendix SiO, TiO, Alp, Fe,O, FeO MnO MgO CaO Na,O K,o pp, CO,
Silicates 40. Turmalin 41. Turmalin 42. Turmalin 43 . Turmalin 44 . Turmalin 45 . Turm31in 46. Turmalin 47. Vermiculite 48 . Zoisite
(Tan7.anite)
Oxides 49. Brokite 50. Rutile
Phosphates 51. Amplygonite 52. Apatite 53. Apatite 54. Apat ite 55 . Apatite 56. Apatite 57 . Apatite 58. Apatite 59. Eosphorite 60. Herderite 61 . Trifylitc
litiofilite 62. Triplite
Sulfates 63 . Selestine
1 = lotal
36.19 0.27 36.77 8.96, 35 .25 0.27 35 .28 13 .26, 35 .26 0.22 37 .99 10.94, 35 .73 0.10 38.83 7.15, 36.82 0.92 32.27 2.59, 36.85 0.02 43 .21 0.23, 38.38 0.03 41.91 0.40, 38.14 1.53 16.59 0.30
39.99 0.05 34.24 0.06,
0.32 0.63, 0.32 1.52,
0.14 0.00 34 .70 0.00 1.11, 0.43, 0.53, 0.36, 0.66, 1.56,
1.43 0.23 1.05, 0.16 0.00 24.50 0.22 0.40 0.19 0.17,
0.12 0.01 0.08 0.48 0.00 0.12 0.16 0.43
0.11
0 .14 4.69 0.20 2.52 0.25 0.62 1.08 0.37 0.14 11.03 1.26 0.12 0.41 0.43 0.01 23.09
0.04 0.04
0.01 0.10 0.03 0.07
0.00 0.00 0.00 0.04 0.77 0.02 0.50 0.03 0.57 0.01 0.03 0.02 0.34 0.07 0.19 0.69
1.98 24.30 0.00 0.29
29.37 13.39 0.68 15.47 44 .55 0.10
0.22 1.64 0.09 1.66 0.10 1.96 0.19 2.26 1.51 1.74 0.38 1.74 0.14 1.76 1.47 0.33
24.40 0.09
0.01 0.29 54.0 0.17 53.8 0.13 53.7 0.22 55.2 0.14 54 .3 0.16 53 .7 0.17 51.96 0.76 0.06 0.15
36.24 0.77
0.06 0.07 0.37 0.00
0.83
Numbers stored in the dalabase of GSF (Gustafsson & Saikkonen 1994) (in Finnish):
0.06 0.06 0.06 0.06 0.06 0.18 0.45 0.15
0.06
0.00 0.00 0.00 0.00 0.00 0 .00 0.00 0.03
0.07
0.02 48 .5 0.03 42.9 0.02 42.3 0.07 42.7 0.03 42.9 0.03 42 .3 0.01 41.2 0.06 38.71 0.02 32.95 0.08 43 .21
0.03 45.99 0.02 32 .39
0.00 0.00 0.00 0.00 0.00 0.00 0.00 0.00
0.00
0.19
0.00 0.00
H,O· Hp' F
2.59 2.61 2 .84 2.74 2.60 3.06 3.22 10.41
1.15
2.80
1.04 14 .26 3.28
0.02 0.88
0.03 0.11 0.04 0.04 0.04 0.08 0.09 7.56
0.01
0.15 0.35 0.97 1.18 0.53 1.04 0.93 1.60
0.02
0.00 7.24 0.68 0.41 0.73 1.00 0.76 0.79
0.18 2.43 0.02 0.41 0.00 4.21
0.02 0.00 8.00
2/2. CI S Li,O Rb,o Cs,O DeO SrO BaO Cr,o, NiO D,O, 1-01 Total
0.00 0.02
0.01 0.05 0.59 1.18 0.05 1.82 1.86 0.14
9.70
0.96 0.05
9.08
so, = 43 .55
0.03 0.00
0.00
0.04
0.48 0.42 0.55 0.72 0.70 0.55 0.32 0.00
14.81 0.30
54.69 0.22
0.00
0.11 0 .01
8.78 100.44 9.16 100.72 8.90 100.33 9.03 99.54 8.22 98.30
10. 12 99.67 9.77 99.39
100.65
0.00 V,O, = 0.24 % 100.49
100.32 0.00 100.2 0.00 98.6 0.00 99.1 0.00 100.4 0 .00 99.3 0.00 98 .2
TI,o = 0.53 % 98 .5 99.82
100.85
98 .83 99.26
99.29
1. 71001,2. 71002, 3. 71003.4.71004.5.72101.6. 72102 . 7.840003.8.79030. 9. 72089.10. 72090.11.74126.12.74127. 13 . 840005.14. 67039. 19.81021.20.71022. 21. 71023 . 22 . 71076. 23.71077. 24. 77383.25.840004.26. 78187. 27 . 72088. 40. 73005.41. 73006. 42. 73007. 43 . 73008.44. 73009.45 . 73010.46. 73011.47 . 840001 . 48.840002. 49.71051.50. 71050,51 . 76152.52. 80025, 53.80026,54 . 80027 . 55 . 80028,56. 80029, 57 . 80030, 58. 81020, 59. 76112, 60.81022,61. 75124, 62 . 76098, 63 . 69132 .
About 100 mineral sampies, in which 1-5 elements or constituents have been analysed by the present author, are albites, allanites, antigorites, apatites, biotites, britolites, calsites, chromites , chrysotiles, cordierites. cryolites, hematites, hornblendes , kornerubines , kyanites , ilmenites, kaolinites, lepidolites, margarites, microclines , plagioclases, pyrites, quartzes , siderites, spodumenes, tales, topases, and zeoliles .


Ktsto S
aikkonAfi;C
hemlcalanalysis of rocks and m
inerals - New
anaryricar merhod,s
id"+
v
a!5J.I
t--- .A
'-)
,AV
VA
EtJ\.-^
-,\ -a
|tx=
äc
J-a ^,
'=v.__i9t-)z7,o.
g.- d
2'z *:i\'-r
t+\
2,Lr>{IJa (\i-\.('
Ns\
ISBN 951-690-617-6 « "I?p~l$ He1sinki 1996 Yliopistopaino
Pikapaino
' ~'" , r ,./v)