Chemical analyses of Illinois limestones and dolomites
40
PROPERTY, Oil PETER J. MVXifJDIj STATE OF ILLINOIS William G. Stratton, Governor DEPARTMENT OF REGISTRATION AND EDUCATION Vera M. Binks, Director 1957 CHEMICAL ANALYSES OF ILLINOIS LIMESTONES AND DOLOMITES Compiled by J. E. Lamar REPORT OF INVESTIGATIONS 200 ILLINOIS STATE GEOLOGICAL SURVEY JOHN C. FRYE, Chief URBANA, ILLINOIS
Transcript of Chemical analyses of Illinois limestones and dolomites

PROPERTY, Oil
PETER J. MVXifJDIj
STATE OF ILLINOIS William G. Stratton, Governor
DEPARTMENT OF REGISTRATION AND EDUCATIONVera M. Binks, Director
1957
CHEMICAL ANALYSES OFILLINOIS LIMESTONESAND DOLOMITES
Compiled by
J. E. Lamar
REPORT OF INVESTIGATIONS 200
ILLINOIS STATE GEOLOGICAL SURVEYJOHN C. FRYE, Chief URBANA, ILLINOIS


CHEMICAL ANALYSES OFILLINOIS LIMESTONESAND DOLOMITES
Compiled by
J. E. Lamar
ILLINOIS STATE GEOLOGICAL SURVEYReport of Investigations 200
Urbana, Illinois 1957
PRTNTED BY AUTHORITY OF THE STATE OF ILLINOIS
STATE OF ILLINOISHON. WILLIAM G. STRATTON, Governor
DEPARTMENT OF REGISTRATION AND EDUCATIONHON. VERA M. BINKS, Direcfor
BOARD OF NATURAL RESOURCESAND CONSERVATION
Hon. Vera M. Binks, Chairman
W. H. Newhouse, Ph.D., Geology
Roger Adams, Ph.D., D.Sc, Ll.D., Chemistry
R. H. Anderson, B.S., Engineering
A. E. Emerson, Ph.D., Biology
Lewis H. Tiffany, Ph.D., Pd.D., Forestry
Dean W. L. Everitt, E.E., Ph.D.,University of Illinois
PresidExVt Delyte W. Morris, Ph.D.,Southern Illinois University
GEOLOGICAL SURVEY DIVISIONJOHN C. FRYE, Ph.D., D.Sc, Chief
(47256—3M—11-56)

CHEMICAL ANALYSES OF ILLINOIS LIMESTONESAND DOLOMITES
Compiled by
J. E. LAMAR
ABSTRACTMore than 700 chemical analyses of Illinois limestones and dolomites, compiled from
both published sources and unpublished data in the files of the Illinois State Geological
Survey, are presented in a table to afford information on all the major limestone anddolomite formations of the State.
INTRODUCTION
Chemical analyses of Illinois limestones
and dolomites appear in many diverse pub-
lications, some of which are relatively old and
out-of-print and therefore no longer readily
available. In addition, many unpublished
analyses are on file at the Illinois State Geo-
logical Survey. The table of analyses herein
vyas compiled to meet a recurring need for
a single report consolidating all the afore-
mentioned data.
The purpose of the table is not to show the
chemical composition of the commercial prod-
ucts of the stone-producing plants of the
State. Rather, its objective is to present infor-
mation regarding the various rock formations
for use in evaluating the chemical character
of the limestone and dolomite resources of
Illinois. A number of the samples whose an-
alyses are given are from quarries that are
now filled with water or debris. Other sam-
ples are from outcrops or from roadcuts or
railroad cuts that were well exposed at the
time the samples were taken but have since
been obscured by earth or other materials to
the extent that their composition cannot nowbe determined satisfactorily. The table serves
to preserve information regarding these de-
posits that will be of significance in the eval-
uation of their possible future use.
Almost all the previously unpublished an-
alyses in the table have been made of samples
taken from quarry faces, natural outcrops,
road or railroad cuts, or, more rarely, from
diamond drill cores. The samples from quar-
ries do not represent commercial grades of
stone being produced by the quarries at the
time of sampling. Further, from the dates
indicating when the samples were taken, it
is evident that the samples then analyzed
from operating quarries do not represent cur-
rent commercial products because lateral ex-
pansion and/or deepening of the quarries has
since brought new parts of their deposits into
production, and at some places eliminated
other parts from production.
Analyses are given from some quarries for
stone that is impure and never has been a
part of the commercial production of the
quarries. These samples generally were taken
to determine use limitations and potentials
of the impure stone.
All analyses bear a date indicating whenthey were published, or, in the case of previ-
ously unpublished analyses, when the sample
was taken. Many analyses carry the names
of the operators of quarries from which the
samples analyzed came. A number of the
companies identified in connection with some
of the older analyses no longer exist, either
because they have gone out of business or
have been superseded by newer concerns. Theolder names are carried in the table, however,
because of their historical significance.
A large number of analyses is available for
some deposits. In some such cases a selection
of analyses has been made to avoid duplica-
tion. Where the geographic locations given
for certain samples analyzed could be more
accurately stated, this has been done. Obvi-
ous typographical errors in some published
analyses likewise have been corrected.
Many analyses report either only CaO and
MgO, or CaCOg and MgCOg. In order to
make data available for both pairs of com-
pounds, the missing figures have been calcu-
lated.
[3]

ILLINOIS STATE GEOLOGICAL SURVEY
Much of the compiling and checking of
the chemical data was done by Mrs. Miriam
Hatch and Mrs. Mary Cecil, and their valu-
able and painstaking assistance is gratefully
acknowledged.
CHEMICAL FORMULAS ANDSYMBOLS
A number of chemical formulas and sym-
bols are used in the table of analyses. Their
meanings are indicated below:
AI2O3 —aluminum oxide (alumina)
CaO —calcium oxide (lime)
CaCOa —calcium carbonate
CO2 —carbon dioxide
FeO —ferrous oxide (iron oxide)
Fe203 —ferric oxide (iron oxide)
K2O —potassium oxide (potash)
L. on ign.—loss on ignition
MgO —magnesium oxide (magnesia)
MgCOa —magnesium carbonate
MnO —manganese oxide
Na20 —sodium oxide
P —phosphorus
P2O5 —phosphorus pentoxide
R2O3 —oxides of trivalent metals, chiefly Fe203
and AI2O3
S —sulfur
SO3 —sulfur trioxide
SiOa —silicon dioxide (silica)
Ti02 —titanium dioxide (titania)
CALCIUM CARBONATE EQUIVA-LENTS
The "Calcium Carbonate Equivalent"
(CCE) of limestone and dolomite commonly
is determined by a special analytical tech-
nique rather than from the data provided by
chemical analyses such as those given in the
table. However, an approximate value for
the CCE usually may be calculated from
the data in the table by multiplying the per-
centage of MgCOg by 1.187 and adding to
the resulting product the percentage of
CaCOg.
GEOLOGIC NAMES OF FORMA-TIONS
More than 75 names of geologic forma-
tions are used to identify the rock units rep-
resented by the samples in table 2. In the
case of the published analyses these names
were applied by the sampler at the time the
samples were taken and indicate geological
usage then current. The professional stratig-
rapher will recognize certain obsolete names
but, if questions arise, the latest information
on nomenclature can be obtained by address-
ing the Illinois State Geological Survey. For
other users of the table all "formation"
names used herein are listed alphabetically in
table 1 and the geologic system of rocks to
which they belong is indicated. The sequence
of the systems, from youngest to oldest, is
as follows:
Pennsylvanian system
Mississippian system
Devonian system
Silurian system
Ordovician system
Cambrian system
Table 1.—Correlation of "Formation" Names andGeological System.
"Formation" System
Backbone DevonianBailey DevonianBainbrldge SilurianBrereton PennsylvanianBurlington MississippianBurroughs PennsylvanianCaprock No. 6 coal PennsylvanianCaprock Blair Coal PennsylvanianCedar Valley DevonianCentralia PennsylvanianChester MississippianChouteau MississippianCIncInnatlan DevonianClear Creek DevonianClore Mississippian
Decorah OrdovicianDivine OrdovicianEdgewood Silurian
Fredonia Mississippian
Galena OrdovicianGalena-Plattevllle OrdovicianGirardeau Silurian
Golconda Mississippian
Guttenberg OrdovicianHanover PennsylvanianHamilton DevonianJoachim Ordovician
Joliet Silurian
Keokuk Mississippian
Kankakee Silurian
KImmswick Ordovician
Klnderhook Mississippian
Kinkald Mississippian
Knobby Pennsylvanian
LaSalle Pennsylvanian
Livingston Pennsylvanian
Lonsdale Pennsylvanian
Macoupin Pennsylvanian
Magnesian (lower) Ordovician
Maquoketa Ordovician
Marigold Mississippian

ILLINOIS LIMESTONE AND DOLOMITE ANALYSES
"Formation" System
Maxwell PennsylvanianMcLeansboro PennsylvanianMenard Mississippian
St. Louis Mississippian
New Scotland DevonianNiagaran Silurian
Middle Richmond OrdovicianOkaw Mississippian
Onondaga DevonianOsage Mississippian
Paint Creek Mississippian
Plattin OrdovicianPlatteville OrdovicianPontiac PennsylvanianPort Byron Silurian
Prosser OrdovicianQuarry Creek PennsylvanianRacine Silurian
"Formation" System
Renault MississippianRichmond OrdovicianSalem MississippianSte. Genevieve MississippianSt. Louis MississippianSt. David PennsylvanianSeville PennsylvanianSexton Creek Silurian
Shakopee OrdovicianShoal Creek PennsylvanianSpergen MississippianStewartville OrdovicianTrempealeau CambrianVienna Mississippian
Wapsipinicon DevonianWarsaw MississippianWaukesha Silurian
yz
aabbcc
t
TABLE OF LIMESTONE AND DOLOMITE ANALYSES(p. 6-33)
FOOTNOTES
U. S. Geological Survey, 1912, Mineral resources of the U. S., Part II, 1911, p. 663-665.Bleininger, A. V., Lines, E. F., and Layman, F. E., 1912, Illinois State Geological Survey Bull. 17, p. 97
to 100.
Emley, W. E., 1913, U. S. Bureau of Standards Technologic Paper 16, p. 120.
U. S. Geological Survey Bull. 340, 1907, p. 394; same data in Illinois State Geological Survey BulL 8, 1907,
p. 355.
Geological Survey of Illinois, vol. I, 1866, p. 61, 99, 108, 134-136, 148, 256, 374.
Geological Survey of Illinois, vol. IV, 1870, p. 40.
Geological Survey of Illinois, vol. Ill, 1868, p. 117, 573, 574.
U. S. Geological Survey Bull. 522, 1913, p. 144.
Illinois State Geological Survey Bull. 8, 1907, p. 133.
Twentieth Ann. Kept. U. S. Geological Survey, Part 6, 1899, p. 377, 378, 544.
Illinois State Geological Survey Bull. 46, 1925, p. 312-33.
Analysis by Illinois State Geological Survey.
U. S. Geological Survey Prof. Paper 218, 1952, p. 156-57.
Analysis for Illinois State Geological Survey by Chemistry Department of the University of Illinois.
Illinois State Geological Survey Bull. 61, 1934, p. 57-64, 118, 142-155.
Illinois State Geological Survey Kept. Inv. 17, 1929, p. 13-16.
Illinois State Geological Survey Kept. Inv. 90, 1943, p. 88-89.
Analysis for Illinois State Geological Survey by Illinois State Highway Testing Laboratory.Illinois State Geological Survey Bull. 4, 1907, p. 179-183; calcium and magnesium carbonates estimated.
Illinois State Geological Survey Bull. 51, 1925, p. 33-34.
Illinois State Geological Survey Kept. Inv. 23, 1931, p. 17.
Illinois State Geological Survey Inf. Circ. 4, 1933, p. 4-6.
Eckel, Edwin C, 1905, Cements, Limes, and Plasters, p. 204, 314, John Wiley and Sons, New York.Illinois State Geological Survey Kept. Inv. 161, 1952, p. 4.
Illinois State Geological Survey Bull. 77, 1952, p. 76.
U. S. Geological Survey, 1913, Mineral Resources of the U. S., Part 2, p. 1558.
Cement Mill and Quarry, 1922, v. 20, no. 9, p. 20.
Illinois State Geological Survey Bull. 55, 1928, p. 105.
Rock Products, 1931, v. 34, no. 11, p. 56.
Not detectable in five grams.Figures in italics are calculated from other data in the analysis.

ILLINOIS STATE GEOLOGICAL SURVEY
Table 2.—Chemical Analyses of
SampleFormation Thick-
nessNear
Location Chemical
No. andSource H H H sec. T. R. CaC03 MgCOa Si02 Ti02 AI2O3 Fe203 R2O3
AdamsC17bC16t)ClSb
e
Salem . .
Keokuk . .
Burlington .
Burlington .
3'
30'?
Mendon .
Quincy . . .
Quincy .
Quincy . . .
W.s de
NWSW
112611
INIS2S
7W9W9W
79.3386.3277.4794.68
1.961.421.764.31
12.269.6619.78 —
3.92 —1.54 —1.94 —0.20 —
e
]
]
aa
Burlington .
Burlington .
Burlington .
Burlington .
Burlington .
— Quincy . . .
Quincy .
Marblehead .
Marblehead .
Marblehead . .
— - ——
——
71.0092.7795.6297.4097.51
24.006.750.821.401.30
0.470.400.50
—
4.00 —0.27 —2.18 —68 0.12 —52 0.12 —
z
cBuflington .
Burlington .
— Marblehead .
Marblehead .
— — — — — — 98.4598.97
1.28trace
0.210.36
— 0.04 0.10 —1.22 —
k Burlington . 20± Marblehead .— — — — — — 97.59 0.96 0.39 — 1.00
Alexander
NF4491D42b
Bainbridge .
Kimmswick .
24' 6'
35'
' McClure . .
Thebes . . .
SW SE NW 1217
14S15S
3W3W
95.0099.77
1.441.18
2.820.27
0.13 0.90 0.35 —0.32 —
D42S Kimmswick .35' Thebes . . .
— — — 17 15S 3W 97.25 — — — 0.32 —
NF4501
L571
Kimmswick .
Middle Kimms-wick .
Kimmswick .
26'22'
Thebes . . .
Thebes . . .
Thebes . . .
SE NW SESE
17
1717
15S
15S15S
3W
3W3W
98.01
99.6997.44
1.59
0.710.38
0.160.20
nil
0.20 trace —0.20 0.09 —0.10 0.25 —
L581L63A1L37n
Kimmswick .
Kimmswick .
Girardeau
28'20'25'
Thebes ...Thebes . . .
Thebes . . .— NE
SESENW
171721
15S15S15S
3W3W3W
96.9098.5490.86
0.600.554.60
0.900.323.72
— 0.36 0.10 —0.32 0.10 —— — 1 . 40
BooneDS79043q
aa
Edgewood .
Prosser &Stewartville .
Galena . .
Galena . .
Galena . .
10'
17'
38'?
Belvidere
Belvidere . .
BelvidereBelvidereBelvidere . .
NWSW
SESW
NWNENE
14 43N
8 44N34 44N
3E
3E3E
44.82
54.1653.43si.n54.59
30.90
42.6743.0044.6741.33
12.66
1.582.391.872.90
—6.35 1.52 —0.52 0.51 —— — 0.92
0.98 —0.85 —
BrownR1431C28bC26bC27b
St. LouisSt. LouisSalem . .
Salem andSt. Louis.
13'
7' 6"5'
8'
CooperstownRipleyCooperstown
Cooperstown
— NWSE cor.
— SE
NWSW
SE
204
15
15
ISININ
IN
IW2W2W
2W
86.5588.8978.90
87.43
1.002.517.81
3.01
10.345.868.36
6.62
0.20 0.43 1.30 —2.42 —3.92 —2.64 —
R1420R2001C25bC18b
Spergen . .
Keokuk . .
Salem . .
Salem . .
13' 6"12'3'
3'
CooperstownVarders Bridge .
Versailles . .
Mt. Sterling.
SE NESW NW— NESE corner
SENWSE
153136
IS2S2S2S
2W2W2W3W
46.6187.1669.5994.39
15.241.0720.071.34
30.789.825.802.96
0.000.00
2.15 2.60 —0.67 0.77 —
3.98 —1.46 —
C22bC23bC19abC19cb
Salem . .
Salem . .
Salem . .
Salem4'
20'
Surratt Hollow .
Surratt Hollow .
Mt. SterlingMt. Sterling
— — NWNW
17181818
2S2S2S2S
3W3W3W3W
82.3686.8243.3689.39
1.171.25
18.560.79
13.548.78
26.467.26
—3.10 —2.40 —
10.36 —2.40 —
C24bC21bbC20b
SalemSalem . .
Salem9'
13'
Marden .
VersaillesVersailles . .
— NWNESENW
202026
2S2S2S
3W3W3W
90.1880.8678.30
1.251.051.13
6.4415.4016.90
— 1.90 —3.10 —3.06 —
BureauElSabDxl7oDxl7AlDxl7BlCI labCUbb
LaSalle . .
LaSalle . .
LaSalle . .
LaSalle . .
LaSalle . .
LaSalle . .
. 7' 6"17'
17'
10'8'
Marquette .
Spring Valley .
Spring Valley .
Spring ValleySpring ValleySpring Valley .
NWNW
NWNWNWSWSW
SWSWSWNENE
313333333333
16N16N16N16N16N16N
HEHEHEHEHEHE
60.4257.353.1657.2951.4255.67
6.195.06.915.0211.165.89
23.3026.429.0726.426.1822.76
—
8.64 —4.8 2.7 —5.13 3.34 —4.8 2.7 —11.00 —11.10 —
CalhounRIO5I Silurian . .
R4m Joliet . .
Sexton CreekR20m ChouteauRlSm Burlington .
NF455BI Kimmswick .
NF455C1 Kimmswick .
7'
16'6'
15'
70'
24'21'
Kampsville .
HamburgHardin .
Hardin .
Batchtown .
Batchtown .
SE
NWNWNWNESW
SW
NWNESENESW
SW
SESESESENW
2
3527283132
9S
9SlOSlOSUSlis
2W
3W2W2W2W2W
95.35
95.478.9596.0099.1298.90
0.84
1.842.741.530.750.86
2.28
2.7114.902.640.420.52
0.00 0.42 1.00 —0.38 0.62 —2.02 1.24 —0.14 0.46 —0.14 0.12 —0.11 0.15 —
NF4031 Decorah . .
NF455A1 Kimmswick .
7'
18'Batchtown .
Batchtown .
NESE
SENE
NENE
66
12s12s
2W2W
80.7498.96
3.490.54
9.800.90 = 1.83 0.41 —
0.14 0.09 —
Footnotes appear on page S.

ILLINOIS LIMESTONE AND DOLOMITE ANALYSES
Illinois Limestones and dolomites
Analysis
CaO MgO Na20 K2O CO2Losson
ignition
Miscellaneous Remarks
Yearsampletaken oranalysispublished
SampleNo.
County44.46 0.9448.38 0.6843.42 0.8453.06 2.06
37.2439.9035.10
Insoluble matter 0.05.
1912191219121866
317bCl6bCl5b
39.7951.9953.5954.5854.64
11.483.230.390.670.62
Insoluble matter 1.00.Insoluble 0.37 . . .
Undetermined 0.91F. W. Menke Stone and Lime Co.Marblehead Lime Co. .
Marblehead Lime Co. .
Marblehead Lime Co. .
18661899189919121912
55.17 0.6155.46 Trace
54.65 0.46
County
Average 5 analyses ofchert-free limestone .
Marblehead Lime Co.Marblehead Lime Co.
19131913
1925 —
53.23 0.6955.91 0.56
54.50
0.04 0.22 41.95 41.99 MnO 0.044; P2O5 0.005 0-24J^' above base of Bainbridge
P-0.036Insoluble matter 0.27
19491912
1907
NF449D42
D42
54.92 0.76 —55.86 0.34 0.06
Insoluble matter 0.06;moisture 1.07 . 1866
50.82 2.20
0.01 43.53 43.44
County25.11 14.78 — — 38.39 39.4730.34 21.10 — — 46.09 —29.92 20.5529.29 21.36 — — — —30.59 19.76 — — — —County
48.50 0.48 Trace 0.40 37.52 38.1249.82 1.20 — — — 41.0244.22 3.74 — — — 40.04
49.00 1.44 — — — 40.82
26.12 7.29 0.31 0.50 30.00 30.8848.84 0.51 0.00 0.00 39.16 39.1839.00 9.60 — — — 42.2052.90 0.64 — — — 42.70
46.16 0.56 37.2648.66 0.60 — — — 39.6224.30 8.88 — — — 30.8450.10 0.38 — — — 40.10
50.54 0.60 40.7445.32 0.50 — — — 36.4043.88 0.54 — — — 35.98
County33.86 2.96 — — — 32.3832.1 2.4 — — — 30.729.79 3.30 — — 27.38 29.4132.1 2.4 — — — 30.728.82 5.34 — — — 29.5631.20 2.82 — — — 32.78
MnO 0.038; P2O6 0.034 Total . .
Lower part
Middle partUpper part
Average 2 analysesElectric Stone Co.Electric Stone Co.
S0.04
S0.06S0.07
19491928
NF450L57
192819281928
L58L63AL37
19341943
DS7943
193419121912
—
193019121912
R143C28C26
1912 C27
1930193119121912
R142R200C25C18
1912191219121912
C22C23C19aC19c
191219121912
C24C21bC20
191219341932193219121912
E15aDxl7Dxl7ADxl7BCllacub
County53.43 0.40 41.33 42.03 1930 R105
53.3644.2353.7955.5455.42
45.2455.45
0.881.310.730.360.41
1.670.26
0.100.10
0.07
0.02 43.590.02 43.53
— 36.630.03 43.35
41.8236.2842.1743.6743.56
41.0443.34
SO3 0.15SO3O.I2SO3 0.19P2O5 0.097P2O6 0.085
25'6' to 49'6'' above base of formation49'6'' to 70'6'' above base of Kimms-wick formation
P2O5 1.72 0-18' above base of Kimmswick
1952195219521950
195019361950
R4R20R15NF455B
NF455CNF403NF455A

ILLINOIS STATE GEOLOGICAL SURVEY
Table 2.-
SampleFormation Thick-
nessNear
Location Chemical
No. andSource M M M sec. T. R. CaCOs MgCOs Si02 Ti02 AI2O3 Fe203 R2O3
R29mR19mRlSmR350R34m
R33mNF172A1NF172B1NF172C1
KimmswickPlattin .
Joachim .
Niagaran.Hanover andBreretonSt. Louis.St. LouisSt. LouisSt. Louis
37' Batchtown .
50' Batchtown . ,
60' Batchtown .
22' Meppen .
8' Brussels .
39' Fruitland Landing24' 6" Fruitland Landing18' 4" Fruitland Landing16' 2" Fruitland Landing
— NW SE— NE SE— SW SE— SW SE
— SW SW— NE SWSE NE SWSE NE SWSE NE SW
17 12S 2W19 12s 2W19 12s 2W23 12s 2W
14 13S6 14S6 14S6 14S6 14S
2WIWIWIWIW
99.10 0.88 0.7486.41 11.19 2.1961.19 34.27 3.5452.00 40.29 4.82
96.9194.9889.0988.9378.02
1.321.231.923.9910.96
1.533.236.794.855.80
Calhoun0.28 0.62 —0.72 0.46 —0.60 0.94 —1.15 1.71 —0.22 0.62 —0.44 0.62 —1.64 0.52 —1.44 0.76 —1.68 3.37 —
Miq33q35q
kS9bS51abS51cbS52abS52bb
WaukeshaStewartvilleWaukeshaGalena .
McLeansboroQuarry CreekQuarry CreekQuarry CreekMcLeansboroMcLeansboro
35' Savanna .
12' Lanark .
30' Mt. Carroll— Mt. Carroll
6'
5'
5' 6"
West UnionCaseyMarshallMarshallMarshallMarshall
SE NW NWNE NE NESW SW NW
2 24N 3E1 2 4N 5E
25 25N 5E
— SE— NE— NW— NW— NW— NW
19 9N IIW28 ION 14W6 UN IIW6 UN IIW
29 UN UW29 UN UW
55.39 42.63 0.1653.71 43.28 1.2954.66 43.42 0.3354.06 43.68 1.62
97.2291.4694.4695.0096.1082.11
1.381.111.441.154.10
1.594.041.742.121.466.26
Carroll
0.25 1.37 —0.47 0.60 —0.29 0.64 —
1.12 —Clark
1.102.942.261.561.625.50
S33
S3bBlOk
Livingston .
McLeansboroMcLeansboro
Charleston
18' Charleston— Charleston— — NW 5 12N lOE
93.53 0.53
93.6759.95
2.4610.05
3.91
Coles
1.56
1.56
240 RacineNF409q Racine
FIQF29
RacineRacine
NF580 Niagaran.NF590 Niagaran.
d Niagaran
.
d Niagaran
.
a Niagaran.^ Niagaran.
220 Racine .
Dx5o Niagaran.Dx4o Niagaran.NF297A1 Niagaran.
NF297B1 Niagaran.
d Niagaran.NF960 Niagaran.
Al-AlOo Niagaran.All-Al90Niagaran.A20-A33oNiagaran.
A34-A47oNiagaran
.
A48-A560 Niagaran.
NF59ao Niagaran.NF6O0 Niagaran.NF6I0 Niagaran.
g Niagaran
.
23q RacineNF294A1 Niagaran.
NF294B1 Niagaran.
NF294D1 Niagaran,
NF294EqRacine .
NF295B1 Niagaran.
NF295 CI Niagaran.
10'50'
40'30'
15'
15'
10'
27'
Chicago HeightsThornton
ThorntonThorntonThorntonThorntonThornton
ThorntonThorntonThorntonSag Bridge
Lemont .
Lemont .
Lemont .
22' 61^" Lemont ,
— Lemont .— Spoil Bank SagChannel .
11' Blue Island5' 6" Blue Island12' Blue Island
9' 6" Blue Island7' 6" Blue Island
— Blue Island— Blue Island— Blue Island— Blue Island
9'
31' 6'
24'
12'
30'
12'
19'
Chicago .
LaGrange
LaGrange
LaGrange
LaGrange
LaGrange
LaGrange
NE SE NE 22 35N 14E 54.41— NW SE 28 36N 14E 55.69
— NW SE 28 36N 14E 54.57— NW SE 28 36N 14E 55.17— NW SE 33 36N 14E 46.95— NW SE Z3 36N 14E 53.19— — — — — — 54.04
— — — — — — 33.50— — — — — — 52.44— — — — — — 52.67SW SE SW 13 37N HE 54.71
— NE SW 21 37N HE 31.22— NE SW 21 37N HE 41.04— SW NW 21 37N HE 53.47
— SW NW 21 37N HE 47.67
— — — — — — 36.00
C E line SWNW SE SWNW SE SWNW SE SW
NW SE SWNW SE SW— NE SW— NE SW— NE SW
35 37N 13E36 37N 13E36 37N 13E36 37N 13E
36 37N 13E36 37N 13E
36 37N 13E36 37N 13E36 37N 13E
SW NW SW 1 37N 14ESE NE NW 10 38N 12E
SE NE NW 10 38N 12E
SE NE NW 10 38N 12E
SE NE NW 10 38N 12E
SE NE NW 10 38N 12E
SE NE NW 10 38N 12E
35.0142.3025.5239.97
22.6638.01
30.6131.5943.6831.60
54.1652 . 81
55.38
53.50
54.92
53.02
54.45
42.3642.76
44.3044.3036.5940.7742.96
27.9543.6643.5744.09
24.9931.3943.37
38.88
41.00
28.4434.9222.7933.46
22.5932.62
28.4426.9835.0722.24
42.4641.03
42.35
44.00
43.05
44.19
44.73
1.200.11
0.060.12
14.62.41.23
27.272.352.100.27
41.0824.842.33
11.00
17.30
26.9516.837.120.4
40.220.8
28.8631.215.40
1.194.88
1.27
2.97
0.28
3.53
1.16
0.520.30
0.00 0.250.03 0.19
Cook0.38 —0.19 —0.02 —0.01 —— 4.3
— 0.55 0.37
5.630.
0.
0.25
2.011.130.65
1.33
6.454.29.05.2
5.1
0.31 7.39— 9.1520 4 00
0.580.81
0.48
0.99
0.37
0.56
0.22
1.6285850.19
1.881.850.47
0.61
0.96
1.361.82.22.0
2.42.1
0.841.9558
1.20
0.420.26
0.22
0.27
0.31
0.36
0.30
Footnotes appear on page 5.

ILLINOIS LIMESTONE AND DOLOMITE ANALYSES
Continued.
Analysis
CaO MgO Na20 K2O CO2Losson
ignition
Miscellaneous Remarks
Yearsampletaken oranalysispublished
SampleNo.
County—Cont.55.52 0.4248.41 5.3534.28 16.3929.13 19.27
54.2953.2149.9249.8343.72
0.630.590.921.915.24
County31.03 20.9330.09 21.0830.62 21.1930.30 20.89
County53.28 Trace51.2652.9453.2453.8646.02
0.660.530.690.551.96
County52.41 0.25
52.49 1.1833.60 4.81
County30.48 20.7431.20 20.45
30.5730.9126.329.830.28
21.5421.6017.519.520.54
18.77 13.3729.39 20.8829.52 20.8430.65 21.47
17.49 11.9522.99 15.0129.96 20.74
26.71
20.17
19.6223.714.322.4
12.721.3
17.^517.724.4717.71
30.3429.59
31.03
29.98
30.77
29.71
30.51
18.59
19.61
13.6016.710.916.0
10.815.6
13.6012.916.7710.64
20.8019.62
20.25
21.04
21.63
21.13
21.39
0.06
0.110.20
0.19
0.02
2.32
0.10
0.06
0.00
0.10
40.4241.0439.91
46.6146.2146.70
— 46.040.00 47.05
0.01 47.120.03 47.38
— 45 . 98
— 40.94
— 35.7— 21.2— 33.6
— 19.7— 33.0
2.09 25.81
0.69 36.32
— 45.98— 44.53
— 46.44
0.00 45.28
0.00 46.62
— 45.11
— 46.20
42.6743.0143.8343.99
42.8041.9840.1941.0940.24
46.71
43.8041.9243.1843.1643.1640.78
47.87
47.7447.17— — 38.5— — 46.9
0.14 — —2 . 94 — —
0.00 47.07 —25.9134.6746.13
30.2836.322.434.0
20.833.0
28.2027.136.881.30
44.83
46.82
45.52
47.09
45.27
46.74
SO3 0.10SO3 0.26SO3 0.14SO3 0.10
SO3 0.05SO3 0.10
Herter Quarry, 0-24'6" above base
.
Herter Quarry ,24'8 "-43 '0" above baseHerter Quarry, 43'0"-46'l " and 50'0"-63'1"
1952195219521934
1952195219341934
Illinois Limestone Co.
P 0.032; insoluble ma-terial 3.90 ....Insoluble matter 24.48Phosphorus 0.45 .
SOa 0.10; PzOs O.OOfMnO 0.015 . .
FeO 0.07 . . .
FeO 0.08 . . .
Material Service Corp., north quarryMaterial Service CorpMaterial Service Corp
MnO 0.03; SO3 trace . Brownell Improvement Co.
MnO 0.02; SO3 trace .
Organic matter 0.60 .
Organic matter 0.72 .
FeO 0.08; P2O6 O.OOtMnO 0.015; SO3 0.02 .
Brownell Improvement Co.Brownell Improvement Co.Brownell Improvement Co.
SO3 0.32
SO3 0.22
Basal 10'
Top 15'
Consumers Co.; extending 29' up frombase of quarryConsumers Co.; total exposure onsouth face of quarryWestern Stone Co
S0.2S0.2S0.3
S0.3S0.3
From boring
FeO 1.17; S0.29;SO30.07
FeO 0.98; S 0.26; SO3 0.16Clay and soluble matter43.56 Soluble silica 0.16
MnO 0.010; P2O5 O.OOtSOs0.09 ....SO3O.25 ....SO3 0.27
Material Service Corp.; 0-31 '6" abovebaseMaterial Service Corp.; 31'6"-55'6"above baseMaterial Service Corp.; 67'-79' abovebaseMaterial Service Corp.; from 79'-109' above baseMaterial Service Corp.; diamond drill
core; from 106'-118' from top . . .
Material Service Corp.; diamond drill
core; from 118'-137' from top .
R29R19R18R35
R34R33NF172ANF172B
1934 NF172C
1943194319431912
Ml
35
192519121912191219121912
S9S51aS51cS52aS52b
19071912
S3S3
1925 BIO
24
194319431943193419341907
NF409FlF2NF58NF59
190719121912
—
194319341934
22Dx5Dx4
1935 NF297A
19351907
NF297B
1934193419341934
NF96Al-AlOA11-A19A20-A33
19341934
A34-A47A48-A56
193419341934
NF59aNF60NF61
18681943 23
1935 NF294A
1935 NF294B
1935 NF294D
1935 NF294E
1935 NF295B
1935 NF295C
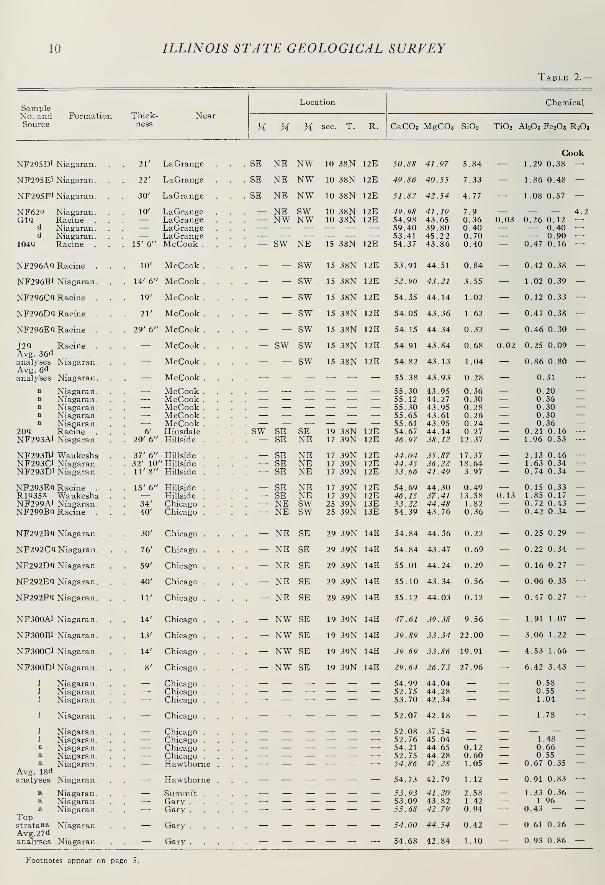
10 ILLINOIS STATE GEOLOGICAL SURVEY
Table 2.—
SampleFormation Thick-
nessNear
Location Chemical
No. andSource M H M sec. T. R. CaCOs MgCOs SiOa Ti02 AI2O3 Fe203 R2O3
CookNF295D1 Niagaran. . . 21' LaGrange . . SE NE NW 10 38N 12E 50.88 41.97 5.84 — 1.29 0.38 —NP295EI Niagaran. . . 22' LaGrange . . SE NE NW 10 38N 12E 49.86 40.55 7.33 — 1.86 0.48 —NF295F1 Niagaran. . . 30' LaGrange . . SE NE NW 10 38N 12E 51.82 42.54 4.77 — 1.08 0.57 —NF620 Niagaran. .
GIQ Racine . .
d Niagaran.d Niagaran.
104a Racine . .
. 10'
'. 15' 6"
LaGrangeLaGrangeLaGrangeLaGrangeMcCook . .
. . — NE
. . — NW
; ;— sw
SWNW
NE
10 38N10 38N
15 38N
12E12E
12E
49.9854.9859.4053.4154.37
41.1943.6539.8045.2 2
43.86
7.90.360.400.700.40
0.03 0.26 0.12— 0.40— 0.900.47 0.16
4.2
NF296Aq Racine . .10' McCook . . . . — — SW 15 38N 12E 53.91 44.51 0.84 — 0.42 0.38 —
NF296B1 Niagaran. . . 14' 6' McCook . . . . — — SW 15 38N 12E 52.90 43.21 3.55 — 1.02 0.39 —NF296Cq Racine . . . 19' McCook . . . .
— — sw 15 38N 12E 54.35 44.14 1.02 — 0.12 0.33 —NF296Dq Racine . . . 21' McCook . . . .
— — sw 15 38N 12E 54.05 43.36 1.62 — 0.47 0.38 —NF296Eq Racine . . . 29' 6' McCook . . . .
— — sw 15 38N 12E 54.15 44.34 0.32 - 0.46 0.30 —
J2q Racine . .
Avg. 36danalyses Niagaran.Avg. 6danalyses Niagaran.
. —McCook . .
McCook . .
McCook . .
. . — sw sw
sw
15 38N
15 38N
12E
12E
54.91
54.82
55.38
43 . 84
43.13
43.93
0.68
1.04
0.28
0.02 0.25 0.09
0.86 0.80
0.31
—
a Niagaran.a Niagaran
.
a Niagaran
.
a Niagaran
.
a Niagaran. .
209 Racine . .
NF293A1 Niagaran. .
6'
. 20' 6'
McCook . .
McCook . .
McCook . .
McCook . .
McCook . .
HinsdaleHillside . .
'.
'. sw SE. . — SE
SENE
19 38N17 39N
12E12E
55.3055.1255.3055.6555.6154.6746.97
43.9544.2743.9543.6143.9544.1438.12
0.360.300.280.260.240.2712.37
I
0.200.360.300.300.36
0.21 0.161.96 0.53
—
NF293B1 Waukesha .
NF293C1 Niagaran. .
NF293D1 Niagaran. .
. 37' 6'
. 32' 10
. 11' 8'
Hillside . .
"Hillside . .
Hillside . .
. . — SE
. . — SE
. . — SE
NENENE
17 39N17 39N17 39N
12E12E12E
44.0444.4553.66
35.8736.2241.49
17.3718.643.97
— 2.13 0.461.63 0.340.74 0.34
—
NF293Eq Racine . .
R1935X Waukesha .
NF299A1 Niagaran. .
NF299Bq Racine . .
. 15' 6'
'. 34'
. 40'
Hillside . .
Hillside . .
Chicago .
Chicago .
. . — SE
. . — SE
. . — NE
. . — NE
NENEswsw
17 39N17 39N25 39N25 39N
12E12E13E13E
54.6946.1553.2254.39
44.3037.4144.4843.76
0.4913.581.820.36
0.130.15 0.331.85 0.170.72 0.430.42 0.34
—
NF292Bq Niagaran. . . 30' Chicago . . . — NE SE 29 39N 14E 54.84 44.36 0.22 — 0.25 0.29 —NF292Cq Niagaran. . . 76' Chicago . . . — NE SE 29 39N 14E 54.84 43.47 0.69 — 0.22 0.34 —NF292Dq Niagaran. . . 59' Chicago . . . — NE SE 29 39N 14E 55.01 44.24 0.29 — 0.16 0.27 —NF292Eq Niagaran. . . 40' Chicago . . . — NE SE 29 39N 14E 55.10 43.34 0.56 — 0.06 0.35 —NF292Fq Niagaran. . 11' Chicago . . . — NE SE 29 39N 14E 55.12 44.03 0.12 — 0.47 0.27 —
NF300A1 Niagaran. .14' Chicago . . . . — NW SE 19 39N 14E 47.61 39.38 9.56 — 1.91 1.07 —
NF300B1 Niagaran. . 13' Chicago . . . . — NW SE 19 39N 14E 39.89 33.34 22.00 — 3.06 1.22 —NF300C1 Niagaran. . 14' Chicago . . . — NW SE 19 39N 14E 39.69 33.86 19.91 — 4.53 1.66 —NF300D1 Niagaran. .
8' Chicago . . . . — NW SE 19 39N 14E 29.64 26.73 27.96 - 6.42 3.43 —i Niagaran
.
i Niagaran
.
i Niagaran
.
—Chicago .
Chicago .
Chicago .
; ; — — — - — — 54.9952.7553.70
44.0444.2842.34
0.580.551.04 E
i Niagaran
.
. — Chicago . . . — — — - — — 52.07 42.18 — — 1.78 —i Niagaran.J Niagaran
.
a Niagaran
.
a Niagaran
.
a Niagaran
.
Avg. 18danalyses Niagaran.
—Chicago .
Chicago .
Chicago .
Chicago .
Hawthorne .
; ;— - -
— ——
52.0852.7654.2152.7554.86
37.5445.0444.6544.2847.28
0.120.601.05
— 1.480.660.55
0.67 0.35
—
— Hawthorne . . .— — — — — — 54.73 42.79 1.12 — 0.91 0.83 —
a Niagaran.a Niagaran
.
a Niagaran.Topstrataaa Niagaran. .
Avg.27danalyses Niagaran.
— Summit .
Gary . . .
Gary . . .
— " — 53.9353.0955.68
41.2043.8242.79
2.581.420.94
1.33 0.361 96
0.43 ——
— Gary .
Gary . . .
— — — — —
•
— 54.00
54.68
44.54
42.84
0.42
1.10
0.61 0.26
0.93 0.86 —
Footnotes appear on page 5.

ILLINOIS LIMESTONE AND DOLOMITE ANALYSES 11
Continued.
Analysis
CaO MgO Na20 K2O CO2Losson
ignition
Miscellaneous Remarks
Yearsampletaken oranalysispublished
SampleNo.
County—Cont.28.51 20.07 — — 43.74 44.04
27.94 19.39 — — 42.66 42.74
29.04 20.34 — — 44.28 44.40
28.030.8033.2929.9330.46
19.721.5619.0321.6221.40
0.09
0.06
0.05
0.07
46.96
46.80
42.246.93
47.25
30.20 21.59 — — 46.94 46.96
29.64 20.66 — — 45.08 45.23
30.45 21.53 — — 46.94 46.85
30.28 21.25 — — 46.40 46.46
30.33 21.92 0.00 0.03 46.96 47.14
30.76 21.32 0.15 0.07 47.03 46.85
30.72 20.62 —31.03 21.01 —30 99 21 02 — — — —30.89 21 17 — — — —.30 99 21 02 — — — —31 19 20.85 — —
-
— —31 16 21 02 — —
•
— —30 6? 21 32 — — 47 08 —26 32 18 23 — — 39 73 40 19
7,4 68 17 15 — — 37 20 —24 91 17 32 — — 3/ 12 37 71
30.07 19 84 — — 44 88 45 34
30 64 21 74 — — 47 17 47 18
?5 86 17 89 0.10 0.95 39 16 —7.9 82 21 27 — —
•
45 83 45 8830 47 21 91 — — 46 76 46 72
30 72 21 45 — — 47 27 47 43
30 72 21 28 — — 46 81 46 95
30 82 21 58 — — 47 28 47 24
30 87 21 32 — — 46 85 47 19
30 88 21 45 — — 47 22 47 23
26 68 18 83 — — 40 86 40 70
22 35 15 94 — — - 34 27
22 24 16 19 — — 33 72 34 27
16 61 12 78 — — 26 66 28 88
30.82 21 06 — _ — —29 56 21 17 — — — —30.09 20 25 — — — "~
29 18 20 17 — — — -
29 19 17 95 — — — —29 57 21 54 — — — —30 .38 21 35 — — — —7.9 ^6 21 17 —
.
— — —30 74 22 61 — — 44 54 —
30 67 20 46 — — — -
30 22 19 70 — — 45 74 —79 75 20 95 — — — —31 20 20.46 — — 46 58 —30 26 21 30 — 47 11 "
30 64 20.49 — — — —
SO3 0.27
SO3 0.40
SO3 0.47
FeO 0.13P trace; S
SO3 0.09
SO3 0.30
SO3 0.22
SO3 0.27
SO3 0.25
MnO 0.015SO3O.llFeO 0.18
SO3 0.12FeO 0.25SO3 0.22SO3O.I7
SO3 0.40
SO3 0.42
SO3 0.30
SO3 0.40
SO3 0.02
SO3 0.92
SO3 1.47
SO3 1.82
SO3 3.77
Insoluble 0.87Insoluble 0.60Insoluble 1.28
Insoluble 4.00
P2O5 o.oot
Insoluble 0.21
Material Service Corp.; diamond drill
core; from 137'-158' from top .
Material Service Corp.; diamond drill
core; from 158'-180' from top .
Material Service Corp.; diamond drill
core; from 180'-210' from top .
Material Service CorpFederal Stone CoFederal Stone CoConsumers Co.; top of middle bench,NWface
Dolese and Shepard Co. 0-10' up fromabove baseDolese and Shepard Co., 10'-24'6"
above baseDolese and Shepard Co., 29'6"-48'6"
above baseDolese and Shepard Co. 48'6"-69'6"
above base
Dolese and Shepard Co., topDolese and Shepard Co.
Dolese and Shepard Co.
U. S. Crushed Stone Co.
U. S. Crushed Stone Co.U. S. Crushed Stone Co.U. S. Crushed Stone Co.U. S. Crushed Stone Co.U. S. Crushed Stone Co.
Consumers Co. upward from base20'6'
Consumers Co. 20'6"-58' above baseConsumers Co. 58'-90'10" above baseConsumers Co. 90'10"-102 '6" abovebaseConsumers Co. 102'6"-118' above baseHand specimenHouse of Correction 0-34' above baseHouse of Correction quarry, abandon-ed, 34'-74' above base
Material Service Corp. 15'-45' abovebaseMaterial Service Corp. 45'-121' abovebaseMaterial Service Corp. 121'-180'
above baseMaterial Service Corp. 180'-221'
above baseMaterial Service Corp. 221 '-228',
232'-237' from base
SO3 0.036; P2O8 .004
P 0.005; S 0.04 . .
SO3 0.059; P2O6 0.007
Chicago Union Lime Works; core360-374' below floor of quarry.Chicago Union Lime Works; core374'-387' below floor of quarryChicago Unicrti Lime Works; core387'-40r below floor of quarryChicago Union Lime Works; core401'-409' below floor of quarryUnion Lime CoStearns Stone and Lime Co. . . .
Artesian Stone & Lime Co. Averageof quarryArtesian Stone & Lime Co. LumpylayerStony Island Ave. quarry . . . .
Chicago Union Lime WorksChicago Union Lime WorksStearns Lime & Stone CoDolese and Shepard Co
Dolese and Shepard Co.
U. S. Crushed Stone Co.Dolese and Shepard Co.
Fe 0.36; S 0.031 ; P 0.004 Dolese and Shepard Co.P 0.005; S 0.026;moisture 0.009 . . Dolese and Shepard Co.
Dolese and Shepard Co.
1935 NF295D
1935 NF295E
1935 NF295F
194319071907
Gl
1943 104
1943 NF296A
1935 NF296B
1935 NF296C
1935 NF296D
19351943
NF296EJ2
1907 Avg. 36 anal
1907 Avg. 6 anal.
191219121912191219121943 20
193519351935
NF293ANF293BNF293C
1935193519521935
NF293DNF293ER1935NF299A
1935 NF299B
1935 NF292B
1935 NF292C
1935 NF292D
1935 NF292E
1935 NF292F
1935 NF300A
1935 NF300B
1935 NF300C
193518991899
NF300D
1899 —189918991899191219121912
—
1907 Avg. 18 anal
191219121912
—
1922 Top strata
1907 Avg. 27 anal

12 ILLINOIS STATE GEOLOGICAL SURVEY
Table 2.—
SampleFormation Thick-
nessNear
Location Chemical
No. andSource M M M sec. T. R. CaC03 MgCOa SiOz Ti02 AI2O3 FezOs R2O3
19a Joliet
46Q Racine
NF298A1 Niagaran
NF298B1 Niagaran
NF298C1 Niagaran
NF298D1 Niagaran
NF298E1 Niagaran
SSOab McLeansboroSSOcb McLeansboroBu2l> McLeansboro
U2-ldl Seville .
RllOo Burlington
g St. Louis,
g St. Louis.
u DivineV DivineV DivineV DivineV Divine
C38b KeokukC42b KeokukSL15. 16' SalemC40b St. LouisC41b Keokuk
W81k Keokuk
KxkNF176A1NF176B1NF176C1NF176D1NF177A1
NF177B1
NF177C1
NP177D1
W322b
NF453A1
NF453B1
NF453C1
NF453D1
NF453E1
NF4S3F1
Fredonia _ .
Ste. GenevieveSte. GenevieveRenault .
Renault .
Ste. Genevieve
Ste. Geneveive
Ste. Genevieve
Ste. Genevieve
St. Louis.
Ste. Genevieve
Ste. Genevieve
Ste. Genevieve
Ste. Genevieve
Ste. Genevieve
Ste. Genevieve
7' Naperville
50' Elmhurst
23' Elmhurst
14' Elmhurst
i' 3' Elmhurst
4' Elmhurst
6' Elmhurst
6' Baldwinsville6' Baldwinsville— Cherry Point
61'
4'
28'26'26'8'
9'
5'
35'6'
4'
Marietta
Eldred . . .
Thompkins Mill
CarroUton .
DivineDivineDivineDivineDivine
HamiltonNauvoo .
PontoosucNiota
.
Niota.Niota.
— Nauvoo— Warsaw
— Shetlerville10' 7" Shetlerville
17' Shetlerville12' 7" Shetlerville5' 4" Shetlerville16' 6" Shetlerville
22' 1" Shetlerville
32' 5"Shetlerville
11' 4"Shetlerville
50' Elizabethtown
9' 7" Cave in Rock
14' 5" Cave in Rock
10' 7" Cave in Rock
12' 7" Cave in Rock
14' 5" Cave in Rock
16' 7" Cave in Rock
NF4S4A1 Ste. Genevieve . 38' 4" Cave in Rock
NF454B1 Ste. Genevieve . 12' 4" Cave in Rock
DuPageSE SE SW 13 38N 9E 54.85 42.86 0.97 — 0.38 0.29 —NW SW NW 2 39N HE 54.14 43.26 0.84 — 0.57 0.20 —— SW NW 2 39N HE 45.42 37.83 15.58 — 1.89 0.47 —— SE NW 2 39N HE 45.88 38.12 14.12 — 2.17 0.51 —
— SW NW 2 39N HE 48.02 40.55 7.99 0.00 3.19 0.51 —— SW NW 2 39N HE 51.54 42.64 5.84 — 1.30 0.42 —— SW NW 2 39N HE 53.50 42.70 1.97 — 0.83 0.43 —
Edgar— SE NE 10 14N IIW 95.96 1.21 1.52 — 1.74 —— SE NE 10 14N HW 82.61 2.82 8.02 — 5.52 —— — NE 3 15N 12W 92.62 2.97 2.66 — 2.34 —
FultonNE NE SE 22 6N IE 65.16 3.30 16.53 — 2.07 9.61 —
Greene— SW NE 28 ION 13W 95.23 4.16 1.27 0.00 0.08 0.32 —— — — — — — 30.70 16.31 — — 2.75 —— — — — — — 44.90 25.44 — — 5.21 —
Grundycen.N.line 34 34N 8E 95.88 1.90 0.94 — 1.14 —NWcor. NE 34 34N 8E 74.6 22.8 — _ _ _ _SE SW NE 35 34N 8E 69.5 26.3 — _ _ _ _SW SW NE 2 33N 8E 71.6 25.0 — _ _ _ _SWcor. SE 22 34N 8E 66.3 27.6 — _ _ _ _
Hancock— — — 30 5N 8W 69.16 4.18 23.24 — 3.34 —
SEcor. — 12 6N 8W 74.66 5.23 16.24 — 3.80 —NE NE NE 17 7N 7W 46.50 27.88 18.27 — 2.83 3.10 —— — NW 14 7N 8W 95.67 0.79 2.62 — 1.48 —— — SE 16 7N 8W 86.08 1.21 10.20 — 2.36 —— — — — — — 53.93 36.59 4.69 — 2.65 —— — — — — — 82.48 — — — 2.10 —— _ _ _ — _ 92.89 1.92 4.18 — 0.93 —
Hardin— — — 35 12s 7E 8^3.20 8.31 5.54 — 2.41 —— Ei^ SW 35 12s 7E 50.54 3.93 39.07 — 6.28 1.54 —— EJ^ SW 35 12s 7E 94.10 3.12 2.43 — 0.25 0.78 —— Ei^ SW 35 12S 7E 81.68 2.94 13.17 — 2.16 0.72 —— EH SW 35 12S 7E 94.99 2.99 1.95 — 0.11 0.81 —
SH NM SE 35 12s 7E 98.28 1.08 1.13 — 0.51 0.31 —SJ^ NH SE 35 12s 7E 99.58 0.23 0.59 — 0.32 0.26 —SH NH SE 35 12s 7E 88.80 5.10 4.84 — 1.59 1.04 —SJ^ N>^ SE 35 12s 7E 95.49 3.28 1.73 — 0.54 0.56 —— — SW 27 12s SE 80.43 7.56 9.10 — 2.14 —
NE NE NW 12 12s lOE 90.57 7.09 1.34 — 1.00 0.27 —NE NE NW 12 12s lOE 98.47 1.13 0.03 — 0.63 0.13 —NE NE NW 12 12s lOE 95.73 1.46 1.73 — 0,97 0.31 —NE NE NW 12 12s lOE 92.37 2.36 3.86 — 1.11 0.29 —NE NE NW 12 12s lOE 82.23 5.58 8.86 — 2.17 0.67 —NE NE NW 12 12s lOE 96.07 1.99 1.77 — 0.51 0.25 —
NE NW NW 12 12s lOE 91.39 5.90 2.12 — 0.54 0.31 —NE NW NW 12 12s lOE 92.98 2.40 3.91 — 0.65 0.26 —
Footnotes appear on page 5.

ILLINOIS LIMESTONE AND DOLOMITE ANALYSES 13
Continued.
Analysis
Miscellaneous Remarks
Yearsampletaken oranalysispublished
Sample
CaO MgO Na20 K2O CO2Losson
ignition
No
Cou30.73
nty21.06
21.23
18.09
18.23
19.39
20.39
20.42
nty0.581.351.42
nty1.58
nty
1.99
7.80
12.17
nty0.9110.912.612.013.2
tity
2.002.50
13.340.380.58
17.50
0.92
y3.971.881.491.411.430.52
0.11
2.44
1.57
3.62
3.39
0.54
0.70
1.13
2.67
0.95
2.82
1.15
0.01
0.00
0.03
0.08
0.16
0.01
0.16
0.08
0.07
0.10
0.11
0.24
0.20
0.14
0.14
0.07
0.10
0.49
0.77
0.42
0.16
0.71
0.06
0.03
0.11
0.13
0.36
0.06
0.06
0.11
46.49
46.39
38.38
38.80
43.24
45.94
33.31
35.36
22.4842.3136.5142.5342.57
43.47
41.25
42.93
43.09
43.51
42.57
41.45
38.57
42.75
42.85
41.76
47.23
38.75
39.13
41.80
43.70
45.98
43.1838.9842.00
33.44
43.52
0.49
43.57
33.4035.9835.8442.4838.94
22.7642.3036.8042.4743.15
43.42
41.03
42.81
40.18
43.34
43.74
42.68
41.78
39.12
43.08
43.07
42.02
FeO 0.13; P2O6 O.OOfMnO 0.040; SO3 0.04
SO3O.IO ....
1943
1943
1935
1935
1935
1935
1935
191219121912
1936
1934
1868
1868
19311933193319331933
19121912194819121912
191218661925
19251934193419341934
1934
1934
1934
19341912
1950
1950
1950
1950
1950
1950
1950
1950
1930.33 Elmhurst-Chicago Stone Co. quarry.
4625.45
25.71
Elmhurst-Chicago Stone Co.;23' from base of exposure .
Elmhurst-Chicago Stone Co.;
upward
23'-37''NF298A
NF298B
26.91 Elmhurst-Chicago Stone Co.;3" above base
37'-45'
NF298C28.88 Elmhurst-Chicago Stone Co.;
49'3" above base45 '3"-
NF298D29.98 Elmhurst-Chicago Stone Co.;
55 '3" above base
49'3''-
NF298E
Cou53.78 S50a46 30 S50c51.90 . Bu2
Cou36.51 142-ld
Cou53.35 S 0.06; chert not includ-
ed . . . . . .
Clay and insolublematter 48.53 .
RUO17.20
25.16 Clay and insolublematter 23.49 .
Cou53.7341.8
SO3O.O7 .... .—
38 9 Diamond drill core40.137 2 Diamond drill core
Cou38 76 C3841.84 C4226 05 SL15. 1653 62 C4048 24 C4130.22
46 22 Insoluble matter 12.50
Port Madison and AppanooseCo
Stone
52 07 W81
Count46 63 Kx28.3252.7345.7753.2355.07 Mndo.62; SOs'o.oV;
PzOi 0.020 ....MnO 0.008; SO3 0.15;P2O5 0.009 ....
12'4'-22'11' from base22'11'-39'11' from base . . . .
39'll'-52'6' from base52'6'-57'10' from baseP. R. Brown Stone Co. 0-16'6'' frombase
NF176ANF176BNF176CNF176D
NF177A55.80 P. R. Brown Stone Co. 16'6
rom base ...'-387
'
NF177B49.76 P. R. Brown Stone Co. 38'7'
from base-72'10'
NF177C53.51 P. R. Brown Stone Co. 72'10
from base
"'-84'2'
NF177D45.08 W322
50.75 PiOi 0.023 ....P,06 0.010 ....P20» 0.017 ....P2O6 0.031 ....P2O6 0.053 ....P20i 0.029 ....P2O5 0.035 ....P2O5 0.043 ....
Rigsby and Barnard; 0-9'7' aboveNF453A
55.18 Rigsby and Barnard; 9'7 ''-24'0"
NF453B53.64 Rigsby and Barnard; 24'0 '-3A'7"
NF453C51.76 Eligsby and Barnard; 36'11
above base
'-49 '6'
NF453D46.08 Rigsby and Barnard; 49'6''
above base-63'11'
NF453E53.83 Rigsby and Barnard; 63'11
above base
''-80'6'
NF453F
51.21 Okerson Quarry Co. l'8'-40'03ase
' aboveNF454A
52.10 Okerson Quarry Co. 43'9'-56'laase
' aboveNF454B

14 ILLINOIS STATE GEOLOGICAL SURVEY
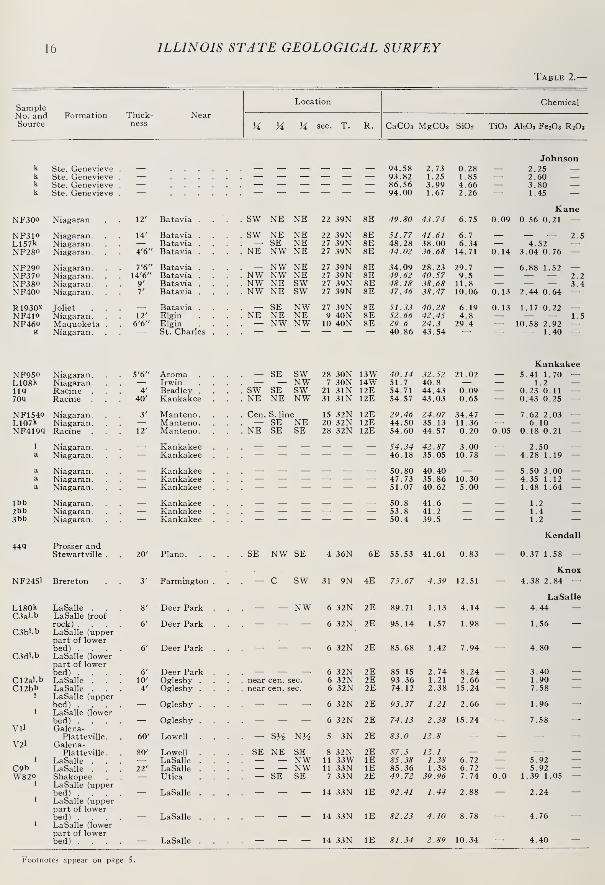
Table 2.-
Sample Location Chemical
No. andSource
Formation Thick-ness
Near
H M H sec. T. R, CaCOs MgCOa Si02 Ti02 AI2O3 Fe203 R2O3
HardinNF454C1 Ste. Genevieve 13' 4' Cave in Rock . NE NW NW 12 12S lOE 81.79 4.83 10.41 — 1.89 0.75 —NF454D1 Ste. Genevieve 15' 2' Cave in Rock . NE NW NW 12 12S lOE 92.39 3.68 2.89 — 0.88 0.42 —W330b
eSte. GenevieveSt, Louis. .
37' Rosiclare.Rosiclare. . . .
— — SW 5 13S 8E 85.8290.86
2.213.18
7.78 — 4.10 —1.06 —
HendersonC39b
SLll. 12131
SL26-301SL1&31SL21
Burlington orKeokuk . .
Burlington .
Burlington .
Burlington .
Burlington .
16' 11'
16' 2'
8'
6'
Lomax . . . .
' Lomax . . . .
GladstoneGladstoneGladstone
SENWSWSW
NENWSWSW
SESENWNW
22
30111515
8N
8NIONIONION
6W
6W5W5W5W
96.71
92.2796.2182.1892.57
0.71
2.491.34
13.812.36
2.30
5.132.793.454.87
—
1.12 —0.46 0.25 —0.32 0.22 —0.50 0.55 —0.48 0.26 —
Jackson
NF681
L80kL53nL90kL91k
Caprock No. 6coal .
Chester . .
BackboneSt. Louis-SalemSt. Louis-Salem
4'
14' 8"45'
DeSoto . . . .
Grain . . . .
Grand Tower . .
Grand TowerGrand Tower
— NW— E^cen sec.
cen sec.
NENWEM
3534232424
7S8SlOSlOSlOS
2W4W4W4W4W
76.7493.3091.3696.4894.76
4.392.281.571.831.83
11.72.272.120.981.71
— 6.43 2.37 —1.73 —
0.21 0.47 —0.70 —1.34 —
L92kk
S5bS57a
St. Louis-SalemSt. Louis-SalemOnondaga .
New Scotland
53'15'
48'
Grand TowerGrand Tower . .
Grand TowerGrand Tower . .
cen. sec.
NENW
24242525
lOSlOSlOSlOS
4W4W4W4W
94.6695.3093.2193.93
2.602.092.634.89
1.341.343.080.86
— 0.97 —— — 1.001.12 —0.72 —
NF404180qR130RUni
e
gg
Edgewood .
Silurian .
Sexton CreekCedar ValleyNiagaran.Niagaran.Hamilton
9'
16'8'
13'
Grafton . . . .
Grafton . . . .
E. Hardin , . .
Hardin . . . .
Grafton . . . .
Grafton . . . .
Grafton . . . .
SE
SW
NENWSENE
SWNWNENE
10142929
6N6N8N8N
12W12W13W13W
56.5454.7596.2788.4847.7950.1559.30
38.3342.551.251.05
42.8642.2016.08
2.131.262.109.92
—
Jersey
1.36 0.81 —0.68 0.36 —0.48 0.32 —0.54 0.46 —
1.40 —2.10 —1.00 —
Jo Daviess
NF442IL4qDS720NF98AO36q
Edgewood .
Stewartville .
Niagaran
.
Niagaran
.
Stewartville .
22'21'25'25'45'
Hanover . . . .
Galena Jet. . . .
Rodden . . . .
Elizabeth , . .
Elizabeth . . .
SW
NW
cor.
NWSWNW
cen.SESWSW
281
141923
26N27N27N27N27N
2EIWIE2E2E
40.5155.1741.4842.0154.71
32.3543.1334.0831.2042.13
21.660.9819.6627.111.36
0.38
3.07 1.41 —0.40 0.85 —4.27 1.56 —1.48 0.55 —0.50 0.41 —
NF99037q
Maquoketa .
Stewartville .
15'
20'Apple River . .
Warren . . . .
SWSW
NWSW
NWNW
2228
29N29N
3E5E
31.6653.96
25.5342.17
29.761.80 — 7.95 2.82 —
0.59 0.63 —Johnson
K29kWillsl-61W308bTioT50
Kinkaid . .
Kinkaid . .
Chester . .
Menard .
Menard .
9'
30'7'
34'
Bloomfield . . .
Simpson . . . .
Vienna . . . .
Flatwoods . . .
Flatwoods . . .
S cen.
EVi SWMiddle— SE— SE
NE
NW
162316
12S12S13S13S13S
3E4E3E4E4E
91.4587.2195.5787.2977.50
3.103.761.553.745.71
4.746.560.965.5012.30
0.100.74 —
1.44 0.73 —1.76 —
3.19 1.53 —1.53 1.79 —
LlOOnD16S
Vienna . .20'18'
Grantsburg .
Belknap . . . .— — EM 12 13S
14S4E2E
75.5290.31
7.491.40
13.02 — 0.57 1.33 —1.32 —
D17S 15' Belknap . . . .— — — 14S 2E 92.36 — — - 0.83 —
D16bD17bD16S
Ste. GenevieveSte. Genevieve
18'15'
18'
Belknap . . . .
Belknap . . . .
Belknap . . . .
— — — 114S14S
2E2E
90.1793.1190.31
4.332.371.40
6.005.33
— 1.32 —0.83 —1.32 —
D17S 15' Belknap . . . .— — — — — — 92.36 — — — 0.83 —
W304b Ste. GenevieveNF175A1 Ste. GenevieveNF175B1 Ste. Genevieve
60'10' 2"24' 5'
Whitehill. . . .
Whitehill. . . .
Whitehill. . . .
SWSW
SESE
SWSWSW
55
5
14S14S14S
2E2E2E
94.0782.4094.39
3.1413.781.53
2.043.183.51 E
1.22 —0.81 0.46 —0.57 0.35 —
NF175C1 Ste. Genevieve 11' 2' Whitehill. . . . SW SE SW 5 14S 2E 64.82 21.21 13.78 — 2.03 0.66 —NF175D1 Ste. Genevieve 56'4" Whitehill . . . SW SE SW 5 14S 2E 97.10 2.42 1.44 — 0.37 0.28 —NF175E1 Ste. Genevieve 25'5" Whitehill . . . SW SE SW 5 14S 2E 88.84 3.74 6.81 - 1.46 0.64 —
kkk
Ste. GenevieveSte. GenevieveSte. Genevieve
— — — — — — 94.9681.3895.70
1.581.742.04
1.7313.161.28 —
1.50 —4.05 —0.80 —
Footnotes appear on page 5.

ILLINOIS LIMESTONE AND DOLOMITE ANALYSES 15
Continued.
Analysis
CaO MgO Na20 K2O CO2Losson
ignition
Miscellaneous Remarks
Yearsampletaken oranalysispublished
SampleNo.
County—Gont.45.83 2.31 0.19
51.77 1.76 0.18
48.1050.92
1.061.5Z
0.42 37.97 38.61
0.20 42.10 42.45
— — 39.72
P2O5 0.067
P2O6 0.038
Okerson Quarry Co. 56'1 "-69'5 " abovebaseOkerson Quarry Co. 72'5"-87'7" above
1950 NF454C
Insoluble matter 2.72Moisture 0.15 .
19501912
1868
NF454DW330
County
54.20 0.34 _ _ _ 1912 C39
51.69 1.19 0.11 0.13 41.45 41.4753.90 0.64 0.11 0.05 42.52 42.3446.04 6.61 0.11 0.07 42.93 43.0351.86 1.13 0.13 0.06 41.51 41.54
County
43.0 2.1 _ 35.452.29 1.09 __ — — —51.16 0.75 — — —54.07 0.88 — —
-
-—
.
—53.10 0.88 — — — —53.05 1.2453.37 0.99 — — — —52.24 1.26 — — —
.
42.6252.64 2.34 — — — 43.92
County31.68 18.83 — — 45.26 45.1830.67 20.70 0.12 0.15 46.29 45.6353.93 0.60 — — 42.7049.57 0.50 — — — 39.2326.78 20.50 — — — —28.10 20.18 — — — —33.23 7.69 — — — —
County22.70 15.47 0.19 1.06 — 34.0830.91 20.66 — — 46.77 46.9023.24 15.30 — — 33.76 34.6023.54 14.92 — — — 33.4530.65 20.53 0.06 0.11 46.05
17.74 12.21 — — — 27.1530.23 20.59 0.06 0.11 45.74 —
County51.25 1.48 — — — —48.87 1.80 0.11 0.24 39.64 39.9053.56 0.74 — — — 43.2048.90 1.79 — — — —43.42 2.73 — — — —42.29 3.58 — — — —50.61 0.67 — — — —51.76 — — — — —50.53 1.75 — .
52.18 0.96 — — — —50.61 0.67 — — — —51.76 — — — — —52.72 1.50 . — —
.
43.3446.17 6.59 —
.
— 42.99 42.7152.89 0.73 — — 42.43 42.00
36.32 10.14 — — 37.06 37.67
54.41 1.16 — — 43.42 43.09
49.78 1.79 — — 39.24 40.19
53.22 0.7645.61 0.83 — — — —53.63 0.98 -^ — — —
C. J. Moore Quarry, 0-17' from baseBasal 16'2" .......0-3' and 9-14' above base .
3-9' above base
1948 SLU, 12, 131948 SL26-301948 SLl and 31948 SL2
McCann Bros. .
McCann Bros. .
Average L 90, 91, 92
SO3 0.02 ....SO3 0.14 ....S0» 0.12 ....Insoluble matter 5.60Insoluble matter 5.15Clay and insoluble mat-ter 23,13. Alkalies, loss,
etc., 0.49 ....
Total EdgewoodKeller Quarry Co. quarry bottom
1932 NF681925 L801928 L531925 L901925 L91
1925 L9219251912 S51912 SS7
1936 NF4041943 801929 R131929 R1418661868 —
1868 —
Lower 22' in quarry
FeO 0.20; P2O5 0.02;MnO 0.045; SO3 0.05 .
— FeO 0.19; P205'o.o"2;
MnO 0.050; SOa 0.04 ,
Seeley Construction Co.
1945194319341934
19431934
1943
MnO 0.032; P2OS 0.030 5-14' above quarry floor
P 0,038; insol. matter6.0P 0.023; insoL matter5.33
Insoluble 5.996Phosphorus 0.038Insoluble 5,328Phosphorus 0,023
SO3 0.22
Charles Stone Co, 0-10'2" from base .
Charles Stone Co. 10'2"-34'7" frombaseCharles Stone Co, 34'7'-45'9" from
Charles Stone Co. 45'9''-102'l " from
Charles Stone'Co! lo'2'l''-127'6" from'base
NF442L4DS72NF98A
36NF99
37
19251950191219341934
K29Wills 1-6W308TlT5
1928 LlOO
1907 D16
190719121912
D17D16D17
1907 D16
190719121934
D17W304NF175A
1934 NF175B
1934 NF175C
1934 NF175D
1934192519251925
NP175E
16 ILLINOIS STATE GEOLOGICAL SURVEY
Table 2.
—
Location ChemicalSample
Formation Thick- NearNo. ancSource ness M M M sec. T. R. CaC03 MgCOa Si02 Ti02 AI2O3 FeaOa R2O3
Johnsonk Ste. Genevieve — — — — — — — 94.58 2.73 0.28 — 2.25 —k Ste. Genevieve — — — — — — — 93.82 1.25 1.85 — 2.60 —k Ste. Genevieve — — — — — — — 86.56 3.99 4.66 — 3.80 —k Ste. Genevieve 94.00 1.67 2.26 1.45 —
KaneNF300 Niagaran. 12' Batavia . . . . SW NE NE 22 39N 8E 49.80 43.74 6.75 0.09 0.56 0.21 —NF310 Niagaran. 14' Batavia . . . . sw NE NE 22 39N 8E 51.77 41.61 6.7 — — 2.5L157k Niagaran. . Batavia . . . .
— SE NE 27 39N 8E 48.28 38.00 6.34 — 4.52NF280 Niagaran. 4'6" Batavia . . . . NE NW NE 27 39N 8E 44.02 36.68 14.71 0.14 3.04 0.76 —NF290 Niagaran. 7'6" Batavia . . . . NW NE 27 39N 8E 34.09 28.23 29.7 6.88 1.52 —NF370 Niagaran. .
14'6" Batavia . . . . NW NW NE 27 39N 8E 49.62 40.57 9.5 — — — 2.2NF380 Niagaran. 9' Batavia . . . . NW NE SW 27 39N 8E 48.18 38.68 11.8 — — — 3.4NF400 Niagaran. 7' Batavia . . . . NW NE SW 27 39N 8E 47.46 38.47 10.06 0.13 2.44 0.64 —R1930X Joliet . . Batavia . . . .
— SE NW 27 39N 8E 51.33 40.28 6.19 0.13 1.17 0.22 —NF410 Niagaran
.
12' Elgin . . . . NE NE NE 9 40N 8E 52.66 42.45 4.8 — — — 1.5NF460 Maquoketa .
6'6" Elgin . . . .— NW NW- 10 40N 8E 29.6 24.3 29.4 — 10.58 2.92 —
K Niagaran. St. Charles . . . 40.86 43.54 — 1.40 —
KankakeeNF950 Niagaran. 5'6" Aroma . . . .
— SE sw 28 30N 13W 40.14 32.52 21.02 — 5.41 1.70 —L108k Niagaran
.
— Irwin — — NW 7 30N 14W 51.7 40.8 — — 1.2 —IIQ Racine .
4' Bradley . . . . SW SE SW 21 31N 12E 54.71 44.43 0.09 — 0.23 0.11 —7oq Racine . .
40' Kankakee NE NE NW 31 31N 12E 54.57 43.03 0.65 — 0.43 0.25 —NF1540 Niagaran. 3' Manteno. Cen. S.line 15 32N 12E 29.46 24.07 34.47 — 7.62 2.03 —L107k Niagaran.
Racine . .
— Manteno. — SE NE 20 32N 12E 44.50 35.13 11.36 — 6.10 —NF419q 12' Manteno. NE SE SE 28 32N 12E 54.60 44.57 0.20 0.05 0.18 0.21 —
i Niagaran
.
Kankakee — — — — — — 54.34 42.87 3.00 2.50 —a Niagaran. — Kankakee — — — — — — 46.18 35.05 10.78 — 4.28 1.19 —a Niagaran. Kankakee 50.80 40.40 . 5.50 3.00 —a Niagaran. — Kankakee — — — — — — 47.73 35.86 10.30 — 4.35 1.12 —a Niagaran
.
— Kankakee — — — — — — 51.07 40.62 5.00 — 1.48 1.64 —Ibb Niagaran
.
Kankakee 50.8 41.6 1.2 —2bb Niagaran
.
— Kankakee — — — — — — 53.8 41.2 — — 1.4 —3bb Niagaran
.
Kankakee 50.4 39.5 1.2 —Kendall
44q Prosser andStewartville .
20' Piano. . .. . . SE NW SE 4 36N 6E 55.53 41.61 0.83 0.37 1.58 —Knox
NF2451 Brereton 3' Farmington .— C SW 31 9N 4E 75.67 4.39 12.51 — 4.38 2.84 —
LaSalleL180k LaSalle . .
8' Deer Park . . . NW 6 32N 2E 89.71 1.13 4.14 4.44 —C3al.b LaSalle (roof
rock) . . .6' Deer Park . . .
— — — 6 32N 2E 95.14 1.57 1.98 — 1.56 —C3bi.b LaSalle (upper
part of lowerbed) . . .
6' 6 32N 2E 85.68 1.42 7.94 _Deer Park . . '."
—
— '— 4.80 —C3dl.b LaSalle (lower
part of lowerbed) . . .
6' Deer Park . . .— — — 6 32N 2E 85.15 2.74 8.24 — 3.40 —
Cl2al.b LaSalle . .10' Oglesby . . . . near cen. sec. 6 32N 2E 93.36 1.21 2.66 — 1.90 —
C12bb LaSalle . .4' Oglesby . . . , near cen. sec. 6 32N 2E 74.12 2.38 15.24 — 7.58 —
1 LaSalle (upperbed) . . .
— Oglesby . . . .— — — 6 32N 2E 93.37 1.21 2.66 — 1.96 —
1 LaSalle (lowerbed) . . .
— Oglesby . . . .— — — 6 32N 2E 74.13 2.38 15.24 — 7.58 —
vu Galena-Platteville
.
. 60' Lowell . . . .— SV2 NH 5 3N, 2^ 83.0 12.8 — — — —
V2l Galena-Platteville. . 80' Lowell . . . . SE NE SE 8 32N 2E 87.3 12.1 — — — —
1 LaSalle . .— LaSalle . . . .
— — NW 11 33W IE 85.38 1.38 6.72 — 5.92 —C9b LaSalle . .
22' LaSalle . . . .— — NW 11 33N IE 85.36 1.38 6.72 — 5.92 —
W820 Shakopee. — Utica . . . .— SE SE 7 33N 2E 49.72 39.96 7.74 0.0 1.39 1.05 —
1 LaSalle (upperbed) . . .
— LaSalle . . . .— — — 14 33N IE 92.41 1.44 2.88 — 2.24 —
1 LaSalle (upperpart of lowerbed) . . .
— LaSalle . . . .— — — 14 33N IE 82.23 4.10 8.78 — 4.76 —
1 LaSalle (lowerpart of lowerbed) . . .
— LaSalle . . . .— — — 14 33N IE 81.34 2.89 10.34 — 4.40 —
Footnotes appear on page 5.

ILLINOIS LIMESTONE AND DOLOMITE ANALYSES 17
Continued.
Analysis
CaO MgO Na20 K2OLoss
CO2 onignition
Miscellaneous Remarks
Yearsampletaken oranalysispublished
SampleNo.
County—Cont.53.00 1.3152.58 0.6048.51 1.9152.68 0.80
0.07
0.13
County27.90 20.92
29.0 19.927.06 18.1724.66 17.54
19.1 13.527.8 19.427.0 18.526.59 18.40
28.76 19.2629.5 20.316.6 11.622.90 20.82
County22.49 15.5528.97 19.5130.65 21.7130.57 21.16
16.51 11.5124.94 16.8030.59 21.52
30.45 20.5025.88 16.76
28.47 19.3226.75 17.1528.62 19.42
28.5 19.930.2 19.728.2 18.9
County
31.11 19.90 —County
42.41 2.07 —County
50.27 0.54 —53.32 0.75 —
0.03 0.09 43.44
trace 0.18 37.51
0.53 40.27
0.69 43.38
0.06 0.06
0.07 0.00
47.2546.46
47.27
43.54
46.20
34.41
43.85
43.5
FeO 0.18; S 0.10;SO3O.O7
38.52
28.9
FeO 0.26; S 0.12;SO3O.O8
41 840.240.82
43.9
FeO 0.60; S0.21;SO3O.O8FeO 0.40 .... Hand specimen
25.8 Na20 + K2O as K2O 3.2
38 80
Clay and insoluble mat-ter 11.60; alkalies, loss,
etc., 2.60
47.06
25.70
47.38
1925192519251925
—
193419341925
NF30NF31L157
1934193419341934
NF28NF29NF37NF38
1934195219341934
NF40R1930NF41NF46
1868
MnO 0.015; SO j 0.03;P2O5 0.00t . . .
P 0.006 . . .
H2O and loss 2.50;P 0.02; S. trace .
H2O and P 0.30 .
TotalKankakee, Quarries Co,
Insoluble matter, 6.3Insoluble matter, 3.7
Insoluble matter, 8.3
Lehigh Stone Co,
Lehigh Stone Co,
Lehigh Stone Co.Lehigh Stone Co.Lehigh Stone Co.
1934192519431943
NF95L1081170
19341925
NF154L107
19431899
NF419
1912191219121912
—
192819281928
—
Total
42.66 Marquette Portland Cement Co,
1943
1934
1925
1907
44
NF245
L180
C3a
48.02 0.68 — 39.48 Marquette Portland Cement Co. 1907 C3b
47.7253.3241.54
1.310.581.14
— — — 38.9042.6635.58
52.32 0.58 — — — —41.54 1.14 — — — —46.5 6.1 — — — —48.947.8447.8427.86
5.80.660.6619.11 0.02 0.80 42.15
40.2042.73
Marquette Portland Cement Co.
51.78 0.69 — —
46.08 1.96 — —
45.58 1.38 — —
Volatile matter 38,54
Volatile matter 38.80
Acid insoluble 4.1 .
Acid insoluble 1.2 .
Volatile matter 40.20
Versenate analysis
Versenate analysis
Volatile matter 42.06
— — Volatile matter 39,26
— — Volatile matter 37,88
190719071912
C3dC12aC12b
1907 —1907 —1953 Vll
1953190719121934
1907
V2l
C9W82
1907
1907 ]
,18 ILLINOIS STATE GEOLOGICAL SURVEY
Table 2.-
SampleFormation Thick-
nessNear
Location Chemical
No. andSource H H H sec. T. R. CaCOs MgCOa Si02 Ti02 AI2O3 Fe203 R2O3
Dx20oElal.b
LaSalle . . .
LaSalle (upperbed) . . . .
24'
6'6"
LaSalle
LaSalle
Elcl.b LaSalle (upperpart of lowerbed) . . . .
6'6" LaSalle
Eldl.b LaSalle (lowerpart of lowerbed) . . . .
5' LaSalle
C2ab LaSalle . .5' LaSalle
C2cb LaSalle . . .6' LaSalle
C2db LaSalle . .4' LaSalle
E6ab
E6bJ.b
LaSalle (upperbed) . . .
LaSalle (lowerbed) . . .
6 to 20
5'
' Oglesby
Oglesby
C13bNF5061(32-36)
LaSalle . .
Shakopee
4'
5'
Peru .
Utica
NF5061(11-17) Shakopee .
14' Utica
Dxl80Dxl90C14ab
C14bb
ShakopeeShakopeeShakopee (uppeicement rock bedShakopee (lowercement rock bed
26'40'
) 6 to 8'
) 12 to 1-3
UticaUtica
Utica
' Utica
DS570DS560L179kE3b
e
ShakopeeShakopeeShakopeeLower MagnesiaShakopee
60'11'
30'
n —
UticaUticaUticaUticaUtica
2WShakopeeShakopee
— UticaUtica
3w Shakopee . — Utica
4w Shakopee . — Utica
5wW8OO
b.l
ClObhh
ShakopeeGalena-Platte-ville . . .
LaSalle . .
LaSalle . .
Probably LaSallProbably LaSall
13'
." 19'6"
e —e —
Utica
OttawaLaSalleLaSalle
hwwn
Probably LaSallLaSalle . .
LaSalle . .
LaSalle . .
e —LaSalleLaSalleLaSalle
w LaSalle . . . — LaSalle
w LaSalle . . . — LaSalle
w LaSalle . .— LaSalle
30q
3iqC6bL188kC5abCSbbS46cbS46dbS46eb29q
Prosser (lower-most;.Stewartville .
Platteville .
Platteville .
Platteville .
Platteville .
Platteville .
Platteville .
Platteville .
Guttenberg .
16'
12'7'
. 50'5'
8'
. 4 to 610'9'
15'
DixonPalmyraDixonDixonDixonDixon
' DixonDixonDixonAshton
— SE NW 14 33N IE 71.83 4.07 16.83
— SE NW 14 33N IE 90.14 1.86 4.92
— SE NW 14 33N IE 65.34 3.99 22.26
— SE NW 14 33N IE 65.38 5.06 17.76
— — — 15 33N IE 92.39 1.44 2.88
— — — 15 33N IE 82.22 4.10 8.78
— — — 15 33N IE 81.33 2.88 10.34
— — SE 25 33N IE 91.57 1.23 4.32
— — SE 25 33N IE 82.22 1.55 9.62
— — SW 30 33N IE 44.64 13.17 21.18
— — S3^ 6 33N 2E 44.45 36.20 13.36
— — NH 7 33N 2E 43.94 35.61 16.04
— SE SE 7 33N 2E 42.93 29.23 16.10— SE SE 7 33N 2E 42.36 33.94 23.05
SW.cor. 8 33N 2E 45.32 26.13 15.02
SW.cor. 8 33N 2E 46.61 20.53 14.42
— SE SW 8 33N 2E 45.37 39.50 12.65— — NE 17 33N 2E — — 11.59— NW NW 18 33N 2E 81.50 11.14 3.76— — — — — — 50.60 38.25 4.58— — — — — — 43.50 30.07 —
— — — — — — 43.54 21.81 12.22— — — — — — 58.62 17.67 17.01
— — — — — — 43.47 29.93 —— — — — — — 42,22 31.83 —— — — — — — 46.97 25.30 \^.\^
— NE SE 21 33N 3E 78 06 17.38 0.80— — SE 34 34N IE 77.56 2.43 11.10— — SE 34 34N IE 77.55 2.42 11.10— — — — — — 79.31 2.34 17.11— — — — — — 75.01 3.22 18.54
— — — — — — 74.51 2.53 19.49— — — — — — 88.27 1.90 6.06— — — — — — 88.16 1.78 8.20— — — — — — 81.32 9.19 7.54
— — — — — — 86.18 7.65 5.06
— — — — — — 81.93 2.09 13.89
— — — — — — 92.83 2.32 5.43
SE SE NE 12 21N 8E 54.84 43.61 0.26NE SW NW 33 22N 8E 54.55 41.46 1.30— — NE 18 22N 9E 65 98 23.45 4.50
SR SW 21 22N 9K 56.60 42.18 0.84— SW 27 22N 9E 88.54 1.42 5.52SW 27 22N 9R 87.29 4.14 3.44— — 27 22N 9E 86.50 1.25 7.56
27 22N 9E 81.79 9.57 5.10— — — 27 22N 9E 83.93 5 02 4.78— SE NW 27 22N HE 54.23 42.42 1 59
LaSalle
4.32 2.06 —3.08 —
— 6.86
— 9.56
— 2.24
— 4.76
— 4.40
— 2.86
— 5.56
— 16.36
— 3.09 1.10
— 2.24 0.84
— 6.57 1.60— 1.64 1.64
— 8.20
— 11.34
— 1.58 1.18— 1.77 1.24— 3.36— 3.72
9.39 3.903.35 2.39
— 2.00
— 1.12
6.37 2.35
1.19 1.677.847.841.973.91
00
3.713.921.303.43
2.32
2.61
1.43
Lee
— 0.29 0.37.51 1.
4.602.103 663.883.542.584.4458 0.
15
37
Footnotes appear on page 5.

ILLINOIS LIMESTONE AND DOLOMITE ANALYSES 19
Continued.
Analysis
LossCaO MgO NaaO K2O CO2 on
ignition
Miscellaneous Remarks
Yearsampletaken oranalysispublished
SampleNo.
County—Cont.40.25 1.95 0.26
50.52 0.89 —0.60 32.94 33.93
— — 41.06 German American Portland CementCo
1934
1907
Dx20
Ela
36.62 1.91 — 33.28 German American Portland CementCo 1907 Elc
36.64 2.42 _ _ _51.78 0.69 — _ _46.08 1.96 _ _ —45.58 1.38 — — —
51.32 0.59 _ _ _46.08 0.74 — — —25.02 6.30 _ — _24.91 17.31 0.12 1.76 38.03
24.62 17.03 0.14
24.05 13.9823.73 16.23
25.40 12.50
26.12 9.82
25.4226.5645.6728.3624.38
24.4032.85
24.36
23.66
26.32
43.7343.4643.4644.4442.03
41.7549.4649.3745.57
48.29
45.91
52.02
18.8917.885.3318.3014.38
10.438.45
14.31
15.22
12.10
8.311.161.161.121.54
1.210.910.854.36
3.66
1.00
1.11
County
30.7230.5636.9831.7249.6248.9248.4845.8447.0430.38
21.3620.2911.2220.17
1.36 37.65
— 37.19
— 39.46— 40.05
— 0.18 35.35
— — 35.35
— 0.18 34.70
Trace Trace 43.72
34.36
42.06
39.26
37.88
41.92
39.16
32.14
38.43
38.07
37.4334.85
38.54
38.80
39.6040.37
44.92
44.13
37.38
46.88 —45.63 —— 43.72
40.68— 41.70— 40.54— 41.94— 41.92
German American Portland CementCoGerman American Portland CementCoGerman American Portland CementCo.German American Portland CementCo
Chicago Portland Cement Co. .
Chicago Portland Cement Co. .
Upper cement rock, 46' above baseoutcrop
Lower cement rock, 11
' above base of
exposure
Illinois Hydraulic Cement Mfg. Co.
Illinois Hydraulic Cement Mfg. Co.
Clay 20,00; potash 0.18;free silica 1.00; iron car-bonate 2.00 ...CO2 plus H2O 38.48 .
CO2PIUSH2O 34.12;SO3 1.81 ....SiOaand AI2O3 21.00;H2O 3.00 ....Si02 and AhOa 21.12;H2O 1.07 ....SO3 1.81; H2O 3.23 .
Utica Cement Co.Illinois Hydraulic Cement Co.
Natural cement rock
Natural cement rock
Natural cement rock
Natural cement rockAverage of samples 1-4 above
S 0.12 ....Volatile matter 37.38
CO2 and water 39.06
CO2 and' water 39.57
CO2 and water 41.05
CO2 and water 36.82
CO2 and water 40.24
Chicago Portland Cement Co. .
Marquette Portland Cement Co. .
German American Portland CementCoGerman American Portland CementCoGerman American Portland CementCoGerman American Portland CementCo.
Gerdes Quarry, top .
Sandusky Cement Co., Dixon
20.77 45.99
Sandusky Cement Co., DixonSandusky Cement Co., DixonSandusky Cement Co., DixonSandusky Cement Co., DixonSandusky Cement Co., Dixon
1907 Eld
1912 C2a
1912 C2c
1912 C2d
1912 E6a
1907 E6b
1912 C13
1953 NF506(32-36)
195319341934
NF506(11-17)Dxl8Dxl9
1912
1912
C14a
Cl4b
1934 DS571934 DS561925 L1791912 E3
18661905 1
1905 2
1905 3
1905 41905 5
1934 W801907 —1912 CIO1913 —1913 —19131905 —1899 —1905 —1905 —1905 —1905 —
1943 301943 311912 C61925 L1881912 C5a1912 C5b1912 S46c1912 S46d1912 S46e1943 29

20 ILLINOIS STATE GEOLOGICAL SURVEY
Table 2.
SampleFormation Thick- Near
Location Chemical
No. andSource ness H H H sec. T. R. CaC03 MgC03 Si02 Ti02 AI2O3 FezOa R2O3
Livingston
P6PP8PP2PP3P
Pontiac .
Pontiac .
Pontiac .
Pontiac .
. . 3'
. 15'11'3'
Ocoya ....McDowell . . .
Pontiac ....Pontiac . . . .
cen.E. line— NW— SW— SW
NENENE
251
1616
27N27N28N28N
4E5E5E5E
91.5695.0593.5089.20
1.780.400.280.29
4.641.121.335.44
— 0.36 0.740.29 0.651.39 0.640.28 0.90
—
P4PPPP
Pontiac .
Pontiac .
Pontiac .
Pontiac .
1'
'. 10'4'
Pontiac ....Pontiac ....Pontiac ....Pontiac ....
—SWSWSWSW
NENENENE
16161616
28N28N28N28N
5E5E5E5E
68.7542.1391.7261.58
0.903.361.633.99
25.3436.642.88
21.23
— 1.13 0.5111.80 2.201.88 1.219.47 2.53
—
PPPcc
Pontiac .
Pontiac .
Pontiac .
Pontiac .
12'
10'4'
Pontiac ....Pontiac ....Pontiac ....Pontiac ....
— SESWSW
NENENE
161616
28N28N28N
SE5E5E
90.488.4585.4994.88
1.602.262.651.68
4.245.777.151.70
— 1.88 1.281.71 1.481.54 1.48
1.30
,-- LoganE28at)E28bt)NF4451
McLeansborcMcLeansborcLonsdale
) . 2'
) . 6'
. 10'6"
Lincoln ....Lincoln ....Lincoln ....
Near NWNear NWWM NE
cor.cor.
NE
55
7
19N19N19N
3W3W3W
90.2883.7992.32
1.718.950.94
4.702.044.21
— 2.664.92
1.15 0.78 —
MacoupinNFioayNFiopyNF107yNFlOOo
BurroughsCarlinvilleMacoupinShoal Creek
4'
4'
2'6'
7'
Carlinville .
Carlinville . . .
' Carlinville . . .
Carlinville . . .
NWNWSE
NESENWNW
NWSENENW
2303536
9NIONIONION
7W7W7W7W
58.7787.7575.9588.75
4.355.636.383.12
25.472.135.405.57
—11.02
0.83 3.0710.11
1.81 1.77
—
NFioiyNFl02yNFiieyNFiuy
Shoal CreekShoal CreekShoal CreekCarlinville
4'
1'
. . 3'3'
Carlinville . . .
Carlinville .
Nilwood ....Palmyra .... NE
SE
NWNWNWSE
NWNWNENE
3636169
IONIONUNUN
7W7W7W8W
64.9676.9294.1979.88
3.796.442.457.38
9.84
5.48
— 6.49
6.70
—
MadisonNF170A1 Salem .
NF170B1 Salem. .
NF170C1 St. Louis.NF170D1 St. Louis.NF170E1 St. Louis.
. 13'10'
. 22'
.20'4"
. 27'1"
. 19'6"
AltonAltonAltonAltonAlton. . .. . .
— — SESESESESE
44444
5N5N5N5N5N
lowlowlowlowlow
85.8291.0062.2882.8275.61
9.756.13
17.619.3119.72
4.973.7917.936.464.31
—
0.90 0.380.42 0.320.77 0.431.07 0.290.91 0.41
—
NF170F> St. Louis.NF168A1 St. Louis.
. 31'11'
. 16'11'AltonAlton SE SW
SESW
410
5NSN
lowlow
86.7196.66
9.140.06
2.632.75
— 0.94 0.491.04 0.38 —
NF168B1 St. Louis. . 28'5" Alton SE SW SW 10 5N low 95.01 1.99 2.99 — 0.81 0.37 —NF168C1 St. Louis. . 21'10' Alton SE SW SW 10 5N low 98.17 0.06 1.85 — 0.66 0.34 —NF168D1 St. Louis. . 7' Alton SE SW SW 10 5N low 83.81 nil 16.62 — 0.37 0.28 —NF168E1 St. Louis. . 21'10' Alton SE SW SW 10 5N low 99.72 0.79 0.40 — 0.37 0.24 —NF169A1 St. Louis. . 24'1" Alton NW SE NW 10 5N low 88.20 3.76 5.72 — 1.46 0.37 —
NF169B1 St. Louis. . . 24'5" Alton NW SE NW 10 5N low 87.37 9.12 3.00 — 0.88 0.39 —NF169C! St. Louis. . 6'6" Alton. . . . . NW SE NW 10 5N low 53.81 32.81 10.87 — 1.81 0.74 —NF169D1 St. Louis. .
17'8" Alton NW SE NW 10 5N low 75.08 19.64 4.14 — 0.78 0.68 —NF169E1 St. Louis. . 22' Alton NW SE NW 10 5N low 95.33 0.52 3.09 — 0.71 0.27 —NF169F1 St. Louis. . 14'10' Alton NW SE NW 10 5N low 96.55 0.54 2.25 — 0.53 0.29 —
aaaa
St. Louis (?)
St. Louis.St. Louis.St. Louis.
: — Alt»nAltonAltonAlton E E — = — =
97.5398.2092.3595.98
0.44trace1.000.75
0.480.306.522.41
— 0.16— trace— trace— trace
—
aaaa
St. Louis. .
St. Louis.St. Louis.St. Louis.
; —AltonAltonAltonAlton
— — — — — — 97.3097.8198.0995.53
0.211.350.940.14
1.001.000.500.48
—— trace— trace— trace— 0.16
—
St. Louis.NF171A1 St. Louis. . 16'5"
AltonAlton NE SW
— 10-11NE 11
5N5N
lowlow
96.4795.94
0.772.04
1.742.58
—0.06 0.56 —
NF171B1 St. Louis. .16'5" Alton. . . . . NE SW NE 11 5N low 95.08 1.38 2.90 — 0.05 0.66 —
NF171C1 St. Louis. . 9'2" Alton NE SW NE 11 5N low 55.77 40.38 3.40 — 0.02 1.54 —NF171DlSt. Louis. . 25'2" Alton. . . . . NE SW NE 11 5N low 97.47 0.71 2.13 — 0.08 0.58 —NF171E1 St. Louis. .
10'9" Alton NE SW NE '' 5N low 98.24 1.13 0.60 ~" 0.03 0.68 "
Footnotes appear on page 5.

ILLINOIS LIMESTONE AND DOLOMITE ANALYSES 21
Continued.
Analysis
CaO MgO NaiO K2O CO2Losson
ignition
Miscellaneous Remarks
Yearsampletaken oranalysispublished
SampleNo.
County51.44 0.85 —53.40 0.19 —52.52 0.13 —50.11 0,13 —38.59 0.43 —23.61 1.61 —51.53 0.78 —34.60 1.93 —50.79 0.77 —49.69 1.08 —48.03 1.27 —53.17 0.80 —County
50.60 0.82 —46.96 4.28 —51.73 0.45 0.15
County32.93 2.08 —49.17 2.69 —42.56 3.05 —49.72 1.49 —36.40 1.81 —43.10 3.08 —52.78 1.17 —44.76 3.53 —County
48.09 4.66 —50.9934.9046.4142.37
48.5954.16
48.96
30.15
42.07
53.42
54.10
54.6655.0351.7553.69
54.5354.8154.9753.54
54.0253.76
53.28
31.25
54.62
55.05
2.938.424.459.43
4.370.03
53.24 0.95
55.01 0.03
46.96 nil
55.88 0.38
49.42 1.80
4.36
15.69
9.39
0.25
0.26
0.21trace
0.480.36
0.100.650.450.07
0.370.98
0.66
19.31
0.34
0.54
0.20 41.10
— 28.46
— 37.29
— 30.94— 36.90— 42 . 99— 39.33
41.8142.2837.1940.9542.58
42.7442.51
42.14
42.83
36.78
43.62
41.11
41.79
40.16
41.7442.2837.2141.2042.93
43.0542.25
42.15
42.67
36.43
43.35
41.14
42.87 42.88
40.27 40.75
42.77 42.95
42.13 42.24
42.58 42.43
42.21 42.27
42.21 42.42
44.23 45.06
42.54 42.75
43.43 43.67
P 0.020 .
P 0.033 .
P 0.016 .
P 0.036 .
P 0.048 .
Bottom 3' of exposure . . . .
Entire exposureBed 3, 4'2"-15'2'' from base . .
Bed 2, l'2"-4'2" from base . . .
Bottom 1 '2' of exposureQuarry floor
Boring depth 6' to 16' .
Boring depth 18-22' below surface
Boring depth 2 to 4'
Boring depth 6 to 16'
Boring depth 18 to 22' . . . .
Pontiac Stone Co
41.8642.8441.42 MnO 0.07; SO3 0.10;
P2O5 0.043 . . . Rocky Ford Limestone Co..
MnO 0.25
Mnd 1.20
— MnO 0.11
— Mnd 0.20
1-4' above baseBasal 1'
. .
SO3 0.14
MnO 0.013; SOs 0.15;P2OB 0.011 . . .
Average 7 analyses
O-U'lO' from base13'10"-35'10" from base . . .
35'10"-56'2" from base . . . ,
S6'2''-83'3" from base ....83'3"-102'9' from base . . . .
102'9''-134'8'' from base . . .
Mississippi Lime Co.; O-16'll'' frombaseMississippi Lime Co., 16'll'-45'4"'
from baseMississippi Lime Co.; 45'4''-67'2''
from base .
Mississippi Lime Co.; 67'2''-74'2''
from baseMississippi Lime Co.; 74'2''-96'0''
from baseMississippi Lime Co.; O-24'l''
from base . ,
-48 '6'Mississippi Lime Co.; 24'1
from baseMississippi Lime Co.; 48'6''-55'0''
from baseMississippi Lime Co.; 55'0''-72'8"'
from baseMississippi Lime Co.; 72'8''-94'8''
from baseMississippi Lime Co.; 94'8'-109'6''
from baseAlton Lime and Cement Co.Harry Gissal Quarry Co., top layer .
Harry Gissal Quarry Co., No. 1
Harry Gissal Quarry Co., No. 2
Harry Gissal Quarry Co., No. 5 .
Harry Gissal Quarry Co., north layerHarry Gissal Quarry Co., south layerHarry Gissal Quarry Co., buildingstone .
.'. \ . . . .
Reliance Whiting Co.i 0-16'5'' frombaseReliance Whiting Co., 16'5''-32'10''
from base .
Reliance Whiting Co., 32'10'-42'0'
from baseReliance Whiting Co., 42'0"'-67'2''
from baseReliance Whiting Co., 67'2''-78'll''
from base
1929192919291929
P6P8P2P3
1929192919291929
P4
192919291929 —
19121912
E28aE28b
1947 NF445
1952195219521952
NF103NF109NF107NFIOO
1952195219521952
NFlOlNF102NF116NF114
19341934193419341934
NF170ANF170BNF170CNF170DNF170E
1934 NF170F
1934 NF168A
1934 NF168B
1934 NF168C
1934 NF168D
1934 NF168E
1934 NF169A
1934 NF169B
1934 NF169C
1934 NF169D
1934 NF169E
1934191219121912^912
191219121912
NF169F
1934 —1934 NF171A
1934 NF171B
1934 NF171C
1934 NF171D
1934 NF171E

22 ILLINOIS STATE GEOLOGICAL SURVEY
Table 2.—
Location ChemicalSample
i Formation Thick- NearNo. ancSource ness H M H sec. T. R. CaCOs MgCOa Si02 TiOz AI2O3 Fe203 R2O3
Madison
NF171F' St. Louis. . .6'8" Alton. . . . . NE SW NE 11 5N low 95.66 3.14 0.42 — 0.05 0.56 —
a St. Louis. . . Alton _ . — 95.79 0.38 2.01 — 1.41 0.41 —a St. Louis. — Alton —
•
— — — — — 94.78 4.18 0.30 — 0.68 —i St. Louis. . .
— Alton — — — — — — 97.72 0.00 1.01 — 1.10 — —Marshall
E20bb McLeansboro .5' Sparland SW NW 14 12N 9E 55.78 1.84 31.74 — 8.92 —
E23b McLeansboro 2'6" Sparland — — SE 14 12N 9E 92.36 1.50 3.42 — 2.36 —Monroe
NF167A1 Salem . . ,35' Columbia SE SW SW 14 IS low 97.37 1.07 1.42 0.05 0.36
NF167B1 Salem . . . ll'll' Columbia SE SW SW 14 IS low 96.98 0.98 1.91 — 0.12 0.30 —NF167C1 Salem . . .
14'2" Columbia SE SW SW 14 IS low 98.55 0.82 0.67 — 0.13 0.29 —L66k Ste. Genevieve .
30' Columbia — S3^ 17 IS low 91.60 2.51 4.33 — 1.28 —L69k St. Louis. 11' New Hanover . cen. N. lineNE 18 2S low 92.50 2.97 1.32 — 2.74 —U49ab St. Louis. 30-40' Columbia NW NE 23 IS low 89.79 2.63 5.42 — 2.24 —NF327A1 Ste. Genevieve .
7'6" Waterloo. . . . NE NE NW 34 2S lOW 71.87 1.09 24.78 — 2.23 0.55 —NF327B1 Ste. Genevieve .
17'2" Waterloo. NE NE NW 34 2S low 82.09 0.84 16.91 — 0.90 0.37 —NF90O Osage. 35' Valmeyer — — SW 35 2S uw 71.8 3.1 24.4 — 1.2 —L67k Okaw. . . .
13' Hecker .... — — W^ 21 3S 8W 95.70 2.50 0.81 — 0.85 —NF890 Decorah or
Plattin . . .11' Valmeyer — NE SW 3 3S UW 56.0 1.6 40.2 0.33 2.07
L68k Kimmswick . Valmeyer _ — SW 3 3S uw 95.70 3.46 0.08 0.741 Kimmswick . Valmeyer — NW NE 10 3S uw 97.65 0.90 2.22 — — — 0.34
L70k Salem . . .
— Valmeyer . . .— NW SE 15 3S uw 95.20 2.56 1.30 — 0.62 —
S211 Warsaw-Salem . 95' Fults — SE SE 36 4S low 89.46 2 22 6.84 — — — 0.90
NF332A1 Salem . . .43'6" Prairie du Rocher, 3 mi. N. W. — 5S 12W 97.80 0.77 1.55 — 1.01 0.12 —
NF332B1 Salem . . .13' Prairie du Rocher, 3 mi. N. W. — 5S 12W 75.29 1.67 19.86 — 2.82 0.59 —
NF332C1 Salem . . .15'7" Prairie du Rocher, 3 mi. N. W. — 5S 12W 94.83 1.19 3.63 — 1.40 0.18 —
NF332D1 Salem . . . 15'H" Prairie du Rocher, 3 mi. N. W. — 5S 12W 95.90 2.51 1.80 — 0.84 0.18 —NF332E1 Salem . . .
27'5" Prairie du Rocher, 3 mi. N. W. — 5S 12W 96.60 1.32 2.35 — 0.79 0.22 —a Salem Millstadt. . . .
— — — — — — 98.43 0.02 1.12 — — 0.44 —Montgomery
698b McLeansboro .20' Hillsboro. . . .
— — — 2 8N 5W 93.53 2.15 2.06 — 3.45 —L425k Shoal Creek . .
10' Litchfield . . .— — SW 2 8N 5W 96.40 0.76 1.76 — 0.28 0.43 —
DS340 McLeansboro 1'6" Litchfield . . .— NW NE 2 8N 5W 63.37 9.89 6.24 — 12.92 4.07 —
694b McLeansboro Hillsboro. . . .— — — 32 9N 4W 94.84 1.78 1.41 — 2.29 —
Ogle
LI90k Platteville . .40' Grand Detour ,
— NW NW 8 22N 9E 76.36 19.16 3.10 — 2.30 —4iq Prosser (middle) 16' Polo — NW NW 17 23N 8E 56.85 40.85 0.63 — 0.20 0.80 —C7ab Platteville . .
10' Grand Detour .— — SE 27 23N 9E 86.36 11.41 1.38 — 1.56 —
NF1281 Galena . . .44' Oregon .... — WH NW 2 23N lOE 53.70 42.35 2.46 — 0.44 1.50 —
NF1291 Trempealeau 12' Oregon .... — Sy2 NE 3 23N lOE 48.60 37.52 10.14 — 2.75 1.90 —NF1240 Shakopee 6' Oregon .... — SE NW 6 23N lOE 42.65 33.17 22.10 — 1.81 1.10 —NF1241 Shakopee . .
6' Oregon .... S3^ SE NW 6 23N lOE 41.33 32.31 — — — — —NF1261 Shakopee 7' Oregon .... sy2 SE NW 6 23N lOE 46.76 39.53 — — — — —
NF1250 Shakopee 2' Oregon .... H mi. NWcen. of sec. 6 23N lOE 32.55 24.11 34.37 — 8.56 2.30 —
NF1350 Galena . . .50' Mt. Morris . SW SE 32 24N 9E 54.76 42.24 1.09 — 0.40 0.60 —
C8b Platteville . .10' Oregon .... — — NW 28 24N lOE 51.25 34.32 5.62 — 4.22 —
NF1321 Platteville . .25' Oregon .... NE SE SW 34 24N lOE 52.86 39.73 3.99 — 1.17 3.18 —
NF1331 Platteville . .25' Oregon .... NE SE SW 34 24N lOE 72.04 22.69 2.93 — 1.65 1.34 —
NF140O Prosser flower) .55' Adeline .... NE SW SW 21 25N 9E 55.82 45.21 0.23 — 0.07 0.44 —
NF1391 Platteville . .22' Byron .... SW SE SW 32 25N HE 51.82 43.75 3.93 — 0.64 1.09 —
k Galena . . .
— — — — — — 44.67 31.00 21.20 — 4.00 —Peoria
DS550 Lonsdale 15' Peoria .... SW NW SW 3 8N 7E 80.57 1.63 15.27 — 2.26 1.04 —Bu9b Maxwell (proba-
bly Lonsdale) 9' Maxwell .... SE cor. 10 8N 7E 80.83 0.96 14.24 — 3.98 —E24ab Maxwell (proba-
bly Lonsdale) 3'6" Maxwell .... — — SE 10 8N 7E 70.05 1.00 21.96 — 5.88 —E24bb Maxwell (proba-
bly Lonsdale) 6'6" Maxwell .... — — SE 10 8N 7E 73.83 1.17 21.04 — 3.70 —E24cb Maxwell (proba-
bly Lonsdale) 3' Maxwell .... — — SE 10 8N 7E 91.93 3.89 2.78 — 1.82 —E26b Pennsvlvanian
(probably Lons-dale) .... 10' Princeville .
— SE 5 UN 7E 78.83 1.05 16.46 — 3.30 —Bu8b Maxwell (proba-
bly Lonsdale) .13'6" Princeville .
- — SE 5 UN 7E 83.40 0.88 13.36 — 3.24 —
Footnotes appear on page 5.
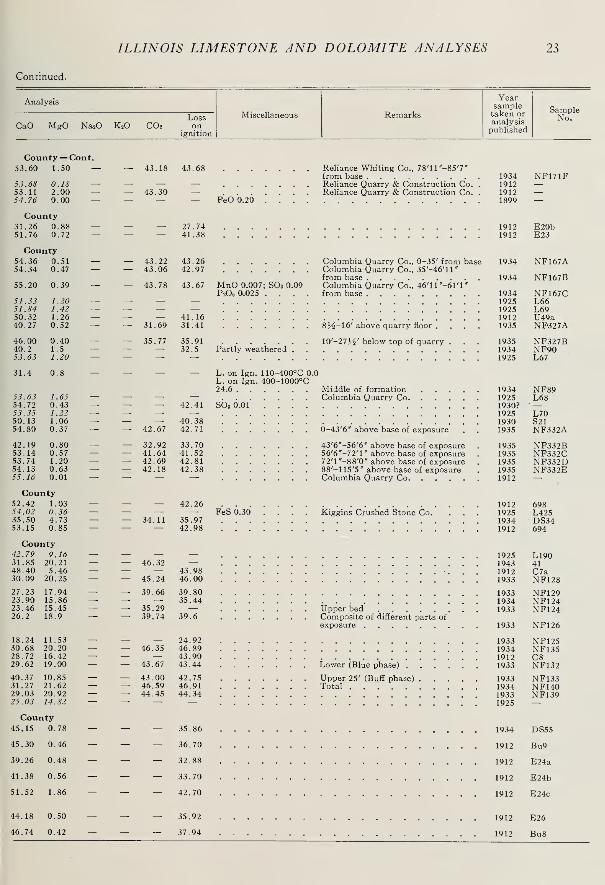
ILLINOIS LIMESTONE AND DOLOMITE ANALYSES 23
Continued.
Analysis
CaO MgO Na20 K2O CO2Losson
ignition
Miscellaneous Remarks
Yearsampletaken oranalysispublished
SampleNo.
County— Con t
53.60 1.50
53.6853.1154.76
0.182.000.00
County31.2651.76
0.880.72
County54.3654.34
0.510.47
55.20 0.39
51.3351.8450.3240.27
1.201.421.260.52
46.0040.253.63
0.401.51.20
31.4 0.8
53.6354.7253.3550.1354.80
1.650.431.221.060.37
42.1953.1453.7454.1355.16
0.800.571.200.630.01
County52.4254.0235.5053.15
1.030.364.730.85
County42.7931.8548.4030.09
9.1620.215.46
20.25
27.2323.9023.4626.2
17.9415.8615.4518.9
18.2430.6828.7229.62
11.5320.2016.4219.00
40.3731.2729.0325.03
10.8521.6220.9214.82
County45.15 0.78
45.30 0.46
39.26 0.48
41.38 0.56
51.52 1.86
44.18 0.50
46.74 0.42
43. 1{
43.30
43.68
— 27.74— 41.38
43.2243.06
31.69
35.77
32.9241.6442.6942.18
— — 34.11
— 46.32
43.2642.97
— 43.78 43.67
41.1631.41
35.9132.5
— 40.3842.67 42.71
33.7041.5242.8142.38
— — 42.26
35.9742.98
45.2443.9846.00
39.66
35.2939.74
39.8035.44
39.6
46.35
43.67
24.9246.8943.9043.44
43.0046.5944.45
42.7546.9144.34
35.86
— 36.70
— 32.88
— 33.70
— 42.70
— 35.92
— 37.94
— FeO 0.20
Reliance Whiting Co., 78'll''-85'7'from baseReliance Quarry & Construction Co.Reliance Quarry & Construction Co.
MnO 0.007; SO3 0.09P2O6 a025 . . .
Columbia Quarry Co., 0-35' from baseColumbia Quarry Co., 35'-46'll''from baseColumbia Quarry Co., 46'11''-61'1'
from base
Partly weathered
8J^-16' above quarry floor .
10'-273^' below top of quarry
L. on Ign. 110-400°C 0.0L. on Ign. 400-1000°C24.6
42.41 SO3O.OI
Middle of formationColumbia Quarry Co.
0-43'6'' above base of exposure
43'6"-56'6'' above base of exposure56'6'-72'l'' above base of exposure72'l"-88'0'' above base of exposure88'-115'5'' above base of exposureColumbia Quarry Co
FeS 0.30 Kiggins Crushed Stone Co.
Upper bedComposite of different parts ofexposure
Lower (Blue phase) .
Upper 25' (Buff phase)Total
1934191219121899
NF171F
19121912
E20bE23
1934 NF167A
1934 NF167B
19341925192519121935
NF167CL66L69U49aNF327A
193519341925
NF327BNF90L67
193419251930?192519301935
NF89_L68
L70S21NF332A
19351935193519351912
NF332BNF332CNF332DNF332E
1912192519341912
698L425DS34694
1925194319121933
LI9041C7aNF128
193319341933
NF129NF124NF124
1933 NF126
1933193419121933
NF125NF135C8NF132
1933193419331925
NF133NF140NF139
1934 DS55
1912 Bu9
1912 E24a
1912 E24b
1912 E24c
1912 E26
1912 Bu8

24 ILLINOIS STATE GEOLOGICAL SURVEY
Table 2.—
SampleFormation Thick-
nessNear
Location Chemical
No. andSource H H H sec. T. R. CaC03 MgCOa Si02 Ti02 AI2O3 FezOa R2O3
NF690 Caprock No. 6coal .
DSI80 Caprock No. 6coal .
NF730 Caprock No. 6coal .
NF770 Caprock No. 6coal .
R1281RIOO-
1010RlOOlRlOll
t
Burlington .
Burlington .
Burlington .
Burlington .
Upper Kinder-hook .
Niagaran
.
9'
15'
15'
15'
150'56'94'
Sunfield .
DuQuoin.
DuQuoin.
Pinckneyville
18' Florence
NW NW SE
— NE SW
NE NW NE
32 5S
21 6S
29 6S
— NW 11 6S
IW 84.06 2.71 9.8
2W 60.30 7.30 23.31
2W 60.68 4.39 26.9
3W 54.1 5.6 29.1
Pearl . . . .
Pearl . . . .
Pearl . . . .
Above village ofKinderhook .
Quarry near mouthof Six Mile Creek .
W320bDS240W319bW321b
Ste. Genevieve .
Clore . . .
Chester . . .
Chester . . .
15'5'
15'
Herod .
Simpson .
GolcondaGolconda
Bu20bD48bW311b
Chester . . .
Chester . . .
Chester . . .
Golconda
50'32'50'
GolcondaReevesvilleReevesvilleGolconda
D47bD47S
Warsaw-Salem .
Warsaw-Salem .
40'40'
Ullin . .
Ullin . .
Lion Warsaw-Salem .
NF451A1 Warsaw-Salem .
40'14'
Ullin . .
Ullin . .
E NW NE 15 5S 2W 92.23 1.17 3.13
— SEm SEIE SE
SWSWSW
101010
7S7S7S
2W2W2W
94.2597.85
68.15
61.60
2.320.77
18.55
33.14
2.700.394.10
7.00
— SW— NWSESE
22191926
lis12s13S13S
7E5E7E6E
70.5286.5286.4389.82
1.763.853.342.09
18.066.797.045.44
— — NE263131
13S13S13S
6E5E5E
88.7587.3287.7291.52
3.682.652.472.26
7.6610.457.906.32
NF451B1 Warsaw-Salem 24'6'
. — — — 14 14S IW 92.90
. — — — 14 14S IW 91.05
. — SW NE 14 14S IW 94.72
. SJ^ SW NW 14 14S IW 97.58
Ullin Si^ SW NE 14 14S IW 96.31
6.38 —
1.50 1.661.86 1.12
Perry
- — 4.7
5 .67 2.32 —4.92 2.08 —7 49 2.21 —
Pike1 .91 0.55 —0.00
— 0.23 0.58 —0.00 0.33 0.33 —0.00 0.16 0.72 —
0.77 0.77
1.60
Pope8.86.47 1.182.362.90
2.021.142.741.92
Pulaski0.490.49
— 0.35 0.230.00 0.20 0.07
2.49 1.71 0.00 0.18 0.08
W254b Chester (proba-bly Okaw) . .
8' Red Bud . .— — NW 4 4S 8W 96 42 1 09 1.50
W253b Chester (proba-bly Okaw) . .
10' Red Bud . .- — SW 5 4S 8W 81 76 7 61 4.54
NF331A1 Salem .36'8" Prairie du Rocher, IM mi. NW — 5S 9W 98 17 / 17 0.65
NF331B1 Salem .22' Prairie du Rocher. I ¥ mi. NW 5S 9W 96 67 0.82 1.01
NF331C1 St. Louis. 5'3" Prairie du Rocher, I J^ mi. NW — 5S 9W 92 07 2 57 4.59
NF331D1 St. Louis. 6'7" Prairie du Rocher, ¥ mi. NW 5S 9W 75 99 21 25 1.68NF331E1 St. Louis. 14'9" Prairie du Rocher, ] V^ mi. NW —
.
5S 9W 77.27 11 46 1.90NF331F1 St. Louis. 15'9" Prairie du Rocher, iH mi. NW — 5S 9W 97 27 1 10 0.96
U47b St. Louis. 75' Prairie du Rocher _ 20 5S 9W 97 85 1 38 0.58K26k St. Louis. — At nose of hill about
M mi. NE Prairie duRocher . . .
-_ — — — 5S 9W 95 89 2 12 0.90NF330A1 Ste. Genevieve .
13'7" Prairie du Rocher, I mi SE. — — 98 69 / 03 0.69
K9k St. Louis. . .— M mile N. of
Prairie du Rocher 97 73 1 37 0.50K24Ak Okaw. . . .
— Roots. . . ._ — SW 4 6S 8W 84.95 2 48 10.84
S27r Okaw & Lower .38'2" Modoc .
-- SW NW 5 6S 8W 90 71 3 47 5.38S24r Okaw. . . . Modoc . 94 37 2 3 2.52K23k Okaw. . . .
— Roots. .__ — NW 12 6S 8W 87 66 5 00 4.52
SL551 Marigold
.
20' Roots. .— 6S 8W 98 27 1 // 0.73
K22k Okaw. . . .. Reily Lake - cen. SE 24 6S 8W 94.48 2 48 1.75
Kl2Ak Menard .— Chester .
_- cen. NW 30 7S 6W 86 05 9 00 1.74K13Ak Okaw. . . .
— Chester . - cen. NW 30 7S 6W 94.98 2 12 1.52K13Bk Menard .
—
.
Chester ._- cen. NW 30 7S 6W 93 27 2 98 1.04
K13Ck Menard .— Chester . - cen. NW 30 7S 6W 91 23 2 71 3.77
Randolph
— 2.00 —5.12.43 0.09
0.00
72 0.1366 0.32
2.01 0.291.89 0.161.54 0.06
0.56
1.06 —0.35 0.18 —
0.38 _1.54 —— — 0.46— — 0.762.78 —
0.22 0.28 —1.433.07 —
.
1.20 —2.84 —2.10 —
Footnotes appear on page 5.

ILLINOIS LIMESTONE AND DOLOMITE ANALYSES 25
Continued.
Analysis
CaO MgO Na20 K2O CO2Losson
ignition
Miscellaneous Remarks
Yearsampletaken oranalysispublished
SampleNo.
0.00
County
47.1 1.3
33.78 3.49
34.0 2.1
30.3 2.7
County51,69 0.56
52.88 1.1154.83 0.3751.58 1.53
38.19 8.87
34.52 15.85
County39.52 0.8448.47 1.8448.44 1.6050.34 1.00
49.74 0.9348.88 1.2849.16 1.1851.42 1.08
County52.06 0.9251.02 —53.04 0.72 —54.68 0.89 0.00
30.17
1.4
38.3
31.35
29.8
27.4 MnO 0.07
0.00 0.00 41.75 42.32
1934 NF69
1934 DS18
1934 NF73
1934 NF77
1933 R128
— 43.70.00 41.67
42.4143.5041.68
SO.OOLower bedsUpper beds
— — — — Insoluble matter 3.35
39.25
County
54.04 0.52
45.8255.01
54.1751.59
42.5843.3054.50
3.640.56
0.391.23
10.165.480.53
— — 43.16
43.2841.48
43.8143.3042.86
33.7239.5540.4640.92
— — — 39.85
— 40.08— 39.42
0.05 43.21 43.14
53.97 1.19 0.01 0.06 42.91 42.90
42.72
41.2643.03
43.0141.28
43.9743.0643.07
193419331933
RlOO-101RlOORlOl
1870 —1866 —
1912193419121912
W320DS24W319W321
1912191219121925
Bu20D48W311
P 0.026; Insol. matter6.39
1912
54.84 0.66 _ _ _ 43.98
MnO 0.002; SO3O.ll;P2O6 0.045 . . . .
MnO 0.002; SO3 0.14;P2O5 0.055 . . . .
MnO 0.002; SOj 0.10;P2O5 0.010 . . .
MnO 0.005; SO3 0.05;P2O6 0.039 . . .
Columbia Quarry Co.. 653^-79>^'above base of quarryColumbia Quarry Co., 41-653^'above base of quarry
Williams Quarry
Red Bud City quarry ....8'9''-47'5' above base of exposure .
50'2''-72'2' above base of exposureIl'l'-ITS" above base of exposure
77'5'-80'4' above base84'-98'9'' above base
98'9'-114'6'' above base
D47
19071928
D47LIO
1949 NF451A
1949 NF451B
1912 W254
1912 W253
194119411941
NF331ANF331BNF331C
19411941
NF331DNF331E
19411912
NF331FU47
53.74 1.0155.30 0.49
54.7747.6150.8352.8849.1255.07
52.9548.2253.2352.2751.13
0.661.191.661.102.390.53
1.194.301.011.431.30
— — 43.30 43.471925 K26
0.00 0.05 43.29 43.07
32'-45'7' above spring along bluffs ofMississippi River 1941 NF330A
— 42.42 SOjO.05
MnO 0.016; SO3 0.06;P2O6 0.045 . . .
1925 K91925 K24A1930 S271930 S241925 K23
1949 SL551925 K221925 K12A1925 K13A1925 K13B1925 K13C
PROPERTY OFPETER J. MURPHY

26 ILLINOIS STATE GEOLOGICAL SURVEY
Table 2.-
SampleFormation Thick-
nessNear
Location Chemical
No. andSource H H M sec. T. R. CaC03 MgCOs Si02 Ti02 AI2O3 Fe203 R2O3
K13DkS6rKl7BkSl2rW208b
W209bB6bB8bSirK8kB9S
B2k
B4k
B6SBBSS7rS9r
Menard .
Okaw & MenardMenard .
Menard & OkawMenard .
Chester .
Chester .
Chester .
Okaw.Okaw
.
Okaw
.
Chester .
Chester .
Chester .
Chester .
Menard .
Clore . .
BulSb HamiltonBul6b HamiltonNF459I Wapsipinicon
DS690 Devoniana Hamiltona Hamilton
a HamiltonNF286a Port Byron .
NF850 Caprock BlairCoal . . .
NF840 St. David .
NF163A1 St. Louis. .
NF163B1 St. Louis. .
NF163C1 St. Louis. .
NF163D1 St. Louis. .
NF163E1 St. Louis. .
NF163F1 St. Louis. .
NF163H1 St. Louis. .
NF163J1 St. Louis. .
NF163K1 St. Louis. .
NF163L1 St. Louis
NF163M1 St. Louis
NF163P1 St. Louis
NF160A1 St. Louis
NF160B1 St. Louis
NF160C1 St. Louis
NF160E1 St. Louis
NF160G1 St. Louis
NF160H1 St Louis
NF162A1 St. Louis
NF162B1 St. Louis
NF162C1 St. Louis
NF162D1 St Louis
i20'2'
27'
Chester .
Coles MillCloresMenard .
Menard .
Menard .
Menard .
Menard .
Menard .
Menard .
Menard .
— Menard
— Menard
42'17'3'
67'
Menard .
Menard .
Cora .
Rockwood
20' Milan8' Milan
39'4" Milan
14' Milan— Moline— Moline
— Moline25' Cordova
— cen. NW 30 7S 6W 95.09 2.38 1.42— SW NE 30 7S 6W 87.89 2.91 6.52near cen. 33 7S 6W 90.44 2.38 6.06— NE NW 15 7S 7W 87.05 2.51 9.38— — NW 15 7S 7W 95.37 1.44 1.85
NW 15 7S 7W 86.13 1.42 9.62— — — 23 7S 7W 93.95 3.86 2.48— — — 23 7S 7W 95.72 3.22 1.90— NW NE 23 7S 7W 87.03 2.11 8.68— NE NW 23 7S 7W 93.45 1.86 3.62
I I : : I :89.40
77.12
3.07
— — — — — :61.09
93.8195.57
1.150.89
:— NW SE 17 8S 5W 78.22 2.74 15.22— NW NE 18 8S 5W 87.23 2.13 7.92
— — — 25 17N IW 82.04 5.52 6.98— — — 25 17N IW 96.67 1.21 1.66cen. N 3^ 25 17N IW 95.26 4.31 0.37
— SE NW 25 17N 2W 70.15 7.84 13.42— — — — — — 98.04 44 1.46— — — — — — 97.15 0.13 0.65
— — — — — — 79.34 1.93 11.00SW SW NE 1 19N IE 54.39 44.09 0.38
4'6" CenterviUe . . . SW NW NW6' CenterviUe . . . SW NW NW
IS'll" Stolle NW NW NW2'11" Stolle NW NW NW
12'11" Stolle NW NW NW
20'7" Stolle. . . . . NW NW NW6'6" Stolle NW NW NW11'6" Stolle NW NW NW9'10" Stolle NW NW NW
14' 5" Stolle. .... NW NW NW10' 2" Stolle NW NW NW
12'10" Stolle NW NW NW8' 7" Stolle NW NW NW
25' 2" Stolle NW NW NW6' 4" Dupo SE SE NW8' 6" Dupo SE SE NW
10' 9" Dupo. . . . . SE SE NWir 2" Dupo SE SE NW11' 1" Dupo SE SE NW6' 8" Dupo SE SE NW12'11" Dupo SE NW SW15' 2" Dupo SE NW SW7'10" Dupo SE NW SW
13'10" Dupo SE NW SW
33
13
INININ
9W9Wlow
60.281.085.66
6.51.3
12.53
23.615.32.83
13 IN low 65.96 22.40 9.68
13 IN low 92.51 5.75 1.85
13 IN low 81.38 7.70 9.40
13 IN low 55.60 39.88 4.47
13 IN low 90.98 6.78 3.21
13 IN low 95.16 2.99 2.45
13 IN io;v 92.23 6.82 1.29
13 IN low 92.10 0.23 6.74
13 IN low 96.71 1.80 1.16
13 IN low 90.23 0.75 8.31
13 IN low 93.69 3.95 2.86
14 IN low 58.71 31.96 6.56
14 IN low 95.16 2.38 2.15
14 IN low 87.52 10.26 2.04
14 IN low 94.08 3.95 1.67
14 IN low 97.58 0.38 1.73
14 IN low 94.35 1.00 3.70
14 IN low 94.26 0.31 5.62
14 IN low 56.23 38.47 4 45
14 IN low 93.76 2.46 3.18
14 IN low 83.72 15.10 1.70
Randolph
—
1.16
1.26
1.28
— 2.44
1.88
—1.941.110.67
1.001.40
- 2.39
— 5.82 —— 2.72 —
— 1.110.67 - 3.31
3.00
Rock Island
—4.321.16
.18 0.39—
— 5 .13 20.66
41 —
— 7.43.12 0.30
—
St . Clair
— 5
—.13 3.87
.17 0.803.1
— 2 94 1 42 —— 22 80 -
— 70 41 —— 1 16 1 14 —— 39 72 —— 70 28 —— 06 52 —— 1 67 0. 43 —
— 0.02 54 —— 1 62 0.32 —— 04 0. 64 —— 1 43 1. 12 —— 41 0. 86 -
— 40 0.97 —— 21 0. 70 —— 19 0. 74 —— 25 0. 74 —— 26 0.59 —— 1 29 0.99 —— 0.88 0. 43 —— 30 0. 46 _
Footnotes appear on page 5.

ILLINOIS LIMESTONE AND DOLOMITE ANALYSES 21
Continued.
Analysis
CaO MgO NaaO K2O CO2Losson
ignition
Miscellaneous Remarks
Yearsampletaken oranalysispublished
SampleNo.
County—Cont.53.29 1.1449.2550.6848.7853.45
48.2752.6553.6448.7752.3750.10
43.22
34.23
1.391.141.200.69
0.681.561.301.010.8Q1.47
52.51 0.55 —53.56 0.43 —43.83 1.31 —48.88 1.02 —County
45 . 98 2 . 64 —54.18 0.58 —53.38 2.06 0.09
39.30 3.7554.94 0.2154.44 0.06
44.46 0.9230.47 21.09
County
33.7 3.145.4 0.648.00 5.99
36.96 10.71
51.85 2.75
45.60 3.68
31.15 19.07
50.98 3.24
53.32 1.43
51.68 3.26
51.61 0.11
54.19
50.56
52.50
32.90
53.32
49.04
52.72
54.68
52.87
52.82
31.51
52.54
46.91
0.86
0.36
1.89
15.28
1.14
5.03
1.89
0.18
0.48
0.15
18.40
1.18
7.22
0.00 43.76
— 34.73
— 42.02
42.49
38.01
42.73
40.31
43.15
41.71
42.80
43.25
39.54
43.05
39.41
41.99
41.55
42.07
42.84
42.88
42.83
41.59
41.39
43.87
42.63
44.58
40.67
39.0443.08
39.00
36.6039.19
40.0043.3843.72
36.06
0.11 0.00 47.18 48.07
30.236.142.89
38.61
42.81
40.18
43.47
42.05
42.46
43.48
39.96
43.27
39.55
42.23
42.51
42.15
43.16
42.88
42.79
41.73
41.46
43.77
42.11
44.01
SO3 0.09
SO3 6.03"
39.65 SO3O.ll
Insoluble 4.92Phosphorus 0.052Insoluble 8.98 .
Insoluble 33.98Phosphorus 0.05P 0.041 . . .
P 0.035 . . .
SOa 0.10 . .
SO3 0.15 . .
S. 111. PenitentiaryS. 111. Penitentiary
CoUinson Stone Co.; basal 29'4" in
quarry and 10' in boring in quarryfloor
PzOs 0.083; organic mat-ter, trace; SO3 1.808;FeO 3.48 ....Mnd 0.005;' SO3 0.06;"
PzOsO.OOt ....
Cady Stone Co.
Moline Stone Co.Cady Stone Co. ,
U. S. Gypsum Co.
Casper Stolle Quarry & Cont. Co.basal 15'11'' from base ....Caspar Stolle Quarry & Cont. Co.15'11"'-18'10" from base . . .
Casper Stolle Quarry & Cont. Co.;18'10''-31'9"from base ....Casper Stolle Quarry & Cont. Co.31 '9 ""-5 2 '4" from base . . .
Casper Stolle Quarry & Cont. Co.:52'4''-58'10" from base . . .
Caspar Stolle Quarry & Cont. Co.59'8''-71'2" from base . . .
Caspar Stolle Quarry & Cont. Co.71'2"'-81'0'' from base . . .
Caspar Stolle Quarry & Cont. Co.8 1'O '-95 '5" from base . . .
Caspar Stolle Quarry & Cont. Co.95'5 "-1057 ' from base . . .
Caspar Stolle Quarry & Cont. Co.105'7''-118'5'' from base. . .
Caspar Stolle Quarry & Cont. Co.118'5''-127'0" from base. . .
Caspar Stolle Quarry & Cont. Co.127'0''-152'2" from base. . .
East St. Louis Stone Co.;0-6'4''from baseEast St. Louis Stone Co.; 6'4''-
14'10"' from base ....East St. Louis Stone Co.; U'lO'-25'7'' from baseEast St. Louis Stone Co.; 26'9'-
37'11' from base ....East St. Louis Stone Co.; 39'11''-
50'7 ' from baseEast St. Louis Stone Co.; 507'-
,
57'3' from baseCaspar Stolle Quarry & Cont. Co.O-12'll'' from base ....Caspar Stolle Quarry & Cont. Co.12'11'-28'1'' from base . . .
Caspar Stolle Quarry & Cont. Co.28'1''-35'11' from base . . .
Caspar Stolle Quarry & Cont. Co.35'ir-49'9''from base . . .
19251930192519301912
K13DS6K17BS12W208
19121912191219301925
W209B6B8SIK8
19071925
B9B2
19251907190719281928
B4B6B8S7S9
19121912
Bu 15Bul6
195119341912
NF459DS69
19121912
1943 NF286
19341934
NF85NF84
1934 NF163A
1934 NF163B
1934 NF163C
1934 NF163D
1934 NF163E
1934 NF163F
1934 NF163H
1934 NF163J
1934 NF163K
1934 NF163L
1934 NF163M
1934 NF163P
1934 NF160A
1934 NF160B
1934 NF160C
1934 NF160E
1934 NF160G
1934 NF160H
1934 NF162A
1934 NF162B
1934 NF162C
1934 NF162D

28 ILLINOIS STATE GEOLOGICAL SURVEY
Tabi
Location ChemicalSampleNo. and Formation Thick- NearSource ness M M H sec. T. R. CaCOj MgCOs Si02 Ti02 AI2O3 Fe203 R2O3
St. Clair
NF162F1 St. Louis. .6'10" Dupo SE NW SW 14 IN low 71.01 27.38 2.77 — 0.25 0.48 —
NF162H1 St. Louis. . 12'11" Dupo SE NW SW 14 IN lOW 96.90 1.51 1.60 — 0.07 0.42 —NF162J1 St. Louis. . 19' 8" Dupo SE NW SW 14 IN low 90.80 0.06 7.74 — 1.32 0.53 —NF162K1 St. Louis. . 14' 3" Dupo SE NW SW 14 IN low 97.31 1.3 0.63 — 0.26 0.44 —
NF1921 Warsaw .7' 9" Dupo NE SW NW 34 IN low 51.27 22.24 17.01 — 4.11 2.17 —
NF80O Caprock CoalNo. 6. . .
4' 6" French Village . . NE NW NE 24 2N 9W 83.0 6.1 7.0 — — — 4.8NF831 Caprock Coal lower
No. 6. . .1' 6" French Village . . SW SW SE 26 2N 9W 49.25 15.27 27.9 — 4.07 4.43 —
NF165A1 Salem . .36'11" Columbia NE NE SE 10 IS low 95.96 2.84 1.26 — 0.49 0.28 —
NF165B1 St. Louis. , 11' 1" Columbia NE NE SE 10 IS low 91.66 3.79 4.59 — 0.64 0.58 —NF165C1 St. Louis. .
9' 2" Columbia NE NE SE 10 IS low 85.07 9.99 4.81 — 0.79 0.60 —
NF165D1 St. Louis. . 13' 8" Columbia NE NE SE 10 IS low 92.69 3.68 3.93 — 1.04 0.62 —NF165E1 St. Louis. . S'll" Columbia NE NE SE 10 IS low 96.35 1.36 2.62 — 0.57 0.34 —NF165F1 St. Louis. .
5'4" Columbia NE NE SE 10 IS low 52.12 36.41 8.39 — 2.02 1.51 —NF165G1 St. Louis. .
16' 8" Columbia NE NE SE 10 IS low 91.87 3.41 4.21 — 0.87 0.56 —a St. Louis. . Columbia SE 10 IS low 97.30 0.48 0.90 — 1.40 —
NF790 Caprock CoalNo. 6. . .
5' Freeburg. SE 4 2S 7W 57.8 2.3 28.5 6.18 2.92 —
Saline
CaveHil -
1 and 21 Kinkaid .10' Harrisburg . SE SW NW 3 lOS 7E 91.53 3.16 4.17 0.05 0.73 0.48 —
Sangamon6 McLeansboro — Chatham. . . .
— NE SE 2 14N 5W 68.73 5.07 " 0.70 14.62 —Schuyler
C32b Salem orSt. Louis. .
— Scott Mill . . .— — NW 7 IN 2W 75.76 2.80 15.04 —
.
6.44 —C3lb St. Louis. .
5' Ripley . . . . NW cor. 19 IN 2W 82.90 1.00 n.88 — 3.84 —C30b St. Louis. .
4' Ripley . . . .— SE 29 IN 2W 92.53 1.38 4.14 — 1.88 —
C4Sb Pen^sylvanianPennsylvanianSalem orSt. Louis. .
8' Frederick . . .— NW NE 5 IN IE 95.32 0.92 2.66 — 2.18 —
C43b Rushville . . . near cen. NE 28 2N 2W 70.19 3.59 18.62 — 7.24 —C36b — Camden .... — — NW 11 2N 3W 77.11 5.68 11.30 — 6.16 —C35ab Keokuk . .
— Camden .... — — NW 17 2N 3W 85.61 0.88 9.30 — 4.54 —C35bb Keokuk . .
10' Camden . . . .— — NW 17 2N 3W 64.23 14.30 15.80 — 5.88 —
C34b St. Louis. .8' Camden . . . . SW :or. 34 2N 3W 88.68 4.68 4.14 — 3.08 —
C46b Pennsylvanian 15' Frederick — NW SW 32 2N IE 94.78 0.92 3.10 — 2.14 —C37b St. Louis. .
8-10' Brooklyn. SW 27 3N 3W 90.29 0.88 6.58 2.70 —Scott
R1221 Salem . . 25' 8" Winchester . . . NE NE SE 27 14N 13W 75.49 16.63 4.07 0.00 1.42 1.65 —R130O Knobby (Sea-
borne) 3' Exeter . . . . SE SW 23 15N 13W 95.48 0.63 0.47 1.36 1.05 —Stark
E27ab McLeansboro 4' Bradford. . . . SW SE 21 14N 7E 62.95 2.05 27.24 — 7.58 —E27bb McLeansboro 5' Bradford. . . . SW SE 21 14N 7E 79.44 1.50 15.40 2.80 —
Stephenson
DS77056q
Maquoketa .
Prosser (upper-
26' Pearl City . . .— SE SE 6 26N 6E 45.93 34.79 11.74 — 4.82 1.29 —
most) .' .
16' Freeport . . . . SE NE SW 6 26N 8E 54.10 43.47 0.95 — 0.35 0.38 —40a Prosser (upper-
most) .15' Ridott . . . . NE SE SW 4 27N 9E 54.03 43.55 1.12 — 0.33 0.63 —
DS730 Niagaran
.
30' Waddams Grove SE SE 13 28N 5E — — 3.31 — — — —DS740 Maquoketa .
35' Waddams Grove — SE SE 13 28N 5E 31.11 24.28 29.66 — — — 13.14
DS750 Galena . .12' Lena — SE NW 29 28N 6E — — — — — — —
38q Prosser (lower-most). 15' Rock City . . .
— SW NW 22 28N 8E 53.21 42.77 2.20 — 0.58 0.40 —Clab Platteville .
2' Winslow . . . . NW SE 22 29N 6E 46.71 33.90 14.02 — 3.52 —Clbb Platteville .
33' Winslow . . . .— 22 29N 6E 54.99 39.05 1.68 — 1.54 —
Clcb Platteville .— Winslow . . . .
— — — 22 29N 6E 54.60 41.18 2.12 — 1.70 —Cldb Platteville .
— Winslow . . . .— — — 22 29N 6E 53.35 38.59 3.22 — 2.76 —
Cleb Platteville .
— Winslow . . . .— — — 22 29N 6E 44.57 30.14 12.56 — 7.04 —
Footnotes appear on page S.

ILLINOIS LIMESTONE AND DOLOMITE ANALYSES 29
Continued.
Analysis
LossCaO MgO Na20 K2O CO2 on
ignition
Miscellaneous Remarks
Yearsampletaken oranalysispublished
SampleNo.
County—Cont,39.79 13.09
54.30 0.72
50.88 0.03
54.53 0.62
2.9
27.6 7.353.77 1.36
51.36 1.81
47.67 4.78
51.94 1.76
53.99 0.65
29.21 17.41
51.48 1.63
54.53 0.23
32.4 1.1
County
51.29 1.51
County38.52 2.42
County
42.4646.4651.8653.4239.34
43.2247.9836.0049.7053.1250.60
1.340.480.660.441.72
2.720.426.842.240.440.42
County42.30 7.95
— — 44.41 43.92
— — 42.75 43.03
— — 40.08 39.75
28.73 11.59 0.93
46.5
43.54 43.62
34.02 34.71
MnO 0.015; SO3 0.10P2O5 0.006 . . .
Caspar Stolle Quarry & Cont. Co.;53'-59'10'' from base ....Caspar Stolle Quarry & Cont. Co.;64'2'-77'l'' from base . . . .
Caspar Stolle Quarry & Cont. Co.;77'l''-96'9' from base . . . .
Caspar Stolle Quarry & Cont. Co.;96'9''-lll'0' from base . . . .
Total face of old mine except lower 5'
— — 38.9
0.743 11
27.843.08
41 24 41.26
41 37 41.69
41 43 41.46
42 18 42.14
40 96 41.60
41 46 41.72
— — 27.3 MnO 0.14; Na20 & K2Oas K2O 1.2 . . . .
Columbia Quarry Co.; O-36'll'from baseColumbia Quarry Co.; 36'll''-48'0"from baseColumbia Quarry Co.; 5r4'-60'6'from base
Columbia Quarry Co.; 62'8'-76'4'
from baseColumbia Quarry Co.; 77'10'-83'9"
from baseColumbia Quarry Co.; 83'9'-89'l'from baseColumbia Quarry Co.; 89'1'-105'9"
from baseColumbia Quarry Co
0.06 0.16 41.35 41.38 MnO 0.020; P2O6 0,030 Lower 10' of quarry face
— — — — Insoluble matter 10.27
0.05 0.21
53.49 0.30 — —County
35.28 0.98 — —44.52 0.72 — —County
25.73 16.64
30.31 21.15
30.27 21.19
17.43 11.61
0.03 0.05
29.81 20.95 — —26.1830.8230.6029.9024.98
16.2218.6819.7018.4614.42
— 35 66— 37 76— 41 46— 42 48— 33 82
38 0642 .12 38 84— 36 92— 42 04— 42 22— 40 66
41 .30 42 42
42 .05 42 50
29 66— 36 38
36 .90 39 51
46 .48 47 09
46 .49 ._43 62 -—
28 3245 53 -—
45 72 --
40 78— 47 00— 46 44— 45 68— 40.02
S trace
S0.35
Winslow City quarryQuarry 1 mi. N. of WinslowQuarry 1 mi. N. of WinslowQuarry 1 mi. N. of WinslowQuarry 1 mi. N. of Winslow
1934 NF162F
1934 NF162H
1934 NF162J
19341934
NF162KNF192
1934 NF80
1934 NF83
1934 NF165A
1934 NF165B
1934 NF165C
1934 NF16SD
1934 NF165E
1934 NF165F
19341912
NF165G
1934
1934
1943
NF79
1950 Cave Hill 1&2
1866 —
19121912191219121912
C32C31C30C45C43
191219121912191219121912
C36C35aC35bC34C46C37
1930 R122
1934 R130
19121912
E27aE27b
DS77
56
1943 401934 DS731934 DS741934 DS75
1943 38
1912 Cla1912 Clb1912 Clc1912 Cld1912 Cle

30 ILLINOIS STATE GEOLOGICAL SURVEY
Table 2.
SampleLocation Chemical
No. and Formation Thick- NearSource ness H K M sec. T. R. CaC03 MgCOs Si02 Ti02 AI2O3 FezOs R2O3
UnionNF91.920
NF910NF920La7oNF4441
Bailey . .
Bailey . .
Bailey . .
Bailey . .
Backbone .
95'45'50'60'40'
Aldridge . . .
Aldridge ....Aldridge ....LaRue . . . .
Wolf Lake . . .
mi
NE
swswsw
sw
SESESENENE
4 US4 US4 US
21 US23 US
3W3W3W3W3W
50.8754.2047.8658.1495.98
5.374.815.894.753.78
39.4637.2541.4433.580.68
1.03
3.59 l.U3.21 1.123.93 1.101.21 —0.30 0.10
—
L20nD2bD2S
Paint Creek .
Ste. GenevieveSte. Genevieve
18'
20'Anna . . . .
Anna . . . .
Anna . . . .
— NM NESESE
8 12S17 12S17 12S
IWIWIW
87.5691.5591.41
4.007.824.40
7.341.99 — 0.42 0.64
0.360.36
—
U66l> Ste. GenevieveNF174A1 Ste. GenevieveNF174C1 Ste. Genevieve
7' 4'
25'10'
Anna . . . .
Anna ....Anna . . . .
SE~SE
NWNW
NENE
17 12S20 12S20 12S
IWIWIW
95.6497.3093.10
2.131.335.44
1.761.071.82
— 0.920.50 0.290.68 0.33
—
NF174E1 Ste. Genevieve 26' 3' Anna . . . . SE NW NE 20 12S IW 93.98 4.83 2.10 — 0.45 0.33 —a — Anna .... — — — — — — 93.09 3.28 1.98 — 0.66 —
LinNF70ONF4431
Salem . .
Bailey . .
Salem . .
60'60'50'
Kaolin . . . .
Wolf Lake . . .
Mill Creek . . .
SE~NE
NWSW
WHNWSW
2 12S3 12S17 13S
2W3WIW
96.7056.2299.10
0.736.061.46
0.7236.30.29
— 0.20 0.102.18 1.420.26 O.U
—
W28SbNF930NF940NF93,
940
Warsaw-SalemBailey . .
Bailey . .
Bailey . .
40'30'
100'
103'
JonesboroReynoldsvilleReynoldsville
Reynoldsville
CC
NE
N^SE 1 13S
20 13S20 13S
20 13S
2W2W2W
2W
92.4661.6659.27
59.83
2.973.456.06
5.46
3.3031.5331.81
31.75
—1.48
2.96 1.072.64 1.74
2.71 1.59
—
VermilionTRl-lSl Livingston .
18' Fairmount . SE SW SW 21 18N 13W 96.42 1.17 1.25 — 0.49 0.77 —Warren
NF3721NF3731
Burlington .
Burlington .
4'
5'Monmouth .
Monmouth .
SESE
NENE
NENE
7 UN7 UN
2W2W
67.4293.64
18.021.00
12.954.78 — 1.03 0.64
0.62 0.52
—
NF3741 Keokuk . . U' 6' Monmouth . SE NE NE 7 UN 2W 41.50 18.73 35.70 — 2.30 1.80 —
Whiteside
Hiq Racine .20' Albany . . . . SE NE SE 24 21N 2E 55.89 43.63 0.10 — 0.25 0.21 —
KIQ Racine .26' Morrison. NW SW SE 7 21N 5E 55.95 43.22 0.24 — 0.19 0.25 —
63aDiq
Racine .
Waukesha .
18'40'
Fulton . . . .
Fulton . . , .
NWNW
NWNE
SWNW
36 22N19 22N
3E4E
55.2656.83
43.0742.48
0.100.18 - 0.24 0.41
0.63 0.36 —
Will
NF3951L126BkDS970Lll7Bk
k
Divine .
Niagaran(?) .
KankakeeEdgewood .
Edgewood .
4'
12'
4H
Wilmington .
' Rockville . . .
Wilmington .
' Wilmington .
Wilmington .
SE SE— NE— NEcen. N.
line— NW
SESWNE
NENE
26 33N26 32N31 33N
31 33N31 33N
9ElOElOE
lOElOE
89.3076.58
91.2086.3
2.9919.86
5.334.6
4.802.12
2.628.11
— 1.50 1.121.75
1.023.51
—
NF3941k
L125kNF4011NF4021
Kankakee .
Maquoketa .
Niagaran
.
Niagaran.Edgewood .
12'
16'
15'
Wilmington .
Wilmington .
Wilton Center . .
Elwood . . . .
Joliet . . . .
NWNW
NE
SENWNW
NE
se"SWNW
31 33N
20 33N19 34N28 35N
lOE
llEUE9E
84.2376.954.1550.5644.38
10.105.239.6940.9536.01
4.2413.583.806.8214.55
—1.21 0.712.382.70
1.47 0.672.75 1.42
—
NF3881NF3901NF3931R1929XLlUAk
Edgewood .
Edgewood .
Maquoketa .
KankakeeNiagaran
.
U'15'6'
bliet . . . .
Joliet . . . .
.oliet . . . .
. oliet . . . .
Joliet . . . .
SE SW
SWSE
NESESESWSE
35 35N35 35N35 35N16 35N17 35N
9E9E9ElOElOE
46.5236.9443.5652.7747.76
37.5530.1633.6142.1639.0
12.4024.8014.443.719.46
o.u
2.59 1.154.64 1.754.63 2.720.69 0.17
3.90
—
LlUBkLlUCkLll2kNF540NF550
Niagaran
.
Niagaran
.
Niagaran
.
KankakeeNiagaran.
23'40'35'50'
Joliet ....Joliet . . . .
Joliet ....Joliet . . . .
Joliet ....
— SESESWNENE
SESESESESE
17 35N17 35N20 35N21 35N21 35N
lOElOElOElOElOE
49.8153.2352.7650.8753.55
39.4641.4542.7840.7742.45
6.573.413.087.85.3
— 3.522.031.74
2.61.6
NF560LU3k
KankakeeNiagaran.
1' Joliet . . . .
Joliet . . . .— NE
NESESE
21 35N21 35N
lOElOE
34.7154.67
21.9642.90
33.4 — 9.01 1.990.12 —
—
A13QR1926X
Joliet . .
Niagaran . .
— Joliet . . . .
JoHet ....— NE
NESESE
21 35N21 35N
lOElOE
54.8449.47
43.3039.23
0.988.54
0.100.16
0.00 0.061.50 0.16 —
Footnotes appear^Qn page 5.

ILLINOIS LIMESTONE AND DOLOMITE ANALYSES 31
Continued.
Analysis
CaO MgO NaaO K2O CO2Losson
ignition
Miscellaneous Remarks
Yearsampletaken oranalysispublished
SampleNo.
County
28.5030.3726.8232.5853.77
2.572.302.822.271.81
— — — 24.42— — — 25.48— — — 23.47
0.09 0.04 43.61 43.60
49.03 1.9151.30 3.3651.23 2.10
53.6054.5252.17
1.020.642.60
— 43.28— 43.69
52.65 2.31
52.15 1.37
54.15 0.3531.5 2.955.53 0.70
51.82 1.4234.55 1.6533.21 2.90
33.52 2.61
County54.03 0.56
County37.77 8.6252.46 0.48
23.25 8.96 — —
43.2843.0643.04
— 43.32 42.94
— — 43.62
— — — 26.70.07 0.02 43.42 43.23
— — — 42.32— — — 27.99— — — 28.35
— — — 28.27
0.08 0.01 43.06 42.92
Lower 45'
Upper 50'
SO3 0.04; MnO 0.030;P2O6 0,009 . . . Total
P 0.017; insolublematter 1.99. .
Union Stone & Lime Co., Anna
Union Stone & Lime Co., AnnaAnna Quarries, Inc.; 0-7 '4" from baseAnna Quarries, Inc.; 20'6''-46'4"
from baseAnna Quarries, Inc.; 49'6"-75'9"
from base
MnO 0.005; SOs 0.15;P2O5 0.046 . . . . Jonesboro Stone Co.
Swan Creek Phosphate Co.Lower 30' ....Upper 100' ....
1934193419341934
NF91, 92NF91NF92La7
1946 NF444
19281912
L20D2
190719121934
D2U66NF174A
1934 NF174C
19341912
NF174E
19281934
LINF70
1946191219341934
NF443W28SNF93NF94
1934 NF93, 94
Material Service Corp.
County31.31 20.99
31.35 21.52
30.96 20.6031.84 20.59
0.00 0.00 — 39.07 Monmouth Stone Co.; basal 4'..— — — 41.39 Total alkalies calculated
as sodium oxide 0.06 . Monmouth Stone Co.; from 4-9'
above quarry floor
28.00 Monmouth Stone Co.; from 9-20K'above quarry floor
1952 TRl-18
1935 NF372
1935 NF373
1935 NF374
0.00
0.00
0.040.00
0.00 47.35
0.00 47.16
0.00 46.960.00 47.16
47 .57 SOs 0.04; P2O5 O.OOfMnO 0.015 . .
47 . 13 SOs 0.04; P2O6 O.OOfMnO 0.010 . .
47.3146.97 SOs 0.02; P2O6 0.00t
MnO 0.25 . . .
1943
19431943
1943
HI
Kl63
Dl
County50.04 1.4342.92 9.50
51.1148.32
47.2043.0530.3528.3324.87
26.0720.7024.4129.5726.76
27.9029.8329.5728.530.0
12.330.64
30.72n .12
2.552.19
4.832.51
18.9819.5817.22
17.9614.4216.0720.1618.65
18.8719.8220.4619.520.3
16.620.51
20.9218.76
40.55
41.84
— — 42.09— — 36.99
0.10 0.34
39.5631.5835.9744.89
0.120.12
0.060.73
46.7242.45
40.40
— — 38.54 38.54
41.7736.99
— 42.98 43.08— 37.97 38.24
39.7732.0536.36
42.744.8
— — — 26.2
46.77
FeO 0.29
MnO 0.07 . . .
Iron and silica 1.40oxides 0.78 . .
FeO 0.32 . . .
FeO 0.36 . . .
Barr quarry
0-15' from top34-40' below top of sectionHand specimenMarkgraf Stone Co., Joliet
Markgraf Stone Co., JolietMarkgraf Stone Co., JolietLincoln Crushed Stone Co., Joliet
National Stone Co., JoHetNational Stone Co. .
Hand specimen .
193619251934
NF395L126BDS97
19251925
L117B
19361925192519361936
NF394
L125NF401NF402
19361936193619521925
NF388NF390NF393R1929LlllA
19251925192519341934
LIUBLineL112NF54NF55
1934 NF56
192519431952
L113A13R1926

32 ILLINOIS STATE GEOLOGICAL SURVEY
Table 2.—
SampleFormation Thick-
nessNear
Location Chemical
No. andSource M }4 M sec. T. R. CaCOs MgCOs SiOz Ti02 AI2O3 Fe203 R2O3
Will
R1927Xt
e
t
Niagaran.Niagaran.Niagaran.Niagaran.
— Joliet ....Joliet ....Joliet ....Joliet ....
78-79qLl33k
Racine .
Niagaran. . .
7' New Lenox .
Lockport.
LI34kL132k17QAverageanal.dAverageanal.d
Niagaran. . .
Niagaran.Joliet . . .
Niagaran. . .
Niagaran. . .
8'
Lockport.Romeoville .
Romeoville .
Romeoville .
Romeoville .
NF760
NF750
Caprock CoalNo. 6. . . .
Caprock CoalNo. 6. . . .
4'
2'
Fordville. . . .
Spillertown . . .
39Q Prosser (upper-most). ... 25' Seward .
k Galena ... — Rockford.55Q Prosser (lower-
most). ... 26' Rockford.a ..... — Rockton .
a — Rockton .
a —. Rockton .
a — Rockton .
a ..... — Rockton .
Footnotes appear on page S.
— NE SE 21 35N lOE 53.70 42.43 2.60— — — — — — 54.67 42.90 1.40— — — — — — 41.92 40.51 —— — — — — — 47.68 40.70 7.96
NE SE NE 17 35N HE 54.19 42.38 2.04— SW NW 26 36N lOE 45.30 31.73 14.40
— SE SE 27 36N lOE 47.44 36.81 11.66— NW SE 25 37N lOE 46.01 36.15 14.20NE SE SW 35 37N lOE 54.80 42.54 1.29
SW SE 32 88 2E
SE NE 12 9S 2E
53.73 42.13 1.99 —52.61 41.84 1.90
76.8 12.13 7.7
54.8 26.8 9.0
0.15
0.12
0.35 0.09 —0.12 0.78 —— 1.77 —1.97 0.14 —
— 0.37 0.35 —6.70 —
— 3.84 —3.52 —
0.40 0.50 —— 0.63 1.15 —— 0.64 2.08 —
Williamson
— — — 3.9
— — 8.8
Winnebago
0.45 0.51 —NW NE NW 28 26N lOE 54.66 42.13 1.16
— SW SE 15 44N IE 53.00 43.00 2.00 _ — —NE SE SE 29 44N IE 54.32 43.44 0.94 — 0.40 0.32— — — — — — 51.03 33.31 3.14 — 3.29
— — — — — — 53.04 45.46 1.96 —— — — — — — 54.81 45.55 2.31 —— — — — — — 51.43 41.91 3.90 —— — — — — — 47.77 40.95 9.08 —
0.440.460.561.73

ILLINOIS LIMESTONE AND DOLOMITE ANALYSES 33
Concluded.
Analysis
CaO MgO NazO K2O CO2Losson
ignition
Miscellaneous Remarks
Yearsampletaken oranalysispublished
SampleNo.
County—Cont,30.09 20.29 0.130.64 20.61 -23.49 19.37 -26.72 19.46
30.36 20.7825.39 15.17
26.59 17.6025.78 17.2930.70 20.44
30.11 20.15
29.48 20.01
County
43 . 5.8
30.7 12.8
County
30.62 20.60
29.70 20.56
30.43 21.2028.60 15.93
29.72 21.7430.71 21.7828.82 20.0426.77 19.58
0.20 45.60 — FeO 0.38
0.42 0.16 41.13
— 45.95
46.30
— 39.8
— 38.9
0.11 0.07 46.03
0.02 0.04 46.56 47.03
— 46.42— 44.90— 46.77
Insoluble matter 14.73FeO 0.56; P2O6O.9I;MnO 0.07 ....
P 0.014 . . .
P 0.012; S 0.054
Hand specimen . . . .
National Crushed Stone Co.
National Stone Co.—bottom
Joliet Flux Stone Co.
Joliet Flux Stone Co.
— FeO 0.20; PaOs 0.02;MnO 0.045; SOj 0.06 .— Other ingredients 2.00 Hart & Page Co.
CO2 & H2O 6.28;Fe 1.25; S 1.26. Rockton Lime & Quarry Co.
Rockton Lime & Quarry Co.Rockton Lime & Quarry Co.Rockton Lime & Quarry Co.Rockton Lime & Quarry Co.
195219251866
R1927
192519431925
78-79L133
192519251943
L134L13217
1907 Avg. anals
1907 Avg. anals
1934 NF76
1934 NF75
19431925
39
1943 55
1912 —1912191219121912
=
Illinois State Geological Survey Report of Investigations 200
33 p., 2 tables, 1957