Chem 728 Lecture Notes – Part 1b - NMR
19
Chem 728 Notes 1b (NMR) 1/28/2003 Page 1 Chem 728 Lecture Notes – Part 1b - NMR The following are lecture notes for Chem 728 (by C. Martin, with minor modifications by L.Thompson). Much of the material is taken directly from the indicated references (old vH, some refs updated to new). This is not intended to replace the original references, but is made available solely for the convenience of students in the class. VH = “Principles of Physical Biochemistry,” Kensal E. van Holde, W. Curtis Johnson, & P. Shing Ho, Prentice Hall, NJ, 1998 (ISBN 0-13-720459-0) CS = “Biophysical Chemistry, Volumes I-III” Charles R. Cantor & Paul R. Schimmel, W. H. Freeman, NY, 1980 (ISBN 0-7167-1188-5, 0-7167-1190-7, 0-7167-1192-3) Magnetic Resonance Spectroscopies (CS 9; VH 12) ...................................................... 2 Introduction - Spin ............................................................................................................... 2 The classical / quantum mechanical spinning top .....................................................................2 Magnetic moments interact with magnetic fields ......................................................................2 Nuclear magnetic moments - allowed values and quantized energy levels.................................3 Magnetic properties of selected nuclei.......................................................................................3 Spin-Spin Interactions - J Coupling ................................................................................. 3 For the interaction between two non-equivalent spins A and B .................................................4 Magnetization........................................................................................................................ 4 Many spins - bulk magnetization and the NMR experiment ......................................................4 Transverse Magnetization - towards Fourier Transform NMR..................................................5 Steady-state absorption at resonance........................................................................................6 Transverse phase .....................................................................................................................6 The Bloch Equations Condensed...............................................................................................6 Brief aside: “rates” (k) vs. “lifetimes” or “half-lives” (T 1 and T 2 ) ...............................................7 T 1 - Longitudinal Relaxation - a.k.a. Spin-Lattice Relaxation Time .........................................7 T 2 - Transverse Relaxation - a.k.a. Spin-Spin Relaxation Time ................................................7 NMR Linewidths .....................................................................................................................9 Molecular Rotation ...................................................................................................................9 NMR - Properties of Molecules .......................................................................................... 9 Chemical Shift..........................................................................................................................9 Ring current shifts - aromatic amino acids.............................................................................. 10 Spin-spin interactions - splitting of resonance lines. ............................................................... 10 Chemical Exchange ................................................................................................................ 11 Fourier Transform NMR ................................................................................................... 12 The Rotating Frame ............................................................................................................... 12 Free Induction Decay.............................................................................................................. 12 90° / 180° Pulses ..................................................................................................................... 13 Pulse Sequences: 180° - t - 90° measures T 1 ........................................................................... 14 Pulse Sequences: 90° - t - 180° - The “Spin Echo” .................................................................. 14 Field Inhomogeneity............................................................................................................... 15 J-Modulated Spin Echo ( Hetero nuclear) ................................................................................ 15 Homonuclear J-Modulated Spin Echo ..................................................................................... 17 Concept: Population transfer .................................................................................................. 18 Measuring Through-Bond Couplings - COSY.......................................................................... 18 Measuring Through-Space Couplings - NOESY ...................................................................... 18 ESR ........................................................................................................................................ 18 Electronic Zeeman Interaction................................................................................................ 18 Spin-Spin Interactions - Hyperfine ......................................................................................... 18 Environmental Differences - g value ....................................................................................... 19
Transcript of Chem 728 Lecture Notes – Part 1b - NMR

Chem 728 Notes 1b (NMR) 1/28/2003 Page 1
Chem 728 Lecture Notes – Part 1b - NMRThe following are lecture notes for Chem 728 (by C. Martin, with minor modifications byL.!Thompson). Much of the material is taken directly from the indicated references (old vH,some refs updated to new). This is not intended to replace the original references, but ismade available solely for the convenience of students in the class.
VH = “Principles of Physical Biochemistry,” Kensal E. van Holde, W. Curtis Johnson, & P.Shing Ho, Prentice Hall, NJ, 1998 (ISBN 0-13-720459-0)
CS = “Biophysical Chemistry, Volumes I-III” Charles R. Cantor & Paul R. Schimmel, W. H.Freeman, NY, 1980 (ISBN 0-7167-1188-5, 0-7167-1190-7, 0-7167-1192-3)
Magnetic Resonance Spectroscopies (CS 9; VH 12)...................................................... 2Introduction - Spin ............................................................................................................... 2
The classical / quantum mechanical spinning top .....................................................................2Magnetic moments interact with magnetic fields......................................................................2Nuclear magnetic moments - allowed values and quantized energy levels.................................3Magnetic properties of selected nuclei.......................................................................................3
Spin-Spin Interactions - J Coupling................................................................................. 3For the interaction between two non-equivalent spins A and B.................................................4
Magnetization........................................................................................................................ 4Many spins - bulk magnetization and the NMR experiment......................................................4Transverse Magnetization - towards Fourier Transform NMR..................................................5Steady-state absorption at resonance........................................................................................6Transverse phase .....................................................................................................................6The Bloch Equations Condensed...............................................................................................6Brief aside: “rates” (k) vs. “lifetimes” or “half-lives” (T1 and T2) ...............................................7T1 - Longitudinal Relaxation - a.k.a. Spin-Lattice Relaxation Time .........................................7T2 - Transverse Relaxation - a.k.a. Spin-Spin Relaxation Time ................................................7 NMR Linewidths .....................................................................................................................9Molecular Rotation...................................................................................................................9
NMR - Properties of Molecules.......................................................................................... 9Chemical Shift..........................................................................................................................9Ring current shifts - aromatic amino acids..............................................................................10Spin-spin interactions - splitting of resonance lines. ...............................................................10Chemical Exchange ................................................................................................................11
Fourier Transform NMR................................................................................................... 12The Rotating Frame ...............................................................................................................12Free Induction Decay..............................................................................................................1290° / 180° Pulses.....................................................................................................................13Pulse Sequences: 180° - t - 90° measures T1 ...........................................................................14Pulse Sequences: 90° - t - 180° - The “Spin Echo” ..................................................................14Field Inhomogeneity...............................................................................................................15J-Modulated Spin Echo ( Hetero nuclear) ................................................................................15Homonuclear J-Modulated Spin Echo .....................................................................................17Concept: Population transfer ..................................................................................................18Measuring Through-Bond Couplings - COSY..........................................................................18Measuring Through-Space Couplings - NOESY ......................................................................18
ESR ........................................................................................................................................ 18Electronic Zeeman Interaction................................................................................................18Spin-Spin Interactions - Hyperfine .........................................................................................18Environmental Differences - g value.......................................................................................19

Chem 728 Notes 1b (NMR) 1/28/2003 Page 2
Magnetic Resonance Spectroscopies (CS 9; VH 12)
Introduction - SpinThe classical / quantum mechanical spinning top
We discussed previously how a circulating charge produces an electriccurrent. This current in turn produces a magnetic moment µm with anangular momentum,!L.
This is how most introductory NMR courses introduce spin angular momentum.Note, however, that this does not refer to an electron moving through space withinits orbital - that is called orbital angular momentum and will come up later. Theclassical (not quite correct) explanation for spin angular momentum pictures theelectron or nuclear proton "spinning about its own axis).
Note that for an individual particle (electron or atomic nucleus) quantum mechanicsdictates that angular momentum is quantized. For the electron, angular momentumis quantized in units of the Bohr magneton be. Quantum mechanics further dictatesthat the magnetic moment is related to the angular momentum by a factor ge.
For electrons: µm = -!gebe
/h L = ge L
where the Bohr magneton be = 9.27!x!10-21 erg gauss-1
Similarly, for nuclei: µm = -!gnbn
/h L = gn L
where the nuclear magneton bn = 5.05!x!10-24 erg gauss-1
Now, the gyromagnetic ratio g= µmL = -
gebe/h
(for electrons) or -!gnbn
/h (for nuclei)
, and can also be expressed as ze2m (it is also called the magnetogyric ratio in C&S) .
Quantum mechanics further tells us that L is quantized, having allowed values of:/ h[I(I+1)]1/2 (nuclei) or/ h[S(S+1)]1/2 (electrons).
Therefore allowed values of µm are g/ h[I(I+1)]1/2 (nuclei) or g/ h[S(S+1)]1/2 (electrons).Magnetic moments interact with magnetic fields
The magnetic moment can interact with amagnetic field,!H, to produce a torqueperpendicular to the plane defined by H and µm.t = µm x HThis torque then acts to produce a change (dL) inthe angular momentum according to
dLdt = t = µm x H =
ze2m L x H = L x
ze2m H = L x wo
where wo is termed the Larmour frequency. We say that the magnetic momentprecesses about the applied magnetic field H with an angular velocity of precession ofwo.

Chem 728 Notes 1b (NMR) 1/28/2003 Page 3
Nuclear magnetic moments - allowed values and quantized energy levelsThe energy associated with a magnetic moment in an applied field isE = - µm • HNote that the dot product really means “the component along...” asshown in the diagram at right.So that E = - µm H cos q= - µmz Hµmz is the component of µm along H.But quantum mechanics dictates that µmz takes on discrete valuesaccording toµmz = mI g / h where mI = I, I-1, I-2, ..., I-2IE = - mI g / h H = -mI gNbN HNote that the quantum mechanical restrictions on µmz require that µm is always slightlyoff axis. Therefore, µm always precesses about HZ, as we saw before.
Magnetic properties of selected nuclei
Nucleus I g (rad G -1 s -1 % Nat.Abun
Rel. Sens.
1H 1/2 26753 99.98 1.0002H 1 4107 0.016 0.009612C 013C 1/2 6728 1.11 0.01614N 1 1934 99.64 0.001015N 1/2 -2711 0.37 0.001016O 017O 5/2 -3627 0.037 0.02919F 1/2 25179 100 0.83423Na 3/2 7076 100 0.09331P 1/2 10840 100 0.06635Cl 3/2 2621 75.53 0.004737Cl 3/2 2182 24.47 0.0027
Nuclei with no net spin (I=0) are useless to us in NMR for obvious reasons. Nuclei withI>1/2, have an additional interaction known as the the nuclear quadrupole interaction,which greatly increases their relaxation rates, and therefore, as we will see later, theirNMR linewidths. For this reason, NMR is most simple for nuclei with I=1/2. From theabove, we see that the most useful biological nuclei are 1H, 13C, and 31P, with 15N beingsignificantly less sensitive. Other nuclei have proven useful in special cases, notably2H, 19F, 23Na, 35Cl, and 37Cl.The relative sensitivity above refers to the expected signal strength for samples withthe same number of nuclei and is related to g (see CS p. 489).
Spin-Spin Interactions - J CouplingRemember the Nuclear Zeeman interaction:
EZeeman = -mI ghH = -mI gN bNHA spin with mI = +1/2 is said to be a, while a spin with mI = -1/2 is said tobe b.mI = +1/2 (a) refers to a spin aligned with the field. This is a favorableinteraction. Energy is lowered by this favorable interaction. Converselyfor spin with mI = -1/2 (b).

Chem 728 Notes 1b (NMR) 1/28/2003 Page 4
For the interaction between two non-equivalent spins A and B
EAB = -mI A
mI BJ AB JAB = spin-spin
coupling constantIf one nuclear spin is aligned with thefield, then the total field that the secondnucleus feels is larger. If the secondnuclear spin aligns with this field, it isstabilized more than it when alignedwith the external field only. In otherwords, if the spins are both a (or both b),then the energy of the system decreases.However, if the spins are alignedopposite to each other, the energy of thesystem is increased relative to theenergy for no interaction.This yields the following for the totalenergy of the system
†
EZeeman = -mIAgNA
bN H - mI BgN B
bN HEZeeman+ SpinSpin = -mI A
gN AbN H - mIB
gNBbN H + mIA
mIBJAB
EZeeman+ SpinSpin = -mI AgN A
bN H - mIBgNB
bN H + mIAmIB
JAB
MagnetizationMany spins - bulk magnetization and the NMR experiment
N.B. The following assumes a spin system with I (or S) = 1/2. In this system, there areonly two quantum mechanically allowed states (or energies). Analogous argumentshold for systems with I > 1/2, but there will be more allowed states.Consider a collection of nuclei, each with magnetic moment µm. In the absence of amagnetic field, the magnetic moments are randomly oriented.Now apply a field along the (laboratory) z-axis. The nuclei will tend toalign along the axis of the field and will precess about this axis at theLarmour frequency, wo. They will eventually populate the allowedquantized energy levels according to the Boltzmann distribution. Buthow do they get there?As with absorption energy levels seen before, the spins interchangebetween energy levels via thermal energy, that is, by interaction withthe environment. As a consequence of these random interactions withthe environment, the total magnetization (bulk magnetization) willincrease with time according to
Mz = M_
z ( 1 - e-t/T1 ) Mx = My = 0 (the field remainsrandomly oriented in the xy directions)where T1 is termed the “longitudinal relaxation time” (longitudinalrefers to the direction of the field axis). Again, as we saw in absorption spectroscopy,the non-radiative mechanisms which couple the two states (and determine T1) can bequite complicated and depend on exactly how the molecule interacts with itsenvironment.Note that the nuclei are precessing about the field axis, but since they have no phaserelationship, the net magnetization in plane remains 0 (all contributions cancel eachother in a randomly precessing group of spins).
Chem 728 Notes 1b (NMR) 1/28/2003 Page 5
We can measure T1 by applying a magnetic field at a given instant in time and thenwatching the growth of the magnetization along the axis of the field. This is not,however, how T1 is normally measured.The picture so far presented forms the basis for simple “continuous wave” (CW) NMRspectroscopy. For a system with I (or S) = 1/2, we have a system of two differentquantized energy levels (spin up and spin down).∆E = g/ h H = / h wo = h no for I (or S) = 1/2Application of electromagnetic radiation of the appropriate energy (now in theradiofrequency region of the spectrum) can induce transitions between levels. Sincethere is a net population difference, we will have a net absorption of radiofrequencyenergy, which is measured in a manner analogous to before (now a coiled wire, anantenna, forms the basis for the generation and detection of the “light” (radiofrequency).Also note that in the absence of an applied magnetic field, there is no difference inenergy between the two states (in fact, there is no direction about which to quantize thestates). The energy gap between the two states is proportional to the applied magneticfield.
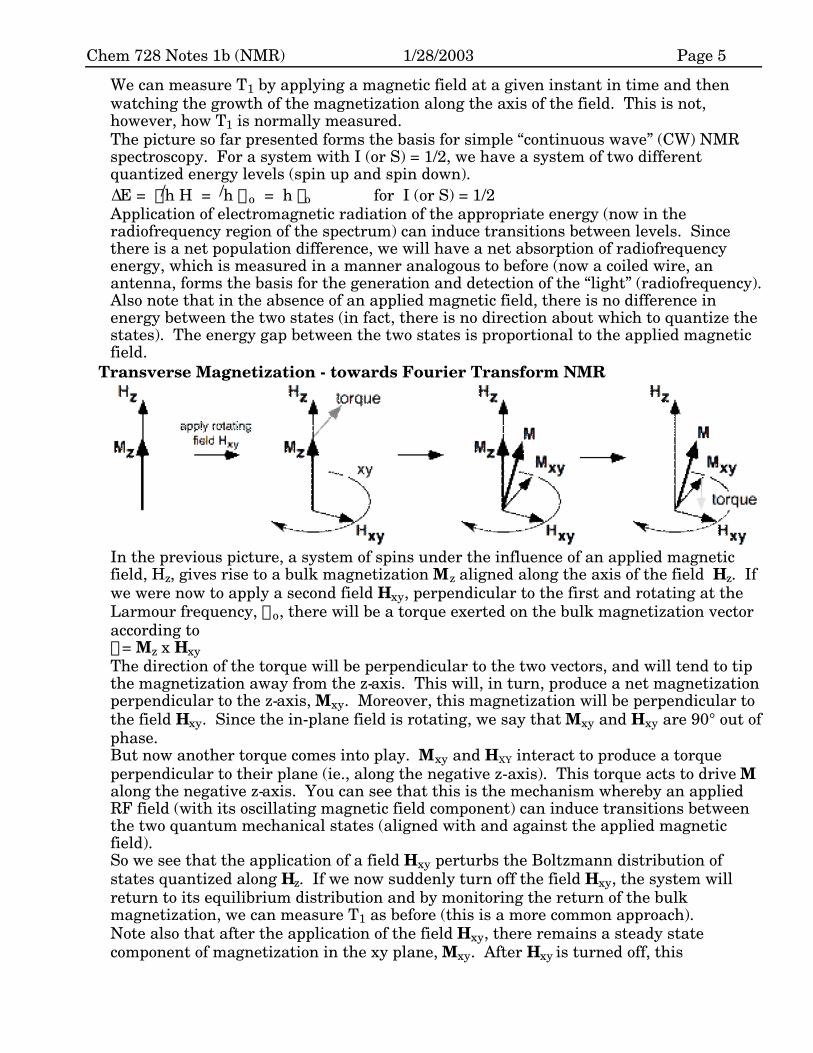
Transverse Magnetization - towards Fourier Transform NMR
In the previous picture, a system of spins under the influence of an applied magneticfield, Hz, gives rise to a bulk magnetization Mz aligned along the axis of the field Hz. Ifwe were now to apply a second field Hxy, perpendicular to the first and rotating at theLarmour frequency, wo, there will be a torque exerted on the bulk magnetization vectoraccording tot = Mz x HxyThe direction of the torque will be perpendicular to the two vectors, and will tend to tipthe magnetization away from the z-axis. This will, in turn, produce a net magnetizationperpendicular to the z-axis, Mxy. Moreover, this magnetization will be perpendicular tothe field Hxy. Since the in-plane field is rotating, we say that Mxy and Hxy are 90° out ofphase.But now another torque comes into play. Mxy and HXY interact to produce a torqueperpendicular to their plane (ie., along the negative z-axis). This torque acts to drive Malong the negative z-axis. You can see that this is the mechanism whereby an appliedRF field (with its oscillating magnetic field component) can induce transitions betweenthe two quantum mechanical states (aligned with and against the applied magneticfield).So we see that the application of a field Hxy perturbs the Boltzmann distribution ofstates quantized along Hz. If we now suddenly turn off the field Hxy, the system willreturn to its equilibrium distribution and by monitoring the return of the bulkmagnetization, we can measure T1 as before (this is a more common approach).Note also that after the application of the field Hxy, there remains a steady statecomponent of magnetization in the xy plane, Mxy. After Hxy is turned off, this

Chem 728 Notes 1b (NMR) 1/28/2003 Page 6
magnetization component will also decay, but now with a different time course, T2.With time
Mxy = (Mxy)0 e-t/T2 The parameter T2 is called the transverse relaxation time. The same interactions withthe environment which give rise to T1 relaxation contribute to T2, but additionalmechanisms exist for T2 relaxation. Consequently, T2 < T1.In order to maintain the 90° phase relationship between Hxy and Mxy, the field Hxymust oscillate at the Larmour frequency wo. The energy of the radiofrequency radiationproducing Hxy must beE = / h wo which is the energy gap between the levels (see above).Thus the “light” (RF) producing the transverse field Hxy must oscillate at the frequencywo which corresponds to the energy gap between the quantized states.
Steady-state absorption at resonanceWe have mentioned above that the application of a field Hxy rotating at the Larmourfrequency induces a component of the bulk magnetization in the xy plane. We have alsodiscussed how this field can induce transitions among allowed Mz states, as forabsorption spectroscopy. But as before, there are also thermal processes (non-radiative)which tend to drive the population of states back to the equilibrium Boltzmanndistribution. These are T1 processes.Similarly, the equilibrium situation in the xy plane is Mxy = 0. But the application ofHxy rotating at wo causes a net magnetization Mxy rotating 90° out of phase with Hxy.Again, thermal processes (T2) tend to drive this back to the equilibrium value of Mxy =0.As for absorption processes in the optical regime, as long as thermal processes canredistribute the system to near Boltzmann levels faster than you can excite them, youwill continue to have a net absorption of energy (the energy is eventually beingfunnelled off into the thermal processes - heat).
Transverse phaseWe instituted the requirement that Hxy be oscillating very near the Larmour frequencywo. We see from above / hwo (hn) corresponds to the energy between states. That makesperfect sense from what we’ve seen before.Another way to look at this requirement is to examine the phase relationship betweenthe involved vectors. When Hxy is applied, it generates a torque on Mz to create Mxy inplane and at 90° to Hxy. Mxy will continue to precess at wo. As long as Hxy also rotatesat wo, the two will remain at 90°. If Hxy is rotating at w≠wo, then the angle betweenthem will slowly drift from 90°. But Hxy will continue to exert a torque on Mz and sowill create a new Mxy at 90° to Hxy. But this new Mxy will of course not align with thepreviously produced Mxy (no longer at 90° to Hxy). You can see that the magnetizationgenerated in the xy-plane will be random and will cancel itself out. The netmagnetization Mxy will be 0.
The Bloch Equations CondensedCantor & Schimmel discuss an approach to understanding NMR first proposed byBloch. We will skip over this formalism although students interested in seriouslyapplying NMR will do well to read this chapter carefully (p. 493-498).From this approach we have a formula for NMR signal strength:
Signal!! µ !!N !!µ 2
mz!!!H2z
kT !!!g2HxyT2
1!+!T22(wo-w)2!+!g2H 2
xyT1T2 I=1/2 only

Chem 728 Notes 1b (NMR) 1/28/2003 Page 7
Note that, as expected, the signal strength is directly proportional to the number ofspins in the sample, i.e. to the sample concentration. Also note that the signal increases
as H2z , such that a doubling of field strength quadruples the signal.
Brief aside: “rates” (k) vs. “lifetimes” or “half-lives” (T1 and T2)
It is important to note that lifetimes are inversely proportional to rate constants k = 1T
Thus, faster (larger) relaxation rate = shorter (smaller) relaxation time (and viceversa).
T1 - Longitudinal Relaxation - a.k.a. Spin-Lattice Relaxation TimeWhat happens when T1 is “Large” (“long”)? From the above equation: signal µ 1/T1
When the longitudinal relaxation time is long, thermal processes do not reequilibratethe levels efficiently so that application of Hxy causes the two levels to be more equallypopulated and we have fewer net transitions in an absorption direction. Signaldecreases. This effect is called saturation and will prove very important in the future.What is the basis of T1 relaxation?
We know that non-radiative processes are due to interactions with the environment. For opticalabsorption, the mechanism of non-radiative mixing of the ground and excited states is often theinteraction of the molecule with fluctuating dipoles in the environment. In the case of T1, themechanism of mixing is via i nteraction with fluctuating (randomly oriented) magnetic fields in themedium. To the extent that a neighboring field has a magnetic component along Mxy which isoscillating at the Larmour frequency w o, it can act just like Hxy to induce a transition between thequantized mz states.
We call the environment the “lattice” (hence “spin-lattice relaxation) and its naturestrongly effects T1. In liquids or gases there is substantial molecular motion such thatthe local magnetic fields produced by neighbor molecules have a wide frequencydistribution. This means that there will be a number of oscillating fields at wo and T1can therefore be small (“fast”), typically <10!sec. In a solid, those motions are severelyrestricted so that the low frequency fluctuations can be << wo. In this case T1 can behours.N.B. - the rotation of neighboring molecules giving rise to fluctuating magnetic fields isrelative, that is, it doesn’t matter which of the two molecules is doing the rotating.Thus, if we are measuring T1 of methyl group protons, even though the environmentalmagnetic fields may be rotating slowly with respect to the molecule (protein) to whichthe methyl group is attached, the methyl group itself may be rotating quite readily.Thus from its point of view, the environment is rotating rapidly - the magnetic fieldsthat it “sees” are fluctuating at a high rate. Thus different atoms within the samemolecule may have very different relaxation rates.
T2 - Transverse Relaxation - a.k.a. Spin-Spin Relaxation TimeThe frequency wo with which spins precess about the applied field is a function of thatfield Hz. But the effective field that an individual spin “sees” is influenced by theenvironment, and so can be written Hz + ∆Hloc. Just as the field will be heterogeneousdue to local environement, so too will be wo. This means that spins in the xy-plane willprecess at individual frequencies, wo±wloc.In addition, this group of spins will not retain their phase relationship and Mxy willdecay once the tipping field is turned off.This loss of phase occurs via two mechanisms:1) ∆Hloc due to small time-dependent fluctuating fields from the local environment. Inother words, immediately after the spin “packet” is tipped into the xy!plane, the spinsall have the same phase. But with time, one spin may have its ∆Hloc altered, changing

Chem 728 Notes 1b (NMR) 1/28/2003 Page 8
at the same time, its phase. Even if it returns to its original ∆Hloc, its phase “memory”is lost.2) spin exchange with neighboring nuclei. In this latter case, an two neighboring nucleiof opposite spin can exchange the sign of their spins (analogous to energy transfer we’veseen before). But in the process of this exchange, the phase relationship that each spinhad is lost. Similarly T1 transitions between mz levels also cause a change in spin andcontribute to T2 dephasing - T2 will therefore always be at least as fast as T1.

Chem 728 Notes 1b (NMR) 1/28/2003 Page 9
NMR LinewidthsReturning to the equation for signal strength, we can simplify it somewhat to reveal theeffects of T1 and T2 on the NMR signal.
Signal µ T2
1!+!T22(wo-w)2!+!g2H 2
xyT1T2
Signalmax µ T2
1!+!!g2H 2xyT1T2
maximum signal
at resonance, w = wo (the “peak” of thesignal)We can combine the two equations above todetermine the linewidth ∆w = wo-w at whichthe signal is half of its maximum value.
∆w1/2 = 2T2
(1 + g2H 2xyT1T2) 1/2
From the above, we can see that:As T2 gets small (solids), the linewidth
goes as 1/T2: the linewidth increases (signalbroadens) for decreasing values of T2.
As T2 increases (liquids; note that T1 must also be increasing), The linewidthdecreases (signal narrows).
Also note that the linewidth is independent of Hz.
Finally, note that when g2H 2xy T1T2 << 1, ∆w1/2 =
2T2
and Signalmax µ T2
Molecular RotationIf a molecule (or a molecular substituent) is rotating quickly enough in space, thenduring the time course of these measurements, a nuclear spin will only “see” an averageenvironment (just like the rotational averaging we saw for Förster energy transfer). Inthis case, ∆Hloc is the same for all nuclei of that type and T2 dephasing is much less.Similarly neighboring nuclei spend too little time near each other to exchange spin. Inthis extreme narrowing limit1/T2 ≈ 1/(2 T1)A factor which often limits NMR of proteins is in fact the slow rate at which themacromolecule (and therefore the fixed nuclei within it) tumble randomly in solution.Again, note that even for a very slowly tumbling protein, protons on a surface methylgroup may rotate at a much higher rate (and show sharp resonances). In solids we havethe extreme limit of limited rotation, and consequently we generally see very broadspectra for solids. However, it is now possible to mechanically spin the sample at a
frequency greater than T-12 . Actually, this is not completely true. To average out 1H-1H
and 1H-13C interactions would require prohibitively fast spinning. These are averagedout by high power decoupling.
NMR - Properties of MoleculesChemical Shift
So far, we have implicitely dealt with groups of identical nuclei. They may have beenrandomly in slightly different environments (thus giving rise to relaxational effects),but on average they all felt the same field. But in a real molecule with multiple nuclei,we know that some nuclei are different environments than others in a well-defined way.
log tc solidliquid
T1
relaxation can occur when
neighboring nuclei rotate near theLarmour frequency. Thus there is aminimum in T1 (maximumrelaxation) at a particular rotationalcorrelation time.
T2
is always less than T1.
T2
increases as mole-
cules rotate more rapidly.Small fluctuations in Hlococcur so rapidly that thenucleus sees only theaverage. Thus no mecha-nism for dephasing.
faster rotationsharplines
broadlines

Chem 728 Notes 1b (NMR) 1/28/2003 Page 10
For example, methyl protons are in a different environment than are amide protons.And in a given molecule or protein, certain amide protons will be in differentenvironments than are other amide protons (interacting with solvent in a random coil,H-bonded to a amide carbonyl in an a-helix, etc.).For this reason, not all protons feel the same net Hz. We can write:
Hz’ = Hz - Hzs = Hz(1-s) s = Hz!-!Hz’
Hz
s describes how much the local environment adds to (or subtracts from) the applied fieldHz.More generally, the additional field produced by the environment is compared to theeffective field in a reference standard sample. In this case
d = Href-Hsamp
Href x 106 =
nref-nsampnref
x 106 expressed in parts per million.
where Href is the effective field felt by the reference nucleus and Hsamp is that felt by thesample nucleus. Alternatively, one can speak about resonance frequencies, n, atconstant field.Thus we have an NMR spectrum, most often plotted as a function of frequency or ppm.Individual protons in a molecule will resonate at individual frequencies in thespectrum.
At a field strength of ≈100,000 guass, most protons resonate over a range of ≈5,000!Hz,centered around 500!MHz. Values of d range between 0 and 10 ppm (relative to theprotons of sodium 2,2-dimethyl-2-silapentane-5-sulfonate, DSS, or tetramethylsilane,TMS).
Ring current shifts - aromatic amino acidsWe will not go into a detailed analysis of which groups show what type of shifts, but oneeffect can be very important in the study of proteins. For an aromatic compound suchas benzene, we have seen that electrons reside in delocalized, circular p systems. In thepresence of an applied magnetic field, these electrons are driven in a circular motionwithin these orbitals. This circulating charge produces an inductive magnetic moment.The resulting field adds to the applied field outside of the aromatic ring, and opposesthe applied field within (above and below) the ring. Thus ring protons, which protrudeon the outside edge of aromatic rings found in Phe, Tyr, etc, feel a field larger thanapplied magnetic field. This leads to a shift in d of as much as 8-10 ppm.
Spin-spin interactions - splitting of resonance lines.The environmental effects discussed above are due to interactions between nuclearspins and other factors in the environment - the magnetic field produced by anoscillating electric dipole or the magnetic moment produced by circulating electrons.Another very important interaction is that between two nearby spins. The magneticmoment associated with one spin adds to the effect magnetic field felt by the other andvice versa. From the point of view of one nuclear spin, the neighbor spin can be eitheraligned with or against the applied field (remember that it is quantized). So the fieldfelt by the first spin is Hz±0.5J, where J is called the (spin-spin) coupling constant andthe neighbor spin has I=1/2. In the spectrum, this results in two absorbance linescentered at the original frequency and split by J.

Chem 728 Notes 1b (NMR) 1/28/2003 Page 11
You can readily see that for the interaction of one spin with twoidentical neighboring spins (I=1/2), the single transition will be splitinto two and each of those again split into two. Since the splittings areidentical, we get the familiar 1:2:1 pattern. If the two neighboring spinsare not identical, then the resulting pattern will be a doublet ofdoublets. Try this one for yourself.Spin-spin splitting is very useful in NMR in that it tells us who is nextto whom in the molecule. Such information is absolutely essential inassigning protein spectra. As you will see, the detailed mechanism of this interactioncan be either through-space or through-bond.Spin-spin splitting can sometimes get in our way as well. We have seen before that if aparticular contributor to a spin’s environment is fluctuating in its properties faster thanthe time course of the measurement, then the spin “sees” only the average of thatfluctuation. In the case of one spin splitting another (different) spin, if we were to applya second oscillating field at the resonance frequency of the second spin, then the firstspin will see only an average - in this case since the two choices are spin up and spindown, the average will be zero. In this way, then the first spin is no longer split by thepresence of the second spin. This general phenomenon is called decoupling.
Chemical ExchangeWe have seen above that if a nucleus is flipping its spin very rapidly, then its neighborswill see an average of the flipping states (no spin, in this case). This averaging is ageneral effect. In fact, if a nucleus is jumping back and forth between two (or more)environments, the NMR properties of that nucleus will be an average of the two states(specifically, an average weighted by the proportion of time spent in each state).Slow exchange
Consider a nucleus which can be in two chemical environments: A or B. Designate the lifetime instate A as tA and the lifetime in state B as tB. Also let the resonant frequencies of the nucleus inthe two environments be wA and wB.
For conditions of “slow exchange,” tA >> 1
wA!-!wB AND tB >>
1wA!-!wB
two distinct lines are seen in the NMR.
Moreover, their T2 relaxation times are given by 1
T !2i
= 1
T02i
+ 1ti
where 1
T02i
is the relaxation time of the nucleus in site i in the absence of exchange.
Fast exchangeIf however the lifetime of the nucleus in each state is shorter than the precession time, then the lines
will merge into a single line. Under these conditions, the T2 relaxation time is1
T2 = cA
1
T0
2A
+ cB 1
T0
2B
+ c2A c2
B (wA-wB) 2 (tA+tB)
where cA and cB are the fractions of the nuclei in states A and B, respectively. This effect is calledexchange broadening.
This phenomenon can often be used to measure dynamics in biological systems.

Chem 728 Notes 1b (NMR) 1/28/2003 Page 12
Fourier Transform NMRThe Rotating Frame
wo wo-wawo+wb
0
-wa
wb
We have now seen that in a real NMR sample, there is a magnetization vector for eachnucleus in the sample and that each of these vectors precesses about the applied field ata slightly different rate due to differences in environment. The figure at left illustratesseveral precessing spins in the xy-plane. If we fix our reference system on the centralspin (i.e., rotate our coordinate system at a frequency wo, then the rotating spins appearas at right. The spin that was precessing at exactly wo is now stationary. Spinsprecessing more slowly, now precess in a negative direction and those precessing at ahigher frequency precesses in a positive direction. Note immediately following theinitial 90° pulse which rotated the magnetization away from Hz, all spins are aligned.With time those that precess faster get away from those that precess more slowly. Theactual precession angle as a function of time is given by wit.
Free Induction DecayWe saw before that if we tip the magnetization into the xy-plane, a component of themagnetization in the xy-plane precesses about the field. If we place a radio receiverantenna (“coil”) in the xy-plane, this precessing magnetization will induce a sinusoidalcurrent in the receiver, corresponding to its precession. We also saw that the netmagnetization will slowy decay, as T2 processes lead to a gradual dephasing of thespins. The resulting free induction decay, or FID, may look something like the figurebelow.
-1
-0.6
-0.2
0.2
0.6
1
0 225 450 675 900
S1=e-t/200
S2=e-t/200sin(at)
Time (msec)If there is more than one spin, then the signal will be a combination of more than onesine wave. Each with its own characteristic frequency and relaxational properties. TheFID for two spins might look something like the one below.

Chem 728 Notes 1b (NMR) 1/28/2003 Page 13
Via a mathematical transformation of the data known as a Fourier transform, one candecompose the above FID into a frequency domain spectrum in which each peak in theNMR spectrum corresponds to a spin-generated sine wave above, and the linewidth ofthe signal reflects the relaxational properties we examined earlier (from the Blochequation result above).This is the simplest basis for an NMR experiment. But it gets more complicated... Andthe information gets richer...First, let’s look more at the Fourier transform. Note in the above figure that the sinewave which decays more rapidly (ie. the one with the shorter T2), gives rise to a morebroad signal in the resulting Fourier transform frequency domain spectrum. This iswhat the Bloch equations told us should happen.We can manipulate FID’s (and often do) in the computer to artificially alter theapparent linewidths of the NMR resonances. We saw before that it is an inherentproperty of the Fourier transform that fast decay in the time domain gives rise to broadresonances in the frequency domain, and of course the opposite is true. Indeed, if ourspectrum is characterized by broad lines and we want to be able to distinguish peaksbetter, we can artifically multiply our expermental FID to decrease the early timesignals and increase the later ones. This is typically done by applying a Gaussianmuliplication to the FID. The result is an FID which decays more slowly. When weFourier transform this, we get a spectrum with sharper peaks!Why don’t we just keep doing this more and more to get infinitely resolved peaks?!Notice that the beginning of the FID has more “information” in terms of the sine wave.The end of the FID has much less (typically we collect an FID until the signal hasdecayed completely). In the manipulation we did above, we decreased the early (signal-rich) part of the FID and increased the late (noise rich) part of the FID. Consequently,as we do this, we decrease the signal-to-noise ratio of our final spectrum. This limitshow much we can artificially increase the resolution. There is no free lunch.In fact, if we have a spectrum with good resolution but poor signal to noise, we can dothe opposite. We can apply a exponential decay weighting function to our FID. Thisincreases the signal-rich part of our FID and decreases the noise-rich part. The signal-to-noise ratio of the final spectrum increases (but our peaks broaden somewhat).
90° / 180° Pulses90° PULSE - If we apply a very intense field Hxy for a very short (but specific) period oftime, we can tip essentially all of the magnetization away from Mz. The angle by whichthe magnetization is tipped is given by q = gHxy ∆t (this can be readily derived fromwhat we learned about torque on magnetic moments above). So we see that the angle isa function of both the intensity of the field and the time for which it is applied. If we tip

Chem 728 Notes 1b (NMR) 1/28/2003 Page 14
the magnetization 90° (a 1-200!µsec pulse under typical conditions), after the transversefield is gone, there will be magnetization in the xy-plane rotating at wo. As the T2 phasedecays, so too will the net magnetization in the plane (and so then will our signal). Thissignal is known as the free induction decay.180° PULSE - In a similar fashion, we can apply twice the field strength (or the samefield for twice the time) and tip the magnetization all the way around 180°. Note that inthis experiment, we have taken the whole system from its Boltzmann distributionproducing the original Mz to one with a net -Mz. At the end of the pulse, the system willslowly decay back to its Boltzmann value of +Mz according to T1.
Pulse Sequences: 180° - t - 90° measures T1We can exploit a combination of pulses above, to measure T1 and T2. We just say thatfollowing the application of a 180° pulse, the net magnetization is changed from +Mz to-Mz and that with time this decays back to +Mz according to T1. But our detectionscheme has relied on detecting a rotating magnetization in the xy-plane. At no time inthis sequence, is there net magnetization in the xy-plane.Now look at what happens if we apply a 180° pulse, followed immediately by a 90°pulse. This is essentially the same as a 270° pulse. All of the magnetization will besent to the xy-plane and we will see a large signal in our detector. If however, we applya 180° pulse and wait a short period of time (t), the magnetization -Mz will decrease
according to e-t/T1 . If we then apply a 90° pulse, we will tip the remainingmagnetization into the xy-plane and see a signal (now smaller, reflecting the fact thatthe tipped Mz was smaller). This is called a 180-t-90 pulse sequence.
Pulse Sequences: 90° - t - 180° - The “Spin Echo”
The above “pulse sequence” is the basis for much of modern FT NMR. It is veryimportant to examine what is happening during the time course of this pulse sequence.We first apply a 90° pulse to tip the bulk magnetization into the xy-plane. As we haveseen, the spins will precess about the field, but each at a slightly different w due toslight differences in the chemical shift of each spin. If we wait a period of time t thebulk magnetization will have spread out in the plane, reducing the overall signal, but inthe absence of dephasing, each spin is precessing at a different, but well-definedfrequency w. If we then apply a 180° pulse, each spin will be rotated about y as shownabove. Each spin is still precessing about the applied field at its own frequency, butnow in the opposite direction that it had been. These means that each spin will retraceits steps and after a time (exactly) t, they will all end up together (rotated 180° fromwhere they were placed by the initial 90° pulse). Thus the spins will coalesce, returningthe signal to its maximum value and producing an echo.
90° 180°t t
Tip themagnetization into
the xy-plane
Spins withdifferent w,
precess differently
2nd pulserotates allspins 180°
Spins nowprecessing in
opposite direction
Spins with originalphase re-focus,
producing an “echo”
SIGNAL

Chem 728 Notes 1b (NMR) 1/28/2003 Page 15
But we know that in a real system, T2 processes will occur,leading some spins to lose their original phasing. Suchspins will not coalesce with the rest to produce the echo attime 2t. Thus, if we plot the echo intensity as a function oft, the resultant trace will decay as e-t/2t as shown at right.
Field InhomogeneityThis pulse sequence is useful for another reason. NMRmagnets are not perfect and it is impossible to design onesuch that every spin in the sample sees exactly the same Hz.One part of the tube will have a slightly different Hz(remember it only takes one part in a million to mess things up...). This means thatprotons which are chemically the same (eg. methyl group protons at the “3” position ofour molecule) should precess at the same wo in fact will have different precessionfrequencies. This means that they no longer precess together and their bulkmagnetization in the xy plane decays more rapidly than it intrinsically should - thesignal for that proton is broadened and if we were to measure the simple decay to get T2we would get the wrong value.In the pulse sequence above, after the first 90° pulse, these spins separate from eachother in the plane. However, after the 180° pulse, they refocus exactly! Only truedephasing will keep them from refocusing and producing our spin echo. Thusmeasuring T2 by the spin echo method gives us the true T2.
J-Modulated Spin Echo (Heteronuclear)We have discussed how spin-spin interactions occur because one nucleus“feels” the magnetic field produced by a neighboring nucleus. Let’s considernot just two different kinds (chemical shifts) of spins, but two different kindsof nucleus (eg. 1H and 13C) - heteronuclear coupling. As an example, let’slook at the 13C NMR spectrum of chloroform: CHCl3. We know that the 13Cresonance will be split into two by interaction with the 1H nucleus (which iseither spin up or down). The 13C resonances precess at wo ± JCH/2, or in therotation frame, they precess at +JCH/2 and -JCH/2.
-1/2 JCH
tD 180° tD
a
b
1/2 JCH
-1/2 JCH
1/2 JCHa
b
aquire (13C NMR)
1/2 JCH
-1/2 JCHb
a
But now, let’s repeat the experiment but applying 1H decoupling throught the seconddelay (tD) and the aquisition (but not during the initial delay. When decoupling is on,the two 13C spins now precess at the original (chemical shift) wo (in other words they donot precess in our rotating frame). We get an FID from them, corresponding to a singlepeak centered at the chemical shift. But notice that the intensity of this peak is lessthan what it would have been had there been decoupling throughout the entire process.

Chem 728 Notes 1b (NMR) 1/28/2003 Page 16
Now let’s lenghten the delay time tD:
In fact, the extent to which this signal is decreased is a function of the delay time tD andthe J-coupling precession frequency (JCH/2). Depending on their relationship, theresulting “static” vector canbe large (1/2 J tD = 0,2π),zero (1/2 J tD = π/2,3π/2), ornegative (1/2 J tD = π).
We have talked before howthe FID is simply acollection of sine waves andthat when we Fouriertransform this “timedomain” we get a “frequencydomain” spectrum. We canthink of tD as a new timevariable. By convention,since tD comes first it isoften called t1 (not to beconfused with T1 and theFID time domain is calledt2. When we FT timedomain t2 in this case eachresonance will varysinusoidally with t1, withthe frequency of that oscillation determined by the J/2 coupling (modulated by Jcoupling). So if we FT the entire set of spectra obtained obtained in the aquistion, wewill get a frequency domain in this second dimension. 2!dimensional NMR!Note that the extent to which the spins have precessed during the delay is a function oftheir spin-spin (in this case) coupling strength and the delay time. This coupling will bedifferent for different spins with different couplings.
-1/2 JCH
tD 180° t D
a
b
1/2 JCH a
b
aquire ( 13 C NMR)
1H decouple
a
b
-1/2 JCH
tD 180° t D
a
b
1/2 JCH
aquire ( 13 C NMR)
1H decouple
a
b
a
b
-1/2 JCH
tD 180° t D
a
b
1/2 JCH
aquire ( 13 C NMR)
1H decouple
a
b
a
b
Chem 728 Notes 1b (NMR) 1/28/2003 Page 17
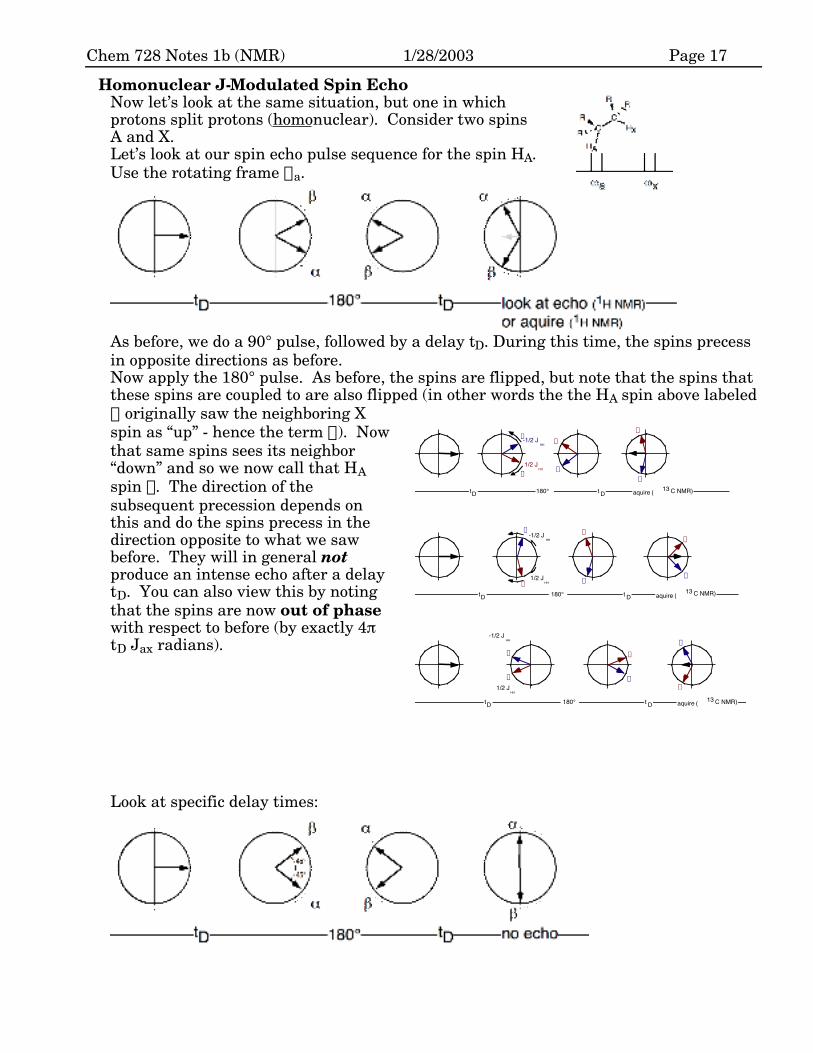
Homonuclear J-Modulated Spin EchoNow let’s look at the same situation, but one in whichprotons split protons (homonuclear). Consider two spinsA and X.Let’s look at our spin echo pulse sequence for the spin HA.Use the rotating frame wa.
As before, we do a 90° pulse, followed by a delay tD. During this time, the spins precessin opposite directions as before.Now apply the 180° pulse. As before, the spins are flipped, but note that the spins thatthese spins are coupled to are also flipped (in other words the the HA spin above labeleda originally saw the neighboring Xspin as “up” - hence the term a). Nowthat same spins sees its neighbor“down” and so we now call that HAspin b. The direction of thesubsequent precession depends onthis and do the spins precess in thedirection opposite to what we sawbefore. They will in general notproduce an intense echo after a delaytD. You can also view this by notingthat the spins are now out of phasewith respect to before (by exactly 4πtD Jax radians).
Look at specific delay times:
-1/2 JHH
tD 180° t D
a
b
1/2 JHH
a
b
aquire ( 13 C NMR)
a
b
-1/2 JHH
tD 180° t D
a
b
1/2 JHH
aquire ( 13 C NMR)
a
b
a
b
-1/2 JHH
tD 180° t D
a
b
1/2 JHH
aquire ( 13 C NMR)
a
ba
b

Chem 728 Notes 1b (NMR) 1/28/2003 Page 18
Concept: Population transfer
Measuring Through-Bond Couplings - COSYWe saw before that spin-spin couplings (J-couplings) measure the interaction betweentwo nuclei. In particular, these interactions occur through-bond - they require that thenuclei be connected by a small number of covalent bonds. Therefore, J-couplinginformation is valuable in assigning the covalent structure of a molecule.A two-dimensional NMR technique called COrrelated SpectroscopY (COSY) measuresJ-couplings in a single set of pulse experiments. We do not have time to go into themechanics of how this is done, but the end result is a two-dimensional spectrum inwhich chemical shift appears on both in-plane axes. The vertical axis contains a“spectrum” in which peaks occur only in the two one-dimensional spectra at at theintersections of two J-coupled transitions.
Measuring Through-Space Couplings - NOESYWe have seen before that two dipoles can interact in a purely through-space manner (forexample, in Förster energy transfer). A similar interaction occurs in NMR to produce(mainly) relaxational effects. Another two-dimensional approach exploits this effect,such that cross-peaks in the two-dimensional spectrum reflect nuclei coupled via adipole-dipole mechanism. This effect is called the Nuclear Overhauser effect, thespectrum is called NOESY.
ESRElectronic Zeeman Interaction
EZeeman = +ms ghH = +msgbHA spin with ms = +1/2 is said to be a, while a spin with ms = -1/2 is said to be b.ms = +1/2 (a) refers to a spin aligned with the field (as in NMR). Since the charge of an electron is
negative, all interactions are opposite that which we described previously for interaction with anapplied magnetic field. Energy is increased by this unfavorable interaction. Conversely for spinwith ms = -1/2 (b).
Spin-Spin Interactions - HyperfineFor the interaction between an electron and a nucleus
Ehyperfine = +msmI A A = hyperfine coupling constant (compare with NMR’s J)
If the nuclear spin is aligned with the field, then the total field that the electron feels is larger. Thisresults in a relative destabilization of an electron which is also aligned with the field. In otherwords, if the electron and nuclear spins are both a (or both b), then the energy of the systemincreases (opposite to NMR). However, if the spins are aligned opposite to each other, the energy ofthe system is decreased relative to the energy for no interaction.
This yields the following for the total energy of the system

Chem 728 Notes 1b (NMR) 1/28/2003 Page 19
EZeeman = -mI A
gN AbN H - mI B
gN BbN H - mI A
mI BJ AB
Environmental Differences - g valueWhen we talk about local fields effecting the total field that a local electron feels, we refer to
variations in g value. This is effectively like chemical shift in NMR. The difference is that variationsin g value usually arise from orbital effects, rather than environment. Organic radicals are simplesystems and the g value is very near that of the free electron (ge). For metals, however, interactionsbetween the magnetic moment of the electron and the orbital angular momentum of the electroncan lead to large variations in g value.
g-anisotropySince g values in metals arises from interactions with the orbital angular momentum, it is not
surprising that this interaction varies with the angle between the applied field and the electronicorbital of interest (for electronic orbitals above the fully symmetric s orbital). This is refered tog-anisotropy.
applicationsradicals and metal centers in proteinsnitroxide radicals monitor motion
Do we want to cover chemical kinetics anywhere???