Chehalis River Proposed Flood Retention Reservoirs: A ... · Chehalis River Proposed . Flood...
62
Chehalis River Proposed Flood Retention Reservoirs: A Review of Potential Mercury Impacts July 2017 Publication No. 17-03-015
-
Upload
nguyencong -
Category
Documents
-
view
217 -
download
0
Transcript of Chehalis River Proposed Flood Retention Reservoirs: A ... · Chehalis River Proposed . Flood...

Chehalis River Proposed Flood Retention Reservoirs: A Review of Potential Mercury Impacts
July 2017 Publication No. 17-03-015
Publication and contact information This report is available on the Department of Ecology’s website at https://fortress.wa.gov/ecy/publications/SummaryPages/1703015.html The Activity Tracker Code for this study is 11-021. For more information contact: Publications Coordinator Environmental Assessment Program P.O. Box 47600, Olympia, WA 98504-7600 Phone: (360) 407-6764
Washington State Department of Ecology - www.ecy.wa.gov o Headquarters, Olympia (360) 407-6000 o Northwest Regional Office, Bellevue (425) 649-7000 o Southwest Regional Office, Olympia (360) 407-6300 o Central Regional Office, Union Gap (509) 575-2490 o Eastern Regional Office, Spokane (509) 329-3400 Cover photo: Schematic of proposed Chehalis River flood retention dams (inset: elemental mercury)
Any use of product or firm names in this publication is for descriptive purposes only and does not imply endorsement by the author or the Department of Ecology.
Accommodation Requests: To request ADA accommodation including materials in a format
for the visually impaired, call Ecology at 360-407-6764. Persons with impaired hearing may call Washington Relay Service at 711. Persons with speech disability may call TTY at 877-833-6341.

Page 1
Chehalis River Proposed Flood Retention Reservoirs:
A Review of Potential Mercury Impacts
by
Morgan Maupin Masters of Environmental Studies Program
The Evergreen State College Olympia, WA
Paul J. Pickett, P.E. Environmental Assessment Program
Washington State Department of Ecology Olympia, Washington 98504-7710
Water Resource Inventory Area (WRIA) and 8-digit Hydrologic Unit Code (HUC) numbers for the study area:
• WRIA 23 • HUC number 17100103

Page 2
This page is purposely left blank

Page 3
Table of Contents
Page
List of Figures and Tables....................................................................................................5
Abstract ................................................................................................................................7
Acknowledgements ..............................................................................................................8
Introduction ..........................................................................................................................9 Study Background ..........................................................................................................9 Mercury Concerns ..........................................................................................................9
Reservoir Limnology .........................................................................................................13 Stratification and Turnover ..........................................................................................13 Trophic Status ..............................................................................................................14 Food Webs ...................................................................................................................15 Differences between Lakes and Reservoirs .................................................................16 Flood Retention Only Facility (FRO) ..........................................................................17
Physical Characteristics of FRO Reservoir............................................................17 Water Quality and Biota ........................................................................................18
Flood Retention and Flow Augmentation Facility (FRFA) .........................................19 Physical Characteristics of the FRFA Reservoir ...................................................19 Water Quality Model Results .................................................................................20 Biota .......................................................................................................................23 Comparison with Other Reservoirs ........................................................................24
The Mercury Cycle ............................................................................................................25 Biogeochemical Cycling ..............................................................................................25
Mercury in the Atmosphere ...................................................................................25 Mercury in Aquatic and Terrestrial Systems .........................................................26
Sources of Mercury to the Environment ......................................................................26 Natural Sources ......................................................................................................26 Anthropogenic Sources ..........................................................................................27 Atmospheric Deposition in Western Washington ..................................................28
Mercury Methylation ...................................................................................................31 Biochemistry of Mercury Methylation ..................................................................31 Methylation in Aquatic Environments ...................................................................32 Abiotic Factors Affecting Methylation ..................................................................34
Assessing the Risk in the Proposed Chehalis Reservoirs .................................................38 Mercury Data in Western Washington Lakes and Reservoirs .....................................39
Context for Mercury in Fish Tissue Data ..............................................................39 Mercury Data .........................................................................................................39
Significant Factors in the Proposed Chehalis Reservoirs ............................................43 Precipitation ...........................................................................................................43 Vegetation and Logging Operations ......................................................................43

Page 4
Inundation ..............................................................................................................44 Wetlands ................................................................................................................45 Dissolved Oxygen ..................................................................................................45 Sedimentation ........................................................................................................46
Conclusions and Recommendations ..................................................................................47 Potential Impacts ..........................................................................................................47 Information Gaps and Recommended Study Methods ................................................48
References ..........................................................................................................................50
Appendix. Glossary, Acronyms, and Abbreviations ........................................................58

Page 5
List of Figures and Tables
Page Figures
Figure 1. Chehalis Basin Strategy study area with flood retention facility and other
proposed projects ...............................................................................................10 Figure 2. Maximum extent of reservoir pool under both scenarios. .................................11 Figure 3. Typical lake/reservoir food chain. .....................................................................15 Figure 4. Simulated reservoir area and depth under FRO proposal. .................................18 Figure 5. Simulated reservoir area and depth under FRFA proposal. ..............................20 Figure 6. Chlorophyll-a, inorganic nitrogen, and orthophosphate levels in the top
30 feet of segment 10 for the FRFA scenario 2 under current and future conditions. ..........................................................................................................22
Figure 7. Distribution of reported locations of mercury-bearing ore in Washington State. ..................................................................................................................27
Figure 8. Total mercury wet deposition for the year 2014. ...............................................29 Figure 9. Spatial extrapolation of top soil (0-40 cm) mercury concentrations based on
multiregression modeling using independent variables latitude, precipitation, soil carbon content, and clay content. ................................................................30
Tables Table 1. Number of surveyed reaches in which fish species, including those identified
to family but not identified to species, were detected July-September, 2015. ..16 Table 2. Physical characteristics of various lakes in western Washington with fish
tissue mercury data. ...........................................................................................41 Table 3. Fish tissue mercury concentrations for various lakes in western Washington. ..42

Page 6
This page is purposely left blank

Page 7
Abstract This report supports the Chehalis Basin Strategy, which addresses periodic flooding and degraded river habitat in the Chehalis River Basin. Various actions to address flood damage and restoration of aquatic habitat are being evaluated. One action being considered is the construction of a flood retention facility on the upper Chehalis River. Of two facility conceptual designs, one would create a temporary reservoir during flooding events, while the other would create a permanent reservoir for both flood retention and flow augmentation (FRFA). Research has found factors in reservoirs that may increase rates of mercury bioaccumulation in the aquatic life. The report provides an assessment of the risk of mercury bioaccumulation in the aquatic life of the proposed Chehalis reservoirs, and recommends further studies. The risk assessment examined the factors known to affect mercury bioaccumulation, analyzed the expected characteristics of the proposed reservoirs, compared mercury data from lakes and reservoirs in Washington State, and identified existing gaps in data and knowledge. Results suggest that, if built, the FRFA reservoir would be subjected to several factors which have been shown to contribute to mercury methylation and bioaccumulation. Consequently, the reservoir could be susceptible to mercury concentrations in fish tissue which could reach levels higher than currently found in the Chehalis River and levels similar to other lakes and reservoirs in western Washington. Some evidence suggests methylmercury (MeHg) levels in reservoirs could reach higher levels than in natural lakes. Characteristics of a newly constructed reservoir could add to the short-term potential for mercury methylation. Recommendations are offered for future studies to increase understanding of MeHg in reservoirs, including additional monitoring of fish tissue, sediment, and the water column in other reservoirs in the basin, such as those on the Skookumchuck or Wynoochee Rivers, as well as further research and modeling.

Page 8
Acknowledgements The authors of this report thank the following people for their contributions to this study:
• Faculty of The Evergreen State College: o Erin Martin – Morgan’s Internship Advisor o Abir Siswas – Morgan’s Subject Resource o Andrea Martin – Assistant Director, Masters of Environmental Studies o Scott Elliott and Brant Eddy – contract specialists
• Washington State Department of Ecology staff o Environmental Assessment Program Debby Sargeant – Morgan’s Field Supervisor Callie Mathieu – subject specialist and peer reviewer Will Hobbs and Keith Seiders – subject resources Dale Norton – manager of lead section and subject specialist Joan Letourneau and Kristi Peter – editing and publication Gary Koshi – contract support
o Shorelands and Environmental Assistance Program Chrissy Bailey – client Jessica Hausman – project coordination and funding
o Water Quality Program Cheryl Niemi and Bryson Finch – regulatory specialists
o Contracts and Purchasing Mark Gaffney and Kathie Collins, contract specialists
• Anchor QEA Staff o Betsy Henry – external reviewer o Adam Hill and Binglei Gong – Anchor QEA, provided modeling data o Bob Montgomery – project support and coordination
• Chip McConnaha – ICF, Chehalis fisheries specialist

Page 9
Introduction
Study Background For over 100 years, and especially in recent decades, the Chehalis River Basin has undergone periodic extreme flooding events. This flooding has resulted in extensive property damage and public safety concerns. Five of the largest floods in the Basin’s history have taken place in the last 30 years, and more flooding events are probable. The cost associated with floods on the Chehalis are estimated in the range of $3.5 billion over the next century (Ecology, 2017). The productivity of salmon, among other species in the Chehalis River, has also been in decline over the last several decades, in part due to degraded habitat, warmer water temperatures and more extreme summer low flows (Liedtke et al., 2016). The declining health of these aquatic species, notably salmon, have significant cultural, economic, and ecological implications. For these reasons, Governor Christine Gregoire convened the Chehalis Basin Work Group (Work Group) in 2012. The Work Group was comprised of six representatives, including citizens, tribal leaders, and local elected officials. Through collaborations with tribal governments, the Chehalis River Basin Flood Authority, and various state agencies, the Work Group oversaw a series of technical studies to support decision making on long-term actions to provide flood damage reduction and restoration of aquatic habitat in the Basin. These studies culminated in a report in 2014, which included the Work Group’s recommended Chehalis Basin Strategy. Two additional members were added to the Work Group in 2015. A Programmatic Environmental Impact Statement (PEIS) was completed in June 2017 (Ecology, 2017) The PEIS evaluated the 2014 Work Group’s recommended Strategy and other action alternatives addressing the dual objectives of flood damage reduction and aquatic habitat restoration. The Chehalis Basin Strategy is intended to be a collection of potential actions aimed at addressing the extreme flooding and degraded river habitat in the Basin. A variety of proposed actions and alternatives are being evaluated, including a flood retention structure on the upper Chehalis River (Figures 1 and 2). Under one scenario, the dam would serve as a flood retention only (FRO) facility, creating a reservoir only during flooding events above a specific magnitude, then releasing the retained water as flooding subsides. Under an alternative scenario, the dam would serve as a flood retention and flow augmentation (FRFA) facility, creating a permanent reservoir which could retain flood waters during extreme events, and augment river flow during summer months as needed to improve downstream river habitat.
Mercury Concerns Amidst the concerns associated with a dam and reservoir on the Chehalis River, the possible mobilization of mercury (Hg) into the aquatic food chain has been proposed. Mercury is naturally present at very low concentrations in most environmental systems (Ullrich et al. 2001).

Page 10
Figure 1. Chehalis Basin Strategy study area with flood retention facility and other proposed projects (from Ecology, 2017).

Page 11
Decades of intense industrial activity such as coal burning, manufacturing, and mining have led to alterations of the biogeochemical cycling of mercury, resulting in atmospheric, oceanic, and terrestrial mercury concentrations 3-5 times background levels, despite emissions reductions since the 1990s (Selin, 2009; Zhang et al., 2016). Once released, mercury may spend centuries to millennia cycling between the atmosphere, oceans, and terrestrial systems before returning to deep ocean sediments (Selin, 2009). In aquatic systems mercury can be converted to methylmercury (MeHg), a potent neurotoxin known to bioaccumulate in aquatic food chains (Driscoll et al., 2007). Human exposure to MeHg through the consumption of fish high on the food chain has been well documented, and continues to threaten fish consumers globally. Acute mercury poisoning, known as Minamata disease, results in a variety of severe health effects. Acute exposure, especially associated with fish consumption in North America, however, is very rare.
Figure 2. Maximum extent of reservoir pool under both scenarios. From the Draft Chehalis Basin Strategy Programmatic EIS Executive Summary.

Page 12
To address potential risk to human health from fish consumption in Washington, the Washington State Department of Ecology (Ecology) has a fish tissue-based human health criterion for MeHg as a water quality standard. The Washington State Department of Health has determined a fish tissue mercury concentration for the screening level they use to issue a fish consumption advisory. Elevated MeHg concentrations in fish and other prey items may also threaten wildlife that consume these items. As will be discussed in detail below, research has suggested that MeHg production is enhanced in reservoirs, such as that proposed on the Chehalis River, relative to natural aquatic systems such as rivers, estuaries, and possibly natural lakes. There are a variety of possible reasons for this relationship. This report aims to summarize the potential impacts of a flood retention reservoir on the Chehalis River in terms of mercury mobilization and uptake by biota, and to make recommendations for further research. This involves:
• An examination of the expected physical, chemical, and biological characteristics of the proposed reservoirs.
• Consideration of the known physical, chemical, and biological factors that affect the processes of mercury methylation and bioaccumulation.
• Identification of existing gaps in data and knowledge.
Page 13
Reservoir Limnology As will be discussed later in this report, there are many variables that may affect the production of MeHg in aquatic systems. In order to assess the risk of increased methylation rates via the creation of a reservoir on the Chehalis River, an understanding of the physical, chemical, and biological characteristics of the proposed reservoirs is needed. In this instance, the reservoir does not exist, and thus reliance on models and comparisons with similar reservoirs in the area are necessary to evaluate possible future MeHg conditions. Subsequent sections will summarize reservoir modeling results performed by Anchor QEA (2016). First, some basic reservoir limnology should be introduced to provide context to the proposal and relevant research. By definition, reservoirs are man-made or man-enlarged lakes, and the current state of knowledge about reservoirs comes primarily from studies of natural lakes. However, because reservoirs are designed by humans and lakes were formed over geologic time, there are important differences to consider. Processes like internal mixing, gas exchange, redox reactions, nutrient uptake, and primary production occur in both lakes and reservoirs. However, the magnitude and phasing of the driving variables behind these processes differ between lakes and reservoirs, so the responses of the systems to environmental factors and human management may differ as well (Thornton et al., 1990). For the purposes of this report, only a brief introduction to key concepts is required. The following information on basic limnology is from the Understanding Lake Ecology portion of U.S. Environmental Protection Agency’s Water on the Web online training site, unless otherwise cited.
Stratification and Turnover Perhaps the most important concept in lake and reservoir limnology is the annual stratification and subsequent turnover of the water column. As summer progresses, solar radiation heats the surface of lakes, creating a temperature and density difference between water layers, which becomes more distinct throughout the summer. Density stratification typically results in three layers; from top to bottom, these layers are the epilimnion, metalimnion, and hypolimnion. The shallow waters of the epilimnion are typically warm and well mixed by wind, whereas the deeper waters of the hypolimnion are colder and relatively motionless. In the metalimnion, or thermocline region, temperature and water density decline rapidly with depth during the summer, creating a physical density barrier between the upper and lower layers which prevents mixing. As solar radiation and air temperature decrease in the fall, the epilimnion cools and the density difference between the upper and lower layers is reduced. Eventually surface and bottom waters reach the same temperature, and wind mixes the entire lake. This process is called lake turnover. Lakes are classified by the frequency of turnover, which can occur once per year in the fall, twice per year if a lake freezes over, or several times a year if wind and currents frequently overcome density stratification. Deeper lakes and reservoirs in the lower elevations of western Washington typically mix once per year in the fall (Cole, 1979).

Page 14
The processes of stratification and turnover have broad implications for the overall chemical, biological, and physical characteristics of a lake. The absence of mixing between upper and lower layers throughout the summer doesn’t only affect temperature, but many other important parameters including dissolved oxygen (DO), pH, nutrient concentrations, and biological productivity. Furthermore, many of these factors influence each other, resulting in complex feedback loops throughout the lake or reservoir system. As will be discussed in more detail later, the rate of MeHg production may be highly influenced by some of these parameters.
Trophic Status Also of high importance to the characterization of a lake is trophic status. The trophic status of a lake or reservoir can be defined as the amount of biomass in a lake, and is a general measure of the productivity of the system. Although all lakes lie somewhere along the spectrum of trophic status, lakes are typically categorized as eutrophic, mesotrophic, or oligotrophic. Eutrophic systems have relatively high amounts of nutrients resulting in high algal and plant productivity. Oligotrophic systems are limited by low nutrient loading and display correspondingly low productivity. Mesotrophic systems lie somewhere in the middle between eutrophic and oligotrophic. There are three main factors that determine the trophic status of a lake or reservoir, each factor being influenced by several sub-factors. First is the rate of nutrient supply, which may be determined by bedrock geology, soils, vegetation, and human land uses in the watershed. Second is climate, which includes the amount of sunlight received, temperature, and hydrological factors such as precipitation and turnover dynamics. Lastly, morphometry characteristics such as depth, volume, surface area, and the ratio of watershed area to lake surface area all influence trophic status. In the summer during periods of high algal productivity and thermal stratification, DO levels in the surface layer may become supersaturated. When organic material (mostly algal) dies it settles to the bottom of the water column where it is consumed and respired by heterotrophs. Respiration consumes oxygen, so bottom waters in stratified and productive lakes are often depleted of DO. Low oxygen conditions also extend into the sediments, where many important chemical and biological reactions occur. Low DO conditions are known as “hypoxia”, and have broad implications for lake and reservoir systems, including the production rates of MeHg. The trophic status of a lake or reservoir can influence the spatial and temporal extent and severity of hypoxia. While eutrophic lakes typically have extended periods of hypoxia, oligotrophic lakes may have depressed but not depleted oxygen concentrations. One common sign of increasing impacts from nutrient pollution in any lake is that hypoxic conditions increase in time (develop earlier and dissipate later) and volume (rising to shallower depths). The development of hypoxic conditions also affects something known as oxidation/reduction potential, or redox potential. Redox potential is a measure of the tendency of a solution to release or accept electrons from chemical reactions. When a molecule accepts one or more electrons, it is “reduced”, whereas when a molecule releases electrons it is “oxidized”. In a solution with depleted oxygen concentrations, such as the hypolimnion of a stratified lake, redox

Page 15
potential is shifted such that reduction reactions are favorable. Reducing conditions result in the dissolution and mobilization of nutrients and metals that would otherwise be in precipitated forms in oxygenated waters. This process is important, as it draws a clear connection between hypoxic conditions and the aquatic food chain.
Food Webs To explain the function of lake ecosystems in simple terms, biological communities can be organized conceptually into food webs, as shown in Figure 3. In general, nutrients, carbon dioxide and solar radiation allow the growth of phytoplankton, bacteria and microscopic organisms, which constitute the base of the food web. This supports the higher trophic levels all the way up to piscivorous fish. Benthic organisms including fish and many invertebrates help recycle organic material and nutrients that accumulate in the sediments. It should be noted that many organisms do not fit neatly into a simple conceptual food chain, as there are omnivores and animals that move up the food chain throughout their life cycle.
Figure 3. Typical lake/reservoir food chain. From http://www.waterontheweb.org/under/lakeecology/11_foodweb.html

Page 16
In September 2016, the Washington Department of Fish and Wildlife published a report with the results of species surveys covering 49 reaches (about 32 km) in the Chehalis River and its tributaries that could be inundated from the proposed dams. Additional reaches located both upstream and downstream of the inundation footprint were also surveyed. Table 1 shows survey results of all reaches.
Table 1. Number of surveyed reaches in which fish species, including those identified to family but not identified to species, were detected July-September, 2015. From Winkowski et al. (2016).
Differences between Lakes and Reservoirs As mentioned previously, some key processes in reservoirs may differ from those in lakes, a few of which will be discussed here, as described by Thornton et al. (1990). The first has to do with sediment retention rates, which may play an important role in mercury methylation. In short, because reservoirs are created by impounding lotic systems (rivers), and lakes typically form at the confluence of many low order (small) streams, reservoir drainage basins are typically narrower, more elongated, and steeper than those of lakes. Furthermore, stream order and drainage basin size upstream of reservoirs are typically higher and larger, respectively, than for lakes. This leads to the general trends of higher total sediment delivery and higher total mass of fine particles (clays and silts) in reservoirs as opposed to lakes.

Page 17
A second notable difference between reservoirs and lakes is the frequency and magnitude of periodic floodplain inundation. Because flood control reservoirs such as those proposed on the Chehalis River experience relatively large changes in elevation before and after flooding events, large areas of land surrounding said reservoirs are intermittently and more rapidly inundated and re-exposed to the atmosphere. Furthermore, reservoirs are typically more dendritic (branched) in form than natural lakes, resulting in overall larger perimeters, and therefore larger areas exposed to periodic inundations.
Flood Retention Only Facility (FRO) The reservoir associated with the flood retention only (FRO) facility (Figure 2) is unique in that it will only exist for a short span of time, and only during major flooding events. The Draft Operations Plan for Flood Retention Facilities prepared by Anchor QEA (2016) summarizes the conditions under which the flood retention facility would be used as well as the resulting reservoir conditions. In order to prevent downstream flooding, the FRO facility would retain river flows during major floods, which are defined as having flow rates exceeding 38,800 cubic feet per second (cfs) at the Grand Mound gage operated by the United States Geological Survey (USGS). Floods of this magnitude are approximately equivalent to a 7-year occurrence interval event, meaning there is a ~15% chance of occurrence in any given year. This magnitude of flooding was chosen as the threshold for operations as it corresponds to “extensive inundation of structures and roads; significant evacuations of people and/or transfer of property to higher elevations” as defined by the National Oceanic and Atmospheric Administration (NOAA). When such an event is predicted by the Northwest River Forecast Center operated by NOAA, water retention would begin within 48 hours of the predicted flood peak, reducing outflow by 200 cfs/hr until outflow reaches 300 cfs. Once the flooding event passes, outflow would be increased at a rate of 1,000 cfs/hr. Outflow rates are determined by the corresponding reservoir drawdown rates, which would be limited to 10 feet per day (5 inches per hour). Drawdown rates are limited to 10 feet per day in order to avoid landslides caused by rapid drawdown, and to allow time for debris management within the reservoir. Physical Characteristics of FRO Reservoir Using Lidar data and GIS along with inflow data from water years 1989-2015, Anchor QEA modeled daily average inflow, outflow, elevation, storage, and reservoir area of the FRO reservoir for the entire period of record. Figure 4 shows modeled reservoir area and depth during the flooding event in 2009, which has a return period of 10 years. During years with no major floods (~85% chance in any given year), the flood retention facility would not be activated, and no reservoir would exist. In the absence of a flooding event, pool elevation remains at 425 feet above sea level. As shown in Figure 4, the modeled reservoir during the 2009 flooding event using the FRO facility would exist for 31 days. The 2007 flooding event has an estimated return period of 500 years, and the same model shows that the reservoir under 2007 conditions would exist for 34 days. It is therefore reasonable to assume a maximum reservoir duration of about 34 days using the FRO facility.

Page 18
Figure 4. Simulated reservoir area and depth under FRO proposal.
Data from Anchor QEA (2016). During the simulated 2009 flooding event shown in Figure 4, the reservoir reached a maximum area of 568 acres and maximum depth of 157 feet. During the simulated 2007 flooding event, the reservoir reached a maximum area of 764 acres and a maximum depth of 193 feet. Water Quality and Biota Due to the season, frequency, and duration of major flooding events (7 year return period, lasting 30-34 days) when the reservoir is filled and drained under FRO operations, there is relatively little concern over water quality associated with stratification. Rapidly changing depth, area, and volume due to high initial inflows and subsequent controlled outflows over a short period of time during late fall through early spring weather conditions will keep the reservoir well mixed. Thermal stratification and eutrophication are highly unlikely as these processes take time, generally do not occur in well mixed water columns, and do not occur during the time period when flooding events typically occur. For these reasons, Anchor QEA (2016) only modeled reservoir water temperatures under the FRO scenario. Results show that under current climatic conditions, if a major flood were to occur in early to mid-fall (October), solar heating could increase reservoir water temperatures to as high as 14°C, whereas a major flood in March would cause reservoir temperatures to reach 8°C. In either scenario, thermal stratification is not expected under current climatic conditions. The same model was also run using future hydrological and meteorological conditions. These conditions were derived from statistically downscaled projections of global climate models (GCMs) for a high greenhouse gas emissions scenario (Representative Concentration Pathway 8.5, as defined by CMIP5 and reported by the Intergovernmental Panel on Climate Change). Under future conditions the reservoir during flooding events would be slightly larger, as storm
0
20
40
60
80
100
120
140
160
180
0
100
200
300
400
500
600
Jan6
Jan8
Jan10
Jan12
Jan14
Jan16
Jan18
Jan20
Jan22
Jan24
Jan26
Jan28
Jan30
Feb1
Feb3
Feb5
Dept
h (fe
et)
Area
(acr
es)
FRO Reservoir area and depth during 2009 Flood
Reservoir Area Reservoir Depth

Page 19
flow is expected to increase with changes in climate from greenhouse gas emissions. Temperature gradients from surface to bottom waters are predicted to be slightly greater than under current conditions, suggesting a slightly higher risk for thermal stratification. However, due to the short time period of the reservoirs existence, overall results for future conditions are largely comparable to results for current conditions. As with water quality, the short duration and infrequency of FRO reservoir creation makes it unlikely that mercury mobilization and bioaccumulation would impact biota.
Flood Retention and Flow Augmentation Facility (FRFA) The reservoir associated with the FRFA facility (Figure 2) would be permanent. It would therefore have largely different physical, chemical, and biological characteristics than the reservoir created by the FRO facility. The Draft Operations Plan for Flood Retention Facilities prepared by Anchor QEA (2016) summarizes how the flood retention facility would be used as well as the resulting reservoir conditions. During major flooding events as described previously, the FRFA facility would operate the same as the FRO facility, except that it would not need to reduce reservoir drawdown rate in the same way. This is due to debris management, as the permanent reservoir would allow for debris removal over a longer time period. During non-flooding periods, dam operations would maintain a conservation pool for the primary purpose of flow augmentation and temperature reduction downstream throughout the summer months. During late fall and winter, inflow would be allowed to re-fill the conservation pool, while occasionally releasing high flows in order to preserve geomorphic processes downstream. Physical Characteristics of the FRFA Reservoir Using Lidar data and GIS along with inflow data from water years 1989-2015, Anchor QEA modeled daily average inflow, outflow, elevation, storage, and reservoir area of the FRFA reservoir for the entire period of record. Figure 5 shows modeled reservoir area and depth from March 1st, 2007 through February 28th, 2010. These dates were picked to show three consecutive wet seasons, one with an extreme flooding event (December 2007), one with a moderate flooding event (January 2009), and one with no major flooding event. During the 2007 flood (500-year return interval) shown in Figure 5, reservoir area and depth reached maximum values of 1,218 acres and 253 feet in early December, whereas minimum values for reservoir area and depth were 650 acres and 173 feet immediately prior to flooding. These values correspond to area and depth increases of 568 acres and 80 feet, respectively. During the 2009 flooding event (10-year return interval), reservoir area and depth increased by 402 acres and 57 feet respectively. During the following year which experienced no flooding event, reservoir area and depth increased by 149 acres and 25 feet from the end of the summer to mid-November. In the absence of flooding events or flow augmentation releases, the FRFA facility maintains the reservoir at an area of approximately 822 acres and a depth of 202 feet.

Page 20
Figure 5. Simulated reservoir area and depth under FRFA proposal. Data from Anchor QEA (2016). Water Quality Model Results Using inflow water quality data from previous and ongoing Chehalis Basin Strategy studies and other publicly available sources, Anchor QEA (2016) modeled water quality in the FRFA reservoir including temperature, dissolved oxygen (DO), nutrients and algae, pH, and suspended solids. These parameters were modeled under two different flow augmentation scenarios, which differ in the amount of water released throughout summer months. Results from the two flow augmentation scenarios are similar for all water quality parameters, and so will not be distinguished in this report. Temperature and DO were also modeled under future climatic conditions as described in the FRO water quality section. Temperature Temperature profiles show the development and dissipation of thermal stratification, with full stratification existing mid-April through mid-October. The warmest temperatures occur July-August, in approximately the top 30 feet, ranging from 20-24.7°C. The highest temperature of 25°C is consistent with temperature patterns of the area from 2013-2015. The deeper waters below the thermocline (below about 30 feet) remained cool throughout the summer. The highest temperatures of 8-12°C occurred in the fall, immediately before turnover. Average bottom temperatures throughout the summer were approximately 6°C. These results were compared to observed temperature data from Lake Cushman, a hydropower reservoir with a pool elevation of approximately 735 feet. The Chehalis reservoir would have a pool elevation of 625 feet, so solar heating patterns would be similar. Results of the modeled
0
50
100
150
200
250
0
200
400
600
800
1000
1200
1400
Mar
200
7
May
200
7
Jul 2
007
Sep
2007
Nov
200
7
Jan
2008
Mar
200
8
May
200
8
Jul 2
008
Sep
2008
Nov
200
8
Jan
2009
Mar
200
9
May
200
9
Jul 2
009
Sep
2009
Nov
200
9
Jan
2010
Dept
h (fe
et)
Area
(acr
es)
FRFA Reservoir area and depth March 2007-February 2010
Reservoir Area Reservoir depth

Page 21
Chehalis reservoir are comparable to observed patterns in Lake Cushman, suggesting relative model accuracy. Under projected future climatic conditions, simulated water temperatures throughout the water column are significantly warmer, resulting in warmer bottom temperatures even after stratification, and throughout the summer. Surface waters are significantly warmer throughout the summer and track the projected air temperature increases, resulting in surface temperatures of 25°C or higher from mid-July through mid-August. The timing of turnover is not expected to change, but water temperatures after turnover are appreciably warmer. Bottom waters reach a maximum temperature of approximately 13°C immediately before turnover, and remain below 9°C throughout the year, until early November of the following year. Dissolved Oxygen During late spring and early summer, upper layers will be supersaturated with DO (above 12 mg/L) due to algal photosynthesis. Throughout the summer, warming waters and decomposition in the water column will cause DO concentrations in surface waters to drop to a low of approximately 9 mg/L in October-November. In lower waters, DO will remain high after turnover, with values ranging between 10-12 mg/L until the onset of thermal stratification in March-April. DO will become progressively lower throughout the spring due to oxygen demand from decaying organic matter in the sediments. The greatest oxygen demand occurs during late summer and early fall, resulting in the lowest DO concentrations of approximately 3 mg/L in mid-to-late November. A key uncertainty in modeling a non-existent reservoir is the intensity of sediment oxygen demand. Models predict the deposition of organic material from phytoplankton, but the oxygen demand in a new reservoir from organic material in soils and debris is difficult to predict. Therefore, hypolimnetic DO should be interpreted with a range of uncertainty – it could be significantly higher or lower than the 3 mg/L predicted. Under projected future conditions, DO concentrations in bottom waters are lower during the entire stratified period (spring through fall) due to warmer water temperatures resulting in enhanced sediment activity. Very low DO concentrations (below 5 mg/L) are expected from July onward through the onset of turnover in November/December, whereas under current climatic conditions, DO below 5 mg/L is only expected during the last month before turnover. DO concentrations in surface waters also show appreciable differences under future climatic conditions. Surface waters show supersaturation earlier in the spring due to algal activity peaking earlier in the year, which explains why hypoxic conditions are predicted to develop earlier in the summer. Nutrients and Algae Because algal blooms and succession are highly variable between and even within lakes/reservoirs, no effort was made to predict specific algal species. Instead, the model aimed to simulate generic patterns of phytoplankton assemblages documented in stratified, oligotrophic lakes and reservoirs, as described in the reservoir limnology section above. Two algal groups
Page 22
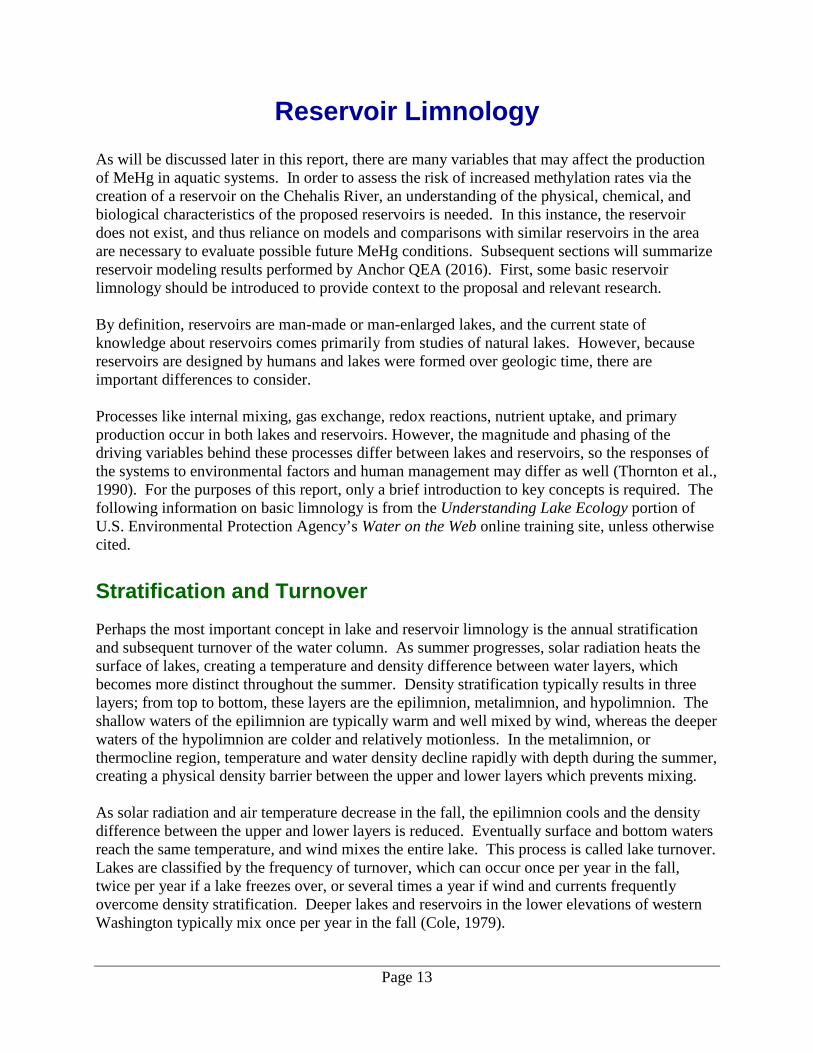
were simulated in order to reproduce these patterns, each with growth coefficients that differed in light, temperature, and nutrient sensitivity. Differences in growth coefficients aim to reproduce the pattern of one algae bloom in mid-spring, and another in late spring-summer. Figure 6 shows chlorophyll-a, inorganic nitrogen, and orthophosphate levels in the top 30 feet of segment 10 of the FRFA reservoir under current and future conditions
Figure 6. Chlorophyll-a, inorganic nitrogen, and orthophosphate levels in the top 30 feet of segment 10 for the FRFA scenario 2 under current and future conditions. From Anchor QEA (2016). Under future conditions, chlorophyll-a and nutrient concentrations are not expected to change significantly; however, the spring bloom (chlorophyll-a) is expected to occur slightly earlier in the spring, resulting in the earlier depletion of nutrients. Based on these modeling results, a trophic state index (TSI) can be calculated, as described by Carlson (1977). Trophic state under Carlson’s TSI is defined as the total weight of biomass in a water body at the time of measurement. It is calculated using the summer average of one of three independent variables, including secchi depth, total phosphorous, or chlorophyll-a concentration. Because Carlson’s TSI is defined as the total weight of biomass, chlorophyll-a is usually given priority as a trophic state indicator, although all three variables correlate. As shown in Figure 6, summer chlorophyll-a concentrations would range from 0-19 ug/L under current conditions and 0-15 ug/L under future conditions. Using these concentrations, and the chlorophyll-a based TSI equation reported by Carlson (1977), TSI values for current and future
Page 23
conditions are approximately 42 and 41 (on a scale from 0-100) respectively. Both of these values correspond to a mesotrophic system. pH The water quality model calculates pH from alkalinity and total inorganic carbon (TIC) in the water column. Results show pH values (~10) in winter were inconsistent with observed pH values (7-7.5) at the Dryad monitoring station, suggesting that further evaluation is needed to assess model accuracy. Fortunately, pH, alkalinity, and TIC are not used as inputs for any other parameters modeled, so the uncertainty in pH does not affect other evaluations of the report. As will be discussed later, pH has been shown to affect mercury methylation rates in a select few studies, while most have shown no relationship. Suspended Solids Particulate organic matter (POM) peaks occur in fall through spring from watershed runoff, as well as in summer due to algal death and settling, reaching maximum concentrations of about 1.4 mg organic matter/L. Inorganic suspended sediment (ISS) concentrations peak during runoff events in fall-spring, with maximum concentrations reaching well over 10 mg/L in some years. POM in summer is mostly labile (bioavailable) but in winter POM is mostly refractory (not bioavailable). Under current and future conditions, model results showed a total suspended solids (TSS) retention rate of 82-83% and 80% respectively. The lower TSS retention rate predicted for future conditions are due to higher flows, resulting in a greater mass of TSS being transported out of the reservoir. Biota Unlike the FRO reservoir, the FRFA reservoir will exist permanently, and will therefore host resident fish species that are adapted to lacustrine conditions. A variety of fish species inhabit reaches that would be inundated by the proposed reservoir and would likely to continue to use the reservoir and its tributaries. Many species identified in the inundation footprint undergo seasonal migrations up to hundreds or thousands of kilometers, including the salmonids (Quinn, 2005) and largescale sucker (Baxter, 2002). Because either facility could present a significant barrier to migratory fish species attempting to enter the reservoir, fish passage structures would be incorporated. The difference in exposure time between species resident in the summer and migratory species would have implications for bioaccumulation of MeHg, which is discussed in more detail below. The population and residence time of anadromous species, and therefore their susceptibility to bioaccumulation, would depend on the final design, the life stage characteristics of the species, and the adaptability of the species to reservoir conditions. Currently studies suggest that juvenile coho may use the reservoir for over-summer rearing, and juvenile steelhead are likely to inhabit tributaries to the reservoir (McConnaha, 2017).

Page 24
Other non-salmonid species observed in the inundation footprint are known to migrate just 100 meters or less or will spend extensive time in the reservoir, including sculpins and lamprey ammocoetes, and so are likely to be present year-round (Winkowski et al., 2016). Inundation is likely to impact these resident fish species, but the extent of impacts is uncertain. Similar reservoirs such as Wynoochee Lake, Skookumchuck Reservoir, and Lake Cushman are actively managed for recreational fishing of trout (WDFW, 2017). Fisheries biologists studying the reservoir proposals expect that the FRFA reservoir will continue to support resident trout. As observed elsewhere, fish are likely to be stocked in the proposed reservoir, possibly by the Washington Department of Fish and Wildlife or illegally by local fisherman (McConnaha, 2017). Comparison with Other Reservoirs The results presented throughout this section are consistent with the fundamental concepts of reservoir and lake limnology. Beyond that, it is difficult to make meaningful comparisons between the model output data and observed data in other reservoirs, as there is considerable spatial and temporal variation within and between observable lakes and reservoirs. Seasonal thermal stratification, DO depletion in bottom waters, and nutrient and algae dynamics predicted by the model all vary from year to year, as they do in the real world, but remain within the bounds of reasonable outcomes (except for pH). As mentioned, the temperature data predicted by the model are consistent with observed temperature data in Lake Cushman, a similar reservoir (an enlarged natural lake) in western Washington.

Page 25
The Mercury Cycle As mentioned previously, mercury is relatively harmless at low concentrations (Ullrich et al., 2001). Once converted to MeHg, however, low concentrations are of concern due to the potential for bioaccumulation in aquatic food chains (Driscoll et al., 2007). So how does mercury become MeHg? Where does mercury come from in the first place? What physical, chemical, and biological factors affect the methylation of mercury? As it turns out, the answers to these questions are very complex, but decades of research have culminated in a fairly thorough understanding of these processes. The purpose of this section is to provide brief answers to these questions based on the current state of knowledge surrounding mercury in the environment. In order to begin to understand mercury methylation, a brief overview of the biogeochemical cycling of mercury is necessary.
Biogeochemical Cycling Liu et al. (2012) provides an in-depth overview of the biogeochemical cycling of mercury - the most important concepts from this source are briefly paraphrased in the following paragraphs unless otherwise cited. Mercury exists in three distinct oxidation states: Hg(0), Hg(I), and Hg(II), with Hg(I) being sufficiently unstable and rare that it can be excluded from this discussion. The 0 and II refer to the oxidation state of the given mercury species. The oxidation state, or degree of oxidation, in this case can be defined as the number of electrons “lost” through an oxidation reaction. Because elemental Hg(0) is uncharged, Hg(II), which has “lost” two electrons, has a charge of +2. This is an important characteristic of mercury speciation, as oxidation state and corresponding charge largely determine the reactivity of the different mercury species. For this reason, Hg(II) readily binds with other ions and molecules, forming complexes in aquatic systems and the atmosphere. Generally speaking, the dominant form of mercury in the atmosphere is gaseous elemental mercury Hg(0),whereas in the water, soils, and sediments it is the inorganic form Hg(II), and in biota it is MeHg. Mercury in the Atmosphere In the atmosphere, water droplets act as microreactors for mercury oxidation and reduction reactions, resulting in a heterogeneous mixture of mercury species. Existing primarily in the gaseous phase, Hg(0) is oxidized by oxidants such as ozone (O3), hydroxyl radical (OH), hydrogen peroxide (H2O2), nitrate radical (NO3), and reactive halogen species (forms of chlorine, bromine, and iodine), to its oxidized form, Hg(II). Hg(II) can then form a variety of complexes which exist primarily in the aqueous phase in water droplets, or adsorbed onto atmospheric particulate matter, creating particulate mercury (PHg).

Page 26
In total, over 95% of mercury in the atmosphere exists as gaseous Hg(0), having an atmospheric lifetime of about 0.5-1.5 years. This relatively long lifetime in the atmosphere allows for large scale mixing, resulting in elevated concentrations even in locations without any significant sources. Atmospheric concentrations of gaseous mercury, including Hg(II), not immediately affected by anthropogenic outputs, range from 1 to 4 ng/m3. Due to greater industrial outputs in the Northern Hemisphere, there is an increasing concentration gradient from the Southern to Northern Hemisphere. Complexed Hg(II) and PHg, representing less than 5% of atmospheric mercury, are relatively soluble in water, and molecules have a tendency to stick together, forming heavier particulate matter. For this reason, they constitute the prominent forms of mercury deposited through wet deposition (dissolved in precipitation or fog), and dry deposition, and have atmospheric lifetimes of just days to weeks. Atmospheric deposition, as will be discussed later, is the main source of mercury to most aquatic and terrestrial systems. Mercury in Aquatic and Terrestrial Systems Once deposited into water, sediment, and soil, mercury exists primarily as various organic and inorganic Hg(II) compounds. Small amounts of Hg(II) can be reduced back to Hg(0), which may volatilize back to the atmosphere. The remaining Hg(II) compounds may be further complexed via various pathways with various inorganic and organic ligands. Of most importance to this report is the production of MeHg. MeHg usually constitutes a minor fraction of total Hg: typically less than 10% in water and less than 3% in soils/sediments. In aquatic systems, however, MeHg readily bioaccumulates and biomagnifies, and therefore is commonly found in the tissues of biota.
Sources of Mercury to the Environment Both natural and anthropogenic sources significantly contribute to the mercury pools found in the atmosphere, aquatic systems, and biota. The prominent pathway of mercury entering the environment both naturally and via human-related emissions is into the atmosphere. The total annual input of mercury into the atmosphere is estimated to be between 5000-6000 tons per year, although there is great uncertainty in these estimates. Despite global reductions in emissions since the 1990s, anthropogenic sources remain high, contributing approximately 50% of total atmospheric mercury to the atmosphere (Liu et al., 2012). Natural Sources Natural mercury sources are primarily emissions from geologic activity, including volcanoes and geothermal emissions. Less common sources include volatilization from marine environments and geologically enriched areas. Forest fires also release mercury stored in soils and vegetation (Friedli et al., 2003). The vast majority (>99%) of natural mercury emissions are in the form of gaseous elemental mercury, Hg(0), with estimates ranging from roughly 800-5,800 tons annually (Liu et al., 2012).

Page 27
Areas naturally enriched in mercury are found most commonly along the global “mercuriferous belts”, which are located along plate tectonic boundaries with natural mercury deposits. The mercury found along these belts is mostly present as cinnabar ore (HgS). Mercury from cinnabar may be released through geothermal activity as mentioned above, or slowly leached into aquatic systems, although the latter pathway is thought to be negligible (Liu et al., 2012). Washington State has a number of mercury bearing ores, as shown in Figure 7. None have been identified in or near the proposed Chehalis reservoir.
Figure 7. Distribution of reported locations of mercury-bearing ore in Washington State. From http://www.dnr.wa.gov/programs-and-services/geology/geologic-hazards/hazardous-minerals#mercury Anthropogenic Sources As noted, humans have substantially altered the biogeochemical cycling of mercury through atmospheric, aquatic, and terrestrial systems. Unlike natural emissions which consist almost exclusively of gaseous elemental mercury, human emissions may also contain reactive gaseous mercury (Hg(II) complexes) and PHg. Anthropogenic emissions are primarily from the combustion of fossil fuels, gold and other metal production, cement production, and waste incineration (Liu et al., 2012). The combustion of coal alone has been estimated to represent 60% of total anthropogenic emissions (Pacyna et al., 2006). There are also diffuse sources such as landfills, sewage sludge amended fields, and mine waste, which contribute little at the global scale, but may be responsible for high concentrations at the local scale.

Page 28
While historically active mercury ores and artisanal gold claims are present throughout the state, and are known to be direct sources of mercury to the environment, none have been identified within the drainage basis of the proposed Chehalis reservoirs. Centralia Big Hanaford power plant operated by TransAlta Corporation, located approximately 26 miles NE of the proposed dam site, could potentially increase local wet and dry mercury deposition rates. However, prevailing winds would send most deposition eastward, and the plant is scheduled to shut down in less than a decade, so this potential source is considered negligible (Furl and Meredith, 2011). Atmospheric Deposition in Western Washington The National Atmospheric Deposition Program (NADP) monitors precipitation chemistry throughout the United States and Canada. Within the NADP is the Mercury Deposition Network (MDN), which is the only network that provides long-term data on total mercury concentration and deposition in precipitation in the United States. In Washington State, data collection sites are located in Neah Bay and Seattle. Figure 8 shows total mercury wet deposition at all MDN gages throughout the United States and southern Canada with spatial extrapolations for the year 2014. Values at the Neah Bay and Seattle stations are 5.9 and 8.2 μg/m2, respectively. Between 2007, when data collection at Neah Bay began, and 2015, annual deposition has ranged from 5.02-9.14 μg/m2 at the Neah Bay gage. At the Seattle station, between 1996 and 2015, annual deposition has ranged from 4.78-17.38 μg/m2. The effects of aerial deposition on lake sediments was investigated by Paulson and Norton (2008). Mercury was measured in sediment cores, and the rate of sediment deposition was similar to levels reported from lakes in Alaska and ice cores from the Fremont Glacier in Wyoming. They cite a number of studies that show that wet deposition of mercury has declined since the 1990s, but continues at a significant rate. The article documents that aerial deposition and sediment enrichment rates occur at similar rates across the region, with higher rates when there is a significant local upwind source.

Page 29
Dry Deposition and Land Use The wet deposition map, as its name implies, does not include dry deposition of mercury. Professor Biswas of The Evergreen State College has hypothesized that large vegetation, such as the coniferous forests of western Washington, may increase local dry deposition rates by “filtering” PHg from the air (A. Biswas, personal communication, April 14, 2017). This hypothesis is supported by Miller et al. (2005) which suggests that tree foliage can increase mercury inputs. Kolka et al. (1999) also showed that mercury inputs into a forested watershed were up to twice as high as those in a nearby un-forested watershed. Subsequent logging of these coniferous forests could then expedite the transfer of recently deposited mercury to soils and surface waters. In a small spruce forested catchment in southern Finland, Porvari et al. (2003) showed significant increases in the runoff output of MeHg and total mercury after clearcutting. Furl et al. (2009) showed that on the Olympic Peninsula of Washington State, increases in the net flux of mercury to Lake Ozette and Lake Dickey coincided with logging operations in the lake’s drainage basins. This could help explain the
Figure 8. Total mercury wet deposition for the year 2014.
From: http://nadp.sws.uiuc.edu/MDN/annualmdnmaps.aspx

Page 30
elevated mercury concentrations in lakes on the Olympic Peninsula (Furl et al., 2009), which will be discussed later in this report. Obrist et al. (2011) investigated mercury concentrations in litter and soils across 14 forest sites in the United States, and found that litter and soil mercury concentrations positively correlated with soil carbon concentration, latitude, precipitation, and clay in soils. In a stepwise multiregression analyses and individual linear regression analyses, these variables explained up to 94% of mercury concentration variability. Furthermore, the authors observed strong latitudinal increases in mercury concentration, in contrast to inverse latitudinal gradients of atmospheric deposition, as described above. Based on a multiregression model, the authors created a distribution map of mercury concentrations in soils, shown in Figure 9. Of the 14 forest sites included, the Douglas-fir dominant portion of Thompson Forest in western Washington had the highest total mercury concentrations in all litter and soil horizons measured.
Figure 9. Spatial extrapolation of top soil (0-40 cm) mercury concentrations based on multiregression modeling using independent variables latitude, precipitation, soil carbon content, and clay content.
From Obrist et al. (2011).

Page 31
Mercury Methylation What follows is a discussion of the finer details of mercury methylation, including some of the physical, biological, and chemical factors known to affect rates of methylation and overall MeHg levels. It should be noted that when referring to “methylation”, this term is often used to represent net MeHg production, which encompasses both methylation and demethylation processes. Demethylation occurs naturally, depends on MeHg abundance, and may take place via metabolic activity of microbial species (Marvin-DiPasquale et al., 2000) or photodegradation (Bittrich et al., 2011). Common proxies for net methylation include the activity of methylating bacteria (discussed below), measurements of elevated MeHg concentrations, changes in mercury mass balance budgets, and the proportion of total mercury that is in the methylated form. Short term measurements of methylation and demethylation rates have been shown to be, for the most part, unrelated to long-term MeHg accumulation (Drott et al., 2008). Biochemistry of Mercury Methylation Once deposited, transported via runoff, or in some cases discharged from a point source to surface water, Hg(0) and Hg(II) molecules may go through a series of chemical transformations via chemical and biological pathways. While abiotic methylation has been shown to occur in some environments, biotic methylation by microbes is overwhelmingly the primary source of MeHg in almost all aquatic systems (Paranjape & Hall, 2017). For this reason, only biotic methylation will be discussed here. Sulfate reducing bacteria (SRB) have been widely identified as the primary microbes responsible for mercury methylation in aquatic environments. In short, SRBs obtain energy in anaerobic environments by oxidizing organic compounds while reducing sulfate, whereas aerobic organisms reduce oxygen. Although the process of mercury methylation by anaerobic microbes was discovered over 40 years ago, the exact biochemical pathways of methylation are still largely unknown (Liu et al., 2012). While SRBs are widely considered the primary methylators in most environments, it should be noted that not all SRBs are capable of methylation, and among those that can, some are more effective than others (Heyes et al., 2006). Ekstrom et al. (2003) showed that SRBs that use acetate as a carbon source exhibit equal or higher methylation rates than SRBs that use different carbon sources. Known SRBs that are capable of methylation include 10 of 14 strains in the Desulfovibrio, Desulfotomaculum, and Desulfobulbus genera (Kaschak et al., 2014). Furthermore, it is likely that different strains of SRBs and other microbes work in tandem to methylate oxidized and even elemental mercury. Hu et al. (2013) showed that methylating and non-methylating bacteria likely work together to anaerobically oxidize and subsequently methylate elemental mercury, and that under specific conditions (such as naturally high thiol concentrations), certain strains may be able to achieve methylation where they usually would not.

Page 32
Yu et al. (2012) suggest that iron reducing bacteria (IRB) can be important in methylation, and that coexisting SRBs and IRBs may work in tandem to contribute to overall methylation, possibly by spatially and temporally separated processes. Several methanogens have also been shown to have methylating properties (Gilmour et al., 2013). Methanogens are a broad class of microorganisms that produce methane as a metabolic byproduct, and are common in anoxic environments including wetlands, sediments, and the digestive systems of animals. Hamelin et al. (2011) even suggests that methanogens may be the primary methylators in some environments such as in periphyton in fluvial lakes. Acha et al. (2011) (in periphyton in Bolivian Amazon region) and Bravo et al. (2015) (in sediments affected by WWTP discharge) both demonstrated that in some cases SRBs are not responsible for most methylation, but were unable to identify primary methylators. Recent research has shown that the gene pair hgcAB is necessary for methylation (Gilmour et al., 2013), and the identification of this gene pair has already enabled researchers to identify the methylating capabilities of some methanogens and other microbial species (Parks et al., 2013). This development will likely be central to future studies in identifying the range of environmental conditions where methylation occurs as well as the individual species capable of methylation (Paranjape & Hall, 2017). Methylation in Aquatic Environments Mercury methylation has been well documented in the majority of aquatic environments, including boreal lakes and wetlands, wetlands in the northern Great Plains and southern Louisiana, agricultural wetlands, the high Arctic, temperate forests, multiple saline, estuarine and marine environments, surface sediments of mudflats, mangroves, lagoons, and a variety of lakes (Paranjape & Hall, 2017). This is important for a more comprehensive understanding of mercury methylation globally, but for the purposes of this report, methylation in only a few specific environments needs to be discussed. Wetlands, Sediments and Benthic Surfaces Mercury methylation occurs most commonly in wetlands and sediments of aquatic systems, and has been studied extensively, especially in the Experimental Lakes Area in northwestern Ontario. Sediments and porewater of aquatic environments are key locations for methylation, and higher rates of methylation have been demonstrated in surface sediments compared to deep sediment (Matilainen, 1995). In general, there is a trend of decreasing methylation potential with depth below surface sediment (Paranjape & Hall, 2017). This can be explained by a variety of factors, including greater labile carbon and nutrient input and availability, abundance of methylating microbes, and warmer temperatures closer to the surface (Branfireun et al., 1996). Significant methylation has also been observed in periphyton (complex of algae, detritus, cyanobacteria and microbes attached to submerged surfaces). Several studies have identified periphyton as important methylation sites in tropical lakes and other tropical freshwater environments (Coelho-Souza et al., 2006; Acha et al., 2011). In a methylation study in Canadian fluvial wetlands, net methylation rates in periphyton were two orders of magnitude greater than

Page 33
those in the sediments (Hamelin et al., 2015). Because periphyton can be a significant source of food for fish and insects that are eaten by fish, methylation in periphyton may be of special importance when considering the possibility of bioaccumulation in aquatic food webs. Inundated Environments In considering aquatic environments prone to high methylation rates, inundated environments are important. This is evident in the fact that reservoirs throughout North America tend to have elevated MeHg concentrations compared to natural lakes and rivers, and this trend is most apparent in newly created reservoirs (Eckley et al., 2015). Little research has been done specifically in reservoirs in the Pacific Northwest on the association between MeHg concentrations and water level fluctuations. Despite this lack of region specific research, increased methylation rates and elevated MeHg concentrations in both fish and sediments after flooding events are well documented in other temperate regions. Bodaly et al. (1984) showed that increases in fish mercury concentrations occurred simultaneously with the flooding of three lakes caused by the diversion of the Churchill River in central Canada. Other nearby lakes in this study that were unaffected by the diversion did not show increases in fish Hg, demonstrating that atmospheric deposition rates cannot explain the variation. Fish mercury levels increased most within 2-3 years of impoundment, and had still not declined 5-8 years after impoundment. Sorenson et al. (2005) conducted a three year monitoring effort in 14 northeastern Minnesota lakes, 6 of which were influenced by dam operations. Results showed significant positive correlation between fish mercury and both maximum water level and the change in water level fluctuations from one year to the next. Fish mercury was negatively correlated with average secchi depth (an indicator of water clarity), which in turn correlated negatively with water level fluctuations. In other words, water level fluctuations caused decreased water clarity, and fish mercury concentrations increased with increasing water level fluctuations and decreasing water clarity. Studying 6 of the 14 lakes sampled by Sorenson et al. (2005), Larson et al. (2014) found that within year fluctuations of water levels did not correlate with fish mercury concentrations, but year to year variation in maximum water levels (inundation) was positively correlated to fish Hg, supporting the results of Sorenson et al. (2005). There was, however, large variability among lakes. In one lake, a one meter rise in water level was associated with a 108 ng/g wet weight increase in fish Hg, whereas in a different lake, a one meter rise was associated with a 5 ng/g wet weight increase. Other notable studies that showed correlations between water level fluctuations and MeHg concentrations include Kelly et al. (1997), St. Louis et al. (2004), Bodaly et al. (2007), Eckley et al. (2015), and Rolfhus et al. (2015). There are several possible reasons for this relationship, which likely all interact to produce the results mentioned above. The first explanation, which is supported by many studies reviewed here, is that the inundation of vegetation and soils supplies organic material, which stimulates microbial activity (Kelly et al., 1997; Hall and St. Louis, 2004; Hall et al., 2004; 2005; Sorenson et al., 2005). There is little debate in the literature as to whether or not this is part of the reason for increased methylation rates in inundated environments. A second explanation is that flooding

Page 34
events increase sediment volume, which is primarily where methylation occurs (Sizmur et al., 2013). A third explanation is that flooding rapidly incorporates large amounts of terrestrial mercury into the aquatic system (Bodaly et al., 2004; Driscoll et al., 2007). A fourth, more nuanced explanation has to do with the availability of sulfate in sediments. As mentioned above, sulfates are required for methylation by SRBs. SRBs reduce sulfates, as part of their metabolic functioning, to their most reduced form, hydrogen sulfide. Sorenson et al. (2005) and Eckley et al. (2015) show that when water levels fall, sulfides in the sediments are exposed to the atmosphere, at which point they are oxidized back to sulfate. When water levels rise again, the newly oxidized sulfate is mobilized which promotes SRB activity. It could also be argued that in some cases inundation events are caused by heavy precipitation, and with heavy precipitation comes significant wet deposition of mercury, which may explain elevated MeHg concentrations after inundation. In the study by Sorenson et al. (2005), wet deposition was monitored, and found to be weakly correlated with fish mercury concentrations in one of the 14 lakes studied, and not correlated in the remaining 13. Abiotic Factors Affecting Methylation Among the many aquatic environments known to support the process of mercury methylation, there is great variability in both methylation rates and MeHg concentrations in fish, sediments and elsewhere. Even among locations with comparable atmospheric mercury deposition, there is high variability in methylation rates and MeHg concentrations. This leads to the assumption that there is an array of factors that may affect methylation rates. In general, the factors that influence biotic methylation are those that either affect the bioavailability of mercury, the activity of methylating microbes, or both (Benoit et al., 1999; 2003; Heyes et al., 2006). What follows is a brief discussion of abiotic factors that have been shown to affect mercury methylation rates or MeHg concentrations. Oxygen Availability For several decades, it has been well established that anoxic environments are the primary location of methylation (Sonke et al., 2014). As mentioned previously, sulfate reducing bacteria (SRBs), the primary methylators in most environments, are anaerobic. Research continues to show the importance of anoxic environments, especially those associated with sediments (Paranjape & Hall, 2017). There is, however, mounting evidence that methylation occurs in oxic environments as well, but this research is mostly limited to marine and tropical environments. Eckley & Hintelmann (2006), for example, showed that there are several strains of methylating bacteria that are not anaerobic. Hintelmann et al. (2000) postulates that the microbes responsible for most methylation typically thrive at the geochemical interface between oxic and anoxic conditions, suggesting, as was mentioned earlier, that methylation is a process mediated by various microbial species working in tandem.

Page 35
Organic Matter As with oxygen availability, it has been well established for several decades that dissolved organic matter (DOM) increases methylation rates (Hall et al., 2004; 2005). Organic matter has been shown to promote mercury methylation in three ways: through the stimulation of microbial activity (Hall et al., 2004; 2005), by providing methyl groups for methylation, and by keeping mercury in a dissolved form that may be available for methylation. Selvendrian et al. (2008) studied MeHg concentrations in freshwater wetlands in the Adirondack Mountain region of New York, and observed the highest MeHg concentrations during periods of high decomposition. Braaten et al. (2014) showed that in subarctic and boreal lakes, regardless of climate, deposition patterns or system size, DOM levels were most strongly correlated with MeHg concentrations, among other variables. DOM can also increase uptake of MeHg into organisms. In tundra lakes with varying levels of dissolved organic carbon (DOC), MeHg uptake by aquatic invertebrates increased with increasing DOC concentrations, until DOC reached ~8.5 mg C/L, at which point there was an inhibitory effect (French et al., 2014). Calder et al (2016) evaluated 22 hydropower facilities proposed for development in Canada. They note that “microbial production of the bioaccumulative neurotoxin MeHg is stimulated in newly flooded soils by degradation of labile organic carbon and associated changes in geochemical conditions.” They probabilistically modeled a facility in Labrador and projected MeHg levels that were 2.6 times higher in the proposed reservoir and 10 times higher in the downstream rivers. Sulfur As mentioned, the primary methylators in most aquatic systems are SRBs, so it is a fair assumption that sulfate levels influence methylation rates. King et al. (1999) showed that the activity of SRBs is in part controlled by the abundance of sulfate. In general, when DOM is abundant, the presence of sulfur species has been found to have strong correlations to MeHg concentrations in aquatic environments (Paranjape & Hall, 2017). Mitchell et al. (2008) found that additions of sulfate alone or sulfate and labile organic carbon to peat stimulated methylation, whereas additions of labile organic carbon alone did not. By manipulating atmospheric sulfate loading to a small boreal peatland, Coleman Wasik et al. (2012) demonstrated that MeHg concentrations and %MeHg (percentage of total Hg as MeHg) in porewaters increased with sulfate addition and declined when sulfate addition stopped. Four years later, MeHg concentrations and %MeHg were still higher than in control systems, even though MeHg production decreased in the absence of sulfate addition. These results suggest sulfate is often a limiting factor for the growth of SRBs and methylation. Temperature In general there is a clear link between warmer water temperatures and increased microbial activity, including that associated with methylation. However, methylation in lakes is most commonly detected in the hypolimnion, which is the coldest part of the lake in summer when
Page 36
density stratification limits circulation (Eckley & Hintelmann, 2006). This is likely because anoxic conditions in lakes are usually only found in the hypolimnion, and methylation is usually restricted to anoxic environments, as noted. So, with all other variables equal, higher temperatures may stimulate methylation, but in lakes this effect is negligible compared to other factors such as anoxia. As mentioned, MeHg may also be formed in the surface sediment in shallow water, as well as wetlands that may discharge into lakes/reservoirs. These systems experience higher temperatures during the summer, which can produce a seasonal signature of methylation due to temperature (Selvendrian, et al, 2008). pH and Trophic Status Trophic status and pH have been identified as factors that potentially affect methylation in lakes, but complex interactions with other variables make the effects of lake productivity difficult to isolate. Studies have shown various trends with respect to pH and methylation rates. Kelly et al. (2003) showed that uptake of mercury by methylating bacteria can be enhanced under low-pH systems. Ullrich et al. (2001) suggests that high methylation rates are associated with acidic environments, while more recent studies have shown the contrasting relationships in tropical lakes (Correia et al., 2012) and sub-arctic and boreal lakes (Braaten et al., 2014). Similarly, studies on trophic status have shown conflicting results. Braaten et al. (2014) showed that in oligotrophic systems, nitrogen availability was positively correlated with MeHg concentration and %MeHg. Todorova et al. (2009) observed negative correlations between nitrate and MeHg concentrations in the water column of a eutrophic lake. These results may not necessarily be contradictory, since oligotrophic lakes are typically strongly nutrient limited, while eutrophic lakes may be reaching saturation levels of nutrient loads. In oligotrophic (low primary productivity) lakes, such as those studied by Braaten et al. (2014), the addition of nutrients stimulates primary productivity, which increases DOM, which stimulates microbial activity, thereby increasing methylation. However, this process eventually reaches a point of maximum enhancement, at which point the addition of nutrients suppresses methylation, as demonstrated by Todorova et al. (2009). This relationship is likely explained by shifts in the metabolic pathways of organic matter decomposition (Todorova et al., 2009). When oxygen is depleted, the reduction of sulfate, rather than oxygen, becomes favorable for microbes in the sediments and water column. Under these conditions, as just described, the addition of nutrients increases DOM, which increases methylation. However, when nitrate becomes abundant, the reduction of nitrate becomes most favorable. Under these conditions, nitrate reducing bacteria, commonly known as denitrifying bacteria, are most responsible for the decomposition of organic matter. Denitrifying bacteria, unlike SRBs, IRBs, and methanogens, do not methylate mercury.
Page 37
Light Light has been shown to stimulate methylation to some extent, by stimulating photosynthetic activity, which in turn releases labile DOM. However, photodemethylation is generally considered the most important sink of MeHg in freshwater lakes (Lehnherr and St. Louis, 2009) Wide and shallow lakes with higher surface to volume ratio, and therefore higher light exposure compared to hypolimnetic volume, will undergo more photodemethylation than smaller or deeper lakes. Braaten et al. (2014) found both MeHg concentration and %MeHg to be negatively correlated to lake surface area, suggesting photodemethylation as a significant factor in MeHg production. Inorganic Mercury The uptake of inorganic mercury has been shown to be limiting in the methylation process (Schafer et al., 2011). Although atmospheric deposition of inorganic mercury is declining globally, it will not decrease to zero due to natural sources discussed previously and consistently high emissions from Asia (Zhang et al., 2016). Furthermore, there are many legacy mercury deposits currently sequestered in sediments, wetland soils, permafrost, and forests, which could be become mobile under a variety of scenarios, especially those associated with climate change (Paranjape & Hall, 2017). Hammerschmidt & Fitzgerald (2006) compared records from databases for MeHg in fish tissue and atmospheric mercury deposition from monitoring efforts spanning the contiguous United States. Results showed that state-wide average MeHg concentrations in largemouth bass were positively correlated to wet atmospheric mercury fluxes among 22 of the 25 states analyzed, suggesting that the supply of inorganic mercury to freshwater systems is an important factor influencing the bioaccumulation of mercury in aquatic systems. Additionally, Benoit et al. (2003) demonstrated that MeHg is correlated with inorganic mercury at low concentrations in aquatic systems unaffected by point sources. At the national scale, wet deposition is clearly a limiting factor for MeHg bioaccumulation. As has been demonstrated, however, methylation rates and fish mercury concentrations can vary considerably between closely located lakes with similar wet deposition rates. These contrasting relationships suggest that at large spatial scales (between U.S. states), wet deposition of mercury limits bioaccumulation, whereas at smaller scales (between lakes in western Washington), other biogeochemical factors, such as those mentioned above, are limiting.

Page 38
Assessing the Risk in the Proposed Chehalis Reservoirs
Due to the wide variety of factors that may affect MeHg production and bioaccumulation, it is difficult to predict specific mercury concentrations and methylation rates in the proposed Chehalis reservoirs. Not only are there many factors to consider, there is a wide range of observed MeHg concentrations and production rates in lakes throughout Washington with similar driving forces. In this section, an attempt is made to identify the factors that will likely have significant effects on methylation and MeHg concentrations in the reservoirs under the FRFA and FRO scenarios. Although impacts under the FRO scenario are likely much less, they will be discussed for comparison. Results from studies on lakes and reservoirs throughout western Washington will be presented for comparative purposes, and to serve as references for the approximate range of MeHg concentrations that can be expected in the Chehalis reservoir. For reference, and based on the modeling results of Anchor QEA (2016) of baseline conditions (no major flooding event), the FRFA reservoir would have the following physical characteristics:
• Drainage basin: 68.9 square miles • Elevation: 590-627 feet • Surface area: 600-822 acres • Lake volume: 38,000-65,800 acre feet • Mean volume:surface area ratio: 78.5 • Max depth: 165-202 feet • Dominant watershed land type: Forest The range of values are due to changes associated with FRFA flow augmentation operations (full drawdown to full augmentation elevation). Because these values are being presented for comparison with existing lakes (see Tables 2 and 3 below), they do not include fluctuations associated with flooding events. The values above and in Table 3 represent average conditions during any given year. If the elevation, surface area, volume, and depth included values for peak floods, they would misrepresent the average daily characteristics of the reservoir. While the effects of flooding events are not represented by the values listed above, their importance in the cycling of mercury and potential for mercury bioaccumulation cannot be overstated. These effects, under both FRO and FRFA scenarios will be further discussed in the subsection titled “Inundation” at the end of this report. For now, mercury in fish tissue data from several lakes and reservoirs of western Washington will be presented.

Page 39
Mercury Data in Western Washington Lakes and Reservoirs Context for Mercury in Fish Tissue Data As of December 2016, the Washington State Water Quality Standard (WQS) for human health for MeHg in freshwater fish is 30 ug/kg (parts per billion, ppb) as set by EPA rule (40 CFR 131.45). It is important to note that this value is calculated based on a reference dose (RfD), which is an estimate of daily exposure that is likely to have no appreciable health effect after a lifetime (70 years) of daily exposure (EPA, 2001). This reference dose is based on a fish consumption rate of 175 grams/day (a little less than one-half pound per meal, six meals per week), which represents average consumption rates of both fish and shellfish for highly exposed populations. The Washington State Department of Health (DOH) screening level for fish consumption advisories is 101 ppb, and is based on a fish consumption rate of 59.7 grams/day (about two half-pound meals per week). This screening level is meant to advise fish consumers, whereas the WQS of 30 ppb is used to set National Pollutant Discharge Elimination System (NPDES) permit limits and assess waters (Mathieu & McCall, 2017). For this reason, the DOH screening level of 101 ppb may be more practical in assessing the risk of significant MeHg exposure through fish consumption. It should also be noted that these standards are for MeHg in fish tissue, whereas the mercury concentrations shown in Table 3 are for total mercury. The values are comparable, however, because the majority (~95%) of mercury in fish tissue is typically MeHg (Bloom, 1995; Driscoll et al., 1994). Mercury Data Since 2005, Ecology has been conducting long-term monitoring of mercury in fish tissues in Washington lakes. Each year, tissue samples from bass, salmonids, and other species are collected from a different set of six lakes throughout the state. Ecology returns to each set every five years to assess trends in fish tissue mercury concentrations, for a total of 30 lakes sampled. Table 2 lists nine waterbodies in western Washington that were selected for physical characteristics and/or location comparable to the proposed FRFA reservoir. Five are natural lakes, and four are regulated impoundments. Two of the impoundments are natural lakes that were dammed, and two are rivers that were impounded. Aldwell Lake was sampled in 2007 and was removed in 2012. Data from the FRFA design are included for comparison. Table 3 shows results for 2007 through 2015 for bass and salmonids in these waterbodies. The range of fish lengths in each lake is provided because fish tissue mercury concentrations can correlate with size. As shown in the Table 3, mean mercury concentrations in fish from all waterbodies in all surveys exceed the WQS of 30 ppb, except for one survey in one lake (salmonid results from Lake Nahwatzel in 2008).

Page 40
Mean concentrations of mercury in bass exceeded the DOH screening level of 101 ppb during all but three lake surveys –Silver Lake was below this level in one survey and the two Failor Lake surveys were both below this level. The upper range of bass mercury values exceed the DOH screening level for all lake surveys. Fish mercury concentrations exceeded the DOH level at the lower range of values in Lake Ozette, Lake Nahwatzel, and Lake Whatcom. In general, mercury levels in lakes shown in Table 3 were higher in bass than in salmonids. All mercury concentrations in salmonids from lakes (which were composites of multiple fish) met the DOH limit. However, one sample from Lake Cushman was slightly above the limit, and the samples from the other three reservoirs (4 samples total) all exceeded the DOH limit. Using data from Ecology’s long term mercury monitoring project, Mathieu et al. (2013b) analyzed spatial patterns in largemouth and smallmouth bass mercury levels across the range of land and climate types, lake chemistry parameters, and physical watershed characteristics represented by the 24 lakes used in the study. Importantly, bass mercury values were normalized to a standard length to adjust for the effect of fish size and to allow for comparisons and correlations across different lakes. Results showed that mercury bioaccumulation in bass was strongly correlated with annual watershed precipitation (positive correlation) and lake alkalinity (negative correlation). Lakes on the west side of the Cascade Mountain Range had significantly higher fish mercury concentrations than those on the east side, primarily due to precipitation patterns. Among lakes on the west side of the state, variability among factors correlated with bass mercury concentrations statewide (precipitation and alkalinity) could not explain the variability in fish mercury concentrations. The differences in lakes on the west side were defined by wetland abundance, DOC levels, and lake depth. As noted previously, both wetlands and DOC concentration are generally known to be positively correlated to MeHg production. In this case, however, both of these variables had little to no correlation to fish mercury (Mathieu et al., 2013b). Unfortunately, there is little data on mercury or MeHg concentrations in reservoirs in western Washington. The four reservoirs shown in Table 3 represent a small data set, and differ in many ways from the proposed Chehalis FRFA reservoir. Wynoochee Lake and Skookumchuck Reservoir are the two reservoirs that most resemble the proposed FRFA reservoir in terms of geography, water inflow characteristics, and dam operations. No mercury data could be found for either of these reservoirs or their associated rivers. In addition, little data could be found on current mercury levels in fish in the Chehalis River. One survey in 2005 measured fish tissue mercury of 0.58 and 0.49 in two cutthroat trout replicates from the Montesano area, and a measurement of 0.49 mg/kg from a salmon sample collected near Aberdeen. No data have been found for the upper Chehalis River.

Page 41
Table 2. Physical characteristics of various lakes in western Washington with fish tissue mercury data.
Water Body FRFA Silver Lake
Lake Ozette
Lake Nahwatzel
Failor Lake
Lake Whatcom
Lake Cushman
Aldwell Lake
Chester Morse Lake
Spada Lake
County Lewis Cowlitz Clallam Mason Grays Harbor Whatcom Mason Clallam King Snohomish
Drainage basin size (square miles) 68.9 39.3 77.5 6.2 4.9 55.9 95 315 81.4 74.5
Elevation (feet) 627 484 29 440 117 315 615-738 188 1,538 1,454
Surface area (acres) 822 2,300 7,300 270 65 5,000 4,010 270 280 1,687
Lake volume (acre-feet) 65,800 13,000 960,000 4,600 500 770,000 453,350 7,600 175,000 153,260
Lake volume: surface area ratio 78.5 5.7 131.5 17.0 7.7 154 113 28.1 625 90.9
Max depth (feet) 202 10 320 25 22 330 262 94 115 >200
Dominant land type Forest Forest, residential Forest Forest Forest Forest,
residential Forest,
residential Forest Forest Forest

Page 42
Table 3. Fish tissue mercury concentrations for various lakes in western Washington.
Water Body Silver Lake
Lake Ozette
Lake Nahwatzel
Failor Lake
Lake Whatcom
Lake Cushman
Aldwell Lake
Chester Morse Lake
Spada Lake
Waterbody type Natural lake Natural lake Natural lake Natural lake Natural lake Regulated lake Reservoir Regulated
lake Reservoir
Sampling year 20101 20152 20073 20124 20085 20136 20097 20148 20097 20148 20079 20079 20079 20079
Bass (largemouth, smallmouth)
Fish length range (mm)
233- 510
230- 462
246-415
263-400
232-263
234-350
195-430
119-480
284-443
290-440
Mean fish Hg concentration (ppb wet weight)
93.5 130 715 463 330 215 76.2 93.8 368 457
Fish Hg range (ppb wet weight)
49.3- 236
42.9- 243
350-1800
203-830
256-461
145-344
40.2-213
41.3-398
167-907
162-1240
Salmonids (rainbow, brook, cutthroat, and redband trout; kokanee; steelhead; blueback, red, and sockeye salmon; mountain whitefish)
Fish length range (mm) 312-
340 331-381
191-372 199-
260 250-325
254- 282
306- 320 412 291
Mean fish Hg concentration (ppb wet weight)
24.4 30.1 46.7 87.9 78.8 105 141 -- --
Fish Hg range (ppb wet weight) 20.2-
31.7 15- 41
26.5-63.2 81.5-
94.3 71.3-83.6
86- 130
102- 181 407 150
1Meredith and Friese (2011); 2Mathieu & McCall (2017); 3Furl and Meredith (2008); 4Mathieu et al. (2013a); 5Furl, et al. 2009; 6Mathieu & McCall (2015); 7Meredith et al. (2010); 8Mathieu & McCall (2016); 9Seiders & Deligeannis (2007). Hg: mercury.

Page 43
Fischnaller et al. (2003) analyzed fish tissue mercury samples collected in 2001 and 2002 from 20 waterbodies throughout Washington State. Results were consistent with those reported in Table 3, and included several reservoirs in eastern Washington. Interestingly and in contrast to many of the studies referenced throughout this report, the three eastern Washington reservoirs studied – Moses Lake, Upper Long Lake, and Banks Lake – had significantly lower fish mercury concentrations than most of the other waterbodies studied. The authors attribute the relatively low fish mercury concentrations in these reservoirs to high annual flushing rates, which would limit the amount of MeHg available for bioaccumulation. Furthermore, there is little vegetation in and surrounding the footprint of these reservoirs, which likely limits microbial activity and MeHg production.
Significant Factors in the Proposed Chehalis Reservoirs Of the many factors that may affect mercury methylation and fish tissue concentrations in reservoirs, some are clearly more influential than others. However, some of these factors are less likely to have a significant effect in the proposed Chehalis reservoirs due to their specific nature. This section will cover factors that are most relevant to mercury bioaccumulation in the proposed reservoirs. Precipitation As reported by Mathieu et al. (2013b), precipitation can be strongly correlated to fish mercury concentrations, as rainfall increases wet deposition and terrestrial runoff of mercury. Mean annual precipitation for the lakes listed in Tables 2 and 3 ranged approximately 40-110 inches (includes + 1 Standard Deviation). These values were generated by the PRISM Climate Group at Oregon State University, and are based on average annual rainfall depths for the years 1984-2008. Precipitation in the drainage basin of the proposed reservoirs ranges from 50 to over 120 inches per year. At the dam location, mean annual precipitation ranges from about 50-75 inches per year, whereas at the headwaters of the Chehalis River, upstream of the reservoir footprint, mean annual precipitation is over 120 inches per year. These values were also generated by the PRISM Climate Group at OSU, and are based on average annual precipitation for the years 1981-2010. USGS’s StreamStats version 3.0 web application calculated a mean annual precipitation for the theoretical reservoir drainage basin of 104 inches. Based on these reported values, precipitation is a driver likely to influence fish mercury concentrations in the Chehalis reservoirs at a level similar to other lakes and reservoirs in western Washington. Vegetation and Logging Operations Kolka et al. (1999), Miller et al. (2005), and others have demonstrated that surrounding foliage abundance correlates with mercury inputs into aquatic systems. Based on the USGS National Land Cover Database, WDFW habitat surveys within the Chehalis River system, and the Chehalis Basin Strategy’s Habitat Mapping and Wildlife Studies Technical Memorandum,

Page 44
vegetation in the reservoir drainage basin is primarily coniferous forest (dominated by western hemlock, western red cedar, western white pine, Douglas fir, and Sitka spruce). These species are relatively large, and contribute considerably to the overall vegetation of the landscape. There is also a small amount of mixed coniferous/deciduous forest and shrub-scrub, both of which are typically adjacent to roadways, developed areas, and other disturbed sites such as rivers. According to USGS’s StreamStats version 3.0, 80.3 percent of the drainage basin is covered by canopy. Porvari et al. (2003), Furl et al. (2009), and others have shown that logging operations in a drainage basin can significantly increase mercury inputs to a waterbody. Specifically, Furl et al. (2009) showed that logging operations on the Olympic Peninsula increased both sedimentation rates and the net flux of mercury to the water bodies, two factors known to increase fish tissue mercury concentrations. Under the FRO scenario, 6 acres of vegetation would be removed for construction of the dam, and 405 acres of mixed coniferous/deciduous forested riparian areas in the inundation footprint would be selectively harvested. Under the FRFA scenario, 9 acres would be removed for dam construction, up to 178 acres of mixed coniferous/deciduous would be selectively harvested, and 711 acres would be harvested from forested upland, riparian, and wetland plant communities. Furthermore, the entire drainage basin is commercial forestland, meaning all areas not set aside due to environmental constraints, such as stream buffers and unstable slopes, could be subject to logging operations. Consequently, the proposed Chehalis reservoirs can be expected to have a similar risk of mercury bioaccumulation contributed by managed forests in the watershed as compared to other lakes in western Washington with similar forested watersheds and logging operations. It is important to note that the conditions in the short-term after reservoir operation begins will likely be considerably different from long-term conditions, particularly with respect to vegetation. The initial flooding of the FRFA reservoir footprint will inundate large amounts of vegetation and soil, which may stimulate a spike in methylation. Eventually much of this organic matter will be respired, which may result in reduced levels of MeHg production possibly 5-10 years later or longer (Bodaly et al. 1984). However, periodic large-scale logging operations within the basin may result in episodic changes in the reservoir inputs of sediment, DOM, and large woody debris. Inundation Arguably the most important factor in assessing the risk of mercury bioaccumulation in the Chehalis reservoirs is the periodic elevation change and subsequent inundation of surrounding organic matter. As discussed, there is a large body of literature documenting increases in methylation rates and fish tissue mercury concentrations in concurrence with changes in lake or reservoir elevation/area change. Eckley et al. (2015) asserts that this trend is most pronounced in newly created reservoirs. Moreover, the shape of the proposed reservoirs (and reservoirs in general) are highly dendritic (see Figure 2), so a change in reservoir depth will be associated with a much larger change in area and inundation of organic matter than in natural lakes.

Page 45
Under the FRO scenario, the surrounding landscape would be exposed to periodic inundations of up to 306 acres of coniferous forest (Douglas fir dominated), which would transition to mixed deciduous/coniferous due to periodic flooding. Under the FRFA scenario, up to 262 acres of coniferous forest would be periodically inundated. Less forest would be periodically inundated under the FRFA scenario because a large percentage of the reservoir would exist permanently. For these reasons, the proposed reservoirs can be expected to have methylation rates and bioaccumulation at least comparable to other lakes and reservoirs in western Washington, and possibly higher. Compared to lakes, the reservoirs will experience much greater fluctuations and inundations, which research has found to increase methylation. Compared to other existing reservoirs, more terrestrial organic material will be inundated in the initial years following construction, which also may increase methylation in the short term. Wetlands Wetlands are widely known to be “hotspots” for mercury methylation (Paranjape & Hall, 2017). In and surrounding the two reservoir inundation footprints, there are a variety of wetland types, including palustrine forested wetlands, scrub-shrub wetlands, and emergent wetlands. The FRO reservoir, at maximum volume, is estimated to inundate a total of 68 acres of these wetlands. The FRFA reservoir is estimated to permanently cover 22 acres of wetlands, and to inundate an additional 67 acres during flooding events. The permanent inundation of 22 acres of wetlands by the FRFA reservoir may decrease the amount MeHg production by these wetlands. However, the periodic inundation of an additional 70 acres will likely transport MeHg produced in these wetlands to the reservoirs, where it may enter the aquatic food chain – an impact that could occur for either flood retention alternative. Furthermore, the FRFA reservoir pool may raise the water table, which combined with periodic inundations will likely create new wetlands with the potential to increase methylation. More study would help clarify the overall potential change in wetland area and methylation rates. However, qualitatively it appears likely that both reservoirs would increase and mobilize wetland derived MeHg, increasing bioaccumulation potential. Dissolved Oxygen Due to the rapid creation and termination of the FRO reservoir by periodic flooding events and subsequent dam operations, stratification and hypoxic conditions are unlikely to develop. In the FRFA reservoir, however, hypoxic conditions in the hypolimnion (lower layer) are highly likely throughout the later summer months (Anchor QEA, 2016). When future climatic conditions associated with climate change are considered, these trends will likely become more pronounced. As discussed, anoxic conditions are widely accepted as being needed for most methylation processes. The predicted extent of stratification and hypoxia in the FRFA reservoir does not exceed the range of observed values in other lakes and reservoirs. So, while there will be sufficient anoxia to support methylation processes, this particular factor is likely to be similar in the FRFA reservoir as compared to other lakes and reservoirs in the region. However, the decay

Page 46
of inundated organic material may increase hypoxia in the FRFA reservoir during the first several years of operation, adding to the factors enhancing methylation during this period. Sedimentation In general, sediments and pore water within sediments of aquatic systems are key locations for methylation. As discussed in the reservoir limnology section, reservoirs typically retain more sediment from inflow waters than do natural lakes. This will likely be the case in the proposed Chehalis reservoirs, especially in the upstream delta areas where tributaries enter the reservoir under the FRFA scenario (Anchor QEA, 2016b). Total suspended sediment (TSS) retention rates in the FRFA reservoir under current and future conditions are predicted to be approximately 82% and 80%, respectively. Despite sediments being important for methylation, it is difficult to say whether high sediment retention rates will result in elevated methylation rates on the basis of increased substrate. This is because methylation takes place primarily in the surface sediments of the hypolimnion, and decreases with depth. However, a portion of the TSS that would be retained is organic, and organic matter has been shown to increase methylation rates. For these reasons, it is possible that sedimentation patterns will increase methylation in the FRFA reservoir on the basis of increased organic matter loading.

Page 47
Conclusions and Recommendations
Potential Impacts Given the suite of factors associated with an increase in mercury methylation and bioaccumulation that would be present in the FRFA reservoir, it is highly likely that fish mercury concentrations would be similar to concentrations found in past studies in western Washington (as reported in Table 3). Factors likely to contribute to elevated mercury concentrations in fish within the reservoir include: • High mean annual precipitation. • The abundance of large vegetation and logging operations in the drainage basin. • The seasonal development of hypoxic conditions. • Sedimentation processes. • The extensive inundation of vegetation, organic material, soils, and wetlands. • The episodic nature of reservoir inundation, which can occur over a broader range and more
frequently than in natural lakes. Beyond this general statement, it is difficult to make any predictions regarding magnitude. However, comparisons with observed mercury concentrations in the reservoirs and lakes shown in Table 3 suggest similar impacts in the FRFA reservoir:
• Mercury methylation and bioaccumulation by biota are likely to be sufficient that resident fish could fail to meet the human health criterion for mercury in the state water quality standards.
• Fish mercury levels could also reach levels that trigger fish consumption advisories, especially for bass, but possibly at times also for resident salmonids.
• Fish tissue mercury levels could be higher in the first 5-10 years of operation, and then could decrease in later years after the reservoir reaches more stable conditions.
• Based on limited data for reservoir and Chehalis River fish and on research findings, fish mercury levels could possibly increase to levels higher than currently found in the Chehalis River.
• Some evidence suggests that fish mercury levels in the reservoir may become higher than levels found in natural lakes.
Under the FRO scenario, it is reasonable that periodic inundation of vegetation and surrounding wetlands will increase methylation rates and methylmercury (MeHg) mobilization from wetlands to the Chehalis River. However, the fate of this MeHg is uncertain. Due to the short duration of the reservoir’s existence, it is unlikely that significant bioaccumulation will occur, as resident species at the top of the aquatic food chain are at the most risk due to biomagnification. Furthermore, chronic exposure to MeHg is required for significant bioaccumulation, and inundation events would occur relatively infrequently under the FRO scenario. Moreover, once

Page 48
released from the reservoir, MeHg would become highly diluted in the Chehalis River, and would be exposed to sunlight, potentially resulting in significant photodemethylation. In addressing the overall question of whether the construction of a flood retention facility on the upper Chehalis River is likely to result in increased MeHg bioaccumulation in the aquatic food chain over current conditions, previous research suggests it is likely, particularly in the first few years after construction. The specific magnitudes of adverse effects is difficult to predict with certainty. However, previous research on MeHg production in reservoirs strongly indicates that the physical characteristics of the watershed and expected characteristics of the reservoir’s limnology and ecosystem will elevate mercury levels in the tissues of fish that reside in the reservoir during the summer. As a final note, at the time of publication a paper was released that includes a review of MeHg impacts in reservoirs (Hsu-Kim et al., 2017). This paper provides findings that are consistent with the results of the study reported here, and is cited as a further source of information for future research into potential impacts of a Chehalis River flood retention reservoir on mercury in aquatic biota.
Information Gaps and Recommended Study Methods Moving forward, there are several recommendations for improving our knowledge base to predict the potential impacts, in terms of mercury bioaccumulation, of a dam on the Chehalis River. There is a gap in data concerning mercury concentrations and trends in reservoirs of western Washington. None of the water bodies in western Washington addressed by Ecology’s long-term monitoring program are reservoirs. For the reasons discussed in this paper, reservoirs are typically more susceptible to elevated mercury methylation and bioaccumulation rates than natural lakes. In order to more accurately assess this risk in the proposed Chehalis reservoirs (especially FRFA), the following recommendations should be considered:
• Conduct long-term monitoring of mercury in fish tissue of Wynoochee Lake and Skookumchuck Reservoir (both are reservoirs). The methods used in the state-wide lakes assessment discussed previously should be adopted. Results from this monitoring could be compared to other data for lakes and reservoirs, to support a more refined evaluation of potential impacts from Chehalis reservoir proposals.
• Monitor other reservoirs in western Washington, such as: Riffe Lake, a 23.5 mile long reservoir on the Cowlitz River in Lewis County; Mud Mountain Lake, a flood-only reservoir on the White River in King County; and Howard Hanson Reservoir on the Green River in King County.
• Conduct baseline fish tissue mercury monitoring for resident fish in the upper Chehalis River, both in the reservoir footprint and in downstream reaches. This will provide a baseline data set for comparison to future monitoring or modeling of mercury in fish.

Page 49
Monitoring of these reservoirs would provide a relatively comprehensive data set that includes reservoirs with a variety of physical characteristics. This information may be useful for consideration of fish consumption advisories by the Washington State Department of Health. To evaluate the potential correlation of fish mercury levels with reservoir characteristics, the following data collection is recommended in conjunction with mercury in fish tissue monitoring at each reservoir:
• Vertical profiles of temperature, pH, conductivity, and DO at the deepest point in each reservoir.
• Measurements of alkalinity, dissolved organic carbon, and chlorophyll-a in the epilimnion and hypolimnion.
• Measurements of sulfates, total mercury, and organic matter in sediments. • Watershed characteristics including annual precipitation and land use/land cover, paying
special attention to logging activity in each watershed. • Physical lake characteristics including volume:surface area ratio and lake surface area:
drainage basin area ratio. Further analysis is needed to quantify the areas of wetland lost by inundation, affected by episodic inundation, or created by raised water tables for the flood retention alternatives. The changes in rates of methylation and MeHg transport and uptake in the food chain could be quantified using improved wetland information and modeling of wetland MeHg dynamics. The potential for modeling mercury methylation and bioaccumulation in the proposed reservoir could be explored, possibly using the EPA BASS model (EPA, 2017), the USGS National Fish Mercury Model (USGS, 2016), or the methodology of Calder et al. (2016). This information could potentially elucidate the most important driving forces of mercury bioaccumulation specific to western Washington and the proposed Chehalis reservoirs. In addition, studying the effects of periodic inundation on MeHg production and bioaccumulation at various time scales would provide valuable insights to the dynamics of the proposed Chehalis Reservoirs (Bodaly et al., 1984; Kelly et al., 1997; Eckley et al., 2015; St. Louis et al., 2004). As discussed previously, the varying frequencies and magnitudes of inundation associated with flooding events and flow augmentation operations may influence mercury concentrations in fish. Finally, this review represents a preliminary assessment of the available data and literature. A more comprehensive and in-depth study of the issues raised in this review can help to determine the state of knowledge with more certainty and direct future work towards the most significant issues and gaps in understanding.

Page 50
References Achá D, Hintelmann H, and Yee J. 2011. Importance of sulfate reducing bacteria in mercury methylation and demethylation in periphyton from Bolivian Amazon region. Chemosphere, 82: 911–916. doi:10.1016/j.chemosphere.2010.10.050. Anchor QEA, LLC. (2016a). Chehalis Basin Strategy draft operations plan for flood retention facilities. Anchor QEA LLC. (2016b). Chehalis Basin Strategy draft reservoir water quality model. Barkay T, Gillman M, and Turner RR. 1997. Effects of dissolved organic carbon and salinity on bioavailability of mercury. Applied and Environmental Microbiology, 63: 4267–4271. PMID:9361413. Baxter CV. 2002. Fish movement and assemblage dynamics in a Pacific Northwest riverscape. Doctor of philosophy in fisheries science dissertation, Oregon State University. Benoit JM, Gilmour CC, Heyes A, Mason RP, and Miller CL. 2003. Geochemical and biological controls over methylmercury production and degradation in aquatic ecosystems. Biogeochemistry of environmentally important trace elements, 19: 262–297. Benoit JM, Gilmour CC, Mason RP, and Heyes A. 1999. Sulfide controls on mercury speciation and bioavailability to methylating bacteria in sediment pore waters. Environmental Science & Technology, 33: 951–957. doi:10.1021/es9808200 Bittrich DR, Rutter AP, Hall BD, and Schauer JJ. 2011. Photodecomposition of methylmercury in atmospheric waters. Aerosol and Air Quality Research, 11: 290–299. doi:10.4209/aaqr.2010.11.0096. Bloom, N. 1995. Considerations in the Analysis of Water and Fish for Mercury. In National Forum on Mercury in Fish: Proceedings. U.S. Environmental Protection Agency Office of Water, Washington D.C. EPA Publication No. 823-R-95-002. Bodaly RA, Hecky RE, and Fudge RJP. 1984. Increases in fish mercury levels in lakes flooded by the Churchill River Diversion, northern Manitoba. Canadian Journal of Fisheries and Aquatic Sciences, 41: 682–691. doi:10.1139/f84-079. Bodaly RA, Beaty K, Hendzel L et al (2004). Experimenting with hydroelectric reservoirs. Environ Sci Technol 38:346A–352A Bodaly RA, Jansen WA, Majewski AR, Fudge RJP, Strange NE, Derksen AJ, et al. 2007. Post-impoundment time course of increased mercury concentrations in fish in hydroelectric reservoirs of northern Manitoba, Canada. Archives of Environmental Contamination and Toxicology, 53: 379–389. PMID:17728990. doi:10.1007/s00244-006-0113-4.
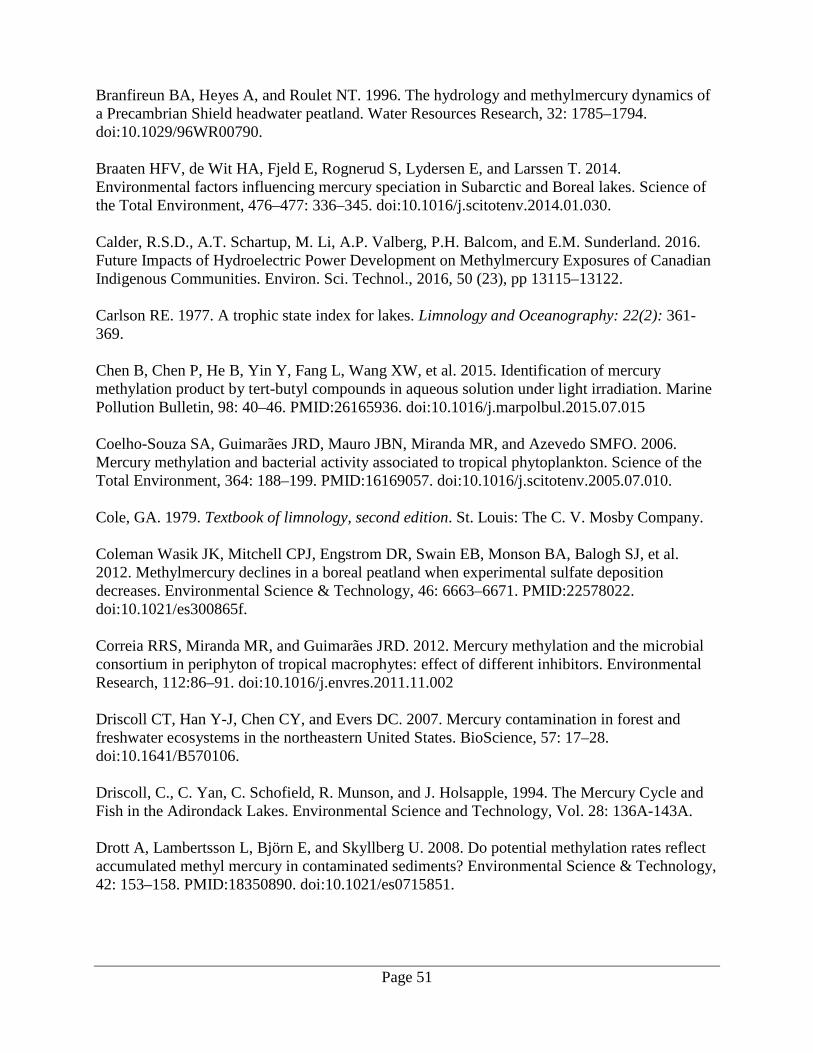
Page 51
Branfireun BA, Heyes A, and Roulet NT. 1996. The hydrology and methylmercury dynamics of a Precambrian Shield headwater peatland. Water Resources Research, 32: 1785–1794. doi:10.1029/96WR00790. Braaten HFV, de Wit HA, Fjeld E, Rognerud S, Lydersen E, and Larssen T. 2014. Environmental factors influencing mercury speciation in Subarctic and Boreal lakes. Science of the Total Environment, 476–477: 336–345. doi:10.1016/j.scitotenv.2014.01.030. Calder, R.S.D., A.T. Schartup, M. Li, A.P. Valberg, P.H. Balcom, and E.M. Sunderland. 2016. Future Impacts of Hydroelectric Power Development on Methylmercury Exposures of Canadian Indigenous Communities. Environ. Sci. Technol., 2016, 50 (23), pp 13115–13122. Carlson RE. 1977. A trophic state index for lakes. Limnology and Oceanography: 22(2): 361-369. Chen B, Chen P, He B, Yin Y, Fang L, Wang XW, et al. 2015. Identification of mercury methylation product by tert-butyl compounds in aqueous solution under light irradiation. Marine Pollution Bulletin, 98: 40–46. PMID:26165936. doi:10.1016/j.marpolbul.2015.07.015 Coelho-Souza SA, Guimarães JRD, Mauro JBN, Miranda MR, and Azevedo SMFO. 2006. Mercury methylation and bacterial activity associated to tropical phytoplankton. Science of the Total Environment, 364: 188–199. PMID:16169057. doi:10.1016/j.scitotenv.2005.07.010. Cole, GA. 1979. Textbook of limnology, second edition. St. Louis: The C. V. Mosby Company. Coleman Wasik JK, Mitchell CPJ, Engstrom DR, Swain EB, Monson BA, Balogh SJ, et al. 2012. Methylmercury declines in a boreal peatland when experimental sulfate deposition decreases. Environmental Science & Technology, 46: 6663–6671. PMID:22578022. doi:10.1021/es300865f. Correia RRS, Miranda MR, and Guimarães JRD. 2012. Mercury methylation and the microbial consortium in periphyton of tropical macrophytes: effect of different inhibitors. Environmental Research, 112:86–91. doi:10.1016/j.envres.2011.11.002 Driscoll CT, Han Y-J, Chen CY, and Evers DC. 2007. Mercury contamination in forest and freshwater ecosystems in the northeastern United States. BioScience, 57: 17–28. doi:10.1641/B570106. Driscoll, C., C. Yan, C. Schofield, R. Munson, and J. Holsapple, 1994. The Mercury Cycle and Fish in the Adirondack Lakes. Environmental Science and Technology, Vol. 28: 136A-143A. Drott A, Lambertsson L, Björn E, and Skyllberg U. 2008. Do potential methylation rates reflect accumulated methyl mercury in contaminated sediments? Environmental Science & Technology, 42: 153–158. PMID:18350890. doi:10.1021/es0715851.

Page 52
Eckley CS, and Hintelmann H. 2006. Determination of mercury methylation potentials in the water column of lakes across Canada. Science of the Total Environment, 368: 111–125. PMID:16216310. doi:10.1016/j.scitotenv.2005.09.042. Ecology, 2017. Chehalis Basin Strategy Programmatic EIS. Washington State Department of Ecology, Olympia, WA. http://chehalisbasinstrategy.com/eis-library/ Ekino S, Susa M, Ninomiya T, Imamura K, and Kitamura T. 2007. Minamata disease revisited: An update on the acute and chronic manifestations of methyl mercury poisoning. Journal of the Neurological Sciences, 262: 131-144. EPA. 2001. Water quality criterion for the protection of human health: methylmercury. Office of Science and Technology, Office of Water. U.S. Environmental Protection Agency, Washington, DC. Publication: EPA-823-R-01-001. EPA. 2004. Understanding Lake Ecology, Water on the Web. U.S. Environmental Protection Agency. http://www.waterontheweb.org/under/lakeecology/11_foodweb.html EPA. 2016. Understanding Lake Ecology, Water on the Web. U.S. Environmental Protection Agency. http://www.waterontheweb.org/curricula/ws/unit_01/U1mod2_3.html EPA. 2017. Exposure Assessment Models – BASS. Website. https://www.epa.gov/exposure-assessment-models/bass French TD, Houben AJ, SDesforges J-PW, Kimpe LE, Kokelj SV, Poulain A, et al. 2014. Dissolved organic carbon thresholds affect mercury bioaccumulation in Arctic Lakes. Environmental Science & Technology, 48: 3162–3168. PMID:24524759. doi:10.1021/es403849d. Friedli HR, Radke LF, Prescott R, Hobbs PV, and Sinha P. 2003. Mercury emissions from the August 2001 wildfires in Washington State and an agricultural waste fire in Oregon and atmospheric mercury budget estimates. Global biogeochemical cycles, 17: 1039. doi:10.1029/2002GB001972. Furl CV, Colman JA, Bothner MH (2010) Mercury sources to Lake Ozette and Lake Dickey: highly contaminated remote coastal lakes, Washington State, USA. Water Air Soil Pollut 208:275–286. Furl, C. and Meredith, M. 2008. Measuring mercury trends in freshwater fish in Washington State, 2007 sampling results. Washington State Department of Ecology, Olympia, WA. Publication No. 08-03-027. https://fortress.wa.gov/ecy/publications/SummaryPages/0803027.html Furl, C. and Meredith, M. 2011. Mercury Accumulation in Sediment Cores from Three Washington State Lakes: Evidence for Local Deposition from a Coal-Fired Power Plant. Arch Environ Contam Toxicol (2011) 60:26–33. https://link.springer.com/content/pdf/10.1007%2Fs00244-010-9530-5.pdf

Page 53
Furl, C. M. Meredith, and M. Friese. 2009. Measuring mercury trends in freshwater fish in Washington State, 2008 sampling results. Washington State Department of Ecology, Olympia, WA. Publication No. 09-03-045. https://fortress.wa.gov/ecy/publications/SummaryPages/0903045.html Gilmour CC, Podar M, Bullock AL, Mitchell Grahan A, Brown S, Somenahally AC, et al. 2013. Mercury methylation by novel microorganisms from new environments. Environmental Science & Technology, 47: 11810–11820. PMID:24024607. doi:10.1021/es403075t. Hall BD, and St. Louis VL. 2004. Methylmercury and total mercury in plant litter decomposing in upland forests and flooded landscapes. Environmental Science & Technology, 38: 5010–5021. PMID:15506193. doi:10.1021/es049800q. Hall BD, St. Louis VL, and Bodaly RA. 2004. The stimulation of methylmercury production by decomposition of flooded birch leaves and jack pine needles. Biogeochemistry, 68: 107–129. doi:10.1023/B:BIOG.0000025745.28447.8b. Hall BD, St. Louis VL, Rolfhus KR, Bodaly RA, Beaty KG, Paterson MJ, et al. 2005. The impact of reservoir creation on the biogeochemical cycling of methyl and total mercury in boreal upland forests. Ecosystems, 8: 248–266. doi:10.1007/s10021-003-0094-3. Hamelin S, Amyot M, Barkay T, Wang YX, and Planas D. 2011. Methanogens: principal methylators of mercury in lake periphyton. Environmental Science & Technology, 45: 7693–7700. PMID:21875053. doi:10.1021/es2010072. Hamelin S, Planas D, and Amyot M. 2015. Mercury methylation and demethylation by periphyton biofilms and their host in a fluvial wetland of the St. Lawrence River (QC, Canada). Science of the Total Environment, 512–513: 464–471. doi:10.1016/j.scitotenv.2015.01.040 Hammerschmidt CR and Fitzgerald WF. 2006. Methylmercury in freshwater fish linked to atmospheric mercury deposition. Environ. Sci. Technol., 40: 7764-7770. Heyes A, Mason RP, Kim E-H, and Sunderland E. 2006. Mercury methylation in estuaries: Insights from using measuring rates using stable mercury isotopes. Marine Chemistry, 102: 134–147. doi:10.1016/j.marchem.2005.09.018. Hintelmann H, Keppel-Jones K, Evans RD. 2000. Constants of mercury methylation and demethylation rates in sediments and comparison of tracer and ambient mercury availability. Environ. Toxicol. Chem. 19:2204–11 Hsu-Kim, H., C.S. Eckley, D., Achá, D., Feng, X., Gilmour, C.C., Jonsson, S., and Mitchell, C.P.J. 2017. Challenges and Opportunities for Managing Aquatic Mercury Pollution in Altered Landscapes. Theme 2 Synthesis for the 13th International Conference on Mercury as a Global Pollutant. Providence, Rhode Island. July 16-21, 2017.

Page 54
Kaschak E, Knopf B, Petersen JH, Bings NH, and König H. 2014. Biotic methylation of mercury by intestinal and sulfate-reducing bacteria and their potential role in mercury accumulation in the tissue of the soil-living Eisenia foetida. Soil Biology and Biochemistry, 69: 202–211. doi:10.1016/j.soilbio.2013.11.004. Kelly CA, Rudd JWM, Bodaly RA, Roulet NT, St. Louis VL, Heyes A, et al. 1997. Increases in fluxes of greenhouse gases and methyl mercury following flooding of an experimental reservoir. Kelly CA, Rudd JWM, Holoka MH (2003) Effect of pH on mercury uptake by an aquatic bacterium: implications for Hg cycling. Environ Sci Technol 37:2941–2946 King JK, Saunders FM, Lee RF, and Jahnke RA. 1999. Coupling mercury methylation rates to sulfate reduction rates in marine sediments. Environmental Toxicology and Chemistry, 18: 1362–1369. doi:10.1002/etc.5620180704. Kolka RK, Nater EA, Grigal DF, Verry ES. 1999. Atmospheric inputs of mercury and organic carbon into a forested upland bog watershed. Water Air Soil Pollut 113:273–294 Larson, J.H., Maki, R.P., Knights, B.C., Gray, B.R. 2014. Can mercury in fish be reduced by water level management? Evaluating the effects of water level fluctuation on mercury accumulation in yellow perch (Perca flavescens). Ecotoxicology 23, 1555–1563. Lehnherr I, and St. Louis VL. 2009. Importance of ultraviolet radiation in the photodemethylation of methylmercury in freshwater ecosystems. Environmental Science & Technology, 43: 5692–5698. PMID:19731664. doi:10.1021/es9002923. Liedtke TL, Zimmerman MS, Tomka RG, Holt C, & Jennings L. 2016. Behavior and Movements of Adult Spring Chinook Salmon (Oncorhynchus tshawytscha) in the Chehalis River Basin, Southwestern Washington, 2015. U.S. Department of the Interior, U.S. Geological Survey, in cooperation with the Washington Department of Fish and Wildlife. Liu G, Cai Y, O’Driscoll N. 2012. Environmental chemistry and toxicology of mercury. John Wiley & Sons, Inc. Hoboken, NJ. Marvin-DiPasquale M, Agee JL, McGowan C, Oremland RS, Thomas M, Krabbenhoft DP, et al. 2000. Methyl-mercury degradation pathways: a comparison among three mercury-impacted ecosystems. Environmental Science & Technology, 34: 4908–4916. doi:10.1021/es0013125. Mathieu C, and Friese M. 2012. Measuring mercury trends in freshwater fish in Washington State, 2011 sampling results. Washington State Department of Ecology, Olympia, WA. Publication No. 12-03-051. https://fortress.wa.gov/ecy/publications/SummaryPages/1203051.html Mathieu C, Friese M, and Bookter A. 2013a. Measuring mercury trends in freshwater fish in Washington State, 2012 sampling results. Washington State Department of Ecology, Olympia, WA. Publication No. 13-03-044. https://fortress.wa.gov/ecy/publications/SummaryPages/1303044.html

Page 55
Mathieu C, Furl C, Roberts T, and Friese M. 2013b. Spatial trends and factors affecting mercury bioaccumulation in freshwater fishes of Washington State, USA. Arch Environ Contam Toxicol 65: 122-131. https://fortress.wa.gov/ecy/publications/UIPages/PublicationList.aspx?IndexTypeName=Program&NameValue=Environmental+Assessment&DocumentTypeName=Publication&yearDate=2013 Mathieu, C. and McCall M. 2015. Measuring mercury trends in freshwater fish in Washington State, 2013 sampling results. Washington State Department of Ecology, Olympia, WA. Publication No. 15-03-010. https://fortress.wa.gov/ecy/publications/SummaryPages/1503010.html Mathieu, C. and McCall M. 2016. Measuring mercury trends in freshwater fish in Washington State, 2014 sampling results. Washington State Department of Ecology, Olympia, WA. Publication No. 16-03-033. https://fortress.wa.gov/ecy/publications/SummaryPages/1603033.html Mathieu, C. and McCall M. 2017. Measuring mercury trends in freshwater fish, 2015 sampling results. Washington State Department of Ecology, Olympia, WA. Publication No. 17-03-006. https://fortress.wa.gov/ecy/publications/SummaryPages/1703006.html Matilainen T. 1995. Involvement of bacteria in methylmercury formation in anaerobic lake waters. Water, Air, and Soil Pollution, 80: 757–764. doi:10.1007/BF01189727. McConnaha, W. 2017. Personal Communication from Willis (Chip) McConnaha, Ph.D., Fisheries Ecologist, Principal, ICF, Portland, OR. Meredith, C., C. Furl, and M. Friese. 2010. Measuring Mercury Trends in Freshwater Fish in Washington State – 2009 Sampling Results. Washington State Department of Ecology, Olympia, WA. Publication No. 10-03-058. https://fortress.wa.gov/ecy/publications/SummaryPages/1003058.html Meredith, C. and M. Friese. 2011. Measuring Mercury Trends in Freshwater Fish in Washington State – 2010 Sampling Results. Washington State Department of Ecology, Olympia, WA. Publication No. 11-03-053. https://fortress.wa.gov/ecy/publications/SummaryPages/1103053.html Miller EK, Vanarsdale A, Keeler GJ, Chalmers A, Poissant L, Kamman NC. 2005. Estimation and mapping of wet and dry mercury deposition across Northeastern North America. Ecotoxicology 14:53-70. Obrist D, Johnson DW, Lindber SE, Luo Y, Hararuk O, Bracho R…& Todd DE. 2011. Mercury distribution across 14 U.S. forests. Part I: spatial patterns of concentrations in biomass, litter, and soils. Environ. Sci. Technol.45: 3974-3981. Pacyna EG, Pacyna JM, Steenhuisen F, Wilson S. 2006. Global anthropogenic mercury emission inventory for 2000. Atmos. Environ. 40:4048-63.

Page 56
Paranjape AR and Hall BD. 2017. Recent advances in the study of mercury methylation in aquatic systems. FACETS 2:85–119. doi:10.1139/facets-2016-0027. Parks JM, Johs A, Podar M, Bridou R, Hurt JRA, Smith S, et al. 2013. The genetic basis for bacterial mercury methylation. Science, 339: 1332–1335. PMID:23393089. doi:10.1126/ science.1230667. Paulson, A.J. and D. Norton. 2008. Mercury Sedimentation in Lakes in Western Whatcom County, Washington, USA and its Relation to Local Industrial and Municipal Atmospheric Sources. Water Air Soil Pollut (2008) 189:5-19. Porvari P, Verta M, Munthe J, Haapanen M. 2003. Forestry practices increase mercury and methyl mercury output from boreal forest catchments. Environ Sci Technol 37:2389-2393. Quinn TP. 2005. The behavior and ecology of Pacific salmon and trout. University of Washington Press, Seattle. Rolfhus KR, Hurley JP, Bodaly RAD, and Perrine G. 2015. Production and retention of methylmercury in inundated boreal forest soils. Environmental Science & Technology, 49: 3482–3489. PMID:25668143. doi:10.1021/es505398z. Schaefer JK, Rocks SS, Zheng W, Liang L, Gu B, and Morel FMM. 2011. Active transport, substrate specificity, and methylation of Hg(II) in anaerobic bacteria. Proceedings of the National Academy of Science, 108: 8714–8719. doi:10.1073/pnas.1105781108. Seiders K and Deligeannis C. 2007. Washington State Toxics Monitoring Program: freshwater fish tissue component, 2007. Washington State Department of Ecology, Olympia, WA. Publication No. 09-03-003. https://fortress.wa.gov/ecy/publications/SummaryPages/0903003.html Selin, N. E. (2009). Global Geochemical Cycling of Mercury: A Review. The Annual Review of Environment and Resources, 44, 43-63. 10.1146/annurev.environ.051308.084314 Selvendrian P, Driscoll CT, Bushey JT, and Montesdeoca MR. 2008. Wetland influence on mercury fate and transport in a temperate forested watershed. Environmental Pollution, 154: 46–55. doi:10.1016/j.envpol.2007.12.005. Sizmur T, Canário J, Edmonds S, Godfrey A, and O’Driscoll N. 2013. The polychaete worm Nereis diversicolor increases mercury lability and methylation in intertidal mudflats. Environmental Toxicology and Chemistry, 32: 1888–1895. PMID:23633443. doi:10.1002/etc.2264. Sonke JE, Heimbürger L-E, and Dommergue A. 2013. Mercury biogeochemistry: paradigm shifts, outstanding issues and research needs. Comptes Rendus Geoscience, 345: 213–224. doi:10.1016/j.crte.2013.05.002.

Page 57
Sorensen, J.A., Kallemeyn, L.W., Sydor, M., 2005. Relationship between mercury accumulation in young-of-the-year yellow perch and water-level fluctuations. Environmental Science and Technology, 39, 9237-9243. St. Louis, V.L., Rudd, J.W.M., Kelly, C.A., Bodaly, R.A., Paterson, M.J., Beaty, K.G…& Majewski, A.R. 2004. The rise and fall of mercury methylation in an experimental reservoir. Environmental Science and Technology, 38, 1348-1358. Thornton KW, Kimmel BL, Payne FE. 1990. Reservoir limnology: ecological perspectives. John Wiley & Sons, Inc. New York, NY. Todorova SG, Driscoll CT, Matthews DA, Effler SW, Hines ME, and Henry EA. 2009. Evidence for regulation of monomethyl mercury by nitrate in a seasonally stratified, eutrophic lake. Environmental Science & Technology, 43: 6572–6578. PMID:19764219. doi:10.1021/es900887b. Ullrich SM, Tanton TW, Abdrashitova SA, 2001. Mercury in the aquatic environment: A review of factors affecting methylation. Critical Reviews in Environmental Science and Technology, 31(3): 241-293 USGS, 2016. National Fish Mercury Model Available On-Line. U.S. Geological Survey. https://toxics.usgs.gov/highlights/mercury_model.html Waples JS, Nagy KL, Aiken GR, and Ryan JN. 2005. Dissolution of cinnabar (HgS) in the presence of natural organic matter. Geochimica et Cosmochimica Acta, 69: 1575–1588. doi:10.1016/j.gca.2004.09.029. Washington State Department of Natural Resources (DNR). 2017. Hazardous Minerals. http://www.dnr.wa.gov/programs-and-services/geology/geologic-hazards/hazardous-minerals#mercury WDFW. Washington Department of Fish and Wildlife. 2017. Fishing and Shellfishing, lowland lakes. http://wdfw.wa.gov/fishing/washington/lowland.html Wilma D. 2003. Tacoma city Light’s Cushman Dam No. 1 on the Skokomish River delivers electricity on March 23, 1926. HistoryLink.org. http://www.historylink.org/File/5085 Winkowski M, Kendall N, Zimmerman MS. 2016. Upper Chehalis Instream Fish Study 2015. Washington Department of Fish and Wildlife, Fish Program, Science Division. Yu RQ, Flanders JR, Mack EE, Turner R, Mirza MB, and Barkay T. 2012. Contribution of coexisting sulfate and iron reducing bacteria to methylmercury production in freshwater river sediments. Environmental Science & Technology, 46: 2684–2691. PMID:22148328. doi:10.1021/es2033718. Zhang Y, Jacob DJ, Horowitz HM, Chen L, Amos HM, Krabbenhoft DP, et al. 2016. Observed decrease in atmospheric mercury explained by global decline in anthropogenic emissions. Proceedings of the National Academy of Science, 113: 526–531. doi:10.1073/pnas.1516312113.

Page 58
Appendix. Glossary, Acronyms, and Abbreviations
Glossary Anthropogenic: Human-caused.
Clean Water Act: A federal act passed in 1972 that contains provisions to restore and maintain the quality of the nation’s waters. Section 303(d) of the Clean Water Act establishes the TMDL program.
Dissolved oxygen (DO): A measure of the amount of oxygen dissolved in water.
National Pollutant Discharge Elimination System (NPDES): National program for issuing, modifying, revoking and reissuing, terminating, monitoring, and enforcing permits, and imposing and enforcing pretreatment requirements under the Clean Water Act. The NPDES program regulates discharges from wastewater treatment plants, large factories, and other facilities that use, process, and discharge water back into lakes, streams, rivers, bays, and oceans.
Nonpoint source: Pollution that enters any waters of the state from any dispersed land-based or water-based activities, including but not limited to atmospheric deposition, surface-water runoff from agricultural lands, urban areas, or forest lands, subsurface or underground sources, or discharges from boats or marine vessels not otherwise regulated under the NPDES program. Generally, any unconfined and diffuse source of contamination. Legally, any source of water pollution that does not meet the legal definition of “point source” in section 502(14) of the Clean Water Act.
Parameter: Water quality constituent being measured (analyte). A physical, chemical, or biological property whose values determine environmental characteristics or behavior.
pH: A measure of the acidity or alkalinity of water. A low pH value (0 to 7) indicates that an acidic condition is present, while a high pH (7 to 14) indicates a basic or alkaline condition. A pH of 7 is considered to be neutral. Since the pH scale is logarithmic, a water sample with a pH of 8 is ten times more basic than one with a pH of 7.
Point source: Sources of pollution that discharge at a specific location from pipes, outfalls, and conveyance channels to a surface water. Examples of point source discharges include municipal wastewater treatment plants, municipal stormwater systems, industrial waste treatment facilities, and construction sites where more than 5 acres of land have been cleared.
Pollution: Contamination or other alteration of the physical, chemical, or biological properties of any waters of the state. This includes change in temperature, taste, color, turbidity, or odor of the waters. It also includes discharge of any liquid, gaseous, solid, radioactive, or other substance into any waters of the state. This definition assumes that these changes will, or are likely to, create a nuisance or render such waters harmful, detrimental, or injurious to (1) public health, safety, or welfare, or (2) domestic, commercial, industrial, agricultural, recreational, or other legitimate beneficial uses, or (3) livestock, wild animals, birds, fish, or other aquatic life.
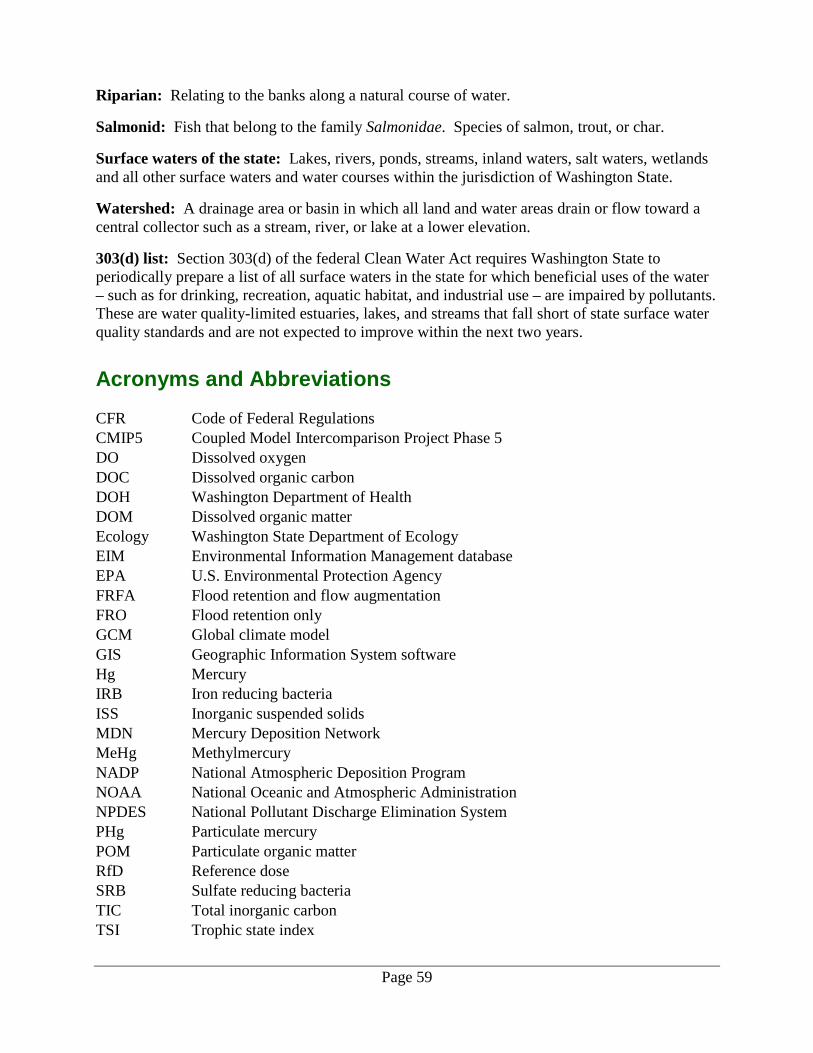
Page 59
Riparian: Relating to the banks along a natural course of water.
Salmonid: Fish that belong to the family Salmonidae. Species of salmon, trout, or char.
Surface waters of the state: Lakes, rivers, ponds, streams, inland waters, salt waters, wetlands and all other surface waters and water courses within the jurisdiction of Washington State.
Watershed: A drainage area or basin in which all land and water areas drain or flow toward a central collector such as a stream, river, or lake at a lower elevation.
303(d) list: Section 303(d) of the federal Clean Water Act requires Washington State to periodically prepare a list of all surface waters in the state for which beneficial uses of the water – such as for drinking, recreation, aquatic habitat, and industrial use – are impaired by pollutants. These are water quality-limited estuaries, lakes, and streams that fall short of state surface water quality standards and are not expected to improve within the next two years.
Acronyms and Abbreviations CFR Code of Federal Regulations CMIP5 Coupled Model Intercomparison Project Phase 5 DO Dissolved oxygen DOC Dissolved organic carbon DOH Washington Department of Health DOM Dissolved organic matter Ecology Washington State Department of Ecology EIM Environmental Information Management database EPA U.S. Environmental Protection Agency FRFA Flood retention and flow augmentation FRO Flood retention only GCM Global climate model GIS Geographic Information System software Hg Mercury IRB Iron reducing bacteria ISS Inorganic suspended solids MDN Mercury Deposition Network MeHg Methylmercury NADP National Atmospheric Deposition Program NOAA National Oceanic and Atmospheric Administration NPDES National Pollutant Discharge Elimination System PHg Particulate mercury POM Particulate organic matter RfD Reference dose SRB Sulfate reducing bacteria TIC Total inorganic carbon TSI Trophic state index

Page 60
TSS Total suspended solids USGS U.S. Geological Survey WDFW Washington Department of Fish and Wildlife WQS Water Quality Standards Units of Measurement °C degrees centigrade cfs cubic feet per second ft feet kg kilograms, a unit of mass equal to 1,000 grams kg/d kilograms per day km kilometer, a unit of length equal to 1,000 meters m meter mg milligram mg/L milligrams per liter (parts per million) mm millimeter ppb parts per billion ug/kg micrograms per kilogram (parts per billion) ug/L micrograms per liter (parts per billion) uM micromolar, a chemistry unit