Checklist- Intrepretation of CIU Test_NoR
7
Approved by Checked by : ________ _______ Compi led by : _______ _______ Section : OP-029 : 19-07-2006 INTERPRETATION OF CIU TEST Page 1 of 7 WORK INSTRUCTIONS FOR ENGINEERS : _____________________________________ Revision : 0 Date RE-ICT. INTERPRETATION OF CIU TEST
description
cHECKLIST
Transcript of Checklist- Intrepretation of CIU Test_NoR

7/21/2019 Checklist- Intrepretation of CIU Test_NoR
http://slidepdf.com/reader/full/checklist-intrepretation-of-ciu-testnor 1/7
Approved by
Checked by : _____________________________________
Compiled by : _____________________________________
Section : OP-029
: 19-07-2006
INTERPRETATION OF CIU TEST Page 1 of 7
WORK INSTRUCTIONS FOR ENGINEERS
: _____________________________________
Revision : 0Date
RE-ICT. INTERPRETATION OF CIU TEST

7/21/2019 Checklist- Intrepretation of CIU Test_NoR
http://slidepdf.com/reader/full/checklist-intrepretation-of-ciu-testnor 2/7
Section : OP-029
: 19-07-2006
INTERPRETATION OF CIU TEST Page 2 of 7
29. INTERPRETATION OF CIU TEST
29.1 INTRODUCTION
The procedure is to determine peak effective friction angle (φ’) and apparent cohesion (c’) from
the CIU test (Isotropically Consolidated Undrained Triaxial Test) results.
29.2 DEFINITIONS
• σ1’ = major principal effective stress
• σ3’ = minor principal effective stress
• σ3 = major principal total stress (Cell Pressure)
• u = pore water pressure
29.3 PROCEDURE
(1) Usually three CIU tests are carried out at different pre-consolidation stresses (σ3’) for anundisturbed sample at a particular depth.
(2) Select a suitable criterion used to define the occurrence of failure of the test samples. Thefollowing criteria are commonly used:
• Maximum deviator stress (σ1’ – σ3’),
• Maximum principal stress ratio (σ1’ / σ3’) – can be used in which the deviator stresscontinues to increase at large strains.
(3) Based on the selected criteria in step (2), obtain the stress points at failure, ie. values of
σ1’ and σ3’ when deviator stress or principal stress ratio is maximum, for each test.
(4) If values of σ1’ and σ3’ are not available in the laboratory datasheet, the respective valuescan be computed as follows:
• Deviator stress (σ1’ – σ3’) = Axial load / Area
• σ3 = Cell Pressure• σ1’ = Deviator stress + Cell Pressure – Pore Pressure
• σ3’ = Cell Pressure – Pore Pressure
(5) The shear strength parameters (φ’, c’) can be interpreted using effective stress Mohr circleor effective stress path plots (MIT plot or Cambridge plot).
• Mohr circle: τ against σ'
τ
σ'
'
σ1' 3'
c' r = (σ1’ – σ3’)/2
Revision : 0Date

7/21/2019 Checklist- Intrepretation of CIU Test_NoR
http://slidepdf.com/reader/full/checklist-intrepretation-of-ciu-testnor 3/7
Section : OP-029
: 19-07-2006
INTERPRETATION OF CIU TEST Page 3 of 7
• MIT plot (t-s plot): (σ1’ – σ3’)/2 against (σ1’ + σ3’)/2
• Cambridge plot (q-p plot): (σ1’ - σ3’) against (σ1’ + 2 σ3’)/3
(6) Select type of the plot to be employed, ie. MIT plot or Cambridge Plot . Compute
coordinates (x,y) for all the stress points obtained in step (5), depends on the type of plot.• For MIT plot: x-value is (σ1’ + σ3’)/2 and y-value is (σ1’ – σ3’)/2.
• For Cambridge plot: x-value is (σ1’ + 2 σ3’)/3 and y-value is (σ1’ - σ3’).(7) To establish more representative parameters for similar soil type at a site, plot all the
points in a single graph. Plot only the points without showing a line. Important: The x-axis and y-axis in the graph should be plotted with same scale (1:1).
(8) From scatter points, draw the upper bound line and lower bound line. For lower bound, y-axis intercept (a) is normally taken as 0.
(9) Draw a design line, which is considered as a moderately conservative line (best fitted line,or a line below about 2/3 of total nos. of points).
(10) Calculate the gradient (m) and y-axis intercept (a) of the design line.
(11) Use the following equations to calculate values of φ’ and c’:
s = (σ1’ + σ3’)/2
t = (
’ 1
–
’ 3 ) / 2
a
1
m
p’ = (σ1’ + 2 σ3’)/3
1
m
a
q ’ = (
1 ’
-
3 ’
)
s or p
t or q
a
UPPER BOUND
m
1
DESIGN LINE
LOWER BOUND
Revision : 0Date

7/21/2019 Checklist- Intrepretation of CIU Test_NoR
http://slidepdf.com/reader/full/checklist-intrepretation-of-ciu-testnor 4/7
Section : OP-029
: 19-07-2006
INTERPRETATION OF CIU TEST Page 4 of 7
a) t-s Plot / MIT Plot
• φ’ = sin-1
m … Eq. (1)
• c’ = a / (cos φ’) … Eq. (2)b) q-p Plot / Cambridge Plot
• m = 6 sin φ’/ (3 – sin φ’) … Eq. (3)
• c’ = a tan φ’/m … Eq. (4)
29.4 WORKED EXAMPLE
i. ‘Maximum stress ratio’ is used as failure criteria in this example.
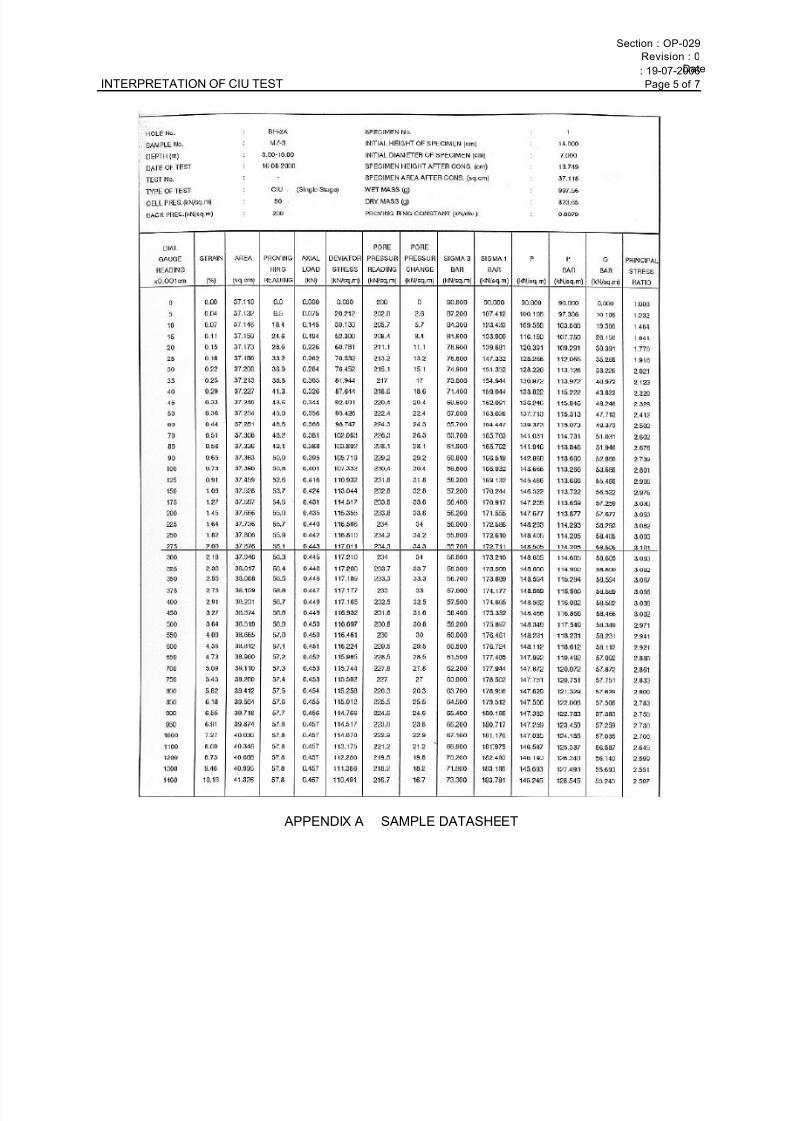
ii. Referring to sample datasheet in Appendix A, a stress point at failure (σ1’, σ3’) isobtained, in which its principal stress ratio is maximum.
Maximum σ1’ / σ3’ = 3.101
σ1’ = 172.71 kN/m2
σ3’ = 55.7 kN/m2
iii. Repeat step (ii) for other set of CIU test results.
MIT PLOTiv. The stress points obtained in steps (ii) and (iii) are plotted in MIT plot, as shown in
Figure A1. The plot includes the stress points from CIU tests for the undisturbedsamples at different boreholes. Coordinates (xi, yi) are computed, for example byusing the values in step (ii):
x1 = (σ1’ + σ3’)/2 = 114.505 kN/m2
y1 = (σ1’ - σ3’)/2 = 58.505 kN/m2
v. The upper bound and lower bound lines are first drawn on the plot and then a designline is also drawn, as shown in Figure A1.
vi. The gradient (m) and y-axis intercept (a) of the design line are calculated as follows:
47.0100
552=
−=m
2/5 mkN a =
vii. The values of φ’ and c’ are computed using Eq. (1) and (2):
( ) °===−−
2847.0sinsin' 11mφ
2/6
28cos
5
'cos' mkN
ac ≈==
φ
CAMBRIDGE PLOTviii. The stress points obtained in steps (ii) and (iii) are plotted in Cambridge plot, as
shown in Figure A2. Coordinates (xi, yi) are computed, for example by using thevalues in step (ii):
x1 = (σ1’ + 2σ3’)/3 = 94.7 kN/m
2
y1 = (σ1’ - σ3’) = 117 kN/m
2
ix. The gradient (m) and y-axis intercept (a) of the design line are calculated as follows:
1.1100
12122=
−=m
2/12 mkN a =
x. The values of φ’ and c’ are computed using Eq. (3) and (4):
[ ] °=+=−
28)1.16/()1.1(3sin'1
φ
2/61.1
28tan12' mkN c ≈
°=
’ = 28°, c’ = 6 kN/m
2
are adopted as design values.
Revision : 0Date
7/21/2019 Checklist- Intrepretation of CIU Test_NoR
http://slidepdf.com/reader/full/checklist-intrepretation-of-ciu-testnor 5/7
Section : OP-029
: 19-07-2006
INTERPRETATION OF CIU TEST Page 5 of 7
APPENDIX A SAMPLE DATASHEET
Revision : 0Date

7/21/2019 Checklist- Intrepretation of CIU Test_NoR
http://slidepdf.com/reader/full/checklist-intrepretation-of-ciu-testnor 6/7
Section : OP-029
: 19-07-2006
INTERPRETATION OF CIU TEST Page 6 of 7
FIGURE A1 t-s Plot
Revision : 0Date

7/21/2019 Checklist- Intrepretation of CIU Test_NoR
http://slidepdf.com/reader/full/checklist-intrepretation-of-ciu-testnor 7/7
Section : OP-029
: 19-07-2006
INTERPRETATION OF CIU TEST Page 7 of 7
FIGURE A2 q-p Plot
Revision : 0Date