
Check Point Firewall Log Analysis In-DepthCheck Point Firewall Log Analysis In-Depth 4 Once again,...
36
Check Point Firewall Log Analysis In-Depth Copyright © 2009 Mark Stingley, GCIH GCIA GPEN ggiac _AT_ altsec.info Version 1.0 Abstract This is a short guidebook for network security analysts who want to find answers about their networks and systems quickly. Using open-source software and off-the-shelf components, an outstanding Check Point firewall log analysis platform can be built for well under $10,000 for an enterprise, or as little as $1,000 or less for more modest needs. Though the focus is on streaming near real-time Check Point firewall logs, the principles herein can be applied to any firewall, or virtually any other log source. This document provides real-world examples of ad-hoc investigations, watchdog anomaly alerting, host profiling, and much more. Through hands-on application of skills every network security analyst needs anyway, raw data can be sifted in every way imaginable. The resulting experience is invaluable.
Transcript of Check Point Firewall Log Analysis In-DepthCheck Point Firewall Log Analysis In-Depth 4 Once again,...
Check Point Firewall Log Analysis In-Depth
Copyright © 2009 Mark Stingley, GCIH GCIA GPENggiac _AT_ altsec.info
Version 1.0
Abstract
This is a short guidebook for network security analysts who want to find answers about
their networks and systems quickly. Using open-source software and off-the-shelf
components, an outstanding Check Point firewall log analysis platform can be built for
well under $10,000 for an enterprise, or as little as $1,000 or less for more modest
needs. Though the focus is on streaming near real-time Check Point firewall logs, the
principles herein can be applied to any firewall, or virtually any other log source. This
document provides real-world examples of ad-hoc investigations, watchdog anomaly
alerting, host profiling, and much more. Through hands-on application of skills every
network security analyst needs anyway, raw data can be sifted in every way imaginable.
The resulting experience is invaluable.
Check Point Firewall Log Analysis In-Depth 2
IntroductionFirewall log analysis serves as a critical component of information security. It ranks in
the “Top 5 Essential Log Reports” by SANS1. Many major information security standards,
certifications, and laws have strict requirements for log keeping, monitoring, and analysis;
including NIST (National Institute of Standards and Technology) sp800-41.pdf 2, HIPAA
(Health Insurance Portability and Accountability Act) 164.308(a)(1)(ii)(D) – Information System
Activity Review 3, CFR (Code of Federal Regulations) Title 16: Commercial Practices, Part 313
Standards for Safeguarding Customer Information 4, and more.
Outside of legal or compliance issues, other references provide many other good reasons
to collect and analyze firewall logs. Barry Anderson cites the need for auditing and optimizing
firewall rules in Check Point firewalls - rulebase cleanup and performance tuning5. Matt
Willard proposes that firewall log analysis is critical to defense-in-depth in Getting the Most out
of your Firewall Logs6. CERT emphasizes log audit in the “Importance of Accountability” in
Defense in Depth: Foundations for Secure and Resilient IT Enterprises7.
Regarding firewall rule audit and log analysis, many commercial or open-source products
produce excellent reports, correlate firewall events with other logs, and offer varying degrees of
query flexibility. This paper does not mean to diminish those systems or imply that the home-
brew firewall log analysis platform is a replacement for them. This paper is about a worthy
endeavor for any information security team regardless of the availability of other tools. At the
very least, the collected firewall connection data provides for audit and fine-tuning of many
other existing log analysis or correlation platforms.
The server featured herein is an off-the-shelf system running Debian 8with the MySQL 9database, Apache 10webserver, unixODBC11, and a customized version of fw1-loggrabber12.
Using the Checkpoint OPSEC LEA 13 (Log Export API) transport, log data is pulled securely at
near real-time speed into the MySQL database.
To avoid the many hours of development and installation expended over the course of
this project, Appendix-A of this document contains download links for all the parts and
documentation necessary to put a comparable system online within a few hours. The only
ingredient not provided is the actual Checkpoint firewall and the hardware.
Mark Stingley, ggiac _AT_ altsec.info
Check Point Firewall Log Analysis In-Depth 3
The Concepts The core to the system is a 64-bit Linux server with the fastest CPU and as much RAM
and disk space as budget allows. A 64-bit CPU and operating system are fundamental
components for performance sake. Without them, applications will be limited to how much
RAM they can use14. The more RAM that MySQL can use, the less it will have to write to the
disks during queries. Then, more disks mean more storage, faster reads, and possibly faster
writes (depending on the RAID architecture).
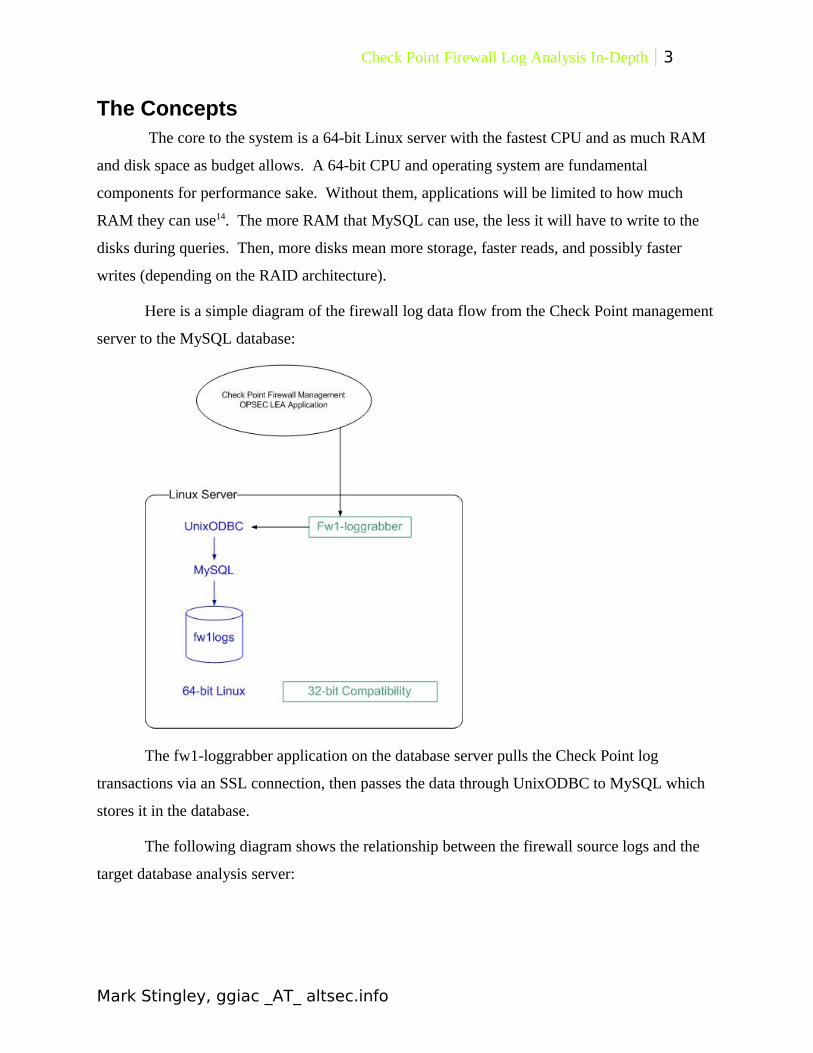
Here is a simple diagram of the firewall log data flow from the Check Point management
server to the MySQL database:
The fw1-loggrabber application on the database server pulls the Check Point log
transactions via an SSL connection, then passes the data through UnixODBC to MySQL which
stores it in the database.
The following diagram shows the relationship between the firewall source logs and the
target database analysis server:
Mark Stingley, ggiac _AT_ altsec.info

Check Point Firewall Log Analysis In-Depth 4
Once again, this paper will not bother with the intricacies of setting up the fw1-
loggrabber server. All of that documentation, and even working software, can be downloaded
from the links provided in Appendix – A.
Mark Stingley, ggiac _AT_ altsec.info

Check Point Firewall Log Analysis In-Depth 5
fw1logs; the databaseThe circa 2005 code for fw1-loggrabber is excellent for spooling the firewall log data to
flat file databases for text searches or systems such as Splunk15, but not necessarily ideal for
dedicated connection analysis. In ‘online’ mode, which is the real-time streaming of data, all of
the fields of the firewall record are fetched. Many of the fields of the record are devoted to
VPN, IPS, and other features that are not essential for connection tracking and analysis. In
addition, the original fw1-loggrabber code was written before Check Point created the field
“rule_uid”, which is the only permanent identifier for a rule. Some original field data types pose
problems, such as numeric port numbers that can be transposed from NULL to ZERO. Lastly,
the only index created is the record number field (fw1number), which slows searches on other
critical fields considerably.
After discovering the above features early in the developmental phase of this project,
several changes were made to the source code to optimize the program for connection analysis.
First, all of the fields not strictly related to a firewall connection were eliminated and the
“rule_uid” field was added. This reduced the record length from 107 fields to just 13. Then, all
of the fields except the record number and date-time were defined as character fields. Finally,
indexes were created for the date-time, source ip address, destination ip address, and destination
port (service) fields to speed up searches.
To demonstrate the field definition situation in the original source code, observe the
sample output below from a stock fw1-loggrabber executable with its 107 defined fields:
| fw1number | fw1time | fw1action | fw1orig | fw1alert | fw1if_dir | fw1if_name | fw1product | fw1src | fw1s_port | fw1dst | fw1service | fw1tcpflags | fw1proto | fw1rule | fw1xlatesrc | fw1xlatedst | fw1xlatesport | fw1xlatedport | fw1nat_rulenum | fw1resource | fw1elapsed | fw1packets | fw1bytes | fw1reason | fw1service_name | fw1agent | fw1from | fw1to | fw1sys_msgs | fw1fw_message | fw1internal_ca | fw1serial_num | fw1dn | fw1icmp | fw1icmp_type | fw1icmp_type2 | fw1icmp_code | fw1icmp_code2 | fw1msgid | fw1message_info | fw1log_sys_message | fw1session_id | fw1dns_query | fw1dns_type | fw1scheme | fw1srckeyid | fw1dstkeyid | fw1methods | fw1peer_gateway | fw1ike | fw1ike_ids | fw1encryption_failure | fw1encryption_fail_r | fw1cookiei | fw1cookier | fw1start_time | fw1segment_time | fw1client_in_packets | fw1client_out_packets | fw1client_in_bytes | fw1client_out_bytes | fw1client_in_if | fw1client_out_if | fw1server_in_packets | fw1server_out_packets | fw1server_in_bytes | fw1server_out_bytes | fw1server_in_if | fw1server_out_if | fw1message | fw1nat_addrulenum | fw1user | fw1srcname | fw1vpn_user | fw1om | fw1om_method | fw1assigned_ip | fw1mac | fw1attack | fw1attack_info | fw1cluster_info | fw1during_sec | fw1fragments_dropped | fw1ip_id | fw1ip_len | fw1ip_offset | fw1tcp_flags2 | fw1sync_info | fw1log | fw1cpmad | fw1auth_method | fw1tcp_packet_oos | fw1rpc_prog | fw1th_flags | fw1cp_message | fw1reject_cat |
Mark Stingley, ggiac _AT_ altsec.info

Check Point Firewall Log Analysis In-Depth 6
Here are the headers of the optimized version:
| fw1loc | fw1time | fw1action | fw1orig | fw1if_dir | fw1if_name | fw1src | fw1s_port | fw1dst |
fw1service | fw1tcpflags | fw1proto | fw1rule_uid
This simplified output is ideal for installations where the Check Point system is used
only as a firewall. However, for an installation that uses more of the UTM (Unified Threat
Management) capabilities of the firewall appliance the extra data could be valuable.
Through over two years of continuous duty, the modifications to the fw1-loggrabber
code have proven reliable and effective. The creation of indexes for the primary data fields has
resulted in fast queries and table joins, and the drop in the number of fields yields a reduction of
both network bandwidth and disk storage space in the database.
During production operation, the database tables are rotated and compressed on a daily
basis, with a typical size of between two and three gigabytes, depending on how busy the
network is on any given day.
Additional improvements to the existing system are planned, such as a full verification
audit of the MySQL database against the online Check Point logs with potential for eliminating
duplicate archival storage of the raw logs.
Before digging into the intricacies of mining the firewall log data, the following page
explains the record structure and the significance of the fields that were selected to put the
system into production.
Mark Stingley, ggiac _AT_ altsec.info
Check Point Firewall Log Analysis In-Depth 7
Field Name Notes Tips
fw1loc This is the unique record number assigned by the firewall management server upon receipt.
It can be used following log rotation to selectively retrieve any missing records from the previous day.
fw1time fw1time is a date and time field in the format 2009-05-01 09:13:00.
Use of the SQl function mid() is a very powerful tool for splitting the field into its parts.
fw1action What the firewall did with the connection, such as drop or accept.
fw1orig This is the ip address of the firewall interface for that zone.
Keep a printed copy of all these identified by firewall zone on your cube wall!
fw1if_dir The direction of traffic through the firewall, such as “inbound”.
fw1if_name This is the device name of the network interface card for that zone.
Hardware architecture and OS dependent.
fw1src The source ip address. To make the interface more user friendly, ip addresses are stored as text.
fw1s_port This is the source port from the originating host.
Though the data is stored as text to avoid having NULL turned into a zero, queries do not have to be quoted text. Since the data is converted in such queries, port ranges can be selected. For example, a text query would be fw1s_port = “21” or fw1s_port = “22”, etc. Instead, using the numeric operator such as fw1s_port > 1024 works great.
fw1dst fw1dst is the destination host for the traffic. To make the interface more user friendly, ip addresses are stored as text.
fw1service The destination port on the destination host.
Though the data is stored as text to avoid having NULL turned into a zero, queries do not have to be quoted text. Since the data is converted in such queries, port ranges can be selected. For example, a text query would be fw1service = “21” or fw1s_port = “22”, etc. Instead, using the numeric operator such as fw1service > 1024 works great.
fw1tcpflags Records the TCP flags for out-of-state packets.
This field will always be NULL for valid connections and for all UDP traffic.
fw1proto The protocol of the packet.
fw1rule_uid This is the permanent unique identifier for the firewall rule that was applied to the connection.
Mark Stingley, ggiac _AT_ altsec.info
Check Point Firewall Log Analysis In-Depth 8
Ad-Hoc Data AnalysisIn daily operation, this is the most frequently used query and is invaluable for incident
handling.
Analysis is commonly triggered by some event, such as a suspected compromise or some
kind of abnormal network activity.
The Drive-By
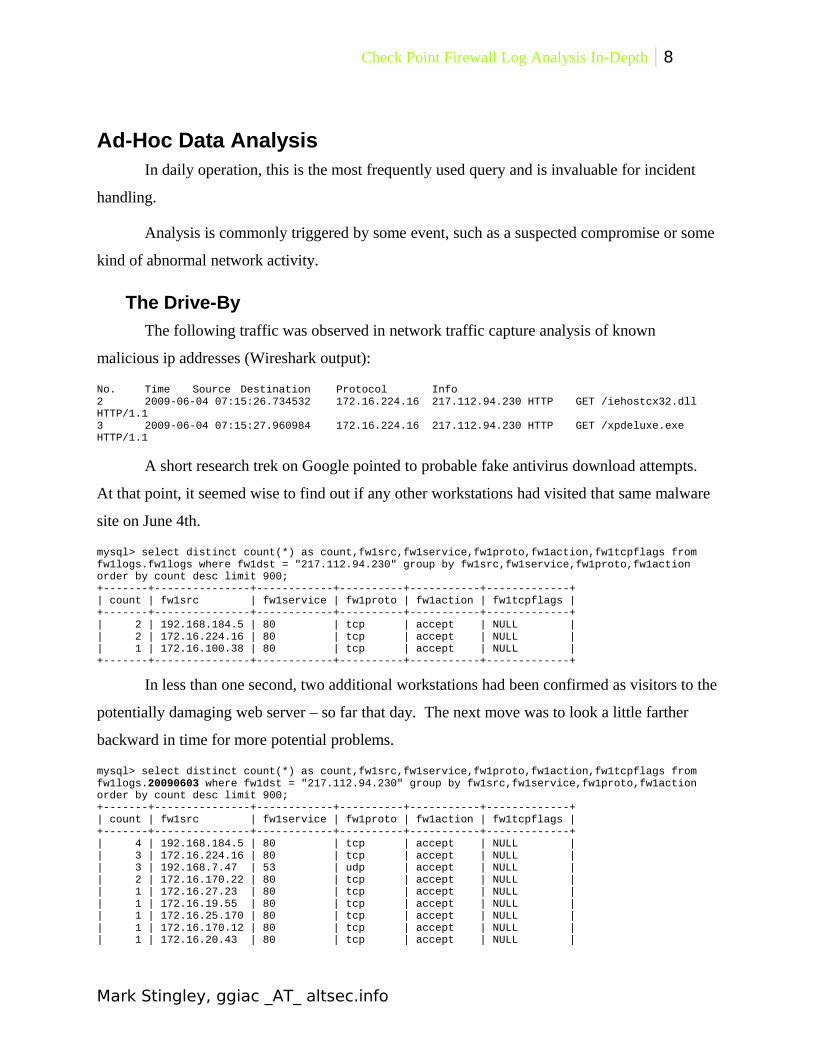
The following traffic was observed in network traffic capture analysis of known
malicious ip addresses (Wireshark output):
No. Time Source Destination Protocol Info2 2009-06-04 07:15:26.734532 172.16.224.16 217.112.94.230 HTTP GET /iehostcx32.dll HTTP/1.1 3 2009-06-04 07:15:27.960984 172.16.224.16 217.112.94.230 HTTP GET /xpdeluxe.exe HTTP/1.1
A short research trek on Google pointed to probable fake antivirus download attempts.
At that point, it seemed wise to find out if any other workstations had visited that same malware
site on June 4th.
mysql> select distinct count(*) as count,fw1src,fw1service,fw1proto,fw1action,fw1tcpflags from fw1logs.fw1logs where fw1dst = "217.112.94.230" group by fw1src,fw1service,fw1proto,fw1action order by count desc limit 900;+-------+---------------+------------+----------+-----------+-------------+| count | fw1src | fw1service | fw1proto | fw1action | fw1tcpflags |+-------+---------------+------------+----------+-----------+-------------+| 2 | 192.168.184.5 | 80 | tcp | accept | NULL || 2 | 172.16.224.16 | 80 | tcp | accept | NULL || 1 | 172.16.100.38 | 80 | tcp | accept | NULL |+-------+---------------+------------+----------+-----------+-------------+
In less than one second, two additional workstations had been confirmed as visitors to the
potentially damaging web server – so far that day. The next move was to look a little farther
backward in time for more potential problems.
mysql> select distinct count(*) as count,fw1src,fw1service,fw1proto,fw1action,fw1tcpflags from fw1logs.20090603 where fw1dst = "217.112.94.230" group by fw1src,fw1service,fw1proto,fw1action order by count desc limit 900;+-------+---------------+------------+----------+-----------+-------------+| count | fw1src | fw1service | fw1proto | fw1action | fw1tcpflags |+-------+---------------+------------+----------+-----------+-------------+| 4 | 192.168.184.5 | 80 | tcp | accept | NULL || 3 | 172.16.224.16 | 80 | tcp | accept | NULL || 3 | 192.168.7.47 | 53 | udp | accept | NULL || 2 | 172.16.170.22 | 80 | tcp | accept | NULL || 1 | 172.16.27.23 | 80 | tcp | accept | NULL || 1 | 172.16.19.55 | 80 | tcp | accept | NULL || 1 | 172.16.25.170 | 80 | tcp | accept | NULL || 1 | 172.16.170.12 | 80 | tcp | accept | NULL || 1 | 172.16.20.43 | 80 | tcp | accept | NULL |
Mark Stingley, ggiac _AT_ altsec.info

Check Point Firewall Log Analysis In-Depth 9
+-------+---------------+------------+----------+-----------+-------------+
mysql> select distinct count(*) as count,fw1src,fw1service,fw1proto,fw1action,fw1tcpflags from fw1logs.20090602 where fw1dst = "217.112.94.230" group by fw1src,fw1service,fw1proto,fw1action order by count desc limit 900;+-------+----------------+------------+----------+-----------+-------------+| count | fw1src | fw1service | fw1proto | fw1action | fw1tcpflags |+-------+----------------+------------+----------+-----------+-------------+| 4 | 172.16.100.15 | 80 | tcp | accept | NULL || 3 | 192.168.184.5 | 80 | tcp | accept | NULL || 2 | 192.168.7.47 | 53 | udp | accept | NULL || 1 | 172.16.165.145 | 80 | tcp | accept | NULL || 1 | 172.16.100.57 | 80 | tcp | accept | NULL || 1 | 172.16.96.154 | 80 | tcp | accept | NULL || 1 | 172.16.235.141 | 80 | tcp | accept | NULL || 1 | 172.16.160.85 | 80 | tcp | accept | NULL |+-------+----------------+------------+----------+-----------+-------------+8 rows in set (0.10 sec)
mysql> select distinct count(*) as count,fw1src,fw1service,fw1proto,fw1action,fw1tcpflags from fw1logs.20090601 where fw1dst = "217.112.94.230" group by fw1src,fw1service,fw1proto,fw1action order by count desc limit 900;+-------+-----------------+------------+----------+-----------+-------------+| count | fw1src | fw1service | fw1proto | fw1action | fw1tcpflags |+-------+-----------------+------------+----------+-----------+-------------+| 4 | 172.16.100.15 | 80 | tcp | accept | NULL || 2 | 192.168.185.11 | 80 | tcp | accept | NULL || 2 | 172.16.220.43 | 80 | tcp | accept | NULL || 2 | 192.168.7.47 | 53 | udp | accept | NULL || 1 | 172.16.226.74 | 80 | tcp | accept | NULL || 1 | 172.16.235.141 | 80 | tcp | accept | NULL || 1 | 172.16.165.75 | 80 | tcp | accept | NULL || 1 | 172.16.100.38 | 80 | tcp | accept | NULL || 1 | 172.16.98.32 | 80 | tcp | accept | NULL || 1 | 172.16.20.46 | 80 | tcp | accept | NULL || 1 | 192.168.245.213 | 80 | tcp | accept | NULL |+-------+-----------------+------------+----------+-----------+-------------+11 rows in set (0.16 sec)
Thusly, the above queries for the three days prior to the known incident produced a much
longer list of users who had visited the malware site. Hosts that made multiple hits on the
malware site, or visits on successive days, were confirmed to have had their browser hijacked or
were actually compromised with a trojan downloader.
The DoS
As many of network security analysts have likely experienced, one day a user began to
complain of dropped SSH connections. The user would establish an SSH session with a server
in another security zone, thus crossing a firewall boundary. After only a few moments of
inactivity, the user’s connection was dropped. Then, more reports of connectivity problems
began to arrive. Several abnormalities or circumstances could produce those symptoms, outside
of the obvious networking or host related problems. One of them could be state table
exhaustion16 on the respective firewall.
Mark Stingley, ggiac _AT_ altsec.info

Check Point Firewall Log Analysis In-Depth 10
Under normal conditions, most of the traffic traversing the firewall either starts a new
connection, or is related to an existing connection as tracked by the state table. When the
firewall receives an unexpected packet, it is said to be out-of-state. The source might be a
remote hacker performing a scan that sends ‘ack’ packets to hosts that have no active tcp
connections listed in the state table. The source of the packet could also be from a valid source
whose connection has been purged from the state table.
The Check Point firewall logs out-of-state data in the field “fw1tcpflags”. If the
connection record is for valid connection, that field will be NULL. For out-of-state traffic, the
field will contain the tcp flags for the packet. Therefore, counting out-of-state firewall log
records on internal firewall interfaces is a valuable indicator of a network or firewall problem.
‘internal interface’ is stressed because Internet traffic is typically ripe with scans containing
invalid tcp flags.
During the mentioned connection problem episode, one analyst investigated the
operational status of the firewall, while another network security analyst began gathering the
count of out-of-state connection attempts in the firewall log database.
mysql> select distinct count(*) as Count,mid(fw1time,12,5) as Time,fw1orig from fw1logs.20090605 where fw1time between "2009-06-05 09:00:00" and "2009-06-05 09:05:00" and (fw1orig = "192.168.95.118" or fw1orig = "192.168.90.254") and fw1tcpflags is not NULL group by Time,fw1orig;+-------+-------+----------------+| Count | Time | fw1orig |+-------+-------+----------------+| 60 | 09:00 | 192.168.90.254 || 76 | 09:01 | 192.168.90.254 || 67 | 09:02 | 192.168.90.254 || 68 | 09:03 | 192.168.90.254 || 96 | 09:04 | 192.168.90.254 |+-------+-------+----------------+5 rows in set (2 min 14.61 sec)
Above are the counts for out-of-state connections on the suspect firewall zone interfaces
showing a range of between 60 and 96 out-of-state packets per minute for the five minute period
measured. Only comparison with a prior period of known normal activity would determine if
those numbers are abnormal. Since everything was known to be working fine the day before, the
previous query was repeated for that day’s same five-minute period.
Mark Stingley, ggiac _AT_ altsec.info

Check Point Firewall Log Analysis In-Depth 11
The comparison period query looked like this:
mysql> select distinct count(*) as Count,mid(fw1time,12,5) as Time,fw1orig from fw1logs.20090604 where fw1time between "2009-06-04 09:00:00" and "2009-06-04 09:05:00" and (fw1orig = "192.168.95.118" or fw1orig = "192.168.90.254") and fw1tcpflags is not NULL group by Time,fw1orig;+-------+-------+----------------+| Count | Time | fw1orig |+-------+-------+----------------+| 26 | 09:00 | 192.168.90.254 || 3 | 09:01 | 192.168.90.254 || 3 | 09:02 | 192.168.90.254 || 3 | 09:03 | 192.168.90.254 || 10 | 09:04 | 192.168.90.254 |+-------+-------+----------------+5 rows in set (1 min 53.03 sec)
The out-of-state packets per minute numbers for the ‘normal day’ were observed to be
substantially lower than the 60 to 90 hits noticed in the traffic for the day of the incident. The
next logical step was to inspect the actual connections on that interface.
mysql> select distinct count(*) as Count,mid(fw1time,12,5) as Time,fw1src from fw1logs.20090605 where fw1time between "2009-06-05 09:00:00" and "2009-06-05 09:05:00" and (fw1orig = "192.168.95.118" or fw1orig = "192.168.90.254") group by Time,fw1src order by Count desc limit 5;+-------+-------+-----------------+| Count | Time | fw1src |+-------+-------+-----------------+| 25257 | 09:01 | 192.168.128.151 || 22268 | 09:04 | 192.168.128.151 || 20995 | 09:03 | 192.168.128.151 || 15251 | 09:02 | 192.168.128.151 || 15054 | 09:00 | 192.168.128.151 |+-------+-------+-----------------+5 rows in set (2 min 13.67 sec)
The query results show one host originating between 15,000 and 25,000 connections per
minute from one source ip address, which could be an indication of a problem. However,
comparison with the ‘known good’ period was again necessary.
mysql> select distinct count(*) as Count,mid(fw1time,12,5) as Time,fw1src from fw1logs.20090604 where fw1time between "2009-06-04 09:00:00" and "2009-06-04 09:05:00" and (fw1orig = "192.168.95.118" or fw1orig = "192.168.90.254") group by Time,fw1src order by Count desc limit 10;+-------+-------+---------------+| Count | Time | fw1src |+-------+-------+---------------+| 287 | 09:04 | 172.16.162.14 || 287 | 09:03 | 172.16.162.14 || 286 | 09:01 | 172.16.174.13 || 285 | 09:04 | 172.16.174.13 || 285 | 09:00 | 172.16.174.13 || 256 | 09:02 | 172.16.162.14 || 252 | 09:02 | 172.16.174.13 || 249 | 09:03 | 172.16.174.13 || 241 | 09:00 | 172.16.162.14 || 239 | 09:01 | 172.16.162.14 |+-------+-------+---------------+10 rows in set (1 min 53.52 sec)
Mark Stingley, ggiac _AT_ altsec.info
Check Point Firewall Log Analysis In-Depth 12
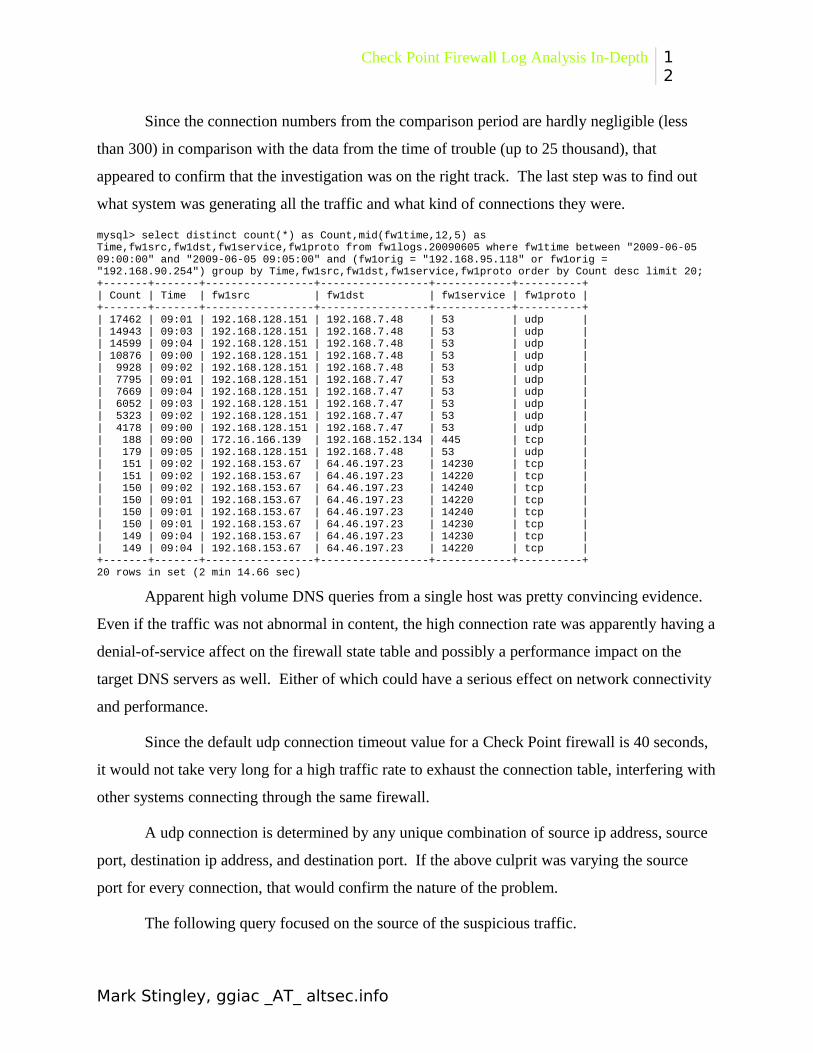
Since the connection numbers from the comparison period are hardly negligible (less
than 300) in comparison with the data from the time of trouble (up to 25 thousand), that
appeared to confirm that the investigation was on the right track. The last step was to find out
what system was generating all the traffic and what kind of connections they were.
mysql> select distinct count(*) as Count,mid(fw1time,12,5) as Time,fw1src,fw1dst,fw1service,fw1proto from fw1logs.20090605 where fw1time between "2009-06-05 09:00:00" and "2009-06-05 09:05:00" and (fw1orig = "192.168.95.118" or fw1orig = "192.168.90.254") group by Time,fw1src,fw1dst,fw1service,fw1proto order by Count desc limit 20;+-------+-------+-----------------+-----------------+------------+----------+| Count | Time | fw1src | fw1dst | fw1service | fw1proto |+-------+-------+-----------------+-----------------+------------+----------+| 17462 | 09:01 | 192.168.128.151 | 192.168.7.48 | 53 | udp || 14943 | 09:03 | 192.168.128.151 | 192.168.7.48 | 53 | udp || 14599 | 09:04 | 192.168.128.151 | 192.168.7.48 | 53 | udp || 10876 | 09:00 | 192.168.128.151 | 192.168.7.48 | 53 | udp || 9928 | 09:02 | 192.168.128.151 | 192.168.7.48 | 53 | udp || 7795 | 09:01 | 192.168.128.151 | 192.168.7.47 | 53 | udp || 7669 | 09:04 | 192.168.128.151 | 192.168.7.47 | 53 | udp || 6052 | 09:03 | 192.168.128.151 | 192.168.7.47 | 53 | udp || 5323 | 09:02 | 192.168.128.151 | 192.168.7.47 | 53 | udp || 4178 | 09:00 | 192.168.128.151 | 192.168.7.47 | 53 | udp || 188 | 09:00 | 172.16.166.139 | 192.168.152.134 | 445 | tcp || 179 | 09:05 | 192.168.128.151 | 192.168.7.48 | 53 | udp || 151 | 09:02 | 192.168.153.67 | 64.46.197.23 | 14230 | tcp || 151 | 09:02 | 192.168.153.67 | 64.46.197.23 | 14220 | tcp || 150 | 09:02 | 192.168.153.67 | 64.46.197.23 | 14240 | tcp || 150 | 09:01 | 192.168.153.67 | 64.46.197.23 | 14220 | tcp || 150 | 09:01 | 192.168.153.67 | 64.46.197.23 | 14240 | tcp || 150 | 09:01 | 192.168.153.67 | 64.46.197.23 | 14230 | tcp || 149 | 09:04 | 192.168.153.67 | 64.46.197.23 | 14230 | tcp || 149 | 09:04 | 192.168.153.67 | 64.46.197.23 | 14220 | tcp |+-------+-------+-----------------+-----------------+------------+----------+20 rows in set (2 min 14.66 sec)
Apparent high volume DNS queries from a single host was pretty convincing evidence.
Even if the traffic was not abnormal in content, the high connection rate was apparently having a
denial-of-service affect on the firewall state table and possibly a performance impact on the
target DNS servers as well. Either of which could have a serious effect on network connectivity
and performance.
Since the default udp connection timeout value for a Check Point firewall is 40 seconds,
it would not take very long for a high traffic rate to exhaust the connection table, interfering with
other systems connecting through the same firewall.
A udp connection is determined by any unique combination of source ip address, source
port, destination ip address, and destination port. If the above culprit was varying the source
port for every connection, that would confirm the nature of the problem.
The following query focused on the source of the suspicious traffic.
Mark Stingley, ggiac _AT_ altsec.info

Check Point Firewall Log Analysis In-Depth 13
mysql> select mid(fw1time,12,8) as Time,fw1src,fw1s_port,fw1dst,fw1service,fw1proto from fw1logs.20090605 where fw1time between "2009-06-05 09:00:00" and "2009-06-05 09:05:00" and (fw1orig = "192.168.95.118" or fw1orig = "192.168.90.254") and fw1src = "192.168.128.151" and (fw1dst = "192.168.7.47" or fw1dst = "192.168.7.48") order by Time limit 20;+----------+-----------------+-----------+--------------+------------+----------+| Time | fw1src | fw1s_port | fw1dst | fw1service | fw1proto |+----------+-----------------+-----------+--------------+------------+----------+| 09:00:28 | 192.168.128.151 | 54038 | 192.168.7.48 | 53 | udp || 09:00:28 | 192.168.128.151 | 54038 | 192.168.7.47 | 53 | udp || 09:00:28 | 192.168.128.151 | 51573 | 192.168.7.48 | 53 | udp || 09:00:28 | 192.168.128.151 | 59508 | 192.168.7.48 | 53 | udp || 09:00:28 | 192.168.128.151 | 56207 | 192.168.7.48 | 53 | udp || 09:00:28 | 192.168.128.151 | 56207 | 192.168.7.47 | 53 | udp || 09:00:28 | 192.168.128.151 | 58100 | 192.168.7.48 | 53 | udp || 09:00:28 | 192.168.128.151 | 60238 | 192.168.7.48 | 53 | udp || 09:00:28 | 192.168.128.151 | 49758 | 192.168.7.48 | 53 | udp || 09:00:28 | 192.168.128.151 | 49758 | 192.168.7.47 | 53 | udp || 09:00:28 | 192.168.128.151 | 61368 | 192.168.7.48 | 53 | udp || 09:00:28 | 192.168.128.151 | 61350 | 192.168.7.48 | 53 | udp || 09:00:28 | 192.168.128.151 | 58047 | 192.168.7.48 | 53 | udp || 09:00:28 | 192.168.128.151 | 58047 | 192.168.7.47 | 53 | udp || 09:00:28 | 192.168.128.151 | 52253 | 192.168.7.48 | 53 | udp || 09:00:28 | 192.168.128.151 | 54378 | 192.168.7.48 | 53 | udp || 09:00:28 | 192.168.128.151 | 62709 | 192.168.7.48 | 53 | udp || 09:00:28 | 192.168.128.151 | 62709 | 192.168.7.47 | 53 | udp || 09:00:28 | 192.168.128.151 | 54231 | 192.168.7.48 | 53 | udp || 09:00:28 | 192.168.128.151 | 54492 | 192.168.7.48 | 53 | udp |+----------+-----------------+-----------+--------------+------------+----------+20 rows in set (2 min 10.31 sec)
Now, the picture is complete. In only minutes of firewall log analysis, a host was
confirmed to be producing an abnormally high rate of udp traffic from varying source ports,
which could be presumed to be capable of exhausting the state table on the firewall.
The next step was to contact the system owner and ask them to check their system,
encourage network operations to attempt some rate limiting on the switch, and explore other
remediation approaches. The ‘lessons learned’ phase of incident handling also recommended
boosting the size of the firewall cluster’s connection table.
During such an incident stopping or seriously limiting the offending traffic should result
in a complete return to normal state for the firewall after the UDP timeout of 40 seconds and
would be absolute confirmation that the suspect system’s traffic was causing the connection
problems.
Mark Stingley, ggiac _AT_ altsec.info

Check Point Firewall Log Analysis In-Depth 14
Watchdog AlertingRaising the alarm on a select set of circumstances is often critical to information security,
especially when malicious attacks or abnormal network traffic are detected. The usual sensor to
generate such alerts is an IDS or possibly a Network Anomaly Detection system. However,
tracking unusual connections with the firewall log analysis database can be an excellent backup
for other systems. Sometimes it is simply more reliable than other sensors.
SPAMBOT
In the past two years of operations, firewall log database analysis has been extremely
reliable for alerting on abnormal outbound SMTP from ip addresses that are not recognized as
mail servers. Although IDS signatures did a good job of detecting bursts of SMTP traffic from
workstations, false alarms were frequent. Thus, a handy little shell script known as
spambotchk.sh was born.
The theory of operation is simple.
Every three minutes, the server’s crontab runs the script, which will query the previous
five minutes of firewall logs for Internet bound port 25 tcp activity originating from internal ip
addresses not found in the list of recognized mail servers.
If the count of connections and destination ip addresses exceeds a threshold, the script
will generate an alert email to incident handlers. The ip address of any detected spambot is then
added to a list of notices sent, which prevents any runaway spamming of the incident handlers.
The notification list is cleared every night.
Once the thresholds were tweaked to allow for legitimate bursts of SMTP traffic, the
spambot script has proven 100% reliability with zero false alarms.
Future development of the system will provide for initiating network capture of any
offenders with automated analysis of the email content.
Mark Stingley, ggiac _AT_ altsec.info
Check Point Firewall Log Analysis In-Depth 15
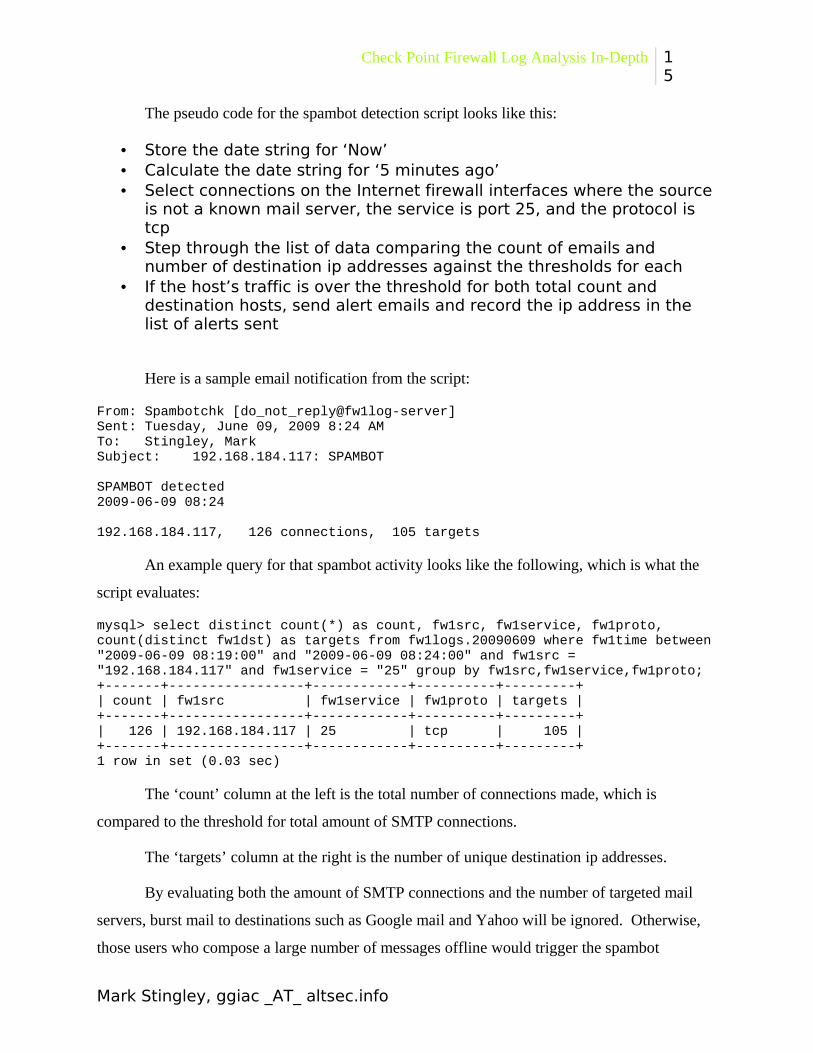
The pseudo code for the spambot detection script looks like this:
• Store the date string for ‘Now’• Calculate the date string for ‘5 minutes ago’• Select connections on the Internet firewall interfaces where the source
is not a known mail server, the service is port 25, and the protocol is tcp
• Step through the list of data comparing the count of emails and number of destination ip addresses against the thresholds for each
• If the host’s traffic is over the threshold for both total count and destination hosts, send alert emails and record the ip address in the list of alerts sent
Here is a sample email notification from the script:
From: Spambotchk [do_not_reply@fw1log-server]Sent: Tuesday, June 09, 2009 8:24 AMTo: Stingley, MarkSubject: 192.168.184.117: SPAMBOT
SPAMBOT detected2009-06-09 08:24
192.168.184.117, 126 connections, 105 targets
An example query for that spambot activity looks like the following, which is what the
script evaluates:
mysql> select distinct count(*) as count, fw1src, fw1service, fw1proto, count(distinct fw1dst) as targets from fw1logs.20090609 where fw1time between "2009-06-09 08:19:00" and "2009-06-09 08:24:00" and fw1src = "192.168.184.117" and fw1service = "25" group by fw1src,fw1service,fw1proto;+-------+-----------------+------------+----------+---------+| count | fw1src | fw1service | fw1proto | targets |+-------+-----------------+------------+----------+---------+| 126 | 192.168.184.117 | 25 | tcp | 105 |+-------+-----------------+------------+----------+---------+1 row in set (0.03 sec)
The ‘count’ column at the left is the total number of connections made, which is
compared to the threshold for total amount of SMTP connections.
The ‘targets’ column at the right is the number of unique destination ip addresses.
By evaluating both the amount of SMTP connections and the number of targeted mail
servers, burst mail to destinations such as Google mail and Yahoo will be ignored. Otherwise,
those users who compose a large number of messages offline would trigger the spambot
Mark Stingley, ggiac _AT_ altsec.info
Check Point Firewall Log Analysis In-Depth 16
watchdog when they connect to the network.
This is the actual production script in use as of the date of this paper.
spambotchk.sh
#!/bin/sh
#Version 20090903.01
#create some secure temporary filesTMPFILE=`tempfile`TMPQRY=`tempfile`MAILTMP=`tempfile`
#store the times NOW and 5 minutes ago in MySQL date time formatTNOW=`date "+%Y-%m-%d %H:%M"`TTHEN=`date -d "5 minutes ago" "+%Y-%m-%d %H:%M"`
#botchk.list is a daily list of reported spambots, a simple way#of avoiding self-spam and noise#if the file doesn’t exit, create itif [ ! -f /var/run/botchk.list ]; then touch /var/run/botchk.listfi
#build the query with the following criteria#1. for the past five minutes#2. for valid connections (not dropped)#3. on internet firewall interfaces 192.168.15.1 and 192.168.15.2#4. originating from internal systems (networks 192.168. and 172.16.)#5. excluding internal destinations (NOT networks 192.168. and 172.16.)#6. excluding known mailservers (subnets 192.106.101 and 192.168.8)#7. looking at only SMTP traffic (destination port 25)#8. examine only the top 40 talkers
echo "select distinct count(*) as count, count(distinct fw1dst) as targets,fw1src,fw1service,fw1proto from fw1logs.fw1logs where fw1time between \"$TTHEN\" and \"$TNOW\" and fw1action = \"accept\" and (fw1orig = \"192.168.15.1\" or fw1orig = \"192.168.15.2\") and (mid(fw1src,1,8) = \"192.168.\" or mid(fw1src,1,7) = \"172.16.\") and mid(fw1dst,1,8) != \"192.168.\" and mid(fw1dst,1,7) != \"172.16.\" and mid(fw1src,1,11) != \"192.168.101\" and mid(fw1src,1,10) != \"192.168.8.\" and fw1service = \"25\" group by fw1src, fw1service, fw1proto order by count desc limit 40;" > $TMPQRY
#ISQL needs a blank line after the query statementecho "" >> $TMPQRY
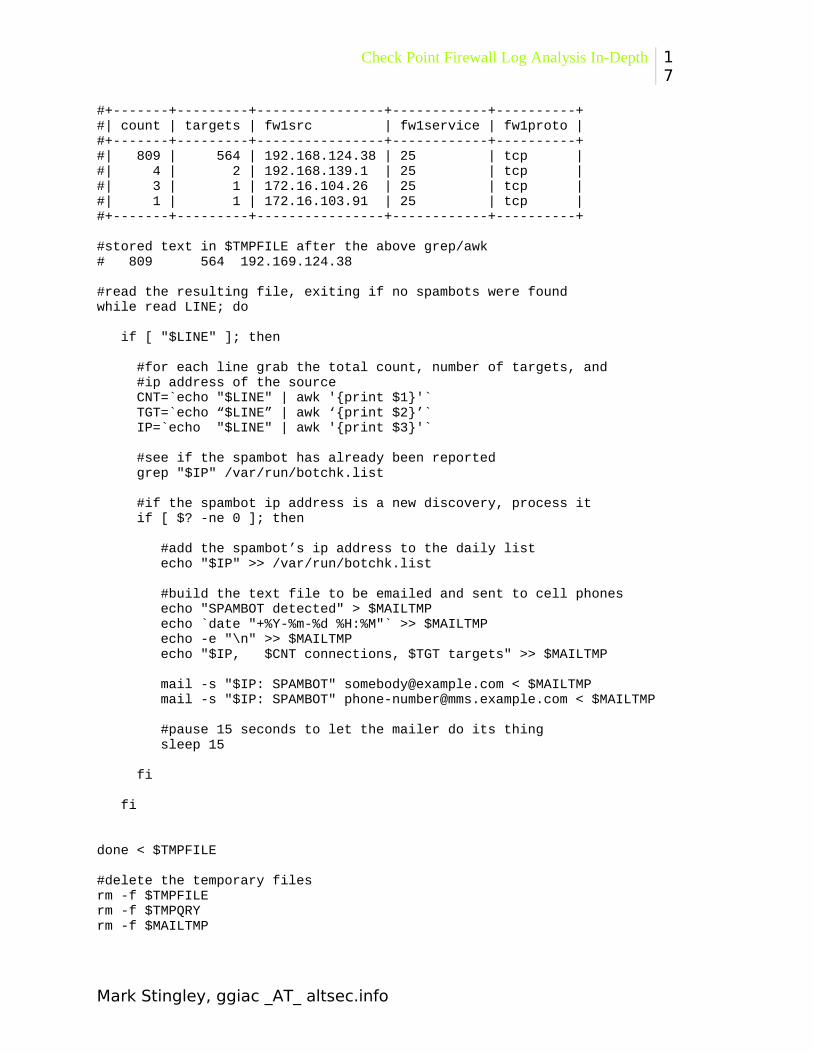
#run the query with the 32 bit version of isql (renamed isql32)#$2>100 is total connections, $3>10 is greater than 10 destinationsisql32 -b FWLogs32 logger somepassword < $TMPQRY | grep '\.' | awk -F"|" '{if ($2>100 && $3>10) print $2$3$4}' >> $TMPFILE
#example output for a confirmed spambot
Mark Stingley, ggiac _AT_ altsec.info
Check Point Firewall Log Analysis In-Depth 17
#+-------+---------+----------------+------------+----------+#| count | targets | fw1src | fw1service | fw1proto |#+-------+---------+----------------+------------+----------+#| 809 | 564 | 192.168.124.38 | 25 | tcp |#| 4 | 2 | 192.168.139.1 | 25 | tcp |#| 3 | 1 | 172.16.104.26 | 25 | tcp |#| 1 | 1 | 172.16.103.91 | 25 | tcp |#+-------+---------+----------------+------------+----------+
#stored text in $TMPFILE after the above grep/awk# 809 564 192.169.124.38
#read the resulting file, exiting if no spambots were foundwhile read LINE; do
if [ "$LINE" ]; then
#for each line grab the total count, number of targets, and #ip address of the source CNT=`echo "$LINE" | awk '{print $1}'` TGT=`echo “$LINE” | awk ‘{print $2}’` IP=`echo "$LINE" | awk '{print $3}'`
#see if the spambot has already been reported grep "$IP" /var/run/botchk.list
#if the spambot ip address is a new discovery, process it if [ $? -ne 0 ]; then
#add the spambot’s ip address to the daily list echo "$IP" >> /var/run/botchk.list
#build the text file to be emailed and sent to cell phones echo "SPAMBOT detected" > $MAILTMP echo `date "+%Y-%m-%d %H:%M"` >> $MAILTMP echo -e "\n" >> $MAILTMP echo "$IP, $CNT connections, $TGT targets" >> $MAILTMP
mail -s "$IP: SPAMBOT" [email protected] < $MAILTMP mail -s "$IP: SPAMBOT" [email protected] < $MAILTMP
#pause 15 seconds to let the mailer do its thing sleep 15
fi
fi
done < $TMPFILE
#delete the temporary filesrm -f $TMPFILErm -f $TMPQRYrm -f $MAILTMP
Mark Stingley, ggiac _AT_ altsec.info
Check Point Firewall Log Analysis In-Depth 18
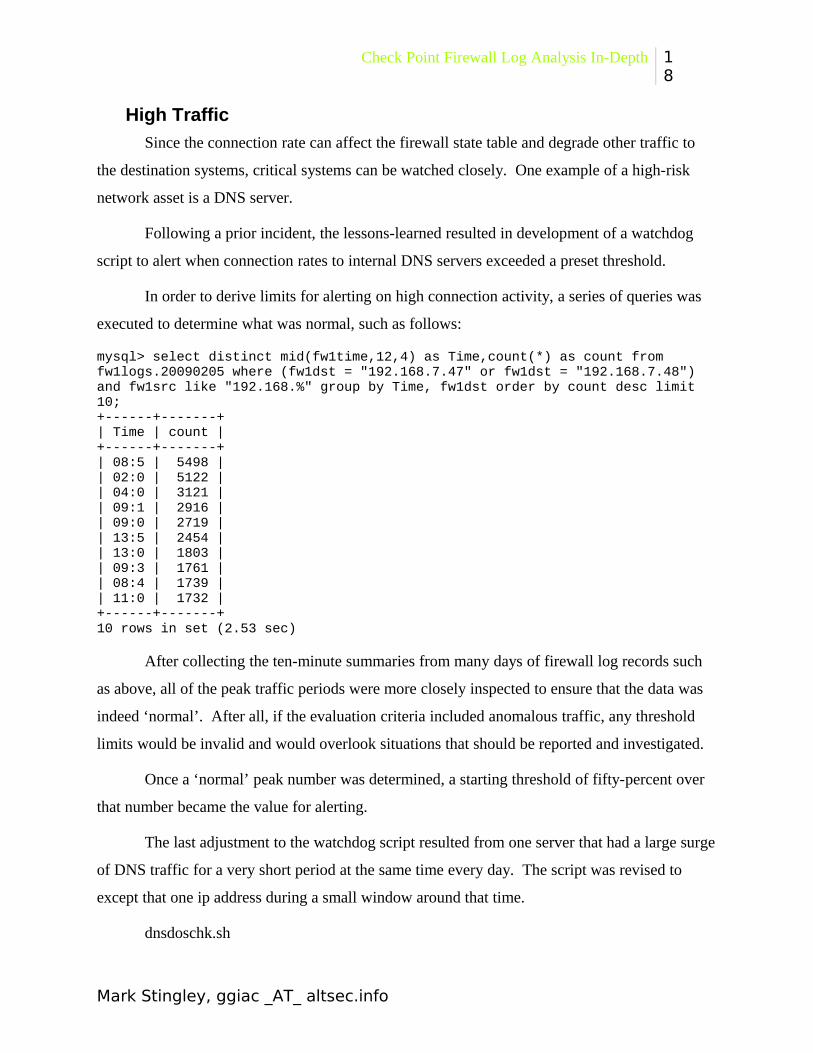
High Traffic
Since the connection rate can affect the firewall state table and degrade other traffic to
the destination systems, critical systems can be watched closely. One example of a high-risk
network asset is a DNS server.
Following a prior incident, the lessons-learned resulted in development of a watchdog
script to alert when connection rates to internal DNS servers exceeded a preset threshold.
In order to derive limits for alerting on high connection activity, a series of queries was
executed to determine what was normal, such as follows:
mysql> select distinct mid(fw1time,12,4) as Time,count(*) as count from fw1logs.20090205 where (fw1dst = "192.168.7.47" or fw1dst = "192.168.7.48") and fw1src like "192.168.%" group by Time, fw1dst order by count desc limit 10;+------+-------+| Time | count |+------+-------+| 08:5 | 5498 || 02:0 | 5122 || 04:0 | 3121 || 09:1 | 2916 || 09:0 | 2719 || 13:5 | 2454 || 13:0 | 1803 || 09:3 | 1761 || 08:4 | 1739 || 11:0 | 1732 |+------+-------+10 rows in set (2.53 sec)
After collecting the ten-minute summaries from many days of firewall log records such
as above, all of the peak traffic periods were more closely inspected to ensure that the data was
indeed ‘normal’. After all, if the evaluation criteria included anomalous traffic, any threshold
limits would be invalid and would overlook situations that should be reported and investigated.
Once a ‘normal’ peak number was determined, a starting threshold of fifty-percent over
that number became the value for alerting.
The last adjustment to the watchdog script resulted from one server that had a large surge
of DNS traffic for a very short period at the same time every day. The script was revised to
except that one ip address during a small window around that time.
dnsdoschk.sh
Mark Stingley, ggiac _AT_ altsec.info

Check Point Firewall Log Analysis In-Depth 19
#!/bin/sh
#Version 20090903.01
#create the temporary filesTMPFILE=`tempfile`TMPQRY=`tempfile`MAILTMP=`tempfile`
#store the times for NOW and 5 minutes ago in MySQL date time formatTNOW=`date "+%Y-%m-%d %H:%M"`TTHEN=`date -d "5 minutes ago" "+%Y-%m-%d %H:%M"`
#convert HH:MM to HHMM for comparison to a known surge periodMINUTE=`date -d "$TNOW" "+%H%M"`
#the daily surge occurs between 04:00 and 04:15TLOW="0400"THIGH="0415"
#create a list of reported DNS DOS hosts, if it doesn’t existif [ ! -f /var/run/dnschk.list ]; then
touch /var/run/dnschk.list
fi
#create a query file with the following criteria#1. examine the last five minutes (THEN and NOW)#2. grab only DNS (port 53) traffic#3. traffic for DNS servers at 192.168.19.12 and 192.168.19.13#4. where the source is subnets 192.168.51,52,53, and 54# these were subnets traversing the firewall for internal DNS echo "select distinct count(*) as count,fw1src,fw1dst from fw1logs.fw1logs where fw1time between \"$TTHEN\" and \"$TNOW\" and fw1service = \"53\" and (fw1dst = \"192.168.19.12\" or fw1dst = \"192.168.19.13\") and (fw1src like \"192.168.51.%\" or fw1src like \"192.168.52.%\" or fw1src like \"192.168.53.%\" or fw1src like \"192.168.54.%\") group by fw1src,fw1dst order by count desc limit 10;" > $TMPQRY
# ISQL needs a blank line after the queryecho "" >> $TMPQRY
#use awk to grab counts above the limit ($2>2000)isql32 -b FW1-Logs32 logger some-password < $TMPQRY | grep '\.' | awk -F"|" '{if ($2>2000) print $2$3}' >> $TMPFILE
#example output for a definite problem#+-------+----------------+---------------+#| count | fw1src | fw1dst |#+-------+----------------+---------------+#| 42595 | 192.168.52.152 | 192.168.19.13 |#| 20293 | 192.168.52.152 | 192.168.19.12 |#| 55 | 192.168.53.223 | 192.168.19.12 |#| 50 | 192.168.52.153 | 192.168.19.12 |#| 49 | 192.168.53.226 | 192.168.19.12 |
Mark Stingley, ggiac _AT_ altsec.info

Check Point Firewall Log Analysis In-Depth 20
#| 49 | 192.168.53.71 | 192.168.19.12 |#| 48 | 192.168.53.225 | 192.168.19.12 |#+-------+----------------+---------------+
# read one line at a time from the file, exiting if emptywhile read LINE; do
if [ "$LINE" ]; then
#store the count and the ip address for notification CNT=`echo "$LINE" | awk '{print $1}'` IP=`echo "$LINE" | awk '{print $2}'`
#ignore the known surge from 192.168.53.14 if it’s the right time if ([ "$IP" == "192.168.53.14" ] && [ $MINUTE -ge $TLOW ] && [ $MINUTE -le $THIGH ] ); then
#log the known surge alert to a separate file echo "$TNOW: $IP - $CNT hits, skipped" >> /var/log/loggrabber/dnsskip.txt continue
fi
#check if the offender has already been reported grep "$IP" /var/run/dnschk.list
#if not, store the ip address then send email alerts if [ $? -ne 0 ]; then
echo "$IP" >> /var/run/dnschk.list
echo "DNS DOS detected" > $MAILTMP echo `date "+%Y-%m-%d %H:%M"` >> $MAILTMP echo -e "\n\n" >> $MAILTMP echo "$IP, $CNT connections" >> $MAILTMP mail -s "$IP: DNS DOS" [email protected] < $MAILTMP mail -s "$IP: DNS DOS" [email protected] < $MAILTMP
sleep 15
fi
fi
done < $TMPFILE#delete the temporary files
rm -f $TMPFILErm -f $TMPQRYrm -f $MAILTMP
Granted, the script is not the most sophisticated programming example. But, it works
reliably and very seldom generates false alarms.
Mark Stingley, ggiac _AT_ altsec.info

Check Point Firewall Log Analysis In-Depth 21
Both the DNS DoS and Spambot watch were created rapidly using very simple tools and
techniques to serve a specific need. Neither was meant to be a permanent solution. Future
evolution of the scripts will likely move toward use of Perl for direct database access with the
venerable DBI 17 and DBD-mysql 18 modules. Use of a more powerful programming language
than the Linux shell script will provide for more sophisticated data evaluation, faster operation,
and eliminate the need for temporary files.
Outside of the critically useful alerting provided by such watchdog scripts, their
development and use paves the way for tuning and verification of larger commercial systems
such as security information or event managers. An inexpensive and simple system like the
loggrabber and watchdog script combination can save serious embarrassment should an
expensive appliance not alert on a serious security event.
Mark Stingley, ggiac _AT_ altsec.info

Check Point Firewall Log Analysis In-Depth 22
Deep AnalysisHardware resources limit the amount and complexity of data analysis that can be
performed on the fw1-loggrabber server. If the server does not have enough CPU power, plenty
of RAM, and fast disk drives, long running and complex queries will have a serious impact on
both the insertion of data from the firewalls and any watchdog scripts. Once the server falls
behind on the task of inserting the data into the database as it is received, the records are
backlogged to the disk creating a downward performance spiral. The result is a system that no
longer stores records fast enough to drive other queries that rely on near real-time data.
The solution is a big and fast replica server for any data analysis other than simple
queries with limited scope. By offloading the more intensive analytical tasks to another server, a
myriad of useful reports can be scheduled without fear of disrupting near real-time data
collection.
Deeper analysis is truly limited only by the imagination and desire to discover the
unknown.
Firewall Rule Usage
A very useful daily query is accumulation of rule uid frequency, because knowing which
rules fire most often is critical to optimization of firewall performance. To quote Check Point:
Rule base processing is a top down process and more CPU expense will be incurred
matching rules that are towards the bottom of the rule base than for those towards the top of the
rule base. Once the traffic profile is known, you may be able to reorder rules so that the most
heavily used rules, are nearer to the top of the rulebase to make rule matching more CPU
efficient. When a packet is matched against a rule, no further processing of the packet in the
rulebase is needed so if a heavily used rule is at the bottom of the rulebase it unnecessarily
creates more workload.19
As mentioned earlier, the rule UID is the only permanent identifier for a specific Check
Point firewall rule. The other rule identifier, the rule ID, is temporary and it will change with
every ruleset change and profile push. That is why the field “fw1rule” was eliminated from the
fw1-loggrabber code revision.
Mark Stingley, ggiac _AT_ altsec.info
Check Point Firewall Log Analysis In-Depth 23
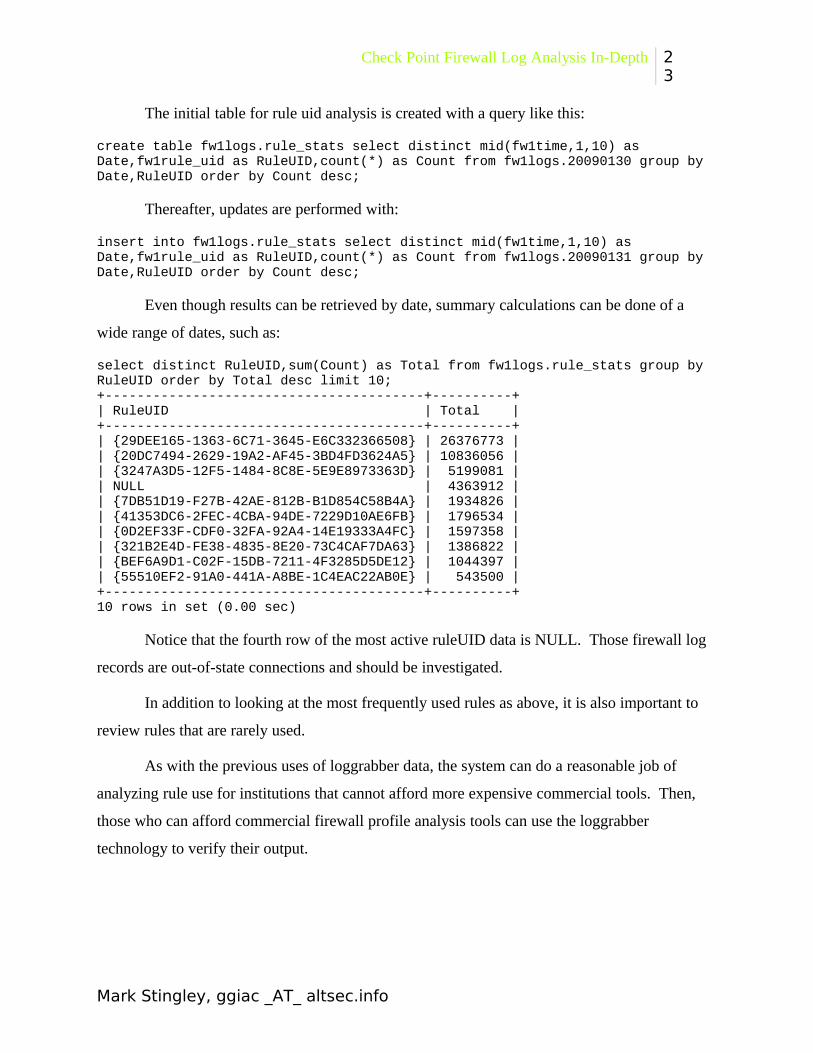
The initial table for rule uid analysis is created with a query like this:
create table fw1logs.rule_stats select distinct mid(fw1time,1,10) as Date,fw1rule_uid as RuleUID,count(*) as Count from fw1logs.20090130 group by Date,RuleUID order by Count desc;
Thereafter, updates are performed with:
insert into fw1logs.rule_stats select distinct mid(fw1time,1,10) as Date,fw1rule_uid as RuleUID,count(*) as Count from fw1logs.20090131 group by Date,RuleUID order by Count desc;
Even though results can be retrieved by date, summary calculations can be done of a
wide range of dates, such as:
select distinct RuleUID,sum(Count) as Total from fw1logs.rule_stats group by RuleUID order by Total desc limit 10;+----------------------------------------+----------+| RuleUID | Total |+----------------------------------------+----------+| {29DEE165-1363-6C71-3645-E6C332366508} | 26376773 || {20DC7494-2629-19A2-AF45-3BD4FD3624A5} | 10836056 || {3247A3D5-12F5-1484-8C8E-5E9E8973363D} | 5199081 || NULL | 4363912 || {7DB51D19-F27B-42AE-812B-B1D854C58B4A} | 1934826 || {41353DC6-2FEC-4CBA-94DE-7229D10AE6FB} | 1796534 || {0D2EF33F-CDF0-32FA-92A4-14E19333A4FC} | 1597358 || {321B2E4D-FE38-4835-8E20-73C4CAF7DA63} | 1386822 || {BEF6A9D1-C02F-15DB-7211-4F3285D5DE12} | 1044397 || {55510EF2-91A0-441A-A8BE-1C4EAC22AB0E} | 543500 |+----------------------------------------+----------+10 rows in set (0.00 sec)
Notice that the fourth row of the most active ruleUID data is NULL. Those firewall log
records are out-of-state connections and should be investigated.
In addition to looking at the most frequently used rules as above, it is also important to
review rules that are rarely used.
As with the previous uses of loggrabber data, the system can do a reasonable job of
analyzing rule use for institutions that cannot afford more expensive commercial tools. Then,
those who can afford commercial firewall profile analysis tools can use the loggrabber
technology to verify their output.
Mark Stingley, ggiac _AT_ altsec.info
Check Point Firewall Log Analysis In-Depth 24
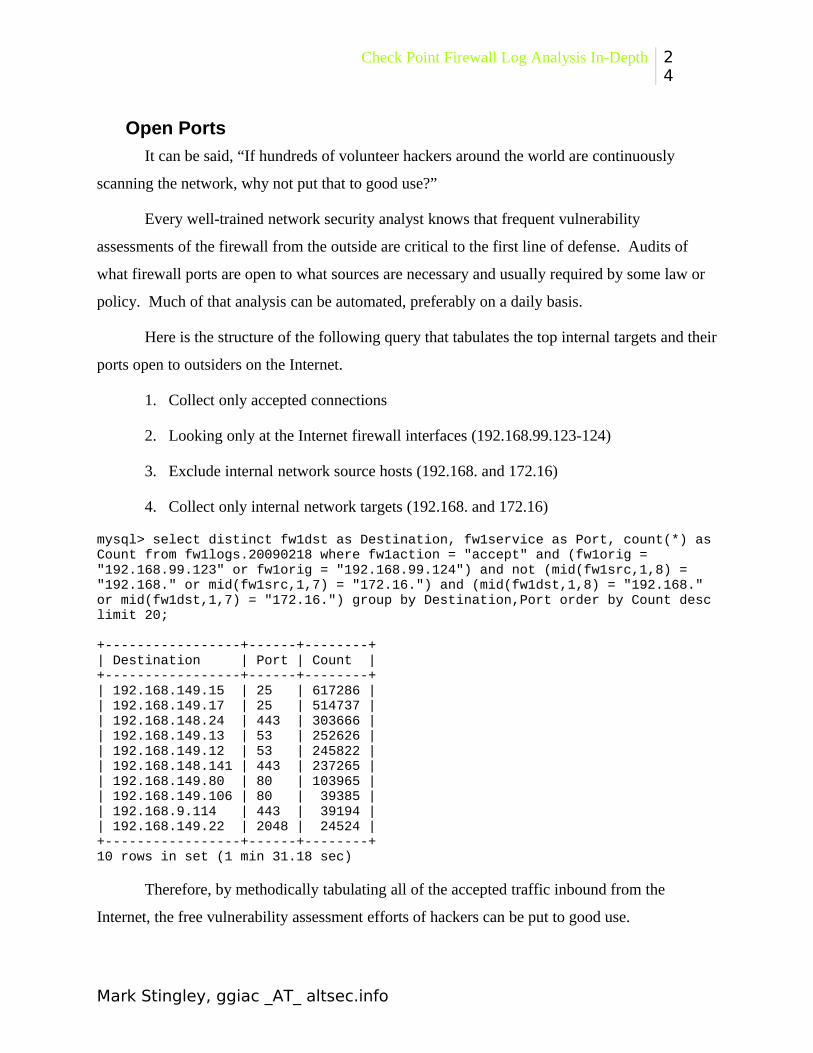
Open Ports
It can be said, “If hundreds of volunteer hackers around the world are continuously
scanning the network, why not put that to good use?”
Every well-trained network security analyst knows that frequent vulnerability
assessments of the firewall from the outside are critical to the first line of defense. Audits of
what firewall ports are open to what sources are necessary and usually required by some law or
policy. Much of that analysis can be automated, preferably on a daily basis.
Here is the structure of the following query that tabulates the top internal targets and their
ports open to outsiders on the Internet.
1. Collect only accepted connections
2. Looking only at the Internet firewall interfaces (192.168.99.123-124)
3. Exclude internal network source hosts (192.168. and 172.16)
4. Collect only internal network targets (192.168. and 172.16)
mysql> select distinct fw1dst as Destination, fw1service as Port, count(*) as Count from fw1logs.20090218 where fw1action = "accept" and (fw1orig = "192.168.99.123" or fw1orig = "192.168.99.124") and not (mid(fw1src,1,8) = "192.168." or mid(fw1src,1,7) = "172.16.") and (mid(fw1dst,1,8) = "192.168." or mid(fw1dst,1,7) = "172.16.") group by Destination,Port order by Count desc limit 20;
+-----------------+------+--------+| Destination | Port | Count |+-----------------+------+--------+| 192.168.149.15 | 25 | 617286 || 192.168.149.17 | 25 | 514737 || 192.168.148.24 | 443 | 303666 || 192.168.149.13 | 53 | 252626 || 192.168.149.12 | 53 | 245822 || 192.168.148.141 | 443 | 237265 || 192.168.149.80 | 80 | 103965 || 192.168.149.106 | 80 | 39385 || 192.168.9.114 | 443 | 39194 || 192.168.149.22 | 2048 | 24524 |+-----------------+------+--------+10 rows in set (1 min 31.18 sec)
Therefore, by methodically tabulating all of the accepted traffic inbound from the
Internet, the free vulnerability assessment efforts of hackers can be put to good use.
Mark Stingley, ggiac _AT_ altsec.info

Check Point Firewall Log Analysis In-Depth 25
The preceding is only a rough example of the potential for such analysis. A more
comprehensive system should store the results by date and make delta comparisons with prior
data. Such efforts may sometimes result in an outlier hit on a seldom-used valid port, but that is
a small amount of noise and bother. The rewards are priceless for finding out quickly that an
external host is reaching an internal host on a port that should not be open to the Internet.
Host Behavior
Profiling host activity is perhaps one of the most complex forms of analysis.
The primary reason for the complexity is the need for supplemental information. For
example, just because a workstation hits the external host at 1.2.3.4 many times a day is
meaningless. Even if the domain name of the site is known, little can be determined without
further correlation. However, if the host country identification is tied to the ip address, that can
be significant.
Early in 2007 during the mass RBN/MPack20 exploitation of public websites, a
predicable pattern of workstation exploitation emerged in repeated network traffic capture.
Although the initial attack vector was most often a hacked legitimate U.S. website, a series of
foreign websites would be hit immediately thereafter by the host to download a veritable cocktail
of malware.
That trend appears to continue to this day. The assumption is that the cybercriminal
enterprises prefer to host their primary malware sites in countries that do not appear to have
stronger information security laws and scrutiny. Regardless of the reason, the mere pattern
change of host activity can be an indicator of a compromise attempt.
Granted, working in one of those malware site ridden countries presents a greater
challenge to host profiling. Such efforts will likely require reliance on other factors than just the
geographic location. For many other analysts though, creating a running profile of daily
workstation http activity will provide at the very least a list of hosts that deserve scrutiny.
Mark Stingley, ggiac _AT_ altsec.info

Check Point Firewall Log Analysis In-Depth 26
To support the geographic relationship to malware, here is the Threatexpert.com21 view
of malware sources on 2007-07-15:
Threat Expert, 2009-07-15 04:20 UCT
Another reliable source of known malware sites is the venerable ZeuS Tracker, which
documents the activity of the ZeuS crimeware network of Trojan Zbot fame. Here are the top 10
sources known to host files (filesonline)22:
30 Russian Federation (RU) 29 United States (US) 26 China (CN) 7 Netherlands (NL) 6 Ukraine (UA) 6 Latvia (LV) 5 Germany (DE) 4 Lithuania (LT) 4 Canada (CA) 3 Taiwan (TW)
The following analytical example involves the use of a supplementary database table
created by mapping the host country to the ip address using a tool called geoiplookup23, which is
available in most Linux distributions.
Mark Stingley, ggiac _AT_ altsec.info
Check Point Firewall Log Analysis In-Depth 27
The current method of host profiling is a rather lengthy offline process that involves perl
scripts originally developed for automated lookup of network abuse contacts. Those materials
are provided online for anyone interested in adopting the use of this technology (See Appendix –
A). For simplicity, the country-to-ip-address database table is already populated with all of the
http destination addresses and country codes. In practice, a scheduled script would populate the
table on a regular interval.
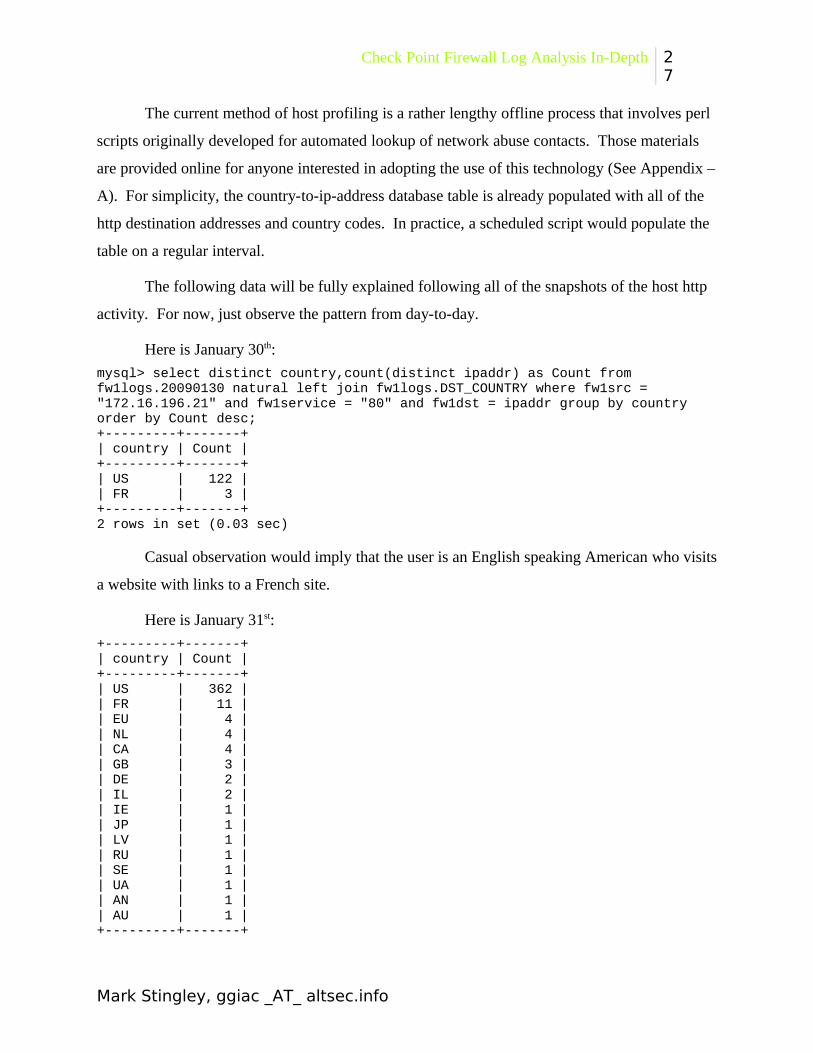
The following data will be fully explained following all of the snapshots of the host http
activity. For now, just observe the pattern from day-to-day.
Here is January 30th:
mysql> select distinct country,count(distinct ipaddr) as Count from fw1logs.20090130 natural left join fw1logs.DST_COUNTRY where fw1src = "172.16.196.21" and fw1service = "80" and fw1dst = ipaddr group by country order by Count desc;+---------+-------+| country | Count |+---------+-------+| US | 122 || FR | 3 |+---------+-------+2 rows in set (0.03 sec)
Casual observation would imply that the user is an English speaking American who visits
a website with links to a French site.
Here is January 31st:
+---------+-------+| country | Count |+---------+-------+| US | 362 || FR | 11 || EU | 4 || NL | 4 || CA | 4 || GB | 3 || DE | 2 || IL | 2 || IE | 1 || JP | 1 || LV | 1 || RU | 1 || SE | 1 || UA | 1 || AN | 1 || AU | 1 |+---------+-------+
Mark Stingley, ggiac _AT_ altsec.info

Check Point Firewall Log Analysis In-Depth 28
Something has changed from the first day. There are many hits outside the baseline of
US and FR destinations only.
The following numbers are for February 1st:
+---------+-------+| country | Count |+---------+-------+| US | 256 || RU | 3 || NL | 2 || CA | 2 || IE | 1 || IL | 1 |+---------+-------+6 rows in set (1.71 sec)
Again, there are multiple hits away from the baseline US and FR.
Then for February 2nd:
+---------+-------+| country | Count |+---------+-------+| US | 138 || CA | 5 || NL | 2 || LV | 2 || IL | 1 |+---------+-------+5 rows in set (1.10 sec)
And for February 3rd:
+---------+-------+| country | Count |+---------+-------+| US | 292 || FR | 7 || CA | 6 || BR | 2 || GB | 2 || NL | 2 || AU | 1 || EU | 1 || LU | 1 |+---------+-------+9 rows in set (2.14 sec)
Mark Stingley, ggiac _AT_ altsec.info
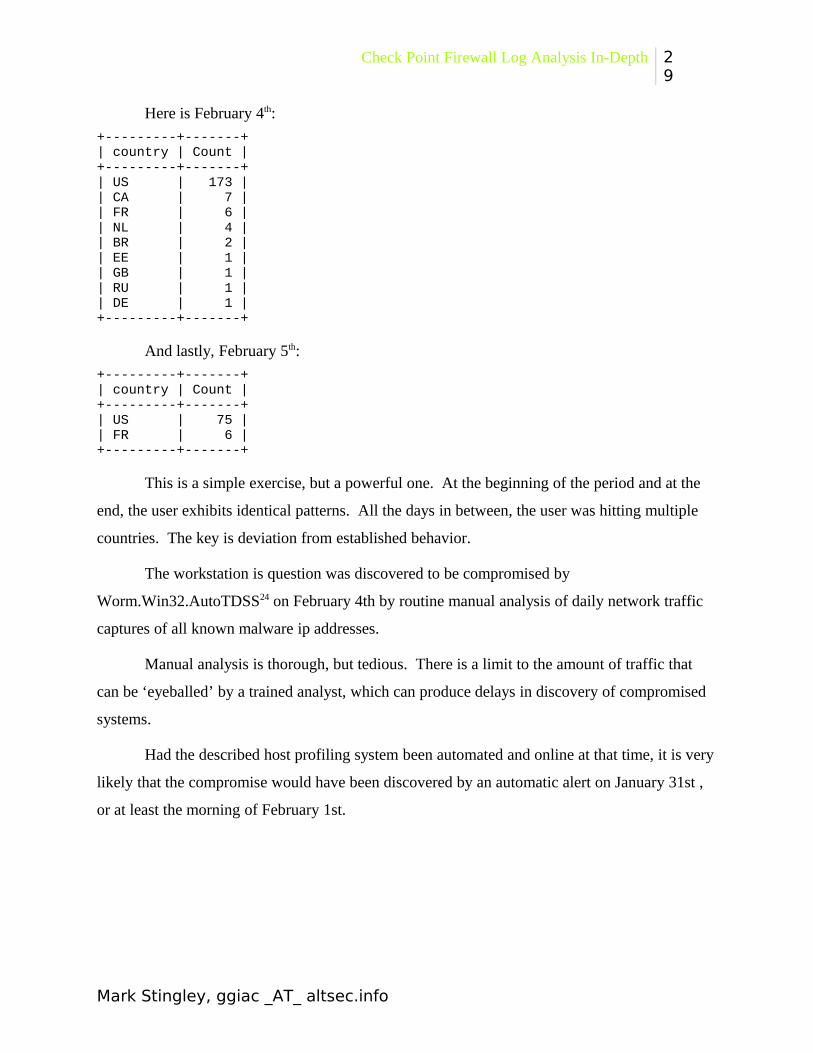
Check Point Firewall Log Analysis In-Depth 29
Here is February 4th:
+---------+-------+| country | Count |+---------+-------+| US | 173 || CA | 7 || FR | 6 || NL | 4 || BR | 2 || EE | 1 || GB | 1 || RU | 1 || DE | 1 |+---------+-------+
And lastly, February 5th:
+---------+-------+| country | Count |+---------+-------+| US | 75 || FR | 6 |+---------+-------+
This is a simple exercise, but a powerful one. At the beginning of the period and at the
end, the user exhibits identical patterns. All the days in between, the user was hitting multiple
countries. The key is deviation from established behavior.
The workstation is question was discovered to be compromised by
Worm.Win32.AutoTDSS24 on February 4th by routine manual analysis of daily network traffic
captures of all known malware ip addresses.
Manual analysis is thorough, but tedious. There is a limit to the amount of traffic that
can be ‘eyeballed’ by a trained analyst, which can produce delays in discovery of compromised
systems.
Had the described host profiling system been automated and online at that time, it is very
likely that the compromise would have been discovered by an automatic alert on January 31st ,
or at least the morning of February 1st.
Mark Stingley, ggiac _AT_ altsec.info

Check Point Firewall Log Analysis In-Depth 30
Here is a detailed look at how the automated profiling would have seen the compromise
footprint.
The system would have noticed that the user’s http traffic habits changed between
January 30th and January 31st. A simple query could have retrieved the initial sequence of
abnormal http hits (the DST_COUNTRY table maps ip address to country):
select fw1time,fw1dst,country from fw1logs.20090131 natural left join fw1logs.DST_COUNTRY where fw1src = "172.16.196.21" and fw1service = "80" and fw1dst = ipaddr and country != "" and country != "US" and country != "FR" order by fw1time limit 25;+---------------------+-----------------+---------+| fw1time | fw1dst | country |+---------------------+-----------------+---------+| 2009-01-31 13:04:28 | 206.223.183.156 | IE || 2009-01-31 13:04:28 | 206.223.183.156 | IE || 2009-01-31 13:08:06 | 204.11.52.67 | CA || 2009-01-31 13:08:07 | 81.3.150.213 | RU || 2009-01-31 13:11:57 | 92.61.149.127 | DE || 2009-01-31 13:11:57 | 92.61.149.127 | DE || 2009-01-31 13:11:58 | 92.61.149.127 | DE || 2009-01-31 13:11:58 | 92.61.149.127 | DE || 2009-01-31 13:11:58 | 92.61.149.127 | DE || 2009-01-31 13:12:01 | 88.214.197.132 | GB || 2009-01-31 13:12:01 | 88.214.197.132 | GB || 2009-01-31 13:12:01 | 88.214.197.132 | GB || 2009-01-31 13:12:01 | 88.214.197.132 | GB || 2009-01-31 13:12:02 | 88.214.197.132 | GB || 2009-01-31 13:13:35 | 122.249.238.191 | JP || 2009-01-31 13:13:35 | 122.249.238.191 | JP || 2009-01-31 13:13:37 | 80.77.86.202 | EU || 2009-01-31 13:13:38 | 80.77.86.202 | EU || 2009-01-31 13:13:38 | 80.77.86.202 | EU || 2009-01-31 13:13:39 | 194.165.4.7 | UA || 2009-01-31 13:13:40 | 94.247.3.40 | LV || 2009-01-31 13:13:40 | 94.247.3.40 | LV || 2009-01-31 13:13:55 | 94.247.3.40 | LV || 2009-01-31 13:13:55 | 94.247.3.40 | LV || 2009-01-31 13:13:55 | 94.247.3.40 | LV |+---------------------+-----------------+---------+25 rows in set (0.06 sec)
All of the ip addresses found in the first twenty-five http hits were recorded at the time as
malware sites at various locations that track cyber criminal activity. And, it’s a good bet that the
compromise happened at 2009-01-31 13:04:28 as the result of an injected web site visited by the
user immediately prior to that time.
Even though the actual compromise was not discovered through firewall log analysis,
work continues on the automated system that will process the data in the described manner.
Mark Stingley, ggiac _AT_ altsec.info
Check Point Firewall Log Analysis In-Depth 31
The system is far from perfect. Yet, such behavioral analysis is the only way to discover
compromises by more sophisticated malware that defies signature recognition by network or
host protection systems.
Problem hosts are going to be those that do not routinely acquire the same ip address. A
multi-national, multi-ethnic user population is a challenge as well. It is possible that a
production system would profile only known high-risk workstations.
Whatever the hurdles, they are worth jumping over to be able to see into the unknown.
ConclusionsMuch of time, the modern information security team deals with higher-level data
reductions, far removed from the raw details. Sometimes, that abstraction hides important
information.
A platform for detailed analysis of firewall logs provides a great deal of flexibility for
validation of other systems and can even perform some tasks that no other appliance can do as
well, as cheaply, or as simply. The firewall log analysis system used to generate the data herein
has proved to be an invaluable resource that has helped solve numerous networking and host
configuration problems, guide incident handling through hundreds of compromises, and helped
validate and tune other sensors and analysis appliances.
This paper may have the word firewall, the name Check Point, and mention firewall log
analysis in every line. However, there is an underlying principle throughout. The principle is
getting ‘under the hood’ and getting dirty with raw data, using the imagination and asking ‘what
if?’
This first version of this publication began as an extensive ‘how-to’ build the firewall
analysis server and fw1-loggrabber. However, after creating over thirty pages of detailed
installation instructions with pictures, it became apparent that this paper needed to focus on what
the system can do, not how to build it.
The ‘how to build it’ links are in Appendix – A, which includes both versions of the
compiled fw1-loggrabber code software, a package of the necessary 32-bit libraries, and detailed
yet simple instructions for setting up the server.
Mark Stingley, ggiac _AT_ altsec.info
Check Point Firewall Log Analysis In-Depth 32
An analyst with only modest Linux skills should be able to have a running system online
within four to eight person-hours. It is well worth the time spent.
Mark Stingley, GCIA GCIH GPENSenior Network Security Analyst
Mark Stingley, ggiac _AT_ altsec.info
Check Point Firewall Log Analysis In-Depth 33
Appendix – A
The basic Linux server used for this project is stock Debian Linux 5.x retrieved from:
netinst CD image (generally 135-175 MB)
http://www.debian.org/CD/netinst/
The official firewall analysis support page for this project is:
http://www.altsec.info/fwdataproj.html
Materials available include:
1. The modified version fw1-loggrabber executable.
2. An fw1-loggrabber executable that meets the original v1.11.1
design specs (all original fields).
3. A package of the necessary 32-bit Debian libraries to run fw1-
loggrabber on 64-bit servers.
4. Simple installation instructions for the packaged version, including
LEA application setup on Check Point.
5. A comprehensive document for full-blown server setup and
compilation.
6. Scripts for starting fw1-loggrabber and rotating the logs
7. A wide variety of analysis scripts in Bash and Perl.
8. Additional resources as the project moves along.
Mark Stingley, ggiac _AT_ altsec.info

Check Point Firewall Log Analysis In-Depth 34
Appendix – B; Useful LinksA. MySQL performance tips:
http://forge.mysql.com/wiki/Top10SQLPerformanceTipsB. MySQL RAM tuning on Linux: http://www.cyberciti.biz/tips/linux-
hugetlbfs-and-mysql-performance.htmlC. Enabling Large Page Support in MySQL:
http://dev.mysql.com/doc/refman/5.0/en/large-page-support.htmlD. Splunk resources for fw1-loggrabber:
http://www.splunk.com/base/Community:Configure_OPSEC_LEA_inputE. The official fw1-loggrabber project page:
http://sourceforge.net/projects/fw1-loggrabber/F. The Splunk fw1-loggrabber packaging (a real time-saver):
http://www.splunk.com/view/SP-CAAABJV , or http://download.splunk.com/support/OPSEC/fw1-loggrabber-splunk.tar.gz
Mark Stingley, ggiac _AT_ altsec.info

Check Point Firewall Log Analysis In-Depth 35
References
Mark Stingley, ggiac _AT_ altsec.info

1 Brenton, Bird and Rainum (Version 1.0). Top 5 Essential Log Reports. Retrieved July 8, 2009, from www.sans.org Web site: http://www.sans.org/resources/top5_logreports.pdf2 Wack, Cutler and Pole (sp800-41.pdf). Guidelines on Firewalls and Firewall Policy. Retrieved July 8, 2009, from csrc.nist.gov Web site: http://csrc.nist.gov/publications/nistpubs/800-41/sp800-41.pdf3 DHHS HIPAA Security Series Publication (Volume 2 / Paper 2, 5/2005: rev. 3/2007). Security Standards: Administrative Safeguards. Retrieved July 8, 2009 from www.cms.hhs.gov Web site: http://www.cms.hhs.gov/EducationMaterials/Downloads/SecurityStandardsAdministrativeSafeguards.pdf4 e-CFR Electronic Code of Federal Regulations (Title 16: Part 313). implements sections 501 and 505(b)(2) of the Gramm-Leach-Bliley Act. Retrieved July 8, 2009 from e-CFR. Web site: http://ecfr.gpoaccess.gov/cgi/t/text/text-idx?c=ecfr;sid=81db4c4ff02598be46d83c12b08c3c46;rgn=div8;view=text;node=16%3A1.0.1.3.38.0.38.1;idno=16;cc=ecfr5 Barry Anderson. Check Point firewalls - rulebase cleanup and performancetuning. Retrieved July 11, 2009 from the SANS Reading Room. Web site: http://www.sans.org/reading_room/whitepapers/firewalls/check_point_firewalls_rulebase_cleanup_and_performance_tuning_328846 John Willard. Getting the Most out of your Firewall Logs. Retrieved July 11, 2009 from the SANS Reading Room. Web site: http://www.sans.org/reading_room/whitepapers/firewalls/getting_the_most_out_of_your_firewall_logs_8117 CERT (Computer Emergency Response Team). Retrieved July 11, 2009 from CERT.org. Web site: http://www.cert.org/archive/pdf/Defense_in_Depth092106.pdf8 Debian – The Universal Operating System. Retrieved July 9, 2009 from Debian. Web site: http://www.debian.org/9 Sun Microsystems. Retrieved July 9, 2009 from Sun.com. Web site: http://dev.mysql.com/10 The Apache Webserver Foundation. Retrieved July 9, 2009 from Apache.org. Web site: http://httpd.apache.org/11 Nick Gorham. The unix ODBC Project Page. Retrieved July 9, 2009 from unixODBC. Web site: http://www.unixodbc.org/12 Torsten Fellhauer. The fw1-loggrabber Project Page. Retrieved July 9, 2009 from Sourceforge.com. Web site: http://sourceforge.net/projects/fw1-loggrabber/13 Check Point Software Technologies. OPSEC SDK 6.0 Documentation download page (unzip LEA.PDF), Retrieved July 9, 2009 from Opsec.com. Web site: (may require free account login) http://www.opsec.com/cp_products/90.htm14 Amit Shah. High Memory In The Linux Kernel. Retrieved July 11, 2009 from KernelTrap.org. Web site: http://kerneltrap.org/node/2450/721715 Splunk, Inc. OPSEC LEA integration. Retrieved September 1, 2009 from Splunk. Web site: http://www.splunk.com/view/SP-CAAABJV16 Stephen Gill. Maximizing Firewall Availability. Retrieved July 14, 2009 from Team CYMRU. Web site: http://www.cymru.com/gillsr/documents/maximizing-firewall-availability.htm17 Tim Bruce and Ilya Sterin. Perl DBI. Retrieved September 3, 2009. Web site: http://dbi.perl.org/18 Patric Galbraith. DBD-mysql. Retrieved September 3, 2009 from CPAN. Web site: http://search.cpan.org/~capttofu/DBD-mysql-4.012/lib/DBD/mysql.pm19 Check Point Software. high CPU utilization on IPSO. Retrieved July 16, 2009 from Check Point Software. Web site: https://supportcenter.checkpoint.com/supportcenter/portal?eventSubmit_doGoviewsolutiondetails=&solutionid=sk3864520 Wikipedia. MPack (Software). Retrieved July 17, 2009 from Wikipedia. Web site: http://en.wikipedia.org/wiki/MPack_(software)21 ThreatExpert. An advanced automated threat analysis system. Retrieved July 15, 2009 from ThreatExpert. Web site: http://www.threatexpert.com/22 abuse.ch. ZeuS Tracker :: monitor. Retrieved July 17, 2009 from abuse.ch. Web site: https://zeustracker.abuse.ch/monitor.php?filter=filesonline 23 MaxMind. GeoLite Country. Retrieved July 17, 2009 from MaxMind. Web site: http://www.maxmind.com/app/geolitecountry24 ThreatExpert. Worm.Win32.AutoTDSS. Retrieved July 17, 2009 from ThreatExpert. Web Site: http://www.threatexpert.com/report.aspx?md5=66298b831793c09ec471c36d9eb85c96


![Trusted Information Systems Internet Firewall Toolkit … · Sample Log Output ftp-gw[3442]: permit host=sol/192.33.112.100 use of gateway](https://static.fdocuments.in/doc/165x107/5b91649309d3f274268b8727/trusted-information-systems-internet-firewall-toolkit-sample-log-output-ftp-gw3442.jpg)