
Charlottesville - Defense Technical Information · PDF fileAar"ME COP. THE LOW PRESSURE...
153
cY THE LOW PRESSURE OXIDATION OF' 0 COPPER SINGLE CRYSTALS By Don Frederick Mitchell October 1965 Technical Report to The Office of Naval Research Contract NOnr 474(11) Principal Investigator: Kenneth R. Lawless, Professor Department of Materials Science Research Laboratories for the Engineering Sciences University of Virginia Charlottesville Report No. MS-3531-102-66U CLEARINGHOUSE rch 1966 FOR FEDERAL SCIENTIFIC AND TECHNICAL INFORMATION h2rdoopy Microfiehe1 lY', 9o,$0i, 0 1 4$C.P Aar"ME COP
-
Upload
dangkhuong -
Category
Documents
-
view
219 -
download
2
Transcript of Charlottesville - Defense Technical Information · PDF fileAar"ME COP. THE LOW PRESSURE...

cY THE LOW PRESSURE OXIDATION OF'
0 COPPER SINGLE CRYSTALS
By
Don Frederick Mitchell
October 1965
Technical Report
to
The Office of Naval Research
Contract NOnr 474(11)
Principal Investigator:
Kenneth R. Lawless, Professor
Department of Materials Science
Research Laboratories for the Engineering Sciences
University of Virginia
Charlottesville
Report No. MS-3531-102-66U
CLEARINGHOUSE rch 1966FOR FEDERAL SCIENTIFIC AND
TECHNICAL INFORMATION
h2rdoopy Microfiehe1
lY', 9o,$0i, 0 1 4$C.P
Aar"ME COP
THE LOW PRESSURE OXIDATION OF
COPPER SINGLE CRYSTALS*
By
Don Frederick Mitchell
October 1965
Techn{cal Report
to
The Office of Naval Research
Contract NOnr 474(11)
Principal Inve stigator:
Kenneth R. Lawless, Professor
Department of Materials Science
SThesis submitted to the Graduate School of the University of Virginiain partial fulfillment of the requirements for the
degree of Doctor of Philosophy
Reproduction in whole or in part is permitted for anypurpose of the United States Government.
Division of Materials Science
RESEARCH LABORATORIES FOR THE ENGINEERING SCIENCES
SCHOOL OF ENGINEERING AND APPLIED SCIENCE
UNIVERSITY OF VIRGINIA
CHARLOTTESVILLE, VIRGINIA
Report No. MS-3531-102-66U
March 1966 Copy No. i-

ACKNOWLEDGEMEN TS
The writcr wishes to thank Dr. Kenneth R. Lawless
for his encouragement and many discussions throughout
this work.
I am also deeply grateful to the late Dr. Allan
T. Gwathmey under whose guidance this work was started.
The assistance of Mr. A. W. Norvelle in the initial
preparation of samples is gratefully acknowledged.
I would also like to thank my fellow students for
their assistance.
The writer acknowledges the support of this work
by the Paint Research Institute and by the Office of
Naval Research,
Don Frederick Mitchell
University of VirginiaCharlottesville, VirginiaSeptember, 1965

TABLE OF CONTENTS
page
H . x aistori o nal .......... . . . ...... ....
I.I Ssx,trim nt. 1. * ... aA.Oxi,'atio Apparatus ... o.... ... .
•.1 System A .......... .. o..........o....... it
2. 3y3tem B ....... J. ........ . ....... .. .. 4B. Sam-le Preparation.......o................ 17
C. Exn rimental Procedure.....o.............. 20i. System A .. . .2. o . . .. . . a .
2. System B ........... o.... o ....... *..I
D. Sur ace Examination ................... .. . '29
1. Electron Diffraction.................. 29
2o Op4;icalMicroscc,•c.2)
". Electron Microscopy0... 5.
4. Electrometric Reduction............... 31
5. Interferometer........................ 32
IV. Results ............. ............ ....... 34A. His-ory of Sampleo.. .......... 34
B. Indiction Period. . . . *....... ... 36C. Mor-.hology and Epitaxy................... 39
1. (I'l) Face .......... .9
2. (001) Iae•ll
3. (110) Face ............................ '411 . ( 3 11 1 ) F a c e .. . .1 -'
D 2 To. traphyl S c.............. ........... o8
1. oxide Nuclei........................ 612. Metal S r a e57
E . Density .............. .0- - *. -.. . ......... . 57
F. Stripped 6ul i. .. ... . .. . . . .. . 1
G. Thermal Faceting .......................... 65
H. Oxi•le Strain...... . ........ 64

I. Unuial Diffraction aesults . .-.
I. ,dsorption Strucrvs .s . ... . . . ..... .2. ,Upr rStructures .7 ... **
2.I
1.. -thod of Calcul iti . ....... .. ... .
2. t, n ( f vcasur e::ic Ite..% . . . . . 81. ....
3. 1ressurc Depende-c....... 5
4. Tem'!craturc Dece
5. fiin" Dependence.......................86K. Electr.'nctric R duction .................. (,.
L Oxv, .. Solution. . .
M. Oxid:ition of Thin 'ilrs . . ... .. . . .. ... 914
N. Contamination........... ..... ...... 98
V. Discussion ............... ................... 102
A. Topography .......... 12
i. Thermal Faceting ................... 102
2. *'ensity of Oxide Vclei.............. 10:
.fovngraphy of Oxide Nuclei and
Surrounding Metal ............. . ...... 1f"
B. Structure ........... ................. 115
1. "dsnrptioaStructures................. 115
2. D)iffracticn Patt-r",s Corresronding
t,, Large Lattice P:arameters .......... J17"- Epi taxy............ .... 122
C. Kinetics ofxidation................ 127
1. iautle Shae................... ..... . 1272. Induction Period ........................ ,
';. "cleation and Growth Period ......... 1'6
VI. C1nclusions............................140
VII. Bibl iogranhy..... .... .144

iI
i. iNTrODUCTION
The critical investigation of the mechanism of oxida-
tion of metallic surfaces is warranted by the rapidity of
the destruct~on by oxidation of man-made metal structures.
Although these investirations have been carried out for
many years, oxidation theory is still in a rather unsatis-
factory state, with only a few theories, applicable to
very specific conditions, which seem to be valid. These
theories have assumed that a continuous, homogeneous oxide
film was formed on the surface initially, and that the
rate of further oxidation was governed by the ability of
the reactants, including electrons, to travel through
this layer of reaction product. These theories were thus
concerned with the forces which influence diffusion
through metal oxides. In 1951, Bardolle and Benard (i)
showed that the reaction product did not always form as
a continuous surface layer, but under suitable conditions
formed as discrete islands, which they called germs, on
the surface of the metal. This phenomenon has now been
observed to occur on several metals (Ag, Cd, Sn, Fe, Cu,
Cu-Ni, Mg) under a wide range of temperature, pressure,
and oxidizing specbele.
It was with the knowledge of the wide occurrence of
the Dbnomenon of nucleation of surface oxides that this
work was undertaken. The objective of this research was
Lit

to determine the mechanism of thp low pressure thermpl
oxidation of copper, from an investigation of i) the
oxide and metal topography, 2) the structural rrlation-
ships of oxide and metal, 3) the kinetics of the nuclea-
tion and growth of the islands of reaction product
(nuclei). The system, copper plus oxygen, was "hosen
for study for two main reasons. One was that it had
recently been shown that nucleation of oxide occurred
on copper over a wide range of easily obtainable condi-
tions (2, 3). The second reason was that conper had
previously been used for oxidation studies in this
laboratory and techniques had been developed for th•
preparation and handling of large single crystal samples.
-'AV

3
TT TI U OMAD T^ A TAi A Al L 0 A IL'.,L %t
In 1951, Bardolle and Benard (1) demonstrated the
procesu of oxide nucleation on metal surfaces for the
first time. In this study, oriented oxide nuclei were
obtained on iron surfaces at temperatures of 8500 C and
oxygen pressures on the order of 10-3 torr. It was
shown also that crystal face played an important role
in both the oxide morphology and the number of nuclei
of oxide formed per unit area.
In the same laboratory, in 1955, Gr5nlund (4) showed
that similar results could be obtained on copper. Oxide
nuclei were observed to form at temperatures from 3000 C
to 9500 C in oxygen pressures from iO-3 torr to I torr.
From his observations, Gr*nlund (2) divided the process
of oxidation into three stages: 1) induction; 2) nuclea-
tion; 3) growth. The first stage, induction, referred
to the time between first contact of the metal with
oxygen and the first appearance of oxide nuclei on the
surface, as observed with che optical microscope. At
the end of this induction period many nuclei appeared
on the surface simultaneously, representing the second
stage in the process, nucleation. The number of these
nuclei per unit area of surface remained constant with
time as the nuclei grew laterally over the surface with
little thickening, until the surfacc was covered, after
I

4
which the oxide began to thicken. This lateral growth
represented the third stage of the process. Figures la,
ibt to show some of the important characteristics which
were observed by Gr5nlund. These include:
i. The number of oxide nuclei/cm2 was a function
of crystal face.
2. The number of oxide nuclei/cm2 was greater the
lower the p:t're.
3. The number of oxide nuclei/cm2 was less the
lower the pressure.
4. The duration of the induction period was greater
the lower the pressure.
Figure id shows the model which Grbnlund used to
explain his observations. In this model the first step
in the oxidation process was the formation of a "primary
oxide" film over the surface. Oxide nuclei which have
preferred epitaxial relationships with the metal substrate
grow out of this film. It was suggested that these
"secondary" nuclei grow by surface diffusion of the
"primary oxide" to the periphery of the preferentially
oriented oxide :auclei. No attempt was made in this model
to define the diffusion species exactly; however, it was
indicated that both the oxygen and the copper atoms
diffused over the surface to the nuclei. The nature of
the "primary oxide" was not described by Grbnlund;
* -m -

5
ov ..n in
ao 0W
11 II-.S" . .c/,o • u'
_ • o

however. B6nard (5) described it as a nolvcrvstalline
disoriented oxide film.
Gr~nlund's model postulated the concept of a rndius
of influence associated with each nuclei. V'ithin this
radius new nuclei did not form because diffusion of the
"primary oxide" to the existing nuclei reduced the
probability of formation of additional nuclei.
With the use of the approximation that the radius
of influence is proportional to tje diffusion constant
for surface diffusion of the "p7 .mary oxide", the acti-
vation energy was determined for diffusion on the mnjor
crystallographic faces. These values which represent
the slope of an Arrhenius plot of the logarithm of !Ae
density of nuclei versus the reciprocal of the absolute
temperature are
(111) (lOO) (I1o) (311)
8 kcal 23 kcal 10 kcal 13 kcal
In the work of Menzel (6), an activation energy
value of 13.2 kcal for the surface diffusion of copper
in the presence of a law (/10-i torr) oxygen pressure
was obtained. This value was determined for an orienta-
tion in the vicinity of the (i1o) face by annealing of
facets and is in agreement with Grenlund's value for
surface diffusion during oxidation on the (Ito) face
listed in the above paragraph. This agreement would

J1
sunnort the contention of 11head (7) that the cozit1k I I
process in . termining the density of nuclei is th,
surface diffusion rate of copper.
In 1957, Harris, Ball, and Gwathmey (7) reported
the occurrence of large nuclei ,'ithin a thin film of oxide
when copper was oxidized at 1500 C and 1 atm. The condi-
tions are quite different from the above experiments but
seem to indicate that the nucleation process may be
important even at atmospheric pressure.
In this regard, Ronnquist (8) studied the kinetics
,he initial stages of the oxidation of copper in the
170* - 5000 C range at pressures from 10-3 atn to I atm.
"-'4r these conditions considerable cupric oxide was
formed along with cuprous oxide. However, according to
the author, nuclei were produced and the %inetics were
Ito obey a Qn = kt law in which Q is the quantity
of oxide formed and n is a function of temperature which
varied from .6 at 4700 C to 2.5 at 1700 C.
G. Van Der Schrick (9) studied the kinetics of the
oxidation of copper by microbalance techniques under
conditions of nucleation and continuous film formation
on polycrystalline samples. Although most of this work
was for continuous films formed at high oxygen pressures,
a linear oxidation rate law was observed for the first02 c 2 02 2 o
few p g 02/cm (1 / g 02/cm= 150 A Cu 2 0) coverage under
nucleating conditions. G. Van Der Schrick (9) also
___________ I j

8
m..^ ,6.i th. I1rrnrnv hetween gravimetric data on
the uptake of oxygen by a sample and the electrometric
reduction of oxide on the surface that solution of oxygen
into the metal was significant under conditions for
nucleation, and thus, concluded that this was the explana-
tion for the induction period. This work was confirmed
by C. Van Der Schrick (10).
A discontinuous oxide was observed on single crystal
copper surfaces as early as 1954, by Menzel (ii). In
this work small single crystal copper hemispheres were
grown by assymetric cooling of a molten copper drop on
a tungsten ribbon. These samples were then oxidized in
the aame system without the need of first exposing the
copper surface to a foreign atmosphere. The growth and
form of the oxide nuclei which grew on these "untouched"
surfaces were observed continuously by an optical micro-
scope. The results of these studies were in agreement
with the observations of Grbnlund. More recent work by
Menzel and Niederauer (12) showed that the number of
nuclei was not a function of the dislocation density of
the copper substrate. In the same work, it was demon-
strated that the shape and density of the nuclei were
sensitive functions of contaminants.
Low energy electron diffraction has been used to
study an earlier stage of the oxidation process than
was possible with the techniques of Bfnard and Menzel.

i-iThis technique has been used by Lee (13), and 'Simmons (1,1)
to examine the initial stages of the oxidation of copper.
Both groups have observed an adsorption structurc, one
layer thick, on the (100) face before the formation of a
true oxide phase. This structure has a cell which is
based on the underlying copper lattice of dimensions
1 x Cu E10 by 2 x Cu E0] .
This structure was found to be quite resistant to further
oxidation at room temperature.
A more complete picture of the early stages of the
oxidation of nickel has been obtained by Farnsworth and
Madden (15). From combined low energy electron diffrac-
tion and photo-electric work-function measurements, they
postulated that on a clean nickel surfaee, oxygen is
initially adsorbed as O0, in which state it diffuses to
lattice defect sites where dissociation occurs. After
sufficient oxygen atoms have accumulated on the surface
by this process, a place exchange occurs. In this ex-
change, oxygen atoms occupy some nickel sites and some
of the nickel atoms are moved to the surface in a simple
periodic manner. WTith continued addition of cxygen to
this structure, it develops into a true nickel oxide.
The excellent work by Orr (i6) on the kinetics of
nucleation of oxide on magnesium should be mentioned.
He found that when oxygen was admitted to a clean

10
magnesium surface at liquid nitrogen temperature, the
oxidation rate first increased and then decreased with
time. This phenomenon was explained by a process of
nucleation of oxide islands, the edges of whiich were
much more reactive than either the metal surface in
between oxide islands or the tops of the oxide islands.
It was shown that, at liquid nitrogen temperatures where
surface diffusion rates are insignificantly small, if
oxidation was to occur, the incoming oxygen molecule
was required to hit the surface at the edge of the
oxide islands, react and form oxide at that site.
Others who have observed oxide nucleation and
growth on systems other than the copper oxygen system
are Gulbransen, Mc Millan and Andr'w (17) on iron;
Martius (18) on nickel; Menzel and Menzel-Xopp (19)
on silver; Boggs, Trozzo and Pellissier (20) on tin;
Bouillon, Bouillon-Nyssen and Stevens (21) on copper-
nickel alloys; Bouillon and Jardinier (22,23) on cadmium;
and Oudar (2', 25) on sulfurization of copper. Sufficient
kinetic data has not been obtained for any of these
systems to extablish a model for oxide nucleation and
growth.
(\

114
III. EXPERIMENTAL
A. Oxidation Apparatus
Two different vacuum reactor systems were used in
this research. These will be designated as system A,
which was used for the studies on spheres and thin films,
and system B, which was used for the studies on copper
slices. System A was designed to give samples for in-
vestigation by electron diffraction and microscopy,
while system B was designed to give oxidation rate data.
i. System A
System A is shown in the photograph in Fig. 2a.
The pumping system consisted of a 50 liter/sec, three
stage, oil diffusion pump (A) backed by a rotary mechani-
cal pump. The diffusion pump used "Octoil-S" in the
early part of this work. Later, however, this oil was
replaced by "Convalex-10". There was no noticeable change
in the oxidation results using the two different oils;
however, "Convalex-lO"1 gave less backstreaming and was
thus preferred over "Octoil-S". The diffusion pump was
trapped with zeolite (B) which was baked out at 400* C
periodically. The pressure above the trap was measured
by an inverted Bayard-Alpert type ionization gauge (C)
and a Consolidated Electrodynamics Coip. residual gas
mass spectrometer, type 21-613. A Veeco, 5/8 inch
stainless steel valve (D) with teflon seat separated
~ - ~ _ _ - -- - - - - - - _ __ _ _ __ _ _
• m mm umm • m lm m l w m • rM • • • • • m m •im m m •• ~

12
-(b)
(a) (b)
(c) (d)
FIGURE 2
(a), (b) SYSTEM A AND ITS REACTION VESSEL AESPECTIVELY
(c),(d) SYSTEM B AND ITS REACTION VESSEL SHOWINGPOSITION OF PYHOMETER
i . •

the reaction section (E) of the system from the diffu-
sion pump. All of the reaction vessel (Fig, 29) which
was heated by a surrounding resistance furnace was made
of vycor glass. The reaction vessel furnace was operated
by a Minneapolis-iUoneywell, 0-i0000 C, Py-r-O-Vane con-
troller. The thermocouple for the controller was placed
at the top of the inside tube of the reaction vessel.
As a check, a thermocouple was placed inside a hole
drilled in one spherical crystal and the reaction vessel
top was modified so that the thermocouple leads could
be gotten out of the vacuum system and to a potentiometer.
The two thermocouples gave the same value within the
ability of the controller to regulate * 50 C. The
remainder of the system was composed of small lioke stain-
less steel valves (G) for gas handling and an ultra-high
vacuum leak valve (F) (Granville-Phillips), for control-
ling the oxygen pressure. A Pirani gauge was placed as
near as possible to the reaction chamber. The system
was regularly pumped to 2 x i0- 8 torr at the ionization
gauge; however, with the mass spectrometer operating,
pressures were generally an order of magnitude higher.
The pumping speed at the sample was calculated from
pressure drop data to be .73 liters/sec at the crystal
and about 3 liters/sec at the ionization gauge location.
After characterizing the gases in this system, the mass
spectrometer was permanently installed on system B. An

14
analysis of the residual gases in system A is given
in the section on experimental procedures (Ill-C-1).
Z. System B
System B, shown in Fig. 2c, was used primarily to
obtain kinetic data. It was of the bakeable ultra-high
vacuum design. During bake-out at Z50o C, the system
was pumped through a Granville-Phillips type "C", ultra-
high vacuum valve by an oil diffusion pump backed by a
mechanical pump. After bake-out, the system was valved
off from the diffusion pump and pumping continued by an
8 liter/sec Vaclon sputter ion pump, through a Varian
ii inch bakeable ultra-high vacuum valve. Hydrogen was
admitted through a Granville-Phillips type "C" valve and
oxygen through a Granville-Phillips leak valve. The
system was also equipped with a Pirani tube for accurate
pressure measurements. This Pirani circuit is described
below. The system regularly pumped down to less than
10-9 torr after bake-out as determined by the ion pump
current.
The sample was heated to the desired temperature
either by a i KW (Lepel) induction heater or by a resist-
ance furnace. The temperature of the sample was deter-
mined by an infra-red pyrometer (Infrared Industries,
TD-6) when using the induction heater. The pyrometer
was coupled to the induction heater so that the sample
temperature was automatically controlled to ± 20 C. To

i Idetermine the sample temperature accurately, the emis-
sivity of the sample and the effect of the pyre 'iat
through which the pyrometer saw the sample had to be
known. Since the emissivity for copper was very lou,
the experimental arrangement shown In Fig. 2d was used.
The silver coating on the top outside of the reactor
chamber increased the apparent emissivity through mul-
tiple reflections between tha sample and the silver
mirror. By placing a thermocouple in a dummy copper
sample and calibrating the pyrometer against the thermo-
couple, an effective emissivity of .11 was found for
this geometry. When using the resistance furnace, the
temperature of the sample was determined by a thermo-
couple placed outside the vacuum wall opposite the
sample. This thermocouple was connected to a Minneapolis-
Honeywell Pyr-O-Vane controller which maintained the
desired temperature.
For recording pressure changes in system B, a
specially designed electronic circuit was built to
operate a standard glass incased Pirani tube (National
Research Corporation). The power supply, regulated by
a zener diode, delivered 2.1 V DU to a wheatstone bridge
network. One arm of the bridge contained the Pirani
tube and another arm contained a variable resistor for
balancing the bridge. All resistors in the circuit
had minimum tempernture coefficients. A high impedencr,

16
1 mv full scale maximum sensitivity (Sargent) strip
chart recorder was used to indicate the bridge imbalance.
Calibration of the Pirani circuit was made against
two different Mc Leod gauges and a sensitivity of
3.7 .1 volt/torr for oxygen was obtained with the
Piranl tube envelope at room temperature. Using the
strip chart recorder having 00 divisions per 1 my, this
gave a maximum sensitivity of 1.34 x 10⁻⁶ torr/div.
There was some drift in the circuit zero which was traced
to temperature fluctuations of the Pirani tube envelope.
The Pirani tube envelope could be immersed in an ice
water bath. This had two desirable effects: first,
it reduced the zero drift; and second, it increased the
sensitivity. However, since it also increased the
response time of the instrument, for this work, the tube
envdlope was kept at room temperature.

B. zample Preparation
Three different types of single crystal samples
were used in this work: spheres, slices, ano thin films.
all made from American Smelting and Refining Cc. 9ý).'99';
copper. The single crystal spheres were turned on a
lathe from 3/4 inch single crystal rods to a sphere
5/8 inch in diameter, generally with two flat areas 3/8
inch in diameter of a particular crystallographic or! n-
tation, and with a stem 1/1 inch long and 1/4 inch in
diameter. These samples were etched in a 5ov nitric
acid, 5% hydrochloric acid solution to remove the coiu
worked surface layer. The orientation of the flat areas
on the spheres were then examined by Laue back reflection
x-:ay diffraction. Any faces found to be off of the
desired orientation by more than two degrees were cor-
rected by additional machining and repetition of the
etching procedure. (26)
Single crystal slices, 5/16 inch thick ;,nd -''; inch
in diameter, were Iiewise cut from the 3/4 inch, ,O).()99.-l
rods, and a small hole was drilled off center in the
samples. These samples were then glued to the head of
an acid polishing wheel of Young's design (27) and the
surface was polished down 1/16 inch. The glue was then
dissolved and the slice remounted, and 1/16 inch was
removed from the other side, This gave a slice, 1/16
inch thick which showed no evidence of deformation in

the back reflection Laue X-ray diffraction photo-
graphs.
The thin film samples were prepared by evaporation
of cop-cer .'rom a tungsten basket onto a freshly cleaved
(100) rocký,alt substrate heated to 3300 C in a Varian
400 liter/see vacuum evaporator at a pressure of less
than 10-7 torr. This gave continuous (1WO) oriented0 0
films, 500 A to 1000 A thick. (Fig. 3a, 3b) The majoricy
of these sampJes were oxidized while on the salt substrate
with no additionial preparation given them. A few films
were removed from the rocksalt by floating onto distilled
water. These films were then mounted on copper electron
microscope grids for oxidation.
-

W&VUB Aw-19
AA
(a)
(b)
FIGURE 3
(100) COPPER THIN FILU' AS GROWNIN(a) Transmission electron micrograph(b) Transmission electron diffraction pattern
t4

C. Experimental Procedure
1. System A
Single crystal spheres for oxidation in system A
were originally prepared and polished as described in
the preceding section. Prior to an oxidation, a sphere
was polished using 1/0 through 4/0 metallographic emery
paper followed by a final mechanical polish with 1 /-
alumina on a wet felt polishing cloth. This mechanical
polishing treatment, which gave the surface a mirror
finish, was followed by an electropolish in a 65% ortho-
phosphoric acid bath after the method of Jacquet (28),
The polishing conditions wep modified somewhat in that
the bath was heated to approximately 500 C and stirred
by a magnetic stirrer as vigorously as possible without
drawing air bubbles into the polishing solution at the
vortex. fhese modifications allowed the bath to operate
at higher voltages (r-•- 8 V DC) and current densities
(r .1 amp/cm2 ) than could have otherwise been obtained
without producing gas on the sample surface. These modi-
fications pcrmitted a considerable reduction in the time
necessary to remove a specific amount of copper from the
sample without affecting the quality of the polish.
After electro-polishing, the sample was washed in 10%
orthophosphoric acid for 30 seconds and then in high
purity distilled water for 5 minutes or 18 megohm demin-
eralized water for 10 minutes. The sample was then
- - --- --

21
4lown dry in a stream of dry nitrogen and placed in
the vacuum reactor system.
Often it was not necessary to do any additional
mechanical polishing between experiments. In these
cases, after examination in one experiment, the sample
was electropolished for 5 minutes in the phosphoric
acid bath, washed, and dried as described above.
After drying, the crystal was placed in the reaction
ressel whicdi vas then evacuated to 10-5 torr or better,
flushed with hydrogen (Matheson Cc., Ultra High Purity
grade 99.9991) and refilled to one atmosphere with hydrogen.
Then, with a flow of hydrogen of approximately 20 cc per
mlnute, the crystal was heated to 5000 C if the planned
oxidation was to be carried out at a tezperature of 5000 C
or lower. However, if the oxidation were to be carried
out at a higher temperature than 500* C, the crystal was
heated to that higher temperature in flowing hydrogen.
The ?rystal was usually annealed for one hour in the
hydrogen flow, although in some experiments the time was
as short as ten minutes and in others as long as 24 hours.
This variance appeared to have no effect on the results
obtained. If the oxidation were to be carried out at
less than 5000 C, the crystal was cooled in flowing
hydrogen to the oxidizing temperature. After a 15
minute wait to permit -hermal equilibrium to be obtained,
the system was pumped out and the crystal annealed in
____ ___ ___ ____ ___ __ ____ ___ ~f
.. . - a r i -• -m n I I lN JJtJ I • nm i4jai n • .

22
a vacuum of 10-6 torr or less in the case of low tem-
perature oxidations. it was observed in t .is syst-em
that with crystals above 5000 C, it took progressively
longer times to obtain the same pressure during annealing
for progressively higher temperatures. The time of
vacuum annealing, which was varied from ./2 hour to 24
hours, was not observed to affect the results obtained
in system A. A sample mass spectrograph analysis of
the gas composition during outgas is listed below:
N2 + CO 35% A .5%
H20 35% C02 i%
H2 20% hydrocarbons .05%
210%
After the vacuum annealing period, oxygen was leaked
into the reaction vessel while continuing to pump the
vessel. In this way, a constant flow of pure oxygen
could be maintained.
In the earlier experiments, tank oxygen purified
through a silver leak was admitted to the reaction
vessel through the leak valve. In later experiments,
oxygen from Matheson Co. reagent grade I liter glass
flasks was used in place of the silver leak purified
oxygen. The oxygen from these two sources was of at
least 99.9% purity; however, desorption from the system
walls resulted in considerably less pure nxygen in the
I . . . . . . . . w • • s • w • • m • •

23
reaction vessel. A typical mass spectrograph analysis
+h ^he nv•4d7ing amnnsphere wan fnund tn be:
02 97.5% CO2 .2%
H2 0 1.3% A .02%
N2 + CO 1.0% others < .005%
To stop a reaction, the oxygen supply was cut off
and the furnace removed from around the reaction vessel.
In some experiments the crystal was allowed to cool in
vacuum. In other experiments, as soon as the oxygen
was pumped out, the valve to the pump was closed and
Matheson research grade helium was admitted to a pressure
of 2 - 5 torr. A blast of cool air was then directed
through the hollow center tube of the reactor. The helium
was admitted to the reaction vessel to improve the thermal-
contact between the reactor walls and the crystal, and
the blast of air helped carry the heat away from the re-
actor walls. This procedure yielded a cooling rate of
approximately 1000 C per minute at 4000 C compared to a
rate of 70 C per minute in vacuum.
After cooling, the system could be filled, if
desired, with dry nitrogen to atmospheric pressure and
the crystal removed for examination by electron diffrac-
tion. (See section on surface examination.)
2. System B
Single crystal slices prepared as described in
01-t

24
Section B above were electropolished, washed, dried, and
polished in the same manner as the spheres. They were
then placed on a pyrex frame which was positioned in the
end of the reaction vessel below the silver mirror. The
reaction vessel was bolted to the system which was then
evacuated via the oil diffusion pump and baked at 21500 C
for four hours by lowering a large hood, which contained
electric heaters, over the entire system. After baking,
the hood was raised, the ion pump started, and the system
closed off from the diffusion pump. When the system had
cooled to room temperature and reached a pressure of less
than 5 x 10⁻⁹ torr, the sample was heated by the induction
heater and given a hydrogen anneal and outgas treatment.
The hydrogen anneal and heat treatment before oxidation
iwr-'r found to affect the results and several different
procedures were used in an attempt to determine the
cause. (See Sec. IV.-A.) After the annealing treatment,
the sample was allowed to cool to room temperature, The
ion pump was then closed off from the system and approxi-
mately 10-3 torr of oxygen admitted to the reaction vessel
by opening the leak valve momentarily. This gas was
partially adsorbed by the walls of the system, causing
the pressure in the system to decrease. The process of
this adsorption could be followed and recorded by the
Pirani circuit and strip chart recorder. If necessary,
additional samples of oxygen were admitted to maintain
lu
kWK

25
the pressure at the desired value.
After approximately I hour, the system walls appar-
ently became saturated with oxygen aid ceased to adsorb
gas. The system was then evacuated. It was found that
pumping alone would not remove this gas from the walls,
since when gas was readmitted, no further adsorption
cecurred. If the system were rebaked, however, the walls
would again adsorb gas. This saturation of the walls
was necessary so that when the oxidation of the copper
sample was started the results would not be complicated
by the adsorption of gas by tb- 'vstem walls.
After the system had equ 2L'ia4,ed and the excess
gas was pumped out with the ion pump, tie sample was
reheated to 6000 C and then cooled to the temperature
of the oxidation. The ion pump was again closed off
from the system and the oxidation started by admitting
a quantity of oxygen via the lea!' valve to bring the
pressure to the desired value as indicated by the Pirani
circuit recorder. Wihen the pressure had dropped to
approximately 50% of its original value because of oxygen
take-up by the sample, more oxygen was admitted via the
leak valve to bring the pressure back to its original
value. A typical pressure vs. time plot, as taken from
the recorder, is shown in Fig. 4. This process was
continued for the duration of the experiment. Occasion-
ally, all of the gas was pumped from the system by
.. . ...... A

26
C*
z u
4*1.4
3 2
2 zw
-AMR--

27
momentarily opening the valve to the ion pump. This
action was taken to remove any impurity gases which
could have accumulated in the reaction vessel. Oxygen
was immediately reintroduced to the reaction vessel on
closure of the ion pump valve. Since the oxidation rate
remained at its previous value when oxygen was again
readmitted to the system, it was concluded that no large
amounts of impurity gases had collected and that the
momentary (30 sec) stopping of the oxidation did not
change the final results.
The strip chart recorder made a permanent record
"^f the system pressure during the entire experiment and
from this record the oxidation kinetics could be obtained.
After the sample had oxidized a desired amount, the oxygen
remaining was pumped out and the sample allowed to cool
in vacuum.
In some experiments, the sample temperature was
suddenly changed over a temperature range of ± 50° C.
It required only one or two seconds to increase the sample
temperature 500 C, but generally about a minute to cool
the sample the same amount. This technique was used for
obtaining oxidation rate measurements as a function of
temperature. It had the advantage that the measurements
were obtained from the same sample in the same surface
condition. However, there appeared to be a slight
hysteresis effect in the oxidation rate when the tem-
perature was changed by larger amounts and the technique

28
was used primarily as a check on data accumulated from
more than one experiment.

29
D. Surface Examination
1. Electron Diffraction
The first examination of the surface after an oxidized
sample had cooled was usually made by glancing angle high
energy (100 KV) electron diffraction. When the conditions
of oxidation were such as to give little or possibly no
true oxide on the sample, the sampIC was transferred in
a nitrogen atmosphere from the reaction vessel to the
diffraction apparatus. When it was known that the oxida-
tion had produced considerable oxide on the sample surface,
the sample was transferred in air. In either case, the
time necessary to transfer a cooled sample from one appa-
ratus to the other was less than 1 minute. Diffraction
patterns we photographed in major crystallographic
directions at various angles of tilt. From this informa-
tion, the epitaxial relationships of the oxide to the
metal could be obtained. Also, examination by electron
diffraction served as a sensitive check for contamination.
If a contaminant was present on the surface in sufficient
quantity, it could be identified from its diffraction
pattern. Usually sufficient contaminant was not present
to produce a diffraction pattern. However, the presence
of a contaminant could still be detected because it would
cause unusual epitaxy in the oxide which could be observed.
2. Optical Microscope
After electron diffraction examination, the crystals
~ -

30
were examined optically with a Rausch and Lomb Balphot
Mctallograph. When nuclei or other features were large
enough to resolve clearly, optical photographs were taken
of the surface. Often, however, the Purface was too
smooth to focus upon and higher resolution microscopy
was necessary.
3. Electron Microscopy
In order to obtain higher resolution photographs
of the surface features than were possible with optical
microscopy, a platinum shadowed carbon replicL technique
was used to oltain suitable sample for examination in
the electron microscope. Three different replication
techniques were used in this work. In the earlier
experiments, platinum was preshadowed from a 40 mil
tungsten filament onto the copper specimen at a 200
incident angle. This was followed by the evaporation
of carbon onto the sample at a high incident angle.
This replica was then removed from the copper by a 10%
ammonium persulfate, 2% ammonium hydroxide solution which
slowly dissnlved the underlying copper oxide and copper.
Because of the slowness of the ammonium persulfate
stripping solution, a second technique was developed
which ustd a 2% potassium cyanide solution for removing
the replica, However, the cyanide solution attacked
the platinum shadowing material and the resolution of
the replica was not good. To remedy this difficulty,

31.
the platinum was shadowed onto the sample after some Iof the carbon had been depositec and then the rest of
the carbon was applied. In the final stages of this work,
a third technique was used in which the platinum was
deposited simultaneously with carbon from commercially
prepared platinum impregnated carbon pellets. This was
followed by an additional layer of carbon deposited at
a high angle as in the two earlier methods. These
changes were made in the replication technique as a
matter of convenience and to save time. All three of
the techniques appeared to give identical resolutions.
The electron microscope used for these studies was
an RCA EMU-3B with double condeuser. A 50 KV electron
beam was used for all replica work; however, the oxidized
copper thin films were examined directly using 100 KV
electrons.
4. Electrometric Reduction
A large percentage of the samples upon which kinetic
measurements had been made were, after cooling, electro-
metrically reduced by a method first developed by Evans
and Miley (29) and improved by Allen (30). This was
done as a check on the amount of oxygen taken up by the
sample and in an attempt to measure any solution of oxygen
into the sample which uight have occurred. A de-oxygenated
solution of .1 N KC1 in distilled water was used as the
electrolyte and a current density of .1 milliamperes
JCZWon-___________-
-
b~

32
per square centimeter was used to reduce the oxide. A
reference elentrode was connected to a Keithley electro-
meter and the cutput from the electrometer fed into a
strip chart recorder which thus plotted the reduction
curve.
5. Interferometer
A Zeiss interferometer was used to obtain the
profile of the surface across an oxide nucleus. A
difference of elevation of two odjoining surfaces of as
little as 300 A could be detectea with this instrument
by measuring the displacement of interference fringes
on the surface. This surface profile was used to comple-
ment the data obtained from shadow measurements on
replicas in the electron microscopc.
6. Isolation of Oxide Nuclei from Copper Substrate
A method of isolating the copper oxide nuclei from
the copper substrate without apparent attack on the
nuclei, which was developed by Beck and Pryor (31), was
used in this work on several occasions. It was used to
isolate the surface oxide from the copper metal for
direct observation in the electron microscope, The
system required absolutely anhydrous conditions and the
"stripping" was thus performed in a closed system.
Methanol was used as the solvent and ammonium acetate
as the complexing agent which dissolved the underlying
-• __•- -. • • • n, • m m m - -•• m m h

33
copper without attacking the oxide. If, however, any
water was present, the oxide was also dissolved. Before
"stripping" the nuclei f£om the surface of the sample,
a carbon film was evaporated onto the sample to support
the nuclei after they were removed from the metal.
This also had the advantage that it gave a faint replica
of the nuclei before they were placed in the solution.
Thus, if any attack on the nuclei had occurred duAing
stripping which changed the size of the nuclei, it could
be detected when the stripped samples were examined in
the electron microscope.
;L-

34
IV. RESULTS
A. History of Sample
The previous history of the copper samples to be
oxidized was found_ to be an important variable in this
work. This appeared to be due primarily to the solu-
bility of various gases in copper. In system A, the
high ultimate pressure, as compared to system B, coupled
with the hot reaction vessel walls made detection of gas
solution in the sample impossible. However, in system B,
with an ultimate pressure of less than 10-9 torr and the
capability of rapid heating of only the sample, the
evolution of dissolved gases was readily observable.
Copper samples that had been previously oxidized
at a high temperature were re-electropolished and re-
placed in system B for the next experiment. These samples,
when heated to 6000 C in a vacuum of less than 10-8 torr,
evolved no measurable amount of gas. If such a sample
was then annealed at 6000 C in a few torr of hydrogen for
a few minutes and the reactor again pumped-out, large
quantities of water vapor were evolved from the sample
along with hydrogen gas. The quantity of water vapor
was so large that its adsorption on the system walls
prevented the previous low pressure from being obtained
until after the entire system had been rebaked. After
baking, a repeat of the hydrogen anneal an-d utgassing

35
gave only hydrogen and little or no detectable water
vapor. The rapid pumping of hydrogen by the ion pump
permitted pressures of 10-9 torr to be obtained as soon
as the sample was allowed to cool without rebalcing the
system. At 6000 C the dissolution rate of hydrogen from
a saturated sample was quite rapid, being initially about
10-4 Ag/cm sec. It required about 1/2 hour of out-assing
at 6000 C to reduce the dissolution rate of the dissolvedhydrogen to 4 x 10⁻⁷ 2
h1 g/cm sec. The dissolution rate was
found to change by about a factor of two for a 250 C
temperature change. However, temperatures greater than
6000 C were not normally used for outgassing because of
the evaporation of the sample. For -inetic work in
system B, the samples were outgassed to this extent but
samples in system A could never be outgassed to such a
low value.
________________ -__________ -- .06

36
B. Induction Period
The period of time after oxygen was admitted to a
clean outgassed copper surface, and before arn oxide phase
was detectible by glancing angle electron diffraction,
is referred to as the induction period. This induction
period was found to be a function of temperature, pressure,
and crystal face. Figure 5 shows the effect of tempera-
ture on the duration of the induction period for the (ill)
face in System A. For a given temperature, it was found
that the induction period was inversely proportional to
the oxygen pressure in the range of i0- 3 to 2 x 10⁻² torr.
In the initial-experiments in system A, it was found that,
at pressures below approximately 10 torr, an oxide
phase did not occur on the surface regardless of the
length of time of the "oxidation". In System B, it was
found, however, that nucleation occurred at pressures
below iO-6 torr. This was taken as an indication that
the residual gases of system A reduced the oxide as fast
as it formed at oxygen pressures of less than 10-1 torr.
The induction period was found to be shorter for
the high index planes regardless of the conditions of
temperature and pressure. Figure 6 shows a sphere oxi-
dized at 8000 C at10- 3 torr which is nucleated on the
higher index planes but not yet nucleated on the (111>
and (iOo> poles. The order of appearance of nuclei on
the major crystallographic planes from the earliest to
the last was (311); (110); (iit); (100).

37
S" OXIDE (.)
I-. tNO OXIDE (,)
OJ3x Io'0
w
00
a 3X10
x
w 10X0
0)
~3XO
I
.3
. 3 "o0" 0 0
200" 300 40 500 600
TEMP (CC)
FIGURE 5
DURATION OF TIlE INDUCTION PERIOD IN TORR - SECAS A FUNCTION OF TEMPERATURE FOR THE (11]) FACE.

38
FIGURE 6
OPTICAL MICROGRAPH OF A 5/8 INCH SPHERE SHOWING
VARIATION OF INDUCTION PERICD WITH ORIENTATION
,L- -- ---. --- -- - - -- --
S*•m I •u m

C. Morphology and Epitaxy
The lateral shape (morphology) and orientation
(feltnxy) of thp nxidre nuclei on a crystal face is
governed by the surface and interf'acial enerties involved
and the mechanism of growth. The configuration which
is obtained is the lowest energy configuration compatible
with the method of growth. Because of the symmetry
relationships of the substrate and the oxide, more than
one orientation is often obtained, all of which are
cruivalent from the interfacial energy viewpoint. At
this time, information about the factors determining
interfacial energies is insufficient to allow a com-
parison of experimental results with theory, For this
reason, this work is limited to reporting the morphology
and epitaxy observed,
1. (iii) Face
On a clean (111) face oxidized above 2500 C, two
equivalent orientations of oxide nuclei were formed, a
parallel orientation and an anti-parallel orientation
in which the [ITOJ metal axis was parallel to the [TO]
oxide axis. Both of these orientations appeared as
triangular nuclei on the surface. This is apparent in
Fig. 7. The two orientations were distinguishal' from
each other, however, in th.'t one appeared rotate, '00
on the surface with respect to the other orientation.
Another morphological feature was that nuclei of one of
-- -- - - At
$ '-

40
di;
4 4 v I)jli
~OOP
clC
A#At
if 0
~/, ~ ' *
Al *

41
the orientations grew much higher than the other and
that nuclei with this orientation grew at the expense
of the other. The taller nuclei were found from electron
diffraction to show the parallel orientation while the
other orientation was anti-parallel. Below 2500 C the
parallel oxide orientation was not observed.
Although the density of nuclei decreased and their
size increased with increasing temperature, the nuclei
retained their general features (Fig. 7). With time,
however, the nuclei with a parallel orientation, which
started growth as regular triangles, tended to become
quite dendritic in character (Fig. 8) apparently because
of multiple twinning of the oxide and the presence of
neighboring oxide nuclei.
2. (001) Face
On the (001) face there occurred four equivalent
orientations of oxide nuclei with the (111) Cu2 0oI (001) Cu.
The following axial rel-tionships were determined:
f cu 2 0 [ITO] -Cu
F ITfJ cu 2 0 [TIo1 cu
7tii cu 2 o (ITO] cu
[11o] CU2 0 11 [17,01 cu
These nuclei grew as right triangles, each triangle
having its hypothnuse parallel to a <110> direction
in the (001) plane of the metal. Nuclei of this type
ki
S.. . . .. 2 - __ . + • . ... . . .. . ... . . . .. .. . . . . . . . . . . . . . . .. . • • 1 * . . . .

42
C~CD
L:.
7 -M
- -lop,
-J-4

--hown in Figs. 9a and 9b.
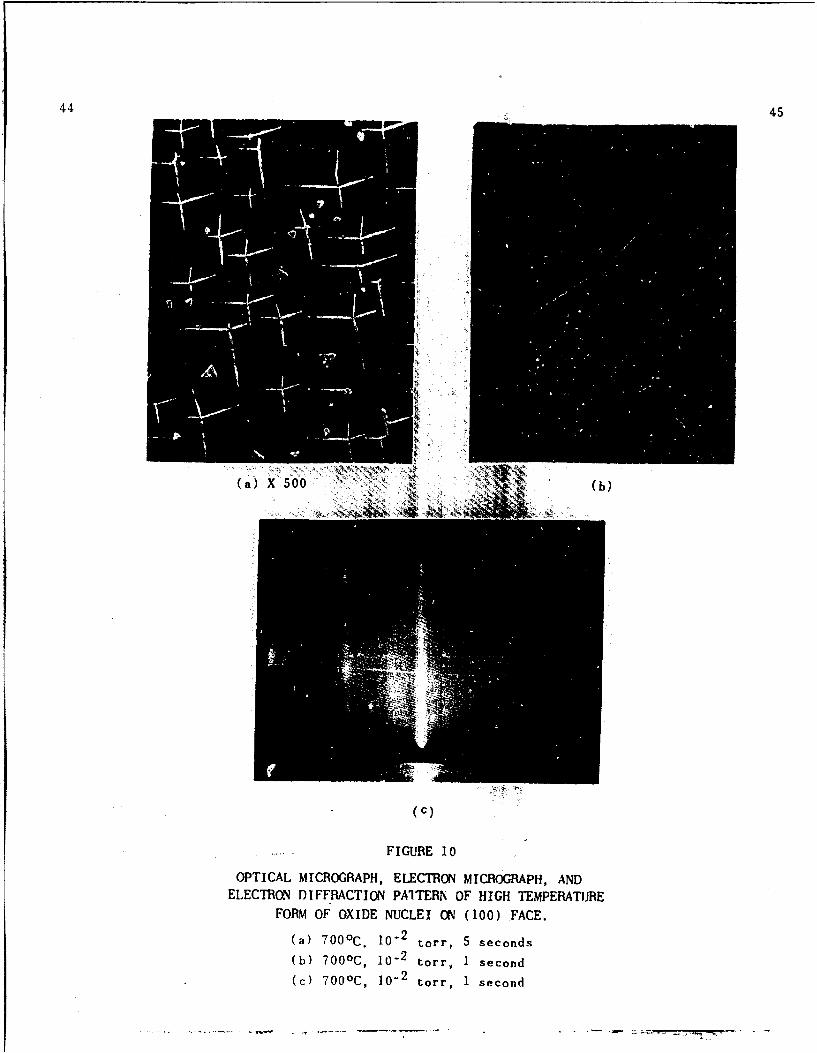
At temperatures above 6000 C and pressures of
approximately 10-9 torr, another shape oxide nucleus was
observed along with the low temperature form. These
nuclei, as seen in Figs. iOa and lOb, consisted of four
rods growing with their long axis in the (710> direction
from a common point. However, the rods were not connected
at this point but left a low mound about .5,U across
between the nuclei instead. The rods were not of equal
length, as can be seen in the photographs (Figs, iOa and
lOb), due to the fact that the face is slightly off the
(001) orientation. The electron diffraction pattern
taken in the [100] direction of the metal showed the
following epitaxy, (510) Cu2 0 I1 (001) Cu (Fig. 10c).
Four equivalent orientations would be expected from
symmt;ry considerations and each is represented by one
of the arms of the nuclei.
3. (11o) Fac,
On the (110) face of copper the copper oxide nuclei
grew as rods with their long axis parallel to the [10ol
direction (Fig. Ila). The oxide was in the parallel
orientation (110) Cu2 0 I0 (110) Cu and [10o Cu2 0 1 [100] Cu.
4. (311) Face
On the (311) face, oxide nuclei grew in a dendritic
manner.as shown in Fig. ilb. On surfaces slightly off
4-
It

44
(b)
FIGURE 9
ELECTI3ON MICROGRAPHS OF OXIDE NUCLEI ON (100) FACE OF COPPER.
(a) 400 0 C, 10-2 torr, 5 minutes
(b) 700 0 C, 3 X 10- 4 torr, 10 minutes
44 45
(a X50 (b)
(C)
FIGURE 10
OPTICAL MICROGRAPH, ELECTRON MICROGRAPH, ANDELECTRON DIFFRACTION PAlTERN OF HIGH TEMPERATURE
FORM OF OXIDE NUCLEI ON (100) FACE.
(a) 700 0 C. 10- 2 torr, 5 seconds(b) 700 0 C, 10- 2 torr, 1 second
(c) 700 0 C, 10i 2 torr, 1 second

46
(a) X 100
(b) X 00 (c) X 300
Ilk FIGURE 11
OPTICAL MICRoGRAPH OF OXIDE NUCLEI
(a) (110) face, 600 0 C, 5 X 10⁻⁵ torr, 20 minutes
(b) (311) face, 500 0 C, 2 X 10⁻³ torr, 5 minutes
(c) (311) face, 5000 C, 10-3 torr, 30 minutes
--....- . .. ----'.a.. 7 -- _ .- - - , - --- -- -. . . . ....--- -.

47
tile (311) face the nuclei grew somewhat longer in the
direction normnl to the [311 pole direction. Thus,
when looking down on a spherical surfa-e, one is given
the impression of the nuclei arranged in circles about
the [31j pole. This is shown in Fig. llc.

'I
.. Oxide Nuclei
Several methods were available for determining the
tapographic features (profile) of the oxide nuiclei. The
simplest and most frequently used method utilized the
observation of replicz.s in the electron microscope.
Platinum shadowed carbon replicas of the surface were
made in the usual manner, except that the platinum was
evaporated in a known crystallographic direction and at
a specific, precisely known angle to the surface. This
was generally asimple procedure since the majority of
the samples that were used in this work were spheres
with both a (111) and a (io1) plane cut on their surfaces.
Since two different interplanar angles were possible for
these planes, 54044J and 1250161, depending on the specific
planes cut on the crystal, two different conditions for
simultaneously shadewing both faces of each crystal were
necessary. If the specific planes were (001) and (111)
with an interplanar angle of 540••1, then for a shadowing
angle of 200 the shauowing direction had to be appi,:A-
mately a [321] direction. The projection of the [321]
direction onto both the (001) and (III) faces is approxi-
mately 8° from the [ITO] direction. If the specific
planes were (ioo) and (i11) with an interplanar angleof 12516', the shadowing direction was approximately
a0233] direction. This direction was adjusted so that

49
the shadowing angle was 270 on each of these faces.
The projection of this direetion on the (100) fare is an
NV~.LJL d r W.&UIu'JA a~% A " 104V %A A &C&%'T, %,Sau &W %%
is now a <211) direction.
A slight modification of the above procedure involved
dispersing small (.801) polystyrene latex spheres on
the surface before making the usual platinum shadowed
carbon replica (Fig. 14a). This addition allowed a
much more accurate determination of the shadowing angle
(by measuring the shadow length of the sphere in the
replica) than the previous method where the sample was
aligned for shadowing by sighting along a 200 wedge.
In some electron microscopic examinations of the
replicas, it was found that the replica had broken and
the broken edge had curled over. In a few cases the
impressions in the replica from one or more oxide nuclei
happened to be right on tt rolled over portion of the
replica so that a silhouette of the profile of a nucleus
could be seen and photographed. Such a profile of two
oxide nuclei is shown in Fig. 12b. Observations of
this type provided good confirmation of profiles deter-
mined more indirectly from the normal replicas.
A Zeiss interferometer with a thallium light (7 = .27/p)
source was also used to determine the oxide profiles.
By measuring the displacement of the interference fringes
(Fig. 14b) along the surface, the altitude of any point
I

-C-
z
c'J
C:)
fei
,-70
I t I

51
could be determined. Because of the small lateral
magnification available in the light microscope, this
technique was limited to studies of large nuclei formed
at the higher temperatures.
a. (lit) Face
Figures 12a and 12b show an axample of typical
nuclei observed on the (111) face of copper when the
oxidation was carried out at temperatures of 3000 C or
less. The oxide nuclei were in the form of three sided
pyramids, two sides being steeply inclined to the metal
surface and the third side making a small angle with the
surface. The crystal faces on one of the -nuclei are
identified in Fig. 12a. The other nuclei are similar
except that they appear rotated 1200 according to the side
of the nuclei on which the high index plane is found.
Figure 12b shows a silhouette of the vertical cross
section to two of these nuclei. The faintly visible
nucleus in the lower left hand corne- of the figure can
be used to determine the direction of the cross section.
Figure 13a shows the two types of nuclei formed at
temperatures above 300* C with the planes of the parallel
oriented nucleus labelled. The tops of these nuclei
were frequently truncated by approximately (11i) planes.
The anti-parallel oriented nuclei which are also visible
in this micrograph are much too shallow to give any
indication of the planes from which they are formed.
!e
i I I I I I II I I I I I I I I4 .

k ~52
(a) (b)
(c) X 600
FIGURE 13
ELECTRON AND OPTICAL MICROGRAPHS OF OXIDE NUCLEI
(a) 4000C, 10-2 torr, 5 minutes
(b) 250 0C, 2 X 10⁻³ torr, 12 hours
(c) 8000C, ib) tori, 15 hours

h. 1100jFace
Figure 13b shows a typical micrograph of the nuclei
obtained on the (100) surface at all but the higher
temperatures and pressures. The indices assigned to the
various surfaces of the nuclei can only be considered as
approximate since the surfaces are obviously not well
defined. The nuclei obtained at high temperatures and
pressures as described in Section IV-C (Fig. 10) tended
to be bound by (110) surfaces.
2. Metal Surface
The topography of the metal surface in the vicinity
of the oxide nuclei was examined by the same techniques
that were used to examine the nuclei themselves. For
temperatures below 6000 C, the metal surface was not
detectably modified by the presence of the oxide nuclei.
Above this temperature, however, the metal surface was
noticeably affected by the presence of the oxide nuclei
for distances of as much as 30 microns (Fig. 13c).
Figure 14a shows a section of a nucleus on the (110)
face which has two latex spheres on it for use in deter-
mining the height of the various features while Fig. 14c
shows the development of faces extending onto the metal
surface from the edge of the same nucleus. Figure 14d
shows the tip of the same nucleus. The most striking
feature in both Fig. 14c and Fig. 14d is the appearance
of long facets, v ich are apparently (111) planes,
. .. - •.7

54
(a)(b
'p-
c1 /
(c) 01)fc,600,5X1-dor,2 iue
(d) 0110) face, 600 0C, 5 X 10⁻⁵ torr, 20 minutes

55
i4 extending in the [rit] direction of the copper. This
direction is perpendicular to the edge of the oxide
nucleus which runs iu the L00l direction of the metal.
The metal surface beneath the ozide nuclei could
be examined by dissolving the oxide nuclei with a short
rinse of dilute hydrochloric acid and then replicating
the surface. Figure 15 shows an idealized cross section
perpendicular to the axis of growth for the nucleus.
shown in Fig. 14, which was formed on the (1iO) face of
copper by oxidation at 6500 C and 2 x iW-5 torr oxygen
for one hour. The vertical stale has been expanded ten
fold for clarity.

J.Iju
UfA
FIGLUE 15
IDEALIZED CMOSS SECTION OF AN OXIDE NUCLEUS ON THE(1!0) FACE (NOTE DIFFERENCE IN iOR]IZONAL
.AND VERTICAL SCALE!

57
E. Density
The number of oxide nuclei per square centimeter
of surface, hereafter referred to as the density of
oxide nuclei, was found to be a strong functian of
temperature and oxygen pressure. The density was also
found to be slightly dependent on surface orientation,
but independent of time, once the nuclei had obtained
a size of approximately 1OLA.
Figure 16 shows the temperature dependency of the
density of oxide nuclei for the various faces of copper
studied for an oxygen pressure of 10-2 torr. The straight
liae fit of this data to an Arrhenius plot 4 ndicates
that the density of nuclei is determined by a simple
activation energy controlled process.
The density of nuclei was found to be directly
proportional to the oxygen pressure over the range of
10-2 - 1O-6 torr on the (ill) face. This relation is
shown in Fig. 17 for the (111) face of copper at 6000 C
(the reliability of the point obtained at W06 torr is
uncertain). The available data indicate that the same
relation is true for the other crystal faces studied
over the range of 10 - 10_ 3 torr for all temperatures.
The density of oxide nuclei was not a simple function
of time. When observed by the optical microscope, there
appeared no nuclei throughout the induction period. After
the appearance of the first nuclii, the density rose
I

ld
3- -
w50" 2000 300" 400" 5009 6000 700800 CI I I I I I I I,
o (310)
A, (III)
IOS III)o (BOO)
" (3311)
S110)
go~o
(100
-i I
z
i d * 3 1 1 )\110)
50 100)
2.5 2.0 1.5 1.0
FIGURE 16
DENSITY OF NUCLEI PER SQUARE CENTIMETER AS A
FUNCTION OF TEMPERATUBE FqR VARIOUSCRYSTAL FACES AT 10- TORB.
$

59
DENSITY (NUCLEI/cm2 )
VS PRESSURE (torr)
(I II) face - 600C /
IOY3 / /
i- 4ILInA
10-7-
A
1000 2 1I310 0 10 10
DENSITY (n/cm2 )
FIGURE 17
DENSITY OF NUCLEI AS A FUNCTION OF OXYGEN PRESSURE
FOR THE (111) FACE AT 6000 C. j

6o
very rapidly to a maximum value at which level the density
remained until the nuclei began growing together. As
adjacent nuclei grew together, the density of nuclei
decreased. When the surface was examined by replica
techniques in the electron microscope, however, it appeared
that at an earlier time in the oxidation, before oxide
nuclei could have been seen in the optical microscope,
there was a greater density of nuclei but that many of
these small nuclei disappeared before growing large enough
to be seen in the optical microscope. (See Fig. 8)

614
F. Stripped Nuclei
A few experiments were made o" polycrystalline
specimens under oxidation conditio. s which would produce
large isolated nuclei. The purpose of these experiments
was to remove these nuclei, unattacked, from the copper
gubstrate in an ethanol-ammonia acetate solution so that
they might be examined directly by transmission electron
microscopy. Figure i8a shows the oxide stripped from an
area of a polycrystalline copper sample in which the
grains have an orientation near (iii). The oxide nuclei
in the micrograph show Bragg extinction contours typical
of monocrystalline material, and electron diffraction
patterns confirmed that these nuclei were single crystals.
Higher magnification micrographs showed that the nuclei
were free of dislocations except at the boundary where
two nuclei had grown together. However, because of the
small size of oxide nuclei, dislocations which may have
been present in the nuclei as grown on the metal surface
could have been removed by climb after the nuclei were
removed from the metal. The micrograph also slows clearly
that the oxide nuclei are considerably thinner in the
center than at their edges. The dark regions in the
micrograph correspond to thicker oxide which formed along
a grain boundary in the eopper. The micrograph also
gives no indication of the presence of any oxide in the
region between nuclei.
"4.

62
(a)
(b)
FIGURE 18
(a)- TRANSMISSION ELECTRON MICROGRAPH OF STRIPPED OXIDENUCLEI FROM POLYCRYSTALLINE COPPER OXIDIZED AT
400 0C, 10-2 TORR, FOR 20 MINUTES
(b)- ELECTRON MICROGRAPH OF REPLICA OF THERMALLYFACETED (100) SURFACE, 500 0C, 10-3 ToRR,
30 MINUTES

63
G. Thermal Faceting
A by-product of the oxidation of copper at pressures
below iO3 torr and temperatures above 50CA C was the
development of facets on the metal surface. Figure 18b
shows the facets developed on the (100) face during the
induction period. Figure 27c shows a similar development
of (iii) and (100) type planar facets on a (311) copper
surface inder similar oxidizing conditions. The develop-
ment of thermal facets is also noticeable in the majority
of the electron micrographs of oxidations carried out
at 6000 C and above in this work. It is clear that the
major facets developed are always of the type [Iii or
10i , but the curvature of the edges of these facets
shows that some high index planes are also present.
____ ________ ______

64
H. Oxide Strain
It was possible in certain experiments to obtain very
precise measurements of the lattice parameters of the
oxide and of the metal by means of measurements of elec-
tron diffraction patterns. From these measurements, the
strain of the oxide could be determined. The conditions
necessary to obtain a suitable diffraction pattern for
such measurements were as follows: 1) temperatures
above 500* C, 2) pressures of 10-3 torr or less, and
3) oxidation time-. such that the crystal was at the end
of the induction period or very early in the nucleation
period. Under these conditions, the surface of the
sample was made-up of very shallow steps with extremely
smooth surfaces, apparently formed by thermal etching.
A typical micrograph of such a surface is shown in Fig. 18b.
The diffraction pattern from the smooth steps was
essential'y that of a two dimensional grating and consisted
of continuous straight lines normal to the shadow edge
of the crystal. These lines are obvious ia Fig. 19,
which shows a diffraction pattern from a (i1) face after
oxidation under the above conditions. Oxide diffrxactlcn
lines from a highly oriented cuprous oxide were also
present parallel to the diffraction lines from copper.
The strong intensity of the diffraction lines from copper
Indicated that either the oxide was present in patches
on the surface with bare metal between, or that the oxide

.V.
65
cli
FIGUF•E 19
GLANCING ANGLE ELUCTRON DIfFRACTION PATIRN OF
(111) FACE IN 1011) DIBECTIOM4. OXIDIZED AT A7000C, 6 X I0-3 TM2R, I MINUTE.

66
was extremely thin (on the order of 10 A). The smoothness
of the surfaces, as seen in the replicas, suggested that
the latter case was more likely.
The diffraction patterns were complicated by multiple
diffraction, in which a diffracted beam from either oxide
or metal acted as a primary beam and was diffracted
again. Most of the features of Fig. 19 can be explained
on this basis.
Lattice parameter measurements were made by measuriug
the distance between the vertical lines and converting
these to dhkl values by use of the diffraction camera
constant. The precision of the measurements in this case
was much higher than that normally obtained from spot
measurements in electron diffraction. Meosgrements were
made on diffraction patterns from bulk copper samples
which were either 1) annealed and thoroughly outgassed,
or 2) saturated with oxygen. These patterns ahowed only
df1Lraction lines from copper and the lattice parameters
for both samples were identically those of bulk copper.
Measurements were then made of %he uxide lines in
the diffraction patterns from (iii) samples oxidized at
500* C to 6000 C. using the ai.aauremeztts of the copper
diffraction line spacings ap an internal standard. The
d2 g0 and d4n values for the oxide were dotermined from
these measurements. This data is shown i0 Table 1.
The bulk values of the oxide parameters are also included

67
From this data it is seen !hat the oxide on the (111)
face is compressed laterally in both the [iEO1 and the
[2TT] direc(tions.
TABL E 1
Compression of Thin Oxide Film on (111) Face
Temp. of Spacing Measured BulkOxidation Determined Value (A) Value Compressioat
5000 C [ Cu2 o .86o5 - .002 .S715 1.3 ± .2
500 C [220] Cu u 2 o 1.487 t .003 1.510 1.5 ± .2
7000 C [-2 Cu2 0 1.489 t .003 1.510 1.4 t .2
8000 C [42 Cu2 o 86 3 0 ± .001 .8715 1.1 ± .2
800o C 122O Cu2 O 1.493 ± .004 1.510 .1t * .2
Also present in some of the diffraction patterns
wis a set of lines with a very small spacing between
them. These are apparent in Fig. 19, and will be con-
sidered in the next section.
*1

68
I. Unusual Diffraction Results
1. Adsorption Structures
In some experiLents in which the oxygen exposure
was either slightly more or slightly less than that re-
quired to produce the tfiret scattered oxide nuclei,
electron diffraction patterns showed extra streaks which
indicated periodic lattice spacings which were based on
the copper substrate lattice.
a. (100) Face
Figure 20a shows a (100)[Oi11 pattern and Fig. 20b
a (iO0)ooi0 pattern from a copper surface after exposure
to oxygen at 5000 C and a pressure of 5 x 10⁻⁴ torr for
10 hours. Figure 20a shows only the streaks expected
from a normal smooth copper surface with several additional
weak oxide lines. On the other hand, Fig. 20b, from the
same surface but with the electron beam in a different
direction, shows three extra diffraction lines between
each pair of normal lines. These pattorns indicate that
there exists on the surface a periodic structure with
the dimenaionn of a x 2a, where a is the normal [iod]
spacing of the face centered copper cell. The relation-
ship of these two diffraction patterns to the LEED pattern
observed by Simmons (14) for an oxygen adsorption struc-
ture on (100) copper is shown in the reciprocal lattice
drawing of Fig. 21a.
Figure 20c shows a (iO0)foli pattern from a copperf
- - - - - --- '-

69
_ 4
Cý C.,
<0

70
0 00 ICY
m ,00
_ _ _ _ _ _ 0 N
"6-d
00
IN
8 C4~
N~ 0 (
o-00
0
|l

F0 71
surface after exposure to oxygen at 700' C and a pressure
of 6 x 1O03 torr for I minute. This pattern can be
explained on the basis of one set of e'tra lines corre-
sponding to a spacing four thirds that of the normal d 0 22
copper spacing. All the other extra lines in the pattern
can then be explained as a result of double diffraction.
The diffraction pattern taken with the beam in the [00oi
direction on this surface showed only the normal copper
lattice streaks.
b. (11O) Face
Figures 22a, 22b, and 22c show electron diffraction
patterns from a (tio) surface exposed to oxygen at 8000 C
at a pressure of 2 x 10 torr for twelve minutes. No
extra lines are present In Fig. 22a, but both Figs. 22b
and 22c show two extra lines between each pair of normal
lines. These patterns indicate a surface structure
with a rectangular lattice havAng the dimensions of
a x 3 x/2 a, i.e. a cell which is equal to the copper
spacing in the [001 direction and three times the copper
spacing in the FTi] direction.
Figures 23a, 23b, and 23c show patterns from another
(110) surface oxidized at 8000 C and 2 x 10⁻⁴ torr for
1 hour. These patterns can be interpreted on the basis
of two surface structures, one with an a x 2 V-'a cell
and the other with an a x 3 v'Wa cell. Figure 21b shows
the reciprocal lattice drawing relating the a x 2 r a
i"I-

0 72
m C>
wz. 0 a C>~
S-, cc J* .0 -
9 c0n ~ ~-

LAW0
z
CD,. C4
4 -4-
C/)
Cz.i CI

74
.pattern to t!ie LTEED nattern observed by Simmons (14).
c. (3l) Face
Figures 2Va andi 24b show the electron diffraction
F• patterns from a (311) surface which was exposed to
oxygen at 8O00 r at a pressure of 2 x 10 torr for
1 hour. 'iguiL,. .'.. aKen in the [14f direction shows
four extr. .1Ines between the normal copper lines.
Figure 24b, however, taken with the beam in the [O1t]
direction shows no extra lines. A reasonable structure
explaining these patterns has not yet been determined.
2. Super-Structures
Electron diffraction patterns from (ill) surfaces
oxidized at 7000 C or higher for periods of time slightly
less than necessary to produce oxide ruclei on the surface
showed a parallel array of very closely spaced lines or
streaks. Figure 25a shows a (iil)[ITo pattern from
which the complete reciprocal lattice for the structure
producing the pattern can be obtained. The lattice
spacing in the [ligj direction can be determined directly
by measurement of the distance between two adjacent lines
lying on a Laue zone. Each of the areas showing maximum
intensity of the streak pattern corresponds to a Lave
ring or zone. These originate in the intersection of
the Ewald reflecting sphere with successive reciprocal
lattice planes along the direction of the electron beam.
- 'w~~~---- -

75
(a)
(b)
FIGURE 24
GLANCING ANGLE ELECTRON DIFFRACTION PATTERNS OFADSORPTION STRUCTURES ON (311) SURFACE
(a) (311) D1ill
(b) (311) ['011"]
1I____ ____ ____ ____ ___ ___ ____ ____ ____.Ji
• --.•• •- ,t

(hih
(b)FIGURE 25
GLANCING ANGLE ELECI1CIN DIrFlACTION PATTRNS OF (111) SURFACESHOWING DIFFRACTION LINES COIRESPQ"IJING TO A CELL OF VERY
LARGE DIMENSIONS
() 111-) [10,-! ~~~~(b) ,I1 •J

771
The measurement of the spacinru of the Laue zone rings (33)
then permits the determination of the spacing of the
reciprocal lattice in tte ElTO]direction from the formula:
8= - 2nL2 -.
("n)2 - 2RoR1
where (34,35)
s = spacing in direction parallel to beam
n = order of intensity maxima
L = sample to photographic fulz distance
R = radiuc of zero order maximao
Rn = radius of a order maxima
7k = wave length of electron beam
Tilting of the sample during examination in the
electron beam showed clearly that the reciprocal lattice
was made up of a regular array of rods normal to the
crystal surface. Figure 26 shows a schematic diagram
of the appearance of this reciprocal lattice. The real
lattice corresponding to this reciprocal lattice is a
two dimensional hexagonal array of points in the (iii)
plane and a diagram of this is also shown in Fig. 26.
Figure 25b is an electron diffraction pattern of
the same (lit) surface taken with the beam in theITT:Pj
direction. This shows quite clearly that the normal
copper [2 O• distance is divided qxactly into 20 1/2
divIsons, which cGrreaponds to the 26.2 A spacing
jf~ !

H 78
zbwO RftOIPROCAL. LATT1WE
VI a 00
Fu~ JGR
WEATICANSHIP BET~te! RECIPROCAL .ArC BOOSp HAs 4NTWO TMF!,SICIFAL REAL '-Afl:CE OF POINT'$

79
determined from messurenents of the distance between the
Laue rings shoviz in Fig. 25a.
This structure is a1so easily seen in Figs, 27A and
27b. In this case a (311) face was oxidized under
conditioa3 which produced (ill) and (100) facets belonging
to the COiTJ zone. These facets are show6 in tt• electron
micrograph, Fig. 27c. Figure 27a, taken wit' the beam
In the [O'T] diruction, thus gives diffractior pattirns
for beth (111) and (100) eurtaces. Figure 27b, on the
other hand, taken with -he beam in the [73] direc-iorn
(Parpendicular to 'the [Lh).). gives a view of the recip-
rocal lattice oF the (111) f.ce at nn angl;' of 51)1 to
the direction of the reciprocal lattice rods. The
structure derived from these patterns fcr the (OWi)
facets is Identical ts that derived for the tiat (ill)
surface. The structure corresponding to the (1,0O) facets
has not yet been workzd out in detail.
j_
~ -~ ~ ~ - - - -~ -

0ý 0
08
C14 CD
dJ44
C-14 O1
~ 00
b, 40 r.UC:0 0

81
J. Kinetics
1. Method of Calculation
For the purpose of measuring the rates of oxida-
tion of the various crystal faces, disc shaped samples
were used which were approximately 1.8 cm in diameter
and .1 cm thick with a small hole hear the edge, by which
the sample could be supported. For these samples, about
tO% of the sample area consisted of surfaces with orien-
tations other than that of the two flat surfaces of the
disk. The results were calculated on the assumption
that all of the sample's surface was of one orientation.
(A discussion of the error due to this assumption can
be found in Section V-C-1.)
The volume of the system was determined by expan-
sion of oxygen from the reactor system into an evacuated
vessel of known volume. The ratio of the pressure in
the system before and after the expansion gave the
volume of the system by means of the equation
Pfia
Vsystem = Vknown "finalkoriginal final
The Pirani gauge which was an integral part of the system
was used for determining Pfinal in the
Poriginal - Pfi.al
-2pressure racge of 10' - iO3 torr. The result was not
a funcý4cn of the sensitivity of the Pirani gauge but --

82
was a function of its linearity and was repeatable to
.5%. With a knowledge of the volume of the system and
a continuous record of the pressure in the system during
an oxidation (Fig.4), the quantity of gas taken up by
the copper sample could be calculated. From the rate
of pressure drop in the system, the volume of the system,
the temperature of the gas, and the area of the sample,
the sticking coefficient of the sample could be calcu-
lated. The following is a sample calculation of these
quantities.
a. Definition of Symbols
= sticking coefficient =
rate molecules are irreversibly adsorbed
rate molecules strike the surface
Q (g 02 /cm 2 ) = quantity of oxygen taken up by surface
J (g 02 /cm 2sec) = rate of oxidation of surface
k = 1.74 x 10⁻³ g 02 torr-I liter- 1
P (torr) = oxygen pressure
V (1) = volume of system
A (cm 2) = area of sample
M (g/cm2 sec torr) = rate oxygen strikes surface
per torr = .329 T-1I
Tg (0K) = gas temperature

3283
b. Sample calculations
Calculation showing determination of quantity of gas
taken up by a square centimeter of sample for a I scale
division pressure change. (sample area = 5 cm2)
Q = k:P.V = 1.74 x 10- 3 g 0 2 x I torr x
A torr liter 7.45 x WO0 scale division
I scale division .91 liter I5 em
1 1 5 cm
4.25 x 10⁻⁹ g 0 2 /cm 2
Calculation showing determination of sticking coefficient
corresponding to a pressure decrease of 1% per second.
(sample area = 5 cm2 )
scale slope x koV - I scale division xscale height A.M sec
s x 1.74 x lO- 3 g 02 x .91 liter x
100 scale dvisions torr liter I
1 x cm2 sec torr =2.5 x 10⁻⁴
5 cm2 1.26 x 1O-2g 02
In some experiments the crystal was heated by an
external resistance furnace; for these studies. the gas
temperature was taken to be the crystal temperature. In
• • • OR

most experiments, however, the crystal was heated by
induction and the walls of the reaction vessel wer-e only
slightly warm to the touch. Under these conditions it
would not be correct to assume the sample temperature or
the wall temperature represented the true gas temperature.
A gas temperature of 500 C was considerei to be a reason-
able approximation and was used for the calculation of
the sticking coefficient when using the induction heater,
regardless of the sample temperature. The gas temperature
influences the calculation of the sticking coefficient
as the inverse square root of the absolute temperature;
thus, an error of 1000 C in the gas temperature would
cause a 10% error in the value of the sticking coeffi-
cient. When the resistance furnace was used, a minor
correction was also made for thermomolecular flow and
the quantity of gas in the system.
A few experiments which used the resistance furnace
heating method were repeated with the induction heater.
The corrected results from the two heating methods were
identical within the normal reprodce'e ility of the
equipment.
2. Range of 1teasurement
Oxidation rate measurements were obtained for the
(11.), (100), (110), (311), (332) crystallographic faces
at temperatures from 250° C to 6000 C and oxygen pressures
from 2 x 10⁻⁴ torr to 3 x 10⁻² torr. In terms of average

* *10 fl ~g~~ t,11( ic:tsureuentis %*r-r rnmad rvý, ~ x i
•,,,,L- of from a Cew tangstroms to approximtetcly 500
angstroms.
1. Pressure- Dependence
In no case in the range of these measurem.ints was
a variance of sticking coefficient with oxygen pressureC)
found. In other words, the oxidation rate in g/ct!:sec
w:as a linear function of the oxygen pressure over the
range of measurement. This was true for all crystal
faces studied.
j. Temperature Dependence
Each crystallographic plane studied was fcunid to
have its own temperature dependence of oxidation rate,
Since the sticking coefficient was independent of pressure,
it was found most convenient to plot the sticking coeffi-
cient (oc) at 10-6 g 02/cm2 average coverage against
temperature. An ýrrhenius plot of these values !;ave
straight lines from whose slopes activation energies
could be obtained, Figure 28 shows graphically the
results obtained for each of the faces studied. The
frequency factors and activation energies calculated
from the curves are also shown in Fig. 21, Table 2
lists the coefficients of the equation for the sticking
probability (o) in the form
/
~l

log o= a +
"(abs.)
for the lines on the graph along with the standard
deviation calculated for from seven to twenty independfmnt
measux ements.
TABLE 2
Coefficients of the equation logoC = a + b/T
Face a b x 103 Remarks
(iiI), (332) -1.11 -2.0 . .1 (332) rate = (111)
(100) - .76 -3.0 + .4
(010) .17 -3.6 1 .4 above 4000 C
(311) 1.19 -4.3 1 1
(110) -3.89 - ,9 ± .2 below 4000 C
The (332) face which is 100 off the (iii) face gave
the same results as the (iII) face.
5. Time Dependence
The quantity of oxygen taken up by a copper surface
was a function of the time of oxidation. In a majority
of the experiments, the conditions of oxidation were
chosen so as to produce oxide nuclei on the surface after
a short induction period. The oxidations were usually
continued until the surface was nearly completely covered
by the lateral growth of these nuclei. In a few experiments,
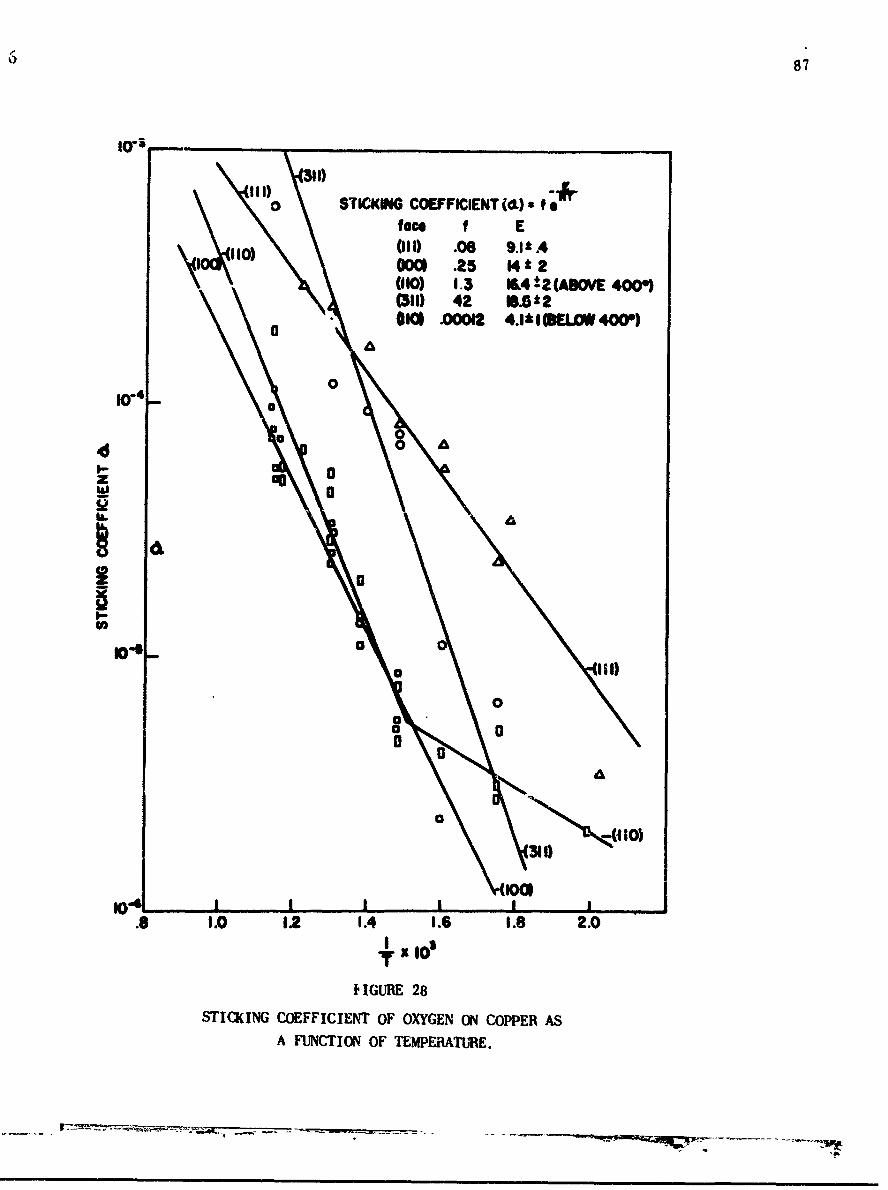
87
0 STICKING COEFFICIENT (.) a fface f E
1o~l10) (111) .08 9..41OW( .25 14t 2(10) 1.3 1.4-2(ASOVE 4000)(011) 42 8.5t2
o ,Ol .00012 4.1*IBELOW400W)
w -"4 _0 0
! BAI--
z g
w q aa
3 4 1.0 I 1.4 1.6 1. 2.
HGURE 28
STICKING COEFFICIENT OF OXYGEN ON COPPER AS
A FUNCTION OF TEMPERATURE.

.A however, the conditions were such as to yield an induc-
tion period of a few hours duration. In three experiments,
the conditions were chosen so that a continuous oxide
film was formed very quickly and the growth of this film0
%as f(llowed to thicknesses of approximately 1000 A,
in those experiments in which the induction period
was long, a linear growth law Q = kt was obtained, where
Q is the mass of oxygen taken up by the surface per unit
area and t is the time of oxidation.
Three oxidations at oxygen pressures of 1 x 10⁻² torr
were carried out on the (110) and (311) faces at tem-
peratures from 300*- 4000 C. These ccnditions were found
to produce a continuous oxide film within a minute of
the start of the oxidation. Under these conditions a
parabolic growth law Q2 = kt was observed.
During the period of time when oxide nucleation
and growth was occurring, a growth law of approximately
Q4/3 = kt was obtained, This portion of the oxidation
curve wa& often piecedýd by a linear portion, which
corresponded to the Induction period. The duration of
this first portion of the oxidation was found to be
4ifficult to roproduce. This was apparently a result
of the previcnu history of the sample (see Sec. IV-A).
Figure 29 shews a representative plot of Q versus t with
the experimental stioking coefficicnts indicated at
various pointe a1.ng the curve.I•

89
ag
w 0nT2 4
00rz9
U01 w/m&i
. .....

90
X. Electrometrio !teductian
Slectrometr'ic reduction, utilizing the apparatus
deaoribed in Sec. 111-D, wve used to determine the quan-
tity of oxygen present on a crysti;.l surface as oxide.
Since the total uptake of oxygen by a cxystal was known
trom the k'netic measurements in system B, the difference
botwveen thetse two amounts of oxygen should be a measure
of the amount of oxygen dibsolved in the metal latice.
The results of these measurement5 are shown in Table 3.
It can be seen from the data in the table that only
those samples for which the oxidation was terminatei
below 1/(g/cm2 oxygen uptake showed a positive indlcation
of appreciable oxygen solution. Many of the electromeiiic
reductions actually indicated about 5, more oxide on the
su2rface than was determin'd from oxygen uptake msasuri-
mqnts. Thi• disorepancy :s "hought to bc dun to io4s
than iOý >ftician-y of the Olectromatric rcductlon
eye ten.

91
TABLMN 3
Comparison of Electrometric Reducwtion Data
with Oxygen Uptake
:,v. Pressure Oxygen Oxygen.. v.ak Pressree4Face Temperature (torr U g,'pake Ridv ced
9/ g/cm 2 g/cm2
C0 10-3.33 .1ý
k _it ,0,, io-, .50 .20
101o) 40o C 2 x i1o- % . .20
1oL00 5000 C iz,-3 .•7 C!22(oo) 50 C 1o .6s .25
(1iI) 40V* 0 2 x 10-t4 4.0 .40
_(J2O) 250o, C 10-2 -7-1 .75
(too) •, 3• 10-3 1.21 .93_j!iI) ,, 0- C .... 5 X 1o-4_ _ .1ý_ i.30
(1.11) _00 C 2 x 10⁻⁴ 1.25 i1 ,*5-_(11•) 00o c .... l. . . )-.73 _, _ 1 7
k 100) 4CG r t0o- 1.71 1.85
__J1001 600 0 0-3 2.00 1.80.
( .00) 6o- r, i0-3 2.5 2.6
(31' _ C 10i2 2.6 2.6
(11.0 5000 C 2 xt0o3_ .1 3.0
(Ilii) 000 C O-3 5.9 4.3
1t1) * _...0-3 _8.7 9.0

L. Oxygen Solution
Since only a few of the eiectrometric reuetion
experiments showed positive evidence of oxygen solution
in the metal, a number of speciai experiments were
carried out in an attempt to ccnfirm that oxygen solutior
was occurvIng.
A )/8 ina sphere was oxidized at 2500 C and I torr
oxygen for five oinutes in order to produce a thin
cottinuous film of oxide oA the surface. This film was0
approximately WOO0 A thock zn the (100) face and showed
interference colors. The sphere was then heated to
730" C in a vacuum of less than 1O& 7 torr for a short
period of time. After cooling, there wao no indication
of oxide on the copper surface. When this experiment
was repeated on a 1 mm thick (ii) sample, the oxide
also disappeared when the sample was heated to 7500 C.
Horover, after slow cooling it was found that the surface
contained oxide nuclei comparable to those obtained on
t sample which had been oxidized at a low oxygen pressure
and high temperature. An electron micrograph of this
sample is shown in 'ig. 30. It is quite clear from the
conditions of these experiments that the oxide originally
on the surface dissolved in the metal. The reprecipitation
of oxide on the surface of the thinner crystal was a
result of saturating the metal with oxygen at the elevated
temperature so that on cooling the metaW became supersatu-
rated and the oxygen then precipitated cut as oxide.
- - - - ~ ~ t~~z4-

934
FIGURE 30
OXIDE NUCLEI- PRECIPITATED GN THE (111) FACE FROM AN
OXYGEN SAIUJiATED COPPER SAMPLE DURING COOLING
IN VACUUM.

M. Oxidation of Thin Films
Copper single crystal films approximately 1',10 0
thick with a (100) orientation, which were prepared 6N
evaporation onto a heated rocksalt substrate, were
oxidized in system A. After oxidation, a 1-yer of ,-c,
was evaporated onto the film for support and the o1di.'.
copper film was floated off the rocksalt with distill(-
water. After a brief second rinse in distalled waLe,
the films were dried and mounted on electron mtcroscr.:;
grids for examination -n the electron microscope: it.
the first few experiments, the copper films were strj!, 2
from the rocksalt and mounted on electron micros,-ope
grids prior to oxidation. This procedure was discoritri,
because the oxide nuclei became detached from th-•,,
film and were lost if not supported.
Figures 31 and 32 show the appearance of a thu,.
film after oxidation at 5500 C at 10-2 torr for - -!.
One half of the film was shadowed with platinu-m tintr
specimen dissolved in dilute nitric acid so thi.t :
* surface features could be observed by electryr, :i
of the replica while the other half was examir-d dif-
by transmission electron microscopy and transii~s',r
electron diffraction. There were observed num'-.-cu;
nuclei of two types: i) approximately squa-e nucie;
with the [i0o direction normal to the surface, a~i
2) 4pproximately three armed triangular nu~lei watf.
175

95
IE
-4-. 00
:-~
Ild:
.3N..L

96
rzz
415* .9 ~ .9
cu'l mR Un
I~0-4

97
EM] direction normal to the film surface. Both types
of nuclei lay in holes in the foil. The copper metal
had apparently diffused away from the area adjacent to
the nuclei and in most cases left the copper oxide
nuclei completely free of the metal film.
_ _ _ _ _ _ _~R _ __ _ __ v.

13artntr this s tuov s-m,;'ý t-,C3 ij Oil o'wore irni (Ivor i -
i..,!y made. on vontaminlated samples, Ii only one ease
was the contaminmnt identifiahle and, its s,)ure Oetel lin(-d
In all other cases tlihe contominant was unknown and ifs
concentration insufficient to be detectable -is a separate
phase by glancing angle electron diffraction Mlect-ron
diffraction was however, a powerful tool for the dAtec-
tion Jf the presence of a contaminant since tht contami-
nants almost always altered the epitaxial relatifons'ips
between the copper sample and the oxide. Yost often the
contaminant resulted in random copper oxide being formed.
In other cases, however, it would Cfause an oxide of a
very high degree of orientation to ocrur hit with an
epitaxy different from that occurring on clean siirfaces,
An equally powerful nethod of deterrnin in,_ the ,,res-
ence of a contaminani was to e(::swine the shm;c of the
oxide nuclei themselves, since these, in the presence
of contaminants, grew with strange forms. In most eases
these contaminated nuclei would be the same shane o,'cr
the entire surface, indicating a uniform distribution of
the contaminant. In a few cases, isolated groups of
unusually shaped nuclei were present inciicating a localized
contaminant. Figvres 33a, b, c, and d show some typical
examples of nuclei grown under contaminated conitions.
It was possible to distinguish between contaminated and
- ':----- '- -

99
'.a) (b)
(z•) (d)
FIGUIE 33
ELECTRON MICROGRAPHS OF CONTAMINATED OXIDE NUCLEI
(a) (100) face, 700 0 C, 3 X 10⁻⁴ torr, 10 minutes
(b) (100' fa:e, 5000 C, 1.7 X 10 -4 torr, 3 hour-
(c) !111) face, 8000C, 10"3 torr, 15 minutes
(d) (111) face, 5000C, 1.5 X 10⁻⁴ torr, 6 hours
.**

100
and unzontaminated oxidations simply by a examination
Of the fnrm nf thc nninlAp Tt wan f•tin t0;.t a nntami-
nated sample never nroduced the same shape nuceI& twice,
except in the case of the one known contyminant. T's
reproducibility of the regular shaped nuclei was there-
fore a good criterion for the lack of contaminant in
the system.
Figure 33a is an electron micrograph of a contamW-
nated nample showing amall, well formed ituclei but with
many different orientations present. The diffraction
pattern in Fig. 27b shows the multiplicity of these
orientations.
When copper samples were oxidized in system A at
temperatures above 6000 C for long periods of time in
low oxygen pressures, a contaminant appeared on the surface
as small rounded particles which pinned the surface steps
formed by thermal etching. This material was identified
as amorphous S102 by electron diffraction. Figures 34c
and 34d show a surface replica of such a contaminated
sample and its associated diffraction p'attern containing
diffuse rings from silica.
- -- ' T-OM

101
(a)
(c) (d)
FIGURE 3 4
CONTAMINAIED OXIDE NUCLEI:
(ap- "ie.tron miclograph of (108) face 4GC'10- torr 5 minutes
kc) Electr(m diffraction pettern assonimced with a.(W) Electron miciograph of (10(l) face. 8600C.
S X 10-4 to-r, 1 ho-ir
(d) Electron diffraction pattern associated with c.
• n,• m n •m • ,, ,s • ,, sn , • •1

102
V. DISCUSSION
A. T]oraphy
It is quite evident from the preceding results
that a smooth copper surface does not remain smooth when
exposed to a low pressure of oxygen at elevated tempera-
tures. Two typeg of changes in the topography of the
surface occur. First, the metal surface may become
roughenec on a microscopic scale by the development of
facets. This is called thermal faceting or thermal
etching. Secondly, the metal surface jay become roughened
by the development of isolated oxide nuclei. Both of
these processes are related in that they are largely the
result of the high mobility of copper and oxygen on the
metal surface. The surface mobility of copper in vacuum
and in hydrogen has been thoroughly investigated by
Choi and .3hewmon (39), by Rlackerman and Simpson (40),
and by Gjostein (41). Bradshaw (42) studied the influence
of a low pressure of oxygen and found the surface diffusion
rate of copper enhanced by a factor of about three over
the diffusion rate in vacuum.
1. Thermal Paceting
Copper surfaces exposed to oxygen at all pressures
used in this work and at temperatures above 5000 C
generally showed the development of facets. These facets
were primarily of the type [1001 and 7i13 , although

103
toese low index pianes were frequently joined by1 small
segments if high index plan3s. Facets weie observed
both on samples which showed nc' surface ol;ide (i.e. the
surface was in the induction period) (Pigs. 18b and 27b),
and on crystal 3urfaces w!,ich showed oxide nurlei.
These facets develop on most metals so as to mini-
mize the surface free energy of the gross ,%rystal in
the presence of an oxygen atmosphere, The mechanism
of their formation on various metals As uncertain (46).
Hondros and Moore (47) indicate that for silver, evaý'ora-
tion of the metal was essential for the formation of
facets. This is apparently not true in the case of
copper, since faceting was observea at temperatures far
below that at which the evaporation rate of either copper
or cuprous oxide is appreciable.
In oxidations at the higher temperatures used in
thts work, tke facets are noticeably influenced by the
presence of the oxide nuclai; i.e., the facets are larger
and are curved in towards the nuclei, as shown in Figs.
lob and 13c. This enhanced lacvzii;r in the immediate
vicinity of the oxide nuclei may be duc to an increased
diffusion rate caused by a strafi fiold set up close
to the growing nuclei. There 's some evidence that this
enhanced faceting develops durin- Vie ,?oolirg of the
sample after removal of the usygen atmcsphere (6, 48).
I

104
2. Density of Oxiee Nuclei
In Section IV-E, it was shown that the density of
oxide nuclei on the cop!,er surface was 1) directly pro-
portional to the oxygen pressure, 2) only slightly de-
pendent on crystal -ace, 3) an exponential function of
the reciprocal of the temperature, and 4) ind'.pendent
of time, after th- nuclei had obtained a size of a few
microns and until the time when the nuclei began to grow
together. Tqese relationships can be explained in terms
of a diffusion c3ntrolled growth process.
Kahlweit (49) has shown for the case of internal
precipitation of oxide particles in dilute metal alloys
that, for diffusion 1ontrolled growth, the density of
precipitated reaction productc in a plane is directly
proportional to the flux of reactant into the plane,
This result is also applicable to the dersity of uuclei
formed on the surfaeG if thc flux late is assuined to be
the rate at which the crystal takes tip oxynett and tVie
plane of precipitation is taien as the ,urface. Thxws,
the direct proportionality between the density of 49'
nuclei and the oxygen pressure i3 explained since the
rate at ibich the sample takes up oxygen is directly
propor!,ionsl to the :•xyger pressure.
The exponential relationship between the density
of nuclei (N) end the reciprocal of tamperature can also
bb oiDplained in terms of diffusion controlled growth.

105
The energy (E), obtained from the experimental slope
of an Arrhenius plot of I/T versus the logarithm of the
density of nuclei determined at cotistant pressure, has
been shown by Gr~inlund (2) to be equal to twice the
activation energy for surface diffusion. Table 4 compares
the values obtained by Gr~nlund for various crystal faces
with those obtained in this workC.
It is the opinion of this author that the density
of nuclei as a function of temperature should hdve been
determined at constant flux and not at constant pressure
since the density of nuclei is a function of the flux.
Using the kinetic data from this work, a corrected set
of activation energies was cal dlated and these are also
shown in Table 4.
TABLE 4
Activation Energy (Iccal/mole) for Surface
Diffusion on Various Crystal Faces
as Calculated by the Method of Grbnlund (2)
(111) (-00) (110) (311)
Grbnlund's values (2) 18 23 10 15
This work(constant pressure) 16 13 12 12
This work(constant flux) 21 20 21 21
The identity of the diffusing species for which the
above activation energies are calculated is not known.
The corrected activation cnergy values in Table 4 are
_ _ _ _ _ _ _ _ _ a

identical, however, to the value of 20 kcal determined
by Bradshaw (42) for copper surface diffusion in the
presence of 5 x 10-u torr of oxygen. There are two
apparent mechanisms for surface diffusion in which the
activation energies for the movement of copper and oxygen
would be the same. One possible mechanism would be the
joint migration of both the copper and oxygen atoms as
a molecular unit, such as Cu2 0. The other possible
mechanism is a ring rotation irocess in which the move-
ment of an oxygen atom in one direction is balanced by
the movement of a copper atom in the opposite direction.
A discussion of the mechanism of growth of the
oxide nuclei on copper has recently been published by
Rhead (7). In this paper, Rhead analyzed the work of
Grbnlund and arrived at the conclusion that "whatever
diffusion mechanism account ror growth of the particles
it may not be very different from surface diffusion of
the metal."
The variation of the number of nuclei per unit
area with time can not be approached in the mathematical
manner of the above discussions. This is due to the lack
of sufficient experimental observations of the relation-
ship between time and density of nuclei. A f'w general
remarks, however, can be made. It is expected that after
the induction period, oxide nuclei precipitate on the
surface due to the surpassing of a "critical concentration"

i06 107
of oxygen in the surface layer. This "critical concen-
tration" is the minimum oxygen concentration in copper
which will precipitate oxide nuclei at that temperature.
The surface layer involved in this solution may extend
to several microns in depth under certain conditions.
At this time the number of nuclei will grow very rapidly
to some maximum value and the concentration of oxygen
on the surface between nuclei will fall to some lower
value, preventing further nucleation. At this point the
surface is covered with many small nuclei and Ostivald
ripening (7, 49) may occur to some extent. (Ostwald
ripening is the growth of larger precipitate particles
at the expense of the small particles as a result of the
variation of surface energy with particle size.) It
was observed in this work that the density of nuclei as
determined in the electron microscope when the nuclei
were small was greater than that determined in the optical
microscope at a later time in the oxidation when the nuclei
were larger. The nuclei which remain, however, continue
to grow because of further oxidation and are soon too
large for Ostwald ripening to be significant and the
density remains constant until the nuclei grow together
and form a continuous film.
3. Topography of Oxide Nuclei and Surrounding Metal
a. Surface of Oxide
It is clear that if an o;ide nucleus were not
um • '• • •... ••= • • _, . ..... + ••• •.• f

SI108
growing (i.e. increasing in voltme) it would, by diffu-
sion, come into equilibrium witIh it,- environment. This
equilibrium would be the lowest energy state for the
system of oxide on metal, and would be governed by the
surface free energies and interfacial energies of the
metal and oxide. The oxide nuclei observed in this work
are not static but are growing nuclei and their configu-
ration will be governed by the various surface energies
involved, the mode of growth, and the diffusion rates of
the oxygen and metal atoms.
The faces which might be expected to develop on the
surface of an oxide particle, from surface energy consid-
erations alone, would be low index planes. Figure 13a
does indeed show the existence of fairly well developed
(100) planes on small oxide nuclei formed on the (ili)
face of copper. However, to continue such growth, the
transport of material must take place over greater and
greater distances. This is because it seems likely that
the majority of the oxide is added to a nucleus at its
periphery and must diffuse to the top of the nucleus.
It is clear that at some point this transfer ,an no
longer take place sufficiently rapidly and the nuclei
become truncated. This rounding off or faceting of the
upper surface of the nuclei can be seen in Figs. 12b and
13a, and in many of the other micrographs in this work.
A second type of facet development which often

8 i109
occurs is seen in Fig. 12a. The oxide nuclei show two
low index planes which are connected by a rather poorly
develdped high inldex plane tLhatt makftes a snall1 ang-le Withu
the substrate surface. This configuration is apparently
due to the tendency for lateral growth resulting from
the addition of oxide to the nuclei at the periphery.
It is not apparent why the (Ili) oxide plane parallel
to the surface is not formed instead of the high index
plane since the close packed plane would have a lower
surface energy.
An analysis of the shape of the oxide nuclei
appearing on the (100) face of copper is more difficult.
It *3uld be expected from the epitaxial relationships
observed, which show (ii1) planes of oxide parallel to
(1oo) copper, that nuclei with bases the shape of regular
equilateral triangles should occur. In facz, the observed
nuclei are triangular, with four different orientations
as expected, but in mos& cases they tend to be 900, rather
than 600 triangles (Fig. 9a). A close examination of
the electron micrographs of the nuclei reveals that many
of the nuclei show a small section, either on the top
of a nucleus or at the tip, with the cxpected 600 angles
(Fig. 9b). This portion of the nucleus also seems to
show inclined (100) planes, as in the case the nuclei
on the (iit) fate. The tendency for the basal angles to
be greater than 600 is not a result of misorientation of
(i

4! 1 10"the copper face, since each of the four equivalent
orientations shows the same features. Nuclei of this
type werA never ohbPrved nn th- (I 1) 1rac, and so the
odd shape is apparently a result of the basic symmetry
difference of the substrate and the oxide at their
interface.
b. Topography of Metal in Vicinity of.Nuclei
The topography of the metal ira the vicinity of a
nucleus is described in Section IV-D for an oxidized
(11O) face of copper. This topography is equally repre-
sentative of the other surfaces studied when oxidized at
sufficiently high temperatures. The general features of
this topography were: 1) the oxide nuclei always
appeared to penetrate deeper into the surface at their
outside edges, and 2) the nuclei were always surrounded
by a mound of copper outside of which there was a shallow
broad depression in the surface.
These features are in excellent ,greement with the
results of Xienzet ,. _. , .. . - t.ris tics,
at first glance, appear t; oe most strange. However,
they are not unreasona. •c '-hen -,ne consideors the 1 prcbable
mechanisms of growth and the volume changes which occur
during the oxidation process.
The growth of a small volume of oxide, which was
formed initially in the metal surface by a precipitationpnprocess, involves an expansion of the unit cell •,f copper
-- _ _ _ _ . - - ---

liti
by 64%. Thts expansion of the lattice sets up local
stresses in the vicinity of the oxide nucleus which can
lead to slip, sc that as the nucleus grovs, excess copper
is actually pushed ahead of the oxide in a ridge. The
actual amount of copper in this ridge will depend on the
detailed mechanism of the growth of the oxide nucleus.
If the growth of the oxide nucleus was the result
of either oxygen diffusion to the nucleus from the gas
phase, or of interstitial diffusion of oxygen in the
metal, it would be expected that the volume of metal
displaced by the nucleus would be about 395 of the volume
of the oxide formed. This assumes that the oxide nucleus
is not expanding above the metal surface. On the other
hand, if the growth of the oxide is the result of either
a substitutional diffusion of oxygen in the bulk or at
the surface, the diffusion process removes a number of
motal atoms from the oxide-metal interface equal to the
number of oxygen atoms arriving, so that the ,,olume of
metal pushed out by the growing nucleus would be unly
10% of the volume of the oxide formed.
It is plausible. whateier tl:ic iechanim for growth,
that "excess" copper will be "pushed" ahead of the
growing oxide nuclei by a stress induced creep or slip.
In either case the result would be the development of
a mound of copper on the metal surface around the oxide
nuclei.
* ~t-w%~ w,--~ -,<*t- 4

The oxide, ho'11ver, does not co•itain itself to 1he
:,riginal surface and below, but also grows above the
surface. This rrocess reduces the quant-'ty of mail
which must be "pushed" before the growln- nuclei.
The volume ef the ridge of "txcess" metal observed
in high temnerature oxidation (Pig. 15) is a.pproximately
307 ef the volume of the nueleus b~low the original
surface, It is t'sus conel'ided that the major mechanism
ot growth at high temperatures is not by diffusion of
substitutional oxygen. The mechanism of growth there-
tore involves the arrival of cxygen from the -as, diff:,-
&ioz. of oxyger, on top of the metal, or interstitial
diffusoioi. The 10.; difference between the expected
and the observed armour;t oý mzetal iti the ridrc ahead of
the nuclei is due t. part of the nuclei grot.-int- nli',v
the original surface.
The existence of o::ygen in the copper lattice as
an interstitial ion is most nnfikýely becausc' of (he
large size of the oxygen ion and this -,ossi'Jiit•t is
therefore rejected. Growth by arrival ef oxygen at the
oxide from the gas phase should yield oxidation ;&Les
which increase as the amount of ox.de surface increases.
This is not the observed kinetics ant thus, this nechanism
is also ruled out. It t, therefore conclud-t' that the
mechanism of oxide growth at high temperatures is by
oxygen diifusion on top of the metal surface, in agree-
ment, with Menzel (50).
E#

12113
It is indeed difficult Cc detcrmine -Lhe exact nature
of the diffusion species which is contrGiling tine oxide
growth. In Section V-A-2, the similarity of activation
energies, determined from data on the density of nuclei,
Rnd those for surface diffusion of copper, seeried to
indicate that copper was the diffusi:.., species. This
agreement of numbers, however, could be merely coincidence
since other evidence in the literature (50) and from
this work suggests that oxygen is the diffusing species.
Apparently under these r.obditions of oxidation, both
oxygen and copper atoms ire tighly mobile on the surface,
and in fact, the mobility of both undoubtedly is involved
in the overall process.
The slight depression in the surface cutside the
ridge of metal is thought to form during the cooling of
the sasmple. The phenomenon of surface faceting on
cooling a copper sample which has been exposed to oxygen
at low pressure and high temperatures has been observed
by Menze! (6) and the enhanced development of these
facets in the vicinity f£ oxide nuclei by Bouillon ('8).
It is to be 6xpected, as indicated above, that
stresses would be set up in the vicinit"y of the oxide
nuclei, and that these stresses could lead to slip
occurring in the metal. Figures 14c and 14d show the
edge and tin respectively of a nucleus on the (110)
surface. Extending out from this nucleus in the [ITj
Irv,4

114
direction are lines which at the tip have the appearance
of slip lines. Farther back from the tip of ttie oxide
naucleus, these lines clearly develop in-Oo (111) planes,
which are the slip planes in cnpper metal. The a~nrurt
of slip required to produce facet3 r" tVe e observed
would be, h~owever, mulch greater than the amount of slip
normally observed in pure copper. It Is thought that
these facets may actually be the result of slip, but that
the size of the facets may have been increased by the
process of surface diffusion.
t__

"Z15
B. Structure
1. Adfurrtion '}tructures
The twa dimensional stituctures reported in See:tiort IV
for the 'I,00) and (QO) copper faces are id-entica] with
the adsorption struciures for eheminsorbwd oxygen cbserved
on these faces by Lee (13) ani Simmon3 (t4) usii.,g low
(!neygy electron diffraction (IEED). "'re extr-i.e diJ~fer-
ence between the conditions used in the LEEP work and the
confitions used in this work deserves discussion. In th"
LEED work, minimum oxygen exposures of 10-7 torr min.!tes
for the (110) face and 2 x 1-: torr minutes for tne (10.9}
face at roomI temperature were required to produce the
adsorption st•,-?.ture. In the high energy electron
diffraction work, exposures of 10-2 ?-orr minutes at
800* C we'e required to produce the obr.:rved .tructurs.
It is believed that the 104 inerease in oxygen expo~ure
Lt 8000 C is necessitated by the rapid solution of oxygen
into the netal at this temnerature. (Sr.e discussion on
oxygen solution in Sec, V-C-2.)
Bqecause of the necessity of cocling the sampl and
exposing it to the atmnsphere, ir, order to transfer it
from therc'ctioa vessel to the di~f~action wunt, it can
not be stated orotquivocally from tbe above data that
the obýsrvel adsorptlon st--uct.ut-s was present on the
sample at the end of the cxidati.n period. It is thought,
nevertheless, that a twe dimensional adsorption structure

n16
of the type observed above does exis. tn the copper
surface aý elevated temperatures in the presence of
,)xygen. The strue•ures observed by high onergy electron
diffraction were a -unction of the react.on conditions,
It cau b4 stated that the structure observed was dependent
zn the oxidation conditions and not on the cooling rate
of the sample or the reaction of the sample with air
during the traitsfer from the reaction system to the
diffraction apparatus, since the adsorption stvr,cture
observed varied with the oxidation conditions. The work
of Sewell (51) on the reaction of oxygen with nickel
provides additional sulpport for the existence of such
adsorption structures on metals at elevated temperatures.
In this wor%, the diffraction patterns from a nickel
crystal exposed to a low pressure of 3xygen in an ultra-
high vacuum diffraction unit (52) were studied at high
temperatures. This study showed not only the existence
of diffraction liaes from the metal and from nicce"
ozide nuclei, but aiso the presence of lines from a two
dimenslori;tl adsorpticn structure.
It should also be pointed out that many of the
diffractien patterns showed both diirfction lines from
oxide nuclei as well as from an ;dserption structure.
This demonstrated the prosence of an oxygen adserption
atruetiire betweeti the nuclei at the time of observation,
and indicated 'that such a structure rrobably existed
during the reaction,

117
An interesting queistion which arises is, why should
such a thin surface structure be sufficiently stable to
further oxidation that it can be transferred in air from
the reaction vessel to the dlffraction unit without
modification? Tlie answer to this question is not yet
available. However, both Lee (13) and Simmons (14) have
found that the adsorption structures on copper are
remarkably resistant to further oxidation at room ten-
perature.
The diffraction data for the (311) face shown in
Figs. 24a and 24b. has not yet been interpreted. There
is no LrED work available an this face of copper for
comparison. It seems apparent, however, that this
pattern is also due to a two dimensional adsorption
structure on the metal surface.
2. Diffraittloz Patterns Corresponding to Large Lattice
Parameters
The dif.raciiovt patterns reported in Section IV-I-2
showed a very small spacing of diffraction lines which
indicated a ýVwo dimensional centered rectangular cell of00
dimensions 15.1 A by 26.2 A on the (111) face after a
short oxidation. A similar pattern hat been reported
by !Zrause 153). In Krause's experiments, the diffraction
pattern was obtained from a (11i) face of a copper sphere
which had a thin film of copper evaporated onto its
surface at rons tempmrature and was i.hen annealed at
~ -~~ ~ - -~'-,-----~. ~ ~ --... _______________________ 4

118
500° C in a rather poor vacuum of 5 x 10⁻⁶ torr. Krause
also stated that a similar pattern could be obtained
after a slight thermal oxidation of this copper sample.
Krause has proposed that the diffraction pattern
observed can be explained on the basis of a hexagonal
array of screw dislocations at the interface bi.tween
the substrate and a slightly disoriented evaporated
copper film. It seems likely, as shown below, that this
is a possible explanation, but it is probably not the
correct one.
The diffraction pattern observed in this study
corresponds to a reciprocal lattice ccasisting of a
hexagonal array of rods, and the real lattice derived
from this is a planar array of points in a hexagonal
arrangement. It is not pnssible to locate the atoms
specifically in this structure, but only to say that
the structure shows the periodic scattering array indicated
by the two dimensional lattice.
There are a number of possible phenomena which
could lead to periodic structures giving the required
type of reciprocal lattice. The most li!iely structures
are discussed below.
Probably the simplest two dimensional structure
which would give the observed reciprocal lattice is a
hexagonal array Gf oxygen atoms adsorbed on the metal
surface with the observed cell size. There are two
4_-

119
factors which make this possible structure rather unlikely.
First, it is highly unlikely that adsorbed n xygen atoms
spaced 15 A apart on the surface would have sufficient
influence on each other to create and hold together tlhe
perfectly regular large spaced lattice observed, although0
possible adsorption sites approximately 15 A apart do
exist on the (iII) surface. Secondly, in such an adsorp-
tion structure only a small fraction of the surface would
consist of oxygen atoms, and with the small electron
scattering factor of oxygen the diffracted intensity
would be extremely low and probably undetectable.
A possible structure which svicld be considered is
that of a superlattice of oxygen in copper. It is quite
clear from the data in the results that oxygen is dissolved
in the metal. An ordered array of oxygen atoms in
substitutional sites in the copper lattice can be con-
ceived which would give the proper shape for the recipro-
cal. lattice. However, if the structure is based on
substitutional oxygen, it is not possible to derive a
superlattice with the proper dimensions without changing
the copper parameters, and no change in these parameters
has been observed. An interstitial location of the
oxygen atoms seems unreasonable from the viewpoint of
the size of the oxygen atom.
A two dimensional superlattice ef oxygen and copper
on the surface of the (III) plane of copper is likewise
- - - - -n~ -
"V.

120
ruled out on the basis that the repeaz distance in the
observed structure is not an integral multiple of a
normal repeat distance for conner atcms in this plane.
Another possible explanaticn of the observed
diffraction pattern is Thnt ibere exists a two dimen-
sional hexagonal networ!k of interfacial dislocations
between an oxide and the metal surface. An array of
screw dislocations resulting from a small ro-ntional
disorientation about the E11U9 axis could lead to a
periodic arrangement of atoms at the interface which
would give the desired reciprocal lattice. Krause (53)
has suggested this explanation for his results, only he
has attribute,. thi -,t observed to a rotational
disorientation of deposited copper, This is highly
unlikely since his diffraction pattern is identical to
the patterns observed ii, this work where the copper
crystals were only exposed to oxygen. It is apparent
that his pattern is also due to the presence of oxygen
from his annealing treatment in a poor vacuum. This
still does not rule out the interfacial dislocation
ex. lanation, however. The high intensity and the sharp-
ness of the diffraction lines indicate a very high regu-
larity in whatever structure there is which leads to the
pattern. So far, no observed networks of interfacial
dislocations reported in the literature have shown
anywhere near the regularity which world be required (54).
'•

A rotation of the oxide about the [Iii axis by about
two degrees wrnild be required to give a screw ,;slocation
network of the dimensions required, There is no evidence
In this study to indicate rointioinal disorientations of
this order of magnitud. on the (111) face,
It is a'-so possible to +-in!c of a networ,: forrmed
of an array of ege dislocations resulting from the
misfit between the oxide and tie copper substrate.
ITowever, from the measured differences in lattice para-
metero of the oxide and metal, the netlwor% of disloca-
tions expected would be much smaller than the dimensions
required to explain this pattern.
The solution of oxygen in copper might, under
suitable ccndition.s lptd to a periodic arrangement of
thin platelets of precipitated Cu2 0 . Such a periodic
array has not been observed and it seems unlikely tha,t
precipitation of v:xide would show the .iAh degree of
regularity necessary.
A final possibility, which is purely conjectural,
is that in the solid solution of oxygen in copper there
is a periodic variation of oxygen concentration. This
would lead to oxygen-poor regions with a lattice parameter
slightly smaller than tbnt for the uniform sclid solution
and oxygen-r-eh regions with a slightly larger lattice
parameter. This essentially amounts to a displacement
type disorder that could lead to "side-band" type

122
diffraction patterns (55) similar to those observed in
a number of metal solid solutions (:6).
S•-itaxy). z•t&.
The first part of this discussion is on the orien-
tation of oxide nuclei observed on various crystal planes
while the latter part is concerned with the lateral
compression existing in very thin oxide films as a
result of epitaxial forces.
a. Orientation
Cuprous oxide was the only oxide formed on the
copper surface under the conditions used in this work.
The orientation relationships observed and reported in
Section IV-C for the (ii1), (110), and at low tempera-
tures on the (100) faces of copper are the same as those
reported by Lawless (57) and Menzel (58). The high
temperature, high pressure, epitaxial relationships
observed on the (100) face (Fig. lob) have not been
previously reported in the literature. Lee (13) nowever,
reports an adsorption structure which was formed at
room temperature at oxygen exposures of 3 x 10⁻⁶ to
3 x 10⁻⁵ torr minutes which is strikingly similar. This
struct re is reported as an oblique cell with sides
running in the (0511 and FO17] directions on the (100)
copper surface, with all four of the equivalent orien.-
tations present.

123
The only relationship which can be drawn from the
observed epitaxy is tha% with the exception of the high
temperature form of nuclei on the (100) face, there is
always a parallelism of one closest-packed direction in
the oxide and metal. Although it is clear that the
epitaxy which is obtained must be the one of minimum
interfacial energy, it is not clear what frctors deter-
mine the interfacial energy. it is apparent that the
magnitude of the interfacial misfit is not the only
factor in determining this energy since it is possible
to cbntse orientations on some planes which would have
a smaller misfit.
b. Compression
It was found that a (111) copper surface, which had
been oxidized at 5000 C or above in an oxygen pressure
of I1-3 torr or less for a time slightly less than that
required to produce oxide nuclei on the surface, showed
an oxide phase in glancing angle electron diffraction
after cooling. The surface of these samples as seen in
the electron micrographs (Fig. 18b) consisted of shallow
steps with very smooth planes approximately 5000 A wide
between steps. The diffraction pattern (Fig. 19) indi-
cated that the oxide phase on these surfaces was present0
as a continuous film on the order of 5 - 15 A thick.
It is thr' ght that this oxide was formed by precipita-
tion of dissoolved oxygen as the sample cooled.

On the (i11) lace this oxide film is compressel
1.1% in the plane of ihe surface. (ne potisible explana-
tion for this result is that the oride on the (tii) face
is strongly bound to the underlying metal and that when
the metal oools to room temperature, -L therwal contrac-
tion being greater than that of the ox•de will result in
an abnormal compression of the oxide film. The magni-
tude oR fho resulting comprescizn for a temperature drop
of 7500 C is approxtuately the amount observed. However,
thbi explanation would yield a compression that is a
function of the oxidizing temperatqre and no such de-
penden2ce was found Pr oxidations bet,,en 500 0 and
8000 C.
A much more likely explanation of the observed
lateral compression of the oxide on the (ill) face comes
from the theory of V1n der Merwe (59). In - his theory
Van der Merwe detcrmine the Interf~cial energy as a
function of the inxerfacial misfit between two pbases•
He then propoaed that if ore of the phases is present as
a thin fiim, a h3mogeneous plane etrain will occur In
the film in sucb a direction as to reeuco the density of
Interfacial dislocatioiss and thus the energy in the
interface. 29 then calculates that the strain resulting
int the minimuz energy for the system is given by:

-,= 2(11_-\{f)* In [2 (1-2P
a 4T,.. /Aa h
where,
b-na
r4agidity wodulns
Ta' OTbt T- = Pciss~n&t ratios
a = lattice parameter of film
b = lattice paramster cf sbstrate0
h = film thickness in A
(subsc•ipts a, b, o refer7 to film, sulstrate, anid
interface respectively)
To obtain a numerical solution of this equation
one needs to know the elastic nroperties of the oxide,
the metal, and the interface. These quantities have
never been determined for the oxide or the interface.
In order to estimate the magnituda of the strain in ,x
thin parallel oriented oxide on the (111) face of copper,
assume that
Witt f .15, and a = 2.47 A, the euation- for - reduces
to 2-"
where the minus aign indicates comprcssion. F;-r a filn i
L

126
"titn angstroms thick the compression of the Miim would
be .2%, This valua is somewhat less than the observed
conmpression but in view of the assumptions necessary
to get a nuneri.al solution, the disagraement is not
unreasonable.
It should be pointed out that Borne (60) has obtained
comparable results for oxide grown on the (110) face of
copper. A refined x-ray diffraction technique was used
in these studies and it was determined that the oxide
lattice planes parallel to the metal surface were ex-
panded in a direction normal to the surface by about
I - 2%.. This is couparablo to the lateral compressions
obse-ved in the present work.
I

404
64 17'
C. Kinetics of Oxidation
1. Sample Shape
Before a proper interpretation of the kinetics of
the oxidation of copper can be given, an analysis of the
effect tLte sample size and shape mdy be playing on the
measurement of total uptake of oxygen by the sample must
be made. As stated in the section on sample preparation,
the samples were of disc shape, approximately 1 mm thick
and 9 mm radius. For this shape approximately 10% of the
total surface is composed of crystal faces other than the
face under investigation. If the major surface is the
(111), an examination of the kinetic data shows that an
"average surface" oxidized at approximately one third
the rate of the (111) face and thus, the contribution
to the total uptake by the edge of the sample would be
approximately 3%. An "average surface" is defined as a
surface giving an oxidation rate corresponding to a
weighted average of the rates of all of the crystal
faces. On the other hand, if the major surface is a
(100), then the naverage surface" will oxidize about 3
times as fast as the (100) face and the edge of the sam-
ple will represent 30% of the total uptake by the sample.
Calculating the kinetic rates on the basis that all of
the sample area is composed of the one crystal face,
thus leads to values approximately 7% low for the (111)
face and approximately 20% high for the (100) face.

128
These two calculations represent the range of errors
due to the presence of the edge area. For a surface
such as a (311.) at 3000 - 4000 C where the oxidation
rate is about the same as that of an average surface,
there would be no error in assuming that all of the sur-
face is the (311) surface.
2. Induction Period
It has beer, suggested by various workers (9, 109 11)
that the induction period is due to oxygen solution into
the copper lattice. It is thus desirable to investigate
iirst the data in the literature on oxygen solution in
copper and then to compare the kinetic data obtained in
this work during the induction period in the light of
this data. With this information and a knowledge of the
nature of the surface during the induction period,
speculation as to the mechanism of oxidation and the
rate controlling step can be made.
a. Solution of Gas in the Metal
The ability of copper to dissolve oxygen has been
known for many years. However, the data available from
several investigators on this solubility shows consid-
erable disagreement (Fig. 36) and the diffusion rate
of oxygen in copper has not yet been determined experi-
mentally. However, from the work of Van Der Schrick
(99 6t) on the oxidation of copper, an approximate value

4 17
of the diffusion constant for oxygen in copper can be
calculated. This calculation is made by comparing the
amount of oxide determined gravimetriclly and by electro-
metric reduction. If the difference in the two results
is taken to be the quantity of oxygen disrolved, and if
it is assumed that the surface concentration is equal
to the solubility limit of oxygen in copper (C.) at that
temperature for all times, then the diffusion coefficient
can be calculated from the equation (62):
2
D =Q dis
4tlrC s
where,
Qeis =quantity of oxygen dissolved
t = time of experiment
C = solubility limit of oxygen in copper as obtained
from Fig. 36.
An average of Van Der Schrick's data gives a value
of D at 5500 C of approximately 10- cm2/sec if an average
of the solubilities shown in Fig. 36 is used for Cs.
It is also possible to make apprnximate calculations of
the diffusion rate of oxygen in copper at 9000 C from
the work of Young (63) on the internal precipitatioa of
oxide nuclei in copper on cooling. In this work it was
found that significant oxide was precipitated at a
depth of 2 mm after a 6 hour exposure of the sample to
.1
-- I_

4 oxygen at 9000 C. From ghe formula (64)
[ 1x rC(x~t) Cs --e 2
if(x,t) is assumed to be at least Y2 Cs, then D must
be 10 6cm /se2 . This calculation has the advantage
that it is independent of CS, which is in some doubt,
but since no information is given on the maximum depth
at which oxide was formed, no calculation can be made as
to the upper limit of D. Figure 35 gives D as a function
of temperature for several diffusion species in copper
for comparison with oxygen diffusion as calculated above
(dashed line), and for oxygen diffusion in silver and
silver self diffusion.
From the fact that the oxidation rate is constant
during the induction period, it is apparent that the
diffusion of oxygen into the bulk of the sample is not
the rate controlling process. Instead, the rate con-
trolling process appears to be a surface step in which
02 is involved. Using the diffusion data in Fig. 35,
the oxidation rate calculated from Fig. 28, and the in-
duction period data from Fig. 5, the oxygen concentration
at the surfave (C s) when oxide nuclei are formed can
be calculated by the formula (62)
Cs =44
iD1t

4 T 4
where,
J = oxidation rate
D = diffusion rate
t = induction time.
Thi3 formula is valid if D is independent of con-
centration and the initial oxygen concentration in the
metal is zero.
The values of C5 obtained in this manner are a
function of oxygen pressure, crystal face, and oxidizing
temperature. They are greater the lower the temperature
and the higher the oxygen presure, and approximately an
order of magnitude larger for the (IiI) face than any
other face under similar conditions. For the (1ii) face
at i0 2 torr and 3000 C, an oxygen concentration of
I atom % is required for precipitation while for the
(100) face at 7000 C at 10-3 torr a concentration of
only .01 atom % is required for precipitation. These
values which indicate the range of concentration are
considerably above the solubility limits given in Fig 36.
This is to be expected since the solubility limit values
in Fig. 36 represent the concentration of oxygen in copper
which exists in equilibrium with copper oxide. On the
other hand, the critical concentrations determined above
represent the oxygen concentration in copper which will
cause the precipitation of an oxide phase at a moderately

132
D m,.E)CU SURFACE F. IN O0
H20I
I0"*/i• •~BULK DIFF. /
io
AG IN
CU IN
i0-•
33
lo"•
1041
TEMP (C)
I I I400" 500" 600- 700" 800" 9000
FIGURE 35
DIFFUSION RATES IN COPPER AND SILVER METAL.

rapid rate. This supersaturation of the copper lattice
is a necessary requirement for the nucleation of an
oxide phase, because there exists an activation energy
for nucleating a new phase. In this case, the activation
energy not only involves the free~ energies of the various
surfaces but also the hydrostatic strains due to the
larger molar volume of the precipitate (65).
A second observation which supports the existence
of a large supersaturation of the copper lattice at low
temperatures is that once oxide nuclei are formed,
essentially all of the oxygen thrnt had been taken up
by the sample during the induction period is precipitated
on the surface. That is, if one looks at the time series
of oxidation on the (Mi) face at 4000 C9 which is shown
in Fig. 8, the amount of oxide on the surface at 5 minutes
is not equivalent to the amount of oxygen taken up by
the sample in the interval from the preceding licture.
It is equivalent to the total amount of oxygen taken up
by the sample since the oxidation began. When oxida-
tions are perfrLued at temperatures above 6000 C, the
supersaturation which occurs is much smaller and a
significant portion of the oxygen taken up by the sample
is lost to solution into the bulk and thus does not
precipitate on the surface. It is therefore concluded
that solution1 of oxygen in the metait is a reasonable
explanation of the induction period.

134
10-1
ATOM % SOLUBILITY OF GAS IN COPPER
i0-2
46
3110"3-
TEMP (*C)
I I I I I
500" 600" 700" 800' 9000 ;0000
FIGURE 36
SOLUBILITY OF GASES IN COPPER.

4
- -~ 13 ]
IThe other possible explanations, dissociation of
the oxide to metal and oxygen and evaporation of the
oxide can be ruled out by the arguments presented by
Van Der Schrick (9). The possibility that the induction
period is duet, to reduction of the oxide by residual
gases in the vacuum system or by dissolved gases in the
sample can also be eliminated. The first because the
concentration of residual gases in the system is known
to be much too small. The second because variation of
outgassing treatments fail to influence the duration
of the induction period except in the case when hydrogen
is known to be dissolved in the sample.
b. Nature of Surface
The fact that the sticking coefficients obtained
in this work for the induction period were on the order
of 10-5 indicates that the metal surface is covered by
a layer of some type. This is based on the fact that
low energy electron diffraction (LEED) work indicates
that oxygen chemisorption on a clean copper surface is
essentially non-activated (66) and thus, for a clean
copper surface, a sticking coefficient of approximately
one would be expected.
It is suggested, from the discussion in Section
V-B-i, that the surface of the metal during the induction
period is actually covered with a chemisorbed structure
consisting of both oxygen and copper atoms. Such a layer

on the surface would deoreaoe the probability that an
arriving oxygen molecule would stick and the low sticking
coefficients nbserved would be expected.
c. Rate Controlling Step
The rate controlling process must take place on
or across this surface adsorption structure since it
involves the oxygen molecule as shown by the linear
dependence of oxidation rate on oxygen pressure. Trapnell
(67) suggests that the limiting process may be the trans-
fer of oxygen into the underlying lattice by a place
exchange mechanism which requires an 02 molecule on the
surface before it can occur. Another ptossible limiting
mechanism is the transfer of electrons through the
chemisorbed 3tructure to the 02 molacules on the surface.
This is similar to the mechnnism proposed by Rideal and
Jones (68) in 1929 for the rate controlling step in the
oxidation of metals such as tungsten in which the oxides
produced are volatile.
It would appear that the magnitude of the activa-
tion energy, the frequency factor and thei.r variation
with crystal face could be used to determine if one of
these models is correct. However, too little is known
at this time to make such an evaluation.
3. Nucleation and Growth Period:
At the end of the induction period tLere was no

137
abrupt change in the oxidation rate. Instead, the rate
slowly decreased from the J = Ic law tc a law closely
approximated by J = lct-'3. !It is suggested that this
decrease In the oxidation rate s due to thie covering -
up of tna metal surface by th• o•xide nuclei.
If the .roba';Ality of an oxygen molecule rtrik-.ug
an cxde n'il3eus and being nermanently retained by the
surface is !nurh loss than the probability of retention
for oxygen strllking the surface in betwr.en f.be nuclei,
then tho rate of oxidation J t er unit area wi13 le the
rai-e per anit area of metal (j ) timeg the fr'actioi of
the surface which is metal( T). That .
j(g cm 2 sec') "m (g cm- 2 sec 1 ) x equation 1)
where ATis the total surface area.
The rate J is equal to dt I the rate of change of
the total quantity of oxygon taken up by the sample.
Also, the fraction of surface which is (etalm) 1lus
IA\\fthe fraction which is oxide (AT0 must be equal to 1.
Making these two substitutions in equation 1, one obtains
A\= jU. "-(equation 2)
A-T)

136
/AoHot'ever, 'o~ is a function of Qin the following manner:
\T/
*ic' ' NVn, Thai is, the amount of oxide on the surface
per square ceitimeter is proportinnal to the volume of
the lndfvidua1 . nuclei (V n) ti•.es their density on the
iiurface in nu-.bers pi~r square Centimeter (N). If it is
assumed that the nuclei are in the form of circular
cones, then, the volume cf a nucleus is equal to Y/i'r 2h,
where r is tho radius of a nucleus, and h is the height
of a nucleus. If the height of a nueleus is proportional
to some power x of the radius, then from equation 2,
the amount ff oxide on a surfazce is related to the radius
of the nuclei by
q Co4 Vno_ r(2+x) (equation •)
The area covered by oxide is, however,
A Npr 2 and thus
2
""Aor - (equation 4)
Substituting tquý:tion 4 into equaticn 2 and rearranging,
one obtains
_ 2 d• f- dt (equation 5)
2
Since kQ +X< 1, this equation can be expanded into a
power series of the form
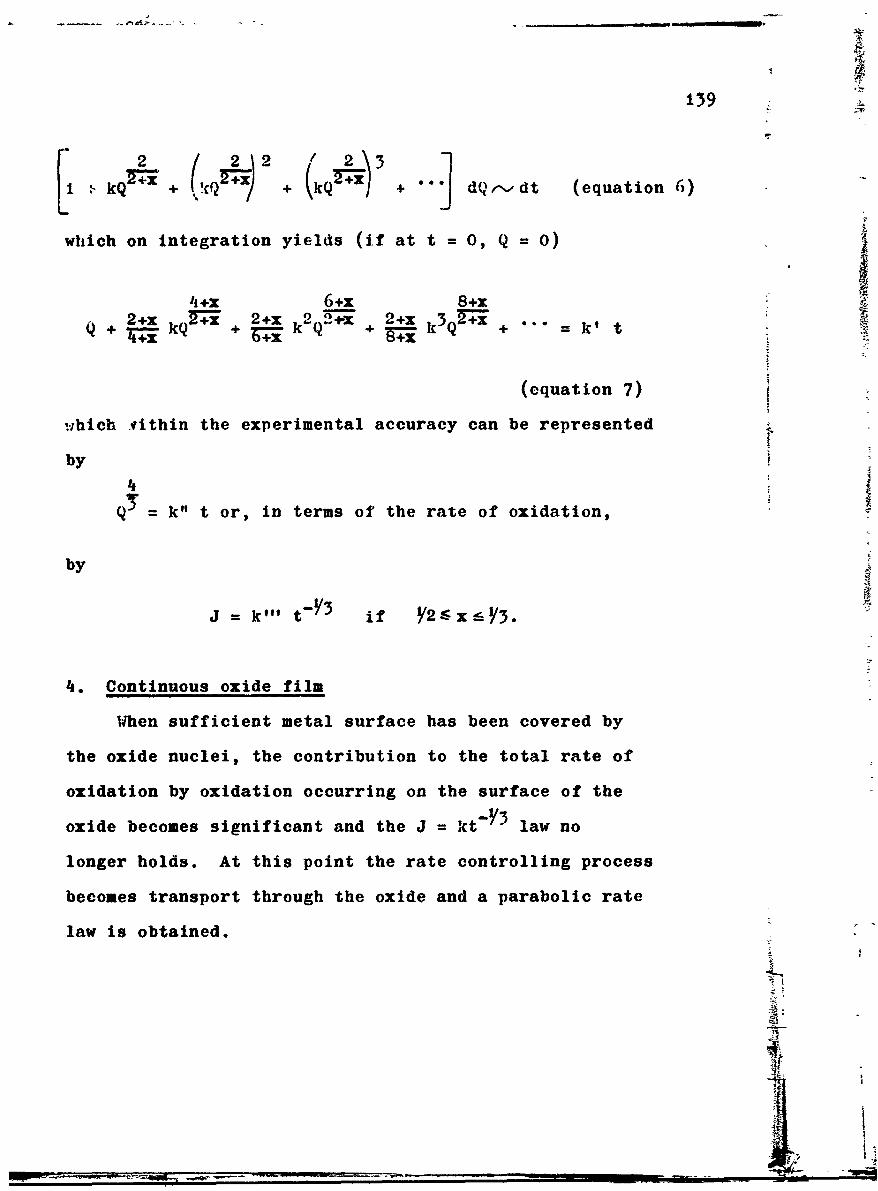
139
2L 2 2\IkQ + +Q +)k ) + dQ--dt (equation 6)
which on integration yields (if at t = 0, Q = 0)
4 +x 6+x 8+x2+x +x 2+x 2++ + "x= 4tt
Q Q + 1k + 9- k Q +
(equation 7)
which 4ithin the experimental accuracy can be represented
by
= k" t or, in terms of the rate of oxidation,
by
J = k"t t-Y 3 if Y2 xýY3.
4. Continuous oxide film
When sufficient metal surface has been covered by
the oxide nuclei, the contribution to the total rate of
oxidation by oxidation occurring on the surface of the
oxide becomes significant and the J = kt-Y3 law no
longer holds. At this point the rate controlling process
becomes transport through the oxide and a parabolic rate
law is obtained.

14')
VI. CONCLUSIONS
The early stages of the thermal oxidation of clean
copper surfaces in low pressures of oxygen between
1500 C and 9000 C have been studied. Topographic features
* of the surfaces were determined by means of optical and
electron microscope observations. Structural features
were ascertained from high energy electron diffraction
studies. Kinetic data were obtained from continuous
measurements of the oxygen pressure decrease in a closed
reactor vessel.
The general features of the reaction of oxygen with
copper were as follows:
i) For a short period of time after admitting oxygen
to the copper surface, no oxide formed. The time before
oxide appeared on the surface is referred to as the
induction period and was found to be a function of crystal
face, temperature, and oxygen pressure.
2) This induction period was followed by the sudden
appearance of isolated oxide nuclei. The number of
nuclei/cm2 grew rapidly to some maximum value and then
decreased slightly, after which the number remained
constant until the nuclei began to grow together to
produce a continuous oxide film.
A reasonable zmechanism for this oxidation process
can be proposed, based primarily on the data obtained
in this study.

141.
The first process involved in the interaction of
oxygen with clean copper surfaces is chemisorption.
This process is essentially non-activated and the sticking
coefficient is high. Thus, at a pressure in he range
of 10-4 to iO2 torr a complete adsorption layer would
be formed in less than a second. This chemisorbed layer
is rapidly converted to an ordered adsorption structure
by a process of diffusion of both copper and oxygen atoms.
Evidence for the formation and existence of such a struc-
ture comes both from LEED studies and from high energy
electron diffraction data. This adsorbed layer is
remarkably protective and the sticking coefficient falls
to values of about 10-5.
Oxygen adsorption on this structure is associated
with the solution of oxygen into the metal lattice.
Electron diffraction and electron microscope data give
no indication of the formation of an oxide phase during
this induction period. The kinetic data obtained during
this solution process reveal that the rate of oxygen
uptake by the sample is directly proportional to the
oxygen pressure and the rate is constant with respect to
time. This indicates that the adsorption layer on the
metal is essentially unchanged during this process and
that the rate controlling step involves the oxygen
molecule.
When sufficient oxygen has dissolved into the

142
metal to produce a critical concentration of oxygen in
the copper lattice, cuprous oxide is precipitated. This
critical concentratioh, is probably closely related to
the stresses created in the lattice as a result of the
oxygen solution. This precipitation of oxide nroduces
nuclei distributed randomly over the surface. The initi.xl
growth of these oxide nuce"i reduces the oxygen concen-
tration in their vicinity and further nucleation of oxide
can no longer occur. At this time there exist many
nuclei on the surface, the smaller of which are incor-
porated into the larger nuclei by a proces3 of Ostwald
ripening. The final number of nuclei/cm2 is directly
proportional to the oxygen flux as would be expected if
tha mechanism of precipitation were diffusion controlled.
The oxide nuclei grow predominantly laterally on
the surface of the metal with only a slight increase in
thickness with time. The kinetic data during this growth
period indicate that the rate controlling process is the
same as in the induction period. Electron diffraction
data show that an adsorption structure is present on the
surface between the oxide nuclei: The oxygen urtake
follows a Q ; = kt law. This results from the fact
that the oxidation rate is proportional to the fraction
of the metal surface which is not covered by oxide nuclei.
The mechanism of the growth of the oxide nuclei probably
involves the surface diffusion of both copper and oxygen
atoms on the adsorption structure between the nuclei.
14
I _ _ _ _ _• • • • • •• m • mmmumm
+ho nvii• nuolpi beg.in to
grow together to form a continuous oxide film. The
mechanism of growth now becomes one of bulk diffusion
through the oxide and a parabolic rate law is obtained.
-- I

411
VTTI. RTnT.TATj'nkADV
1. J. Bard lie and J. Benard, Compt. rend., ItZ, 231
(0950).
2. F. Gr~nlund, "ublications Scientifiques et Techniques,
NO N.T., 88 (1960).
~•. f. W. Harris, F. R. Ball, and A. T. Gwathmey, Acta
4 Met., 5, 574 (1957).
4. F. Grdn1und and J. Benard, Compt. rend., 240, 624
(1955).
5. J. Benard, "L'Oxydation des Metaux" (Gauthier-Villars,
ie1962), ed C, page 82.
6. E. Menzel, Z. Physik, '132, 508 (1952).
7. G. F. lihead, Trans. Faraday Soc., 61, 797 (1965).
8. A. Rb'nnnuist, J. Inst. Metals, 91, 89-94 (1962-63).
9. G. Van Der Schrick, Ph. D. Thesis, University Libre
de Bruxelles, 1960.
10. C. Kaechenbeeck-Van Der Schricec, Ph. D. Thesis,
University Libre de Bruxelles, 1962.
11. S. Menzel and W. Stossel, Naturwissenschaften, 41,
302 (1954).
12. E. Menzel and C. N:icdrhrauer, Acta Met., 10, 561
(1962).
13. R. N. Lee, Ph. D. Thesis, Brown University, 1965.
14. G. Simmons, Private communication.
_--,__.__.- ........_____

144 145"" 1 I --. J . .. • -- "So1 2 .... d-
I5. ii. z•. zaz•aamwu, i•anu 1. wud-eng, "o"-' ýuriaes anu
the Gas-Solid Interface", Advances in Chemistry
Series No. 33 (American Chemical Society, 1961),
pages 7)1, 114.
16. If. H. Orr, Ph. D. Thesis, Cornell University, 1962.
17. E. A. Gulbransen, W. R1. Me Millan, and K. F. Andrew,
J. Inst. Metals, 6, 1027 (1954).
18. U. M. Martius, Can J. Phys., 3, 466 (1955).
19. E. Menzel and C. Menzel-Kopp, Z. Naturforsch, 13a,
985 (1958).
20. W. Boggs, P. Trozzo, and G. Pellissier, J. Electrochem.
Soc., 108, 13-24 (1961).
21. F. Bouillon, Y. Bouillon-Nyssen and J. Stev':,;
"Proceedings, Fifth International Conferenct r
Electron Microscopy", Vol. 1, edited by S. Breese, Jr.,
1962, pages 66-67.
22. F. Bouillon and M. Jardinier-Offergeld, Compt. rend.,
252, 1470 (1961).
23. F. Bouillon and M. Jardinier-Offergeld, Acta Met.,
2v 104! (1961).
24. S. Leistikow and J. Oudar, Journal De Microscopie,
2, 373 (1963).
25. J. Oudar and J. Benard, Acta Met., Z, 295 (1959).
2L. R. Y. Meelheim, Dissertation, University of Virginia,
1958.
27. F. W. Young, Jr., and T. Wilson, Rev. Sci. Instr.,
32, 559 (1961).

146
28. P. Jacquet, Bull, Soc. Chim. France, ', 705 (1936).
29. H. Miley, J. Am. Chem. Soc., 59 2626 (1937).
30. J. A. Allen, Trans. Faraday Soc., 48, 273 (1952).
31. A. F. Beck and M. J. Feyor, J. Electrochem. Soc.,
108, 417 (1961).
32. D. P. Smith, "Hydrogen in Metals", (University of
Chicago Press, 1948), pages 75-77.
33. F.M. G. Johnson and ". Larose, J. Am Chem. Soc.,
46, 1377 (1924); 49, 3:..' (1927).
34. L. Spencer, J. Chem. Soc., 123, 2124 (1923).
35. C. J. Smithells and C. E. Ransley, Proc. Roy. Soc.,
A 153, 172 (1935).
36. E. Braaten and G. Clark, Proc. Roy. Soc., A 153,
504 (1936).
37. W. A. Johnson, Trans. AI;E, 224, 509 (1962).
38. J. Steigman, Wf. Shockley, and F. Nix, Phys. Rev.,
56t 13 (1939).
39. J. V. Choi and P. G. Shewman, Trans. AIME, 224,
509 (1962).
40. N. Hackerman and N. Simpson, Trans. Faraday Soc.,
52, 628 (1956).
41. N. Gjostein, Trans. AIME, 221, 1039 (1961).
42. F. J. Bradshaw, R. H. Brandon, and C. Wheeler,
Acta Met., 12, 1057 (1964).
43. F. N. Rhines and C. H. Mathewson, Trans. AIME, 111,
337 (1934).

V t7
ilt, A. Phil] !,Vs and E' N " r. :Lr jLan, -
45. ::. A. B: e,, see (4k).
46. N. ... G, s to.in, Acts. Met , et, .' ('6.).
47. E. ). 1. 'drf's and A. J. M oere, A ict:t Her.., 6,
647 (0 9().
48. P. Bonui) ,n, G. Van Der ehric;, and C. !raeecenbceeck.-
V.n Der ;ehriel: Acta Mel, ,_, 647 (1962).
1j9. G. Bohm ?nd N. Kahui¢eit, ,Iea Net., 12, 641 (1964).
50. P. Menze] and Chir. Menze-2opn, "Solid Surfaces",
(Ncrth I llr± i.ublishing, Ccmpa.aiy, 1964), pages T76-
380.
51. P. B. Sewell, Private ccrmunication.
52. P. B. Sewell and M. Cohen, Appl. Phys. Letters,
7, 32 (1965).
53. G. Krause, Chr. Menzel-Kopp, and E. Menzel, Phys.
Stat. Sol., 6, 121 (1964).
54. J. W. Matthews, "Single Crystal Films, edited by
M. H. Francombe and IH. Sato, (Mac Millan Co., 1964),
page 165.
55. A. Guinier, "Solid State Physics", edited by F. Seitz
and D. Turnbull, (Academic Press, 1959) Vol. 9,
page 294.
56. M. E. Hargreaves, Acta Cryst., _, 301 (1951).
57. A. T. Gwathmey and K. R. Lawless, "Semiconductors",
edited by Gatos, (John Wiley and Sons Inc., 1960),
page 483.
Sm mm n, m mm• • n • • •nmlmmon~~ma m Im 4

148
58. E. Menzel, if. Stossel, and Chr. Menzel-Kopp, Z.
Na-turforseh,, , 1 -'.1 404 ' I ( I*_)
59. J. H. Van der Merwe, "Single Crystal Films", edited
by M. H. Francombe and H. Sato, (Mac Millan Co.,
1964), page 139.
60. B. Boric, C. J. Sparks, Jr., and J. V. Cathcart,
Acta Met., 10, 691 (1962).
61. F. Boillon, G. Van -)er Schrick, and C. Kaeckenbeeck-
Van Der Schrick, Acta Met., 10, 647 (1962).
62. J. Crank, "Mathematics of Diffusion", (Oxford
University Press, 1956), page 30.
63. F. If, Young, Jr.- "Direct Observations of Imperfections
in Crystals", edited by J. B. Newkirk and J. H. Wirnic'c,
(Jobn Wiley and Sons, 1962), page 103.
64. P. G. Shewmon, 'Diffusion in Solids", (Me Graw-Hill
Book Co., 1963), page 14.
65. J. Hillard, "Symposium on Nucleation Phenomenon".
A. C. S. Division of Industrial and Engineering
Chemistry, Dr. A. Michaels, Chairman, 1965, page 151.
66. A. Mac Rae, Surface Sci., 1, 319 (1964).
67. M. Lanyon and B. Trapnell, Proc. Roy. Soc., A 227,
387 (1955).
68. E. Rideal and 0. Joves, Proc. Roy. Soc., A 123,
202 (1929).
.Amm


![[Emanuel Tov] Textual Criticism of the Hebrew Bibl(Bookos.org)](https://static.fdocuments.in/doc/165x107/55cf993f550346d0339c6524/emanuel-tov-textual-criticism-of-the-hebrew-biblbookosorg.jpg)
