Charitable Giving in Indiana - Lilly Family School of ... · Chapter 5: Corporate Giving in ......
95
Indiana Gives 2008 Charitable Giving in Indiana A report prepared by with support from the Indiana Grantmakers Alliance Fall 2008 This report follows a format developed with the Giving USA Foundation for Giving Memphis 2003.
Transcript of Charitable Giving in Indiana - Lilly Family School of ... · Chapter 5: Corporate Giving in ......

Indiana Gives 2008
Charitable Giving in Indiana
A report prepared by
with support from the
Indiana Grantmakers Alliance
Fall 2008
This report follows a format developed with the Giving USA Foundation for Giving Memphis 2003.

Philanthropy is a potent force for good. Every culture practices it; every culture benefits from it. Such a force must be studied and understood. It must be strengthened and focused, so that it can be put to work in the most effective way possible. The Center on Philanthropy at Indiana University does just that. As part of Indiana University-Purdue University Indianapolis (IUPUI), the Center draws on remarkable resources—and its own 20 years of experience—in its quest to establish a seamless link between philanthropic research and practice. Whether researching, studying, teaching, or developing and sharing best practices, the Center stands at the heart of philanthropy.
The Center on Philanthropy at Indiana University increases the understanding of philanthropy and improves its practice through programs in research, teaching, public service, and public affairs.
The Center on Philanthropy at Indiana University is a part of the IU School of Liberal Arts at Indiana University-Purdue University Indianapolis. The Center has academic and research programs on the IUPUI and the IU-Bloomington campuses.
The Center on Philanthropy at Indiana University 550 W. North St., Suite 301 Indianapolis, IN 46202-3272 317-274-4200 www.philanthropy.iupui.edu © 2008 Trustees of Indiana University

Fall 2008 Dear Fellow Hoosier: The Center on Philanthropy at Indiana University has been fortunate to be located in a state remarkable for its philanthropy and for its communities for the past 20 years. In part as a gesture of gratitude for the institutional and individual support from Hoosiers for the Center on Philanthropy, we have offered this report, Indiana Gives, every four years starting in 1991. From these findings, nonprofit organizations can identify aspects of giving that are specific to Indiana and evaluate their own giving programs in that context. Donors could find areas that may seem comparably well-supported or under-funded as part of their environmental scan before making a significant gift. Policy makers can identify the current level of private philanthropic funding for institutions that serve statewide goals—an educated populace, healthy citizens, or safe communities. We invite you to share with us your thoughts about what that examination should cover. Please feel free to contact us at 317-278-8909. Cordially, Patrick M. Rooney, Ph.D. Interim Executive Director and Director of Research

Acknowledgments
The research about individual or household giving for Indiana Gives 2008 was funded through generous contributions to the Center on Philanthropy at Indiana University from the W.K. Kellogg Foundation. The Indiana Grantmakers Alliance funded the study of foundation giving. Several people were instrumental in completing this work— more than we have room to mention by name. We would like to thank:
Staff at the Indiana Grantmakers Alliance for providing good counsel and sharing information about Indiana grantmaking foundations; Staff at the Metropolitan Chicago Information Center (MCIC) for conducting two separate surveys —of households and corporations — required for this work;
Staff at the Foundation Center, FoundationSearch.com and NOZA, Inc. for their assistance in utilizing their databases as sources of information for the foundation and corporate giving chapters; and Mark My Word!, for professional services rendered.
Many staff members at the Center on Philanthropy at Indiana University worked on the study’s design, data analysis, preparation of text and graphics, editing, review, production assistance, and media relations. We would like to specifically mention just a few of those individuals.
Patrick Rooney, Ph.D., Principal Investigator Heidi Frederick, Project Manager on the Study Brian Getz, Introduction Long Kang, Corporate Giving Sung-Ju Kim, Individual and Corporate Giving Austin Mitchell, Foundation Giving


Indiana Gives 2008 edition about 2006
Contents
Acknowledgments ........................................................................................................................... v Key Findings ................................................................................................................................ viii Chapter 1: Introduction ................................................................................................................... 1 Chapter 2: Statewide Individual Giving .......................................................................................... 7 Chapter 3: Individual Giving in Indianapolis ................................................................................ 33 Chapter 4: Foundation Grantmaking in Indiana ............................................................................ 48 Chapter 5: Corporate Giving in Indiana ....................................................................................... 67 Chapter 6: Methodology ............................................................................................................... 85
Indiana Gives 2008 viii Key Findings
Indiana Gives 2008 Key Findings
Individuals contributed an estimated $3.86 billion. Just over 58.7 percent of Indiana households made a donation to charity in 2006 (the latest year for which individual giving data are available as of mid-2008), an 11 percentage point decrease in the share of Hoosiers who donate to charity from 2003. However, the average gift total of $2,211 per donor household was a 21 percent increase from 2003. According to the 2006 survey, religious beliefs were selected by 67.9 percent of Indiana donors as a major motivation for giving to charity and by 23.0 percent of them as a minor motivation. Hoosiers selected equity as the second highest major motivation for giving to charity. (Equity means that those with more should help those with less.) Nearly 84 percent of Indiana residents also reported that they would give more to charity if nonprofits spent more money on the people nonprofits serve rather than on administrative or fundraising expenses. In addition, 84 percent of Indiana respondents reported that they would give more if they felt more financially secure. Finally, over half (56.6 percent) of Indiana residents reported that they have stopped giving to a particular charity because the organization misled the public about its work. Indiana foundations contributed an estimated $868.1 million in 2005 (the latest year for which foundation data are available as of mid-2008) to nonprofits all over the world. An estimated 70 percent of grant dollars awarded by Indiana foundations in 2005 stayed in Indiana. Over half (50.2 percent) of all grant dollars awarded by Indiana foundations were for educational organizations, which is a slightly higher share than the 49.2 percent found in 2003 (Indiana Gives 2004). Lilly Endowment Inc. was the nation’s sixth-largest foundation by total grantmaking in 2005. Grants from Lilly Endowment account for just under half (49.2 percent) of grantmaking by Indiana’s private (independent) and community foundations. Corporate foundation grantmaking is included in corporate giving in this report. Approximately 90 percent of Indiana corporations surveyed reported making a contribution to charity in 2006. Public-society benefit organizations (e.g., United Way, community foundations) received the largest share of corporate giving from surveyed Indiana companies (22.3 percent) and Indiana corporate foundations (25.5 percent). Among surveyed companies, smaller firms had a higher average giving amount per employee ($773), than larger companies ($146).

Indiana Gives 2008 1 Chapter 1: Introduction
Indiana Gives 2008 Introduction
The nonprofit sector plays a vital role in American life. Occupying the space outside of business and government, yet influenced by both, nonprofits address peoples’ physical, intellectual and spiritual needs. Nonprofits’ unique place in society allows them not only to provide services, but also guard the values of their constituents, advocate for them and facilitate connections among all involved with the organizations.1 Nationwide, there are over 1.4 million nonprofits2 with yearly revenue of nearly $1.1 trillion3 which account for 8.3 percent of wages and salaries paid in the U.S.4 They run the gamut from large hospitals that derive their revenue mainly from fees to small social service groups run by part-time volunteers. Philanthropy is incredibly important to American nonprofits. Giving USA, published by the Giving USA Foundation and researched and written at the Center on Philanthropy at Indiana University, estimates that $294.91 billion was given to charity in 2006. Living individuals gave $222.95 billion. Corporations and corporate foundations contributed $15.40 billion, while independent and community foundations gave $34.91 billion. Bequests rounded out the total at $21.65 billion.5 Philanthropy in Indiana is just as important. There are over 60,000 nonprofits in the Hoosier state. According to Kirsten A. Grønbjerg, Efroymson Chair in Philanthropy at the Center on
Philanthropy at IU, nearly one in every 12 employees works for a nonprofit.6 In 2006, philanthropic giving in Indiana by living individuals came to $3.86 billion. Not only is giving vital to Indiana’s nonprofit sector, it shows who Hoosiers are as a people.
Background Information about Indiana 6.3 million estimated population in 2006 2.1 percent of the total U.S. population 15th most populated state in the U.S. The population of Indiana is 86.0 percent white 8.7 percent black 4.7 percent of Hispanic or Latino origin
(any race) 5.9 percent from other minority groups 872,986 Hoosiers in Marion County,
13.8 percent of Indiana’s population $45,394 median household income, below
the national average of $48,451 13 percent of people live in poverty 85 percent graduated from high school 22 percent have a bachelor's degree or
higher. 21 percent employed in education,
health care, and social assistance 21 percent employed in manufacturing 60,000 estimated charities and religious
organizations in Indiana Source: U.S. Census Bureau, 2006 American Community Survey; Grønbjerg, Kirsten, Indiana University

Indiana Gives 2008 2 Chapter 1: Introduction
Why Study Indiana? Every state has a unique mix of demographic, economic, religious and historical factors which influence giving patterns. When philanthropy data from individual states differs from benchmarks set by large, national studies like Giving USA and the Center on Philanthropy Panel Study, one must look to the differences between states. Several characteristics which set Indiana apart are examined below. It is helpful to keep these broad themes and important characteristics in mind when interpreting the data contained in this report. Indiana’s Characteristics The culture of the Midwest is largely a product of its history. Early Indiana settlers banded together to tame the frontier, relying on each other with strong social networks rather than government. As the frontier was settled, this “do it yourself” attitude stuck with Midwesterners. The Republican Party was born in this region and conservative values still run deep. The general distrust for big government and increased reliance on family, friends, churches, and nonprofits led to less government provision of social services. Indiana’s income is somewhat lower than that of other states. The state’s per capita income is $1,190 lower than the national average and its median household income is $1,117 below the national median.7 Previous research has shown that charitable giving is correlated with income. As a household’s income increases, so does its charitable giving.8 Therefore, it is not surprising that Indiana’s per capita giving of $1,357 was 18 percent below the national average. Religion is an important part of Hoosier life. According to a Gallup Poll, 46 percent of Hoosiers say they attend religious services once per week or nearly every week, ranking 16th in church attendance.9 Additionally, Indiana is rather homogeneously Christian. Among religious adherents, Protestants (69.9 percent) and Catholics (27.2 percent) make up the majority, while Orthodox Christian (0.8 percent), Mormon (0.9 percent), Jewish (0.6 percent), Muslim (0.4 percent), and Eastern religions (0.2 percent) round out the total.10 Accordingly, the most common reason individuals cited for their giving was religious beliefs. Also, the dollar amount given to religion was higher than any other recipient subsector. Foundation giving to religion as a percentage of total giving was 6.2 percent, more than twice the national share (2.5 percent). Oddly, religious giving by individuals as a percentage of total giving was actually lower than the national average (47 versus 61 percent). This is likely explained by higher Hoosier giving to international organizations and education. Indiana suffers from a “brain drain.” Both Hoosiers and out-of-state students at Indiana colleges have a tendency to leave after graduation for jobs elsewhere, especially on the coasts. According to Stan Jones, the state’s higher education commissioner, “The brain drain is one of the top three or four issues facing the state.”11 This difficulty is brought on by Indiana’s relative lack of high-paying jobs combined with high quality universities. One can make two negative observations and one positive comment about the “brain drain.” First, because the level of giving is correlated with educational attainment and income level, the exodus of well-educated, potential donors is reason for concern.12 Second, lack of tax dollars paid by the departing graduates, lack of jobs and businesses they could create, and the lost revenue of subsidizing their educations all have adverse effects on the state at large. Finally, however, the high quality of education at Indiana colleges, which is partially responsible for the “brain drain,” also leads to increased giving to these institutions both by Hoosiers and out-of-state graduates. Individual giving to education in Indiana is 7.0 percent of all individual giving. This is higher than the 5.5 percent national

Indiana Gives 2008 3 Chapter 1: Introduction
average. In addition, over half of all grants from Indiana foundations (not including corporate foundation grants) were for educational organizations, a 1.0 percentage point increase from 2003. The giant of Indiana philanthropy is Lilly Endowment. Created in 1937 by J. K. Lilly Sr., J. K. Lilly Jr., and Eli Lilly, the Endowment supports religion, education and community development. While it began as gifts of Eli Lilly and Company stock, it is separate from both the company and the Eli Lilly and Company Foundation. The endowment’s assets of $8.3 billion make it the seventh largest grant-making foundation in the world and the sixth largest in the United States.13 Its assets and amount given per year are nearly as large as all other Indiana foundations combined. Significantly, most of its giving remains in Indiana. In addition to raising the Indiana foundation giving per capita rate, the Endowment also explains the high percentage of giving to religion by Indiana foundations. While separate from the endowment, Eli Lilly and Company itself has an important role in Indiana philanthropy. It gave away $58.1 million in cash in 2006, but when the value of product donations is added, the total comes to more than $420 million. A reported 12.3 percent of the company’s pretax profits went to charity, mainly through the Eli Lilly and Company Foundation.14 Lilly Endowment has played a role in the development of philanthropy in Indiana in other ways as well. Indiana has 95 of the nation’s 70715 community foundations, the highest number in any state. The development of many of Indiana’s community foundations was bolstered by investments made by Lilly Endowment through its “Giving Indiana Funds for Tomorrow,” or “GIFT” initiative. 16 Additionally, United Way campaigns are strong in the Hoosier state, ranking 19th in per capita giving.17 One reason for this strength is Lilly Endowment’s support for local United Ways through the Indiana Association of United Ways. Lilly Endowment has contributed over $130 million toward capital construction and endowment development for the United Way of Central Indiana and its agencies in addition to regular annual support exceeding $4 million per year. The combined presence of community foundations and United Ways has meant that 8.4 percent of donations by individuals in Indiana go to the broad category of “public-society benefit” charities. Public-society benefit organizations include United Ways, local funds and community foundations, economic development agencies, and leadership programs. Average household giving to public-society benefit organizations is the state’s third highest ($326), just behind giving to religion ($1,814) and giving for basic needs ($381). Some public-society benefit organizations reallocate money to other organizations. This study does not track the reallocation. Objectives The goal of Indiana Gives is to report the sources, recipients, and scope of giving in Indiana. Comparisons with national data provide context and show the distinctive character of Hoosier philanthropy. Acting on careful assessment of these national benchmarks can improve both the understanding and practice of philanthropy in Indiana. This study of Indiana’s philanthropic landscape focused particularly on formal donations that qualify for tax deduction under the Internal Revenue Code. This includes donations to 501(c)3 charities as well as religious organizations. While informal philanthropy such as giving to friends and relatives, volunteering, or donating to unincorporated groups is important to American society, these forms are not included in this report.
Indiana Gives 2008 4 Chapter 1: Introduction
Indiana Gives compiles data from all areas of the private and nonprofit sectors to provide the most accurate and up-to-date information based on data available. Corporations and individuals in Indiana were surveyed to determine how much, where, and why people and organizations give to charitable causes and what types of organizations Indiana residents support with their gifts. Foundation information was obtained through IRS Forms 990-PF, as available on Guidestar.org and foundationsearch.com. Information from secondary sources is also included, such as reports from the Foundation Center, and analyzed data from the Center on Philanthropy Panel Study. There are four primary sources of charitable gifts to nonprofit organizations in the United States.
• Living Individuals, • Foundations, • Corporations and corporate foundations, and • Bequest gifts.
This report will first examine giving by source (living individuals, foundations, and corporations). Individual gifts represent the largest portion of gifts made to charitable causes in the United States. According to Giving USA 2008, individuals contributed an estimated $222.95 billion in 2006, or about 75.6 percent of the total estimated giving (including bequests) of $294.91 billion.18 These gifts, which are defined as donations of money or assets by a living individual, can range from multimillion-dollar gifts by wealthy donors to donations of food to a local food bank. Total individual giving continues to rise, from $83.24 billion in 1967 to $229.30 billion (in inflation adjusted 2007 dollars) in 2006.19
An independent or private foundation is defined as “a nongovernmental, nonprofit [entity] with its own funds… established to maintain or aid educational, social, charitable, religious, or other activities serving the common welfare, primarily by making grants to other nonprofit organizations.”20 Indiana has approximately 1,100 private or independent foundations not including corporate foundations. Indiana’s private foundations gave an estimated $793 million to charity in 2006. Another form of foundation is a community foundation. These differ from most private foundations because they generate funding from a broad range of donors to their endowments rather than from one individual, family, or organization. Indiana is home to more community foundations than any other state, with 97 of these registered entities currently operating in the Hoosier state and serving all counties.21 Indiana’s community foundations gave an estimated $75 million to nonprofit organizations. Corporations make gifts directly to charities in cash or in-kind—giving either products or equipment—and through grants made by corporate foundations funded through prior years’ corporate profits. Charitable contributions by U.S. companies and corporate foundations decreased 7.2 percent (10.1 percent adjusted for inflation in 2007 dollars) in 2006 with a rise in corporate profits.22 U.S. corporate giving as a median percent of U.S. pretax income dropped 0.4 percentage points in 2006, while corporate profits grew 24.2 percent during the same period (adjusted for inflation in 2007 dollars).23 Approximately 90 percent of Indiana corporations surveyed reported making a contribution to charity in 2006. Indiana corporate foundations

Indiana Gives 2008 5 Chapter 1: Introduction
granted a total of $77 million to nonprofits in 2006. Public-society benefit organizations (e.g., United Way, community foundations) received the largest share of corporate giving from surveyed Indiana companies (22.3 percent) and Indiana corporate foundations (25.5 percent). Charitable bequests amounted to $21.65 billion in 2006, 7.3 percent of the total given in the United States that year.24 Charitable bequests have doubled over the last forty years25, and will likely continue to grow as the wealthy choose to give away some of their savings at death rather than passing it on to relatives.26 While Indiana Gives does not gather data about charitable bequest giving, the study found that 11 percent of Hoosiers with a will had named a charity in their will. In addition, 45 percent of those who had no will said they would consider naming a charity in their will if they had one. 1 Salamon, Lester M. America's Nonprofit Sector: A Primer. 2nd ed. New York: The Foundation Center, 1999. pp. 15-17. 2 The Urban Institute, National Center for Charitable Statistics, IRS Business Master File 01/2007. Available at: http://www.nccsdataweb.urban.org. 3 The Urban Institute, National Center for Charitable Statistics, Core Files 2004, http://www.nccs.urban.org. 4 The Urban Institute, National Center on Charitable Statistics, Nonprofit Almanac 2007 (forthcoming). Preliminary estimate based on data from the U.S. Bureau of Economic Analysis.) http://www.nccs.urban.org. 5 Giving USA 2008, a publication of the Giving USA Foundation, researched and written by the Center on Philanthropy at Indiana University, p. 210. 6 Indiana Nonprofit Employment: 2007 Report, by Kirsten A. Grønbjerg, Andrea Lewis and Pauline Campbell (Bloomington, IN: Indiana University School of Public and Environmental Affairs, September, 2007). p. 1. 7 State and County QuickFacts. 2007. U.S. Census Bureau. 30 Oct. 2007 <http://quickfacts.census.gov/qfd/states/18000.html>. 8 Yoshioka, Takayuki. "Patterns of Overall Giving in COPPS 2003 (working paper)." The Center on Philanthropy at Indiana University. 24 May 2006. Center on Philanthropy at Indiana University. 1 Nov. 2007 <http://foundationcenter.org/gainknowledge/research/pdf/keyfacts_comm_2007.pdf>. 9 "Church or synagogue attendance by state." San Diego Union-Tribune 2 May 2006. 10 North American Religion Atlas. The Polis Center. 1 Nov. 2007 <http://www.religionatlas.org/default.asp?page=rel_region&ext=htm>. 11 Martin, Deanna. "Indiana Hopes to Stop Brain Drain." Boston Globe 6 Feb. 2007. 12 Yoshioka, Takayuki. "Patterns of Overall Giving in COPPS 2003 (working paper)." The Center on Philanthropy at Indiana University. 24 May 2006. Center on Philanthropy at Indiana University. 1 Nov. 2007 <http://foundationcenter.org/gainknowledge/research/pdf/keyfacts_comm_2007.pdf>. 13 Top Funders. 2007. The Foundation Center. 1 Nov. 2007 <http://foundationcenter.org/findfunders/topfunders/top100assets.html>. 14 Chronicle of Philanthropy, Charitable Giving at Major Corporations Database, available on 22 Oct. 2008. 15 "Key Facts on Community Foundations." Foundation Center. Sep. 2007. The Foundation Center. 1 Nov. 2007 <http://foundationcenter.org/gainknowledge/research/pdf/keyfacts_comm_2007.pdf>. 16 Community Development. Lilly Endowment, Inc. 1 Nov. 2007 <http://www.lillyendowment.org/cd_gift.html>. 17 Resource Development Overview Survey. Alexandria, VA: United Way of America, 2007. 18 Giving USA 2008, p. 210. 19 Ibid, p. 211. 20 Lawrence, Steven, Dia Ganguly. (2002). Foundation Yearbook, 2002. New York: The Foundation Center, p. 85. 21 Community Foundation Locator. Indiana Grantmakers Alliance. 1 Nov. 2007 <http://www.indianagrantmakers.org/locator/Index.cfm>. 22 Giving USA 2008, p. 210. 23 Ibid, p. 218. 24 Ibid, p. 210. 25 Ibid, p. 25.

Indiana Gives 2008 6 Chapter 1: Introduction
26 Schervish, Paul G., and John J. Havens. "Resource Development Overview Survey." The CASE International Journal of Educational advancement 2.2 (2001): 95-113.

Indiana Gives 2008 7 Chapter 2: Statewide Individual Giving
Indiana Gives 2008 Statewide Individual Giving
Highlights
58.7 percent of Indiana households made charitable gifts in 2006, totaling an estimated
$3.86 billion.
Among those Indiana households that donated to charity in 2006, the average amount
donated was $2,211, a 21 percent increase from 2003.
The average donation for all Indiana households in 2006, including the approximately
41.3 percent who gave nothing, was $1,357 per household. This is nearly 7.0 percent
higher than 2003.
Indianapolis-area donors gave an estimated $1.0 billion of the total $3.86 billion donated
by all Indiana households.
The average gift amount among donors in the state’s capital region was $2,142, which is
3.1 percent lower than the statewide average.
Individual gifts represent the largest portion of gifts made to charitable causes
in the United States. According to Giving USA 2008, individuals contributed an estimated
$222.95 billion in 2006, or 75.6 percent of the total estimated giving (including bequests) of
$294.91 billion nationwide. When charitable bequests are not included in the national total,
individual giving is 82 percent of giving.
Money or assets contributed by a living individual can range from multimillion-dollar gifts by
wealthy donors to donations of household items to programs such as Goodwill. Total U.S.
individual giving of $229.30 billion (adjusted for inflation in 2007 dollars) in 2006 is nearly
three times the $83.24 billion (adjusted for inflation in 2007 dollars) given by individuals in
1967.
Because contributions from individuals are such a large share of all
charitable gifts, having an accurate picture of factors that influence individual gifts will help
organizations in Indiana be more effective in their fundraising. Indiana Gives 2008 provides
results from its study of a representative 1,600 individuals from across the state who were
surveyed concerning how much, where, and why they donate.

Indiana Gives 2008 8 Chapter 2: Statewide Individual Giving
Fewer Indiana households contributed to charity in 2006 than in 2003. Among all
households, the average amount was slightly less than the national average in 2006. This
conclusion is based on data from the Indiana Gives 2008 survey and is compared with national
data from the Center on Philanthropy Panel Study (COPPS), which surveyed households in 2005
about contributions in 2004. Indiana Gives used the same survey questions as COPPS to make
the information comparable. As a national measure, COPPS is highly accurate because it reaches
more households and has a higher response rate than any other survey of giving in the United
States.1
The COPPS study shows that nationally 70.2 percent of households contributed to charity in
2005. In Indiana, 58.7 percent of households donated in 2006. Comparing with the national
percentage of donors, COPPS shows that nationally 67.0 percent of households contributed to
charity in 2003, but 70.2 percent of households contributed to charity in 2005. Almost 3 percent
more households made donations in 2005 than in 2003. However, in Indiana, 69.7 percent of
households contributed to charity in 2003. In 2006, only 58.7 percent of households contributed
to charity. Thus, fewer households in Indiana (11 percentage points fewer) contributed to charity
in 2006 than in 2003 (see Figure 1).
Figure 1
Percentage of Donors
Indiana and U.S., 2003 and 2005/06
67.0
69.770.2
58.7
Indiana U.S.2003 20032006 2005
Note: IN data is for 2003 and 2006, U.S. data is for 2003 and 2005.

Indiana Gives 2008 9 Chapter 2: Statewide Individual Giving
As shown in Figure 2, among all U.S. households including those who did not donate to charity,
the average amount donated in 2006 was $1,546.2 Among all Indiana households, the average
amount contributed to charity was $1,357 for 2006. Thus, the average total amount of giving to
charity from all Indiana households was approximately 13.9 percent less than all U.S. households
in 2006. Also, in 2003, the average total amount given to charity from all Indiana households
was $1,159 ($1,270 adjusted for inflation in 2006 dollars). Thus, the average amount contributed
by all Indiana households in 2006 was an approximate 7.0 percent increase from 2003 after
adjustments for inflation in 2006 dollars.
Figure 2
Average Total Contribution by All Households
(including Non-Donors)
Indiana and U.S., 2006 dollars
$1,270
$1,446$1,357
$1,546
Indiana U.S.2006 2003 20062003
All figures were adjusted for inflation in 2006 dollars.
Indiana Gives 2008 10 Chapter 2: Statewide Individual Giving
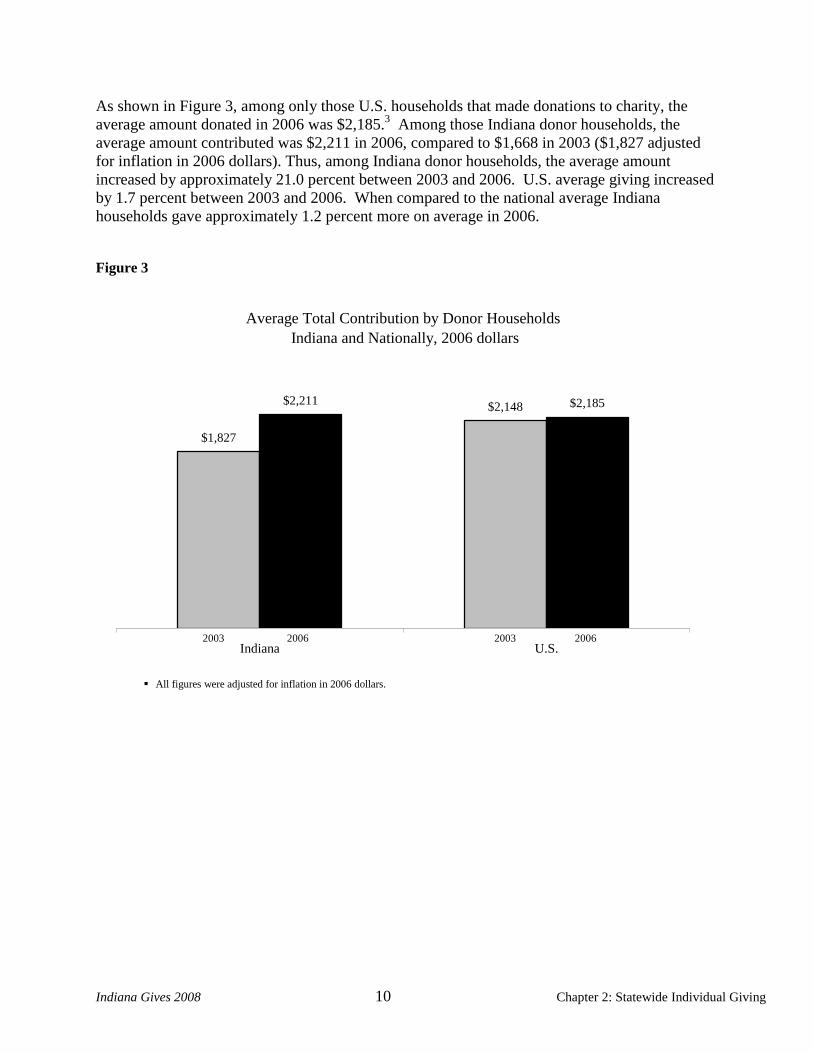
As shown in Figure 3, among only those U.S. households that made donations to charity, the
average amount donated in 2006 was $2,185.3 Among those Indiana donor households, the
average amount contributed was $2,211 in 2006, compared to $1,668 in 2003 ($1,827 adjusted
for inflation in 2006 dollars). Thus, among Indiana donor households, the average amount
increased by approximately 21.0 percent between 2003 and 2006. U.S. average giving increased
by 1.7 percent between 2003 and 2006. When compared to the national average Indiana
households gave approximately 1.2 percent more on average in 2006.
Figure 3
Average Total Contribution by Donor Households
Indiana and Nationally, 2006 dollars
$1,827
$2,148$2,211 $2,185
Indiana U.S.2006 2003 20062003
All figures were adjusted for inflation in 2006 dollars.

Indiana Gives 2008 11 Chapter 2: Statewide Individual Giving
Indiana residents gave to a variety of causes in 2006. There was little change
in the distribution of givers between 2003 and 2006. As shown in Figure 4, the estimated total
amount given to charity by Indiana households in 2006 was $3.86 billion. The estimated total
was $4.086 billion in 2003 (adjusted for inflation in 2006 dollars), approximately 5.5 percent
higher than in 2006. In addition, as shown in Figure 4, the largest share, 47.0 percent of the total
amount donated to charity in 2006, went to religion, which includes houses of worship, media
ministries, and other types of religious groups. In 2006, the share of donations to religion by
Indiana donor households was 2.8 percentage points lower than in 2003.
Figure 4
Indiana Donor Households' Giving, by Type of Recipient, 2006
$3.862 Billion Total Estimated Household Giving
Public-society benefit
$325.6
8.4%
Basic needs
$381.0
9.9%
Health
$108.0
2.8%
Religion
$1,814.0
47.0%
Other
$316.4
8.2%
Environment/animals
$91.3
2.4%
International affairs
$295.3
7.6%
Neighborhood
$86.2
2.2%
Education
$272.0
7.0%
Art & culture
$102.9
2.7%
Youth & family
$69.5
1.8%

Indiana Gives 2008 12 Chapter 2: Statewide Individual Giving
Distribution of gifts by recipient type closely parallels that of
Americans overall, which can be seen when comparing the allocation of gifts by Indiana
households with that of households across the nation (see Figure 5). Indiana households,
however, give a smaller proportion of their donations to religion than other U.S. donors. Instead,
Indiana households give a slightly larger percentage to international causes and “other” types of
organizations such as veterans’ groups.
Figure 5
Estimated Percentage of Gift Dollars by Type of Recipient,
Household Donations, 2006
1.7
1.0
1.2
1.6
4.3
5.5
1.2
2.7
9.8
10.0
61.0
1.8
2.2
2.4
2.7
2.8
7.0
7.6
8.2
8.4
9.9
47.0
Youth/family
Neghborhood
Environment/animals
Art and culture
Health
Education
International affairs
Other
Public-society benefit
Basic needs
Religion
U.S. Indiana
Indiana Gives 2008 13 Chapter 2: Statewide Individual Giving
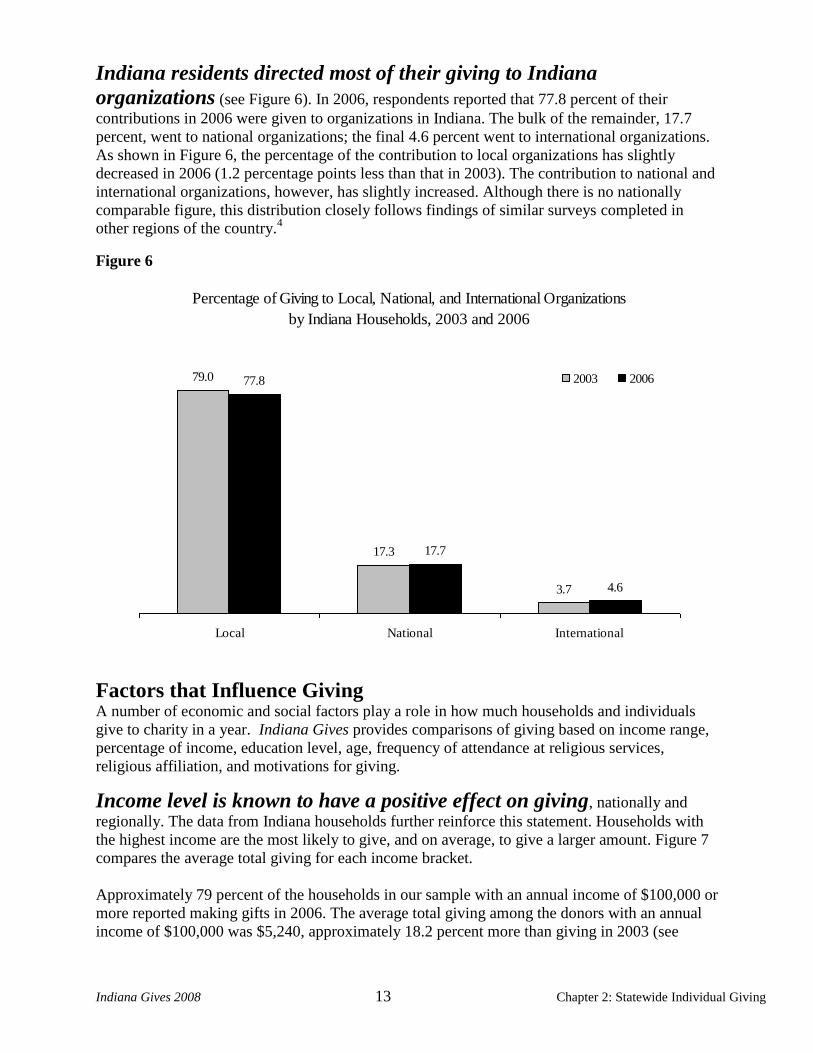
Indiana residents directed most of their giving to Indiana
organizations (see Figure 6). In 2006, respondents reported that 77.8 percent of their
contributions in 2006 were given to organizations in Indiana. The bulk of the remainder, 17.7
percent, went to national organizations; the final 4.6 percent went to international organizations.
As shown in Figure 6, the percentage of the contribution to local organizations has slightly
decreased in 2006 (1.2 percentage points less than that in 2003). The contribution to national and
international organizations, however, has slightly increased. Although there is no nationally
comparable figure, this distribution closely follows findings of similar surveys completed in
other regions of the country.4
Figure 6
Factors that Influence Giving A number of economic and social factors play a role in how much households and individuals
give to charity in a year. Indiana Gives provides comparisons of giving based on income range,
percentage of income, education level, age, frequency of attendance at religious services,
religious affiliation, and motivations for giving.
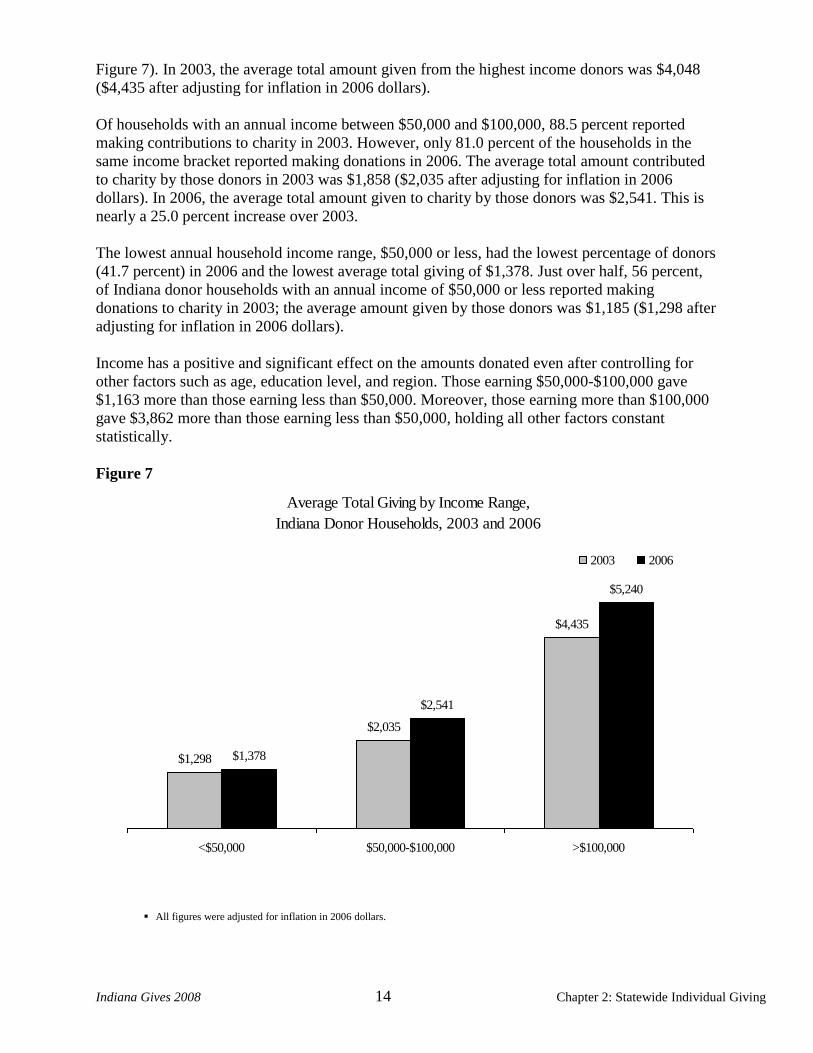
Income level is known to have a positive effect on giving, nationally and
regionally. The data from Indiana households further reinforce this statement. Households with
the highest income are the most likely to give, and on average, to give a larger amount. Figure 7
compares the average total giving for each income bracket.
Approximately 79 percent of the households in our sample with an annual income of $100,000 or
more reported making gifts in 2006. The average total giving among the donors with an annual
income of $100,000 was $5,240, approximately 18.2 percent more than giving in 2003 (see
Percentage of Giving to Local, National, and International Organizations
by Indiana Households, 2003 and 2006
79.0
17.3
3.7
77.8
17.7
4.6
Local National International
2003 2006
Indiana Gives 2008 14 Chapter 2: Statewide Individual Giving
Figure 7). In 2003, the average total amount given from the highest income donors was $4,048
($4,435 after adjusting for inflation in 2006 dollars).
Of households with an annual income between $50,000 and $100,000, 88.5 percent reported
making contributions to charity in 2003. However, only 81.0 percent of the households in the
same income bracket reported making donations in 2006. The average total amount contributed
to charity by those donors in 2003 was $1,858 ($2,035 after adjusting for inflation in 2006
dollars). In 2006, the average total amount given to charity by those donors was $2,541. This is
nearly a 25.0 percent increase over 2003.
The lowest annual household income range, $50,000 or less, had the lowest percentage of donors
(41.7 percent) in 2006 and the lowest average total giving of $1,378. Just over half, 56 percent,
of Indiana donor households with an annual income of $50,000 or less reported making
donations to charity in 2003; the average amount given by those donors was $1,185 ($1,298 after
adjusting for inflation in 2006 dollars).
Income has a positive and significant effect on the amounts donated even after controlling for
other factors such as age, education level, and region. Those earning $50,000-$100,000 gave
$1,163 more than those earning less than $50,000. Moreover, those earning more than $100,000
gave $3,862 more than those earning less than $50,000, holding all other factors constant
statistically.
Figure 7
All figures were adjusted for inflation in 2006 dollars.
Average Total Giving by Income Range,
Indiana Donor Households, 2003 and 2006
$1,298
$2,035
$4,435
$1,378
$2,541
$5,240
<$50,000 $50,000-$100,000 >$100,000
2003 2006

Indiana Gives 2008 15 Chapter 2: Statewide Individual Giving
Lower income donor households gave the largest percentage of their
income to charity in 2006 (see Figure 8). Of lower income Indiana households, 41.7 percent
made donations to charity, and they donated approximately 5.5 percent of their annual income.
Middle income households (those with an income between $50,000 and $100,000) donated a
lower percentage of their income to charity in 2006; they gave 2.9 percent of their income, a
slight decrease from 2003. However, higher income donors, those with $100,000 or more in
annual income, gave slightly more than they did in 2003 (0.5 percentage points more in 2006).
Figure 8
Average Total Giving as a Percentage of Income,
Indiana Donor Households, 2003 and 2006
5.6
3.2
3.7
5.5
2.9
4.2
<$50,000 $50,000-$100,000 >$100,000
2003 2006
Indiana Gives 2008 16 Chapter 2: Statewide Individual Giving
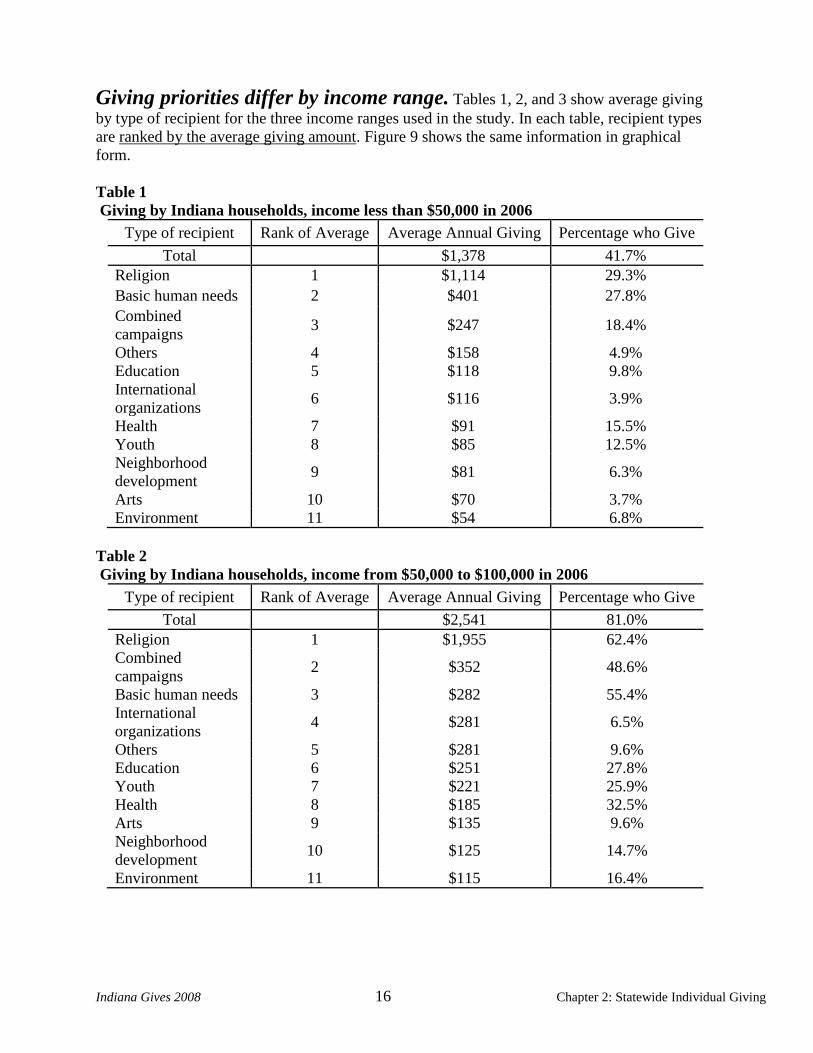
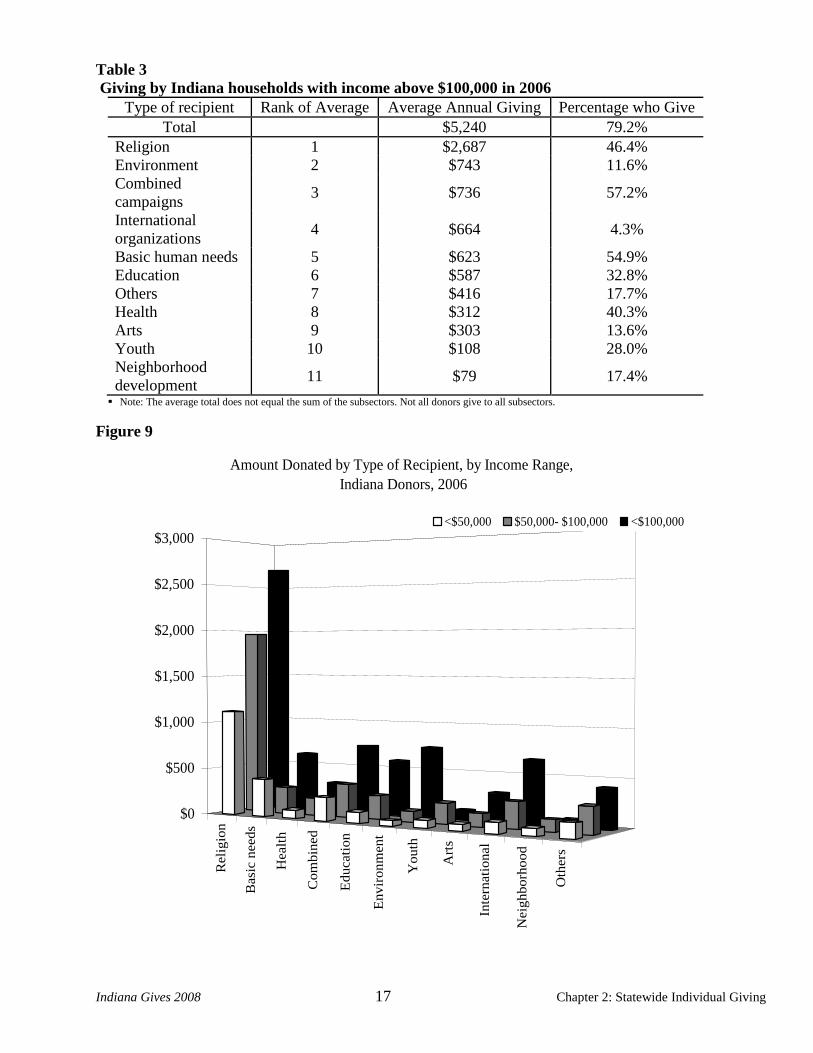
Giving priorities differ by income range. Tables 1, 2, and 3 show average giving
by type of recipient for the three income ranges used in the study. In each table, recipient types
are ranked by the average giving amount. Figure 9 shows the same information in graphical
form.
Table 1
Giving by Indiana households, income less than $50,000 in 2006
Type of recipient Rank of Average Average Annual Giving Percentage who Give
Total $1,378 41.7%
Religion 1 $1,114 29.3%
Basic human needs 2 $401 27.8%
Combined
campaigns 3 $247 18.4%
Others 4 $158 4.9%
Education 5 $118 9.8%
International
organizations 6 $116 3.9%
Health 7 $91 15.5%
Youth 8 $85 12.5%
Neighborhood
development 9 $81 6.3%
Arts 10 $70 3.7%
Environment 11 $54 6.8%
Table 2
Giving by Indiana households, income from $50,000 to $100,000 in 2006
Type of recipient Rank of Average Average Annual Giving Percentage who Give
Total $2,541 81.0%
Religion 1 $1,955 62.4%
Combined
campaigns 2 $352 48.6%
Basic human needs 3 $282 55.4%
International
organizations 4 $281 6.5%
Others 5 $281 9.6%
Education 6 $251 27.8%
Youth 7 $221 25.9%
Health 8 $185 32.5%
Arts 9 $135 9.6%
Neighborhood
development 10 $125 14.7%
Environment 11 $115 16.4%
Indiana Gives 2008 17 Chapter 2: Statewide Individual Giving
Table 3
Giving by Indiana households with income above $100,000 in 2006
Type of recipient Rank of Average Average Annual Giving Percentage who Give
Total $5,240 79.2%
Religion 1 $2,687 46.4%
Environment 2 $743 11.6%
Combined
campaigns 3 $736 57.2%
International
organizations 4 $664 4.3%
Basic human needs 5 $623 54.9%
Education 6 $587 32.8%
Others 7 $416 17.7%
Health 8 $312 40.3%
Arts 9 $303 13.6%
Youth 10 $108 28.0%
Neighborhood
development 11 $79 17.4%
Note: The average total does not equal the sum of the subsectors. Not all donors give to all subsectors.
Figure 9
Reli
gio
n
Basi
c n
eeds
Healt
h
Com
bin
ed
Educati
on
Envir
onm
ent
Youth
Art
s
Inte
rnati
onal
Neig
hborh
ood
Oth
ers
$0
$500
$1,000
$1,500
$2,000
$2,500
$3,000
Amount Donated by Type of Recipient, by Income Range,
Indiana Donors, 2006
<$50,000 $50,000- $100,000 <$100,000

Indiana Gives 2008 18 Chapter 2: Statewide Individual Giving
No matter the income, Indiana donor households gave the most on average to religion. After
religion, lower income households give the most on average to basic human needs, whereas
middle income groups give the most to combined campaigns such as United Way or Catholic
Charities, and the highest income Indiana households give the most to the environment.
Indiana residents with college degrees contributed a larger amount to
charity in 2006. Figure 10 shows the changing pattern of average giving by Indiana
donors by education level in 2003 and in 2006. In general, higher levels of education are
associated with higher giving levels. Those Indiana residents who had earned a college degree,
gave $3,100 on average to charity in 2006; those with only some college or who were high
school graduates gave $2,005 or $1,560, respectively. Indiana high school graduates gave less in
2006 than in 2003, whereas those with more education gave more in 2006 than they did in 2003.
Education attainment is positively associated with the amounts donated and grows in a fairly
linear manner with levels of education attainment, even after controlling for differences in
income and wealth.
Figure 10
Average Giving by Education Level
Indiana Donor Households, 2003 and 2006
$614
$2,009
$1,780
$2,957
$2,005$2,202*
$1,560
$3,100
<High school High school graduate Some college College degree**
2003 2006
All figures were adjusted for inflation in 2006 dollars.
* n <100, therefore a few households gave large amounts, inflating the average amount.
** College degree refers to those with bachelor’s, master’s, or any other post-secondary degree.

Indiana Gives 2008 19 Chapter 2: Statewide Individual Giving
Table 4 shows the differences between giving in Indiana and nationally, using national data from
the Center on Philanthropy Panel Study in 2005, by education level. The highest rate of giving
among all education levels was among people with a college degree, 88.5 percent of whom in
Indiana reported contributions to charity in 2006. That is higher than the national participation
rate of 86.1 percent. The average total giving of Indiana college graduates, in 2006, was $3,100;
this is 3.0 percent less than the national average of $3,193 (after adjusting for inflation in 2006
dollars).
Table 4
Giving by the Maximum Educational Level Attained by Head of Household, Indiana and
U.S.*, 2006 Education < High School High School Graduates Some College College Degree +
Locale Indiana Nation Indiana Nation Indiana Nation Indiana Nation
Percentage
of all
households
giving
22.6 44.1 52.4 63.3 64.4 75.9 88.5 86.1
Average
donation
among
donors
$2,202 $1,434 $1,560 $1,498 $2,005 $2,088 $3,100 $3,193
All figures were adjusted inflation in 2006 dollars. * National data from the Center on Philanthropy Panel Study in 2005.
Indiana donors with some college experience were less likely to give in 2006 than those with a
college degree or more (24.1 percentage points less). A lower percentage of Indiana residents
than national residents with some college contribute (11.5 percentage points less). Also, Indiana
residents with only some college experience gave a slightly lower annual amount to charity than
their national counterparts ($2,005 vs. $2,088).
Indiana respondents with a high school diploma reported a lower participation rate (52.4 percent)
than those with more education. Their average annual giving of $1,560, in 2006, was also lower
than Indiana residents with more education. Indiana high school graduates had higher levels of
giving than their national counterparts. Nationally, 63.3 percent of high school graduates with no
college experience donated to charity but donated less on average ($1,498 adjusted for inflation
in 2006 dollars).

Indiana Gives 2008 20 Chapter 2: Statewide Individual Giving
The survey also showed a connection between the age of donors and
the amount they gave. Figure 11 compares average annual giving in 2003 and 2006 for
those Indiana residents under 40, those 40 through 65 years old, and those older than 65 years.
Overall, the average amount donated to charity increased in 2006 from 2003 no matter the age
category. Particularly, the average total giving for those over 65 was almost 26.0 percent higher
than 2003, meaning that when they made donations older Hoosiers gave substantially more in
2006 than they did in 2003. Age has a small, significant positive effect on the amounts donated
by Indiana donor households in regression results, when holding all other factors constant
statistically.
Figure 11
Average Total Giving by Age Range
Indiana Donor Households, 2003 and 2006
$1,518
$2,412
$2,094
$1,585
$2,484$2,638
<40 40-65 >65
2003 2006
All figures were adjusted for inflation in 2006 dollars.
Table 5 compares Indiana giving by age group with national data from the Center on
Philanthropy Panel Study in 2005.
Table 5
Giving by Age Range, Indiana and the U.S.*, 2006
< 40 40–65 > 65
Locale Indiana Nation Indiana Nation Indiana Nation
Percentage of all
households giving 47.5 58.9 66.5 74.8 59.2 76.6
Average donation total $1,585 $1,187 $2,484 $2,362 $2,638 $2,343
All figures were adjusted for inflation in 2006 dollars.
* National data from the Center on Philanthropy Panel Study in 2005.

Indiana Gives 2008 21 Chapter 2: Statewide Individual Giving
Among Hoosiers of all ages, the average amount given to charity was noticeably higher than the
national averages. The average amount donated to nonprofits increased with age. Those over 65
years had higher average giving levels than those of other ages. Indiana residents in the
youngest cohort gave nearly $400 more than their national cohorts ($1,585 versus $1,187).
Indiana donors ages 40 to 65 gave 5.2 percent more than donors of the same age range nationally
($2,484 compared with $2,362). Finally, Indiana donors over 65 gave approximately 12.6
percent more than donors in that age range gave nationally ($2,638 compared to $2,343).
Numerous studies have shown a strong link between religious practice
and total giving.5 Indiana Gives finds that the frequency of attendance at religious services
is associated with higher levels of giving. In 2006, there was a pronounced linear relationship
between giving and worship service attendance, while in 2003 this relationship was not quite
linear. Figure 12 shows total household giving for 2006 averaged by frequency of reported
attendance at worship services.
Figure 12
Average Total Giving by Frequency of Attendance at Religious Services
Indiana Donor Households, 2003 and 2006
$2,639
$3,035
$1,608
$738
$1,200
$3,869
$1,046$760
$2,674
$1,486
More than once a
week
Once a week Once or twice a
month
A few times a year Never
2003 2006
All figures were adjusted for inflation in 2006 dollars.
Indiana Gives 2008 22 Chapter 2: Statewide Individual Giving
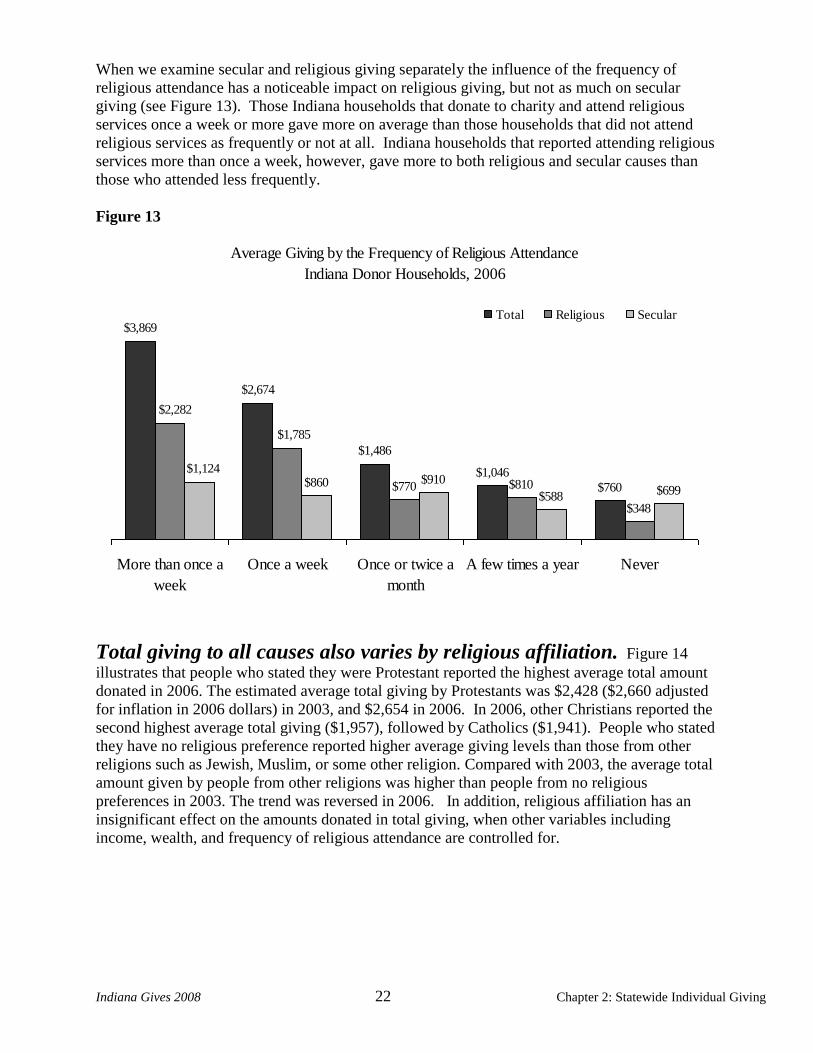
When we examine secular and religious giving separately the influence of the frequency of
religious attendance has a noticeable impact on religious giving, but not as much on secular
giving (see Figure 13). Those Indiana households that donate to charity and attend religious
services once a week or more gave more on average than those households that did not attend
religious services as frequently or not at all. Indiana households that reported attending religious
services more than once a week, however, gave more to both religious and secular causes than
those who attended less frequently.
Figure 13
Average Giving by the Frequency of Religious Attendance
Indiana Donor Households, 2006
$3,869
$2,674
$1,486
$1,046
$760$770 $810
$348
$860 $910
$588$699
$1,785
$2,282
$1,124
More than once a
week
Once a week Once or twice a
month
A few times a year Never
Total Religious Secular
Total giving to all causes also varies by religious affiliation. Figure 14
illustrates that people who stated they were Protestant reported the highest average total amount
donated in 2006. The estimated average total giving by Protestants was $2,428 ($2,660 adjusted
for inflation in 2006 dollars) in 2003, and $2,654 in 2006. In 2006, other Christians reported the
second highest average total giving ($1,957), followed by Catholics ($1,941). People who stated
they have no religious preference reported higher average giving levels than those from other
religions such as Jewish, Muslim, or some other religion. Compared with 2003, the average total
amount given by people from other religions was higher than people from no religious
preferences in 2003. The trend was reversed in 2006. In addition, religious affiliation has an
insignificant effect on the amounts donated in total giving, when other variables including
income, wealth, and frequency of religious attendance are controlled for.

Indiana Gives 2008 23 Chapter 2: Statewide Individual Giving
Figure 14
Average Total Giving by Religious Preference
Indiana Donor Households, 2003 and 2006
$2,145
$2,660
$1,797 $1,777^
$810^
$1,957
$2,654
$1,941^^
$1,207 ^^$1,227 ^^
Catholic Protestant Other Christian Other religions No religious
preference
2003 2006
All figures were adjusted for inflation in 2006 dollars.
* Respondents selected one of the following from a list of possibilities: Mormon/Latter Day Saint, Quaker, Jehovah’s Witness, Mennonite, or nondenominational Christian.
** Respondents selected one of the following from a list of possibilities: Jewish, Muslim, some other religions.
^ n = <30 ^^ n = 30~100
Indiana Gives 2008 also found that secular giving did not vary much by religious denomination;
however, religious giving did vary by denomination (see Figure 15). Protestant households who
made donations in 2006 gave more on average to religion than Catholic and Other Christian
households ($1,854 versus $1,307 and $1,421, respectively). With the exception of those who
reported other religions, secular giving by Indiana households did not vary much by
denomination.

Indiana Gives 2008 24 Chapter 2: Statewide Individual Giving
Figure 15
Average Giving by Religious Preference
Indiana Donor Households, 2006
$1,941
$2,654
$1,957
$1,207 $1,227
$869 $846 $853
$613
$865$1,025
$1,180
$1,421$1,307
$1,854
Catholic Protestant Other Christian Other religious No religious
Total Religious Secular
Nontraditional analysis—employment, metropolitan area, immediacy
of immigration, entrepreneurs, and state-level differences—presented
a complex picture of giving.
For the Indiana Gives 2008 study we also examined other variables to determine if they were
associated with giving in Indiana. The study found that even after controlling for income
differences, those employed full-time gave $359 more than those unemployed in Indiana. We
also found that recent immigrants, those who have moved to the U.S. after 1987, gave $375 less
than others households, after controlling for other differences. Being an entrepreneur and living
in a metropolitan area were not associated with differences in giving after we controlled for
income, education, age, etc.
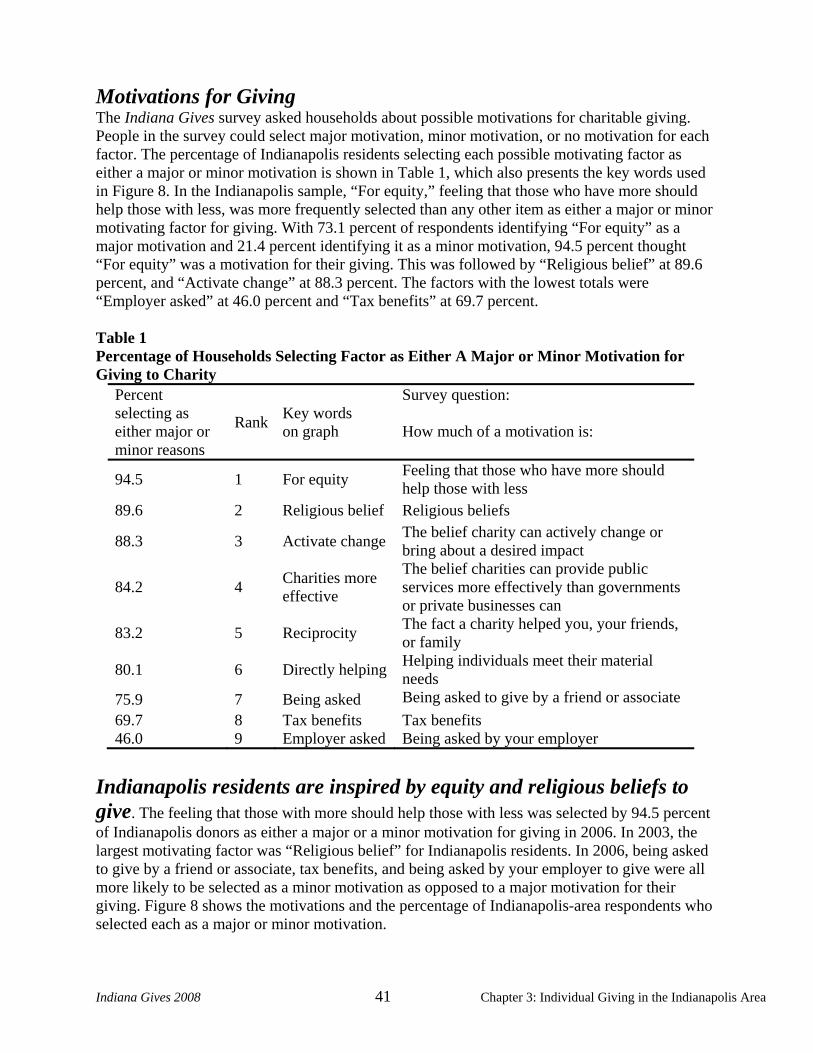
Motivation for Giving The Indiana Gives survey asked households about possible motivations for charitable giving.
People in the survey could select major motivation, minor motivation, or no motivation for each
factor. The percentage of Indianapolis residents selecting each possible motivating factor as
either a major or minor motivation is shown in Table 6, which also presents the key words used
in Figure 16.
As shown in Table 6, religious beliefs are a major motivation for giving for 90.9 percent of
respondents, which is not surprising since nearly half of all households’ donations are made to
religious institutions. Feeling that those who have more should help those with less or “For
Equity” was the second-highest major motivation for giving, reported by 89.5 percent of

Indiana Gives 2008 25 Chapter 2: Statewide Individual Giving
respondents as either a major or minor motivation. The least-cited major motivation for giving to
charity was “Employer Asked,” which was reported by only 45.4 percent of respondents.
Table 6
Percentage of Households Selecting Factor as Either a Major or Minor Motivation for
Giving to Charity
Percent
selecting as
major or
minor reason
Rank Key words
on Figure 16
and 17
Survey question:
How much of a motivation is:
90.9 1 Religious
belief Religious beliefs
89.5 2 For equity Feeling that those who have more should help those
with less
86.8 3 Reciprocity The fact a charity helped you, your friends or
family
86.3 4 Activate
change
The belief charity can activate change or bring
about a desired impact
85.2 5 Charities more
effective
The belief charities can provide public services
more effectively than governments or private
businesses can
82.8 6 Directly
helping Helping individuals meet their material needs
77.2 7 Being asked Being asked to give by a friend or associate
61.4 8 Tax benefits Tax benefits
45.4 9 Employer
asked Being asked by your employer

Indiana Gives 2008 26 Chapter 2: Statewide Individual Giving
Indiana residents were inspired by both religious beliefs and equity to
give in 2006. According to the 2006 survey, religious beliefs were selected by 67.9 percent
of Indiana donors as a major motivation for giving to charity and by 23.0 percent of them as a
minor motivation. Hoosiers selected equity as the second highest major motivation for giving to
charity. Figure 16 shows the motivation and the percentage of respondents who selected each
factor as a major or a minor motivation.
Figure 16
Percentage of Households Selecting Factor
as Major or Minor Motivation
38.2
44.2
51.1
42.3
41.6
32.6
30.1
25.5
23.0
7.2
17.2
26.1
40.5
44.7
54.2
55.1
64.0
67.9
Employer asked
Tax benefit
Being asked
Directly helping
Activate change
Reciprocity
Charities more
effective
Equity
Religious belief
Minor Major
The average total amount varied by motivating factors selected by each donor respondent. Figure
17 shows the average total giving from donors who selected each of the motivating factors as
either a major or a minor motivation in 2006. Religious beliefs as the largest reported motivation
for giving had the largest average total giving ($2,586). The second-highest average total giving
($2,467) came from the people who identified “Activate change” as a major motivation. Only

Indiana Gives 2008 27 Chapter 2: Statewide Individual Giving
44.7 percent of donors cited it as a major motivation of giving; however, they gave more money
to charity than those donors who cited “For equity” did.
Those with the third highest average total giving ($2,359) came from the people who identified
“Employer asked” as a major motivation. “Employer Asked,” however, had the lowest
percentage of respondents among motivation categories (7.2 percent). The lowest average
contribution was associated with the 17.2 percent of respondents who reported “Tax benefit” as a
major motivation.
Figure 17
Average Total Giving by Motivation Cited
Indiana Donor Households, 2006
$1,788
$1,818
$1,818
$1,945
$2,039
$2,120
$2,359
$2,467
$2,586
Tax benefit
Reciprocity
Being asked
Directly helping
Equity
Charities more
effective
Employer asked
Activate change
Religious belief

Indiana Gives 2008 28 Chapter 2: Statewide Individual Giving
Reason to Give More to Charity The Indiana Gives survey asked households about possible factors that would cause them to
increase their giving. People in the survey could select agree or disagree for each factor. The
percentage of Indiana residents selecting each possible factor is in Table 7, which also presents
the key words used in Figure 18. In the Indiana sample, “Spent more money on the people
nonprofits’ serve” was the most frequently selected factor (83.9 percent). 83.7 percent of
respondents identified “Felt financially secure” as the second-highest factor that might cause
them to give more to charity. The factors with the lowest totals were “Understanding goals and
missions” at 60.7 percent and “Volunteer for an organization” at 57.5 percent.
Table 7
Percentage of Households Agrees or Disagrees with Impediments for Giving to Charity
Percent selecting Key words
on graph
Survey question:
Agree Disagree Would give more to charity if:
83.9 14.5
Spent more money
on the people nonprofit's
serve
More money were spent on
programming rather than administration
83.7 15.7 Felt financially secure Feeling more financially secure
79.4 18.3 Able to determine
effectiveness/impact
Being able to determine the
effectiveness or impact of nonprofits
70.6 27.0 Supporting causes I
support
Knowing of more organizations that
further a cause I care about
61.0 36.0 Didn't have so much debt Didn’t have so much debt
60.7 37.6
Better understood
nonprofit's goals &
missions
Better understanding the goals and
missions of nonprofits
57.5 39.2 Volunteered
for an organization Volunteered for an organization

Indiana Gives 2008 29 Chapter 2: Statewide Individual Giving
Indiana donors reported they would give more to charity if more funds
were directed to programming at nonprofit organizations. According to the
2006 survey, almost 84 percent of all Indiana donors agreed they would give more to charity if
more funding went directly to programming rather than being spent on fundraising or
administration (see Figure 18). 83.7 percent of all respondents reported that they would give
more to charity if they felt more financially secure. Still over half of Indiana donors, 57.5
percent, reported that they would give more if they volunteered for an organization.
Figure 18
Percentage Who Said They Would Give More to Charity If They:
57.5
60.7
61.0
70.6
79.4
83.7
83.9
Volunteered
for an organization
Better understood
nonprofit's goals & missions
Didn't have so much debt
Supporting causes I support
Able to determine
effectiveness/impact
Felt financially secure
Spent more money
on the people nonprofit's serve

Indiana Gives 2008 30 Chapter 2: Statewide Individual Giving
Reasons households stopped giving to charity The Indiana Gives survey asked households about possible reasons that caused them to stop their
giving to a particular organization. People in the survey could select agree or disagree for each
factor. Responses are shown in Table 8; this table also presents the key words used in Figure 19.
Table 8
Reasons Why Respondents Stopped Supporting an Organization They Previously Supported
Percent selecting Key words
on graph
Survey question:
Agree Disagree I stopped supporting an organization
because:
56.6 43.4 Misled public Organization misled the public about its work
54.4 45.6 Lost connection I didn’t feel connected to the organization
anymore
49.6 50.4 Lack of finances My finances did not permit it
43.1 56.9 Stopped involvement I stopped my involvement with the organization
33.6 66.4 Other reasons Other reasons
19.0 81.0 No recognition Organization did not recognize or acknowledge
my contributions
16.0 84.0 Inaccurate reporting Organization did not keep accurate records of
my address or gifts
11.5 88.5 Overhead Concerns about spending too much on
administration and/or fundraising
9.5 90.5 Frequent soliciting Organization requested donations too frequently
8.3 91.7 Moved I moved to another place
8.1 91.9 Untruthful Organization was dishonest about its operation
or is untrustworthy
6.9 93.1 Changed mission Organization changed its mission or its
programs
“Misleading the public”, not “moving”, is the major reason Indiana
donors stopped supporting a charitable organization. Almost all respondents
(approximately 92.0 percent of total respondents) reported that they strongly disagree that
moving is one of the reasons for their decision to stop giving money to charitable organizations.
Figure 19 shows the reasons that donors stopped giving to nonprofit organizations. In the Indiana
sample, “organization misled the public about its work” was the most frequently selected reason
Indiana residents stopped giving to a charity (56.6 percent). The second highest reason Indiana
households stopped giving was “I didn’t feel connected to the organization anymore” reported by
54.4 percent. Nearly half (49.6 percent) of Indiana respondents reported their financial constraint
was the reason they stopped to an organization.
The organization “changed mission” was reported by 6.9 percent and the organization was
“untruthful,” meaning it was dishonest about its operation reported by 8.1 percent were the least
frequently reported reasons Indiana households stopped giving to a particular nonprofit.

Indiana Gives 2008 31 Chapter 2: Statewide Individual Giving
Figure 19
Reasons Why Respondents Stopped Supporting
an Organization They Previously Supported
6.9
8.1
8.3
9.5
11.5
16.0
19.0
33.6
43.1
49.6
54.4
56.6
Changed mission
Untruthful
Moved
Frequent soliciting
Overhead
Inaccurate
reporting
No recognition
Other reasons
Stopped
involvement
Lack of finances
Lost connection
Misled public
Indiana Gives 2008 32 Chapter 2: Statewide Individual Giving
1 Mark O. Wilhelm, associate professor of economics and philanthropic studies at IUPUI, in "The Distribution of
Giving in Six Surveys," examines six major household surveys of giving and attempts to trace the differences in
their measurements to underlying differences in survey methodology. Preliminary analysis of the results from the
newest survey, the Center on Philanthropy Panel Study (COPPS), shows that nearly every respondent (98.5
percent) answered all the survey questions about charitable giving. In other surveys, this figure can be as low as
two-thirds. Just as important, the COPPS seems to be the only survey to obtain measurements of giving, among
respondents who contribute very large amounts, which are similar to those obtained by the Filer Commission's
National Study of Philanthropy (1974). The success of the COPPS in these two dimensions is probably due to the
design of the questionnaire; the use of interviewers experienced in asking about financial issues; and the
respondents who, through their experience as participants in a long panel study, also are accustomed to answering
questions about financial matters. These advantages, combined with the sample size of 7,406 households, make
the COPPS a good tool for evaluating giving. 2 Center on Philanthropy Panel Study indicates the average amount donated by all U.S. households was $1,449 in
2004. This figure was adjusted for inflation to 2006 dollars to make it comparable. 3 Center on Philanthropy Panel Study indicates the average amount donated by donor U.S. households was $2,047
in 2004. This figure was adjusted for inflation to 2006 dollars to make it comparable. 4 Similar regional studies of Memphis and St. Louis in 2003 and giving in Illinois in 2007 showed similar
distributions. See Memphis Gives 2003, and Private Dollars for Public Good: A Report on Giving in the St. Louis
Region, and Individual giving in Illinois: Implications for the nonprofit community. 5 INDEPENDENT SECTOR, Faith and Philanthropy and data under analysis currently from the Center on Philanthropy
Panel Study (COPPS), among others.

Indiana Gives 2008 33 Chapter 3: Individual Giving in the Indianapolis Area
Indiana Gives 2008 Individual Giving in Indianapolis
Highlights
• 58.0 percent of Indianapolis households made charitable donations in 2006. • Donors in the state’s capital region gave an average of $2,142, slightly lower than the
state-wide average of $2,211. • The average donation for all households in Indianapolis, including those who gave
nothing, was $1,276 per household. • Indianapolis-area donors gave an estimated $1 billion of the total $3.86 billion that
Indiana households gave to charity.
Indianapolis is the center of the state’s largest metropolitan area, the state’s capital city, and a centrally located hub for statewide business and industry. The Indianapolis metropolitan statistical area (MSA), which encompasses Marion County and nine nearby counties,1 accounts for roughly 29 percent of the state’s entire population, with 1.8 million of Indiana’s 6.3 million residents living in these counties. The principal differences between the two populations are relatively small. The Indianapolis area is slightly more diverse ethnically, has a much higher percentage of people with a bachelor’s degree (19 percent vs. 7.3 percentage), and has a 10 percent higher median per capita income than the rest of the state ($50,841 vs. $45,394).2 Indianapolis is home to a slightly more diverse population than the rest of the state. Roughly 80 percent of the Indianapolis-area population is white, compared with 86 percent of the population of Indiana. The share of the Indianapolis area’s population identifying themselves as Black or African American was 14.4 percent while 8.7 percent of all Indiana residents identified themselves as Black or African American.3 Indianapolis-area residents tend to have higher levels of education. In Indianapolis 52.9 percent of Indiana residents had received at least some college education, while only 48.3 percent of Indiana residents in general had reached that level of education.4 On average, Indianapolis residents earn more than other state residents. According to the U.S. census, the median per capita income earned by residents of the Indianapolis MSA in 2006 was $50,841. That is below the national average of $65,527. The median income of all households in Indiana, at $45,394 in 2006, was below the national average and the average for Indianapolis.5
Indiana Gives 2008 34 Chapter 3: Individual Giving in the Indianapolis Area
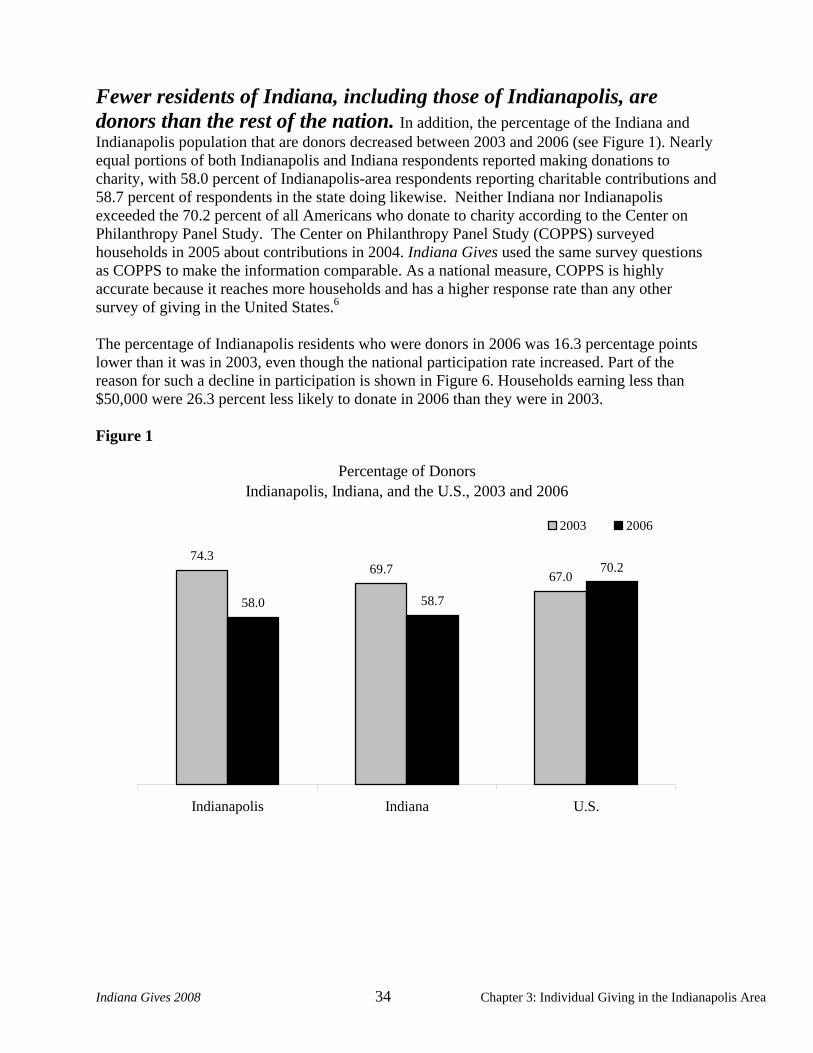
Fewer residents of Indiana, including those of Indianapolis, are donors than the rest of the nation. In addition, the percentage of the Indiana and Indianapolis population that are donors decreased between 2003 and 2006 (see Figure 1). Nearly equal portions of both Indianapolis and Indiana respondents reported making donations to charity, with 58.0 percent of Indianapolis-area respondents reporting charitable contributions and 58.7 percent of respondents in the state doing likewise. Neither Indiana nor Indianapolis exceeded the 70.2 percent of all Americans who donate to charity according to the Center on Philanthropy Panel Study. The Center on Philanthropy Panel Study (COPPS) surveyed households in 2005 about contributions in 2004. Indiana Gives used the same survey questions as COPPS to make the information comparable. As a national measure, COPPS is highly accurate because it reaches more households and has a higher response rate than any other survey of giving in the United States.6 The percentage of Indianapolis residents who were donors in 2006 was 16.3 percentage points lower than it was in 2003, even though the national participation rate increased. Part of the reason for such a decline in participation is shown in Figure 6. Households earning less than $50,000 were 26.3 percent less likely to donate in 2006 than they were in 2003. Figure 1
Percentage of Donors Indianapolis, Indiana, and the U.S., 2003 and 2006
74.369.7 67.0
58.0 58.7
70.2
Indianapolis Indiana U.S.
2003 2006

Indiana Gives 2008 35 Chapter 3: Individual Giving in the Indianapolis Area
On average, donors in the Indianapolis area gave slightly less than donors in the rest of the state and in the nation in 2006. As shown in Figure 2, in 2006, Indianapolis-area donors gave $2,142 to all causes, which was 3.1 percent less than the average of $2,211 given by donors statewide. Compared with donors throughout the U.S., Indianapolis-area donors contributed approximately 5.0 percent less than donors nationally. Nationally, donors contributed an estimated average of $2,185 ($2,255 adjusted inflation in 2006 dollars). In addition, the average amount donated by Indianapolis-area donors in 2006 slightly decreased from 2003 even though the average amount donated by both statewide and nationwide donors increased from 2003. Figure 2
Average Total Giving by Donor Households Indianapolis, Indiana, and the U.S., 2003 and 2006
$2,195
$1,827$1,961
$2,142 $2,211 $2,255
Indianapolis Indiana U.S.
2003 2006
All figures were adjusted for inflation in 2006 dollars.

Indiana Gives 2008 36 Chapter 3: Individual Giving in the Indianapolis Area
As shown in Figure 3, in 2006 average total giving for all Indiana and national households increased, except for those households in Indianapolis. The average contribution from all Indianapolis-area residents is estimated to be $1,276, which was approximately 20.6 percent less than the average in 2003. The statewide average amount contributed for all households, including those that did not contribute to charity, is estimated to be $1,357 for 2006. Figure 3
Average Total Giving by All Households Indianapolis, Indiana, and the U.S., 2003 and 2006
$1,608
$1,270 $1,320$1,276$1,357
$1,596
Indianapolis Indiana U.S.
2003 2006
All figures were adjusted for inflation in 2006 dollars.

Indiana Gives 2008 37 Chapter 3: Individual Giving in the Indianapolis Area
In general, Indianapolis-area donors’ giving priorities are consistent with national and statewide priorities. Individual donors in Indianapolis, in Indiana as a whole, and in the nation gave the largest share of their donations to religious organizations. Even though donors in the Indianapolis area and in Indiana devoted a slightly smaller share of household giving to religious organizations than donors nationally, roughly half of all donations given by individuals in Indianapolis and Indiana still went to religious causes (see Figure 4). Figure 4
Estimated Percentage of Gift Dollars by Type of Recipient, Indianapolis, Indiana, and U.S., Donor Households, 2006
2.7
1.2
9.8
61.0
8.2
2.2
2.7
7.0
2.8
9.9
4.9
3.3
3.2
2.1
7.2
3.4
9.1
7.4
49.2
1.0
1.2
1.6
1.7
5.5
4.3
10.0
2.4
7.6
1.8
8.4
47.0
6.8
3.4
Other
International affairs
Environment/animals
Neghborhood
Art and culture
Youth/family
Education
Health
Basic needs
Public-society benefit
Religion
U.S. Indiana Indianapolis

Indiana Gives 2008 38 Chapter 3: Individual Giving in the Indianapolis Area
Donors living outside Indianapolis have a significantly higher rate of support for ‘other’ organizations such as veterans groups. Indianapolis-area donors gave 3.3 percentage points less to ‘other ’organizations than Indiana donors in 2006. Individual donors nationally gave only 1.2 percent of all their donations to international affairs. In contrast, 6.8 percent of giving by individuals in Indianapolis-area and 7.6 percent of giving by Indiana donors went to international organizations in 2006. Income is directly associated with charitable giving. The data from Indianapolis-area households reinforces this statement. Households with the highest income are the most likely to give and give the most. Figure 5 compares average giving by income for Indianapolis and Indiana residents. Indianapolis-area donor households with incomes of over $100,000 in 2006 gave approximately 23 percent less than the average amount given by people in the same income brackets, but living in all of Indiana. However, the difference between Indianapolis-area and Indiana is not statistically meaningful because the Indianapolis sample contains less than 100 respondents. The average gifts by Indianapolis-area residents with incomes of $50,000 or less and between $50,000 and $100,000 were higher than the average gifts from Indiana residents in the same income brackets. Figure 5
Average Total Giving by Donor Households Income Range, Indianapolis, Indiana, and U.S. 2006
$1,436
$2,863
$1,378
$2,541
$5,240
$1,224
$1,931
$4,011$4,034*
<$50,000 $50,000- $100,000 >$100,000
Indianapolis Indiana U.S.
All figures were adjusted for inflation in 2006 dollars.
* n<100

Indiana Gives 2008 39 Chapter 3: Individual Giving in the Indianapolis Area
Nearly every high-income household gives. As shown in Figure 6, in the Indianapolis sample, 97.1 percent of respondents with an annual income of $100,000 or more reported making gifts in 2006, almost the same as the percentage in 2003. Of the households with an annual income between $50,000 and $100,000 per year, 79.2 percent reported making contributions to charity in 2006. Compared with 2003, this was approximately a 5.2 percentage points decrease. The lowest annual household income range, $50,000 or less, had the lowest percentage of donors (35.3 percent), a decrease of 26.3 percentage points from 2003. Figure 6
Percentage of Donors by Income Level, Indianapolis Households 2006
61.6
84.496.0
35.3
79.2
97.1
<$50,000 $50,000-$100,000 >$100,000
2003 2006

Indiana Gives 2008 40 Chapter 3: Individual Giving in the Indianapolis Area
Low-income Indianapolis donors gave a high percentage of their income to charity. Low-income households are less likely to contribute to charity than are high-income households, but when they do they give a higher percentage of their income to charity. About 35.3 percent of Indianapolis households with incomes below $50,000 reported making contributions. These donors gave approximately 5.2 percent of their annual income to charity in 2006. Compared with the percentage of income contributed by Indiana individuals, Indianapolis-area individuals with incomes below $50,000 gave a slightly lower percentage of their income to charity than Indiana households in 2006. Also, Indianapolis-area households with annual incomes between $50,000 and $100,000 donated 1.3 percent of their income more than households elsewhere in the state (4.2 percent vs. 2.9 percent). Indianapolis-area donors with an annual income of $100,000 or more gave a slightly lower percent of their earnings to charity, donating 3.5 percent of their gross income versus 4.2 percent. Figure 7 compares average giving as a percentage of income among these three income groups in 2006. Figure 7
Percentage of Income Contributed, Indianapolis, Indiana, and U.S. Donor Households 2006
5.2
4.2
5.5
2.9
4.3
2.72.2
3.5*
4.2
<$50,000 $50,000-$100,000 >$100,000
Indianapolis Indiana U.S.
*n<100
Indiana Gives 2008 41 Chapter 3: Individual Giving in the Indianapolis Area
Motivations for Giving The Indiana Gives survey asked households about possible motivations for charitable giving. People in the survey could select major motivation, minor motivation, or no motivation for each factor. The percentage of Indianapolis residents selecting each possible motivating factor as either a major or minor motivation is shown in Table 1, which also presents the key words used in Figure 8. In the Indianapolis sample, “For equity,” feeling that those who have more should help those with less, was more frequently selected than any other item as either a major or minor motivating factor for giving. With 73.1 percent of respondents identifying “For equity” as a major motivation and 21.4 percent identifying it as a minor motivation, 94.5 percent thought “For equity” was a motivation for their giving. This was followed by “Religious belief” at 89.6 percent, and “Activate change” at 88.3 percent. The factors with the lowest totals were “Employer asked” at 46.0 percent and “Tax benefits” at 69.7 percent. Table 1 Percentage of Households Selecting Factor as Either A Major or Minor Motivation for Giving to Charity
Percent selecting as either major or minor reasons
Rank Key words on graph
Survey question:
How much of a motivation is:
94.5 1 For equity Feeling that those who have more should help those with less
89.6 2 Religious belief Religious beliefs
88.3 3 Activate change The belief charity can actively change or bring about a desired impact
84.2 4 Charities more effective
The belief charities can provide public services more effectively than governments or private businesses can
83.2 5 Reciprocity The fact a charity helped you, your friends, or family
80.1 6 Directly helping Helping individuals meet their material needs
75.9 7 Being asked Being asked to give by a friend or associate 69.7 8 Tax benefits Tax benefits 46.0 9 Employer asked Being asked by your employer
Indianapolis residents are inspired by equity and religious beliefs to give. The feeling that those with more should help those with less was selected by 94.5 percent of Indianapolis donors as either a major or a minor motivation for giving in 2006. In 2003, the largest motivating factor was “Religious belief” for Indianapolis residents. In 2006, being asked to give by a friend or associate, tax benefits, and being asked by your employer to give were all more likely to be selected as a minor motivation as opposed to a major motivation for their giving. Figure 8 shows the motivations and the percentage of Indianapolis-area respondents who selected each as a major or minor motivation.

Indiana Gives 2008 42 Chapter 3: Individual Giving in the Indianapolis Area
Figure 8
Percentage of Households Selecting Motivation as Major Motivation or Minor Motivation
35.8
49.7
49.0
37.3
37.2
27.5
20.5
23.9
21.4
10.2
20.0
26.9
42.8
51.1
57.7
62.7
65.7
73.1
Employer asked
Tax benefit
Being asked
Directly helping
Activate change
Charities moreeffective
Reciprocity
Religious belief
Equity
Minor Major

Indiana Gives 2008 43 Chapter 3: Individual Giving in the Indianapolis Area
Reasons to Give More to Charity The Indiana Gives survey asked households about possible factors that would cause them to increase their giving. People in the survey could select agree or disagree for each factor. The percentage of Indianapolis residents selecting each possible factor is in Table 2, which also presents the key words used in Figure 9. In the Indianapolis sample, “Financial Security,” giving more if I felt more financially secure, was the most frequently selected factor. The factors with the lowest totals were “Understanding Goals and Missions” at 57.8 percent and “Volunteered for an Organization” at 57.5 percent. Table 2 Percentage of Households Agrees or Disagrees with Impediments for Giving to Charity
Percent selecting Key words on graph
Survey question: Agree Disagree Would give more to charity if:
88.1 11.9 Felt more financially secure Feeling more financially secure
82.3 15.9 Spent more money on the people nonprofit’s serve
More money was spent on programming rather than administration
77.5 19.9 Able to determine effectiveness/impact
Being able to determine the effectiveness or impact of nonprofits
73.3 26.1 Support causes I support Knowing of more organizations that further a cause I care about
60.8 35.6 Didn’t have so much debt Didn’t have so much debt
57.8 42.2 Better understood nonprofit’s goals & mission
Better understanding the goals and missions of nonprofits
57.5 42.5 Volunteered for an Organization Volunteered for an organization
As shown in Figure 9, the number one factor Indianapolis donors said would cause them to give more to charity was if they felt more financially secure, reported by 88.1 percent of respondents. This factor was followed by concerns about administrative and fundraising costs reported by 82.3 percent of Indianapolis households.

Indiana Gives 2008 44 Chapter 3: Individual Giving in the Indianapolis Area
Figure 9
Percentage Who Said They Would Gave More to Charity if They:
57.5
57.8
60.8
73.3
77.5
82.3
88.1
Volunteered for an organization
Better understoodnonprofit's goals &
mission
Didn't have so much debt
Supporting causes I support
Able to determine effectiveness/impact
Spent more money on the people nonprofit's
serve
Felt more financially secure

Indiana Gives 2008 45 Chapter 3: Individual Giving in the Indianapolis Area
Reasons households stopped giving to charity The Indiana Gives survey asked households about possible reasons that caused them to stop their giving to a particular organization. People in the survey could select agree or disagree for each factor. The responses from donors are shown in Table 3; this table also presents the key words used in Figure 10. Table 3 Reasons Why Respondents Stopped Supporting an Organization They Previously Supported
Percent selecting Key words on graph
Survey question: Agree Disagree I stopped supporting an organization because: 59.9 40.1 Misled public Organization misled the public about its work
58.2 41.8 Lost connection I didn’t feel connected to the organization anymore
48.6 51.4 Stopped involvement I stopped my involvement with the organization
46.3 53.7 Lack of finances My finances did not permit it
21.5 78.5 No recognition Organization did not recognize or acknowledge my contributions
20.9 79.1 Other reasons Other reasons
20.3 79.7 Inaccurate reporting Organization did not keep accurate records of my address or gifts
11.9 88.1 Moved I moved to another place
7.9 92.1 Overhead Concerns about spending too much on administration and/or fundraising
6.2 93.8 Untruthful Organization was dishonest about its operation or is untrustworthy
5.6 94.4 Changed mission Organization changed its mission or its programs
4.0 96.0 Frequent soliciting Organization requested donations too frequently
“Misled public” is the major reason Indianapolis donors stopped supporting a charitable organization. Almost 59.9 percent of all Indianapolis donor residents reported that they stopped giving to charity when the organization did not use the charitable money for its original purpose. It was the most frequently selected reason for Indiana donor residents as well (56.6 percent). The second highest reason Indianapolis donor households stopped giving was “I didn’t feel connected to the organization anymore,” at 58.2 percent. Almost 48.6 percent of Indianapolis respondents reported they stopped giving because they stopped their involvement with the organization. Financial constraints were the fourth highest reason Indianapolis households stopped giving, at 46.3 percent (the third highest reason for Indiana donors at 49.6 percent). Moving out of the area (11.9 percent) was not a major reason for Indianapolis donor residents to stop giving.
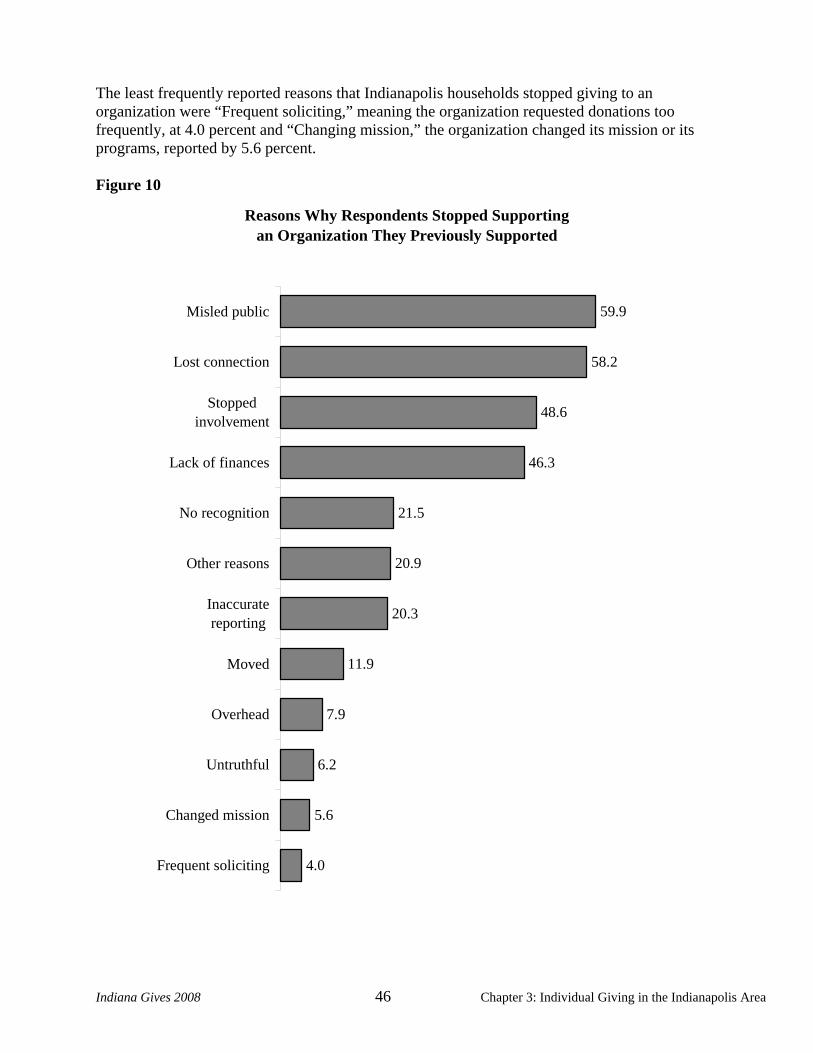
Indiana Gives 2008 46 Chapter 3: Individual Giving in the Indianapolis Area
The least frequently reported reasons that Indianapolis households stopped giving to an organization were “Frequent soliciting,” meaning the organization requested donations too frequently, at 4.0 percent and “Changing mission,” the organization changed its mission or its programs, reported by 5.6 percent. Figure 10
Reasons Why Respondents Stopped Supporting an Organization They Previously Supported
4.0
5.6
6.2
7.9
11.9
20.3
20.9
21.5
46.3
48.6
58.2
59.9
Frequent soliciting
Changed mission
Untruthful
Overhead
Moved
Inaccuratereporting
Other reasons
No recognition
Lack of finances
Stoppedinvolvement
Lost connection
Misled public

Indiana Gives 2008 47 Chapter 3: Individual Giving in the Indianapolis Area
1 Counties of the Indianapolis MSA in 2006 were Boone, Brown, Hamilton, Hancock, Hendricks, Johnson, Marion,
Morgan, Putnam, and Shelby. 2 Median per capita income found through the 2006 American Community Survey (ACS), available at http://factfinder.census.gov/servlet/DatasetMainPageServlet?_program=ACS&_submenuId=&_lang=en&_ts= 3 The percentage of the population of Indiana and Indianapolis found through the 2006 American Community Survey (ACS), available at http://factfinder.census.gov/servlet/DatasetMainPageServlet?_program=ACS&_submenuId=&_lang=en&_ts= 4 The level of education found through the 2006 American Community Survey (ACS), available at http://factfinder.census.gov/servlet/DatasetMainPageServlet?_program=ACS&_submenuId=&_lang=en&_ts= 5 Per capita income fields found through the Bureau of Economic Affairs, available at http://www.bea.gov/bea/newsrel/MPINewsRelease.htm and http://www.stats.indiana.edu/sip/rank/pcpi1.html 6 Mark O. Wilhelm, associate professor of economics and philanthropic studies at IUPUI, in "The Distribution of
Giving in Six Surveys," examines six major household surveys of giving and attempts to trace the differences in their measurements to underlying differences in survey methodology. Preliminary analysis of the results from the newest survey, the Center on Philanthropy Panel Study (COPPS), shows that nearly every respondent (98.5 percent) answered all the survey questions about charitable giving. In other surveys, this figure can be as low as two-thirds. Just as important, the COPPS seems to be the only survey to obtain measurements of giving, among respondents who contribute very large amounts, which are similar to those obtained by the Filer Commission's National Study of Philanthropy (1974). The success of the COPPS in these two dimensions is probably due to the design of the questionnaire; the use of interviewers experienced in asking about financial issues; and the respondents who, through their experience as participants in a long panel study, also are accustomed to answering questions about financial matters. These advantages, combined with the sample size of 7,406 households, make the COPPS a good tool for evaluating giving.
Indiana Gives 2008 48 Chapter 4: Foundation Grantmaking
Indiana Gives 2008 Foundation Grantmaking
Sponsored by Indiana Grantmakers Alliance
Highlights
• Indiana independent, operating, and community foundations granted an estimated total of $868.1 million in 2005 (not including corporate foundation grants). Of that amount:
o Independent and operating foundations in Indiana granted an estimated $792.8 million, and
o Community foundations granted an estimated $75.3 million. • 70 percent of the grant dollars awarded by Indiana foundations in 2005 stayed in Indiana. • Over half of all grants were for educational organizations, a 1.0 percentage point increase
from 2003. • Grants from Lilly Endowment Inc. accounted for 49.2 percent of all the dollars granted by
Indiana foundations.
The 2008 study of Indiana foundation grantmaking is a new, more comprehensive approach compared with the foundation study in Indiana Gives 2004. The 2008 study analyzes more than 11,000 grants made by independent foundations, operating foundations, and community foundations in Indiana during 2005 (the latest year available as of mid-2008). The first portion of the chapter looks at grantmaking by these three types of foundations. The second part of this chapter contains a section about community foundation grantmaking. Information used in the study was primarily obtained from online databases, including FoundationSearch.com, GuideStar.org, and FoundationCenter.org, all of which present information about funders, including forms filed with the Internal Revenue Service. In some cases, individual foundations provided information about grants they paid in 2005. All analyses are based on paid grants reported on IRS Forms 990 or 990-PF filed for 2005. Where a form was filed for a fiscal year, we used 2005/2006 if available and 2004/2005 if the later form was not yet public.
Background Information about Indiana Foundations
IRS records show for 2005:
• 1,279 Independent foundations (not all active), including
o 196 Corporate foundations o 444 Family foundations
• 95 Community foundations representing all of Indiana’s 92 counties.
Foundation Center records for 2006 show: $15.7 billion in assets for Indiana
community, independent, corporate and operating foundations
Per capita, this equates to: $2,494 in foundation assets for every person in Indiana (with Lilly Endowment assets included) $1,288 in foundation assets for every person in Indiana (excluding Lilly Endowment assets) Nationally, there are $2,087 in foundation assets for every person in the U.S.

Indiana Gives 2008 49 Chapter 4: Foundation Grantmaking
Definitions of the foundations in this chapter
• Independent foundations, generally, have a single major source of funding, and have a primary activity of making grants to charitable organizations.1 They are also known as private foundations.2 Types of independent foundations include: family foundations, special purpose foundations, and corporate foundations. Corporate foundation grantmaking is not included in this chapter (see the Corporate Giving chapter of Indiana Gives 2008 for information on corporate foundation grantmaking).
• Operating foundations are private foundations that use a large portion of their funds for
activities other than grantmaking, though operating foundations may make some grants.3 Operating foundation grantmaking accounted for an estimated 18 percent of foundation grantmaking in Indiana during 2005, according to data from The Foundation Center.4 In this study they are considered in combination with independent foundations, as the approach is very similar: a proposal consistent with the foundation’s stated goals and procedures.
• Community foundations, generally, are public charities and receive funding from
multiple sources. The community foundation uses the funds to make grants or contribute to programs that benefit specific regions or communities.5 Indiana is home to more community foundations than most other states in the U.S.6
Giving USA 2008 estimated that foundation giving (from independent, operating, and community foundations) represented 11.8 percent of all giving in 2006 when compared with giving by bequests, individuals, and corporations.7 The Foundation Center estimated $32.4 billion in giving in the U.S. during 2005 by independent, operating, and community foundations.8 Both of these figures include foundation grants paid in 2005 for disaster relief. Educational organizations received the largest share of grant dollars from Indiana foundations, followed by public-society benefit organizations. Indiana foundations made $868.1 million in grants to nonprofit organizations in 2005. Foundations gave over half of all grant dollars to educational organizations including grants to schools, universities, and libraries. Grants to public-society benefit organizations include those to United Way, Catholic Charities, and a Jewish Federation. Figures 1 and 2 show the allocation of Indiana foundation giving in 2005 by grant dollars and number of grants.9 Figure 1 indicates that Indiana foundations granted:
• The largest share to educational organizations ($435.43 million), representing more than half of all grant dollars (50.2 percent).
• The second largest amount, $130.71 million, to public-society benefit groups making up 15.1 percent of all grant dollars from Indiana foundations.
• Slightly less to human services organizations (13.9 percent) than to public-society benefit organizations (15.1 percent).
• Lesser amounts to arts and cultural (7.2 percent), religion (6.2 percent), and health (4.7 percent) organizations.

Indiana Gives 2008 50 Chapter 4: Foundation Grantmaking
• The least to organizations serving the environment/animals (1.3 percent), other/unallocated (1.1 percent), and international organizations (0.3 percent).
Figure 1
Indiana Foundations' Giving Priorities, 2005 Total Estimated Donation: $868.12
(dollars in millions)
Education $435.43
50.2%
Arts & Culture $62.667.2%
Religion$53.93 6.2%
Health $41.22 4.7%
Environment/Animals $11.27 1.3%
Other/Unallocated $9.92 1.1%
Public-Society Benefit $130.71
15.1%
International $2.56 0.3%
Human Services $120.42 13.9%
• Source: The Center on Philanthropy at Indiana University, Indiana Gives 2008. Data: FoundationSearch.com Figure includes all
grants in the Indiana Gives 2008 foundation study. See methodology for subsector categories.
Indiana foundations made grants totaling $868.1 million in 2005. Using the grants that could be categorized by type of recipient, Figure 2 shows that: • Education received the largest number of grants (2,650 or 29.5 percent). • While educational organizations received more than half of the grant dollars (50.2 percent),
they received a smaller percentage of the number of grants (29.5 percent), in part due to the larger size of the grants to education (see Table 1).10
• Public-society benefit organizations also received a smaller percentage of the number of grants (11.5 percent) than grant dollars (15.1 percent).
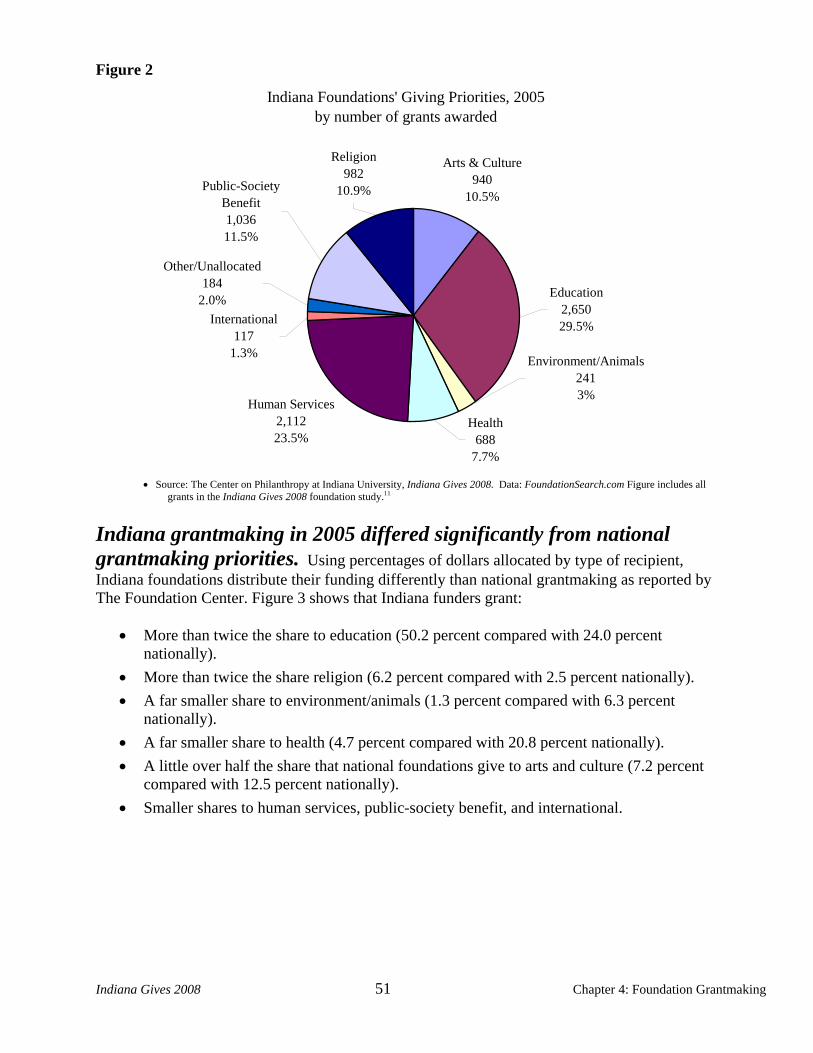
Indiana Gives 2008 51 Chapter 4: Foundation Grantmaking
Figure 2
Indiana Foundations' Giving Priorities, 2005by number of grants awarded
Human Services2,11223.5%
International117
1.3%
Public-Society Benefit1,03611.5%
Other/Unallocated184
2.0%
Health688
7.7%
Religion982
10.9%
Arts & Culture940
10.5%
Education2,65029.5%
Environment/Animals2413%
• Source: The Center on Philanthropy at Indiana University, Indiana Gives 2008. Data: FoundationSearch.com Figure includes all
grants in the Indiana Gives 2008 foundation study.11
Indiana grantmaking in 2005 differed significantly from national grantmaking priorities. Using percentages of dollars allocated by type of recipient, Indiana foundations distribute their funding differently than national grantmaking as reported by The Foundation Center. Figure 3 shows that Indiana funders grant:
• More than twice the share to education (50.2 percent compared with 24.0 percent nationally).
• More than twice the share religion (6.2 percent compared with 2.5 percent nationally). • A far smaller share to environment/animals (1.3 percent compared with 6.3 percent
nationally). • A far smaller share to health (4.7 percent compared with 20.8 percent nationally). • A little over half the share that national foundations give to arts and culture (7.2 percent
compared with 12.5 percent nationally). • Smaller shares to human services, public-society benefit, and international.

Indiana Gives 2008 52 Chapter 4: Foundation Grantmaking
Figure 3
Indiana Foundation Giving Priorities, 2005 Compared with National Foundation Giving Priorities, 2005 Percentage Distribution of Total Grant Dollars by Subsector
National Data: Foundation Center
50.2
1.3
20.8
6.3 3.6 0.14.7 1.10.3
15.17.2
13.96.2
15.512.514.824.0
2.5
Religio
n
Educat
ion
Human
servi
cesHeal
th
Arts an
d cult
ure
Public
-socie
ty be
nefit
Enviro
nmen
t/anim
als
Intern
ation
al
Other/u
nallo
cated
IndianaU.S.
• Source: The Center on Philanthropy at Indiana University, Indiana Gives 2008; Indiana Data: FoundationSearch.com. National
Data: The Foundation Center, Foundation Giving Trends 2007 Edition. Indiana data is categorized by type of organization whereas the Foundation Center categorizes by the subject of the grant.12
The distribution of Indiana grantmaking changed only slightly between 2003 and 2005. Figure 4 compares the percentages of Indiana foundation grant dollars by type of recipient for years 2003 and 2005. According to the figure, the distribution of grants to:
• Public-society benefit organizations changed the most with an increase of 5.8 percentage points, from 9.3 percent to 15.1 percent. The study using 2005 data found $34 million in grants to United Ways compared with $8 million reported in 2003. The 2005 grants also included significant grants to policy research institutes and to organizations engaged in economic development.
• Health increased 1.1 percentage points, from 3.6 percent to 4.7 percent. • Educational organizations increased 1.0 percentage point from 49.2 percent to 50.2
percent. • Religion increased 0.4 percentage points between 2003 and 2005. • Environment/animals (+0.2 percent), and international (+0.3 percent) organizations
changed only slightly. • Human services (-2.6 percent), arts and culture (-3.3 percent), and other/unallocated (-2.9
percent) organizations decreased the most in terms of percentage points.

Indiana Gives 2008 53 Chapter 4: Foundation Grantmaking
Figure 4
Indiana Foundations' Giving Priorities Percentage Distribution of Total Grant Dollars by Subsector, 2003-2005
6.2
15.1
1.14.0
0.0
9.310.5
3.6
16.5
49.2
5.81.3 1.10.3
7.24.713.9
50.2
Religio
n
Educat
ion
Human
servi
cesHeal
th
Arts an
d cult
ure
Public
-socie
ty be
nefit
Enviro
nmen
t/anim
als
Intern
ation
al
Other/u
nallo
cated
20032005
• Source: The Center on Philanthropy at Indiana University, Indiana Gives 2008 and Indiana Gives 2004.13 2005 Data:
FoundationSearch.com
A significant portion of Indiana grantmaking dollars stayed in Indiana. Figure 5 shows that 70 percent of Indiana foundation grant dollars awarded in 2005 went to organizations in Indiana. Data from Indiana Gives 2004 indicated that among the 234 independent and community foundations surveyed in Indiana, 71 percent of grant funds were allocated to Indiana organizations in 2003 – a decrease of one percentage point from 2003 to 2005. Virtually none of the grant dollars awarded were given to non-U.S. organizations. A portion (0.2 percent) could not be confirmed but it is highly probable that most grants in this category are to Indiana organizations.

Indiana Gives 2008 54 Chapter 4: Foundation Grantmaking
Figure 5
Percentage Distribution of Total Grant Dollars from Indiana Foundations by Recipient Location (dollars in millions)
U.S.$257.49 29.7%
Indiana $607.94 70.0%
Non U.S. $1.13 0.1%
Unknown, likely IN $1.560.2%
• Source: The Center on Philanthropy at Indiana University, Indiana Gives 2008. Data: FoundationSearch.com Figure includes
grants of $25 thousand or more.14 Similar to the distribution of grant dollars, nearly 69 percent of grants were made to organizations in Indiana. Figure 6 shows the number of grants awarded by recipient location. A significant minority (30.4 percent) of the number of grants was awarded in the U.S., but outside of Indiana. Comparably, an insignificant portion (0.2 percent) of the number of grants by Indiana foundations was awarded to international organizations. A portion (0.8 percent) could not be confirmed but it is highly probable that most grants in this category are to Indiana organizations. Figure 6
Percentage Distribution of the Number of Grants from Indiana Foundations by Recipient Location
U.S.30.4%
Indiana68.6%
Non U.S.0.2%
Unknown, likely IN0.8%
• Source: The Center on Philanthropy at Indiana University, Indiana Gives 2008. Data: FoundationSearch.com Figure includes
grants of $25 thousand or more.15
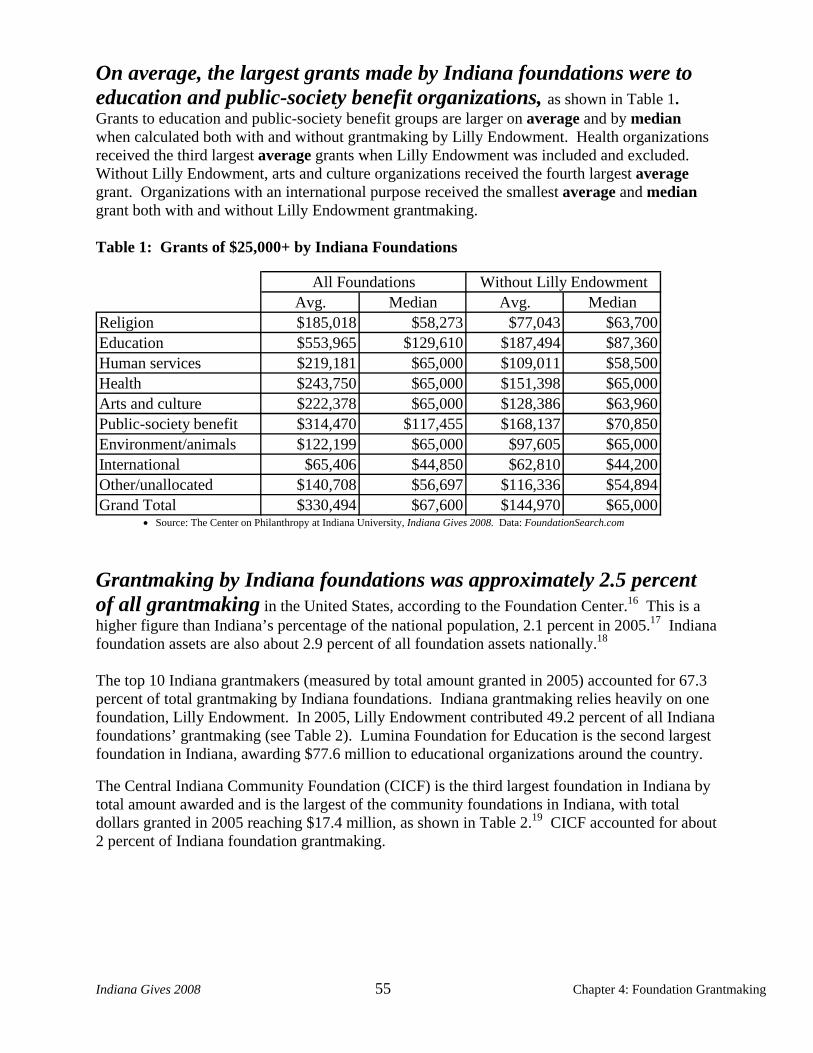
Indiana Gives 2008 55 Chapter 4: Foundation Grantmaking
On average, the largest grants made by Indiana foundations were to education and public-society benefit organizations, as shown in Table 1. Grants to education and public-society benefit groups are larger on average and by median when calculated both with and without grantmaking by Lilly Endowment. Health organizations received the third largest average grants when Lilly Endowment was included and excluded. Without Lilly Endowment, arts and culture organizations received the fourth largest average grant. Organizations with an international purpose received the smallest average and median grant both with and without Lilly Endowment grantmaking. Table 1: Grants of $25,000+ by Indiana Foundations
Avg. Median Avg. MedianReligion $185,018 $58,273 $77,043 $63,700Education $553,965 $129,610 $187,494 $87,360Human services $219,181 $65,000 $109,011 $58,500Health $243,750 $65,000 $151,398 $65,000Arts and culture $222,378 $65,000 $128,386 $63,960Public-society benefit $314,470 $117,455 $168,137 $70,850Environment/animals $122,199 $65,000 $97,605 $65,000International $65,406 $44,850 $62,810 $44,200Other/unallocated $140,708 $56,697 $116,336 $54,894Grand Total $330,494 $67,600 $144,970 $65,000
All Foundations Without Lilly Endowment
• Source: The Center on Philanthropy at Indiana University, Indiana Gives 2008. Data: FoundationSearch.com
Grantmaking by Indiana foundations was approximately 2.5 percent of all grantmaking in the United States, according to the Foundation Center.16 This is a higher figure than Indiana’s percentage of the national population, 2.1 percent in 2005.17 Indiana foundation assets are also about 2.9 percent of all foundation assets nationally.18 The top 10 Indiana grantmakers (measured by total amount granted in 2005) accounted for 67.3 percent of total grantmaking by Indiana foundations. Indiana grantmaking relies heavily on one foundation, Lilly Endowment. In 2005, Lilly Endowment contributed 49.2 percent of all Indiana foundations’ grantmaking (see Table 2). Lumina Foundation for Education is the second largest foundation in Indiana, awarding $77.6 million to educational organizations around the country. The Central Indiana Community Foundation (CICF) is the third largest foundation in Indiana by total amount awarded and is the largest of the community foundations in Indiana, with total dollars granted in 2005 reaching $17.4 million, as shown in Table 2.19 CICF accounted for about 2 percent of Indiana foundation grantmaking.
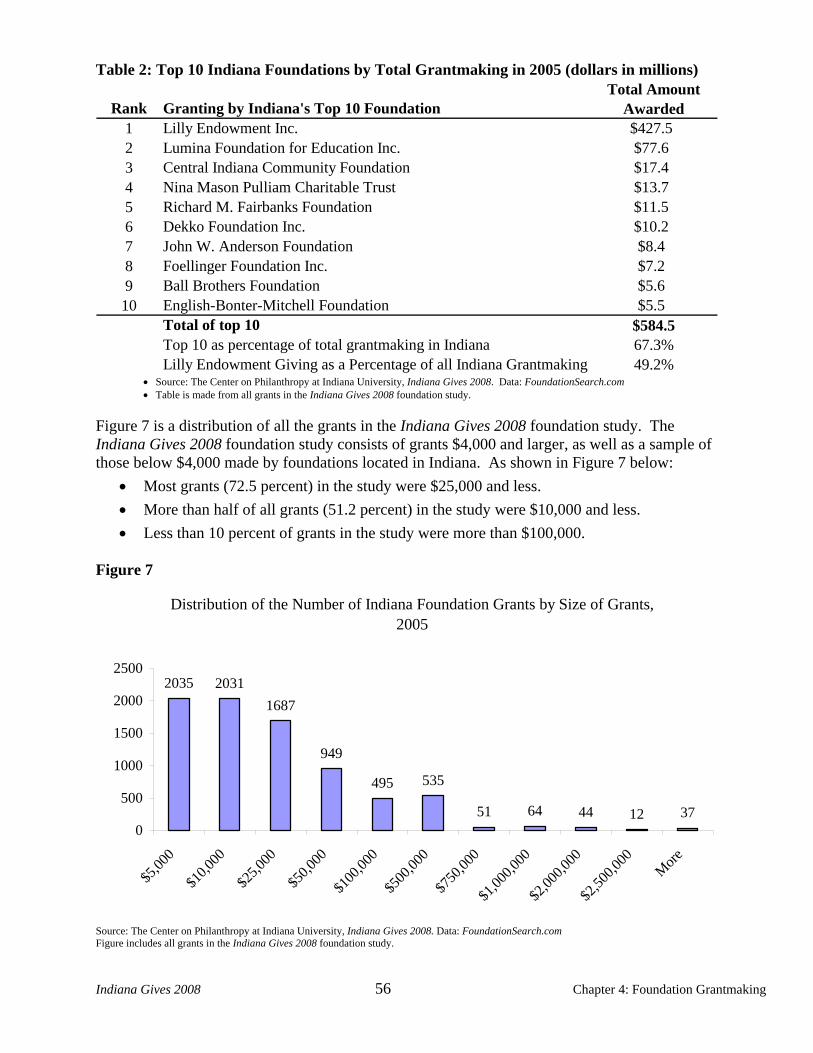
Indiana Gives 2008 56 Chapter 4: Foundation Grantmaking
Table 2: Top 10 Indiana Foundations by Total Grantmaking in 2005 (dollars in millions)
Rank Granting by Indiana's Top 10 FoundationTotal Amount
Awarded1 Lilly Endowment Inc. $427.52 Lumina Foundation for Education Inc. $77.63 Central Indiana Community Foundation $17.44 Nina Mason Pulliam Charitable Trust $13.75 Richard M. Fairbanks Foundation $11.56 Dekko Foundation Inc. $10.27 John W. Anderson Foundation $8.48 Foellinger Foundation Inc. $7.29 Ball Brothers Foundation $5.610 English-Bonter-Mitchell Foundation $5.5
Total of top 10 $584.5Top 10 as percentage of total grantmaking in Indiana 67.3%Lilly Endowment Giving as a Percentage of all Indiana Grantmaking 49.2%
• Source: The Center on Philanthropy at Indiana University, Indiana Gives 2008. Data: FoundationSearch.com • Table is made from all grants in the Indiana Gives 2008 foundation study.
Figure 7 is a distribution of all the grants in the Indiana Gives 2008 foundation study. The Indiana Gives 2008 foundation study consists of grants $4,000 and larger, as well as a sample of those below $4,000 made by foundations located in Indiana. As shown in Figure 7 below:
• Most grants (72.5 percent) in the study were $25,000 and less. • More than half of all grants (51.2 percent) in the study were $10,000 and less. • Less than 10 percent of grants in the study were more than $100,000.
Figure 7
Distribution of the Number of Indiana Foundation Grants by Size of Grants, 2005
2035 20311687
949
495 535
51 64 44 12 370
500
1000
1500
2000
2500
$5,00
0
$10,0
00
$25,0
00
$50,0
00
$100
,000
$500
,000
$750
,000
$1,00
0,000
$2,00
0,000
$2,50
0,000
More
Source: The Center on Philanthropy at Indiana University, Indiana Gives 2008. Data: FoundationSearch.com Figure includes all grants in the Indiana Gives 2008 foundation study.
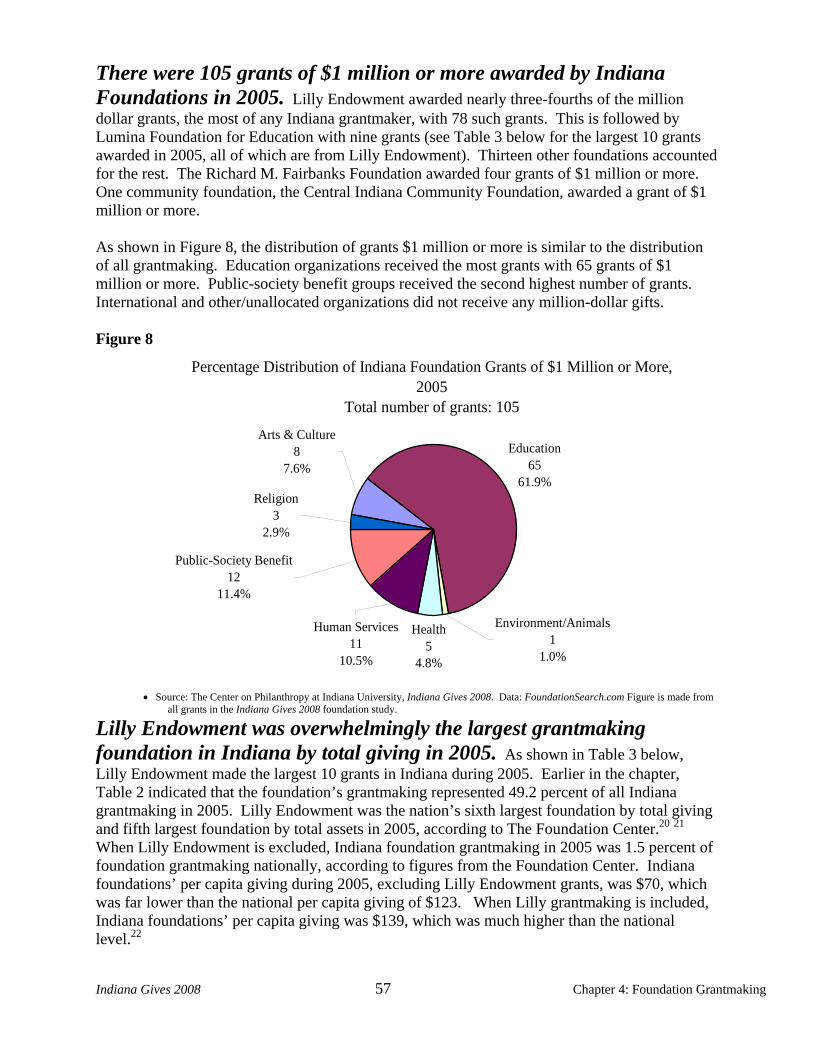
Indiana Gives 2008 57 Chapter 4: Foundation Grantmaking
There were 105 grants of $1 million or more awarded by Indiana Foundations in 2005. Lilly Endowment awarded nearly three-fourths of the million dollar grants, the most of any Indiana grantmaker, with 78 such grants. This is followed by Lumina Foundation for Education with nine grants (see Table 3 below for the largest 10 grants awarded in 2005, all of which are from Lilly Endowment). Thirteen other foundations accounted for the rest. The Richard M. Fairbanks Foundation awarded four grants of $1 million or more. One community foundation, the Central Indiana Community Foundation, awarded a grant of $1 million or more. As shown in Figure 8, the distribution of grants $1 million or more is similar to the distribution of all grantmaking. Education organizations received the most grants with 65 grants of $1 million or more. Public-society benefit groups received the second highest number of grants. International and other/unallocated organizations did not receive any million-dollar gifts. Figure 8
Percentage Distribution of Indiana Foundation Grants of $1 Million or More, 2005
Total number of grants: 105
Education65
61.9%
Health5
4.8%
Environment/Animals1
1.0%
Human Services11
10.5%
Public-Society Benefit12
11.4%
Religion3
2.9%
Arts & Culture8
7.6%
• Source: The Center on Philanthropy at Indiana University, Indiana Gives 2008. Data: FoundationSearch.com Figure is made from
all grants in the Indiana Gives 2008 foundation study.
Lilly Endowment was overwhelmingly the largest grantmaking foundation in Indiana by total giving in 2005. As shown in Table 3 below, Lilly Endowment made the largest 10 grants in Indiana during 2005. Earlier in the chapter, Table 2 indicated that the foundation’s grantmaking represented 49.2 percent of all Indiana grantmaking in 2005. Lilly Endowment was the nation’s sixth largest foundation by total giving and fifth largest foundation by total assets in 2005, according to The Foundation Center.20 21 When Lilly Endowment is excluded, Indiana foundation grantmaking in 2005 was 1.5 percent of foundation grantmaking nationally, according to figures from the Foundation Center. Indiana foundations’ per capita giving during 2005, excluding Lilly Endowment grants, was $70, which was far lower than the national per capita giving of $123. When Lilly grantmaking is included, Indiana foundations’ per capita giving was $139, which was much higher than the national level.22

Indiana Gives 2008 58 Chapter 4: Foundation Grantmaking
Table 3Ten Largest Indiana Foundation Grants 2005 (dollars in millions)
Rank Donor Foundation Recipient Organization Recipient State Recipient Subsector Grant Amount1 Lilly Endowment Inc Butler University Indiana Education $22.02 Lilly Endowment Inc Ball State University Foundation Indiana Education $20.03 Lilly Endowment Inc Wabash College Indiana Education $12.54 Lilly Endowment Inc Hispanic Scholarship Fund California Education $12.35 Lilly Endowment Inc Independent Colleges of Indiana Indiana Education $10.56 Lilly Endowment Inc James Whitcomb Riley Memorial Assn Indiana Health $10.0
Lilly Endowment Inc American Red Cross Dist Of Columbia Human services $10.0Lilly Endowment Inc Salvation Army Indiana Human services $10.0Lilly Endowment Inc United Way of America Virginia Public-society benefit $10.0
7 Lilly Endowment Inc Indianapolis Center for Congregations Indiana Religion $8.2Total $125.5 • Source: The Center on Philanthropy at Indiana University, Indiana Gives 2008. Data: FoundationSearch.com • Table `is made from all grants in the Indiana Gives 2008 foundation study.

Indiana Gives 2008 59 Chapter 4: Foundation Grantmaking
Community foundation section analysis The analysis of community foundation grantmaking during 2005 consists of grants made by 72 of the 83 community foundations that have been identified in the state by Indiana Gives 2008.* For this study, many of the community foundations submitted their grantmaking information directly to The Center on Philanthropy at Indiana University. Education received the most grant dollars and number of grants from Indiana community foundations. Education received the most grant dollars from community foundations, but not as large of a percentage as when independent and operating foundations are included (31.2 percent for community foundations only and 50.2 percent with independent and operating foundations included, as shown in Figure 9 compared to Figure 1). Also, giving to education by community foundations was not the largest by average or median grants (see Table 4 below), as it was for independent, operating, and community foundations combined (Table 1 above). According to Figure 9 below, community foundations in Indiana during 2005 granted the:
• Most to education at 31.2 percent. • Second most to human services at 20.6 percent. • Third most to arts and culture at 13.6 percent. • Slightly less to public-society benefit, at 11.6 percent, than arts and culture. • Fifth most to health at 10.1 percent. • Less to other/unallocated (5.0 percent), environment/animals (4.6 percent), religion (2.9
percent), and international (0.3 percent) than other subsectors. Community foundations support arts and culture much more than do independent and operating foundations in Indiana. When comparing grant dollars to arts and culture organizations, community foundations are found to grant twice as much as independent and operating foundations (compare Figure 9 and Figure 1) in Indiana.† However, Indiana community foundation giving to arts and culture is close to the percentage of giving by foundations nationally (13.6 percent compared to 12.5 percent by foundations nationally), as shown in Figure 9 and Figure 3. * Since some community foundations file their IRS forms as groups, the number of community foundations within Indiana may fluctuate depending on how they are counted. Indiana Gives 2008 counts only community foundations that file an individual IRS form. † When independent and operating foundations are analyzed separately from community foundations, independent and operating foundations were found to grant 6.3 percent of total grant dollars to arts and culture. Since community foundation grantmaking is included in Figure 1, the percent for arts and culture is slightly higher.

Indiana Gives 2008 60 Chapter 4: Foundation Grantmaking
Figure 9
Indiana Community Foundations' Giving Priorities, 2005 Total estimated donations: $75.34
(dollars in millions)
Health $7.58 10.1%
International $0.22 0.3%
Other/Unallocated $3.74 5.0%
Arts & Culture $10.24 13.6%
Religion $2.20 2.9%
Public-Society Benefit $8.78 11.6%
Environment/Animals $3.48 4.6%
Education $23.54 31.2%
Human Services $15.56 20.6%
Source: The Center on Philanthropy at Indiana University, Indiana Gives 2008. Data: FoundationSearch.com
The distribution of the number of grants is similar to the distribution of grant dollars by community foundations. Community foundations granted the most to educational organizations, just under one third of all grants (see Figure 10). The percentage of the number of grants to education (33.1 percent) was larger than the percentage of grant dollars given to educational organizations (31.2 percent). Human services organizations received the second most number of grants at 24.1 percent. Figure 10
• Source: The Center on Philanthropy at Indiana University, Indiana Gives 2008. Data: FoundationSearch.com Figure is made from all community foundation grants in the Indiana Gives 2008 foundation study.23
Indiana Community Foundations' Giving Priorities, 2005 Total number of grants: 2877
Education952
33.1%
Other/Unallocated199
6.9%
International 13
0.5%
Religion176
6.1% Arts & Culture295
10.3%
Public-Society Benefit
286 9.9%
Human Services692
24.1% Environment/Animals
832.9%
Health181
6.3%

Indiana Gives 2008 61 Chapter 4: Foundation Grantmaking
Grants made by Indiana community foundations to religion tend to be smaller than gifts made to other kinds of organizations while grants to environment/animals tend to be larger by subsector averages and median. As shown in Table 4 below, grants between $4,000 and $25,000 made to religious organizations by Indiana community foundations was the lowest with an average grant of $11,330 (median $9,170) – with the exception of other or unallocated grants. Grants to environment/animals organizations were largest by both average and median for grants of $25,000 and above, even though grantmaking to environment and animals organizations represented only 4.6 percent of total grant dollars awarded by Indiana community foundations. The recipients of the largest environment/animals grants included the Fort Wayne Park Foundation ($597,961), Indianapolis Zoological Society ($500,000), Potawatomi Park ($206,400), the Nature Conservancy in Indiana ($200,000), and the Humane Society of Indianapolis ($100,000). However, as shown in Table 5 below, there were grants to other subsectors that were larger. Table 4 Community Foundation Grants
Avg. Median Avg. MedianReligion $11,330 $9,170 $60,632 $42,595Education $12,331 $11,168 $109,666 $57,970Human services $11,683 $9,825 $81,560 $51,146Health $12,222 $10,480 $156,336 $68,273Arts and culture $11,899 $9,170 $129,705 $53,595Public-society benefit $12,081 $9,170 $105,912 $59,219Environment/animals $11,634 $9,170 $162,462 $61,243International $12,729 $12,445 $65,466 $65,500Other/unallocated $11,085 $7,952 $95,869 $60,408Grand Total $11,934 $10,480 $109,117 $57,205
Grants of $4,000 up to $25,000 Grants of $25,000 and Above
• Source: The Center on Philanthropy at Indiana University, Indiana Gives 2008. Data: FoundationSearch.com • Table is made from all grants in the Indiana Gives 2008 foundation study.24
Seven community foundations award the top 10 largest community foundation grants in Indiana in 2005. The largest grant was awarded by the Harrison County Community Foundation. The other nine grants in the top 10 list were from community foundations that were within the top seven community foundations by total dollars awarded. All but one of the grants in the top 10 list went to a recipient located in Indiana. Religion, international, and other/unallocated were the only subsectors which were not represented in the top 10 list.
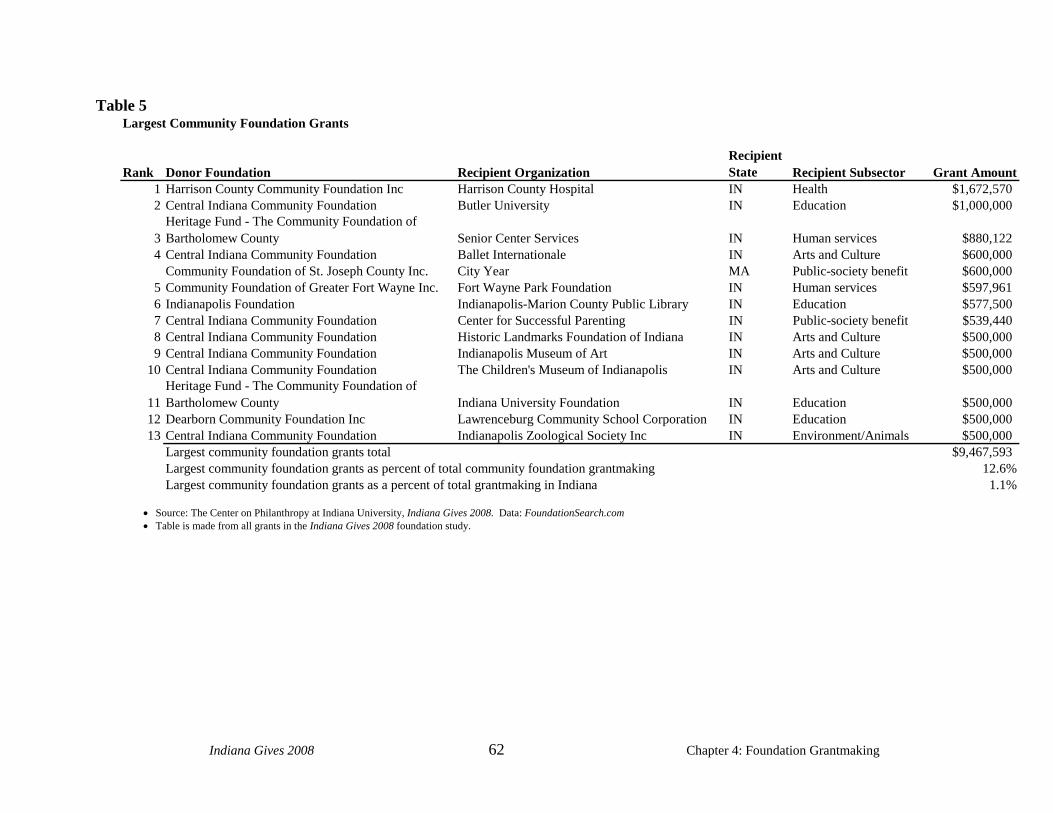
Indiana Gives 2008 62 Chapter 4: Foundation Grantmaking
Table 5 Largest Community Foundation Grants
Rank Donor Foundation Recipient OrganizationRecipient State Recipient Subsector Grant Amount
1 Harrison County Community Foundation Inc Harrison County Hospital IN Health $1,672,5702 Central Indiana Community Foundation Butler University IN Education $1,000,000
3Heritage Fund - The Community Foundation of Bartholomew County Senior Center Services IN Human services $880,122
4 Central Indiana Community Foundation Ballet Internationale IN Arts and Culture $600,000Community Foundation of St. Joseph County Inc. City Year MA Public-society benefit $600,000
5 Community Foundation of Greater Fort Wayne Inc. Fort Wayne Park Foundation IN Human services $597,9616 Indianapolis Foundation Indianapolis-Marion County Public Library IN Education $577,5007 Central Indiana Community Foundation Center for Successful Parenting IN Public-society benefit $539,4408 Central Indiana Community Foundation Historic Landmarks Foundation of Indiana IN Arts and Culture $500,0009 Central Indiana Community Foundation Indianapolis Museum of Art IN Arts and Culture $500,000
10 Central Indiana Community Foundation The Children's Museum of Indianapolis IN Arts and Culture $500,000
11Heritage Fund - The Community Foundation of Bartholomew County Indiana University Foundation IN Education $500,000
12 Dearborn Community Foundation Inc Lawrenceburg Community School Corporation IN Education $500,00013 Central Indiana Community Foundation Indianapolis Zoological Society Inc IN Environment/Animals $500,000
Largest community foundation grants total $9,467,593Largest community foundation grants as percent of total community foundation grantmaking 12.6%Largest community foundation grants as a percent of total grantmaking in Indiana 1.1%
• Source: The Center on Philanthropy at Indiana University, Indiana Gives 2008. Data: FoundationSearch.com • Table is made from all grants in the Indiana Gives 2008 foundation study.

Indiana Gives 2008 63 Chapter 4: Foundation Grantmaking
1 Public Charities, Internal Revenue Service, http://www.irs.gov/charities/charitable/article/0,,id=137894,00.html. 2 Guide to Funding Research, Foundation Center, http://foundationcenter.org/getstarted/tutorials/gfr/glossary.html. 3 Definition of Private Operating Foundation, Internal Revenue Service, http://www.irs.gov/charities/foundations/article/0,,id=136869,00.html. 4 The Foundation Center data was adjusted to reflect operating, community, and independent foundations. Corporate foundation grantmaking was excluded. Aggregate Financial Data for Foundations in the State of Indiana, 2005, Foundation Center, 2007, www.foundationcenter.org/findfunders/statistics/. 5 Guide to Funding Research, Foundation Center, http://foundationcenter.org/getstarted/tutorials/gfr/glossary.html. 6 Community Foundation Locator, Council on Foundations, http://www.cof.org/locator/?navItemNumber=2502. 7 Giving USA 2008, p. 210. Corporate foundation grantmaking is included in the corporate section, not in the foundation section. 8 Sources of contributions, Giving USA 2008, p 210. This figure was adjusted by Giving USA to include only independent, operating, and community foundation grantmaking. Corporate foundation grantmaking was excluded. 9 Figures 1 & 2 shows Indiana foundations’ giving priorities by subsector. Subsector figures are created by categorizing grants by the recipient organization. For example, a grant to the medical school at Indiana University would be categorized as education. 10 Aggregated grants, such as scholarships, may have also affected this figure. But the average size of grants going to education definitely had an affect on the ratio of grant dollars and number of grants awarded to education. 11 Some grants were reported as aggregated funding which may have affected these figures. The study included grants of $25,000 or more and a sample of grants less than $25,000. 12 Indiana data in the figure includes all grants in the Indiana Gives 2008 foundation study as coded by the type of recipient. National grants are coded by the purpose of the grant, not the type of organization. The Foundation Center figures include corporate foundation giving, Indiana Gives 2008 does not. Also, the Foundation Center sample base for this figure consists of grants of $10,000 or more, compared to the Indiana Gives 2008 sample base of all grants. These differences may have affected the subsector data in the graph. The Foundation Center calculates science and technology, and social sciences separately from public-society benefit, but they have been included in public-society benefit for this graph. 13 Indiana data in the figure includes all grants in the Indiana Gives 2008 foundation study. 2003 data is based on the Indiana Gives Survey from Indiana Gives 2004. 14 Recipient location was not found for $1.56 million (0.2 percent) of the grants of $25,000 or more. It is more than likely that these grants went to Indiana organizations. Organizations that are national or international in scope but are headquartered in Indiana, were categorized as being located in Indiana. 15 Recipient location was not found for 0.8 percent of all grants of the grants $25,000 or more. It is highly probable that these grants went to Indiana organizations. Also, some grants were reported as aggregated funding which may have affected these figures. Organizations that are national or international in scope but are headquartered in Indiana, were categorized as being located in Indiana. 16 According to Giving USA 2008, foundation grantmaking was estimated to be $34.91 billion for 2006. And the estimated total giving from Indiana independent, operating, and community foundations was $868.1million in 2005. 17 United States--States; and Puerto Rico: GCT-T1-R. Population Estimates (geographies ranked by estimate), United States Census Bureau, http://factfinder.census.gov/servlet/GCTTable?_bm=y&-geo_id=01000US&-_box_head_nbr=GCT-T1-R&-ds_name=PEP_2007_EST&-format=US-9S. 18 Fiscal Data of Grantmaking Foundations by Region and State, 2005, Foundation Center, http://foundationcenter.org/findfunders/statistics/. 19 The figures for total dollars granted for each foundation in the study may be smaller than the actual number of dollars granted found on an IRS-Form 990 since the Indiana Gives 2008 foundation study does not include grants smaller than $3,000 20 50 Largest Foundations by Total Giving, 2005, Foundation Center, http://foundationcenter.org/findfunders/statistics/. 21 50 Largest Foundations by Assets, 2005, Foundation Center, http://foundationcenter.org/findfunders/statistics/. 22 Per capita giving was created using the population and grantmaking figures for 2005 found in the Foundation Center and the US Census Bureau documents referenced in the same paragraph as this reference. 23 Some grants were reported as aggregated funding which may have affected these figures. See the methodology at the end of this chapter for more information about coding.

Indiana Gives 2008 64 Chapter 4: Foundation Grantmaking
24 Average and median grant data for the $4,000 up to $25,000 range were created by a redistribution, except total figures were made by averaging all coded and uncoded grants within the range. See the Overview at the end of the chapter for a methodology of redistribution.
Indiana Gives 2008 Chapter 5: Corporate Giving 67
Indiana Gives 2008 Corporate Giving
Highlights
• Approximately 90 percent of Indiana corporations surveyed reported making a contribution to charity in 2006.
• Public-society benefit organizations (e.g., United Way, community foundations) received the largest share of corporate giving from surveyed Indiana companies (22.3 percent) and Indiana corporate foundations (25.5 percent).
• Nearly 60 percent of Indiana corporate foundation grants were less than $10,000 and 35.7 percent were less than $5,000.
• Among surveyed companies, smaller firms had a higher average giving amount per employee, $773, than larger companies, $146.
• Nearly two-thirds of corporate gifts as listed by nonprofits on their annual reports were annual gifts as opposed to sponsorships, in-kind gifts, capital gifts, or other types of gifts.
• Nearly 70 percent of the corporate gifts reported by nonprofits in annual reports and on their websites were less than $3,000.
Charitable contributions by U.S. companies and corporate foundations decreased 7.2 percent (10.1 percent adjusted for inflation in 2007 dollars) in 2006 with a rise in corporate profits.1 U.S. corporate giving as a median percent of U.S. pretax income dropped from 1.2 percent in 2005 to 0.8 percent in 2006, while corporate profits grew 24.2 percent during the same period (adjusted for inflation in 2007 dollars).2 Nationwide, corporations donated an estimated $15.40 billion in 2006.3 Nationally, the annual increase in charitable giving by corporations is 2.7 percent per year over the past 40 years, adjusted for inflation.4 The Conference Board asked its survey participants to provide the type of donation made by companies, as reported in Giving USA 2007. The Conference Board reported in-kind donations from 10 pharmaceutical companies that were 86.6 percent of reported total contributions.5 When in-kind gifts from pharmaceutical firms were excluded, in-kind giving was just over one-quarter (27 percent) of reported total corporate contributions in 2006.6 The Center on Philanthropy utilized three sources of information to assess corporate philanthropy in Indiana. First, nearly 625 Indiana companies were asked to report on their charitable giving practices. Of those, 100 were the largest companies in Indiana. The Center received 65 completed responses, an 11.4 percent response rate. The Center supplemented these survey results with two other sources of information,

Indiana Gives 2008 Chapter 5: Corporate Giving 68
corporate foundation information and corporate giving information to Indiana nonprofits. The Center accessed IRS Forms 990-PF for Indiana corporate foundations through FoundationSearch.com. FoundationSearch.com allowed us to examine all grants made in 2006 to nonprofit organizations by Indiana corporations that had a foundation. The last source of information was from NOZA, Inc. The NOZA data provided a list of 9,582 gifts or grants received by nonprofits in Indiana by corporations as reported in or on the nonprofits’ annual reports, newsletters, website, etc. Please see the methodology section of this report for more detail. Among responding Indiana firms, approximately 90 percent reported making contributions to nonprofits in 2006. As shown in Table 1, cash gifts for 2006 (for the 59 responding firms that made cash donations) were almost $15.67 million when including projected corporate foundation grants from those firms that responded to the survey. For 2007, cash gifts from the responding Indiana firms were anticipated to be almost $23.0 million, which was a 46.6 percent increase from 2006, after adjusting for inflation. The average cash gift for 2007 was almost $123,902 more than it was in 2006. Average direct cash and in-kind giving in 2007 was almost $122,267 higher than in 2006. The total amount of giving from marketing budgets, which included all types of sponsorships of nonprofit organizations, by responding firms, was $863,550 in 2007. This was 7.4 percent higher than in 2006. The average amount of giving through marketing budgets was $5,385 more in 2007 than in 2006. Table 1 Average Total Giving based on Types of Donations from Respondent Indiana Firms, 2006 and 2007
Type of donation
Average per firm in 2006
Average per firm in 2007
Percent difference
Cash* $265,645** $389,547** +46.6%
Direct and In-kind
contribution $268,817** $391,084** +45.5%
Sponsorships of nonprofits $73,120*** $78,505*** +7.4%
* Includes foundation grants and direct cash contributions. ** Average amount of 59 firms in Indiana. *** Average amount of 11 firms in Indiana. All figures were adjusted for inflation in 2007 dollars. Source: The Center on Philanthropy at Indiana University, Indiana Gives 2008.
Large firms were more likely to give cash to charity. In Indiana Gives 2008, respondents to the corporate giving survey included large companies (defined as those with 250 or more full-time employees), medium companies (defined as those with between 50 and 249 full-time employees), and small companies (defined as those with fewer than 50 employees). Table 2 shows average cash giving by firm size in 2006 and 2007. Large companies donated almost 49.0 percent more in 2007 than they did in 2006. However, in 2007, medium and small companies gave less cash to charity than they did in 2006, on average.
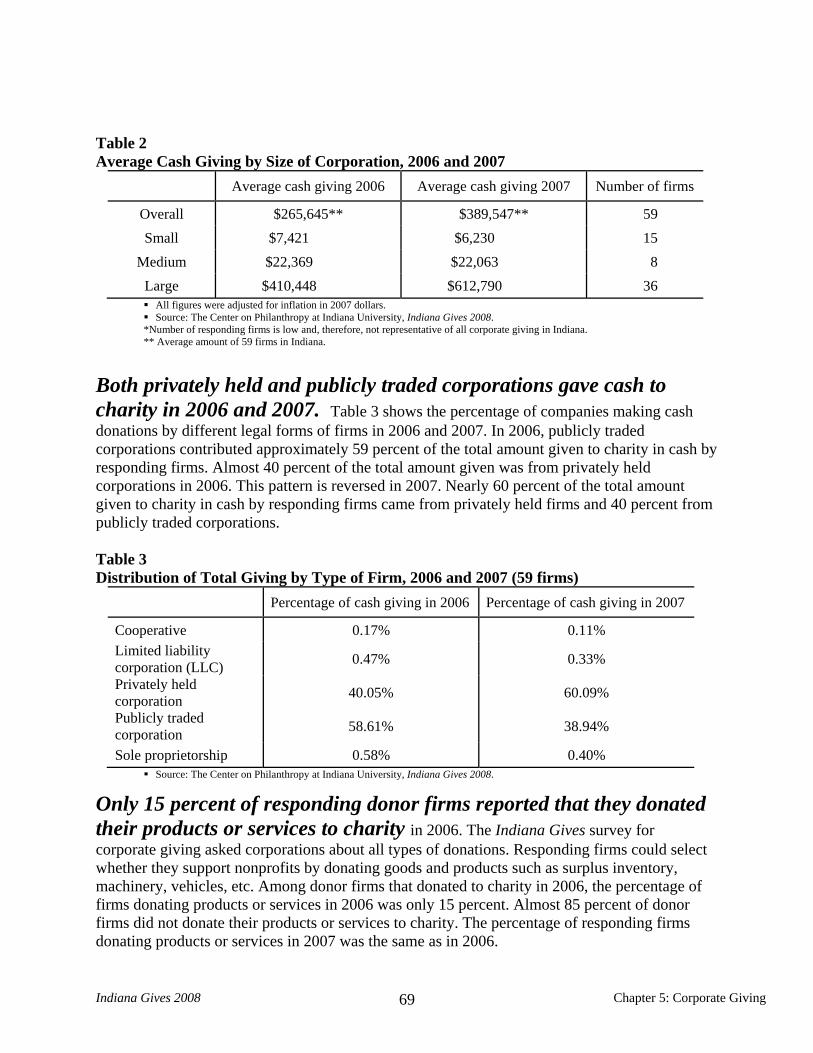
Indiana Gives 2008 Chapter 5: Corporate Giving 69
Table 2 Average Cash Giving by Size of Corporation, 2006 and 2007
Average cash giving 2006 Average cash giving 2007 Number of firms
Overall $265,645** $389,547** 59 Small $7,421 $6,230 15
Medium $22,369 $22,063 8 Large $410,448 $612,790 36 All figures were adjusted for inflation in 2007 dollars. Source: The Center on Philanthropy at Indiana University, Indiana Gives 2008.
*Number of responding firms is low and, therefore, not representative of all corporate giving in Indiana. ** Average amount of 59 firms in Indiana.
Both privately held and publicly traded corporations gave cash to charity in 2006 and 2007. Table 3 shows the percentage of companies making cash donations by different legal forms of firms in 2006 and 2007. In 2006, publicly traded corporations contributed approximately 59 percent of the total amount given to charity in cash by responding firms. Almost 40 percent of the total amount given was from privately held corporations in 2006. This pattern is reversed in 2007. Nearly 60 percent of the total amount given to charity in cash by responding firms came from privately held firms and 40 percent from publicly traded corporations. Table 3 Distribution of Total Giving by Type of Firm, 2006 and 2007 (59 firms)
Percentage of cash giving in 2006 Percentage of cash giving in 2007
Cooperative 0.17% 0.11% Limited liability corporation (LLC) 0.47% 0.33%
Privately held corporation 40.05% 60.09%
Publicly traded corporation 58.61% 38.94%
Sole proprietorship 0.58% 0.40% Source: The Center on Philanthropy at Indiana University, Indiana Gives 2008.
Only 15 percent of responding donor firms reported that they donated their products or services to charity in 2006. The Indiana Gives survey for corporate giving asked corporations about all types of donations. Responding firms could select whether they support nonprofits by donating goods and products such as surplus inventory, machinery, vehicles, etc. Among donor firms that donated to charity in 2006, the percentage of firms donating products or services in 2006 was only 15 percent. Almost 85 percent of donor firms did not donate their products or services to charity. The percentage of responding firms donating products or services in 2007 was the same as in 2006.

Indiana Gives 2008 Chapter 5: Corporate Giving 70
Few responding Indiana firms supported nonprofits through marketing budgets in 2006. The Indiana Gives survey for corporate giving asked respondents about their spending on marketing with charities; this would include sponsorship of an event, payment for an advertisement that features the nonprofit, etc. Only 16.4 percent of responding companies reported supporting nonprofits through their marketing budget in 2006. This proportion was projected to be unchanged in 2007. Responding firms can deduct marketing expenses as business expenses, but they typically do not appear as deductions for charitable gifts.
Responding Indiana firms gave to a variety of causes in 2006. As shown in Figure 1, the largest share, 22.3 percent of the total dollars given to charity in 2006 by responding Indiana firms, went to public-society benefit organizations such as the United Way, community foundations, or Catholic Charities. The share of donations to human services organizations such as American Red Cross or Goodwill by responding Indiana firms was the second largest share, which was 16.7 percent of the total amount given by the responding firms. None of the firms reported donating their gifts to organizations supporting international affairs or youth or family services in 2006.
Figure 1
Responding Indiana Corporate Giving by Type of Recipient, 2006(65 firms reporting)
Religion12.6%
Other1.2%Environment/
animals4.2%
Neighborhood*15.7%
Art and culture8.1%
Education13.8%
Health5.4%
Human services16.7%
Public-society benefit* 22.3%
Source: The Center on Philanthropy at Indiana University, Indiana Gives 2008. Figure includes donations of $19.6 millions. Neighborhood development is often combined with public-society benefit organizations. This would make the share of donations
going to public-society benefit 38 percent.
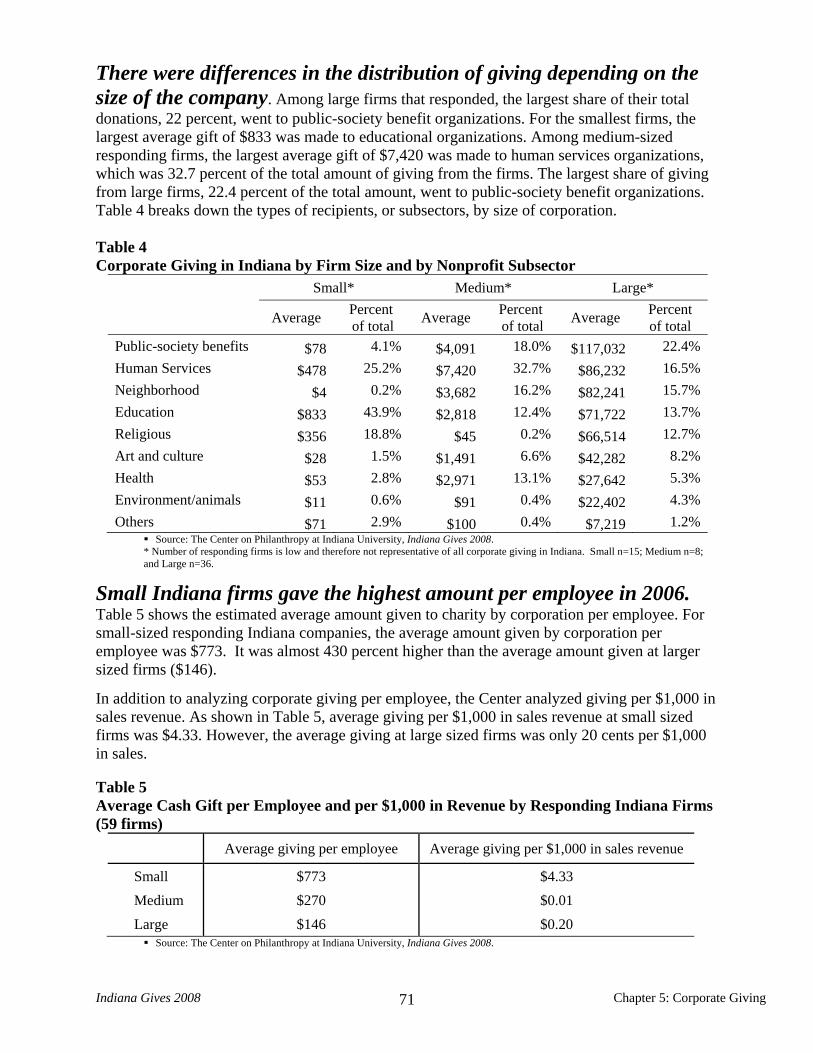
Indiana Gives 2008 Chapter 5: Corporate Giving 71
There were differences in the distribution of giving depending on the size of the company. Among large firms that responded, the largest share of their total donations, 22 percent, went to public-society benefit organizations. For the smallest firms, the largest average gift of $833 was made to educational organizations. Among medium-sized responding firms, the largest average gift of $7,420 was made to human services organizations, which was 32.7 percent of the total amount of giving from the firms. The largest share of giving from large firms, 22.4 percent of the total amount, went to public-society benefit organizations. Table 4 breaks down the types of recipients, or subsectors, by size of corporation. Table 4 Corporate Giving in Indiana by Firm Size and by Nonprofit Subsector
Small* Medium* Large*
Average Percent of total Average Percent
of total Average Percent of total
Public-society benefits $78 4.1% $4,091 18.0% $117,032 22.4%Human Services $478 25.2% $7,420 32.7% $86,232 16.5%Neighborhood $4 0.2% $3,682 16.2% $82,241 15.7%Education $833 43.9% $2,818 12.4% $71,722 13.7%Religious $356 18.8% $45 0.2% $66,514 12.7%Art and culture $28 1.5% $1,491 6.6% $42,282 8.2%Health $53 2.8% $2,971 13.1% $27,642 5.3%Environment/animals $11 0.6% $91 0.4% $22,402 4.3%Others $71 2.9% $100 0.4% $7,219 1.2%
Source: The Center on Philanthropy at Indiana University, Indiana Gives 2008. * Number of responding firms is low and therefore not representative of all corporate giving in Indiana. Small n=15; Medium n=8; and Large n=36.
Small Indiana firms gave the highest amount per employee in 2006. Table 5 shows the estimated average amount given to charity by corporation per employee. For small-sized responding Indiana companies, the average amount given by corporation per employee was $773. It was almost 430 percent higher than the average amount given at larger sized firms ($146).
In addition to analyzing corporate giving per employee, the Center analyzed giving per $1,000 in sales revenue. As shown in Table 5, average giving per $1,000 in sales revenue at small sized firms was $4.33. However, the average giving at large sized firms was only 20 cents per $1,000 in sales.
Table 5 Average Cash Gift per Employee and per $1,000 in Revenue by Responding Indiana Firms (59 firms)
Average giving per employee Average giving per $1,000 in sales revenue
Small $773 $4.33 Medium $270 $0.01 Large $146 $0.20
Source: The Center on Philanthropy at Indiana University, Indiana Gives 2008.
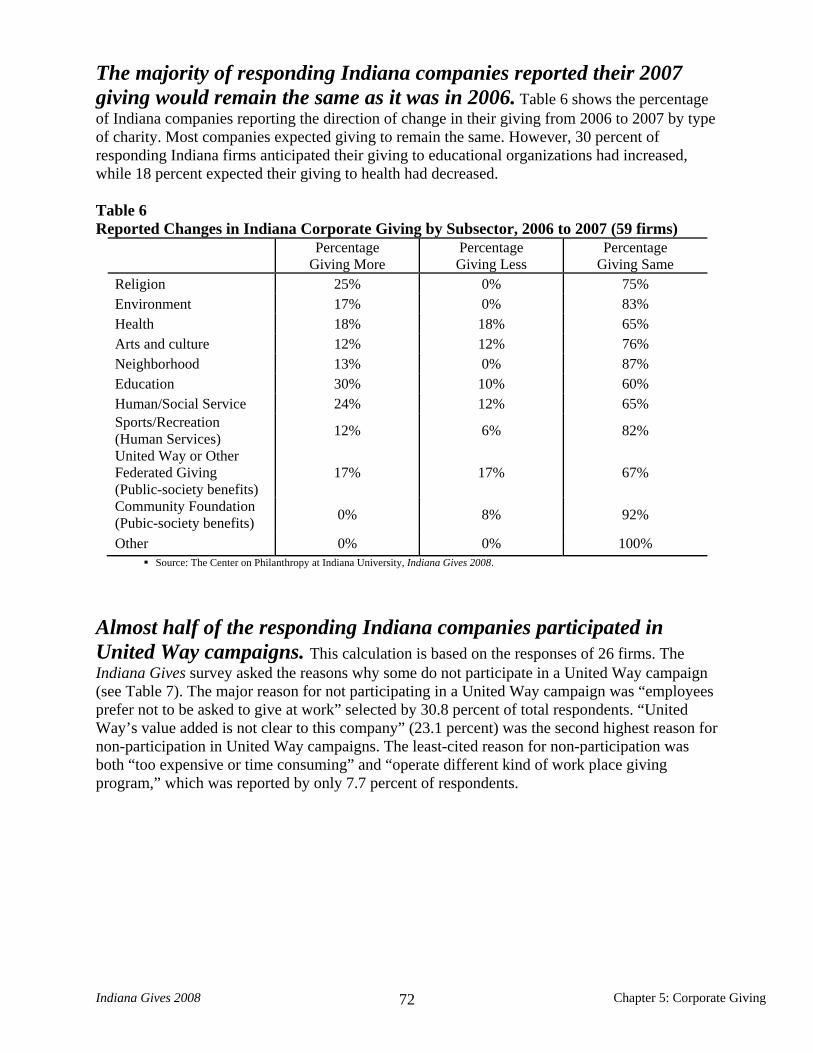
Indiana Gives 2008 Chapter 5: Corporate Giving 72
The majority of responding Indiana companies reported their 2007 giving would remain the same as it was in 2006. Table 6 shows the percentage of Indiana companies reporting the direction of change in their giving from 2006 to 2007 by type of charity. Most companies expected giving to remain the same. However, 30 percent of responding Indiana firms anticipated their giving to educational organizations had increased, while 18 percent expected their giving to health had decreased. Table 6 Reported Changes in Indiana Corporate Giving by Subsector, 2006 to 2007 (59 firms)
Percentage Giving More
Percentage Giving Less
Percentage Giving Same
Religion 25% 0% 75% Environment 17% 0% 83% Health 18% 18% 65% Arts and culture 12% 12% 76% Neighborhood 13% 0% 87% Education 30% 10% 60% Human/Social Service 24% 12% 65% Sports/Recreation (Human Services) 12% 6% 82%
United Way or Other Federated Giving (Public-society benefits)
17% 17% 67%
Community Foundation (Pubic-society benefits) 0% 8% 92%
Other 0% 0% 100% Source: The Center on Philanthropy at Indiana University, Indiana Gives 2008.
Almost half of the responding Indiana companies participated in United Way campaigns. This calculation is based on the responses of 26 firms. The Indiana Gives survey asked the reasons why some do not participate in a United Way campaign (see Table 7). The major reason for not participating in a United Way campaign was “employees prefer not to be asked to give at work” selected by 30.8 percent of total respondents. “United Way’s value added is not clear to this company” (23.1 percent) was the second highest reason for non-participation in United Way campaigns. The least-cited reason for non-participation was both “too expensive or time consuming” and “operate different kind of work place giving program,” which was reported by only 7.7 percent of respondents.
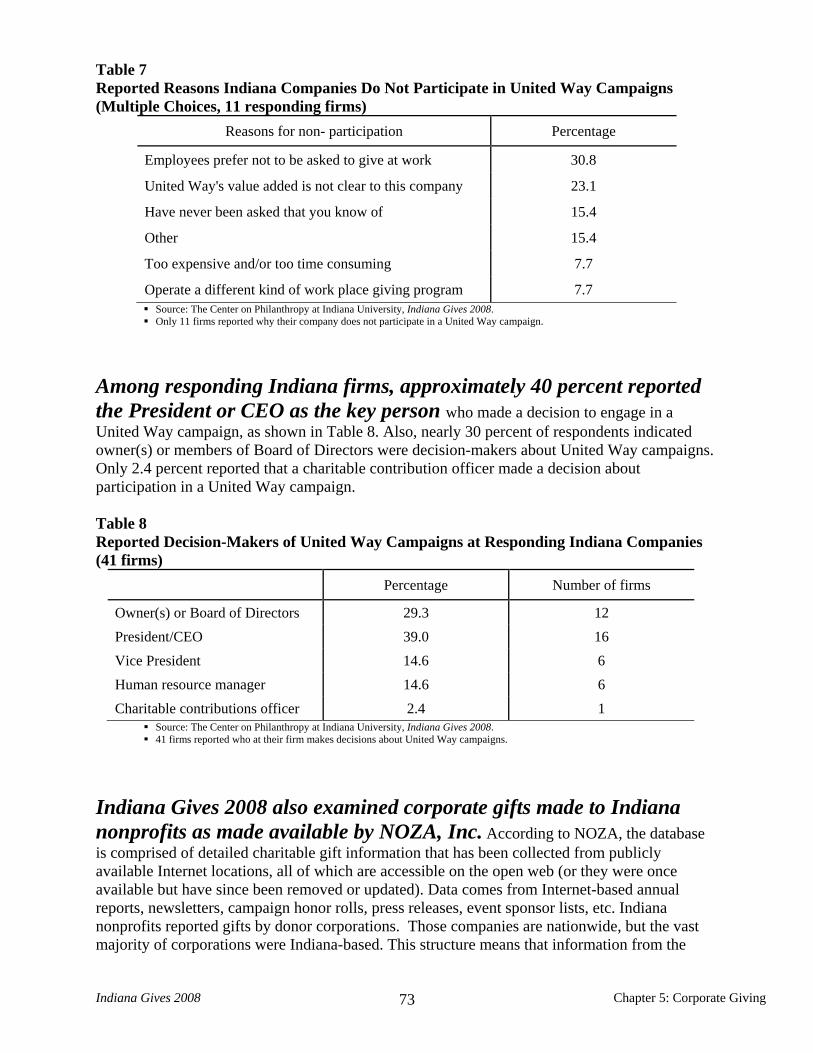
Indiana Gives 2008 Chapter 5: Corporate Giving 73
Table 7 Reported Reasons Indiana Companies Do Not Participate in United Way Campaigns (Multiple Choices, 11 responding firms)
Reasons for non- participation Percentage
Employees prefer not to be asked to give at work 30.8
United Way's value added is not clear to this company 23.1
Have never been asked that you know of 15.4
Other 15.4
Too expensive and/or too time consuming 7.7
Operate a different kind of work place giving program 7.7 Source: The Center on Philanthropy at Indiana University, Indiana Gives 2008. Only 11 firms reported why their company does not participate in a United Way campaign.
Among responding Indiana firms, approximately 40 percent reported the President or CEO as the key person who made a decision to engage in a United Way campaign, as shown in Table 8. Also, nearly 30 percent of respondents indicated owner(s) or members of Board of Directors were decision-makers about United Way campaigns. Only 2.4 percent reported that a charitable contribution officer made a decision about participation in a United Way campaign. Table 8 Reported Decision-Makers of United Way Campaigns at Responding Indiana Companies (41 firms)
Percentage Number of firms
Owner(s) or Board of Directors 29.3 12 President/CEO 39.0 16 Vice President 14.6 6 Human resource manager 14.6 6 Charitable contributions officer 2.4 1
Source: The Center on Philanthropy at Indiana University, Indiana Gives 2008. 41 firms reported who at their firm makes decisions about United Way campaigns.
Indiana Gives 2008 also examined corporate gifts made to Indiana nonprofits as made available by NOZA, Inc. According to NOZA, the database is comprised of detailed charitable gift information that has been collected from publicly available Internet locations, all of which are accessible on the open web (or they were once available but have since been removed or updated). Data comes from Internet-based annual reports, newsletters, campaign honor rolls, press releases, event sponsor lists, etc. Indiana nonprofits reported gifts by donor corporations. Those companies are nationwide, but the vast majority of corporations were Indiana-based. This structure means that information from the
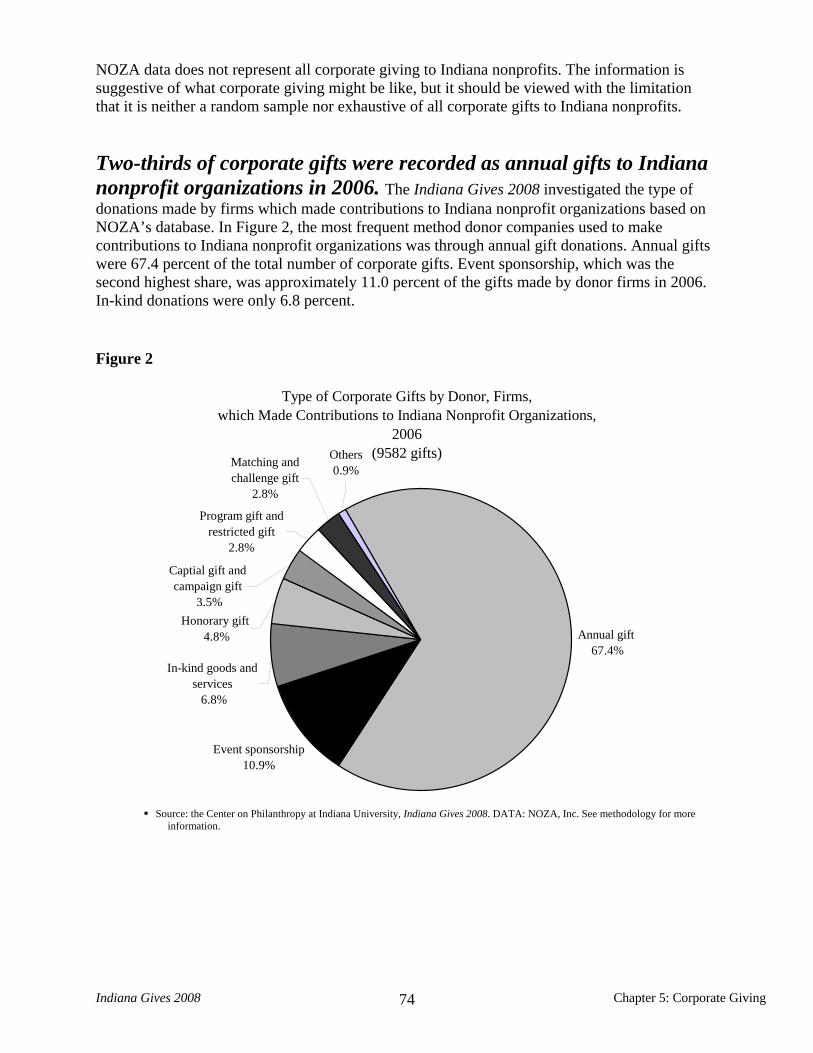
Indiana Gives 2008 Chapter 5: Corporate Giving 74
NOZA data does not represent all corporate giving to Indiana nonprofits. The information is suggestive of what corporate giving might be like, but it should be viewed with the limitation that it is neither a random sample nor exhaustive of all corporate gifts to Indiana nonprofits.
Two-thirds of corporate gifts were recorded as annual gifts to Indiana nonprofit organizations in 2006. The Indiana Gives 2008 investigated the type of donations made by firms which made contributions to Indiana nonprofit organizations based on NOZA’s database. In Figure 2, the most frequent method donor companies used to make contributions to Indiana nonprofit organizations was through annual gift donations. Annual gifts were 67.4 percent of the total number of corporate gifts. Event sponsorship, which was the second highest share, was approximately 11.0 percent of the gifts made by donor firms in 2006. In-kind donations were only 6.8 percent.
Figure 2
Type of Corporate Gifts by Donor, Firms,which Made Contributions to Indiana Nonprofit Organizations,
2006(9582 gifts)Others
0.9%Matching and challenge gift
2.8%
Program gift and restricted gift
2.8%
Captial gift and campaign gift
3.5%Honorary gift
4.8%
In-kind goods and services 6.8%
Event sponsorship 10.9%
Annual gift 67.4%
Source: the Center on Philanthropy at Indiana University, Indiana Gives 2008. DATA: NOZA, Inc. See methodology for more
information.

Indiana Gives 2008 Chapter 5: Corporate Giving 75
The size of contributions made to charitable organizations in Indiana varied. The Indiana Gives 2008 study investigated the range of gift sizes made by corporate donor firms to Indiana nonprofit organizations in 2006 using the NOZA database. Approximately 34 percent of the gifts located in the database included the gift amounts which were reported by nonprofits as a range (the minimum and maximum dollar amount for example, between $2,000 and $5,000). Figure 3 was generated by taking the midpoint of the maximum and minimum dollar amount (for example, $3,500 was recorded when the gift range was $2,000 and $5,000) of each charitable gift within the NOZA database. As Figure 3 shows, the most frequent size of a corporate gift was over $3,000 dollars, 30.7 percent of the gifts. This indicates that nearly 70 percent of corporate gifts to Indiana nonprofits were less than $3,000. The second most common giving range was $100-$499 with 22.5 percent of the total number of gifts. Only 10.6 percent of gifts were $100 dollars or less.
Figure 3
Gift Range of Corporate Donations from Donor Firms which Made Contributions to Indiana Nonprofit
Organizations, 2006
30.7%
20.0%16.3%
22.5%
10.6%
<$100 $100-$499 $500-$999 $1,000-$2,999
$3,000+
Source: the Center on Philanthropy at Indiana University, Indiana Gives 2008. DATA: NOZA, Inc.
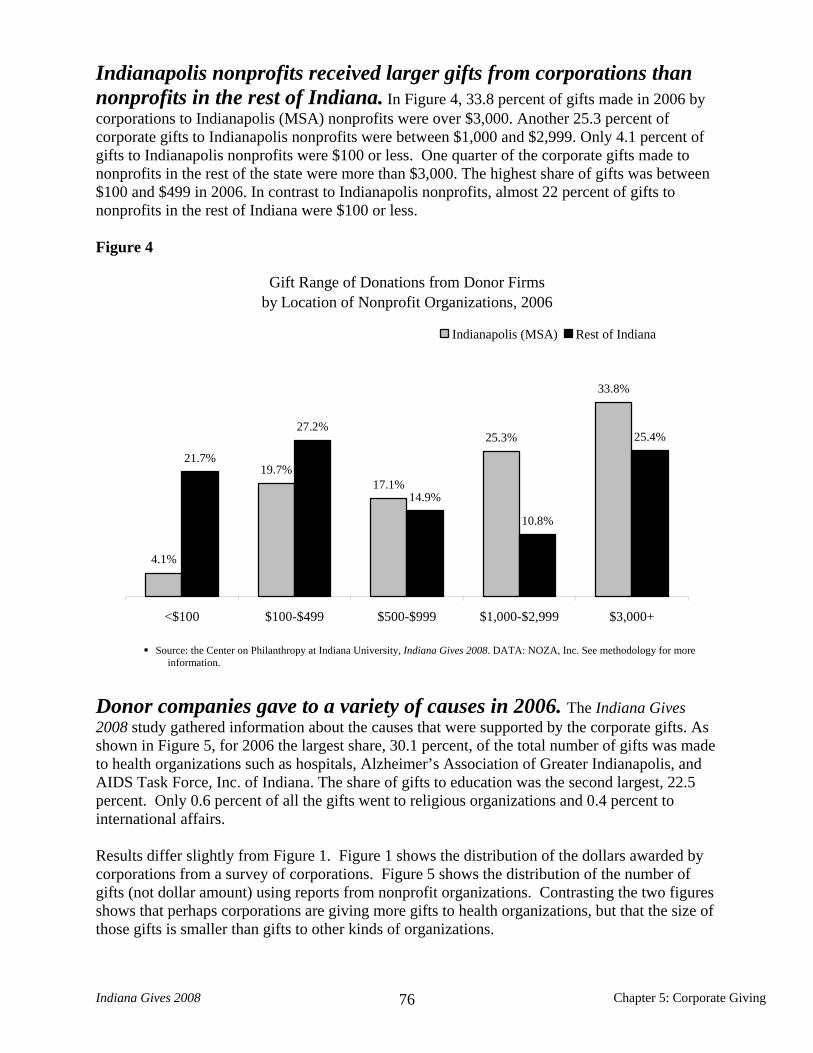
Indiana Gives 2008 Chapter 5: Corporate Giving 76
Indianapolis nonprofits received larger gifts from corporations than nonprofits in the rest of Indiana. In Figure 4, 33.8 percent of gifts made in 2006 by corporations to Indianapolis (MSA) nonprofits were over $3,000. Another 25.3 percent of corporate gifts to Indianapolis nonprofits were between $1,000 and $2,999. Only 4.1 percent of gifts to Indianapolis nonprofits were $100 or less. One quarter of the corporate gifts made to nonprofits in the rest of the state were more than $3,000. The highest share of gifts was between $100 and $499 in 2006. In contrast to Indianapolis nonprofits, almost 22 percent of gifts to nonprofits in the rest of Indiana were $100 or less. Figure 4
Gift Range of Donations from Donor Firms by Location of Nonprofit Organizations, 2006
4.1%
19.7%17.1%
25.3%
33.8%
21.7%
27.2%
14.9%
10.8%
25.4%
<$100 $100-$499 $500-$999 $1,000-$2,999 $3,000+
Indianapolis (MSA) Rest of Indiana
Source: the Center on Philanthropy at Indiana University, Indiana Gives 2008. DATA: NOZA, Inc. See methodology for more
information.
Donor companies gave to a variety of causes in 2006. The Indiana Gives 2008 study gathered information about the causes that were supported by the corporate gifts. As shown in Figure 5, for 2006 the largest share, 30.1 percent, of the total number of gifts was made to health organizations such as hospitals, Alzheimer’s Association of Greater Indianapolis, and AIDS Task Force, Inc. of Indiana. The share of gifts to education was the second largest, 22.5 percent. Only 0.6 percent of all the gifts went to religious organizations and 0.4 percent to international affairs. Results differ slightly from Figure 1. Figure 1 shows the distribution of the dollars awarded by corporations from a survey of corporations. Figure 5 shows the distribution of the number of gifts (not dollar amount) using reports from nonprofit organizations. Contrasting the two figures shows that perhaps corporations are giving more gifts to health organizations, but that the size of those gifts is smaller than gifts to other kinds of organizations.

Indiana Gives 2008 Chapter 5: Corporate Giving 77
Figure 5
Distribution of Corporate Gifts by Donor Firmswhich Made Contributions to Indiana Nonprofit Organizations
by Type of Organization, 2006
Health 30.1%
Education 22.5%
Human services14.7%
Art and culture 13.7%
Public-society benefit 9.3%
Youth and family 4.8%
Environment and animals2.7%
Neghborhood1.1%
Religion0.6%
International affairs0.4%
Source: the Center on Philanthropy at Indiana University, Indiana Gives 2008. DATA: NOZA, Inc. See methodology for more
information.
Donor companies preferred to make contributions to local Indiana nonprofit organizations in 2006. As shown in Figure 6, almost 68.0 percent of the gifts made by donor firms went to local Indiana nonprofit organizations. Approximately 31.0 percent of the gifts went to national nonprofit organizations that are located in Indiana in 2006. Only 1.8 percent of the gifts went to international nonprofit organizations that make their home in Indiana, for example the aid organization Church World Services. In addition, almost 74 percent of the total amount contributed by donor firms went to local nonprofit organizations in Indiana. National nonprofit organizations that are located in Indiana received 26 percent of the total amount contributed from donor firms in 2006, while only 0.03 percent of the total dollar amount went to nonprofit organizations serving internationally.

Indiana Gives 2008 Chapter 5: Corporate Giving 78
Figure 6
Scope of Indiana Recipient Nonprofit Organizations from Donor Firms, 2006
1.8%
30.7%
67.5%
Local National International Source: the Center on Philanthropy at Indiana University, Indiana Gives 2008. DATA: NOZA, Inc.
Over 40 percent of the number of gifts was made to nonprofit organizations in the Indianapolis MSA. As shown in Figure 7, of all the gifts made to Indiana nonprofits in 2006, almost 59.0 percent were given to nonprofit organizations located outside of the Indianapolis MSA region.
Figure 7
Location of Indiana Recipient Nonprofit Organizations,which Received Contriubtions from Corporations, 2006
59.0%
41.0%
Indianapolis (MSA) Rest of Indiana
Source: the Center on Philanthropy at Indiana University, Indiana Gives 2008. DATA: NOZA, Inc. Counties of the Indianapolis MSA in 2006 were Boone, Brown, Hamilton, Hancock, Hendricks, Johnson, Marion, Morgan, Putnam, and Shelby.

Indiana Gives 2008 Chapter 5: Corporate Giving 79
Indiana Gives 2008 also examined Indiana corporate foundations’ gifts made to nonprofit organizations. Indiana corporate foundation data was collected through FoundationSearch.com, Foundation Center, and GuideStar. Donor corporate foundations are Indiana-based and they made contributions to nonprofit organizations in Indiana, the rest of the U.S., and internationally. There were a total of 71 Indiana corporate foundations that made grants in 2006. Please see the methodology for more information.
Of all the types of organizations, Indiana corporate foundations donated the most to public-society benefit organizations in 2006. Indiana corporate foundations made approximately $76.9 million in grants to nonprofit organizations in 2006. Corporate foundations gave almost 25 percent of all grant dollars to public-society benefit organizations such as the United Way, Catholic Charities, and community foundations. The second largest share, 21.0 percent of total giving, went to educational organizations. Only 1.3 percent went to environmental nonprofit organizations and only 1.5 percent of the total amount donated by corporate foundations in Indiana was granted to organizations for international affairs. Figure 8
Indiana Corporate Foundations' Giving Priorities, 2006Total Estimated Donations: $76.9 million
(dollars in millions)
International affairs$1.11.5%
Enviroment and animals
$1.01.3%
Other$0.1
0.2%
Religion$2.7
3.5%
Art and culture $6.78.7%
Health $14.819.2%
Human services $15.0 19.6%
Education $15.820.6%
Public-society benefit $19.6 25.5%
Source: the Center on Philanthropy at Indiana University, Indiana Gives 2008. DATA: FoundationSearch.com.

Indiana Gives 2008 Chapter 5: Corporate Giving 80
Educational organizations received the largest number of grants from Indiana corporate foundations in 2006. Among the 2,763 grants made by Indiana corporate foundations, approximately 25.8 percent of the total number of grants from Indiana corporate foundations went to educational organizations (see Figure 9). The second largest share, 22.2 percent of the total number of grants, went to human service organizations. Only 0.7 percent went to organizations for other purposes and 1.3 percent went to international affairs.
Figure 9
Indiana Corporate Foundations' Giving Prioirities, 2006Total Number of Grants: 2,763
Education 712
25.8%
Enviroment and animals
431.6%
Religion244
8.8%
Art and culture 267
9.7%Health
35612.9%
Public-society benefit
47217.1%
Human services614
22.2%
Other19
0.7%International
affairs36
1.3%
Source: The Center on Philanthropy at Indiana University, Indiana Gives 2008. DATA: FoundationSearch.com.
On average, the largest grants from Indiana corporate foundations were made to health and public-society benefit organizations, as shown in Table 9. Grants to health organizations were the largest on average, $41,555 (median = $12,000). Public-society benefit organizations received the second largest average grants, $41,502 (median = $10,000). Organizations for “other” purposes received the smallest average grant, but the median grant was a little higher than the median grant to religious organizations ($4,997 vs. $4,450). Religious organizations received the second smallest average grants from Indiana corporate foundations in 2006 (mean = $11,042, median = $4,450).
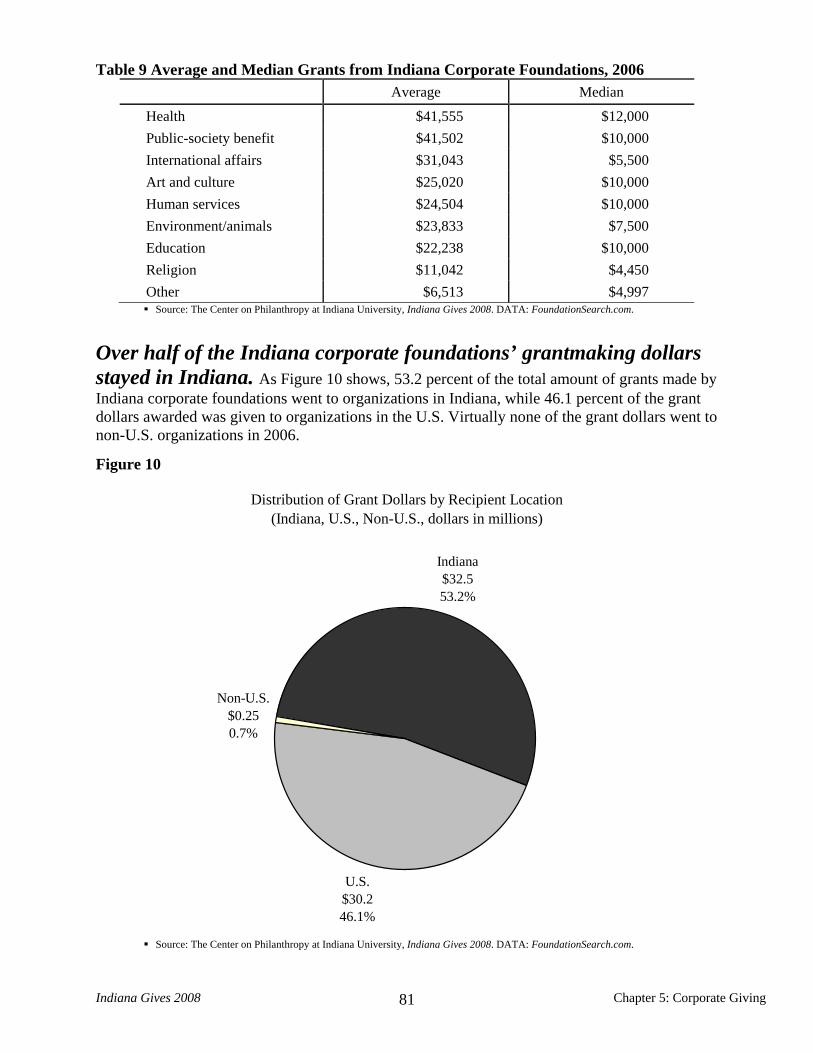
Indiana Gives 2008 Chapter 5: Corporate Giving 81
Table 9 Average and Median Grants from Indiana Corporate Foundations, 2006 Average Median
Health $41,555 $12,000 Public-society benefit $41,502 $10,000 International affairs $31,043 $5,500 Art and culture $25,020 $10,000 Human services $24,504 $10,000 Environment/animals $23,833 $7,500 Education $22,238 $10,000 Religion $11,042 $4,450 Other $6,513 $4,997 Source: The Center on Philanthropy at Indiana University, Indiana Gives 2008. DATA: FoundationSearch.com.
Over half of the Indiana corporate foundations’ grantmaking dollars stayed in Indiana. As Figure 10 shows, 53.2 percent of the total amount of grants made by Indiana corporate foundations went to organizations in Indiana, while 46.1 percent of the grant dollars awarded was given to organizations in the U.S. Virtually none of the grant dollars went to non-U.S. organizations in 2006.
Figure 10
Distribution of Grant Dollars by Recipient Location(Indiana, U.S., Non-U.S., dollars in millions)
Non-U.S.$0.250.7%
Indiana$32.553.2%
U.S.$30.246.1%
Source: The Center on Philanthropy at Indiana University, Indiana Gives 2008. DATA: FoundationSearch.com.

Indiana Gives 2008 Chapter 5: Corporate Giving 82
Eli Lilly and Company Foundation was the largest corporate grantmaker in Indiana, as shown in Table 10. Eli Lilly and Company Foundation donated almost $27.0 million to charity in 2006, which was almost 40.6 percent of the total amount of grants given by the top 10 Indiana corporate foundations. This amount does not include other donations made by the company from corporate revenue, only donations from the foundation. Total grant dollars from Eli Lilly and Company Foundation was almost 96 percent higher than the second largest corporate grantmaker. The second largest amount granted from a corporate foundation in Indiana was awarded from Guidant Foundation, Inc., which was $13.7 million. Total grants awarded by the top 10 Indiana corporate foundations were 86.3 percent of the total amount granted by all Indiana corporate foundations in 2006. Table 10 Ranking of the Top 10 Corporate Foundations by Amount Awarded, 2006
Rank Granting Foundation Total Amount Awarded
1 Eli Lilly and Company Foundation, Inc. $26,872,653 2 Guidant Foundation, Inc.* $13,732,838 3 Lincoln Financial Group Foundation, Inc. $9,419,463 4 Anthem Foundation, Inc.* $3,767,150 5 The Cummins Foundation, Inc. $3,122,794 6 Cinergy Foundation, Inc. $2,912,995 7 Caesars Riverboat Casino Foundation, Inc. $2,694,219 8 Vectren Foundation, Inc. $1,403,344 9 Immi Word & Deed Foundation, Inc. $1,282,000
10 Nisource Charitable Foundation $1,183,610 Total of top 10 $66,391,066
Top 10 as percentage of total grantmaking in Indiana corporate foundations 86.27%
Source: The Center on Philanthropy at Indiana University, Indiana Gives 2008. DATA: FoundationSearch.com.
* In 2006, Guidant and Boston Scientific merged. Anthem and WellPoint also merged in 2005, however Anthem Foundation remained a separate entity at the time of this report. Therefore the ranking of corporate foundations has changed since 2006.

Indiana Gives 2008 Chapter 5: Corporate Giving 83
A significant portion of Indiana corporate foundations’ grants, 70 percent, were between $1,000 and $25,000 in 2006, as shown in Figure 11. Almost 24 percent of the total number of grants from Indiana corporate foundations were between $1,000 and $5,000. Approximately 23.7 percent of the Indiana corporate foundation grants were between $5,000 and $10,000. The grants between $100,000 and $1,000,000 were only 4.1 percent of the total number of grants from Indiana corporate foundations.
Figure 11
Distribution of Grants by Indiana Corporate Foundationsby Size of Grants, 2006
3.6%
7.9%
24.2% 23.7%22.1%
8.8%5.5% 4.1%
0.1%
$100
or le
ss
$100
up to
$1,00
0
$1,00
0 up t
o $5,0
00
$5,00
0 up t
o $10
,000
$10,0
0 up t
o $25
,000
$25,0
00 up
to $5
0,000
$50,0
00 up
to $1
00,00
0
$100
,000 u
p to $
1,000
,000
$1,00
0,000
or M
ore

Indiana Gives 2008 Chapter 5: Corporate Giving 84
1 Giving USA 2008, p. 210. 2 Ibid, p. 218. 3 An estimated total amount of corporation giving found through Giving USA 2008. 4 An estimated growth rate of average amount contributed by corporations to charity found through Giving USA 2007. 5 An estimated percent of charitable giving by companies other than pharmaceutical firms found through Giving USA 2007. 6 An estimated percent of in-kind giving by companies excluding pharmaceutical firms found through Giving USA 2007.
Indiana Gives 2008 Chapter 6: Methodology 85
This section presents a review of the methods used to gather information for this report. For more information about the specific statistical techniques used in the estimating models, please contact the Research Department at The Center on Philanthropy at Indiana University.
The geographic area covered in this study of philanthropy is the state of Indiana, which includes the Indianapolis Metropolitan Statistical Area (MSA). This study involved research on the sources of charitable contributions in Indiana and their uses.
Fielding of the household and corporate survey, data processing, and construction of the sample weight was conducted by Metro Chicago Information Center (MCIC) in Chicago, IL. Data on foundation grants made by all Indiana foundations came from FoundationSearch.com and data on corporate gifts made to Indiana nonprofits came from NOZA, Inc.
Sources of Contributions This study involved research on three forms of charitable giving to nonprofit organizations: individual giving, foundation gifts, and corporate donations. Each of these types of contribution is covered in the following sections.
Individual Giving The primary source of information for the estimate of individual giving consisted of a telephone survey of household philanthropic activity. The questionnaire was based on a household survey used in the Center on Philanthropy Panel Study (COPPS), which is a national study done in conjunction with the Institute for Social Research at the University of Michigan. The use of a field-tested survey is important because it allows for the comparison of results from Indianapolis to other cities and from Indiana to the United States as a whole. Earlier research (e.g., Rooney, Steinberg, & Schervish, 2001; Rooney, Steinberg, & Schervish, 2004; and Wilhelm, 2006) found that longer more detailed prompts were significantly associated with less missing data because respondents recalled greater incidences of giving at all and they tended to report larger levels of giving. Therefore, the COPPS core questions and survey protocol include numerous memory prompts with specifics examples of what should and should not be included in giving to the various subsectors we asked about. All surveys conducted in Indiana originated from random digit dialing. To ensure the final disposition of the study was representative of the Indiana population, a weight was constructed by MCIC. The weight takes into account the population’s age, income, race, education, and geographic distribution as reported on the American Community Survey conducted by the Census.
Indiana Gives 2008
Methodology
Indiana Gives 2008 Chapter 6: Methodology 86
The survey instrument consisted of 89 questions relating to donations of money and assets in the year 2006 and 33 questions on demographic characteristics such as household income, race, gender, and education. Other questions including motivations and impediments to giving and volunteering patterns were also asked. A total of 1,600 households in Indiana were surveyed about their philanthropic behavior. Survey production began in July 2007 and was completed in mid August. The effective response rate was 22.7 percent, based on the standard definition (Response Rate 1) developed by the American Association for Public Opinion Research and available online at http://www.aapor.org/uploads/Standard_Definitions_07_08_Final.pdf.
Corporate Giving Three methods were used to assess corporate giving in Indiana, a mail survey of corporations, analysis of a database containing corporate gifts made to Indiana nonprofits, and analysis of a database of corporate foundation grants. The mail survey of corporations was fielded by MCIC in Chicago, IL. The mail survey was sent to all companies with the option of responding via a Web version of the survey. The mailings of the questionnaire packets began in October 2007 and were completed by February 2008. A total of four mailings were sent to companies, with each including the survey instrument and a cover letter to explain the purpose of the study, and instructions for either faxing their completed survey or filling out the Web version. The first two mailings included a 4 page survey instrument and were sent via USPS First Class. The remaining two mailings included a 2 page survey instrument that was sent by Priority Mail and included incentives to boost the response rate.
The questionnaire itself was developed by the Center on Philanthropy. The Indiana corporate survey instrument consisted of 72 questions (four pages) or 38 questions (two pages) relating to donations of money, assets, and time for the year 2006 and projected figures for the year 2007. Both local (within the state) and non-local giving were queried. The survey also included questions on business characteristics such as the company’s legal form and number of employees.
The sampling frame consisted of 525 companies, which were randomly selected to represent small, medium, and large companies in Indiana, were compiled by the Indiana Business Research Center from Hoover’s Inc. Large companies were defined as those that reported 250 or more employees. Medium companies were defined as those that reported 50 to 249 employees, and small companies were defined as those that reported fewer than 50 employees.
The sample was supplemented with 100 of the largest public and private companies including company-sponsored foundations (based on 2006 sales revenue) in Indiana. Disposition of the sample is shown in Table 1.
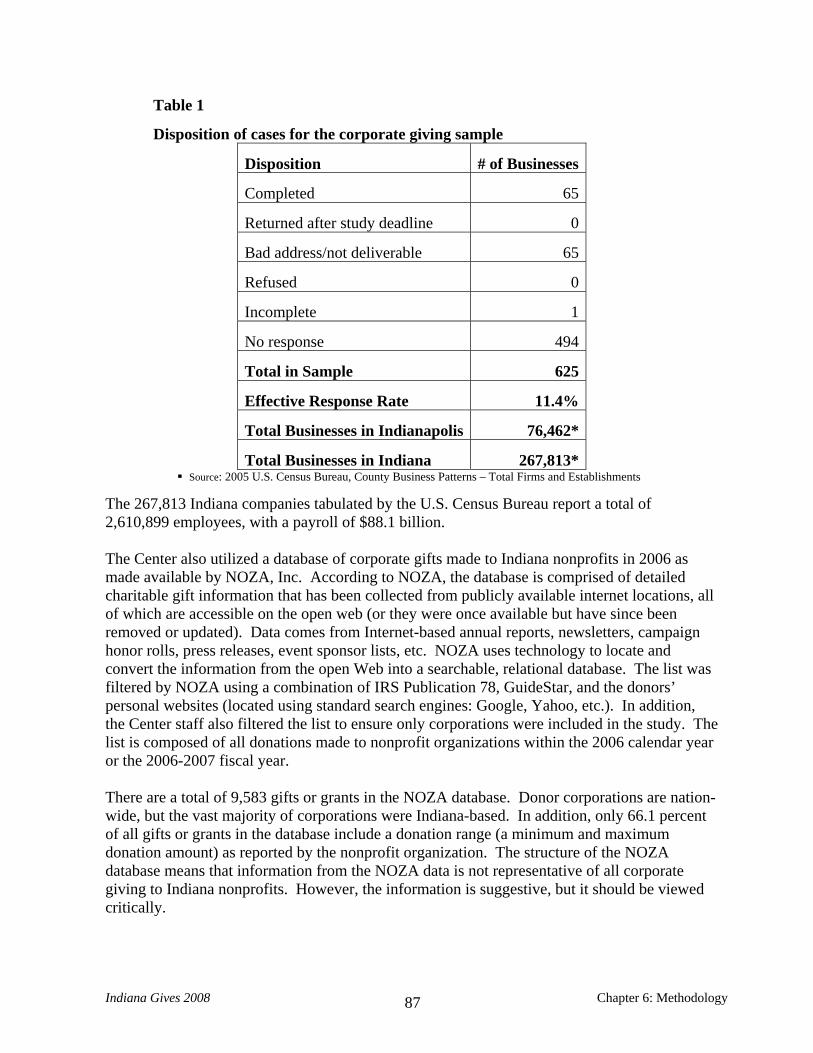
Indiana Gives 2008 Chapter 6: Methodology 87
Table 1
Disposition of cases for the corporate giving sample
Disposition # of Businesses
Completed 65
Returned after study deadline 0
Bad address/not deliverable 65
Refused 0
Incomplete 1
No response 494
Total in Sample 625
Effective Response Rate 11.4%
Total Businesses in Indianapolis 76,462*
Total Businesses in Indiana 267,813* Source: 2005 U.S. Census Bureau, County Business Patterns – Total Firms and Establishments
The 267,813 Indiana companies tabulated by the U.S. Census Bureau report a total of 2,610,899 employees, with a payroll of $88.1 billion. The Center also utilized a database of corporate gifts made to Indiana nonprofits in 2006 as made available by NOZA, Inc. According to NOZA, the database is comprised of detailed charitable gift information that has been collected from publicly available internet locations, all of which are accessible on the open web (or they were once available but have since been removed or updated). Data comes from Internet-based annual reports, newsletters, campaign honor rolls, press releases, event sponsor lists, etc. NOZA uses technology to locate and convert the information from the open Web into a searchable, relational database. The list was filtered by NOZA using a combination of IRS Publication 78, GuideStar, and the donors’ personal websites (located using standard search engines: Google, Yahoo, etc.). In addition, the Center staff also filtered the list to ensure only corporations were included in the study. The list is composed of all donations made to nonprofit organizations within the 2006 calendar year or the 2006-2007 fiscal year. There are a total of 9,583 gifts or grants in the NOZA database. Donor corporations are nation-wide, but the vast majority of corporations were Indiana-based. In addition, only 66.1 percent of all gifts or grants in the database include a donation range (a minimum and maximum donation amount) as reported by the nonprofit organization. The structure of the NOZA database means that information from the NOZA data is not representative of all corporate giving to Indiana nonprofits. However, the information is suggestive, but it should be viewed critically.
Indiana Gives 2008 Chapter 6: Methodology 88
The third source of information is a database of corporate foundation grants. The data came from FoundationSearch.com and was supplemented with some grant information from IRS-Forms 990-PF as made available on Guidestar.org. The fiscal year for corporate grants was 2006. The study consists of grant information for grants $4,000 or greater. There were a total of 2,765 grants made by 71 corporate foundations located in Indiana.
Foundation Giving The data in this study represents grant information that was reported by independent, operating, and community foundations in Indiana. The study consisted of grant information that was obtained from the FoundationSearch.com database, IRS Forms 990 or Forms 990PF, annual reports, or by electronic lists from foundations themselves. If the grantmaker filed a form for a fiscal year, 2005-2006 was used if available; if not, the prior year (2004-2005) was used. Using the list of all Indiana foundations, 20 percent were randomly selected in the sample. An estimated 1,285 Indiana foundations (excluding corporate foundations) were listed, and 319 foundations were randomly selected to be in the study sample. Based on the list of sampled foundations in Indiana, all grants of $4,000 and above were listed. Grants below $4,000 were numbered and a random selection of 20 percent identified using a random number generator. Those grants were then entered into the database. An estimated total of 11,915 unduplicated grants were recorded. Of these, 10,128 grants were $4,000 or more, and 1,780 grants were less than $4,000. In order to create figures that account for all grants, not just the ones that were coded, redistribution was performed to account for entire figures of data. For example, the distribution of coded grants by each subsector from all sampled grants were redistributed across all grants to get a dollar figure for each subsector that would account for all grant dollars. Some grants were excluded from the study. Grants were removed from the list because of redundancy in search results, because the donor had voided the grants, because the grants were non-outgoing funding, because the grants were classified as “single organization support” to its primary recipient, or because the grants funded for-profit organizations. Grants that were made by a foundation to another foundation were included in the study. Since data represents what the foundations report, figures are an approximation of what grantmaking was in 2005. How a foundation reports its grantmaking will affect figures. Pass-through grants are not considered a part of a foundation’s grantmaking priorities, but are sometimes reported and may be included in this study. Also, “double counting” may be included in the study. Double counting happens when funding from one foundation to another foundation is redistributed by the recipient foundation to a third party. Finally, some grants were reported as having various recipients or were for multiple scholarships. These aggregate grants may have affected the data.

Indiana Gives 2008 Chapter 6: Methodology 89
Types of Recipient Organizations The Center on Philanthropy combined results from the individual, foundation, and corporate datasets to draw conclusions about the distribution of charitable gifts to nonprofit organizations in the Indiana area. As with Giving USA, nonprofit organizations were classified into nine different subsectors, based on the National Taxonomy of Exempt Entities. These subsectors include 1) Arts, Culture, and Humanities; 2) Education; 3) Environment; 4) Human Services; 5) Health; 6) International Affairs; 7) Public-Society Benefit; 8) Religion; and 9) Foundations. Please see http://nccsdataweb.urban.org/FAQ/index.php?category=65#327 for more details.
Accuracy of Estimates
Every precaution was taken to make the findings in this study as accurate as possible. For example, we used the best possible state-of-the art sampling, weighting, and survey techniques. However, all surveys are subject to a small amount of error. The estimates contained in this report are extrapolated from our survey data. They should be viewed as the best possible estimates that could be obtained, providing as complete a picture as possible of philanthropy in Indiana and the Indianapolis metropolitan area.