charantia doi: 10.2503/hortj.MI-159 Genetic Research on ...
6
Genetic Research on Fruit Color Traits of the Bitter Gourd (Momordica charantia L.) Hsiang-Yi Huang 1 and Ching-Hsiang Hsieh 2 * 1 Chinan Branch Station, Kaohsiung District Agricultural Research and Extension Station, Kaohsiung 842, Taiwan, Republic of China 2 Department of Plant Industry, National Pingtung University of Science and Technology, Pingtung 912, Taiwan, Republic of China The objective of this study was to determine the genetic model of fruit color in the bitter gourd (Momordica charantia L.). Six generations (P 1 , P 2 , F 1 , F 2 , BCP 1 , and BCP 2 ) in the hybrid set “MS 41 × MS 47” were used to estimate the genetic effects via generation mean analysis (GMA). The fruit color of the F 1 population was green implying the green color was dominant over the white color. The fruit color of the F 2 population showed a continuous distribution from white to dark green indicating this trait was controlled by quantitative genes. Genetic analyses using the Royal Horticultural Society scoring system (RHS score) fitted the three parameters model (χ 2 3 = 1.59, P = 0.6607) and showed significant to highly significant additive and dominance effects, respectively. The GMA results of the six parameters model revealed a significant additive effect on chlorophyll b concentration. Chlorophyll a and total chlorophyll concentrations were nonsignificant in all parameters. The magnitudes of additive and additive × additive gene effects were larger than those of the dominance and dominance × dominance gene effects, which revealed that additive genes were more important in the contribution to chlorophyll concentrations. Broad-sense heritability estimates for color traits were 0.39, 0.611, 0.470, and 0.460 for concentrations of chlorophyll a, chlorophyll b, total chlorophyll, and RHS score, respectively. In contrast to previous findings, with the GMA analysis we believe that the genetic model of fruit color in bitter gourd is clearly a quantitative model. Key Words: chlorophyll, generation mean analysis (GMA), genetic effect, heritability. Introduction The bitter gourd (Momordica charantia L.) an impor- tant cucurbitaceous crop in eastern and southern Asia. It is often consumed as a vegetable in the daily diet in these areas (Rubatzky and Yamaguchi, 1997). Although its origin is uncertain, areas of eastern India and south- ern China are thought to be possible native regions (Raj et al., 1993). The major editable portion of the bitter gourd is the immature fruit. Immature bitter gourd fruits are green or white. There is a broad spectrum for color of the green fruit—from light green to very dark green. Actually, there are many pigments in bitter gourd fruits e.g. chlorophylls, carotenoids, flavonoids, and so on (Behera et al., 2013; Gross, 1991; Rodriguez et al., 1976). The interaction of the pigments is responsible for the color changes at different developmental stages Received; March 29, 2016. Accepted; August 15, 2016. First Published Online in J-STAGE on September 27, 2016. * Corresponding author (E-mail: [email protected]). of the fruit. The major pigments of the immature fruit are chlorophylls (chlorophyll a and chlorophyll b) which affect the external color of bitter gourd fruits, ranging from white to very dark green. The color be- comes orange when fruits are mature as chlorophyll concentrations reduce and carotenoids, flavonoids con- centrations accumulate (Gross, 1991). The inheritance of the fruit or mesocarp colors varied within different cucurbits. Paris (2000) reported the fruit color of squash was affected by two genes, one dominant, one recessive, and that their interactions gov- erned the color at each stage of fruit growth. The flesh color of watermelon was controlled by two genes (Shimotsuma, 1963), but Gusmini and Wehner (2006) mentioned the genetic model of flesh color in the water- melon was affected by one gene or multiple genes that depended on the combinations of parents with different flesh colors. Cuevas et al. (2010a) found the inheritance of beta-carotene content in the cucumber mesocarp was controlled by two recessive genes which affected the phenotype of flesh color, but inheritance of beta- The Horticulture Journal 86 (2): 238–243. 2017. doi: 10.2503/hortj.MI-159 JSHS e Japanese Society for Horticultural Science http://www.jshs.jp/ © 2017 The Japanese Society for Horticultural Science (JSHS), All rights reserved.
Transcript of charantia doi: 10.2503/hortj.MI-159 Genetic Research on ...
Genetic Research on Fruit Color Traits of the Bitter Gourd (Momordicacharantia L.)
Hsiang-Yi Huang1 and Ching-Hsiang Hsieh2*
1Chinan Branch Station, Kaohsiung District Agricultural Research and Extension Station, Kaohsiung 842, Taiwan, Republic ofChina
2Department of Plant Industry, National Pingtung University of Science and Technology, Pingtung 912, Taiwan, Republic of China
The objective of this study was to determine the genetic model of fruit color in the bitter gourd (Momordicacharantia L.). Six generations (P1, P2, F1, F2, BCP1, and BCP2) in the hybrid set “MS 41 × MS 47” were used toestimate the genetic effects via generation mean analysis (GMA). The fruit color of the F1 population was greenimplying the green color was dominant over the white color. The fruit color of the F2 population showed acontinuous distribution from white to dark green indicating this trait was controlled by quantitative genes.Genetic analyses using the Royal Horticultural Society scoring system (RHS score) fitted the three parametersmodel (χ2
3 = 1.59, P = 0.6607) and showed significant to highly significant additive and dominance effects,respectively. The GMA results of the six parameters model revealed a significant additive effect on chlorophyllb concentration. Chlorophyll a and total chlorophyll concentrations were nonsignificant in all parameters. Themagnitudes of additive and additive × additive gene effects were larger than those of the dominance anddominance × dominance gene effects, which revealed that additive genes were more important in thecontribution to chlorophyll concentrations. Broad-sense heritability estimates for color traits were 0.39, 0.611,0.470, and 0.460 for concentrations of chlorophyll a, chlorophyll b, total chlorophyll, and RHS score,respectively. In contrast to previous findings, with the GMA analysis we believe that the genetic model of fruitcolor in bitter gourd is clearly a quantitative model.
Key Words: chlorophyll, generation mean analysis (GMA), genetic effect, heritability.
Introduction
The bitter gourd (Momordica charantia L.) an impor-tant cucurbitaceous crop in eastern and southern Asia. Itis often consumed as a vegetable in the daily diet inthese areas (Rubatzky and Yamaguchi, 1997). Althoughits origin is uncertain, areas of eastern India and south-ern China are thought to be possible native regions (Rajet al., 1993). The major editable portion of the bittergourd is the immature fruit. Immature bitter gourd fruitsare green or white. There is a broad spectrum for colorof the green fruit—from light green to very dark green.Actually, there are many pigments in bitter gourd fruitse.g. chlorophylls, carotenoids, flavonoids, and so on(Behera et al., 2013; Gross, 1991; Rodriguez et al.,1976). The interaction of the pigments is responsiblefor the color changes at different developmental stages
Received; March 29, 2016. Accepted; August 15, 2016.First Published Online in J-STAGE on September 27, 2016.* Corresponding author (E-mail: [email protected]).
of the fruit. The major pigments of the immature fruitare chlorophylls (chlorophyll a and chlorophyll b)which affect the external color of bitter gourd fruits,ranging from white to very dark green. The color be-comes orange when fruits are mature as chlorophyllconcentrations reduce and carotenoids, flavonoids con-centrations accumulate (Gross, 1991).
The inheritance of the fruit or mesocarp colors variedwithin different cucurbits. Paris (2000) reported thefruit color of squash was affected by two genes, onedominant, one recessive, and that their interactions gov-erned the color at each stage of fruit growth. The fleshcolor of watermelon was controlled by two genes(Shimotsuma, 1963), but Gusmini and Wehner (2006)mentioned the genetic model of flesh color in the water-melon was affected by one gene or multiple genes thatdepended on the combinations of parents with differentflesh colors. Cuevas et al. (2010a) found the inheritanceof beta-carotene content in the cucumber mesocarp wascontrolled by two recessive genes which affected thephenotype of flesh color, but inheritance of beta-
The Horticulture Journal 86 (2): 238–243. 2017.doi: 10.2503/hortj.MI-159
JSHS
�e Japanese Society for
Horticultural Sciencehttp://www.jshs.jp/
© 2017 The Japanese Society for Horticultural Science (JSHS), All rights reserved.
carotene content in the endocarp was dominated by onerecessive gene. The color appearances of the mesocarpand endocarp were independent. As for inheritance ofmesocarp color in melon (Cucumis pepo L.), Cuevaset al. (2010b) evaluated the mesocarp color of segregat-ing generations that fitted a two-gene recessive epistaticmodel.
Only a few studies about the inheritance of fruit colorin the bitter gourd have been reported and three of them(Dalamu et al., 2012; Hu et al., 2002; Srivastava andNath, 1972) concluded that the green color was mono-genically dominant over the white color. Srivastava andNath (1972) analyzed two F2 populations from two hy-brid combinations with green fruit and white fruit par-ents that found immature fruit color of the bitter gourdwas controlled by one nucleus gene with no cytoplas-mic factor involved. Hu et al. (2002) and Dalamu et al.(2012) reached similar conclusions about the expres-sions of fruit color in bitter gourds. However, Hu et al.(2002) also found the color of some fruits from F1 andbackcross populations was lighter than that of the par-ents. They speculated the light green colors were prob-ably affected by incomplete dominance or modifiers.Hence, the fruits of an F2 population derived from pureline parents showed a green color gradient.
In order to further clarify the genetic puzzle of thefruit color in the bitter gourd, the present study initiateda series of crosses, from the parents, F1, F2, to BCP1 andBCP2, and estimated the concentrations of chlorophyllsand color appearance in the fruits analyzed by usinggeneration mean analyses and broad-sense heritabilityestimation techniques to clarify the possible geneticalmechanism for the coloring of bitter gourd fruits.
Materials and Methods
Plant materialA white fruit bitter gourd line MS 41 (maternal par-
ent, P1) was crossed with a green fruit line MS 47 (pa-ternal parent, P2). Both parents were inbred lines thathad been selfed for six generations. The F1 plants wereself-pollinated to produce the F2 population. Then, theF1 plants were used as paternal parents which werebackcrossed with P1 and P2 plants to generate BCP1 andBCP2 generations, respectively. Seeds from each gener-ation, from parents, F1, F2, BCP1, and BCP2 were ger-minated and raised in a net-house at Chinan Branch,Kaohsiung District Agricultural Research andExtension Station in the summer of 2013.
Experimental designThe experiment was a random complete block design
(RCBD) with four replications. There were 153 plantsfor P1, 139 plants for P2, 139 plants for F1, 216 plantsfor F2, 200 plants for BCP1, and 201 plants for BCP2 inthe study. The planting density was 1.2 m × 0.5 m.Standard fertilization programs and pest control prac-tices as recommended by the government for commer-
cial bitter gourd production in Taiwan were followed.
Fruit color classification and chlorophyll concentrationanalysis
The fruits from the second and third fruit-set wereharvested from each plant at 14 days after pollination toinvestigate the external color and chlorophyll concen-trations. Fruits were collected from June 11 to July 12,2013. The fruits were classified into 10 color groupsfrom white (as 1) to the darkest green (as 10) usingRoyal Horticultural Society (RHS) color charts (5th Ed-ition, 2007). The corresponding codes for RHS colorcharts are as follows: 1 = RHS-155B, 2 = RHS-157A,3 = RHS-150D, 4 = RHS-145C, 5 = RHS-145B, 6 = RHS-139D, 7 = RHS-144B, 8 = RHS-143A, 9 = RHS-137C, and 10 = RHS-137A.
Chlorophyll concentrations were determined accord-ing to the method of Arnon (1949). Two pulp samplesfor chlorophyll determination were collected from themiddle of each fruit at opposite positions. The innersponge-like pulp tissues were removed and all otherportions were used for analysis. 0.5 g pulp was groundwith 5 mL 100% acetone with a cold mortar and pestle.Then, the extract was centrifuged at 3024 × g for 5 minto clarify it. 0.05 mL of the upper solution of centri-fuged extract was added to 0.95 mL of 80% aqueousacetone. Absorption was measured at 663 nm and645 nm using an ultraviolet-visible spectrophotometer(UV-1601; Shimadzu Corporation, Japan). The chloro-phyll concentration was calculated as follows:
Chlorophyll a mg ⋅ g−1FW = 12.7 × A663− 2.69 × A645 × g FW × V
Chlorophyll b mg ⋅ g−1FW = 22.9 × A645− 4.68 × A663 × g FW × V
Total chlorophyll mg ⋅ g−1FW = 20.08 × A645+ 8.02 × A663 / g FW × V
Where, A663 = absorption at 663 nm, A645 = absorptionat 645 nm,
Total chlorophyll = Chlorophyll a + b,V = volume of chlorophyll extract (0.05 mL)
Estimation of genetic parameters and generation meananalysis (GMA)
The means of populations for the six generations (P1,P2, F1, F2, BCP1, and BCP2) were used to evaluate thetypes of gene action. The calculations of three parame-ters, i.e., mean of F2 population (m), additive effects (a),and dominance effects (d) were described by Hayman(1958). Fitness of the three parameters model was de-termined by the Chi-square (χ2) test with 3 degrees offreedom.
When the χ2 value was nonsignificant (P > 0.05), it
Hort. J. 86 (2): 238–243. 2017. 239

indicated the trait fitted for the three parameters model.If the χ2 value of the three parameters model was signif-icant, then the six parameters model was computed. Sixparameters of genetic effects were estimated for addi-tive (a), dominance (d), additive × additive (aa), addi-tive × dominance (ad), dominance × dominance (dd),and mean of F2 population (m), and were tested for sig-nificance using an unpaired t-test. The expected geneticvariance of the six populations was estimated by theprocedure of Hayman (1958). Broad-sense heritability(h2
B) was evaluated by the data of four fruit color-related traits gained from GMA, which was calculatedby the method of Mahmud and Kramer (1951).
Results
Fruit color classification and chlorophyll concentrationanalysis
The fruit colors of six generations are shown inFigure 1. The means of chlorophyll a, chlorophyll b,total chlorophyll, and RHS scores for the six genera-tions of the bitter gourd hybrid set are presented inTable 1. Concentrations of chlorophyll (a, b, and total)and RHS scores were significantly different betweenthe two parents. The values of all fruit color-relatedtraits derived from the cross-progenies (F1, F2, BCP1,and BCP2) were scattered and distributed between thetwo parents.
The concentrations of chlorophyll a, chlorophyll b,and total chlorophyll of the F1 population were signifi-cantly higher than those of the white-colored parent (P1)and lower than that of the green-colored parent (P2).The average RHS score of F1 population reached 6.8,which was very close to the mean of the green parent,
P2, revealing that green fruit color was dominant overwhite color. The fruit colors of F2 population were scat-tered from white (RHS score = 1) to dark green (RHSscore = 10) with continuous changes (Table 2) that im-plied the fruit color of bitter gourd was a quantitativetrait that corresponded to actual fruit colors (Fig. 1D).
Estimation of genetic parametersThe analysis of genetic effect estimates of the three
A
C
E F
D
B
Fig. 1. Fruit colors of parents (P1 (A) and P2 (B)), F1 (C), F2 (D),and backcross progenies of BCP1 (E) and BCP2 (F) in the hy-brid set “MS 41 × MS 47”.
Table 1. Means of chlorophyll concentrations and RHS scores of the six generations in the bitter gourd hybrid set “MS 41 × MS 47”.
Generation Chlorophyll a(μg·g−1 fresh pulp)
Chlorophyll b(μg·g−1 fresh pulp)
Total chlorophyll(μg·g−1 fresh pulp)
RHS score
P1 5.2 ± 0.3z 6.4 ± 0.1 11.6 ± 0.5 2.0 ± 0.1P2 125.3 ± 15.8 60.0 ± 8.3 184.7 ± 24.0 8.3 ± 0.3F1 45.0 ± 7.3 22.0 ± 2.9 66.8 ± 10.2 6.8 ± 0.4F2 34.0 ± 3.0 18.2 ± 1.3 52.0 ± 4.3 5.8 ± 0.3BCP1 22.8 ± 1.8 13.3 ± 0.7 36.0 ± 2.5 4.7 ± 0.4BCP2 74.7 ± 8.5 35.9 ± 3.2 110.2 ± 11.7 7.9 ± 0.3
z The data show mean ± SE.
Table 1. Means of chlorophyll concentrations and RHS scores of the six generations in the bitter gourd hybrid set “MS 41 × MS 47”.
Table 2. The frequency distribution of RHS scores for the six generations in the bitter gourd hybrid set “MS 41 × MS 47”.
GenerationRHS score
Population1 2 3 4 5 6 7 8 9 10
P1 67 40 29 17 0 0 0 0 0 0 153P2 0 0 0 0 0 0 3 83 42 11 139F1 0 0 0 7 19 12 22 75 4 0 139F2 2 2 23 25 33 4 40 85 1 1 216BCP1 7 17 22 80 4 9 30 29 2 0 200BCP2 0 0 0 1 4 5 13 140 27 11 201
Table 2. The frequency distribution of RHS scores for the six generations in the bitter gourd hybrid set “MS 41 × MS 47”.
240 H.-Y. Huang and C.-H. Hsieh
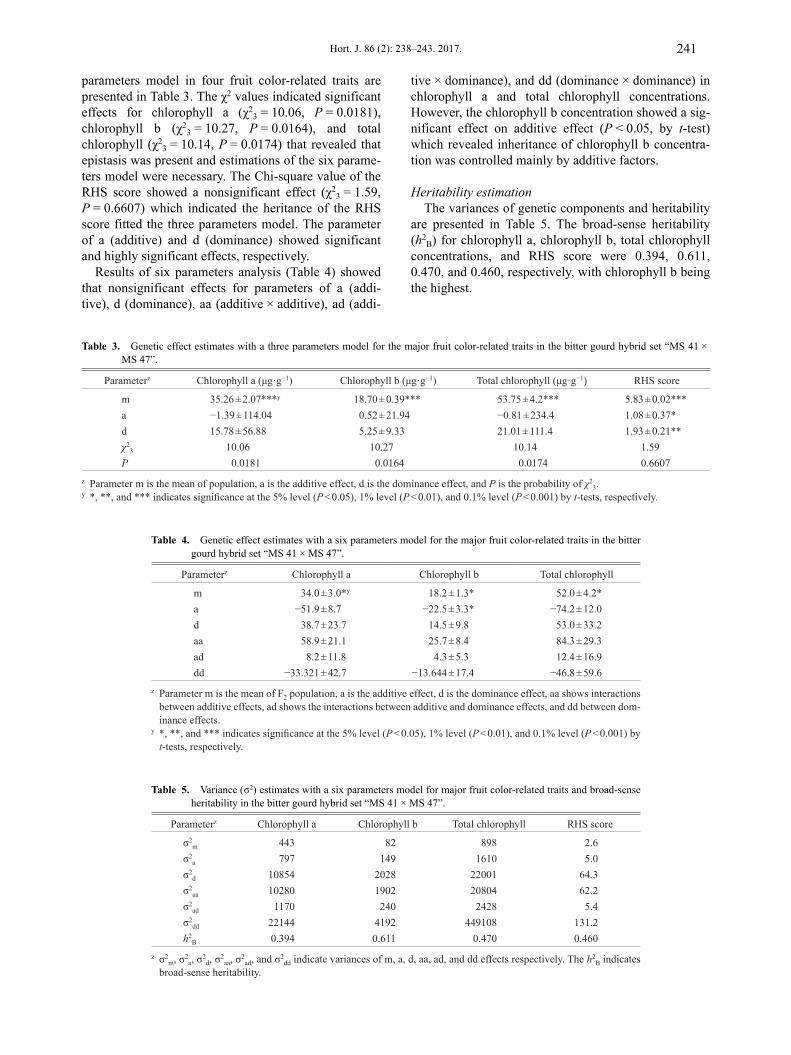
parameters model in four fruit color-related traits arepresented in Table 3. The χ2 values indicated significanteffects for chlorophyll a (χ2
3 = 10.06, P = 0.0181),chlorophyll b (χ2
3 = 10.27, P = 0.0164), and totalchlorophyll (χ2
3 = 10.14, P = 0.0174) that revealed thatepistasis was present and estimations of the six parame-ters model were necessary. The Chi-square value of theRHS score showed a nonsignificant effect (χ2
3 = 1.59,P = 0.6607) which indicated the heritance of the RHSscore fitted the three parameters model. The parameterof a (additive) and d (dominance) showed significantand highly significant effects, respectively.
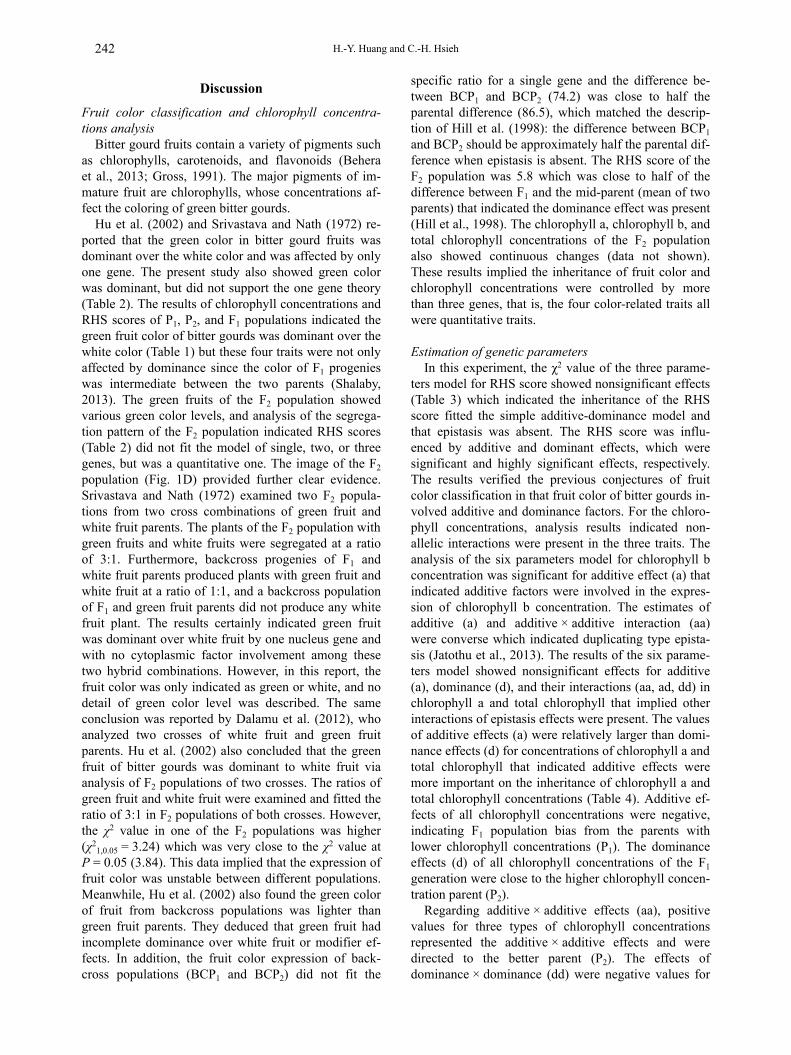
Results of six parameters analysis (Table 4) showedthat nonsignificant effects for parameters of a (addi-tive), d (dominance), aa (additive × additive), ad (addi-
tive × dominance), and dd (dominance × dominance) inchlorophyll a and total chlorophyll concentrations.However, the chlorophyll b concentration showed a sig-nificant effect on additive effect (P < 0.05, by t-test)which revealed inheritance of chlorophyll b concentra-tion was controlled mainly by additive factors.
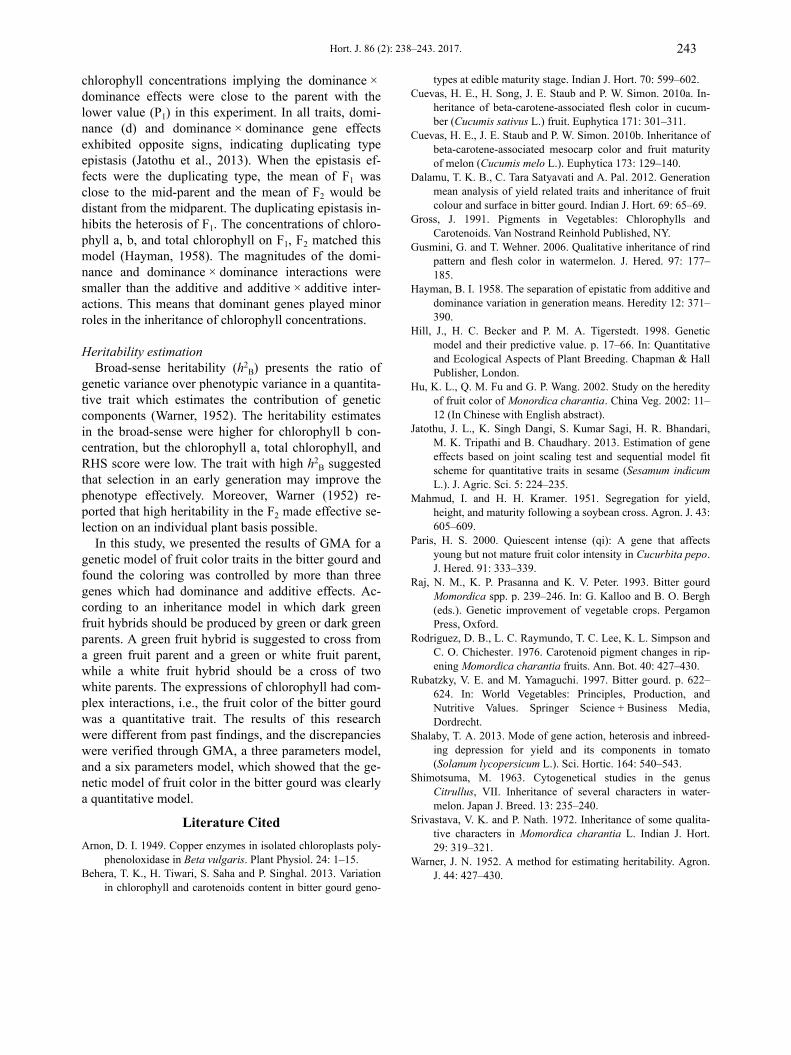
Heritability estimationThe variances of genetic components and heritability
are presented in Table 5. The broad-sense heritability(h2
B) for chlorophyll a, chlorophyll b, total chlorophyllconcentrations, and RHS score were 0.394, 0.611,0.470, and 0.460, respectively, with chlorophyll b beingthe highest.
Table 3. Genetic effect estimates with a three parameters model for the major fruit color-related traits in the bitter gourd hybrid set “MS 41 × MS 47”.
Parameterz Chlorophyll a (μg·g−1) Chlorophyll b (μg·g−1) Total chlorophyll (μg·g−1) RHS score
m 35.26 ± 2.07***y 18.70 ± 0.39*** 53.75 ± 4.2*** 5.83 ± 0.02***a −1.39 ± 114.04 0.52 ± 21.94 −0.81 ± 234.4 1.08 ± 0.37*d 15.78 ± 56.88 5.25 ± 9.33 21.01 ± 111.4 1.93 ± 0.21**χ2
3 10.06 10.27 10.14 1.59P 0.0181 0.0164 0.0174 0.6607
z Parameter m is the mean of population, a is the additive effect, d is the dominance effect, and P is the probability of χ23.
y *, **, and *** indicates significance at the 5% level (P < 0.05), 1% level (P < 0.01), and 0.1% level (P < 0.001) by t-tests, respectively.
Table 3. Genetic effect estimates with a three parameters model for the major fruit color-related traits in the bitter gourd hybrid set “MS 41 × MS 47”.
Table 4. Genetic effect estimates with a six parameters model for the major fruit color-related traits in the bittergourd hybrid set “MS 41 × MS 47”.
Parameterz Chlorophyll a Chlorophyll b Total chlorophyll
m 34.0 ± 3.0*y 18.2 ± 1.3* 52.0 ± 4.2*a −51.9 ± 8.7 −22.5 ± 3.3* −74.2 ± 12.0d 38.7 ± 23.7 14.5 ± 9.8 53.0 ± 33.2aa 58.9 ± 21.1 25.7 ± 8.4 84.3 ± 29.3ad 8.2 ± 11.8 4.3 ± 5.3 12.4 ± 16.9dd −33.321 ± 42.7 −13.644 ± 17.4 −46.8 ± 59.6
z Parameter m is the mean of F2 population, a is the additive effect, d is the dominance effect, aa shows interactions between additive effects, ad shows the interactions between additive and dominance effects, and dd between dom-inance effects.
y *, **, and *** indicates significance at the 5% level (P < 0.05), 1% level (P < 0.01), and 0.1% level (P < 0.001) by t-tests, respectively.
Table 4. Genetic effect estimates with a six parameters model for the major fruit color-related traits in the bitter gourd hybrid set “MS 41 × MS 47”.
Table 5. Variance (σ2) estimates with a six parameters model for major fruit color-related traits and broad-senseheritability in the bitter gourd hybrid set “MS 41 × MS 47”.
Parameterz Chlorophyll a Chlorophyll b Total chlorophyll RHS score
σ2m 443 82 898 2.6
σ2a 797 149 1610 5.0
σ2d 10854 2028 22001 64.3
σ2aa 10280 1902 20804 62.2
σ2ad 1170 240 2428 5.4
σ2dd 22144 4192 449108 131.2
h2B 0.394 0.611 0.470 0.460
z σ2m, σ2
a, σ2d, σ2
aa, σ2ad, and σ2
dd indicate variances of m, a, d, aa, ad, and dd effects respectively. The h2B indicates
broad-sense heritability.
Table 5. Variance (σ2) estimates with a six parameters model for major fruit color-related traits and broad-sense heritability in the bitter gourd hybrid set “MS 41 × MS 47”.
Hort. J. 86 (2): 238–243. 2017. 241
Discussion
Fruit color classification and chlorophyll concentra-tions analysis
Bitter gourd fruits contain a variety of pigments suchas chlorophylls, carotenoids, and flavonoids (Beheraet al., 2013; Gross, 1991). The major pigments of im-mature fruit are chlorophylls, whose concentrations af-fect the coloring of green bitter gourds.
Hu et al. (2002) and Srivastava and Nath (1972) re-ported that the green color in bitter gourd fruits wasdominant over the white color and was affected by onlyone gene. The present study also showed green colorwas dominant, but did not support the one gene theory(Table 2). The results of chlorophyll concentrations andRHS scores of P1, P2, and F1 populations indicated thegreen fruit color of bitter gourds was dominant over thewhite color (Table 1) but these four traits were not onlyaffected by dominance since the color of F1 progenieswas intermediate between the two parents (Shalaby,2013). The green fruits of the F2 population showedvarious green color levels, and analysis of the segrega-tion pattern of the F2 population indicated RHS scores(Table 2) did not fit the model of single, two, or threegenes, but was a quantitative one. The image of the F2population (Fig. 1D) provided further clear evidence.Srivastava and Nath (1972) examined two F2 popula-tions from two cross combinations of green fruit andwhite fruit parents. The plants of the F2 population withgreen fruits and white fruits were segregated at a ratioof 3:1. Furthermore, backcross progenies of F1 andwhite fruit parents produced plants with green fruit andwhite fruit at a ratio of 1:1, and a backcross populationof F1 and green fruit parents did not produce any whitefruit plant. The results certainly indicated green fruitwas dominant over white fruit by one nucleus gene andwith no cytoplasmic factor involvement among thesetwo hybrid combinations. However, in this report, thefruit color was only indicated as green or white, and nodetail of green color level was described. The sameconclusion was reported by Dalamu et al. (2012), whoanalyzed two crosses of white fruit and green fruitparents. Hu et al. (2002) also concluded that the greenfruit of bitter gourds was dominant to white fruit viaanalysis of F2 populations of two crosses. The ratios ofgreen fruit and white fruit were examined and fitted theratio of 3:1 in F2 populations of both crosses. However,the χ2 value in one of the F2 populations was higher(χ2
1,0.05 = 3.24) which was very close to the χ2 value atP = 0.05 (3.84). This data implied that the expression offruit color was unstable between different populations.Meanwhile, Hu et al. (2002) also found the green colorof fruit from backcross populations was lighter thangreen fruit parents. They deduced that green fruit hadincomplete dominance over white fruit or modifier ef-fects. In addition, the fruit color expression of back-cross populations (BCP1 and BCP2) did not fit the
specific ratio for a single gene and the difference be-tween BCP1 and BCP2 (74.2) was close to half theparental difference (86.5), which matched the descrip-tion of Hill et al. (1998): the difference between BCP1and BCP2 should be approximately half the parental dif-ference when epistasis is absent. The RHS score of theF2 population was 5.8 which was close to half of thedifference between F1 and the mid-parent (mean of twoparents) that indicated the dominance effect was present(Hill et al., 1998). The chlorophyll a, chlorophyll b, andtotal chlorophyll concentrations of the F2 populationalso showed continuous changes (data not shown).These results implied the inheritance of fruit color andchlorophyll concentrations were controlled by morethan three genes, that is, the four color-related traits allwere quantitative traits.
Estimation of genetic parametersIn this experiment, the χ2 value of the three parame-
ters model for RHS score showed nonsignificant effects(Table 3) which indicated the inheritance of the RHSscore fitted the simple additive-dominance model andthat epistasis was absent. The RHS score was influ-enced by additive and dominant effects, which weresignificant and highly significant effects, respectively.The results verified the previous conjectures of fruitcolor classification in that fruit color of bitter gourds in-volved additive and dominance factors. For the chloro-phyll concentrations, analysis results indicated non-allelic interactions were present in the three traits. Theanalysis of the six parameters model for chlorophyll bconcentration was significant for additive effect (a) thatindicated additive factors were involved in the expres-sion of chlorophyll b concentration. The estimates ofadditive (a) and additive × additive interaction (aa)were converse which indicated duplicating type epista-sis (Jatothu et al., 2013). The results of the six parame-ters model showed nonsignificant effects for additive(a), dominance (d), and their interactions (aa, ad, dd) inchlorophyll a and total chlorophyll that implied otherinteractions of epistasis effects were present. The valuesof additive effects (a) were relatively larger than domi-nance effects (d) for concentrations of chlorophyll a andtotal chlorophyll that indicated additive effects weremore important on the inheritance of chlorophyll a andtotal chlorophyll concentrations (Table 4). Additive ef-fects of all chlorophyll concentrations were negative,indicating F1 population bias from the parents withlower chlorophyll concentrations (P1). The dominanceeffects (d) of all chlorophyll concentrations of the F1generation were close to the higher chlorophyll concen-tration parent (P2).
Regarding additive × additive effects (aa), positivevalues for three types of chlorophyll concentrationsrepresented the additive × additive effects and weredirected to the better parent (P2). The effects ofdominance × dominance (dd) were negative values for
242 H.-Y. Huang and C.-H. Hsieh
chlorophyll concentrations implying the dominance × dominance effects were close to the parent with thelower value (P1) in this experiment. In all traits, domi-nance (d) and dominance × dominance gene effectsexhibited opposite signs, indicating duplicating typeepistasis (Jatothu et al., 2013). When the epistasis ef-fects were the duplicating type, the mean of F1 wasclose to the mid-parent and the mean of F2 would bedistant from the midparent. The duplicating epistasis in-hibits the heterosis of F1. The concentrations of chloro-phyll a, b, and total chlorophyll on F1, F2 matched thismodel (Hayman, 1958). The magnitudes of the domi-nance and dominance × dominance interactions weresmaller than the additive and additive × additive inter-actions. This means that dominant genes played minorroles in the inheritance of chlorophyll concentrations.
Heritability estimationBroad-sense heritability (h2
B) presents the ratio ofgenetic variance over phenotypic variance in a quantita-tive trait which estimates the contribution of geneticcomponents (Warner, 1952). The heritability estimatesin the broad-sense were higher for chlorophyll b con-centration, but the chlorophyll a, total chlorophyll, andRHS score were low. The trait with high h2
B suggestedthat selection in an early generation may improve thephenotype effectively. Moreover, Warner (1952) re-ported that high heritability in the F2 made effective se-lection on an individual plant basis possible.
In this study, we presented the results of GMA for agenetic model of fruit color traits in the bitter gourd andfound the coloring was controlled by more than threegenes which had dominance and additive effects. Ac-cording to an inheritance model in which dark greenfruit hybrids should be produced by green or dark greenparents. A green fruit hybrid is suggested to cross froma green fruit parent and a green or white fruit parent,while a white fruit hybrid should be a cross of twowhite parents. The expressions of chlorophyll had com-plex interactions, i.e., the fruit color of the bitter gourdwas a quantitative trait. The results of this researchwere different from past findings, and the discrepancieswere verified through GMA, a three parameters model,and a six parameters model, which showed that the ge-netic model of fruit color in the bitter gourd was clearlya quantitative model.
Literature CitedArnon, D. I. 1949. Copper enzymes in isolated chloroplasts poly-
phenoloxidase in Beta vulgaris. Plant Physiol. 24: 1–15.Behera, T. K., H. Tiwari, S. Saha and P. Singhal. 2013. Variation
in chlorophyll and carotenoids content in bitter gourd geno-
types at edible maturity stage. Indian J. Hort. 70: 599–602.Cuevas, H. E., H. Song, J. E. Staub and P. W. Simon. 2010a. In-
heritance of beta-carotene-associated flesh color in cucum-ber (Cucumis sativus L.) fruit. Euphytica 171: 301–311.
Cuevas, H. E., J. E. Staub and P. W. Simon. 2010b. Inheritance ofbeta-carotene-associated mesocarp color and fruit maturityof melon (Cucumis melo L.). Euphytica 173: 129–140.
Dalamu, T. K. B., C. Tara Satyavati and A. Pal. 2012. Generationmean analysis of yield related traits and inheritance of fruitcolour and surface in bitter gourd. Indian J. Hort. 69: 65–69.
Gross, J. 1991. Pigments in Vegetables: Chlorophylls andCarotenoids. Van Nostrand Reinhold Published, NY.
Gusmini, G. and T. Wehner. 2006. Qualitative inheritance of rindpattern and flesh color in watermelon. J. Hered. 97: 177–185.
Hayman, B. I. 1958. The separation of epistatic from additive anddominance variation in generation means. Heredity 12: 371–390.
Hill, J., H. C. Becker and P. M. A. Tigerstedt. 1998. Geneticmodel and their predictive value. p. 17–66. In: Quantitativeand Ecological Aspects of Plant Breeding. Chapman & HallPublisher, London.
Hu, K. L., Q. M. Fu and G. P. Wang. 2002. Study on the heredityof fruit color of Monordica charantia. China Veg. 2002: 11–12 (In Chinese with English abstract).
Jatothu, J. L., K. Singh Dangi, S. Kumar Sagi, H. R. Bhandari,M. K. Tripathi and B. Chaudhary. 2013. Estimation of geneeffects based on joint scaling test and sequential model fitscheme for quantitative traits in sesame (Sesamum indicumL.). J. Agric. Sci. 5: 224–235.
Mahmud, I. and H. H. Kramer. 1951. Segregation for yield,height, and maturity following a soybean cross. Agron. J. 43:605–609.
Paris, H. S. 2000. Quiescent intense (qi): A gene that affectsyoung but not mature fruit color intensity in Cucurbita pepo.J. Hered. 91: 333–339.
Raj, N. M., K. P. Prasanna and K. V. Peter. 1993. Bitter gourdMomordica spp. p. 239–246. In: G. Kalloo and B. O. Bergh(eds.). Genetic improvement of vegetable crops. PergamonPress, Oxford.
Rodriguez, D. B., L. C. Raymundo, T. C. Lee, K. L. Simpson andC. O. Chichester. 1976. Carotenoid pigment changes in rip-ening Momordica charantia fruits. Ann. Bot. 40: 427–430.
Rubatzky, V. E. and M. Yamaguchi. 1997. Bitter gourd. p. 622–624. In: World Vegetables: Principles, Production, andNutritive Values. Springer Science + Business Media,Dordrecht.
Shalaby, T. A. 2013. Mode of gene action, heterosis and inbreed-ing depression for yield and its components in tomato(Solanum lycopersicum L.). Sci. Hortic. 164: 540–543.
Shimotsuma, M. 1963. Cytogenetical studies in the genusCitrullus, VII. Inheritance of several characters in water-melon. Japan J. Breed. 13: 235–240.
Srivastava, V. K. and P. Nath. 1972. Inheritance of some qualita-tive characters in Momordica charantia L. Indian J. Hort.29: 319–321.
Warner, J. N. 1952. A method for estimating heritability. Agron.J. 44: 427–430.
Hort. J. 86 (2): 238–243. 2017. 243