Characterizing Unsaturated Diffusion in Porous Tuff Gravel
14
Reproduced from Vadose Zone Journal. Published by Soil Science Society of America. All copyrights reserved. Characterizing Unsaturated Diffusion in Porous Tuff Gravel Qinhong Hu,* Timothy J. Kneafsey, Jeffery J. Roberts, Liviu Tomutsa, and Joseph S. Y. Wang ABSTRACT latest developments in instrumentation and techniques. Improved understanding of unsaturated diffusion in Evaluation of solute diffusion in unsaturated porous gravel is very gravel will help in the characterization and remediation important for investigations of contaminant transport and remedia- tion, risk assessment, and waste disposal (e.g., the potential high-level effort in gravel deposits at the Hanford Reservation nuclear waste repository at Yucca Mountain, Nevada). For a porous (Washington). It will also help in the invert diffusion aggregate medium such as granular tuff, the total water content is barrier concept for the potential underground high-level comprised of surface water and interior water. The surface water radioactive waste repository at Yucca Mountain, Ne- component (water film around grains and pendular water between vada, where tuff gravel has been considered as an invert the grain contacts) could serve as a predominant diffusion pathway. material (material filling the bottom of a tunnel having a To investigate the extent to which surface water films and contact circular cross-section) to contain radionuclide transport. points affect solute diffusion in unsaturated gravel, we examined the The invert placed between the waste package or drip configuration of water using X-ray computed tomography (CT) in shield and the tuff host rock at Yucca Mountain is an partially saturated gravel and made quantitative measurements of dif- integral component of the repository’s performance. If fusion at multiple water contents using two different techniques. In the first, diffusion coefficients of KCl in 2- to 4-mm granular tuff at effective, an invert diffusion barrier (caused by slow multiple water contents were calculated from electrical conductivity radionuclide diffusion through the invert) can greatly (EC) measurements using the Nernst–Einstein equation. In the sec- enhance waste-isolation capacity. Conca and Wright ond, we used laser ablation with inductively coupled plasma–mass (1992) measured effective diffusion coefficients (D e ) in spectrometry (LA/ICP-MS) to perform microscale mapping, allowing unsaturated soil, gravel, bentonite, and whole rock for the measurement of diffusion coefficients for a mixture of chemical a wide range of volumetric water contents (this free tracers for tuff cubes and tetrahedrons having two contact geometries water content does not include interlayer water in clays (cube–cube and cube–tetrahedron). The X-ray computed tomography or other structural water; Conca and Wright, 2000). images show limited contact between grains, and this could hinder They found that D e values in all media were primarily the pathways for diffusive transport. Experimental results show the a function of volumetric water content and not material critical role of surface water in controlling transport pathways and hence the magnitude of diffusion. Even with a bulk volumetric water characteristics. CRWMS M&O (2000b) reported that content of 1.5%, the measured solute diffusion coefficient is as low this diffusion data set was well correlated in terms of a as 1.5 10 14 m 2 s 1 for tuff gravel. Currently used diffusion models power-dependence (Archie’s Law type) on the volumet- relating diffusion coefficients to total volumetric water content inade- ric water content, and in this study a resultant “univer- quately describe unsaturated diffusion behavior in porous gravel at sal” power function was used to represent diffusive very low water contents. transport of radionuclides through the invert. However, in waste emplacement drifts, characterized by a humid environment with or without the presence of liquid S tudies of flow and transport in gravels have re- water, crushed porous rock may provide unique charac- cently received attention because of the importance teristics that vary greatly from this generic power func- of gravel aquifers, the need to understand contamina- tion (Wang et al., 2001; Hu and Wang, 2003). For exam- tion characterization and remediation of gravel deposits ple, Conca (1990) placed four different size fractions of in the vadose zone, and the use of gravel as capillary bar- tuff gravel samples (2–4, 4–6.3, 6.3–9.5, and 15–25.4 mm) riers for waste isolation. As stated in Tokunaga et al. for equilibrium inside a chamber with a nearly 100% (2003), relatively little information is available on the humidity atmosphere. After equilibrating about 70 d, unsaturated hydraulic properties of gravels; this is also all samples of individual grains were observed to be dry, true for transport processes in unsaturated gravel sys- despite the 2.7% intragranular water content. No EC tems. Conca and coworkers published pioneering work could be measured on these samples, resulting in an examining chemical diffusion behavior in porous grav- inferred diffusion coefficient below 10 15 m 2 s 1 , which els, but this work was conducted more than 10 yr ago is the detection limit reported by Conca (1990) using (Conca, 1990; Conca and Wright, 1990, 1992). With the EC for estimating the diffusion coefficient. The inferred improved understanding of water distribution in gravel, low diffusion value of 10 15 m 2 s 1 at this water content there is a strong need to investigate the diffusion pro- deviates significantly from the “universal” power func- cesses in unsaturated porous gravel by employing the tion with a diffusion coefficient (≈2.8 10 12 m 2 s 1 ), which is obtained with continuous fluid introduction. In other words, at the same water content, diffusion in sam- Q. Hu and J.J. Roberts, 7000 East Ave., MS L-231, Lawrence Liver- more National Laboratory, Livermore, CA 94550; T.J. Kneafsey, L. ples prepared using high humidity (without fluid source Tomutsa, and J.S.Y. Wang, 1 Cyclotron Road, MS 90-1116, Lawrence Berkeley National Laboratory, Berkeley, CA 94720. Received 12 Nov. Abbreviations: CT, computed tomography; EC, electrical conductiv- 2003. Original Research Paper. *Corresponding author ([email protected]). ity; ICP-MS, inductively coupled plasma-mass spectrometry; LA/ICP- MS, laser ablation with inductively coupled plasma-mass spectrome- Published in Vadose Zone Journal 3:1425–1438 (2004). © Soil Science Society of America try; PVC, polyvinyl chloride; RH, relative humidity; RMS, root mean square; TSw, Topopah Spring welded [tuff]. 677 S. Segoe Rd., Madison, WI 53711 USA 1425
Transcript of Characterizing Unsaturated Diffusion in Porous Tuff Gravel

Rep
rodu
ced
from
Vad
ose
Zon
e Jo
urna
l. P
ublis
hed
by S
oil S
cien
ce S
ocie
ty o
f Am
eric
a. A
ll co
pyrig
hts
rese
rved
.
Characterizing Unsaturated Diffusion in Porous Tuff Gravel
Qinhong Hu,* Timothy J. Kneafsey, Jeffery J. Roberts, Liviu Tomutsa, and Joseph S. Y. Wang
ABSTRACT latest developments in instrumentation and techniques.Improved understanding of unsaturated diffusion inEvaluation of solute diffusion in unsaturated porous gravel is verygravel will help in the characterization and remediationimportant for investigations of contaminant transport and remedia-
tion, risk assessment, and waste disposal (e.g., the potential high-level effort in gravel deposits at the Hanford Reservationnuclear waste repository at Yucca Mountain, Nevada). For a porous (Washington). It will also help in the invert diffusionaggregate medium such as granular tuff, the total water content is barrier concept for the potential underground high-levelcomprised of surface water and interior water. The surface water radioactive waste repository at Yucca Mountain, Ne-component (water film around grains and pendular water between vada, where tuff gravel has been considered as an invertthe grain contacts) could serve as a predominant diffusion pathway. material (material filling the bottom of a tunnel having aTo investigate the extent to which surface water films and contact
circular cross-section) to contain radionuclide transport.points affect solute diffusion in unsaturated gravel, we examined theThe invert placed between the waste package or dripconfiguration of water using X-ray computed tomography (CT) in
shield and the tuff host rock at Yucca Mountain is anpartially saturated gravel and made quantitative measurements of dif-integral component of the repository’s performance. Iffusion at multiple water contents using two different techniques. In
the first, diffusion coefficients of KCl in 2- to 4-mm granular tuff at effective, an invert diffusion barrier (caused by slowmultiple water contents were calculated from electrical conductivity radionuclide diffusion through the invert) can greatly(EC) measurements using the Nernst–Einstein equation. In the sec- enhance waste-isolation capacity. Conca and Wrightond, we used laser ablation with inductively coupled plasma–mass (1992) measured effective diffusion coefficients (De) inspectrometry (LA/ICP-MS) to perform microscale mapping, allowing unsaturated soil, gravel, bentonite, and whole rock forthe measurement of diffusion coefficients for a mixture of chemical a wide range of volumetric water contents (this freetracers for tuff cubes and tetrahedrons having two contact geometries
water content does not include interlayer water in clays(cube–cube and cube–tetrahedron). The X-ray computed tomographyor other structural water; Conca and Wright, 2000).images show limited contact between grains, and this could hinderThey found that De values in all media were primarilythe pathways for diffusive transport. Experimental results show thea function of volumetric water content and not materialcritical role of surface water in controlling transport pathways and
hence the magnitude of diffusion. Even with a bulk volumetric water characteristics. CRWMS M&O (2000b) reported thatcontent of 1.5%, the measured solute diffusion coefficient is as low this diffusion data set was well correlated in terms of aas 1.5 � 10�14 m2 s�1 for tuff gravel. Currently used diffusion models power-dependence (Archie’s Law type) on the volumet-relating diffusion coefficients to total volumetric water content inade- ric water content, and in this study a resultant “univer-quately describe unsaturated diffusion behavior in porous gravel at sal” power function was used to represent diffusivevery low water contents. transport of radionuclides through the invert. However,
in waste emplacement drifts, characterized by a humidenvironment with or without the presence of liquid
Studies of flow and transport in gravels have re- water, crushed porous rock may provide unique charac-cently received attention because of the importance teristics that vary greatly from this generic power func-
of gravel aquifers, the need to understand contamina- tion (Wang et al., 2001; Hu and Wang, 2003). For exam-tion characterization and remediation of gravel deposits ple, Conca (1990) placed four different size fractions ofin the vadose zone, and the use of gravel as capillary bar- tuff gravel samples (2–4, 4–6.3, 6.3–9.5, and 15–25.4 mm)riers for waste isolation. As stated in Tokunaga et al. for equilibrium inside a chamber with a nearly 100%(2003), relatively little information is available on the humidity atmosphere. After equilibrating about 70 d,unsaturated hydraulic properties of gravels; this is also all samples of individual grains were observed to be dry,true for transport processes in unsaturated gravel sys- despite the 2.7% intragranular water content. No ECtems. Conca and coworkers published pioneering work could be measured on these samples, resulting in anexamining chemical diffusion behavior in porous grav- inferred diffusion coefficient below 10�15 m2 s�1, whichels, but this work was conducted more than 10 yr ago is the detection limit reported by Conca (1990) using(Conca, 1990; Conca and Wright, 1990, 1992). With the EC for estimating the diffusion coefficient. The inferredimproved understanding of water distribution in gravel, low diffusion value of 10�15 m2 s�1 at this water contentthere is a strong need to investigate the diffusion pro- deviates significantly from the “universal” power func-cesses in unsaturated porous gravel by employing the tion with a diffusion coefficient (≈2.8 � 10�12 m2 s�1),
which is obtained with continuous fluid introduction. Inother words, at the same water content, diffusion in sam-Q. Hu and J.J. Roberts, 7000 East Ave., MS L-231, Lawrence Liver-
more National Laboratory, Livermore, CA 94550; T.J. Kneafsey, L. ples prepared using high humidity (without fluid sourceTomutsa, and J.S.Y. Wang, 1 Cyclotron Road, MS 90-1116, LawrenceBerkeley National Laboratory, Berkeley, CA 94720. Received 12 Nov.
Abbreviations: CT, computed tomography; EC, electrical conductiv-2003. Original Research Paper. *Corresponding author ([email protected]).ity; ICP-MS, inductively coupled plasma-mass spectrometry; LA/ICP-MS, laser ablation with inductively coupled plasma-mass spectrome-Published in Vadose Zone Journal 3:1425–1438 (2004).
© Soil Science Society of America try; PVC, polyvinyl chloride; RH, relative humidity; RMS, root meansquare; TSw, Topopah Spring welded [tuff].677 S. Segoe Rd., Madison, WI 53711 USA
1425

Rep
rodu
ced
from
Vad
ose
Zon
e Jo
urna
l. P
ublis
hed
by S
oil S
cien
ce S
ocie
ty o
f Am
eric
a. A
ll co
pyrig
hts
rese
rved
.
1426 VADOSE ZONE J., VOL. 3, NOVEMBER 2004
sion behavior of single tuff grains with two contact geometriesinside several humid environments. For this single-grain study,we employed a microscale mapping technique that involvedusing LA/ICP-MS.
Tuff block samples from the Topopah Spring welded (TSw)volcanic tuff, the potential repository geologic unit, were col-lected at the underground tunnel at Yucca Mountain, Nevada.For gravel column experiments, tuff samples were crushedand sieved into various-sized fractions. For the microscale map-ping approach, tuff samples were machined into two shapes:cubic (1.50 cm in length) and tetrahedral (1.50 cm on eachside of the triangle and 1.30 cm in height). The external surfaceroughness of these machined samples was measured using ascanning white interferometer (Zygo Newview 200, Zygo Cor-poration, Middlefield, CT). The measured value of the rootFig. 1. Schematic of different components of water present in an ag-mean square (RMS) roughness is 2.2 �m for 714-�m scans.gregate medium and their effects on diffusion. DInterior and DSurface
denote interior and surface diffusion, respectively. (Modified fromConca and Wright, 1992.) X-Ray Computed Tomography Scanning of
Tuff Gravel Systemcontact) is almost three orders of magnitude lower thanin the samples prepared with liquid-water introduction. Computed Tomography scanning provides a direct view of
This diffusion behavior is caused by the water distri- fluid distribution in geological media. Recently, Polak et al.(2002) used an X-ray CT scanner to investigate the diffusionbution exhibited by porous-rock gravel (Fig. 1). Rockof NaI between a fracture and the surrounding matrix undersurfaces in partially saturated environments will gener-a saturated chalk core. Interested readers are referred to theally be wetted by liquid films that can be held either bypaper of Clausnitzer and Hopmans (2000) for an excellentadsorptive forces on mineral surfaces or by capillaryreview of the background and principles of CT with respectforces in surface depressions. For a porous-rock–gravelto its application in flow and transport studies.system, the total water content is comprised of surface We used CT scanning to provide a preliminary evaluation
(intergranular) water (surface film water around grains of our conceptual model about moisture distribution and flowand pendular water between rock grain contacts) and pathways in unsaturated tuff gravel. Using the CT scanner,interior (intragranular) water (water contained within we were able to observe pathways available for diffusive trans-the rock matrix pores). Small pores and the relatively port. A modified medical-based X-ray CT scanner with cross-
sectional resolution of about 0.2 by 0.2 mm (Siemens Somatomlarge porosity of tuff gravel could play an importantHiQ, Siemens, Malvern, PA) was used to monitor moisturerole in retaining water in the internal pores, reducingdistribution in sample holders packed with crushed tuff. Athe surface water content of the gravel to levels wherehigh-accuracy (�12 �m) computer-controlled table was useddiffusion becomes as low as the detection limits of con-for sample positioning (Tomutsa et al., 1992). This positioningventional methods. On the other hand, the interior watertable enabled back-and-forth movement of the sampler holderis not likely to contribute significantly to water flow and during the scanning process. Rapid, accurate, and repeatable
transport in the unsaturated gravel system (Conca and positioning of the sample within the X-ray beam could beWright, 1990; Tokunaga et al., 2003). Pendular water programmed to perform automated series of scans. The sam-elements between gravel grains serve as the bridging ple holder was constructed out of Plexiglas, had a 6.35-cm i.d.,pathways between grains and control the efficiency of 1.27-cm thickness, and was threaded at both ends.
Two different size fractions of tuff gravel (16–25 and 6.3–the system in attaining the upper limit of transport deter-9.5 mm) were used. The tuff gravels were initially oven driedmined by surface films. At low water contents, diffusionat 60�C for 7 d to achieve a constant weight (change betweenin rock gravel could be very slow, because water filmstwo consecutive weighings �0.01%). A drying temperatureon surfaces can be discontinuous or absent. Conca andof 60�C was selected to remove pore water while keepingWright (1992) reported an experimental method to deter-structural water of the samples (Soeder et al., 1991). Aftermine diffusion coefficients (using the Nernst–Einstein packing the sample in the holder, a background set of scans
equation) by using an unsaturated-flow apparatus in was performed for the dry gravel. The sample holder wascombination with EC measurements. However, experi- placed horizontally on the CT positioning table, and cross-mental limitations may exist with this approach, such sectional slices were acquired along the core, using an X-rayas the contact resistance at low water contact and the ap- beam energy of 133 keV with a slice thickness of 1 mm. The
sample and holder were fixed on the table during the experi-plicability of the Nernst–Einstein equation in geologic me-ment, ensuring proper registration of the CT images at pre-dia at very low saturation. To further understand andcisely the same locations. Scans were performed consecutivelyexplore the low diffusion potential in unsaturated po-for a total length of 3 cm at the middle section of the column.rous gravel, we need to refine available testing methodsThe 6.3- to 9.5-mm sample was then saturated by pumpingor develop innovative approaches to measuring diffusion.Nanopure water (Barnstead International, Dubuque, IA) intothe holder. Air escaped through a small hole on the top ofMATERIALS AND METHODS the sample holder. The samples were submerged for a day,and then water was drained from a hole on the bottom side.In this work, we (i) used X-ray CT to examine the flow char-When only about one-third of the bottom section of tuff gravelacteristics and water distribution in a tuff gravel column, (ii)was saturated, another series of scans was performed at theemployed an EC approach to measure the effective diffusion
coefficient of similar gravel columns, and (iii) examined diffu- same locations. The difference between the wet and dry scans

Rep
rodu
ced
from
Vad
ose
Zon
e Jo
urna
l. P
ublis
hed
by S
oil S
cien
ce S
ocie
ty o
f Am
eric
a. A
ll co
pyrig
hts
rese
rved
.
www.vadosezonejournal.org 1427
tuff was somewhat friable, and some grain breakage was ob-served during normal laboratory handling.
The crushed tuff was vacuum saturated in 0.5 g L�1
(6.7 mM) KCl solution. The three compartments of the cellwere filled with crushed tuff at the desired volumetric watercontent, ranging from fully saturated to about 10% saturationfor tuff grains. Tuff was compacted into each of the three cellcompartments, and the sliding endcaps were clamped to-gether, forcing contact between the tuff and electrodes. Theporosity in each compartment was assumed to be equal. Highwater contents were initially used (saturated and initial drain-age), and these were attained by emplacing the saturated tuffin the cell and draining the sample, using a porous ceramicdrain in the cell. Further tuff drainage was accomplished usingan ultracentrifuge (Beckman Model L8-60M/P, BeckmanFig. 2. Electrical conductivity measurement cell.Coulter, Fullerton, CA). To do this, portions of the saturatedtuff were placed in centrifuge cups and drained under specified
at each slice was used to determine the moisture distribution conditions. Following the centrifugation, the tuff was placedwithin the sample. into the cell inside a glove bag maintained at high relative
humidity (RH) by a beaker of warm water. This was to preventDiffusion Measurements by the dryout of the surface layer of water on the tuff grains. Al-
though all work was performed at normal laboratory tempera-Electrical Conductivity Methodtures, to allow for thermal equilibration the filled cell was
Diffusion of radionuclides in unsaturated gravel could occur placed into an incubator maintained at 22�C for several hours(i) through water films (present on the gravel surfaces), (ii) before measuring resistance.through water in the interconnected porosity (present within Resistance measurements were made using a GenRad 1692the gravel grains), or (iii) very slowly on the solid mineral Digibridge LCR meter (QuadTech, Maynard, MA). The LCRsurface. Measuring low diffusion coefficients requires long meter was checked against many resistance measurement sys-duration measurements, the ability to sample on extremely tems and found reliable for the expected conditions. Beforesmall spatial scales, or an indirect approach. Calculating diffu- making measurements, the meter was calibrated and the offsetsion coefficients based on EC measurements is an indirect corrected to zero, according to the manufacturer’s instruc-technique that has been accepted for diffusants in bulk aque- tions. The four electrodes from the cell were connected to theous samples (Conca and Wright, 1992). The Nernst–Einstein four ports of the meter, and resistance (series) was recordedequation relates the EC of a solution to the effective diffusion for the five frequencies generated by the meter (100, 120,coefficient of an ionic diffusant: 1000, 10 000, and 100 000 Hz). For high water contents, mea-
surements were made primarily at 1000 Hz because the qualityDe �
RTF 2
�GtZC
[1] factor (Q) indicated by the meter was low. (Q provides anindication of the phase shift [Q � tan(phase shift)] betweenthe current and voltage measurement.) The Nernst–EinsteinHere, R is the universal gas constant, T is the absolute temper-equation requires the passive resistance (phase shift � 0);ature, F is Faraday’s constant, � is the geometric factor of thethus, the resistance value for the frequency with the lowestexperimental cell, G is the measured conductance, t is theQ was selected for diffusion coefficient calculation. In manytransference number, Z is the valence of the diffusant, and Ccases, alternate electrode configurations were connected to theis the diffusant molar concentration.meter, and the resistance was recorded. Using the electrodeTo use this method for inference of diffusion coefficients,numbers from Fig. 2, we made measurements for some waterwe must account for sources of conductivity in our system. Ourcontents in the 1144, 1122, 2233, 3344, 1234 (four electrode),dry porous tuff was quite resistive, as was our sample holder.1133, and 2244 configurations, where, for example, 1144 indi-Thus, we consider the connected aqueous pathways (films incates that Current was connected to Electrode 1, Potentialparticular) in an unsaturated porous medium as the only elec-to Electrode 1, Potential� to Electrode 4, and Current� totrical current–carrying routes. We can measure a resistanceElectrode 4. Because both positive connections were con-and calculate the diffusion coefficient. This method directlynected to one electrode and both negative connections wereaccounts for the tortuosity of the fluid pathway on the gravelconnected to another electrode, we call this a two-electrodesurface and the diffusion resistance at intergranular contacts.measurement. This allowed for an analysis of two- and four-A cell with four electrodes was constructed to contain tuffelectrode measurement techniques.gravel and isolate the sample from the atmosphere (Fig. 2).
The 6.22-cm-i.d. cell was constructed out of transparent poly-vinyl chloride (PVC) pipe. Nylon endcaps were machined such Diffusion Measurements by thethat two O-rings were placed between each endcap and the Microscale Mapping MethodPVC pipe, and each endcap was fitted with a stainless-steel
Laser ablation refers to the process in which an intense burstelectrode to make contact with the sample across the entireof energy delivered by short laser pulses is used to vaporize across-sectional area of the pipe. Two stainless-steel screen elec-minute sample (in the range of nanograms) from a specifictrodes were placed in the center of the cell approximately 65location of a sample. The chemical composition of the vapor-mm apart. A sealable access port was placed between the twoized sample is then analyzed with inductively coupled plasma–screen electrodes.mass spectrometry (ICP-MS). Laser ablation, coupled withThe crushed tuff used in the measurements was from theICP-MS (LA/ICP-MS), has recently evolved as a powerful ana-2- to 4-mm fraction of tuff sample, with internal porosity andlytical tool for solid sampling (Russo et al., 2000). LA/ICP-MSgrain bulk density of 10.5% and 2.23 g cm�3 respectively. The
grains were shard-like, often with one dimension 4 mm. The can determine simultaneously a large number of chemical ele-
Rep
rodu
ced
from
Vad
ose
Zon
e Jo
urna
l. P
ublis
hed
by S
oil S
cien
ce S
ocie
ty o
f Am
eric
a. A
ll co
pyrig
hts
rese
rved
.
1428 VADOSE ZONE J., VOL. 3, NOVEMBER 2004
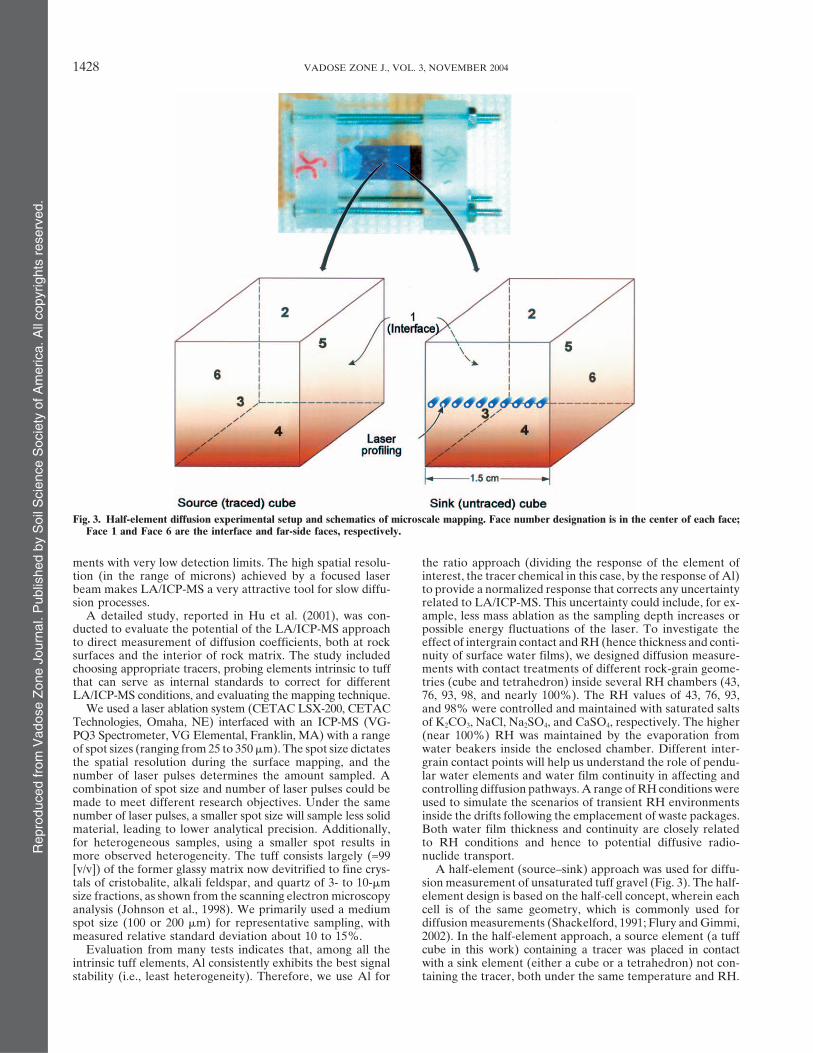
Fig. 3. Half-element diffusion experimental setup and schematics of microscale mapping. Face number designation is in the center of each face;Face 1 and Face 6 are the interface and far-side faces, respectively.
ments with very low detection limits. The high spatial resolu- the ratio approach (dividing the response of the element ofinterest, the tracer chemical in this case, by the response of Al)tion (in the range of microns) achieved by a focused laser
beam makes LA/ICP-MS a very attractive tool for slow diffu- to provide a normalized response that corrects any uncertaintyrelated to LA/ICP-MS. This uncertainty could include, for ex-sion processes.
A detailed study, reported in Hu et al. (2001), was con- ample, less mass ablation as the sampling depth increases orpossible energy fluctuations of the laser. To investigate theducted to evaluate the potential of the LA/ICP-MS approach
to direct measurement of diffusion coefficients, both at rock effect of intergrain contact and RH (hence thickness and conti-nuity of surface water films), we designed diffusion measure-surfaces and the interior of rock matrix. The study included
choosing appropriate tracers, probing elements intrinsic to tuff ments with contact treatments of different rock-grain geome-tries (cube and tetrahedron) inside several RH chambers (43,that can serve as internal standards to correct for different
LA/ICP-MS conditions, and evaluating the mapping technique. 76, 93, 98, and nearly 100%). The RH values of 43, 76, 93,and 98% were controlled and maintained with saturated saltsWe used a laser ablation system (CETAC LSX-200, CETAC
Technologies, Omaha, NE) interfaced with an ICP-MS (VG- of K2CO3, NaCl, Na2SO4, and CaSO4, respectively. The higher(near 100%) RH was maintained by the evaporation fromPQ3 Spectrometer, VG Elemental, Franklin, MA) with a range
of spot sizes (ranging from 25 to 350 �m). The spot size dictates water beakers inside the enclosed chamber. Different inter-grain contact points will help us understand the role of pendu-the spatial resolution during the surface mapping, and the
number of laser pulses determines the amount sampled. A lar water elements and water film continuity in affecting andcontrolling diffusion pathways. A range of RH conditions werecombination of spot size and number of laser pulses could be
made to meet different research objectives. Under the same used to simulate the scenarios of transient RH environmentsinside the drifts following the emplacement of waste packages.number of laser pulses, a smaller spot size will sample less solid
material, leading to lower analytical precision. Additionally, Both water film thickness and continuity are closely relatedto RH conditions and hence to potential diffusive radio-for heterogeneous samples, using a smaller spot results in
more observed heterogeneity. The tuff consists largely (≈99 nuclide transport.A half-element (source–sink) approach was used for diffu-[v/v]) of the former glassy matrix now devitrified to fine crys-
tals of cristobalite, alkali feldspar, and quartz of 3- to 10-�m sion measurement of unsaturated tuff gravel (Fig. 3). The half-element design is based on the half-cell concept, wherein eachsize fractions, as shown from the scanning electron microscopy
analysis (Johnson et al., 1998). We primarily used a medium cell is of the same geometry, which is commonly used fordiffusion measurements (Shackelford, 1991; Flury and Gimmi,spot size (100 or 200 �m) for representative sampling, with
measured relative standard deviation about 10 to 15%. 2002). In the half-element approach, a source element (a tuffcube in this work) containing a tracer was placed in contactEvaluation from many tests indicates that, among all the
intrinsic tuff elements, Al consistently exhibits the best signal with a sink element (either a cube or a tetrahedron) not con-taining the tracer, both under the same temperature and RH.stability (i.e., least heterogeneity). Therefore, we use Al for

Rep
rodu
ced
from
Vad
ose
Zon
e Jo
urna
l. P
ublis
hed
by S
oil S
cien
ce S
ocie
ty o
f Am
eric
a. A
ll co
pyrig
hts
rese
rved
.
www.vadosezonejournal.org 1429
Fig. 4. Cross-sectional computed tomography images of two sizes of tuff gravel packed inside a column with an inner diameter of 6.22 cm: (a)16- to 25-mm tuff gravel; (b) 6.3- to 9.5-mm tuff gravel. Spatial resolution in the viewed plane is approximately 0.2 by 0.2 mm. Voxel depthis 1 mm.
The tracer will then diffuse from the tracer-containing element elements. Tracer distributions on the surface of the sink ele-ment were immediately mapped using LA/ICP-MS. After map-to the other, and its diffusion coefficient is obtained from the
concentration profile at different locations at a certain diffu- ping the sink cubes, a small groove was hand-sawed in themiddle of the top face parallel to the diffusion direction, andsion time.
The source tuff cube was vacuum-saturated with a tracer the cube was cracked open with a hammer and a chisel toexpose the interior. The interior surface was then mapped bymixture solution that contained bromide (Br�) and perrhen-
ate (ReO�4 ). Both species act as nonsorbing tracers, confirmed adjusting the laser focus at each sampling location for the
exposed rough surface. Stable responses were obtained duringfrom our laboratory column transport experiments using crushedtuff. Perrhenate serves as an analog to technetium (Brookins, testing of these tuff elements despite the rough surface (Hu
et al., 2001).1986), which in the form of pertechnetate (99TcO�4 ) is of concern
for the potential repository at Yucca Mountain. Cationic sorbingtracers Cs, Co2, Sr 2, and Sm3, as the counter ions for RESULTS AND DISCUSSIONthe nonsorbing anions in the tracer solution, were chosen toexamine the combined transport from unsaturated diffusion Computed Tomography Imaging of Tuff Graveland retardation; however, this paper is focused on the behavior
Figure 4 shows 12 consecutive 1-mm-thick cross-sec-of nonsorbing tracers.tional images for 16- to 25- and 6.3- to 9.5-mm tuff gravels.The sink element was also vacuum-saturated, but withoutVery little physical contact is observed between thetracers. Source and sink elements were then separately placed
inside a humidity chamber within an incubator maintained at tuff grains for the 16- to 25-mm size fraction. While22�C. Cube weight was periodically monitored until it reached noticeable, limited contact exists for the smaller sizea constant weight. This pre-equilibration, which took 137 d for gravel. The measured bulk density was 0.549 and 0.806the lowest RH (43%), was to ensure similar water potential was g cm�3 for the columns packed with 16- to 25- and 6.3-established between source and sink elements to prevent or to 9.5-mm gravels, respectively. Transport pathways inminimize potential advective transport. The elements were then such gravel systems could be potentially hindered be-placed in a customized sample holder, clamped together, and
cause of the limited number of contact locations be-placed in the RH chamber to start the diffusion test (Fig. 3).tween grains.For the cube–tetrahedron geometry, a cube face was in contact
A series of CT images are shown in Fig. 5a for partiallywith an apex of the tetrahedron, resulting in a point contact be-saturated 6.3- to 9.5-mm gravel. Water pockets (purpletween the elements. After a certain diffusion duration, the
diffusion test was stopped by separating the source and sink color in Fig. 5a) are easily discerned in the scans from

Rep
rodu
ced
from
Vad
ose
Zon
e Jo
urna
l. P
ublis
hed
by S
oil S
cien
ce S
ocie
ty o
f Am
eric
a. A
ll co
pyrig
hts
rese
rved
.
1430 VADOSE ZONE J., VOL. 3, NOVEMBER 2004
Fig. 5. One-millimeter cross-sectional computed tomography images for 6.3- to 9.5-mm tuff gravel (a) under a partially saturated condition and(b) showing water distribution (wet scan–dry scan).
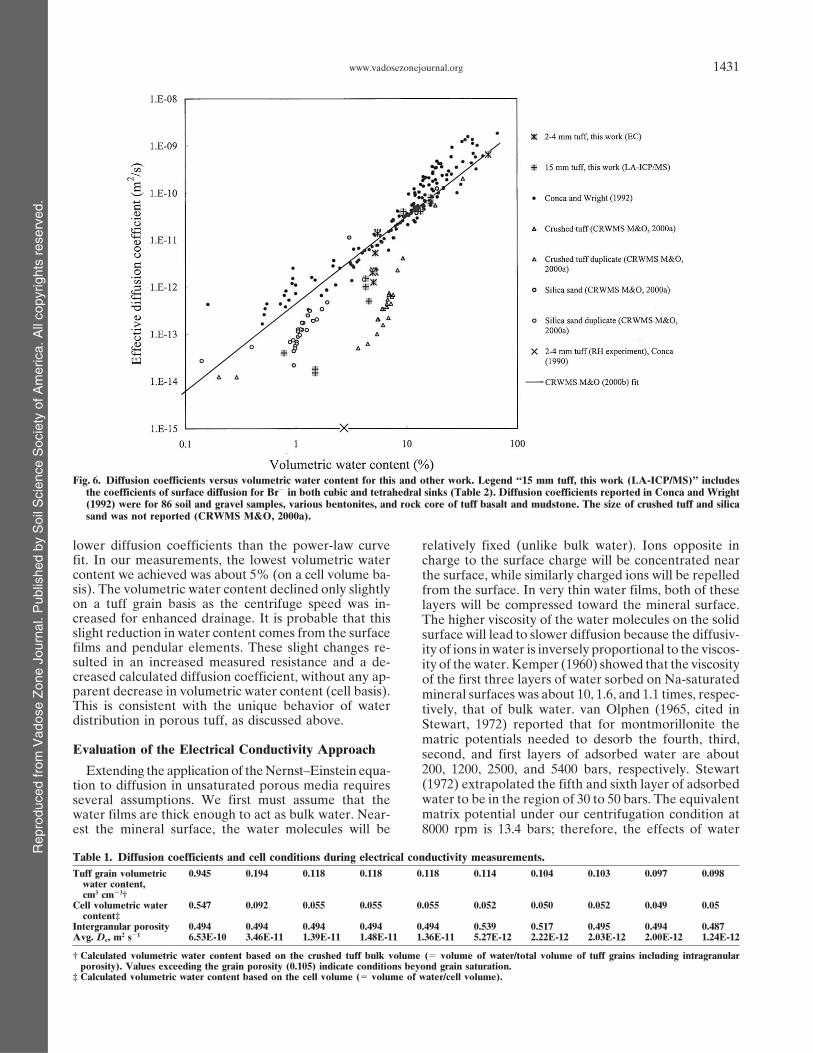
air and tuff grains. Subtraction of a set of dry scans from Einstein equation for volumetric moisture content arethe wet background scans is shown in Fig. 5b to indicate shown in Fig. 6 and Table 1. The five points with volu-the water distribution. In these images, only the differ- metric water content 5.4% were attained by drainageence between the two conditions (dry and wet) is ob- of the initially brine-saturated cell. Lower volumetricserved. Some water is shown in the nonsubmerged top water contents were achieved by centrifuging vacuum-part (Scan 1 of Fig. 5b), and this was probably caused saturated tuff at 1000, 2000, 3000, 4000, and 8000 rpmby the water pooling on the top of the flat grains. Also, in an ultracentrifuge (10–20 min, with a consistent timetuff grains in the top portion are not totally subtracted used for each speed) before placing it in the cell. Theseout, probably because of the slight movement of grain speeds correspond to relative centrifugal forces of 45,position during water introduction and drainage. A 181, 408, 726, and 2903 g. The cell was allowed to equili-slight positioning error is also apparent as the sample brate for several hours in an incubator at 22�C beforeholder outline is slightly visible. Outlines of individual measurement. The tuff surface appeared to become pro-grains may be enhanced similarly. gressively drier as the centrifuge speed increased. Any
handling of the tuff resulted in some breakage. Centrifu-gation at 8000 rpm resulted in a high amount of smallerDiffusion Measurements byparticles being generated (and a higher packing densitythe Electrical Conductivity Methodin the cell), which could result in a higher diffusion co-
Measured Diffusion Coefficients efficient. In a similar study, tuff was also observed todisintegrate, with sharp angular points breaking down,We measured the resistance of partially saturatedat centrifuge speeds larger than 6000 rpm (CRWMScrushed tuff gravel occupying a cell with known dimen-M&O, 2000a).sions. The tuff was conditioned with preset water con-
The calculated diffusion coefficients were comparedtents, and the water contained a known concentrationwith those presented by Conca and Wright (1990) andof KCl. Using the measured resistance and known geom-with the data presented by OCRWM M&O (2000a), alletry, we calculated effective diffusion coefficients De (L2
obtained from EC measurements. At moisture contentsT�1), which incorporates the effect of the geometry of5.5%, our results agree very well with previous mea-the grains and their contacts, and the liquid content ofsurements and the power-law curve fit. However, atthe unsaturated system on diffusion.
The diffusion coefficients calculated using the Nernst– lower moisture contents, our results tend steeply toward
Rep
rodu
ced
from
Vad
ose
Zon
e Jo
urna
l. P
ublis
hed
by S
oil S
cien
ce S
ocie
ty o
f Am
eric
a. A
ll co
pyrig
hts
rese
rved
.
www.vadosezonejournal.org 1431
Fig. 6. Diffusion coefficients versus volumetric water content for this and other work. Legend “15 mm tuff, this work (LA-ICP/MS)” includesthe coefficients of surface diffusion for Br� in both cubic and tetrahedral sinks (Table 2). Diffusion coefficients reported in Conca and Wright(1992) were for 86 soil and gravel samples, various bentonites, and rock core of tuff basalt and mudstone. The size of crushed tuff and silicasand was not reported (CRWMS M&O, 2000a).
lower diffusion coefficients than the power-law curve relatively fixed (unlike bulk water). Ions opposite infit. In our measurements, the lowest volumetric water charge to the surface charge will be concentrated nearcontent we achieved was about 5% (on a cell volume ba- the surface, while similarly charged ions will be repelledsis). The volumetric water content declined only slightly from the surface. In very thin water films, both of theseon a tuff grain basis as the centrifuge speed was in- layers will be compressed toward the mineral surface.creased for enhanced drainage. It is probable that this The higher viscosity of the water molecules on the solidslight reduction in water content comes from the surface surface will lead to slower diffusion because the diffusiv-films and pendular elements. These slight changes re- ity of ions in water is inversely proportional to the viscos-sulted in an increased measured resistance and a de- ity of the water. Kemper (1960) showed that the viscositycreased calculated diffusion coefficient, without any ap- of the first three layers of water sorbed on Na-saturatedparent decrease in volumetric water content (cell basis). mineral surfaces was about 10, 1.6, and 1.1 times, respec-This is consistent with the unique behavior of water tively, that of bulk water. van Olphen (1965, cited indistribution in porous tuff, as discussed above. Stewart, 1972) reported that for montmorillonite the
matric potentials needed to desorb the fourth, third,Evaluation of the Electrical Conductivity Approach second, and first layers of adsorbed water are about
200, 1200, 2500, and 5400 bars, respectively. StewartExtending the application of the Nernst–Einstein equa-(1972) extrapolated the fifth and sixth layer of adsorbedtion to diffusion in unsaturated porous media requireswater to be in the region of 30 to 50 bars. The equivalentseveral assumptions. We first must assume that thematrix potential under our centrifugation condition atwater films are thick enough to act as bulk water. Near-
est the mineral surface, the water molecules will be 8000 rpm is 13.4 bars; therefore, the effects of water
Table 1. Diffusion coefficients and cell conditions during electrical conductivity measurements.Tuff grain volumetric 0.945 0.194 0.118 0.118 0.118 0.114 0.104 0.103 0.097 0.098
water content,cm3 cm�3†
Cell volumetric water 0.547 0.092 0.055 0.055 0.055 0.052 0.050 0.052 0.049 0.05content‡
Intergranular porosity 0.494 0.494 0.494 0.494 0.494 0.539 0.517 0.495 0.494 0.487Avg. De, m2 s�1 6.53E-10 3.46E-11 1.39E-11 1.48E-11 1.36E-11 5.27E-12 2.22E-12 2.03E-12 2.00E-12 1.24E-12
† Calculated volumetric water content based on the crushed tuff bulk volume (� volume of water/total volume of tuff grains including intragranularporosity). Values exceeding the grain porosity (0.105) indicate conditions beyond grain saturation.
‡ Calculated volumetric water content based on the cell volume (� volume of water/cell volume).

Rep
rodu
ced
from
Vad
ose
Zon
e Jo
urna
l. P
ublis
hed
by S
oil S
cien
ce S
ocie
ty o
f Am
eric
a. A
ll co
pyrig
hts
rese
rved
.
1432 VADOSE ZONE J., VOL. 3, NOVEMBER 2004
structure on slow diffusion are not expected to be sig- figurations. For most of our two-electrode measure-nificant. ments, we confirmed that 1000 Hz was the best of the
One important requirement for the use of the Nernst– five frequencies available on the GenRad 1692. For theEinstein equation is that the mode of electrical conduc- four-electrode measurements, however, 100 and 120 Hztion must be known. That is, to use the Nernst–Einstein provided more passive resistances. The geometry of theequation to calculate diffusion coefficients in an aque- measurement cell also affected the phase shift. Values ofous system, there must be an understanding of the con- Q close to zero were obtained across a wider frequencytribution to total electrical conduction from various pos- range (1000–10 000 Hz) for the two electrode measure-sible modes of current conduction. If modes of current ments across the entire cell, whereas for the shorter in-conduction other than through water are present, such tervals, frequencies near 1000 Hz were required.as through mineral lattices, along the dry mineral sur- It is appropriate to ask what effects grain size and in-face, through adsorbed water on the mineral surface, ternal porosity have. The effect of grain size has not beenthrough air in the intragranular pore space, or at the grain– adequately investigated. All of our specimens had nomi-grain connections, the Nernst–Einstein equation may nally the same grain size. Much larger volumes would benot be applicable, or these individual effects may require necessary for larger gravel sizes. With these larger grainquantification. Our system used a hydrophobic, resistive
sizes, it would be difficult to establish the appropriate mois-sample holder, and the resistivity of air, silicate minerals,ture conditions and representatively measure both resis-and tuff glass is high, allowing us to eliminate these cur-tance and physical properties to the accuracy needed. Anrent pathways. Attempts to measure the resistivity ofultracentrifuge might limit preparation to three grainsair-dry tuff failed because of the high resistivity, leavingat a time, and the use of RH chambers would require thebulk water and surface water conduction as the onlyvery slow transfer of large amounts of mass. Under similarconductivity pathways.thermodynamic conditions, smaller grains provide largerOther concerns include electrode design, electrode–surfaces. If we assume that the surface film controls thesample polarization, and contact impedance at the elec-electrical conduction (and thus the diffusivity), smallertrode–sample interfaces. These problems can be mini-grains should provide less diffusive resistance.mized by constructing optimally sized and shaped sample
holders and by performing experiments on samples inwhich electrode spacing is the only variable. We assess
Diffusion Measurements bythe effects of electrode-contact impedance by makingthe Microscale Mapping Methodmeasurements with a four-electrode configuration and
multiple two-electrode configurations. When a four- Evaluation of Testing Techniqueelectrode configuration is used, current is applied across
During our preliminary experiments for measuringthe outer electrodes and potential is measured acrossunsaturated diffusion in a cube–cube configuration in athe inner electrodes. In the wires and electrodes, currentnearly 100% RH environment, the diffusion time usedis carried by electrons. In the water–rock system, current
is carried by ions. This change in charge carrier from was as long as 150 d, based on our sample length (1.5 cm)electronic to ionic occurs at the current electrode–rock and a diffusion coefficient of smaller than 10�15 m2 s�1, asinterface and results in contact impedance. The inner inferred by Conca (1990) from the resistance detectionelectrodes measure only the potential, and since very limit. Our measurements of tracer concentration indi-little current is drawn from the system to make this mea- cate that diffusion coefficients are much higher than thissurement, there is no contact impedance at these elec- inferred value under similar RH conditions.trodes. Calculating the resistance between the potential Figure 7 shows the tracer distribution and comparisonelectrodes can then be accomplished without the influ- for both the source and sink cubes from an experimentence of contact impedance. Using the two-electrode in which two cubes were placed side by side in a nearlyconfiguration, current is applied and potential is mea- 100% RH container for 150 d. In this figure both the xsured at the same two electrodes. Thus, any contact im- and y axes for the all plots have the same scale to facilitatepedance is included in the resistance calculation. This the comparison. Nonsorbing tracers (Br�and ReO�
4 )contact impedance was minimal at high volumetric waterare evidently present across almost the entire sink cubecontents, but increased to as much as 5% of the indi-face (Face 3) perpendicular to the interface face (in thecated resistance in the drier measurements. However,direction of surface diffusion) after a diffusion time ofthe effect of surface water connectivity on diffusion is150 d. The distribution of diffusive tracers is corrobo-so predominant that such refinement yields resultsrated from the results on the far-side face of the sink(shown in Fig. 6) similar to those done by others incube, where both Br�and ReO�
4 are detected. As ex-which a two-electrode design is used.pected, the tracer distributions on the far-side face ofAn additional concern with electrode-sample contactthe source cube are more uniform and at much higheris that for the Nernst–Einstein equation to apply, a pas-(about 10 times) concentrations than the sink cube. Fur-sive resistance (near-zero phase angle) was required.thermore, the interface faces have similar tracer concen-As the sample water content changed, the frequencytration distributions for both the source and sink cubes,providing the most passive resistance (smallest phaseindicating good contact and diffusive mass transfer be-angle) also changed. Conca and Wright (1992) used a
fixed impedance of 1000 Hz for their two-electrode con- tween cubes.

Rep
rodu
ced
from
Vad
ose
Zon
e Jo
urna
l. P
ublis
hed
by S
oil S
cien
ce S
ocie
ty o
f Am
eric
a. A
ll co
pyrig
hts
rese
rved
.
www.vadosezonejournal.org 1433
Fig. 7. Tracer distributions from surface mapping using LA/ICP-MS (100-�m spot size and 10 laser pulses) for cube–cube configuration afterdiffusion inside nearly 100% RH chamber after 149.7 d. y axis: intensity ratio (dimensionless) denotes the signal of each tracer (solid circle:bromide; solid square: perrhenate) divided by the signal of aluminum.
Measured Diffusion Coefficients CC0
�12
erfcx
2√Det[2]
An appropriately short diffusion time was then selectedfor different experimental setups, with longer time for where C (M L�3) is the observed concentration at loca-lower RH tests (Table 2). Figure 8a shows the mapped tion x based on an initial concentration C0 (M L�3), xtracer distribution for cube–cube configuration exposed (L) is the distance from the interface boundary into theto a 98% RH environment, which exhibits a typical dif- sink element, and t (T) is the diffusion time.fusion profile across the interface (x � 0 cm). Intensity Figure 9 shows examples of curve-fitting of the ob-of tracer response is plotted in log scale on the y axis,
tained tracer concentration profiles, with Fig. 9a pre-contrary to the typical diffusion profile in arithmeticsenting a sensitivity analysis of varying De. The fittedscale reported by others, because of the high sensitivitydiffusion coefficients for different half-element configu-of ICP-MS. It appears that the diffusion front reachesration and RH environments are listed in Table 2. Theabout 1 and 0.1 cm for both tracers in the 98% RHdiffusion of Br� is relatively faster than ReO�
4 , as ex-and 43% RH tests, respectively. After this distance, thepected from its larger aqueous diffusion coefficient (D0):signals essentially show the background response. The2.08 � 10�9 m2 s�1 for Br� and 1.46 � 10�9 m2 s�1 forbackground response for Br� is higher than that forReO�
4 (Lide, 2000). The ratio of measured De for Br�ReO�
4 because of its lower sensitivity by ICP-MS analy-to ReO�
4 is also presented in Table 2, with an averagesis. Nevertheless, we obtained a diffusion profile withof 1.81 and a standard deviation of 0.65 for our 11a signal spanning more than two orders of magnitudemeasurements, compared with the D0 ratio of 1.42. Thefor Br�, compared with three orders for ReO�
4 , to pro-averaged ratio for seven surface diffusion measure-vide us with a high-resolution value of the diffusionments (DBr�/DReO�
4) is 1.59 with a standard deviation ofcoefficient obtained from the profile.
In the half-element configuration and for an infinite 0.38. The similarity between the ratios from tuff andaqueous solution confirms that diffusion is the predomi-system in which the concentration profile does not reachnant, and likely the only, mode of transport in our exper-the ends of the element, the analytical solution to theimental systems, as we intended to achieve. For cube sinks,transient diffusion equation (Fick’s second law) is as
follows (Crank, 1975; Flury and Gimmi, 2002): a boundary zone of a few millimeters appears to exist

Rep
rodu
ced
from
Vad
ose
Zon
e Jo
urna
l. P
ublis
hed
by S
oil S
cien
ce S
ocie
ty o
f Am
eric
a. A
ll co
pyrig
hts
rese
rved
.
1434 VADOSE ZONE J., VOL. 3, NOVEMBER 2004
Table 2. Experimental conditions and measured diffusion coefficients.
EffectiveHalf-element Relative Bulk liquid Sampling diffusionconfiguration humidity saturation† Exp. time locations Tracer coefficient DBr /DPerrherate
% d m2 s�1
Cube–cube 98 88.76 0.79 Surface Bromide 8.0E-11 1.60Perrherate 5.0E-11
Interior Bromide 6.0E-11 1.50Perrherate 4.0E-11
Cube–tetrahedron 98 71.65 1.14 Surface Bromide 4.0E-11 1.14Perrherate 3.5E-11
Cube–cube 93 50.15 16.17 Surface Bromide 4.0E-11 2.00Perrherate 2.0E-11
Interior Bromide 4.0E-11 3.33Perrherate 1.2E-11
Cube–cube 76 22.93 16.24 Surface Bromide 1.5E-12 1.88Perrherate 8.0E-13
Interior Bromide 1.0E-12 2.50Perrherate 4.0E-13
Cube–tetrahedron 76 24.47 27.24 Surface Bromide 5.0E-13 1.25Perrherate 4.0E-13
Cube–cube 43 7.99 16.28 Surface Bromide 1.5E-14 1.25Perrherate 1.2E-14
Interior Bromide 1.8E-14 1.50Perrherate 1.2E-14
Cube–tetrahedron 43 4.20 27.32 Surface Bromide 4.0E-14 2.00Perrherate 2.0E-14
† The value is the bulk liquid saturation for the sink element, and the measured porosity is 0.0827 � 0.0036 for eight tuff cubes.
(Fig. 9a) with a lower concentration (higher diffusion)than the overall pattern. This might be related to theboundary condition of the half-element configurationwherein diffusion is not one-dimensional. We do not seesuch an edge effect for the cube–tetrahedron contact, asthe fitted diffusion curve based on the one-dimensionalEq. [2] captures all data very well for the tetrahedralsink sample (Fig. 9b).
Using multiple RH to establish moisture content pro-vides us with multiple water saturations and a relevantscenario to the waste package emplacement drifts. Thebulk liquid saturation, and hence volumetric water con-tent, is closely related to the RH environment. As theRH decreases, the diffusion coefficient decreases dra-matically (Table 2). At water contents about 10%, themeasured data start to deviate from the “universal”power-law fit for diffusion as a function of water con-tent. The deviation is more pronounced at the lowerRH treatments, although the bulk water contents arestill high (Fig. 6). The two approaches, EC and micro-scale mapping, give overlapping diffusion coefficients.The advantage of the EC method is that it provides arelatively fast measurement of diffusion as a functionof water content. The microscale mapping approach com-plements with the EC technique in obtaining a diffusionvalue as low as 10�14 m2 s�1 under lower water contents.
Hu and Wang (2003) reviewed the behavior of, andrelationship between, nonsorbing diffusants and watercontent, particularly for porous aggregates (rock gravel).Diffusion is monotonically related to water content, butthe relationship is not simple and depends on the rangeof water content (in other words, different forms of re-
Fig. 8. Tracer distributions (200-�m spot size and 20 laser pulses) on lationships at different water-content ranges). The rela-the surface of Face 3 for both source (filled symbols) and sink tionship is also related to the texture and characteristics(open symbols) cubes inside (a) 98% RH chamber after 0.79 d and (such as surface wettability) of the geologic medium. It(b) 43% RH chamber after 16.3 d. x axis: 0 indicates the interface,
is evident that the water content at which deviation oc-and increasing positive number indicates increasing distance fromthe interface in the sink cube. curs is different among the tuffs and silica sand (Fig. 6),

Rep
rodu
ced
from
Vad
ose
Zon
e Jo
urna
l. P
ublis
hed
by S
oil S
cien
ce S
ocie
ty o
f Am
eric
a. A
ll co
pyrig
hts
rese
rved
.
www.vadosezonejournal.org 1435
of 0.3 �m, to measure a range of water film thicknessfor glass, natural rock, and gravel samples. Tokunagaand Wan (1997) reported that an average surface filmthickness for a Bishop Tuff fracture surface with a rough-ness of about 50 �m ranged from 2 to 70 �m at matrixpotential greater (i.e., more positive) than about �250Pa (with corresponding RH 99.999%, according tothe Kelvin equation). The average film thickness on aroughened glass (surface roughness ≈9 �m) was be-tween 1.0 and 2.3 �m (Tokunaga et al., 2000). This wasmeasured under matric potentials of �20 and �1.2 kPa,which correspond to RH exceeding 99.9%. With gravelsamples from Hanford, Washington, Tokunaga et al.(2003) reported average film thicknesses of 7 to 10 �m atnear-zero (�0.05 to �0.10kPa) matric potentials. Underdrier conditions, they expect that the smooth surfaces ofnatural Hanford gravels cannot support thick (2 �m)water films for fast advective flow, and chemical trans-port will be diffusion-limited. Our diffusion experimentswere conducted at drier conditions than reported above.
The effects of RH conditions and sample wettability(hydrophobicity) are very critical for surface film thick-ness and connectivity. Using an ellipsometric technique,Gee et al. (1990) determined the equilibrium water filmthickness on quartz as a function of relative vapor pres-sure. (The natural crystalline quartz plates used werepolished with a RMS surface roughness of 10 A.) Theyalso evaluated the effect of wettability of film thicknessby dehydroxylating the quartz samples from heating treat-ments. Some of their results are reproduced here in Fig.10. It is not until the system nears saturation (RH
Fig. 9. Relative Br� concentrations in the sink elements from 98% 90%) that the film thickness undergoes a sharp increaseRH experiments. Lines are the fitted analytical diffusion solutions indicative of the formation of multilayers of water on(Eq. [1]) with the effective diffusion coefficients shown in the
the quartz surface (Fig. 10a). In contrast, the magnitudelegend.of the film thickness on heat-treated quartz is muchlower (Fig. 10b). Another feature of the dehydroxylatedwhich is probably related to the sample size used andquartz is that film thickness does not increase monotoni-the difference in porosity and surface wettability. Atcally with RH, but seems to fluctuate and displays asome low water content, the diffusion pathways becomedistinct step at RH of 80%. The films are metastabledisconnected, and diffusion effectively stops. Using con-at small film thickness (Gee et al., 1990).tinuum percolation theory, Hunt and Ewing (2003) in-
We are not aware of any reports on contact angle mea-terpreted the phenomenon of vanishing solute diffusionsurement for tuff samples at Yucca Mountain, but theat threshold water content in porous media.tuff is water wetting because water drops immediatelyspread over the tuff surface. Our measured diffusion co-
Surface Diffusion efficients seems to decrease significantly at RH �93%(Table 2), similar to the deflection point of surface waterIn our investigations, we used 10 or 20 laser pulses tofilm at 90% RH observed for the fully water-wettingmap tracer concentration distributions at different loca-quartz (Gee et al., 1990). In a lower RH environment,tions. Multiple measurements using a polished tuff sam-the diffusion coefficient becomes even smaller; the val-ple with a RMS surface roughness of 0.28 to 0.35 �mues are more than three orders of magnitude smaller at(from four 714-�m-long scans) indicated a single laser43% RH than at 98% RH. This is likely related topulse creates a crater with a depth of about 0.83 �m.the effect of surface film thickness on the magnitudeTwenty laser pulses, having a corresponding samplingof diffusion.depth of about 16 �m, were used for the tracer mapping
Furthermore, it seems that the decreasing surface dif-on the gravel surface from which the diffusion coef-fusion from the less extensive surface water films isficients was obtained in Table 2. The unpolished tuffmore critical than the extent of contact point. Surfaceelements used in the diffusion tests have a measureddiffusion values for both cube–cube and cube–tetra-surface roughness about 2.2 �m, which indicates thehedron contact at several RH conditions are presentedtopographic constraint on water film thickness (Toku-in Table 2. In high RH environments (76%), the sur-naga et al., 2003).face diffusion on the cube–cube face contact is slightlyTokunaga and coworkers used a synchrotron X-ray
fluorescence technique, which has a quantification limit greater than that on the cube–tetrahedron point contact.

Rep
rodu
ced
from
Vad
ose
Zon
e Jo
urna
l. P
ublis
hed
by S
oil S
cien
ce S
ocie
ty o
f Am
eric
a. A
ll co
pyrig
hts
rese
rved
.
1436 VADOSE ZONE J., VOL. 3, NOVEMBER 2004
the importance of a connected water film on resistivityand diffusion at this range of low water content. Region2 is comprised of pendular rings at grain contacts andpore-throat constrictions. The transition from Region 2to Region 3, which might correspond to RH 93% inthis study, is less abrupt and indicates a gradual displace-ment of air in the pore space.
Interior Diffusion
The interior diffusion could be composed of pore waterdiffusion (diffusion in relatively large, interconnectedwater-filled pores and microcracks), grain-boundary dif-fusion (aqueous diffusion through relatively small porespaces such as grain boundaries), or intracrystalline dif-fusion in minerals. Grain boundaries usually containthin water films on their surfaces, and diffusion throughthin intragranular water films in well-consolidated rocksis often much slower than pore water diffusion becausethe structure of the thin water film may be more con-strained from interaction with solids than “free” waterin pores. From compiled literature data for many typesof rock, Nakashima (1995) reported that grain-boundarydiffusivity is �10�15 m2 s�1, and the ratio of pore water tograin-boundary diffusion is on the order of 100 to 1000.However, Kozaki et al. (2001) reported that grain-boundary diffusion was the predominant diffusion pro-cess, even for anions like chloride, in saturated montmo-rillonite. Intracrystalline diffusion will be even slowerbecause of the extremely constricted diffusion throughnarrow channels within the crystal structure. For exam-ple, Rundberg (1987) estimated, from kinetic sorption
Fig. 10. Adsorption isotherm of water on (a) fully hydroxylated quartzdata, that intracrystalline diffusion coefficients in par-with contact angle � 0� (modified from Gee et al., 1990, Fig.tially welded devitrified tuff from the Prow Pass unit at1) and (b) heat-dehydroxylated quartz with contact angle � 43�
(modified from Gee et al., 1990, Fig. 2). Yucca Mountain ranged from 1.1 � 10�19 to 6.7 � 10�17
m2 s�1 for Cs, Sr, and Ba.Some insights can be obtained from this study, sinceThe interior diffusion is probably controlled by the pore
tracer concentrations for both the surface and interiorwater type, but diffusion needs to undergo tortuousof the tuff are available for cube sinks. At high RH en-pathways inside the tuff. At a lower RH of 43%, surfacevironments (76%), the surface diffusion on the tuffdiffusion on the tetrahedron is somewhat greater thanconsistently is slightly greater than interior diffusion.that on the cube surface and interior, possibly due toThe interior diffusion is probably controlled by the poreadditional water at the cube–tetradedron point contactwater type, but diffusion needs to undergo tortuousfrom the capillary forces.pathways inside the tuff. At lower RH environments,Other resistivity measurements in the unsaturated tuffthere is little difference in the measured diffusion coeffi-of Yucca Mountain lend evidence of water configurationcients between the surface and interior because of theat different saturations and its role in controlling flowreduced surface diffusion due to less-extensive surfacepathways. Roberts and Lin (1997) reported water exist-films. For the interior diffusion, we speculate that theing in three configurations as a function of water satura-transition from pore water diffusion to the grain-bound-tion. These configurations are adsorbed water on solidary diffusion occurs at these lower RHs. It is likely thatsurfaces (Region 1, from completely dry to ≈15% satura-the diffusion at 43% RH is predominantly influencedtion), isolated pockets of water (Region 2, in the satura-by the grain-boundary water.tion range of ≈15 to 35%), and continuous (bulk) water
The use of tracers with different molecular sizes helps(Region 3, from ≈35 to 100% saturation). Region 1 hasthe steepest drop in resistivity as saturation increases, us evaluate the steric hindrance effect on diffusion within
narrow pores. This pore-size restriction effect is not evi-and conduction is assumed to be primarily through lay-ers of adsorbed water. We expect that this region corre- dent among Br� and ReO�
4 , with ReO�4 being a larger
molecule. In saturated rock beaker diffusion tests mea-sponds to the threshold water content to support solutediffusion. From the measured porosity and surface area/ suring tracer concentration change in tuff cavity (beaker),
Triay et al. (1997) suspected this exclusion effect forvolume reported in Roberts and Lin (1997), we calculatethat the average water-film thickness is about 115 A at TcO�
4 . Instead of monitoring the concentration changein the liquid reservoir as in conventional diffusion tests,the water saturation of 15%. This calculation supports

Rep
rodu
ced
from
Vad
ose
Zon
e Jo
urna
l. P
ublis
hed
by S
oil S
cien
ce S
ocie
ty o
f Am
eric
a. A
ll co
pyrig
hts
rese
rved
.
www.vadosezonejournal.org 1437
we directly measured the concentration of two diffusiv- gravel at water contents below about 9%. The distribu-tion of water in gravel (containing both surface andity tracers in rock samples to examine the potential
exclusion effect. A significant steric hindrance effect is interior water) is analogous to that of a fracture–matrixwater system, and a dual-continuum approach could beexpected when pore diameter is less than 10 times the
molecular diameter (Grathwohl, 1998). Using mercury used to model the diffusion behavior. Considering theimportance and recent recognition of gravel in wasteporosimetry, Roberts and Lin (1997) reported that the
average matrix pore diameters (weighted by increments management and environmental remediation, such adual-diffusivity model approach is necessary.of pore space filled) for welded and densely welded
Topopah Spring tuff samples at Yucca Mountain areACKNOWLEDGMENTS53.1 and 19.7 to 21.4 nm, respectively. From the weight-
gain measurements on core saturation of densely welded This work was supported by the Director, Office of CivilianTSw samples inside controlled RH chambers, we found Radioactive Waste Management, U.S. Department of Energy,that about 10% of tuff pores were smaller than 10 nm. through Memorandum Purchase Order EA9013MC5X be-The effective ionic diameters for Br�, ClO�
4 , and TcO�4 tween Bechtel SAIC Company, LLC, the Ernest Orlando
Lawrence Berkeley National Laboratory (LBNL), and Law-are 0.390, 0.472, and 0.480 nm, respectively (Neck andrence Livermore National Laboratory (LLNL). The supportKanellakopulos, 1987). Given its similar structure, theis provided to LBNL through the U.S. Department of Energydiameter of ReO�
4 is probably similar to ClO�4 and
Contract DE-AC03-76SF00098, and to Lawrence LivermoreTcO�4 . Based on the above information, the pore-size
National Laboratory under Contract W-7405-Eng-48. We greatlyrestriction in the tuff matrix is not expected to have aappreciate the help from Andrew Mei for rock machining,significant impact on the diffusive processes for these Ingrid Zubieta for laboratory assistance, Xiang-Lei Mao and
tracers, as confirmed by experimental results. Jhanis Gonzalez of LBNL for their insightful discussions andoperation related to LA/ICP-MS, and Steven Carlson of LLNLfor helpful discussions about electrical conductivity. The au-CONCLUSIONS thors also thank Christopher Campbell and Daniel Hawkesof LBNL for many helpful comments. The authors greatly ap-In this work, innovative and complementary ap-preciate numerous suggestions from James Conca and anotherproaches are employed to investigate and characterizeanonymous reviewer that helped improve the quality and pre-the unsaturated diffusion processes in porous gravel.sentation of this work.At unsaturated conditions, aqueous diffusion occurs in
liquid films on the gravel surfaces, and the diffusion will REFERENCESbe very slow if the water film is thin and discontinuous.
Brookins, D.G. 1986. Rhenium as analog for fissiogenic technetium:Diffusion in unsaturated gravel is not solely dependentEh-pH diagram (25�C, 1 bar) constraints. Appl. Geol. 1:513–517.on the magnitude of water content; rather it is more Civilian Radioactive Waste Management System Management and
closely related to the thickness, mobility, and continuity Operating Contractor (CRWMS M&O). 2000a. The determinationof diffusion coefficient of invert materials. TDR-EBS-MD-000002of the surface water. Within porous rock gravel, appre-REV 00. CRWMS M&O, Las Vegas, NV.ciable water can exist as a surface film around the grain
Civilian Radioactive Waste Management System Management andwithout significantly contributing to overall diffusionOperating Contractor (CRWMS M&O). 2000b. Invert diffusion
because this water is structurally constrained. properties model. ANL-EBS-MD-000031 REV 01. CRWMS M&O,At Yucca Mountain, unsaturated porous tuff gravel Las Vegas, NV.
Clausnitzer, V., and J.W. Hopmans. 2000. Pore-scale measurementscould serve as a diffusion and transport barrier becauseof solute breakthrough using microfocus X-ray computed tomogra-of its water-distribution characteristics. While RH is low,phy. Water Resour. Res. 36:2067–2079.such as following heating phase from radionuclide de- Conca, J.L. 1990. Diffusion barrier transport properties of unsaturated
cay, surface water films are expected to be thin, discon- Paintbrush tuff rubble backfill. p. 394–401. In Proceedings of the FirstInternational High-Level Radioactive Waste Management Confer-tinuous, or completely removed. Diffusive transport ofence. ASCE and American Nuclear Society, Las Vegas, NV.radionuclides in such systems will be greatly reduced.
Conca, J.L., and J. Wright. 1990. Diffusion coefficients in gravel underAdditionally, the thermal history of a mineral affectsunsaturated conditions. Water Resour. Res. 26:1055–1066.
its wettability, as quartz samples that have been heat to Conca, J.L., and J. Wright. 1992. Diffusion and flow in gravel, soil,a temperature of 1050�C are more hydrophobic than and whole rock. Appl. Hydrogeol. 1:5–24.
Conca, J.L., and J. Wright. 2000. Aqueous diffusion in the vadosesamples that are not heat-treated (Gee et al., 1990).zone. p. 796–797. In B.B. Looney and R.W. Falta (ed.) Vadose zoneThis thermal effect could impact diffusion through ascience and technology solutions. Battelle Press, Columbus, OH.gravel invert. However, porous tuff gravel can hold a Crank, J. 1975. The mathematics of diffusion. 2nd ed. Oxford Univer-
considerable amount of water within grains because of sity Press, New York.Flury, M., and T.F. Gimmi. 2002. Solute diffusion. p. 1323–1351. Inits large capillary force. It can imbibe liquid from seep-
J.H. Dane and G.C. Topp (ed.) Methods of soil analysis. Part 4.age or breached waste packages to minimize drainageSSSA Book Ser. 5. SSSA, Madison, WI.of radionuclides through the invert gravel. This unique
Gee, M.L., T.W. Healy, and L.R. White. 1990. Hydrophobicity effectsbehavior of porous gravel can be harnessed to maximize in the condensation of water films on quartz. J. Colloid Interfacethe performance of the potential repository. Sci. 140:450–465.
Grathwohl, P. 1998. Diffusion in natural porous media: ContaminantCurrently used diffusion models relating diffusion co-transport, sorption/desorption and dissolution kinetics. Kluwerefficients to total volumetric water content inadequatelyAcademic Publishers, Boston, MA.describe the bimodal diffusion behavior in porous gravel Hu, Q., T. Kneafsey, J.S.Y. Wang, J.J. Roberts, and S. Carlson. 2001.
at low water contents. The “universal” curve does not cap- Summary report on Phase 1 feasibility study of in-drift diffusion.LBNL-49063. Lawrence Berkeley Natl. Lab., Berkeley, CA.ture the unique characteristics of water distribution for

Rep
rodu
ced
from
Vad
ose
Zon
e Jo
urna
l. P
ublis
hed
by S
oil S
cien
ce S
ocie
ty o
f Am
eric
a. A
ll co
pyrig
hts
rese
rved
.
1438 VADOSE ZONE J., VOL. 3, NOVEMBER 2004
Hu, Q., and J.S.Y. Wang. 2003. Aqueous-phase diffusion in unsatu- chemistry: Instrumentation and applications. John Wiley and Sons,New York.rated geological media: A review. Crit. Rev. Environ. Sci. Tech-
nol. 33:275–297. Shackelford, C. 1991. Laboratory diffusion testing for waste disposal—A review. J. Contam. Hydrol. 7:177–217.Hunt, A.G., and R.P. Ewing. 2003. On the vanishing of solute diffusion
in porous media at a threshold moisture content. Soil Sci. Soc. Am. Soeder, D.J., L.E. Flint, and A.L. Flint. 1991. Effects of sample han-dling and measurement methodology on the determination of po-J. 67:1701–1702.
Johnson, J.W., K.G. Knauss, W.E. Glassley, L.D. DeLoach, and rosity in volcanic rock samples, Agron. Abst. 232. In AgronomyAbstracts. ASA, CSSA, and SSSA, Madison, WI.A.F.B. Thompson. 1998. Reactive transport modeling of plug-flow
reactor experiments: Quartz and tuff dissolution at 240�C. J. Hy- Stewart, G.L. 1972. Clay water interactions, the behavior of 3H and2H in adsorbed water and the isotope effect. Soil Sci. Soc. Am.drol. (Amsterdam) 209:81–111.
Kemper, W.D. 1960. Water and ion movement in thin films as influ- Proc. 36:421–426.Tokunaga, T.K., and J. Wan. 1997. Water film flow along fractureenced by the electrostatic charge and diffuse layer of cations associ-
ated with clay mineral surfaces. Soil Sci. Soc. Am. Proc. 24:10–16. surfaces of porous rock. Water Resour. Res. 33:1287–1295.Tokunaga, T.K., J. Wan, and S.R. Sutton. 2000. Transient film flowKozaki, T., K. Inada, S. Sato, and H. Ohashi. 2001. Diffusion mecha-
nism of chloride ions in sodium montmorillonite. J. Contam. Hy- on rough fracture surfaces. Water Resour. Res. 36(7):1737–1746.Tokunaga, T.K., K.R. Olson, and J. Wan. 2003. Moisture characteris-drol. 47:159–170.
Lide, D.R. (ed.) 2000. CRC handbook of chemistry and physics. 81st tics of Hanford gravels: Bulk, grain-surface, and intragranular com-ponents. Available at www.vadosezonejournal.org. Vadose Zoneed. CRC Press, Boca Raton, FL.
Nakashima, S. 1995. Diffusivity of ions in pore water as a quantitative J. 2:322–329.Tomutsa, L., D. Doughty, A. Brinkmeyer, and S. Mahmood. 1992.basis for rock deformation rate estimates. Tectonophysics 245(3–4):
185–203. Imaging techniques applied to the study of fluids in porous media.NIPER-582. Natl. Inst. for Petroleum and Energy Research, Bar-Neck, V., and B. Kanellakopulos. 1987. Partial molar volume and
effective ionic radius of the TcO�4 ion in aqueous solution. Ra- tlesville, OK.
Triay, I.R., A. Meijer, J.L. Conca, K.S. Kung, R.S. Rundberg, B.A.diochim. Acta 42:135–137.Polak, A., R. Nativ, and R. Wallach. 2002. Matrix diffusion in northern Strietelmeier, and C.D. Tait. 1997. Summary and synthesis report
on radionuclide retardation for the Yucca Mountain Site Character-Negev fractured chalk and its correlation to porosity. Water Re-sour. Res. 268:203–213. ization Project. Milestone 3784M. Los Alamos National Labora-
tory, Los Alamos, NM.Roberts, J.R., and W. Lin. 1997. Electrical properties of partiallysaturated Topopah Spring tuff: Water distribution as a function of van Olphen, H. 1965. Interactions in the clay–water system, physical
principles and applications. p. 253–256. In Proc. Humidity Moisturesaturation. Water Resour. Res. 33:577–587.Rundberg, R.S. 1987. Assessment report on the kinetics of radio- Papers Int. Symp., Washington, DC. 1963.
Wang, J.S.Y., E.L. Hardin, and L.D. Rickertsen. 2001. Crushed tuffnuclide adsorption on Yucca Mountain tuff. LA-11026-MS. Los Ala-mos Natl. Lab., Los Alamos, NM. as an invert diffusion barrier to enhance waste-isolation capacity.
In Proc. of the 9th International High-Level Radioactive WasteRusso, R.E., X.L. Mao, O.V. Borisov, and H.C. Liu. 2000. Laserablation in atomic spectroscopy. In Encyclopedia of analytical Management Conference, Las Vegas, NV.