Characterizing Power-up and Power-down Transients Using ...
8
Characterizing Power-up and Power-down Transients Using the Model DMM7510 7½-Digit Graphical Sampling Multimeter –– APPLICATION NOTE
Transcript of Characterizing Power-up and Power-down Transients Using ...

Characterizing Power-up and Power-down Transients Using the Model DMM7510 7½-Digit Graphical Sampling Multimeter––APPLICATION NOTE
Characterizing Power-up and Power-down Transients Using the Model DMM7510 7½-Digit Graphical Sampling Multimeter
Introduction
Most electronic systems contain analog circuits, microprocessors, DSPs, ASICs, and/or FPGAs, which require multiple supply voltages. In order to ensure reliable and repeatable operation of these systems, transient behaviors such as the power-up and power-down timing, ramp rates, and the magnitude of different supply voltages need to be appropriately controlled. Voltage and current sizing, monitoring, sequencing, and tracking are essential in characterizing the transient performance of power supplies.
Digital multimeter (DMM) is a very common instrument used to evaluate many specifications of power supplies. However, traditional DMMs often lack the ability to measure dynamic events such as power-up and power-down transients. The new Keithley Model DMM7510 7½-Digit Graphical Sampling Multimeter has a secondary 18-bit sampling A-to-D converter dedicated to digitizing rapidly changing voltage and current at 1Mega-sample per second. The digitizing functions employ the same measurement ranges as the DMM’s traditional DC voltage and current functions. In other words, the digitizer offers exceptional dynamic range—from 1µV to 1000V and 100pA to 10A—which is suitable for many applications. The advanced waveform triggering mechanisms such as edge, pulse, and window triggering, allow you to easily capture, view, and interact with these transient signals on the Model DMM7510’s multi-touch display.
Background
Power-up and power-down transients are identified as step functions in the input voltage that result from a relay or switch closure. Achieving a clean or monotonic, rise or fall from various power supplies can be a major concern. You may encounter a sag in the input voltage due to a large inrush current and finite power source impedance, which could cause catastrophic problems with under-voltage lockout circuits, inrush current-limiting circuits, and even generic power supplies. For example, FPGAs contain auxiliary analog circuitry such as a phase-lock loop (PLL) controlled by a voltage controlled oscillator (VCO). The VCO would change frequencies and/or phase, causing the PLL to lose synchronization when the supply voltage droops during power-up. You may also encounter a slow ramp rate that could lead to anomalous, sometimes destructive, consequences.
This application note illustrates how to capture, view, and characterize power-up and power-down transients of a switch-mode power supply (SMPS) on the front panel of the Keithley Model DMM7510.
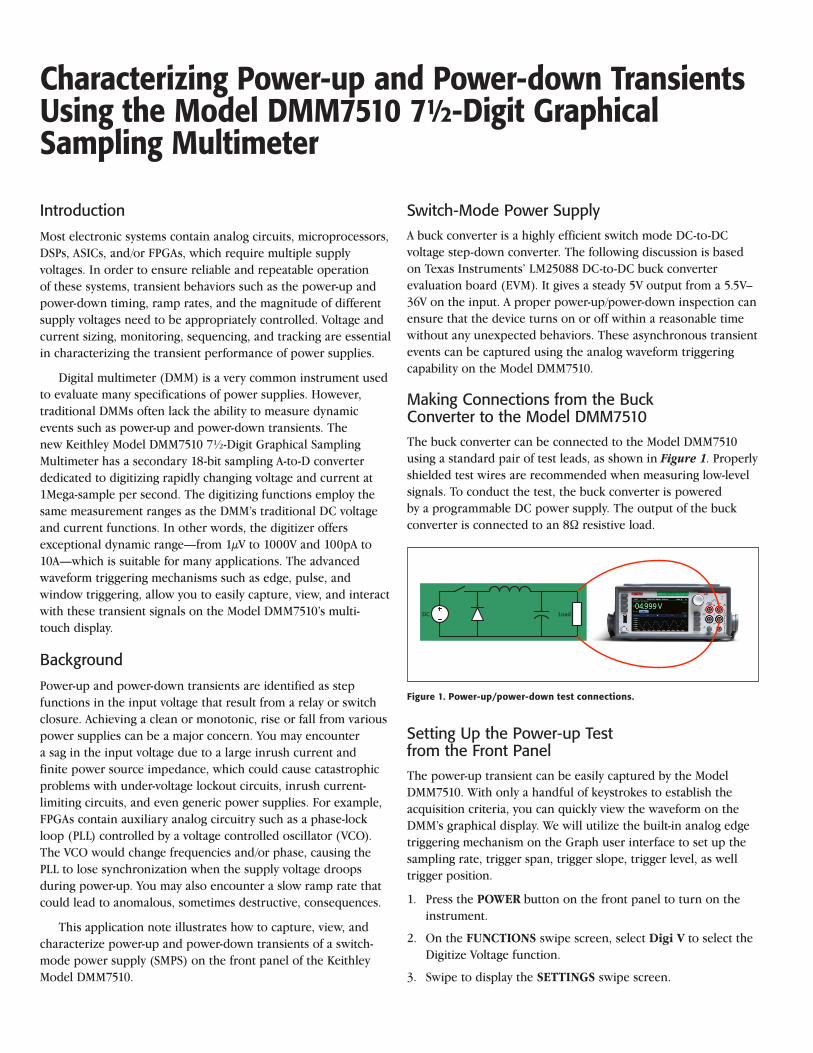
Switch-Mode Power SupplyA buck converter is a highly efficient switch mode DC-to-DC voltage step-down converter. The following discussion is based on Texas Instruments’ LM25088 DC-to-DC buck converter evaluation board (EVM). It gives a steady 5V output from a 5.5V–36V on the input. A proper power-up/power-down inspection can ensure that the device turns on or off within a reasonable time without any unexpected behaviors. These asynchronous transient events can be captured using the analog waveform triggering capability on the Model DMM7510.
Making Connections from the Buck Converter to the Model DMM7510The buck converter can be connected to the Model DMM7510 using a standard pair of test leads, as shown in Figure 1. Properly shielded test wires are recommended when measuring low-level signals. To conduct the test, the buck converter is powered by a programmable DC power supply. The output of the buck converter is connected to an 8Ω resistive load.
DC Load
Figure 1. Power-up/power-down test connections.
Setting Up the Power-up Test from the Front PanelThe power-up transient can be easily captured by the Model DMM7510. With only a handful of keystrokes to establish the acquisition criteria, you can quickly view the waveform on the DMM’s graphical display. We will utilize the built-in analog edge triggering mechanism on the Graph user interface to set up the sampling rate, trigger span, trigger slope, trigger level, as well trigger position.
1. Press the POWER button on the front panel to turn on the instrument.
2. On the FUNCTIONS swipe screen, select Digi V to select the Digitize Voltage function.
3. Swipe to display the SETTINGS swipe screen.
4. Set the Sample Rate to 1,000,000.
5. Press the MENU key.
6. Select Reading Buffers.
7. Set the Capacity to 10,000 for 10ms of readings.
8. Press the MENU key.
9. Select Graph.
10. Select the Scale tab.
11. Set the X-Axis Method to All.
12. Select the Trigger tab.
13. Set Source Event to Waveform.
14. Select Analog Edge.
15. Set Level to 3 V.
16. Set Position to 50% for the pre-trigger position.
17. Select the Graph tab to view the graph.
18. To start capturing the buck converter power-up behavior, press the TRIGGER key on the front panel.
The pre-trigger data acquisition starts immediately and is displayed on the Graph. Turn on the input supply. When the
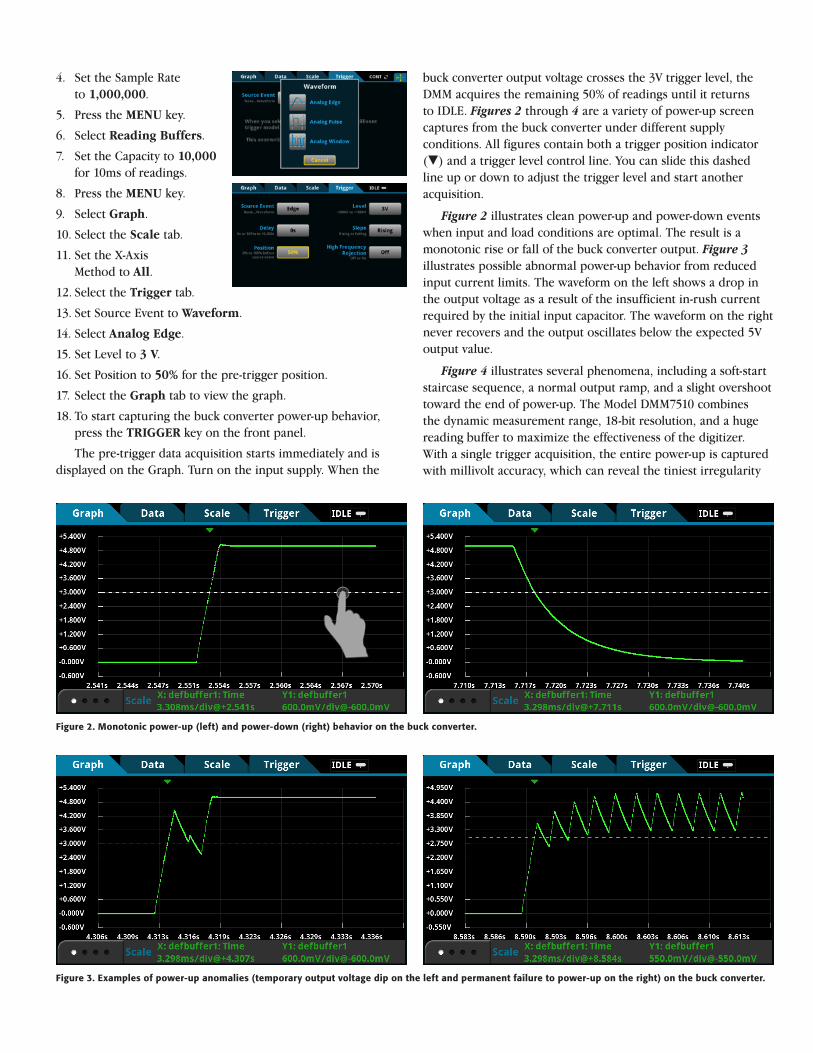
buck converter output voltage crosses the 3V trigger level, the DMM acquires the remaining 50% of readings until it returns to IDLE. Figures 2 through 4 are a variety of power-up screen captures from the buck converter under different supply conditions. All figures contain both a trigger position indicator () and a trigger level control line. You can slide this dashed line up or down to adjust the trigger level and start another acquisition.
Figure 2 illustrates clean power-up and power-down events when input and load conditions are optimal. The result is a monotonic rise or fall of the buck converter output. Figure 3 illustrates possible abnormal power-up behavior from reduced input current limits. The waveform on the left shows a drop in the output voltage as a result of the insufficient in-rush current required by the initial input capacitor. The waveform on the right never recovers and the output oscillates below the expected 5V output value.
Figure 4 illustrates several phenomena, including a soft-start staircase sequence, a normal output ramp, and a slight overshoot toward the end of power-up. The Model DMM7510 combines the dynamic measurement range, 18-bit resolution, and a huge reading buffer to maximize the effectiveness of the digitizer. With a single trigger acquisition, the entire power-up is captured with millivolt accuracy, which can reveal the tiniest irregularity
Figure 3. Examples of power-up anomalies (temporary output voltage dip on the left and permanent failure to power-up on the right) on the buck converter.
Figure 2. Monotonic power-up (left) and power-down (right) behavior on the buck converter.

in the design. You can easily zoom and pan to any area on the waveform to examine the details of these individual occurrences. You can also enable horizontal and vertical cursors for further analysis. See the Appendix for programming examples on analog edge trigger.
Figure 4a. A complete capture of buck converter power-up with soft-start sequence.
Figure 4b. Panning and zooming into the soft-start behavior (top) and output voltage overshoot before reaching steady state (bottom).
Simultaneous Voltage and Current Measurement Using Two Model DMM7510sThe Model DMM7510 is a very powerful high-end multimeter packed with sophisticated modern technologies. The next
demonstration explores the advanced instrument programming and integration valuable to applications seeking simultaneous voltage and/or current digitizing solutions.
The buck converter power-up transient analysis can be more involved than merely monitoring the output voltage. The input voltage, input current, output voltage, and load current are all signals of importance. The key is to synchronize these signals to a single triggering event to uncover critical information of about the design of the buck converter. The example below uses two Model DMM7510s to demonstrate this capability.
Connecting two Model DMM7510s to monitor two different signals on the buck converter simply involves connecting each standard pair of test leads from the circuit to each DMM. A TSP-Link® cross-over cable is used to daisy-chain the two DMMs together for synchronizing the analog waveform trigger event on both. Keithley Instruments’ TSP-Link® interface is a high-speed trigger synchronization and communication bus that test system builders can use to connect multiple instruments in a master and subordinate configuration. Once connected, all the instruments in this system can be programmed (using TSP commands only) and operated under the control of the master instrument. This allows the instruments to run tests more quickly because they can be decoupled from frequent computer interaction. Furthermore, multiple instruments are used as if they are part of the same physical unit for simultaneous multi-channel testing.
Figure 5 is a connection diagram for simultaneous input current and output voltage measurement. The current measurement is made via a standard pair of test leads connected in series with the input high side of the power supply.
TSP Program
Cross-over cable for TSP-Link®
DC Load
Figure 5. Connection for simultaneous input current and output voltage measurement
The Model DMM7510 has a dynamic current measurement range from 0.1nA to 10A with a 100kHz analog bandwidth. Compared to the current probe solution for oscilloscopes, the ultra-low noise performance and the simplicity of current connection using the Model DMM7510 often make it a better choice than current probing solutions. The screen captures in Figure 6 are the results of a synchronized single trigger capture of both input current and output voltage using a TSP script. The synchronization achievable over the TSPLink® interface is less than a few hundreds of nanoseconds. Once the individual signals are acquired, you can overlay these two waveforms on a single display. You can also split the waveforms into individual lanes for a different viewing experience. The buck converter clearly displays current-limiting behavior during the soft-start sequence. Again, you can zoom and pan any area on these

Figure 6a. Individual waveform display of simultaneous input current and output voltage measurement.
Figure 6b. Combining input current and output voltage onto a single display.
Figure 6c. Zooming.
waveforms to examine the dynamic behaviors in detail. For more information and support on TSP programming and simultaneous measurement, refer to the Reference Manual for the Model DMM7510 or the Keithley website (www.keithley.com).
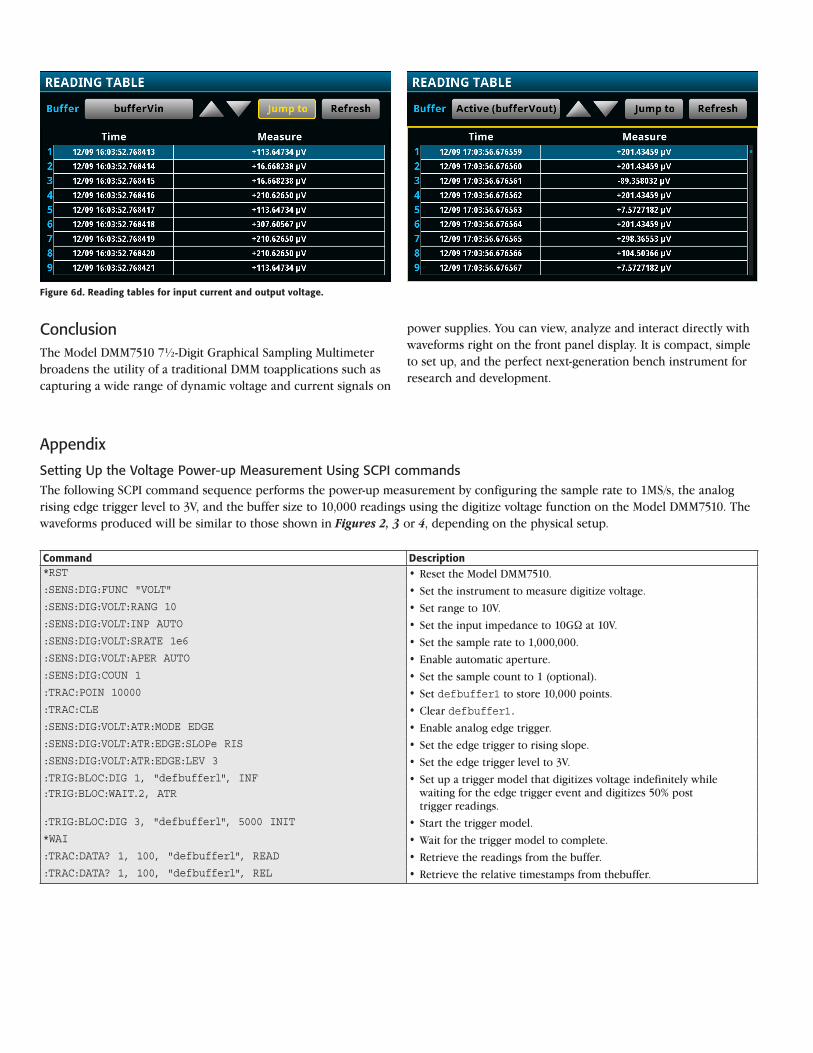
All readings and timestamps are easily accessible through the Reading Table under the main MENU. You can select any defined buffer in the instrument to display. To save these readings to a
thumbdrive, start by inserting a USB thumbdrive into the port on the front panel. Press the MENU key. Select Reading Buffers, press the desired buffer, and then press Save to USB. The data will be saved in the .csv format, so it can later be downloaded and imported into a spreadsheet. TIP: Press the HOME and the ENTER keys on the front panel at the same time to save a screen capture to a USB thumb drive.
ConclusionThe Model DMM7510 7½-Digit Graphical Sampling Multimeter broadens the utility of a traditional DMM toapplications such as capturing a wide range of dynamic voltage and current signals on
power supplies. You can view, analyze and interact directly with waveforms right on the front panel display. It is compact, simple to set up, and the perfect next-generation bench instrument for research and development.
Command Description*RST • Reset the Model DMM7510.:SENS:DIG:FUNC "VOLT" • Set the instrument to measure digitize voltage.:SENS:DIG:VOLT:RANG 10 • Set range to 10V.:SENS:DIG:VOLT:INP AUTO • Set the input impedance to 10GΩ at 10V.:SENS:DIG:VOLT:SRATE 1e6 • Set the sample rate to 1,000,000.:SENS:DIG:VOLT:APER AUTO • Enable automatic aperture.:SENS:DIG:COUN 1 • Set the sample count to 1 (optional).:TRAC:POIN 10000 • Set defbuffer1 to store 10,000 points.:TRAC:CLE • Clear defbuffer1.:SENS:DIG:VOLT:ATR:MODE EDGE • Enable analog edge trigger.:SENS:DIG:VOLT:ATR:EDGE:SLOPe RIS • Set the edge trigger to rising slope.:SENS:DIG:VOLT:ATR:EDGE:LEV 3 • Set the edge trigger level to 3V.:TRIG:BLOC:DIG 1, "defbufferl", INF • Set up a trigger model that digitizes voltage indefinitely while
waiting for the edge trigger event and digitizes 50% post trigger readings.
:TRIG:BLOC:WAIT.2, ATR
:TRIG:BLOC:DIG 3, "defbufferl", 5000 INIT • Start the trigger model.*WAI • Wait for the trigger model to complete.:TRAC:DATA? 1, 100, "defbufferl", READ • Retrieve the readings from the buffer.:TRAC:DATA? 1, 100, "defbufferl", REL • Retrieve the relative timestamps from thebuffer.
Figure 6d. Reading tables for input current and output voltage.
Appendix
Setting Up the Voltage Power-up Measurement Using SCPI commandsThe following SCPI command sequence performs the power-up measurement by configuring the sample rate to 1MS/s, the analog rising edge trigger level to 3V, and the buffer size to 10,000 readings using the digitize voltage function on the Model DMM7510. The waveforms produced will be similar to those shown in Figures 2, 3 or 4, depending on the physical setup.

Setting Up the Voltage Power-up Measurement Using TSP CommandsThe following TSP script is designed to be run from Keithley Instruments’ Test Script Builder (TSB) software, a free software tool that can be downloaded from the website (ww.keithley.com). By default, the Model DMM7510 is configured to use the SCPI command set, so before sending TSP commands to the instruments, the TSP command set must be selected instead. Perform these steps to change the command set: Press MENU -> Settings -> Command Set. Select TSP commands.
The TSP script performs a similar power-up measurement as the front panel operation on the Model DMM7510. And it generates waveforms similar to those illustrated in Figures 2 to 4, depending on the physical setup.
--Reset the instrument to default settings
reset()
--Create a local variable to store the number of samples
numofsamples = 10000
--Set the measure function to digitize voltage to capture the power-up behavior
dmm.digitize.func = dmm.FUNC_DIGITIZE_VOLTAGE
--Voltage range must be fixed when using digitize voltage
dmm.digitize.range = 10
--Set the sample rate to 1 Msample per second to capture any small glitch
dmm.digitize.samplerate = 1e6
--Set aperture to auto to get the highest accuracy measurement for the sampling rate configured
dmm.digitize.aperture = dmm.APERTURE_AUTO
--Changing count is optional.The reading buffer capacity determines the actual count.
dmm.digitize.count = 1
--Set the input impedance to auto so it selects 10 G for the 10 V range
dmm.digitize.inputimpedance = dmm.IMPEDANCE_AUTO
--Set the buffer size to the number of samples to capture both pre and post triggered data
defbufferl.capacity = numofsamples
--Clear buffer
defbuffer1.clear()
--Select analog edge trigger to capature the power-up behavior
dmm.digitize.analogtrigger.mode = dmm.MODE_EDGE
--Set edge slope to detect a rising edge
dmm.digitize.analogtrigger.edge.slope = dmm.SLOPE_RISING
--Set edge level trigger to 3 V for the 5 V steady- state output
dmm.digitize.analogtrigger.edge.level = 3
--Define a trigger model that will capture 50% pre and 50% post triggered data
trigger.model.setblock(1,trigger.BLOCK_DIGITIZE, defbuffer1, trigger.COUNT_INFINITE)
trigger.model.setblock(2,trigger.BLOCK_WAIT, trigger.EVENT_ANALOGTRIGGER)
trigger.model.setblock(3,trigger.BLOCK_DIGITIZE, defbufferl, numofsamples/2)
trigger.model.initiate()
--Waits for the trigger model to finish collecting data before proceeding
waitcomplete()
print("test ended")

For Further InformationTektronix maintains a comprehensive, constantly expanding collection of application notes, technical briefs and other resources to help engineers working on the cutting edge of technology. Please visit tek.com
Copyright © 2016, Tektronix. All rights reserved. Tektronix products are covered by U.S. and foreign patents, issued and pending. Information in this publication supersedes that in all previously published material. Specification and price change privileges reserved. TEKTRONIX and TEK are registered trademarks of Tektronix, Inc. All other trade names referenced are the service marks, trademarks or registered trademarks of their respective companies.
01/16 1KW-1019772-1
TEK.COM
Contact Information:
ASEAN / Australia (65) 6356 3900
Austria 00800 2255 4835
Balkans, Israel, South Africa and other ISE Countries +41 52 675 3777
Belgium 00800 2255 4835
Brazil +55 (11) 3759 7627
Canada 1 800 833 9200
Central East Europe / Baltics +41 52 675 3777
Central Europe / Greece +41 52 675 3777
Denmark +45 80 88 1401
Finland +41 52 675 3777
France 00800 2255 4835
Germany 00800 2255 4835
Hong Kong 400 820 5835
India 000 800 650 1835
Italy 00800 2255 4835
Japan 81 (3) 6714 3010
Luxembourg +41 52 675 3777
Mexico, Central/South America and Caribbean 52 (55) 56 04 50 90
Middle East, Asia, and North Africa +41 52 675 3777
The Netherlands 00800 2255 4835
Norway 800 16098
People’s Republic of China 400 820 5835
Poland +41 52 675 3777
Portugal 80 08 12370
Republic of Korea 001 800 8255 2835
Russia / CIS +7 (495) 6647564
South Africa +41 52 675 3777
Spain 00800 2255 4835
Sweden 00800 2255 4835
Switzerland 00800 2255 4835
Taiwan 886 (2) 2656 6688
United Kingdom / Ireland 00800 2255 4835
USA 1 800 833 9200
Rev. 01/16


![[Allan Greenwood] Electrical Transients in Power Systems (1991)](https://static.fdocuments.in/doc/165x107/5880e5541a28ab0d358b57fd/allan-greenwood-electrical-transients-in-power-systems-1991.jpg)