CHARACTERIZING PATTERNS OF MILCON … PATTERNS OF MILCON PROJECT CONTRACT MODIFICATIONS THESIS Tyler...
96
CHARACTERIZING PATTERNS OF MILCON PROJECT CONTRACT MODIFICATIONS THESIS Tyler K. Nielsen, Captain, USAF AFIT/GEM/ENV/07D-01 DEPARTMENT OF THE AIR FORCE AIR UNIVERSITY AIR FORCE INSTITUTE OF TECHNOLOGY Wright-Patterson Air Force Base, Ohio APPROVED FOR PUBLIC RELEASE; DISTRIBUTION UNLIMITED
Transcript of CHARACTERIZING PATTERNS OF MILCON … PATTERNS OF MILCON PROJECT CONTRACT MODIFICATIONS THESIS Tyler...
CHARACTERIZING PATTERNS OF
MILCON PROJECT CONTRACT MODIFICATIONS
THESIS
Tyler K. Nielsen, Captain, USAF
AFIT/GEM/ENV/07D-01
DEPARTMENT OF THE AIR FORCE AIR UNIVERSITY
AIR FORCE INSTITUTE OF TECHNOLOGY
Wright-Patterson Air Force Base, Ohio
APPROVED FOR PUBLIC RELEASE; DISTRIBUTION UNLIMITED

The views expressed in this thesis are those of the author and do not reflect the official policy or position of the United States Air Force, Department of Defense, or the United States Government.
AFIT/GEM/ENV/07D-01
CHARACTERIZING PATTERNS OF MILCON PROJECT CONTRACT MODIFICATIONS
THESIS
Presented to the Faculty
Department of Systems and Engineering Management
Graduate School of Engineering and Management
Air Force Institute of Technology
Air University
Air Education and Training Command
In Partial Fulfillment of the Requirements for the
Degree of Master of Science in Engineering Management
Tyler K. Nielsen, BS
Captain, USAF
December 2007
APPROVED FOR PUBLIC RELEASE; DISTRIBUTION UNLIMITED.
AFIT/GEM/ENV/07D-1
CHARACTERIZING PATTERNS OF MILCON PROJECT CONTRACT MODIFICATIONS
Tyler K. Nielsen, BS Captain, USAF
Approved: --signed-- 7 Dec 07 ____________________________________ Alfred E.Thal, Jr., PhD (Chairman) date --signed-- 7 Dec 07 ____________________________________ Edward D. White, III, PhD (Member) date --signed00 7 Dec 07 ____________________________________ Jason J. Cook, Capt (Member) date
iv
AFIT/GEM/ENV/07D-01
Abstract
Change orders are used by project managers of construction projects to account
for unexpected changes in construction projects after the contract has been finalized.
This can include everything from weather events to last minute changes requested by the
user. This effort analyzed data from the U.S. Air Force Military Construction (MILCON)
program to find the major causes of change orders in the hopes that the associated costs
may be minimized and that the insight gained may improve project management efforts.
The data was analyzed using means comparison testing through the nonparametric
Kruskal-Wallis test; the results were then ranked using the Dunn-Bonferroni method.
The results show that pre-construction activities (unforeseen site conditions,
unforeseen environmental site conditions, user changes, and design deficiencies) are the
most common causes of change orders for MILCON projects, which agrees with other
construction research reported in the literature. Although the information contained in
the military database was insufficient to determine a conclusive statistical ranking, there
is evidence that suggests Air Force Material Command may have higher median change
order cost and Air Combat Command has lower median change order costs. When
considering the construction agent, the Air Force seems to have higher median change
order costs than both the Army Corps of Engineers and the Naval Facilities Command.
However, no specific reasons can be attributed to these observations. Furthermore, given
the accuracy and completeness of the data, these results remain questionable and require
further research to validate.
v
Acknowledgments
I would like to express my sincere appreciation to my committee. Without their
guidance and assistance this effort would not have been possible. I would also like to
thank my instructors at AFIT, in particular Lt. Col. England, Lt Col. Holt, Maj. Leach,
Dr. Stockman, Dr. Strouble, Dr. Thal, and Dr. White. You have particularly inspired me
in some manner that has forever changed how I view the world.
I would also like to thank Capt Jason Cook for the many times we’ve stayed up
early into the morning calculating the precise melting temperature of glass, rebuilding the
Air Force from the ground up, and understanding the nature of God.
Finally, I would like to thank my family and loved ones who have supported me
throughout this process, in particular my dogs Bob & Rachel.
Tyler K. Nielsen
vi
Table of Contents
Page Abstract ...................................................................................................................... iv Acknowledgements ......................................................................................................v Table of Contents ....................................................................................................... vi List of Figures ........................................................................................................... viii List of Tables ............................................................................................................. ix I. Introduction ............................................................................................................1 General Background ...............................................................................................1 Specific Background...............................................................................................3 Problem Statement ..................................................................................................5 Research Questions.................................................................................................5 Methodology...........................................................................................................6 Assumptions and Limitations .................................................................................6 Overview of Remaining Chapters...........................................................................7 II. Literature Review....................................................................................................8 Background.............................................................................................................8 Types of Change – Legal Definitions ................................................................9 What is a Change Order? – Working Definition ...............................................9 Impacts of Change Orders ....................................................................................11 Productivity......................................................................................................11 Cost Overruns ..................................................................................................14 Summation .......................................................................................................18 The Causes of Change Orders...............................................................................18 Industry Studies ...............................................................................................19 Department of Defense ....................................................................................27 Summation .......................................................................................................29 Synthesizing Existing Research............................................................................29 Conclusion ............................................................................................................30 III. Methodology.........................................................................................................32 Data Collection .....................................................................................................32 Data from within Project Manager’s Files.......................................................33 Data from within ACES...................................................................................34 Initial Data Analysis .............................................................................................34
vii
Page Categorization of Data ..........................................................................................35 Final Data Analysis...............................................................................................36 Conclusion ............................................................................................................40 IV. Results...................................................................................................................41 Data Collection .....................................................................................................41 Data from within Project Manager’s Files.......................................................41 Data from within ACES...................................................................................43 Initial Data Analysis .............................................................................................43 Categorization of Data ..........................................................................................45 Final Data Analysis...............................................................................................46 Characterization of ACES MILCON Data ......................................................47 Statistical Analysis of ACES MILCON Data..................................................50 Analysis of ACES MILCON Data by Change Order Causal Factor ...............51 Analysis of ACES MILCON Data by Major Command (MAJCOM) ............52 Analysis of ACES MILCON Data by Construction Agent .............................53 Analysis of ACES MILCON Data by Year.....................................................54 Conclusion ............................................................................................................55 V. Discussion .............................................................................................................56 Discussion of Results............................................................................................56 Limitations ............................................................................................................58 Recommendations.................................................................................................59 Future Research ....................................................................................................61 Conclusion ............................................................................................................61 Appendix A. Verification of Assumptions .................................................................63 Appendix B. JMP® Output..........................................................................................73 Appendix C. Dunn Test Results..................................................................................77 Bibliography ................................................................................................................81

viii
List of Figures
Figure Page 1. Change Order Distribution by Major Command ..................................................50 2. Dunn Test Results – MAJCOM Rankings............................................................52
ix
List of Tables
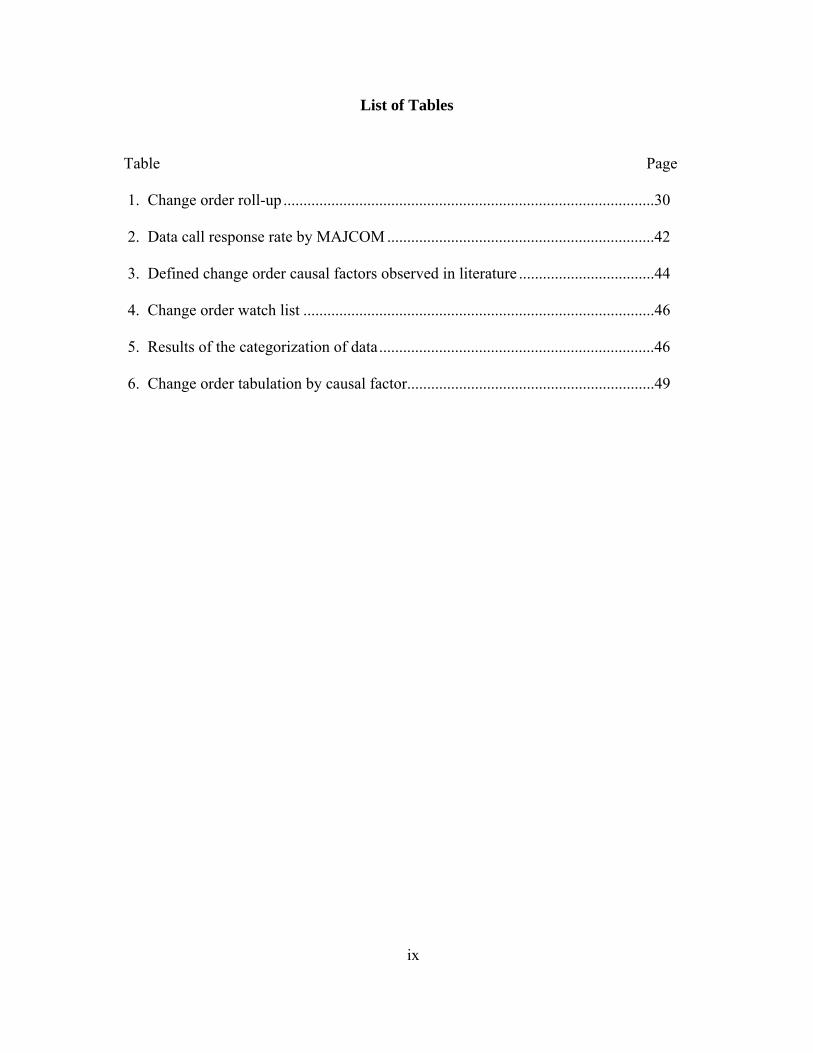
Table Page 1. Change order roll-up .............................................................................................30 2. Data call response rate by MAJCOM ...................................................................42 3. Defined change order causal factors observed in literature ..................................44 4. Change order watch list ........................................................................................46 5. Results of the categorization of data.....................................................................46 6. Change order tabulation by causal factor..............................................................49
1
CHARACTERIZING PATTERNS OF MILCON PROJECT CONTRACT MODIFICATIONS
Chapter 1. Introduction
Within the strict confines of budget, a diverse and broad cast of conflicting
players, and pressures from project requirements, project managers (PMs) must typically
exercise all the tools they have to successfully complete a project. The construction
contract modification, also referred to as a change order or “mod,” is a vital tool used by
PMs to address changes in construction projects after a contract has been finalized. In
fact, the change order is one of the few tools the PM has to accommodate for unplanned
occurrences once the project is under construction. Therefore, having a better
understanding of the causes of change that occur during construction may have a
significant impact on the PM’s ability to manage a project. Consequently, this research
effort attempted to identify the major causes contributing to change orders and quantify
their effects. The results provide PMs a list of red flags alerting them to potential
problems and enable them to develop management strategies to minimize overall costs.
General Background
Simply stated, a change order is a modification of an existing construction
contract, which is a binding legal agreement between the contractor and the purchaser
that, among other things such as specifying design and materials, details the agreed upon
cost and schedule for a project. Any changes to the contract after it has been agreed upon
2
must be negotiated between the contractor and purchaser as a change to the contract using
a change order. As broadly defined above, these terms are industry standards and have
been defined similarly in many studies (Choy and Sidwall, 1991; Gunhan, Arditi, and
Doyle, 2007; Hanna, Russell, and Thomack, 1998).
The negotiation of a change is the change order process and often involves
changes in the amount of the total cost of the building. Many change orders are as simple
as altering the colors or architectural details. If done early in the project, they usually
have no direct impact. However, other change orders have a more direct impact on the
project. Events such as major changes to the design, inclement weather, and design
errors are all examples of change orders with direct impact. These types of change orders
can incur significant additional costs and delays to the original schedule.
Change orders may impact projects indirectly as well. One study found that the
average decrease in efficiency of work is 30% while the change work is being performed
(Thomas and Napolitan, 1995). In the worst case, excessive amounts of change orders
may lead to breach or abandonment of the contract (Richey and Walulik, 2001).
Research has also shown that as the amount of change increases on a project, overall
productivity decreases; this represents a source of cost escalation and schedule delay
(Hanna, Camlic, Peterson, and Nordheim, 2002; Ibbs, 1997; Leonard, 1987; Vandenberg,
1996).
While change orders may bring increased cost, schedule delay, and indirect costs
through lost productivity, they are considered inevitable (Cox, 1997). In fact, change
orders give the PM a vehicle by which to maintain project momentum (Ehrenreich-
3
Hansen, 1994). “It is a common perception that change orders are undesirable and that
their number should be as close to zero as possible. Actually, [change orders] are a very
necessary and useful tool in quality and risk management of projects” (Ehrenreich-
Hansen, 1994). Industry has recognized that management of change orders is clearly a
crucial element of any project. Project managers must be able to effectively deal with
change and manage their impact (Cox, 1997). The focus of this research, understanding
the potential causes and impact of change orders, provides critical insight regarding
effective management strategies.
Specific Background
The United States (U.S.) Air Force executes a very large construction program
each year. In 2006, the Air Force Military Construction (MILCON) budget was $1.28
billion (Dodge, 2006). Of that amount, $64 million (approximately 5%) was set aside as
contingency funding for change orders on MILCON projects (AFCEE, 2000). As
previously asserted, change orders are inevitable and the Air Force has recognized this by
establishing these contingency funds. Furthermore, Air Force PM guidance lists change
orders as a vehicle by which a PM can accommodate for discrepancies in the plans and
specifications, changes requested by owners/users who have altered the project goal in
some way, or simply things that could not be foreseen (AFCEE, 2000).
However, research has shown that funding change orders at the current 5% level
is likely to be inadequate (Cook, 2006). This indicates that budget controls may not be
addressing spending in a manner consistent with current practice. For instance, Cook
4
(2006) found that the $64 million set aside as contingency funding only covered about
half the predicted change order costs. Therefore, it is critical that change order (i.e.,
contingency) budgets are effectively managed. Knowing the most common causes of
change orders gives a PM the ability to scrutinize a project prior to contract award,
thereby helping him or her avoid pitfalls that may have plagued past projects. Presently,
however, the PM has no source for this information.
When a user, key player, or contractor submits a request for a change order, the
PM is typically the first person to review that request. Although many change order
requests must be forwarded to and approved by other key players, the PM may be able to
give unofficial approval or disapproval. In other words, PMs control change orders by
acting as the first filter and at times the decision maker when a change arises. However,
there is very little official guidance provided to Air Force PMs (Arin, 1989).
Compounding the problem, external elements like available funding often take
precedence over other factors (Arin, 1989; AFCEE, 2000). Therefore, any information
that helps a PM control costs will result in a more successful project. An understanding
of the common causes and impacts of change orders is essential so the PM can make wise
decisions as he or she approaches a project. Additionally, this understanding will give
the PM the ability to convey the consequences of the change to decision makers and other
key players.
5
Problem Statement
Given that change order budgets are potentially under-funded, it is imperative that
existing funds are managed in the most efficient manner possible. Presently, information
regarding change order causes and impact across the Air Force does not appear to exist.
This is reinforced in the Air Force Project Manager’s Guide, which states, “It takes
experience and a gut feel to be a good project manager” (AFCEE, 2000). Therefore,
change order causal and impact information in a digestible format would serve as an
inexpensive and valuable means by which PMs could build on the past experience of the
Air Force. Increasing PM experience would aid in maximizing the efficiency with which
contingency budgets are spent.
Research Questions
This research contributes to the body of knowledge required to answer the
overarching question, “What can be done to maximize the value of MILCON project
funding?” Specifically, this effort answers the question, “What are the causes of change
orders within the Air Force MILCON program?” Additionally, this research ranks causes
of change orders by their magnitude of impact. Finally, the question, “What does the Air
Force presently do to capture and preserve experience gained through executing change
orders in the past?” is also answered.
6
Methodology
This research effort collected archived data by gathering project information from
MILCON program managers and querying an existing Air Force database containing
information on MILCON projects. Program managers were asked for electronic copies
of contractual documents for projects completed from the year 2002 through 2006. The
Air Force database containing MILCON information was queried for completed project
information from the years 2000 through 2004. Using a small sample of the collected
project data and information gathered during the literature review (Chapter 2), a list of
potential change order causes was developed. The project data gathered from the
program managers and the database was then categorized by potential change order
causal factor. The results were analyzed using the nonparametric Kruskal-Wallis test and
those results were ranked using the Dunn-Bonferroni method. The results drawn from
those tests are presented in Chapter 4 and final conclusions are presented in Chapter 5.
Assumptions and Limitations
Because the requested data was recorded during project execution by PMs and
contracting officers, it was assumed to be recorded correctly. Therefore, no effort was
made to verify the accuracy of the data. It was also assumed that the data consisted of
projects that were independent of one another and that change orders on one project did
not affect change orders on another project. It was also assumed that the submitted
projects were representative of the Air Force MILCON program as a whole because of
the broad variety of projects executed in a large number of different locations.
7
The primary limitations of this research effort were the quantity and quality of
submitted data. Additionally, there was an inherent reliance upon data that was not
standardized. Because there is not a list of standard change order causes that Air Force
PMs are required to use, assigning a change order causal factor required a subjective
grading. This grading process introduces the possibility for personal bias; however, a
protocol was established early in the effort to minimize any effect of bias. This is
discussed in detail in Chapter 3.
Overview of Remaining Chapters
The remaining chapters of this thesis present the literature review and results of
this research effort. Chapter 2 presents the current status of research regarding change
orders in the construction industry. It covers the industry as a whole and narrows to the
government sector. Chapter 3 presents the methodology used to complete this research,
highlighting the gathering of data, the protocol used to prevent bias, and the statistical
tools used to evaluate the data. Finally, Chapter 4 provides the results and Chapter 5
summarizes the effort with a conclusion and recommendations.
8
Chapter 2. Literature Review
This chapter reviews the state of existing research completed on change orders as
they relate to the present research effort. The chapter begins with a short background
section that introduces the concept of what constitutes change and a change order. This is
followed by a review of research investigating the potential impacts of change on a
project. The chapter then covers existing studies germane to the present effort, beginning
with the construction industry as a whole and narrowing to work specific to the
Department of Defense (DoD). Finally, the reviewed literature is synthesized into a
presentation of common causal factors of change orders, closing with a brief discussion
of key causal factors identified in this review.
Background
It is recognized universally throughout the construction industry that projects will
experience some degree of change. This is evidenced by the inclusion of contract
provisions providing for change, called change clauses, in most construction contracts
(Richey and Walulik, 2001; FAR, 2005; Cox, 1997). Understanding what constitutes
change during a construction contract is necessary prior to being able to study the causes
of change and hence change orders.
9
Types of Change – Legal Definitions
Litigation and contract law have defined several different types of change that
may occur between the parties of a construction contract. There are generally three types
of change that may occur: formal changes, constructive changes, and cardinal changes
(Cox, 1997). Formal changes, also called change orders, are those in which the
contractor is given documentation from the other party (often called the owner) directing
some change to the original contract documents (Cox, 1997). It is this type of change
that is the subject of the current research. Constructive changes are changes to the work
that the contractor must make as the result of an action by the owner. Examples of this
are errors in the contract documents provided to the contractor at the beginning of the
project or changes to the work directed by the owner outside the formal processes
provided for within the original contract (Cox, 1997). Constructive changes can and
often do become formal change orders. Finally, a cardinal change is a change in the
scope of the agreed upon work of the project (Cox, 1997). This type of change is akin to
contracting for an apple and then directing the contractor to provide an orange. A
cardinal change may consist of one change or the cumulative effect of numerous changes
and is typically determined by the courts. If a cardinal change has occurred, costs are
awarded or assessed to each party by the legal system (Cox, 1997; Richey and Walulik,
2001).
What is a Change Order? – Working Definition
While the legal system has clearly defined what a change order is, the term is
rather generic within the construction industry. The R.S. Means Construction Dictionary
10
(2003) defines a change order as simply a modification to the original contract documents
(plans, specifications etc.) formally given to the contractor in writing. Researchers have
referred to a number of textbooks, educational materials, or government regulations, and
arrived at similar definitions (Chan and Yeong, 1995; Günhan et al., 2007). Others have
noted that change orders are not always formal documents and include formal and
constructive changes (e.g., Hanna et al., 1998). Choy and Sidewell (1991) avoid the term
altogether and refer to the general term, contract variations, in their effort to document
the causes of change orders. The regulations governing acquisition within the federal
government define a change order as, “a written order, signed by the contracting officer,
directing the contractor to make a change that the changes clause authorizes the
contracting officer to order without the contractor’s consent” (FAR, 2005).
The definition provided by the Federal Acquisition Regulations (FAR)
encompasses the critical elements of the definition of a formal change generally used by
industry as described by Choy and Sidwell (1991); Chan and Yeong (1995); Cox (1997);
Hanna et al. (1998); Richey and Walulik (2001); and Günhan, Arditi, and Doyle (2007).
The current research effort utilizes the FAR definition since data was collected from a
federal source. It is through this lens that the works presented here have been evaluated.
Chow and Sidwell’s (1991) definition of variation infers that the causes of change orders
cannot be separated from the causes of the impacts of change orders. Experience
supports this, particularly in federal construction. The impacts of change orders
discussed here typically include lost productivity on the jobsite, cost overruns, and delay.
On federal projects, each of those things must be accounted for through the use of a
11
change order (FAR, 2005). The causes of both change orders and the impacts of change
orders, for the purposes of this study, are thus directly comparable.
Impacts of Change Orders
The study of change orders is valuable because it gives project managers and
other practitioners in the field tools through which they might avoid some of the negative
impacts associated with change orders. Change orders can range from having no impact
on a project to causing the complete abandonment of a project (Richey and Walulik,
2001). While the degree of impact caused by change orders can vary, past research has
demonstrated that the greater number of change orders a project experiences, the greater
likelihood the project will be impacted in some manner by change, typically cost growth
or schedule delay (Gunduz and Hanna, 2005; Hanna et al., 2002; Hanna, Russell,
Nordheim, and Bruggink 1999a; Hanna, Russell, and Vandenberg, 1999b; Vandenberg,
1996). Since the literature primarily addresses risk of impact in terms of lost productivity
and cost overruns, limiting the amount of change orders also limits the amount of risk on
a project. The discussion below presents the potential impact of change orders in those
terms.
Productivity
Leonard (1987) studies the measure of percent change orders (the percentage of
labor hours spent on change work vs. the labor hours spent on original contract work)
compared to percent loss of productivity (percent unproductive labor hours vs. labor
hours spent on original contract work). His results show “a significant direct correlation
12
between percentage loss of productivity and percentage change orders” (Leonard,
1987:2). On a project with a 25% change order rate, electrical/mechanical work
experienced a 20% loss of productivity and civil/architectural work experienced a 17%
loss; if the CO rate increased to 50%, respective work types experienced a 31% and 23%
loss of productivity (Leonard, 1987).
Research by Thomas and Napolitan (1995) supported Leonard’s (1987) results.
They compared the labor hours required to accomplish a specific task during both a
normal schedule and change work to calculate productivity rates, which were then used to
calculate performance ratios during normal work and change work. These ratios were
divided by one another to calculate efficiency. Statistical regression was used to test
significant contributing factors affecting performance ratios for correlation; an analysis of
variance test was then completed on each factor to show the efficiency impact of each
factor. Thomas and Napolitan (1995) concluded that during change work, projects suffer
an average 30% loss of efficiency and the timing of the change (that later in the project
the greater impact) plays a crucial role in affecting efficiency.
Ibbs (1997) expanded upon Thomas and Napolitan’s work using a different
approach. Where Thomas and Napolitan (1995) analyzed several crews over two and a
half years, Ibbs (1997) surveyed a large number of organizations within the industry
utilizing a standardized questionnaire that he developed with the Construction Industry
Institute. He assessed change orders vs. productivity during the design and construction
phases and found that as change increases on a project, productivity declines. During the
design phase, Ibbs (1997) found that for every 10% increase in change, productivity
13
decreased by 2.48%; for every 10% increase in change during construction, there was a
corresponding 3.44% decrease in productivity. These results show that change has more
impact when it occurs during the construction phase of the project (Ibbs, 1997). This
supports Thomas and Napolitan’s (1995) finding that change had greater impact the later
it occurred in a project.
At the same time Ibbs (1997) was completing his study, Vandenberg (1996) was
completing his thesis on the impacts of change orders on the efficiency of construction
labor working on mechanical systems. Vandenberg’s thesis later served as the
foundation for his collaboration with Hanna and Russell (1999b). In their work, Hanna et
al. (1999b) utilized the total number of direct labor hours minus the original estimate plus
the change order estimate divided by the total number of direct labor hours. The
published results from their work represent further confirmation of the previous
researchers’ results. Hanna et al. (1999b) confirmed not only that projects with a higher
percentage of change are more likely to be impacted by change, but also that projects
impacted by change are less efficient. They additionally confirmed the findings that
change during the latter part of a project has greater impact (Hanna et al., 1999b).
Hanna et al. (1999a) published an additional study investigating the impact of
change orders on the efficiency of electrical work. Using the same method of measuring
efficiency used by Hanna et al. (1999b), Hanna et al. (1999a) found that as change work
increases, so does the likelihood of decreases in efficiency. Additionally, Hanna et al.
(1999a) further confirmed the works of previous researchers that the later a change
occurs, the greater its impact will likely be. One notable difference, however, was that
14
they were able to find statistical evidence that showed the amount of project manager
experience correlated with the ability to mitigate the impacts of change work (Hanna et
al., 1999a). Earlier efforts had been unable to statistically support this (Hanna et al.,
1999b; Vandenberg, 1996).
In terms of loss of productivity, research has shown that change causes
productivity losses. Research also indicates that the timing of change is important and
that change later in projects is associated with greater losses of efficiency. Interestingly,
research has not shown any improvement in terms of being able to accommodate change
and maintain efficiency during a project.
Cost Overruns
Many studies have directly or indirectly addressed the impact of change orders in
terms of cost overruns, also termed cost growth and cost escalation. As can be seen in
the “causes of change orders” section of this chapter, change order causes are often
identified and characterized by cost overrun information. This is particularly true on
federal projects because changes in cost must be accounted for through the use of a
change order (FAR, 2005). The studies reviewed below offer evidence which
demonstrates the impact of cost overruns on projects.
Jahren and Ashe (1990) introduced the term “change order overrun rate” to the
cost overrun vocabulary, thereby recognizing the inextricable link between cost and
change. Analyzing Naval Facilities Command (NAVFAC) data from 1,576 projects
using nonparametric testing, Jahren and Ashe (1990) investigated potential predictors of
cost overrun and found that large projects are more likely to experience cost overrun rates
15
of 1% to 11% as opposed to smaller ones. Additionally, they observed that projects with
initial award amounts less than the government estimate had a higher risk of cost overrun.
Although the sample size was relatively large, the data did not meet the assumptions
required for typical statistical measures and nonparametric assessments had to be utilized,
thus limiting the overall fidelity of potential results (Jahren and Ashe, 1990).
Burati, Farrington, and Ledbetter (1992) subsequently published a study on
quality deviations in design and construction. They surveyed members of the
Construction Industry Institute (CII) and completed a detailed study of nine projects.
While the goal was to demonstrate the causes of deviations or project change, they found
an average 12.4% cost overrun (Burati et al., 1992). This coincides with the higher end
of the range presented by Jahren and Ashe (1990).
Another study addressing cost growth on military projects was completed by
Barrientez (1995). Similar to Jahren and Ashe (1990), he studied NAVFAC projects with
the goal of identifying causes of change orders. Using a combination of descriptive
statistics and sensitivity analysis performed on 157 change orders over 58 separate
contracts, Barrientez (1995) determined an 8.3% cost escalation as the result of change
orders executed post award. These results support the findings of Jahren and Ashe
(1990) and are within the range determined by Burati et al. (1992).
Cox, Morris, Rogerson, and Jared (1999) approached change orders using the case
study technique. This effort studied two construction projects in the United Kingdom in
detail from contract award to completion, tracking each change. They found a 5-8% cost
overrun as a result of change orders (Cox et al., 1999).
16
An oft-cited study of cost overruns in infrastructure projects is Flyvbjerg, Holm,
and Buhl (2004). Their study spanned 258 transport infrastructure projects in 20 different
nations and was the first and largest of its kind when published (Flyvbjerg et al., 2004).
Using regression and analysis of variance to determine the causes of cost overrun,
Flyvbjerg et al. (2004) found that costs typically increase an average 4.64% per year on
large transportation infrastructure projects as a result of change orders. On the famous
“Chunnel” project, this amounted to $1Millon/day (Flyvbjerg et al., 2004).
Hsieh, Lu, and Wu (2004) studied 90 public works projects in Taiwan. They
found that most change orders resulted from problems in planning and design and
contributed between 10-17% to project cost; they also presented a well-founded argument
to incorporate change management into the overall project management plan (Hsieh et
al., 2004). Their results are in concert with the findings of Jahren and Ashe (1990),
Burati et al. (1992), and within the range reported by Barrientez (1995).
Odeck (2004) used regression analysis of data from the Norwegian Public Roads
Administration to build and test a model that will predict cost overruns based on a variety
of factors he found to be significant contributors. He found a mean cost overrun of 7.9%
and that cost overruns were more likely to occur in smaller projects as opposed to larger
ones (Odeck, 2004). This is a departure from Flyvbjerg et al. (2004) which found the
likelihood of cost escalation to be high for all sizes of transportation projects. Odeck’s
results support the finding of the previous researchers.
Nassar, Nassar, and Hegab (2005) focused on paving projects completed by the
Illinois Department of Transportation (IDOT). Working in a vein similar to Odeck
17
(2004), they utilized data from 219 IDOT projects to develop a frequency distribution of
the causes and effects of cost overrun. This effort reported an overall average cost
overrun of 4%. While this value is low, it is within the range found by Jahren and Ashe
(1990). It should be noted though that Nassar et al. (2005) focused solely on asphalt
paving projects as opposed to other efforts which included multiple types of construction.
Dantata, Touran, and Schneck (2006) completed an interesting study in cost
overrun comparison. They compared the cost overruns on light rail projects from 1994 to
2004 with those of an earlier study that investigated projects from 1984 to 1990. Dantata
et al. (2006) tested the means of the year groups using a t-test to determine if there were
any differences. While the results were not conclusive, they did indicate that cost
overruns in light rail construction did seem to be decreasing (Dantata et al., 2006). Their
research is unique because it is the only effort that seems to suggest a gradual decreasing
trend in cost overruns.
Cook’s work (2006) was the most recent study to address cost escalation within
the DoD, and specifically the Air Force. Cook analyzed a large database of Military
Construction (MILCON) projects to develop and test a predictive model of cost overruns.
The study found that the typical project experienced a cost overrun of 11.6% (Cook,
2006), which is in concert with the results of previous researchers cited in this section.
The Government Accounting Office (GAO) recently completed studies on both
courthouse construction and major construction within the Department of Energy (DOE).
Cost growth in these programs was observed to be 5% and 50%, respectively (GAO,
2005; GAO, 2007). Another study completed by the GAO on the Federal Highway

18
Administration in 1997 reported that 23 of 30 projects reviewed had experienced cost
growth and that half of those had growth greater than 25% (GAO, 1997).
Günhan et al. (2007) work on public school construction is another source of data
regarding the impact of change orders in terms of cost overrun. They tracked the annual
cost overrun of a school district as the ratio of change order value to contract value.
Günhan et al. (2007) cite overruns ranging from as high as 12% to as low as 2.5%, with
an average of roughly 5%. Again, these results coincide with those already presented.
Summation
With reported cost overrun results ranging from 1% to 25%, a cost overrun of
10% to 15% in not unrealistic. Coupling these results with the consideration of the
established losses of productivity that also occur due to change work, it seems as though
addressing the causes of change orders can potentially provide valuable project savings.
These savings can be realized both in terms of actual project cost and intangible costs
associated with improved productivity.
The Causes of Change Orders
A number of studies investigating the causes of change orders have been
completed in recent years. These studies cover everything from large infrastructure
projects in metropolitan locations to small irrigation projects in less developed countries.
They take varied approaches. Some are completed via survey of industry professionals,
others using public data, still others are case studies of specific types of projects such as
public school construction. Presented first are general industry studies followed by

19
studies completed on behalf of or completed using data provided by the DoD. The
culmination of these efforts provides common sources of cost overruns and avenues of
potential investigation. This section concludes with a summation of change order causes
as documented by industry research.
Industry Studies
Among published works in North America, Diekmann and Nelson (1984) stands
out. Frequently cited both domestically and abroad, this effort represented a shift in
industry focus on change order causes by using descriptive statistics to show a new
direction in research was needed; much of the literature until that time focused on other
causes of change such as differing site conditions, mismanagement, and delay.
Diekmann and Nelson (1984) analyzed 22 federally administered projects and found that
72% of change order causes originated from design error and user changes. Differing site
conditions accounted for 15% of claims while weather, labor strikes, and other causes
accounted for the remainder (Diekmann and Nelson, 1984). Although the results were
purely descriptive and did not include any statistical analysis, the research changed the
focus of study within the industry.
Arditi, Akan, and Gurdamar (1985) blazed an early path in studying the causes of
change orders with their benchmark effort studying public sector projects in Turkey.
Alarmed by an average 30% cost increase on school and hospital construction, they
surveyed contractors and public servants to collect data on 384 different projects
completed from 1970 to 1980. The research effort was challenged by high inflation
during the study period and the researchers suspected that data reported on the public
20
projects were possibly handpicked to represent the best cases. Arditi et al. (1985) found
four primary reasons for cost overruns. Presented in order of importance by relative
weight, the reasons for cost overruns in Turkey from 1970 to 1980 were: inflation and
economic circumstances of the nation, government policy, resource shortages, and
inaccurate estimates of project cost due to incomplete plans and specifications at critical
moments during project timelines. Juxtaposed against Diekmann and Nelson (1984), it is
clear that economic and societal conditions external to projects make it difficult to
compare the efforts to one another. It is that much more noteworthy that both efforts cite
design issues as a contributing factor.
Foundational efforts regarding changes orders and construction productivity
include many of the researchers cited earlier in this chapter. Leonard’s (1987, 1988)
work represented a great stride forward as he was among the first to use field
investigation as opposed to survey work. Partnering with a professional construction
management firm, he investigated 57 different projects that had high levels of change to
examine the causes of change orders and how change orders contributed to productivity
loss (Leonard, 1988). Using descriptive statistics, Leonard (1987) found that 65% of
change orders were caused by design errors and omissions and 35% were caused by
design changes (requested by either the user or the A/E). Leonard (1987) further
developed standard productivity curves to estimate loss for specific types of work,
estimating productivity losses as high as 50% in some cases. The principal finding of his
work is that the majority of changes orders are caused by either design errors and
omissions or owner and A/E changes (Leonard, 1988).
21
Dlakwa and Culpin (1990) followed the methodology used by Arditi et al. (1985)
to investigate work in Nigeria by surveying industry professionals. Where Arditi et al.
(1985) included only public agencies and contractors, Dlakwa and Culpin (1990) cast a
broader net to include other professionals such as architects, engineers, and consultants.
Similar to Arditi et al. (1985), Dlakwa and Culpin (1990) found that economic and
political circumstances were the primary factor in cost overruns, followed by construction
delays (caused by resource shortages), inadequate planning, and deficiencies in initial
estimates. Both studies seem to indicate that in less developed countries geo-economics
may play a larger role in cost overruns than local factors.
Choy and Sidwell (1991) published an oft-quoted work on variation in Australian
construction contracts. A number of studies cite their definition of variation, including
the works of both Alwi (2003) and Chan and Yeong (1995). Choy and Sidwell (1991)
used a survey and descriptive analysis of 32 case studies collected from industry to find
that two major sources (design document deficiencies and user requested changes)
accounted for 76% of change on the subject projects.
Burati et al. (1992) subsequently published his study on quality deviations in
design and construction and not only confirmed Leonard’s (1987, 1988) findings but
expanded upon them. Burati et al. (1992) also reported that design errors and omissions
constituted 78% of total deviations and 79% of total overrun cost. Construction changes
and errors comprised another 16% of total deviations and the remaining 6% was
distributed among other factors.
22
Assaf, Al-Khalil, and Al-Hazmi (1995) expanded survey techniques for changes
and performed an analysis of schedule delay. They focused on contractors, owners, and
A/E firms as opposed to Choy and Sidwell’s (1991) focus on contractors. Assaf et al.
(1995) surveyed 48 construction professionals in Saudi Arabia and assessed their
opinions for cause of delay using a standardized questionnaire. Using inferential
statistics to perform an analysis of weighted rankings, they found that contractors,
owners, and A/Es generally agree on the causes of change orders. However, when
measured specifically, A/Es and contractors tend to agree with each other and owners
tend to agree with neither party (Assaf et al., 1995). The analysis also showed that the
leading causes of change were financing, requests by owners for special materials, lack of
manpower (resources), owner changes, design errors, and the relationships between the
parties as the top causes of delay (Assaf et al., 1995). As Dlakwa and Culpin (1990)
found, the general economic and political circumstances of a location play an important
role in project cost. The findings of Assaf et al. (1995) are interesting because they
represent the inklings of a bridge between studies completed in less developed countries
and the modern world, specifically Arditi et al. (1985) and Dlakwa and Culpin (1990).
Assaf et al. (1995) focused on the same change causes that researchers in North America
and Europe focused on prior to Diekmann and Nelson’s (1984) effort.
Previously cited in the cost overrun section of this chapter, Cox et al. (1999) used
the case study technique to examine projects from start to completion. They found the
most common reasons for change orders were errors and omissions in the design
23
documents, user changes, and unforeseen site conditions (Cox, et al., 1999). This is
consistent with the work of previously cited researchers.
Love and Li (2000) approached the causes and costs of rework in much the same
manner as Cox et al. (1999) approached change orders. They used the case study
technique to address rework as a measure of quality on Australian projects and found that
the major causes of rework in both subject projects were errors and omissions in design
documents and user changes (Love and Li, 2000). While change orders and rework are
not always directly comparable, the two major causes of rework (design errors and
omissions and user changers) identified by Love and Li (2000) parallel similar causes of
change orders identified by other studies (e.g., Diekmann and Nelson, 1984; Leonard,
1987, 1988; Choy and Sidwell, 1991; Burati et al., 1992; Cox et al., 1999).
Al-Momani (2000) expanded the work of Assaf et al. (1995) regarding the causes
of schedule delay. He surveyed 130 projects in Jordan considered to have unsatisfactory
performance and found the two most significant causes of delay to be poor design and
change orders; these were followed by weather, unforeseen site conditions, resource
shortages (late delivery), and economic conditions (Al-Momani, 2000). He confirmed
the validity of his results with regression models accounting for approximately two-thirds
of total variation.
Hanna et al. (2002) authored a study using the same measure of efficiency used
by previous efforts to develop a predictive model of change order impact to a project
(Hanna et al., 1999a,b; Vandenberg, 1996). Their research effort yielded several factors
that serve as predictors of potential impact to projects by affecting productivity (Hanna et
24
al., 2002). Of significance, they found that projects not impacted by change orders had a
lower percentage of change orders due to design errors and omissions. Additional factors
that could potentially impact productivity were schedule compression (through the use of
overtime and over manning), the amount of change, absenteeism and turnover, manpower
increase over planned levels, and the processing time from the initiation to approval of a
change order (Hanna et al., 2002).
Alwi (2003) measured productivity by surveying Indonesian contractors and
analyzed their results with respect to 53 different variables derived from a literature
review. These variables were classified as waste categories or waste causes and a survey
was developed to test these variables. The results were analyzed using a weighted score
model and key variables were identified and then ranked using statistical testing. Alwi
(2003) described the causes of productivity loss in order of significance as: design
changes, labor issues, and poor management.
A more recent effort to document delay and cost overruns in less developed
regions of the world was completed by Frimprong and Oluwoye (2003). The study
focused on water projects in Ghana and was based in large part on the works of Arditi et
al. (1985), Dlakwa and Culpin (1990), Assaf et al. (1995), and Al-Momani (2000).
Utilizing a methodology similar to Assaf et al. (1995), they surveyed contractors, owners,
and consultants and used a similar statistical method to analyze the data. Similar to Assaf
et al. (1995), Frimprong and Oluwoye (2003) found financing, economic conditions,
natural conditions, and materials (resources) to be the top four causes.
25
In addition to the cost overrun findings previously cited in this chapter, Hsieh et
al. (2004) developed a list of change order causes based on a literature review and
investigated 90 public works projects in Taiwan. They first classified change orders into
categories and then analyzed projects by cost variance, schedule variance, frequency of
change orders, the total addition and subtraction due to change on a project, the
proportion of change on a project, and the contribution of change to a project. Using
analysis of variance to test the proportion and degree of change of each change category,
they found that most change orders arose from problems in planning and design (Hsieh et
al., 2004).
A pair of studies completed by Wu, Hsieh, and Cheng (2004) and Wu, Hsieh,
Cheng, and Lu (2005) was based on a case study analysis of over 1,000 change orders on
the Second National Highway project in Taiwan. Both studies cited a combination of
geological conditions and thoroughness of geologic survey during design as a primary
cause for most change orders (Wu et al., 2004, 2005). Wu et al. (2005) concluded, “In
the life cycle of construction engineering, the ratio on [sic] the cost of planning and
design is low, but its influence to the entire engineering is the largest of all.” These
results support the general theme of the previously cited research that design errors and
omissions are a leading cause of change orders and project change.
Georgy, Chang, and Zhang (2005) conducted research on the narrow sector of
industrial construction performance. They developed a questionnaire to measure
engineering performance in the industrial construction sector and surveyed 22 contractors
(Georgy et al., 2005). The data was analyzed using a variety of descriptive statistics and

26
efficiency measures developed by the authors. They found the primary causes of rework
to be design error (33%), vendor error (23%), and owner changes (20%) (Georgy et al.,
2005). This analysis contributes additional weight to the overall trend recognizing design
errors and omissions as leading causes of change orders.
Gunduz and Hanna (2005) used the same method that Hanna et al. (2002) used to
calculate productivity in Hanna’s earlier studies (1999a,b). However, they expanded the
detail of the previous studies by characterizing results by project size. While specific
results are difficult to generalize across the three classifications of small, medium, and
large, Gunduz and Hanna (2005) indicated that pre-construction activities and the amount
of change generally correlated with negative impacts on productivity.
The Nassar et al. (2005) study that focused on asphalt paving documented an
average 4% cost increase on asphalt projects and reported the primary cost overrun causal
factors to be unpredictable addition (unforeseen site conditions), differences between the
planned quantities and final needed quantities, environmental cleanup, and finally design
errors. These results are in concert with the other results reviewed so far, finding design
as a key causal issue of change orders.
The final effort reviewed is that of the previously cited effort of Günhan et al.
(2007) investigating public school construction. Although design errors were found to be
a cause of change orders, they were not a consistently high percentage of causes over the
study period (Günhan et al., 2007). Günhan et al. (2007) reported unforeseen site
conditions to be the only consistent source of change orders; owner changes, code
compliance issues, design errors and omissions, and other changes all fluctuated at
27
varying degrees over the study period. However, it should be noted that this finding was
based on data drawn from a single school district.
Department of Defense
The specific focus of the current research effort is the analysis of U.S. Air Force
MILCON projects. Past studies of MILCON and DoD work are quite comparable and
provide a good source of historical information with which to compare the results of the
present effort.
Rowland (1981), in the first study within the DoD to focus on change order rates,
studied change orders from the Southern Division of the Naval Facilities Engineering
Command (NAVFAC). By analyzing bid data collected from 19 projects using
descriptive statistics, Rowland (1981) identified three significant results: change order
rates increased as bid dispersion increased, change order rates increased as the size of the
project increased, and change order rates were highest in commercial construction
(followed by industrial and heavy construction). Rowland (1981) also highlighted the
difficulties of studying change orders because of the diversity of unrelated economic
factors that can affect a project (e.g., inflation, public policy, labor issues).
A subsequent Navy study utilized data collected from the Western Division of the
Naval Facilities Engineering Command. Rosmond (1984) utilized a broader data set in
terms of project numbers than the previous work by Rowland (1981); however, both were
limited to specific geographic regions. Rosmond (1984) investigated whether or not
contractors were low-bidding government contracts and attempting to use change orders
to compensate for low profit margin. Using regression and analysis of variance
28
(ANOVA), the study tested the correlation of change order rates with a number of
independent variables. No single variable, nor any combination of variables, were found
to account for the change order rates within the Western Division (Rosmond, 1984),
further demonstrating, as in Rowland’s (1981) study, the complexity of variables
affecting change rates. Rosmond (1984) particularly focused on competition measures
within the bidding environment but also included geographic area, quarter of the fiscal
year in which the project was awarded, and others. Interestingly, Cook’s (2006) work
provided contrasting results, showing both an increase in cost overruns for projects
awarded in the 4th quarter and a decrease in cost overruns in a highly competitive bid
environment. Cook’s (2006) data, however, covers a broad geographic range and the
spectrum of construction types.
A third Navy study completed in 1995 used a different approach. Instead of
analyzing data to find trends, Barrientez (1995) identified known causes for change
orders based on a combination of Navy guidance and industry standards used to
document changes. Barrientez (1995) then surveyed 58 completed projects from Corpus
Christi Naval Air Station to analyze cost and time data to determine the frequency with
which a predefined set of causes occurred. A second analysis was performed to
determine the frequency of known causes within various types of construction work (e.g.
electrical work, mechanical work, civil work, etc.). Barrientez (1995) found the
predominate source of change orders in the majority of construction types was owner
changes; in projects in which owner changes were not the predominate cause for change
orders, owner changes were still significant causes. Barrientez (1995) also found that
29
design errors comprised only 5% of the total cost of change orders. This represented a
significant departure from industry research in which design errors and omissions were
seen as a leading cause of change.
Finally, the most recent study to address change orders within the DoD, and
specifically the Air Force, was Cook’s (2006) work in which he developed a predictive
model of cost overruns of Air Force projects. The study found that the typical Air Force
Military Construction Project (MILCON) experienced a cost overrun of 11.6% (Cook,
2006). While his research focused on contingency budgets and cost overruns, the change
order is the primary vehicle by which contingency budgets are expended; therefore, Cook
(2006) concluded that the cost of change orders is being underestimated.
Summation
Industry research over the last 20 years has established a relatively small set of
causal factors regarding change orders, with design errors and omissions being the
leading factors. However, research on military construction projects has not been as
definitive. The next and final section of this chapter identifies the most common change
orders causes cited by the literature.
Synthesizing Existing Research
Because of the extent and breadth of information gathered during the literature
review, it was necessary to develop a method by which to synthesize a consensus of
common causal factors regarding change orders. Each research effort was thus studied
and the causes of change orders were identified. Because of the varied nature of the
30
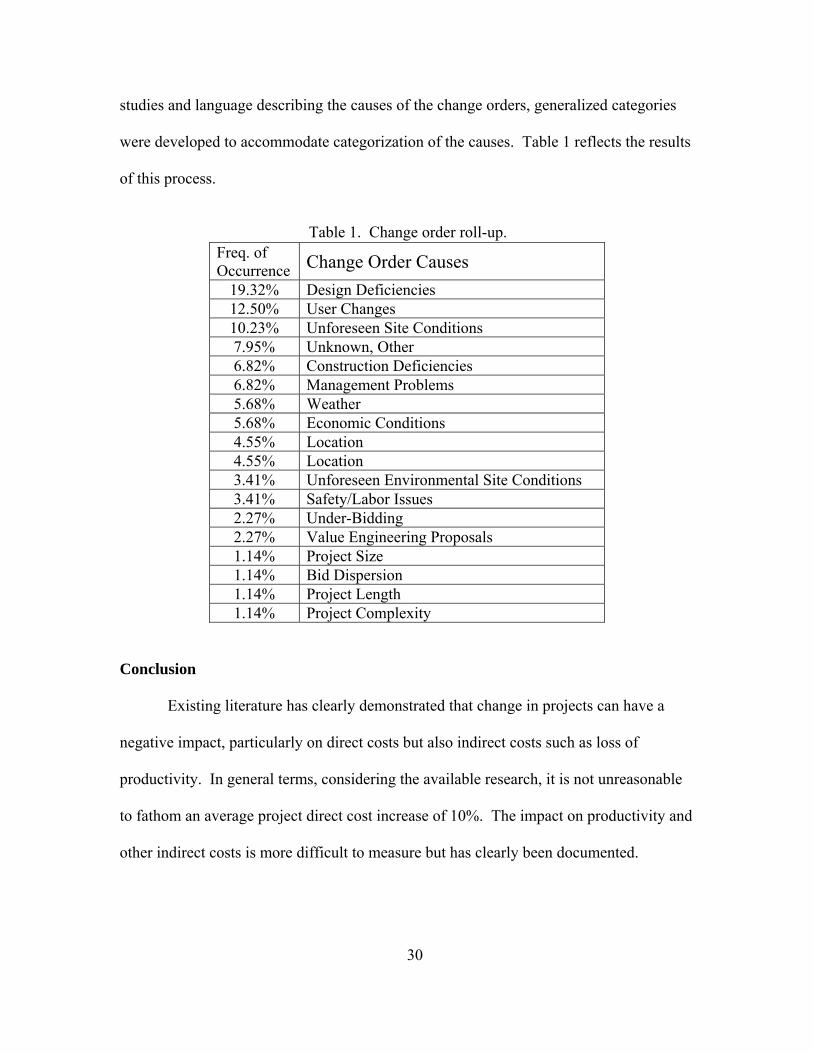
studies and language describing the causes of the change orders, generalized categories
were developed to accommodate categorization of the causes. Table 1 reflects the results
of this process.
Freq. of Occurrence Change Order Causes
19.32% Design Deficiencies 12.50% User Changes 10.23% Unforeseen Site Conditions 7.95% Unknown, Other 6.82% Construction Deficiencies 6.82% Management Problems 5.68% Weather 5.68% Economic Conditions 4.55% Location 4.55% Location 3.41% Unforeseen Environmental Site Conditions 3.41% Safety/Labor Issues 2.27% Under-Bidding 2.27% Value Engineering Proposals 1.14% Project Size 1.14% Bid Dispersion 1.14% Project Length 1.14% Project Complexity
Conclusion
Existing literature has clearly demonstrated that change in projects can have a
negative impact, particularly on direct costs but also indirect costs such as loss of
productivity. In general terms, considering the available research, it is not unreasonable
to fathom an average project direct cost increase of 10%. The impact on productivity and
other indirect costs is more difficult to measure but has clearly been documented.
Table 1. Change order roll-up.
31
Minimizing these impacts is clearly in the best interest of owners, designers, and
contractors.
Addressing these impacts requires an examination of their causes. A review of
existing literature clearly indicates a focus on design issues as a primary cause, followed
by user changes, unforeseen site conditions and a myriad of other causes (see Table 1).
Fortunately, these causes are perhaps the easiest, least expensive, and most practical to
address. The results of this review provide a vector by which to guide the research effort
of the current study.
32
Chapter 3. Methodology
As discussed in Chapter 1, change orders have a large impact on the annual
Military Construction (MILCON) program of the United States Air Force. Existing
research outlined in Chapter 2 showed the progress past efforts have made in
investigating the causes of change orders. This research effort builds on past efforts by
characterizing and analyzing the nature of change orders on MILCON projects across the
United States Air Force. Utilizing existing data collected from Air Force project
managers, descriptive and inferential statistics were used to gauge the magnitude of
change orders within the organization and detect trends or patterns of the causes of
change orders with the hope that this additional insight might help improve project
management performance. The research methodology consisted of four phases: data
collection, initial data analysis, categorization of data, and final data analysis. Each of
these phases will be discussed in this chapter.
Data Collection
In order to characterize MILCON change orders, a large amount of data on
existing projects, and particularly the change orders affecting them, was required. The
objective of this data collection effort was to obtain total project cost, both at the time of
contract award and at financial close out, and a cause and cost for each project
modification. The Air Force records this data primarily in two places: the project
manager’s project file and the Air Force’s Automated Civil Engineer System (ACES).
33
Data from within Project Manager’s Files
Data from the project manager’s files is provided in the form of financial
documentation of the project award and amendments provided by the contracting
authority. Contracting personnel provide MILCON project managers two forms that
document this information. The first is Standard Form (SF) 1442 which documents
contract award information. The second is the SF 30 which documents any changes to
the original project. Surveying these forms, particularly the SF 30, yielded the cost and
cause of a given change order. The SF 1442 was necessary because it contains the
original project data which was also required as part of this effort. Additionally, the SF
1442 form contains ancillary data such as location, the government agency overseeing the
project, the project requester, and other information that may be analyzed for trends not
directly attributable to a specific cause.
To collect the necessary data, a request was sent to the major command
(MAJCOM) MILCON project managers (PMs) through the Installations and Mission
Support office at Headquarters Air Force to provide the SF 1442 and SF 30s for each
MILCON project considered financially completed in 2002 through 2006. The year of
2002 was chosen because, generally speaking, information for projects after that date is
stored electronically. Additionally, because of the way the government contracts and
pays for projects, MILCON projects are not typically financially completed for a period
of time after the physical building has been completed during which all required
paperwork is accomplished. The requirement for financially completed projects is
necessary to screen out data that may change in the future. Although a review of SF 1442
34
and SF 30 forms is the preferred method of collecting data since these forms represent the
original source, it would require significant efforts that are unlikely to be supported by
the organizations being tasked to provide the information. Therefore, collecting the data
electronically is considered the most practical option.
Data from within ACES
The ACES system is a large electronic database utilized by civil engineers to
document, track, and issue reports on a number of organizational functions. Since part of
the system is dedicated to project management, Civil Engineering PMs report project data
to higher headquarters levels through this system. Accessing the database is
accomplished via a request to a central office and the data is provided rapidly at little
cost. Using data obtained from this system relies on the assumption that the system was
regularly and accurately updated. It also limits the amount of information that a project
manager can document by setting limits on the size of the field used to describe a change
order. This requires the project manager to distill the data from the SF 30 into a
description that will fit within the space provided by ACES. This decreases the fidelity
of the description of change orders.
Initial Data Analysis
The purpose of the initial data analysis was to empirically detect common trends
in the causes of change orders within Air Force MILCON projects. To effectively do
this, the change must be carefully attributed to causes that have meaning to the
organization so that the change (and cause) can be appropriately addressed. An initial list
35
of common causes was developed from information gathered during the literature review
in Chapter 2. Based upon their frequency of observation in previous research, the most
common change order causal factors identified in Chapter 2 are Design Deficiencies,
Unforeseen Site Conditions, Unforeseen Environmental Site Conditions, User Changes,
Unknowns, and Weather. These causes are defined (see Table 3, Chapter 4) to create a
standard by which change orders can be judged. This list was used as the basis for the
categorization of change order causes. When less common causes identified during the
literature or previously encountered causes were identified, new categories were created
and added to a “watch list.” The “watch list” served as a place holder for potential cause
categories that may or may not be meaningful (an example of a meaningless cause would
be a cause that is observed only a few times out of several thousand data points). The
change order causal factor list and the watch list were the vehicles by which the
categorization of the data took place.
Categorization of Data
Once a basic list of change order causes and their definitions were generated, each
change order was evaluated and assigned to one of the causal factor categories. During
this categorization, the geographic location and project name were hidden to guard
against researcher bias. As a further measure to prevent bias, the following protocol was
used to determine the cause of a given change order.
1. Read change order cause as listed on the SF 30.
36
2. Review the change order causal factor list and determine the appropriate
category, based on the category definitions, which most closely resembles the
change order cause from step 1. If a suitable causal factor is found, assign the
change order to that category and proceed to step 5; if not, proceed to step 3.
3. Review the “watch list” and determine the appropriate category, based on the
category definitions, which most closely resembles the change order cause
from step 1. If a suitable causal factor is found, assign the change order to
that category and proceed to step 5. If the cause of the change order is not on
the watch list, add an appropriate category to the list, define it, and proceed to
step 5; if not, proceed to step 4.
4. If no cause can be determined from the available information, classify the
change order as an unknown causal factor and proceed to step 5.
5. Verify that a causal factor category has been assigned to the change order,
then repeat the process for the next change order.
Once a change order was assigned to a causal factor category, it was changed only if
clear evidence emerged that the initial categorization was incorrect.
Final Data Analysis The final data analysis consisted of two steps: a descriptive characterization of
the data and a statistical analysis of the data. The descriptive characterization of the data
provided quantification of the costs of change in terms of cause. It also provided an
anecdotal assessment of how well the Air Force is managing the data in terms of how
37
much data could not be used due to lack of supporting information. The statistical
analysis of the data provided an evaluation of the impact of each change order cause and
a rank-order of the causes in terms of impact to the organization. Given the data to be
collected, a single-factor, one-way analysis of variance (ANOVA) test was initially
selected to evaluate the change order causal factors in terms of standardized cost, which
was defined as the change order cost as a percentage of the overall project cost. Utilizing
this test requires several assumptions be met: a) the data are independent and random, b)
the populations have approximately normal distributions, and c) the population variances
are equal (McClave, Benson, and Sincich, 2005). However, after an initial review of the
data, it was determined that the data violated the normality and homogeneity of variance
assumptions; therefore, the ANOVA test could not be used.
Because of the lack of normality and homogeneity of variance, this research used
the Kruskal-Wallis (KW) test, which is a nonparametric median comparison test in which
that data are either provided in rank order or are rank ordered by the researcher (Sheskin,
2007). This test requires that “a) the data has been randomly selected from the
population, b) the data is independent, c) the dependent variable is continuous, and d) the
underlying distributions from which the samples are derived are identical in shape”
(Sheskin, 2007). The data met these assumptions.
The general procedure, as outlined by Sheskin (2007), includes the following
steps: rank order the data, adjust rankings for any ties, sum the rankings to determine the
score per group (i.e., causal factor), and calculate the test statistic. The null hypothesis
for the procedure is (Sheskin, 2007): kH θθ ==K10 : . In other words, it is
38
hypothesized that the medians of each group are equal. The alternative hypothesis of the
test is (Sheskin, 2007): :1H Not 0H , which hypothesizes that the medians of at least
two groups differ. This is an important point of distinction; while the null hypothesis
indicates that all groups are equal, the alternative hypothesis does not state that all groups
differ; the alternative hypothesis states only that at least two differ (Sheskin, 2007). The
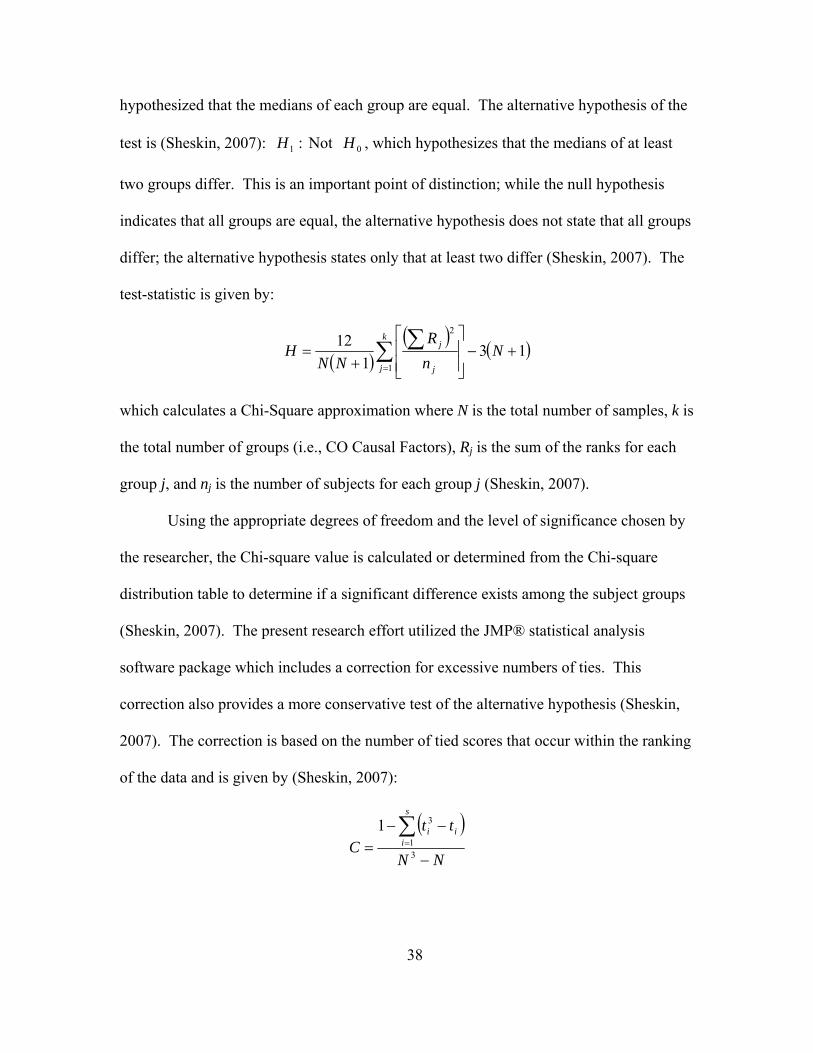
test-statistic is given by:
( )( ) ( )13
112
1
2
+−⎥⎥⎦
⎤
⎢⎢⎣
⎡
+= ∑ ∑
=
NnR
NNH
k
j j
j
which calculates a Chi-Square approximation where N is the total number of samples, k is
the total number of groups (i.e., CO Causal Factors), Rj is the sum of the ranks for each
group j, and nj is the number of subjects for each group j (Sheskin, 2007).
Using the appropriate degrees of freedom and the level of significance chosen by
the researcher, the Chi-square value is calculated or determined from the Chi-square
distribution table to determine if a significant difference exists among the subject groups
(Sheskin, 2007). The present research effort utilized the JMP® statistical analysis
software package which includes a correction for excessive numbers of ties. This
correction also provides a more conservative test of the alternative hypothesis (Sheskin,
2007). The correction is based on the number of tied scores that occur within the ranking
of the data and is given by (Sheskin, 2007):
( )NN
ttC
s
iii
−
−−=
∑=
31
31
39
where s is the number of sets of ties, ti is the number of tied scores in the ith set of ties,
and N is the total number of samples. The corrected test statistic is given by (Sheskin,
2007) as: HC = H/C.
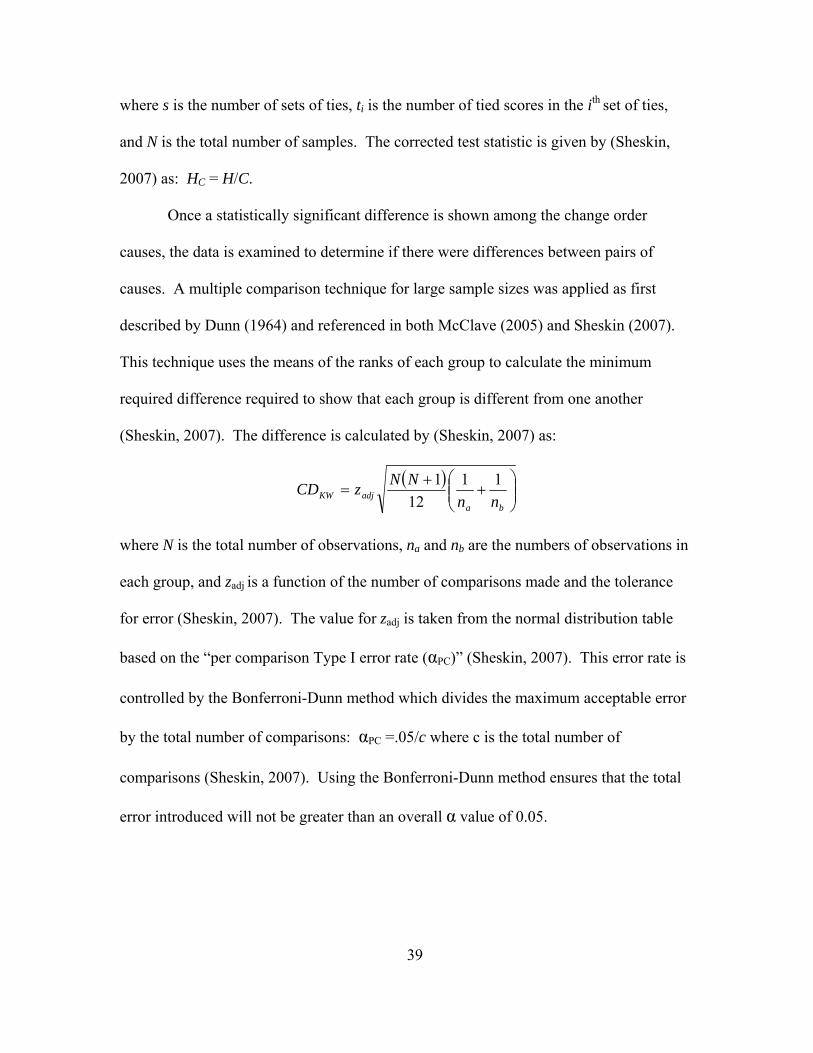
Once a statistically significant difference is shown among the change order
causes, the data is examined to determine if there were differences between pairs of
causes. A multiple comparison technique for large sample sizes was applied as first
described by Dunn (1964) and referenced in both McClave (2005) and Sheskin (2007).
This technique uses the means of the ranks of each group to calculate the minimum
required difference required to show that each group is different from one another
(Sheskin, 2007). The difference is calculated by (Sheskin, 2007) as:
( )⎟⎟⎠
⎞⎜⎜⎝
⎛+
+=
baadjKW nn
NNzCD 1112
1
where N is the total number of observations, na and nb are the numbers of observations in
each group, and zadj is a function of the number of comparisons made and the tolerance
for error (Sheskin, 2007). The value for zadj is taken from the normal distribution table
based on the “per comparison Type I error rate (αPC)” (Sheskin, 2007). This error rate is
controlled by the Bonferroni-Dunn method which divides the maximum acceptable error
by the total number of comparisons: αPC =.05/c where c is the total number of
comparisons (Sheskin, 2007). Using the Bonferroni-Dunn method ensures that the total
error introduced will not be greater than an overall α value of 0.05.
40
Conclusion
The methodology used four processes that collect and analyze data from existing
sources of U.S. Air Force project managers. Utilizing this methodology yields an
assessment of the most common causes of change within Air Force MILCON projects.
This assessment will show the magnitude of each cause and statistically assess which
causes have the greatest impact on projects. Chapter 4 discusses in detail each phase of
this methodology as implemented.
41
Chapter 4. Results
The results of the methodology outlined in Chapter 3 are presented in this chapter.
Discussed in detail are data collection, initial data analysis, categorization of data, and
final data analysis. The chapter concludes with a summary of the results.
Data Collection
During this portion of the methodology, data was collected from two sources.
The preferred approach of gathering data directly from the project manager’s files had
limited success. This was followed by a subsequent, successful effort to collect data from
the Automated Civil Engineer System (ACES) database.
Data from within Project Manager’s Files
A data request was submitted to Headquarters Air Force, Installations and
Mission Support Office, tasking Major Command (MAJCOM) Military Construction
(MILCON) project managers (PMs) to provide electronic copies of standard form (SF)
1442s and SF 30s of projects financially completed between 2002 and 2006. After three
months with no responses, a more targeted approach was used. A list of 200 projects
from the ACES database that met the criteria outlined in the original request was
generated and the request for data was reissued. The resulting response rate of 16% (see
Table 2 for responses) was insufficient to meet the research needs.
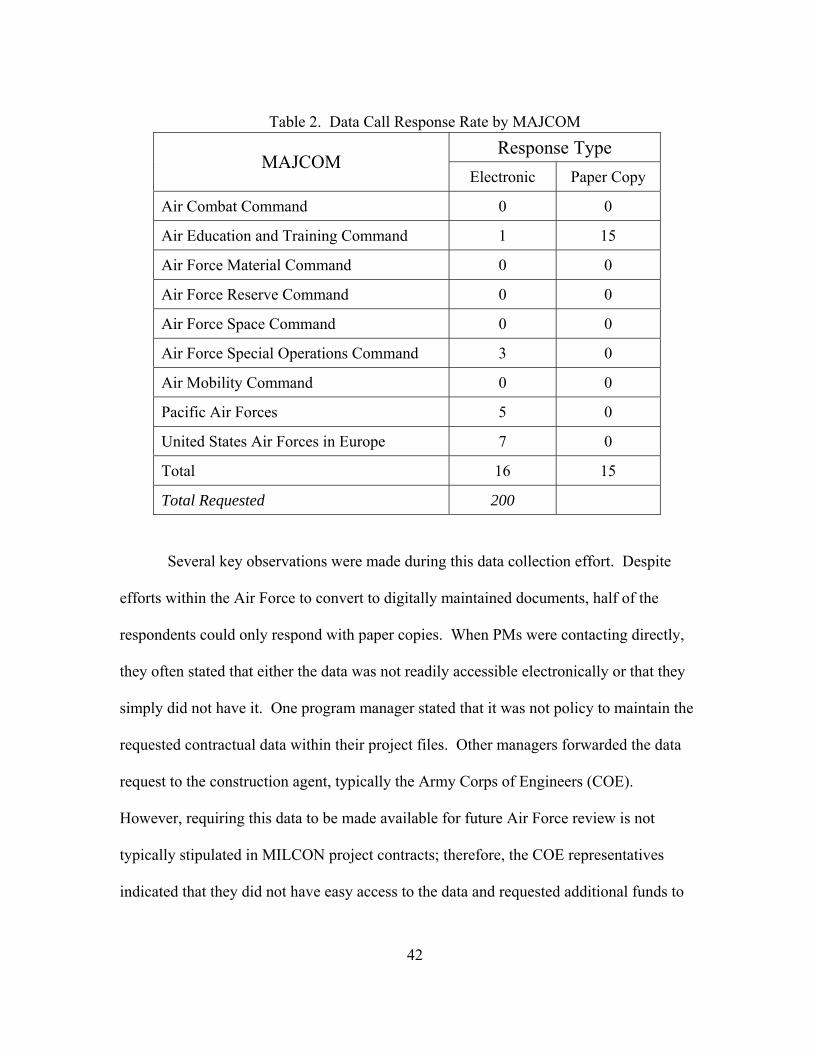
42
Response Type MAJCOM
Electronic Paper Copy
Air Combat Command 0 0
Air Education and Training Command 1 15
Air Force Material Command 0 0
Air Force Reserve Command 0 0
Air Force Space Command 0 0
Air Force Special Operations Command 3 0
Air Mobility Command 0 0
Pacific Air Forces 5 0
United States Air Forces in Europe 7 0
Total 16 15
Total Requested 200
Several key observations were made during this data collection effort. Despite
efforts within the Air Force to convert to digitally maintained documents, half of the
respondents could only respond with paper copies. When PMs were contacting directly,
they often stated that either the data was not readily accessible electronically or that they
simply did not have it. One program manager stated that it was not policy to maintain the
requested contractual data within their project files. Other managers forwarded the data
request to the construction agent, typically the Army Corps of Engineers (COE).
However, requiring this data to be made available for future Air Force review is not
typically stipulated in MILCON project contracts; therefore, the COE representatives
indicated that they did not have easy access to the data and requested additional funds to
Table 2. Data Call Response Rate by MAJCOM
43
pay for the necessary staff work. While no definitive conclusion can be drawn as to why
many program managers could not respond, it is clear that the data is not maintained in a
manner sufficient for easy recall at a later date.
Data from within ACES
The low response rate from MAJCOM program managers posed a severe
problem. Thirty-one projects did not yield a sufficient sample size from which to draw
statistical conclusions. Additionally, the data was concentrated primarily in one
MAJCOM, Air Education and Training Command (AETC), which would have skewed
the results. Therefore, ACES data from Cook’s (2006) prior research effort were used to
obtain the required project information. This data consisted of MILCON projects
financially completed from the years 2000 to 2004; this represented 326 projects with a
total of 5,286 change orders. However, many of the ACES data fields were either
incomplete or contained inconsistencies. Furthermore, 17% of the change orders lacked
complete information in the following fields: Basic Low Bid amount, Change Order
amount, and Change Order description. Therefore, only 278 projects, comprising 3,842
change orders, contained sufficient data. To avoid stratification between the ACES data
and the contractual data contained in the SF 1442 and SF 30 forms, the 31 projects
initially submitted were not used as part of the analysis.
Initial Data Analysis
The intent of this phase was to initiate a list of change order causes by which to
categorize the data. This initial list is outlined in Table 2 and is comprised of the most
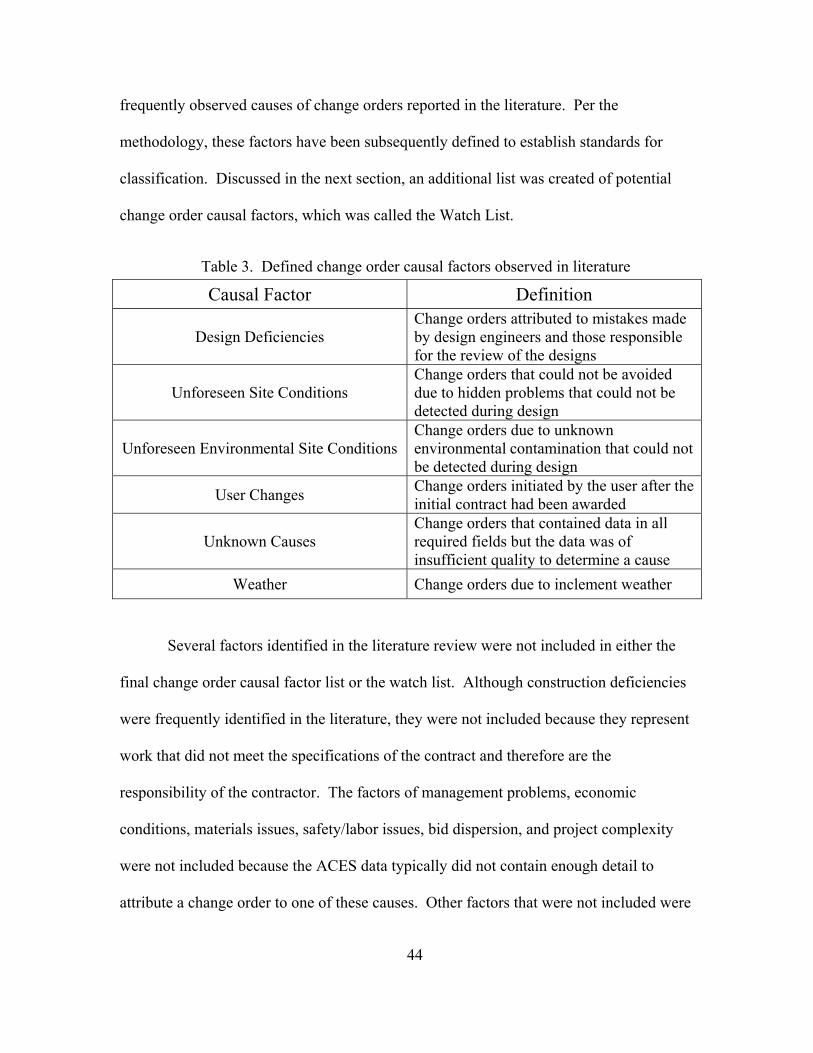
44
frequently observed causes of change orders reported in the literature. Per the
methodology, these factors have been subsequently defined to establish standards for
classification. Discussed in the next section, an additional list was created of potential
change order causal factors, which was called the Watch List.
Causal Factor Definition
Design Deficiencies Change orders attributed to mistakes made by design engineers and those responsible for the review of the designs
Unforeseen Site Conditions Change orders that could not be avoided due to hidden problems that could not be detected during design
Unforeseen Environmental Site Conditions Change orders due to unknown environmental contamination that could not be detected during design
User Changes Change orders initiated by the user after the initial contract had been awarded
Unknown Causes Change orders that contained data in all required fields but the data was of insufficient quality to determine a cause
Weather Change orders due to inclement weather
Several factors identified in the literature review were not included in either the
final change order causal factor list or the watch list. Although construction deficiencies
were frequently identified in the literature, they were not included because they represent
work that did not meet the specifications of the contract and therefore are the
responsibility of the contractor. The factors of management problems, economic
conditions, materials issues, safety/labor issues, bid dispersion, and project complexity
were not included because the ACES data typically did not contain enough detail to
attribute a change order to one of these causes. Other factors that were not included were
Table 3. Defined change order causal factors observed in literature
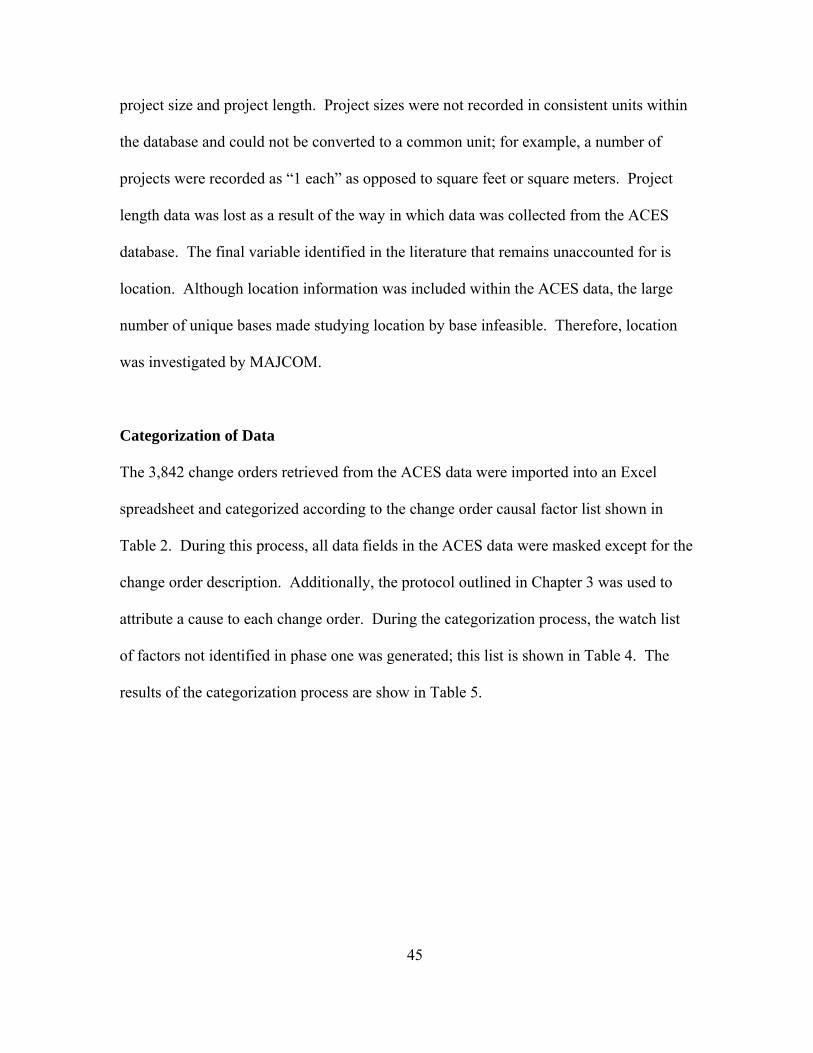
45
project size and project length. Project sizes were not recorded in consistent units within
the database and could not be converted to a common unit; for example, a number of
projects were recorded as “1 each” as opposed to square feet or square meters. Project
length data was lost as a result of the way in which data was collected from the ACES
database. The final variable identified in the literature that remains unaccounted for is
location. Although location information was included within the ACES data, the large
number of unique bases made studying location by base infeasible. Therefore, location
was investigated by MAJCOM.
Categorization of Data
The 3,842 change orders retrieved from the ACES data were imported into an Excel
spreadsheet and categorized according to the change order causal factor list shown in
Table 2. During this process, all data fields in the ACES data were masked except for the
change order description. Additionally, the protocol outlined in Chapter 3 was used to
attribute a cause to each change order. During the categorization process, the watch list
of factors not identified in phase one was generated; this list is shown in Table 4. The
results of the categorization process are show in Table 5.
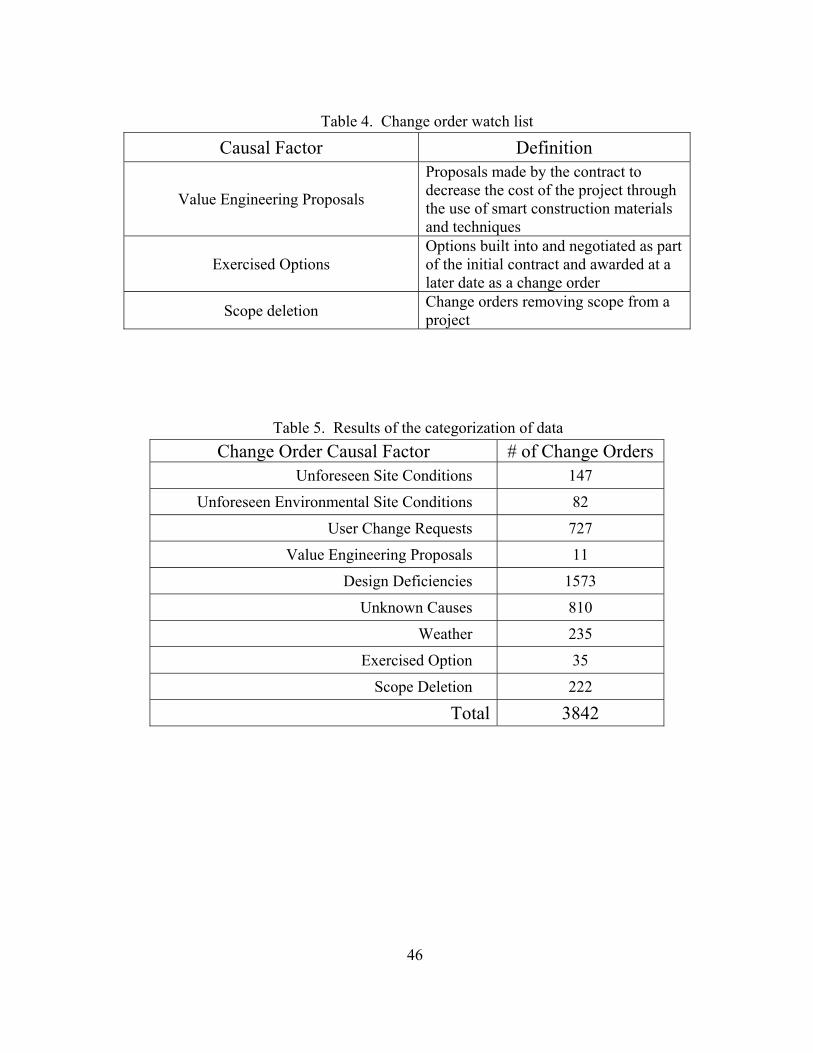
46
Causal Factor Definition
Value Engineering Proposals
Proposals made by the contract to decrease the cost of the project through the use of smart construction materials and techniques
Exercised Options Options built into and negotiated as part of the initial contract and awarded at a later date as a change order
Scope deletion Change orders removing scope from a project
Change Order Causal Factor # of Change Orders Unforeseen Site Conditions 147
Unforeseen Environmental Site Conditions 82
User Change Requests 727
Value Engineering Proposals 11
Design Deficiencies 1573
Unknown Causes 810
Weather 235
Exercised Option 35
Scope Deletion 222
Total 3842
Table 5. Results of the categorization of data
Table 4. Change order watch list
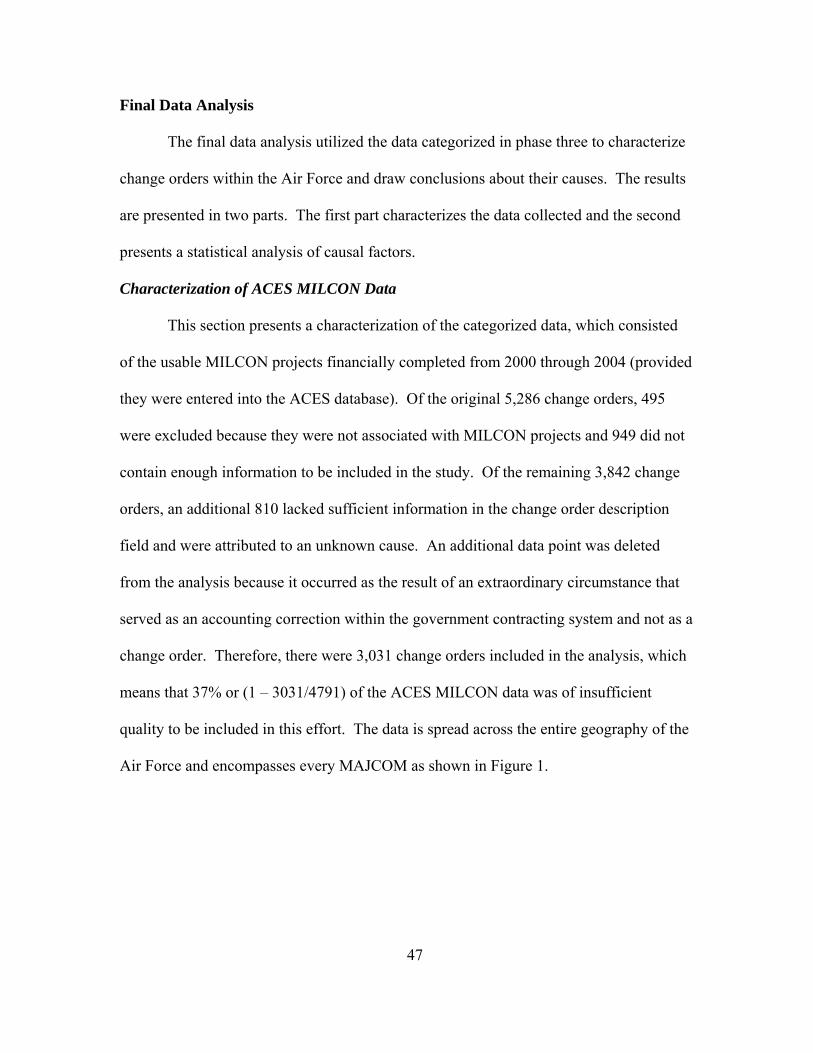
47
Final Data Analysis
The final data analysis utilized the data categorized in phase three to characterize
change orders within the Air Force and draw conclusions about their causes. The results
are presented in two parts. The first part characterizes the data collected and the second
presents a statistical analysis of causal factors.
Characterization of ACES MILCON Data
This section presents a characterization of the categorized data, which consisted
of the usable MILCON projects financially completed from 2000 through 2004 (provided
they were entered into the ACES database). Of the original 5,286 change orders, 495
were excluded because they were not associated with MILCON projects and 949 did not
contain enough information to be included in the study. Of the remaining 3,842 change
orders, an additional 810 lacked sufficient information in the change order description
field and were attributed to an unknown cause. An additional data point was deleted
from the analysis because it occurred as the result of an extraordinary circumstance that
served as an accounting correction within the government contracting system and not as a
change order. Therefore, there were 3,031 change orders included in the analysis, which
means that 37% or (1 – 3031/4791) of the ACES MILCON data was of insufficient
quality to be included in this effort. The data is spread across the entire geography of the
Air Force and encompasses every MAJCOM as shown in Figure 1.
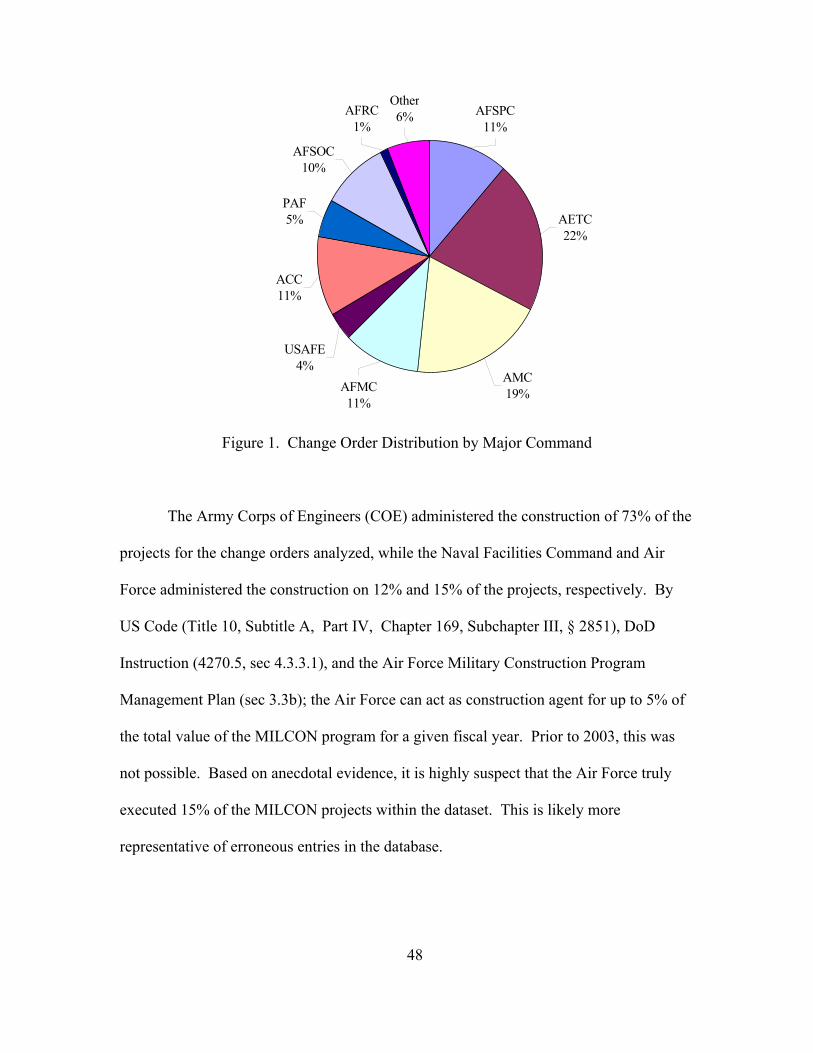
48
Other6% AFSPC
11%
AETC22%
AMC19%AFMC
11%
USAFE4%
ACC11%
PAF5%
AFSOC10%
AFRC1%
Figure 1. Change Order Distribution by Major Command
The Army Corps of Engineers (COE) administered the construction of 73% of the
projects for the change orders analyzed, while the Naval Facilities Command and Air
Force administered the construction on 12% and 15% of the projects, respectively. By
US Code (Title 10, Subtitle A, Part IV, Chapter 169, Subchapter III, § 2851), DoD
Instruction (4270.5, sec 4.3.3.1), and the Air Force Military Construction Program
Management Plan (sec 3.3b); the Air Force can act as construction agent for up to 5% of
the total value of the MILCON program for a given fiscal year. Prior to 2003, this was
not possible. Based on anecdotal evidence, it is highly suspect that the Air Force truly
executed 15% of the MILCON projects within the dataset. This is likely more
representative of erroneous entries in the database.
49
The categorization of the data is shown in Table 6. Speaking in a strictly
descriptive sense, exercised options averaged as the most expensive change orders,
costing $200,000 each and were also the most time consuming, causing an average delay
of 18 days per change order. Weather events (excluding disasters) caused the second
most delay at an average of 17 days per change order but cost, on the average, the least at
$1,700 each. There were 11 value engineering change orders that averaged $56,000 in
savings per change. Finally, the remaining factors conservatively averaged $25,000 in
cost and 6 days of delay per change
When considering the tabulated results in Table 6, it was clear that not all the data
could be compared as planned. First, 810 samples that were attributed to unknown
causes were excluded from analysis. While they serve as a metric of the ACES data
system, they do not yield useful information about the nature of change orders. Second,
there was an insufficient number of samples attributed to value engineering to make valid
comparisons to the other causal factors. Finally, the scope deletion and exercised options
categories posed a significant problem. While both may represent change order causes
on paper, they may also be considered coping behaviors. Project managers in the Air
Force use scope deletion to accommodate for projects that are outstripping budget
constraints and use exercised options to absorb excess contingency. These causes of
change orders are entirely within the project manager’s control. The remaining five
causal factors (unforeseen site conditions, unforeseen environmental site conditions, user
change requests, design deficiencies, and weather) all represent causal factors beyond the
control of the project manager.
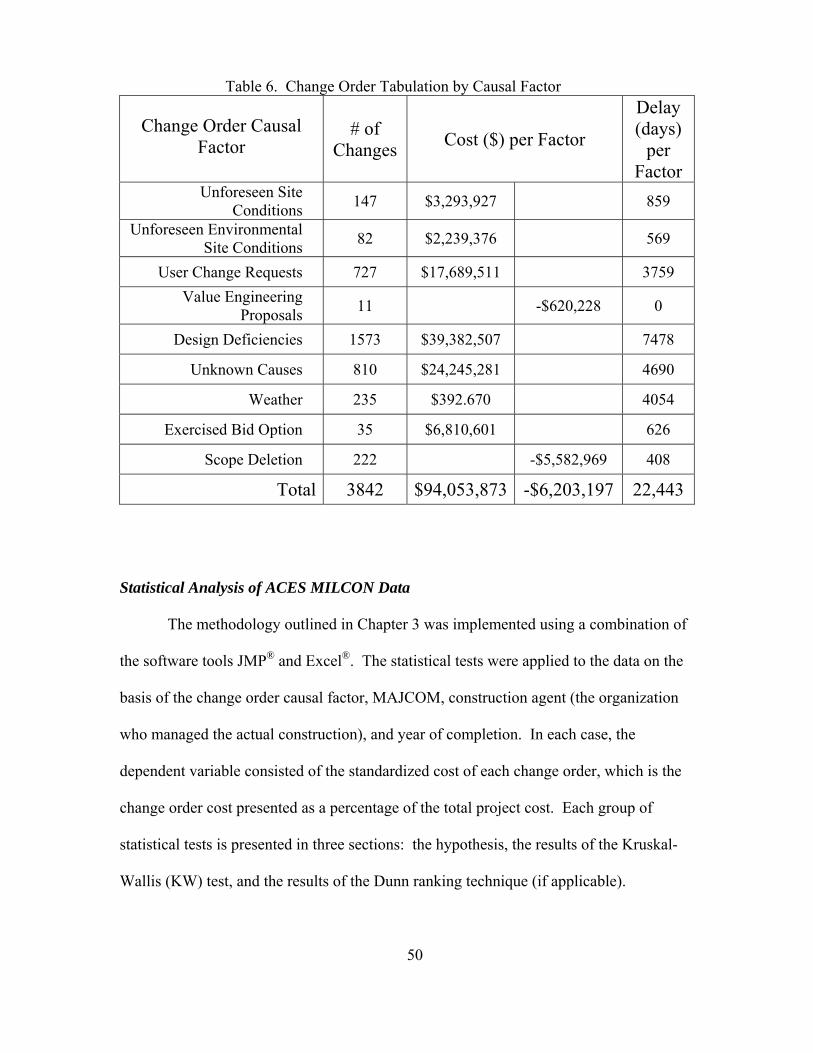
50
Change Order Causal
Factor # of
Changes Cost ($) per Factor
Delay (days)
per Factor
Unforeseen Site Conditions 147 $3,293,927 859
Unforeseen Environmental Site Conditions 82 $2,239,376 569
User Change Requests 727 $17,689,511 3759 Value Engineering
Proposals 11 -$620,228 0
Design Deficiencies 1573 $39,382,507 7478
Unknown Causes 810 $24,245,281 4690
Weather 235 $392.670 4054
Exercised Bid Option 35 $6,810,601 626
Scope Deletion 222 -$5,582,969 408
Total 3842 $94,053,873 -$6,203,197 22,443
Statistical Analysis of ACES MILCON Data
The methodology outlined in Chapter 3 was implemented using a combination of
the software tools JMP® and Excel®. The statistical tests were applied to the data on the
basis of the change order causal factor, MAJCOM, construction agent (the organization
who managed the actual construction), and year of completion. In each case, the
dependent variable consisted of the standardized cost of each change order, which is the
change order cost presented as a percentage of the total project cost. Each group of
statistical tests is presented in three sections: the hypothesis, the results of the Kruskal-
Wallis (KW) test, and the results of the Dunn ranking technique (if applicable).
Table 6. Change Order Tabulation by Causal Factor
51
Verifications of relevant assumptions are documented in the appendix. The error rate (α)
is 0.05 for all tests.
Analysis of ACES MILCON Data by Change Order Causal Factor
The causal factors of Unforeseen Site Conditions, Unforeseen Environmental Site
Conditions, User Change Requests, Design Deficiencies, and Weather were compared
using the KW test; verification of the relevant assumptions is provided in Appendix A.
The null hypothesis states that the medians of the population of each causal factor are
equal; in other words, kH θθθ === ...: 210 . The alternate hypothesis is that at least two
of the medians of the population of each causal factor are different where 1H : Not 0H .
The test statistic was calculated as 8199.430=CH . From the Chi-Square distribution
table (Sheskin, 2007), 49.92950. =χ with a p-value < 0.0001. Therefore, the null
hypothesis is rejected, which means that at least two of the change order causal factors
have different median values of their populations. The Dunn test was performed and the
results indicated that the median values for Unforeseen Site Conditions, Unforeseen
Environmental Site Conditions, User Changes, and Design Deficiencies were higher than
Weather. The only other significant difference was that Unforeseen Site Conditions had a
greater impact than User Changes.
These results did not provide the fidelity that had been hoped for. Probable
reasons for the lack of fidelity are discussed in the limitations section of Chapter 5.
However, it is clear that weather has the lowest impact on projects. The other four
categories can in some way be attributed to pre-construction activities. Site conditions,
user changes, and design deficiencies are causes that can be addressed through increased
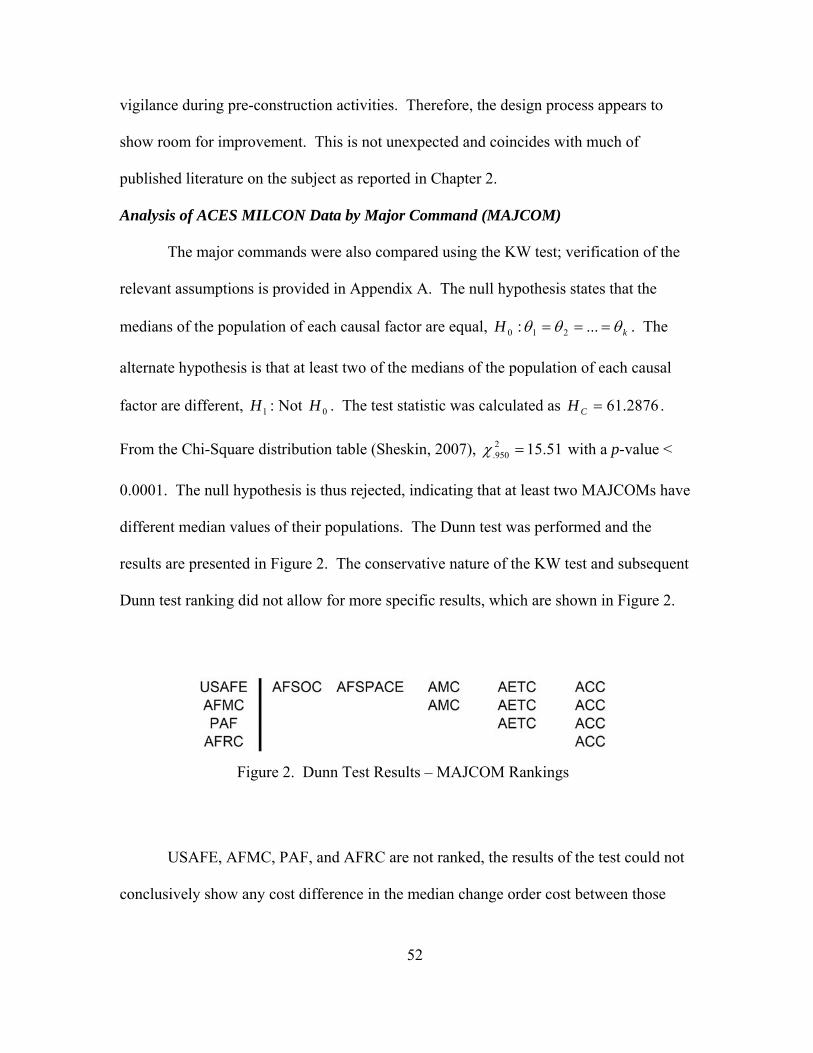
52
vigilance during pre-construction activities. Therefore, the design process appears to
show room for improvement. This is not unexpected and coincides with much of
published literature on the subject as reported in Chapter 2.
Analysis of ACES MILCON Data by Major Command (MAJCOM)
The major commands were also compared using the KW test; verification of the
relevant assumptions is provided in Appendix A. The null hypothesis states that the
medians of the population of each causal factor are equal, kH θθθ === ...: 210 . The
alternate hypothesis is that at least two of the medians of the population of each causal
factor are different, 1H : Not 0H . The test statistic was calculated as 2876.61=CH .
From the Chi-Square distribution table (Sheskin, 2007), 51.152950. =χ with a p-value <
0.0001. The null hypothesis is thus rejected, indicating that at least two MAJCOMs have
different median values of their populations. The Dunn test was performed and the
results are presented in Figure 2. The conservative nature of the KW test and subsequent
Dunn test ranking did not allow for more specific results, which are shown in Figure 2.
USAFE, AFMC, PAF, and AFRC are not ranked, the results of the test could not
conclusively show any cost difference in the median change order cost between those
Figure 2. Dunn Test Results – MAJCOM Rankings
53
commands. Figure 2 shows that the median cost of change orders in USAFE was higher
than the median cost of change orders in AFSOC, AFSPACE, AMC, AETC, and ACC;
the median cost of change orders in AFMC was higher than the median cost of change
orders in AMC, AETC and ACC; the median cost of change orders in PAF was higher
than the median cost of change orders in AETC and ACC; and finally the median cost of
change orders in AFRC was higher than the median cost of change orders in ACC. No
ranking of the commands on the right side of the table with one another can be implied
(for instance within USAFE, AFSOC is not greater than AFSPACE). Of the commands
with high medians, AFMC stands out. USAFE and PAF both execute projects overseas
and the data sample for AFRC was very small. While not conclusive, there is some
evidence to indicate that AFMC experienced more financial impact from change orders
than other commands. Interestingly, while the results on the right side of Figure 2 are not
presented in rank order, it is notable that ACC was the only command that had a lower
median than USAFE, AFRC, AFMC, and PAF. ACC showed a strikingly greater mean
difference when compared to the other commands (see Appendix C). The results are not
conclusive; however, evidence suggests that ACC may have lower cost impact from
change orders as opposed to other commands.
Analysis of ACES MILCON Data by Construction Agent.
The construction agents (Army Corps of Engineers, Naval Facilities Command,
and the Air Force) were also compared using the KW test; verification of assumptions is
provided in Appendix A. As with the previous tests, the null hypothesis states that the
medians of the population of each causal factor are equal, kH θθθ === ...: 210 . The
54
alternate hypothesis is that at least two of the medians of the population of each causal
factor are different, 1H : Not 0H . The test statistic was calculated as 7245.13=CH .
From the Chi-Square distribution table (Sheskin, 2007), 99.52950. =χ with a p-value <
0.001. The null hypothesis is thus rejected, which means that at least two construction
agents have different median values for their populations. The Dunn test was performed
and the median of the change order costs as a percentage of total project cost was higher
for the Air Force than both the Army Corps of Engineers and the Naval Facilities
Command. This test is very suspect and is not considered to be valid because of the
probable error discussed earlier regarding the dataset and the construction agent field.
However, this test does reveal that 15% of the projects, by a fairly wide margin, had
change order medians that did in fact exceed the median costs of the other two groups.
Analysis of ACES MILCON Data by Year
For the final analysis, the years of 2000 through 2004 were compared using the
KW; verification of assumptions is provided in Appendix A. The null hypothesis states
that the medians of the population of each causal factor are equal, kH θθθ === ...: 210
The alternate hypothesis is that at least two of the medians of the population of each
causal factor are different, 1H : Not 0H . The test statistic was calculated as
2240.19=CH . From the Chi-Square distribution table (Sheskin, 2007), 49.92950. =χ with
a p-value < 0.0007. The null hypothesis is thus rejected, indicating that at least two years
had statistically different medians. The Dunn test revealed that the year 2004 had a
higher median than all other years. However, the small sample size in relative
55
comparison to the other years makes this result somewhat suspect. Given the amount of
suspect error in the dataset, it is likely that additional project data from 2004 would yield
a different result.
Conclusion
Data collection was plagued by a low response rate and poor quality. When
statistical analysis was applied, some useful descriptive characteristics of the population
were tabulated. When the data were tested using the KW test, statistical differences were
found; however, due to the low quality of the data, the differences could not be
definitively ranked in most cases. The analysis does, however, suggest several courses
for further investigation. The results and potential uses of the results are discussed
further in Chapter 5.
56
Chapter 5. Conclusion
This chapter concludes the research effort with a discussion of the results, an
overview of limitations that affected the work, recommendations to Air Force project
managers (PMs), and some suggestions for future research.
Discussion of Results
The most profound result of this effort is the spotlight placed on the typical Air
Force civil engineer’s ability to capture and retain Military Construction (MILCON)
project information for future use. The response rate to the initial request for project data
was only 15.5% (31 of 200 projects). However, nearly half of the received project
documents were in hardcopy form (15 of 31), which would seem to indicate that
electronic documentation was not available. It was also noteworthy that PMs did not
appear to have a standardized list of project information they maintain.
While the PMs at Air Education and Training Command, Pacific Air Forces, and
Air Force Special Operations Command were responsive, other project managers either
overlooked the data request or were unable to provide the data. In the case of one major
command, project managers stated that they did not keep the requested records. Others
claimed the Army Corps of Engineers could not provide the data without additional
funding, thereby implying that they did not maintain the records themselves either. The
use of data from the Automated Civil Engineer System (ACES) in place of the data
sought in the initial request led to the discovery of more data housekeeping issues. When
57
the ACES system was reviewed, 37% of the data was either nonexistent or of such poor
quality that the specific change order could not be attributed to a cause.
The analysis of change order causal factors lacked enough fidelity to meet the
original research goal, which was to provide PMs with a definitive rank ordered list of
change order causal factors. It is clear that the most prevalent change causes are changes
due to pre-construction activities. Four of the change order causes (unforeseen site
conditions, unforeseen environmental site conditions, design deficiencies, and user
change requests) can be attributed in some manner and in varying levels to pre-
construction activities. Coupled with Cook’s (2006) work showing contingency budgets
are roughly half of what they should be, this seems to indicate there are systemic
problems in the Air Force design process.
Among the various major commands, there is some evidence to indicate that Air
Force Material Command has potentially higher median change order costs than its
stateside peers; by the same token, Air Combat Command seemed to have the lower
median change order costs. When considering the construction agent, the Air Force
seems to have higher median change order costs than both the Army Corps of Engineers
and the Naval Facilities Command. However, no specific reasons can be attributed to
these observations.
Given the accuracy and completeness of the data, these results remain
questionable. The methodology provided no means of checking for errors within the
ACES data. For example, according to the data, 15% of the 278 MILCON projects were
managed by the Air Force. While evidence is not presented as part of this effort, this
58
statistic seems unreasonably high based on anecdotal experience and suggests that the
data is not accurately and/or consistently entered into ACES. Unfortunately, the quality
of the ACES data adversely impacts the results and is a severe limitation.
Limitations
This research effort was primarily limited by the quality of the data, which was
considered strongly suspect for a number of reasons. Of the original 5,286 change
orders, 495 were excluded because they were incorrectly associated with MILCON
projects, 949 did not contain enough information to be included in the study, and 810
lacked sufficient information in the change order description field. In summary, 37% of
the ACES MILCON data was of insufficient quality to be included. The methodology
was not designed, nor did it provide for, error checking of the ACES data. The quality of
the data thus led to the use of the conservative Kruskal-Wallis test for the statistical
analysis. Utilizing contractual documents would have yielded results of higher fidelity
and quality; it would have also greatly minimized the occurrences of errors. Higher
quality data would perhaps have allowed the use of different testing techniques that
would have provided higher fidelity within the results.
Even with perfect data though, a cause still had to be subjectively attributed to
each change order. Within database systems such as ACES, and to a lesser extent even
the contract documents, there is not a standardized way of reporting the cause of a change
order. Therefore, the data is subject to some degree of bias from the researcher. The
change order description field often contains a single, short sentence that must be used to
59
attribute the change to a cause. Twenty-one percent of the change orders with
descriptions were excluded because they could not be attributed to a cause.
These results clearly demonstrate that the Air Force does not have an effective
means of capturing and recalling project data on change orders. As noted in the
Barrientez study (1995), the Navy uses a standardized set of change order causes in their
method of project documentation. The Air Force should perhaps investigate the
possibility of incorporating a similar standardized reporting system within ACES.
Recommendations
This research has generated two primary recommendations for Air Force
MILCON project managers. First, pre-construction activities seem to contribute the most
to cost overruns as the result of change orders. Therefore, project managers should take a
careful look at how their design review processes are accomplished. Any means by
which the process can be strengthened can only improve project performance. Second,
the results of this research indicate that historical project information is not easily
accessible (or even available) and is generally of poor quality. However, without
historical information, it is difficult to identify where past mistakes were made.
Therefore, it is imperative that base-level PMs be educated on the importance of tracking
historical data and the insight it can provide.
On a broader scale, the major command program managers and Air Force
leadership should consider some type of management plan for historical project
information that makes it easily accessible. Presently, the information that is contained in
60
the ACES database is relatively inaccessible to the local PM by the complicated nature of
the report retrieval software. If local PMs found the ACES system more useful in their
day-to-day jobs, there would be more incentive to input and maintain the accuracy of the
data, thereby benefiting both parties.
Future Research
This effort has generated a number of interesting potential lines of investigation.
Were this study to be repeated, perhaps a better strategy would be to select a
representative sample of bases and analyze MILCON work at each base
comprehensively. It is clear that the cost overrun data that is presently available is of
inadequate quality to definitively identify any causal trends.
Among the major commands, Air Combat Command seems to have a lower
median change order cost compared with the other commands. What is Air Combat
Command doing differently that other commands when it comes to the management of
MILCON projects? By the same token, why does Air Force Material Command seem to
have higher median change order costs?
What are the systematic problems within the Air Force design process? It seems
clear that the design process and other pre-construction activities can be improved to
some degree. Where is the process weak and what are the best strategies to strengthen it?
Closely associated with these processes, project management training and processes
could prove valuable, particularly by focusing on pre-construction activities.
61
Additionally, research considering the type and level of cost management most
appropriate to the Air Force would be beneficial. What type of historical project
information is used by the private sector and are similar methods applicable to the Air
Force? What changes could be made to the ACES system to increase the quality of the
data it captures? This effort has made it clear that the Air Force is underutilizing a large
pool of potentially valuable data. How can the Air Force tap this resource and effectively
exploit the data to improve project performance?
Finally, the data used by the present effort is somewhat obsolete, focusing on
projects from 2000 to 2004. With each passing year, more data becomes available.
Future efforts aimed at improving the methodology used in this research and focusing on
the intricacies of ACES data should yield better results with higher fidelity.
Conclusion
This research represents a snapshot in time from 2000 to 2004. It is subject to the
weaknesses of the limitations of the available data. Therefore, very conservative
statistical testing was used to analyze the data. The results indicate that pre-construction
activities (unforeseen site conditions, unforeseen environmental site conditions, user
changes, and design deficiencies) are the major contributors to cost overrun on MILCON
projects, which is further supported by other research reported in the literature.
Consequently, the Air Force should focus improvement efforts on pre-construction
activities (i.e., the design and design review processes).

62
Appendices
A. Verification of Assumptions B. JMP® Output C. Dunn Results
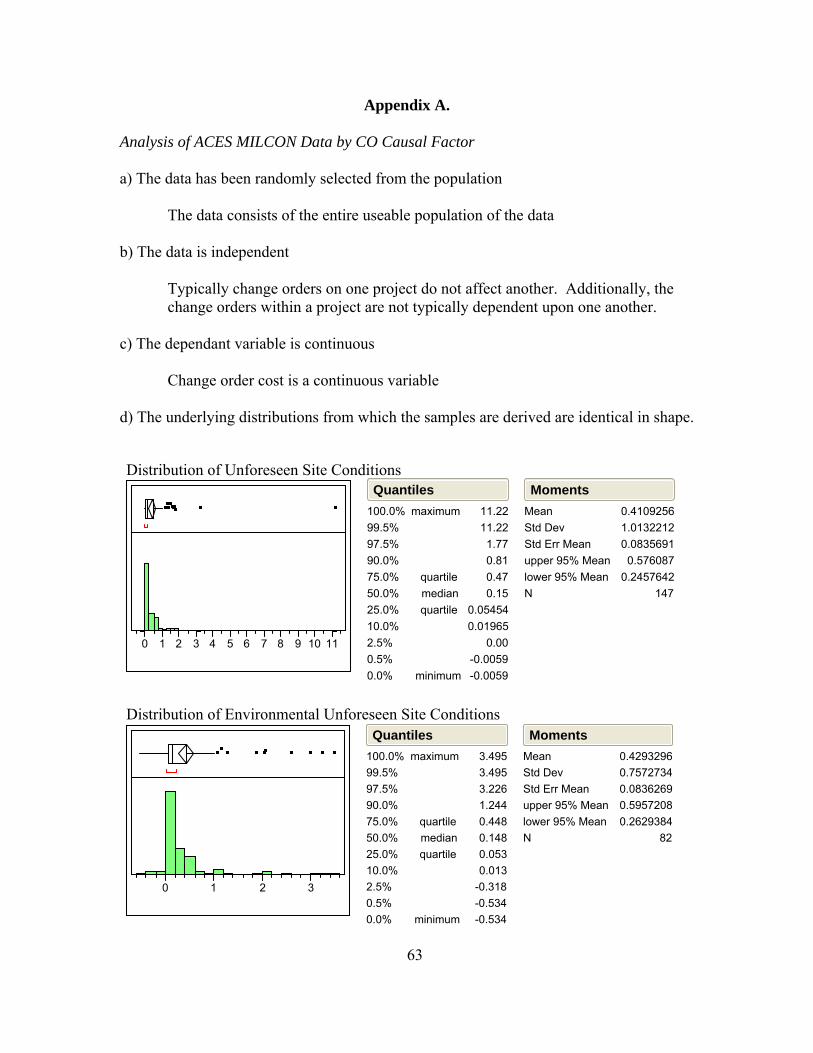
63
Appendix A.
Analysis of ACES MILCON Data by CO Causal Factor
a) The data has been randomly selected from the population The data consists of the entire useable population of the data b) The data is independent
Typically change orders on one project do not affect another. Additionally, the change orders within a project are not typically dependent upon one another.
c) The dependant variable is continuous Change order cost is a continuous variable d) The underlying distributions from which the samples are derived are identical in shape.
0 1 2 3 4 5 6 7 8 9 10 11
100.0%99.5%97.5%90.0%75.0%50.0%25.0%10.0%2.5%0.5%0.0%
maximum
quartilemedianquartile
minimum
11.2211.221.770.810.470.15
0.054540.01965
0.00-0.0059-0.0059
QuantilesMeanStd DevStd Err Meanupper 95% Meanlower 95% MeanN
0.41092561.01322120.08356910.576087
0.2457642147
Moments
Distribution of Unforeseen Site Conditions
0 1 2 3
100.0%99.5%97.5%90.0%75.0%50.0%25.0%10.0%2.5%0.5%0.0%
maximum
quartilemedianquartile
minimum
3.4953.4953.2261.2440.4480.1480.0530.013
-0.318-0.534-0.534
QuantilesMeanStd DevStd Err Meanupper 95% Meanlower 95% MeanN
0.42932960.75727340.08362690.59572080.2629384
82
MomentsDistribution of Environmental Unforeseen Site Conditions
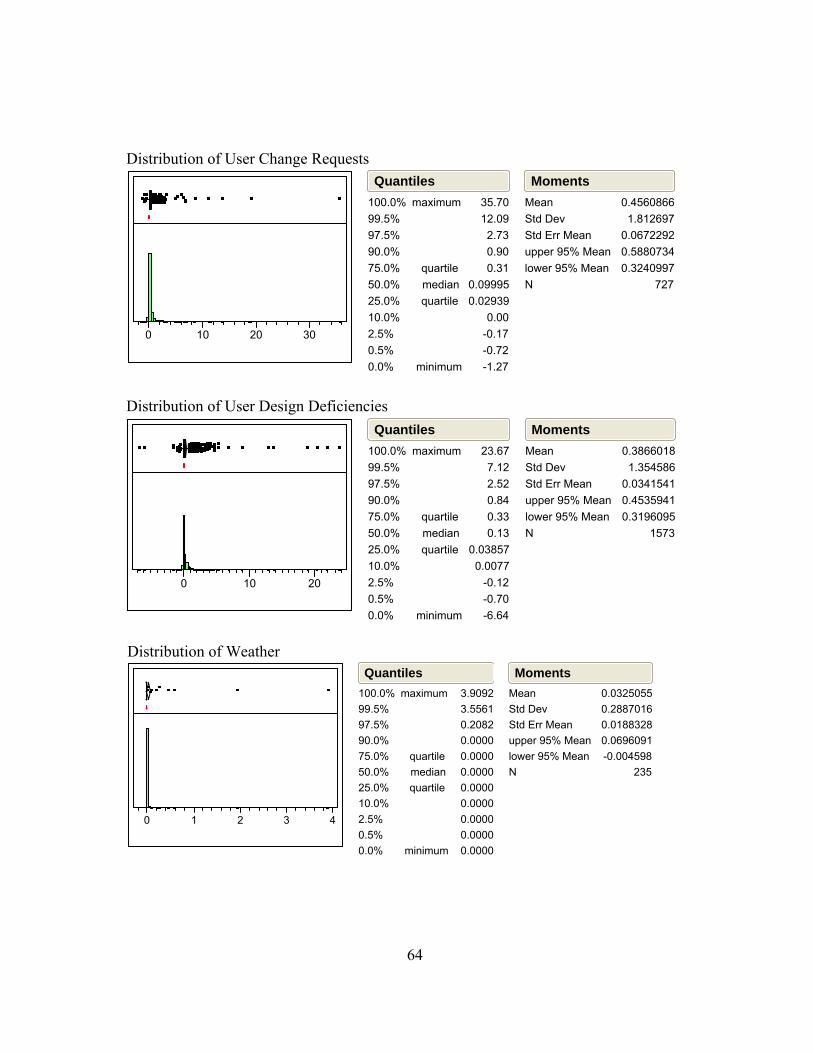
64
Distribution of User Change Requests
0 10 20 30
100.0%99.5%97.5%90.0%75.0%50.0%25.0%10.0%2.5%0.5%0.0%
maximum
quartilemedianquartile
minimum
35.7012.092.730.900.31
0.099950.02939
0.00-0.17-0.72-1.27
QuantilesMeanStd DevStd Err Meanupper 95% Meanlower 95% MeanN
0.45608661.812697
0.06722920.58807340.3240997
727
Moments
Distribution of User Design Deficiencies
0 10 20
100.0%99.5%97.5%90.0%75.0%50.0%25.0%10.0%2.5%0.5%0.0%
maximum
quartilemedianquartile
minimum
23.677.122.520.840.330.13
0.038570.0077
-0.12-0.70-6.64
QuantilesMeanStd DevStd Err Meanupper 95% Meanlower 95% MeanN
0.38660181.354586
0.03415410.45359410.3196095
1573
Moments
Distribution of Weather
0 1 2 3 4
100.0%99.5%97.5%90.0%75.0%50.0%25.0%10.0%2.5%0.5%0.0%
maximum
quartilemedianquartile
minimum
3.90923.55610.20820.00000.00000.00000.00000.00000.00000.00000.0000
QuantilesMeanStd DevStd Err Meanupper 95% Meanlower 95% MeanN
0.03250550.28870160.01883280.0696091-0.004598
235
Moments
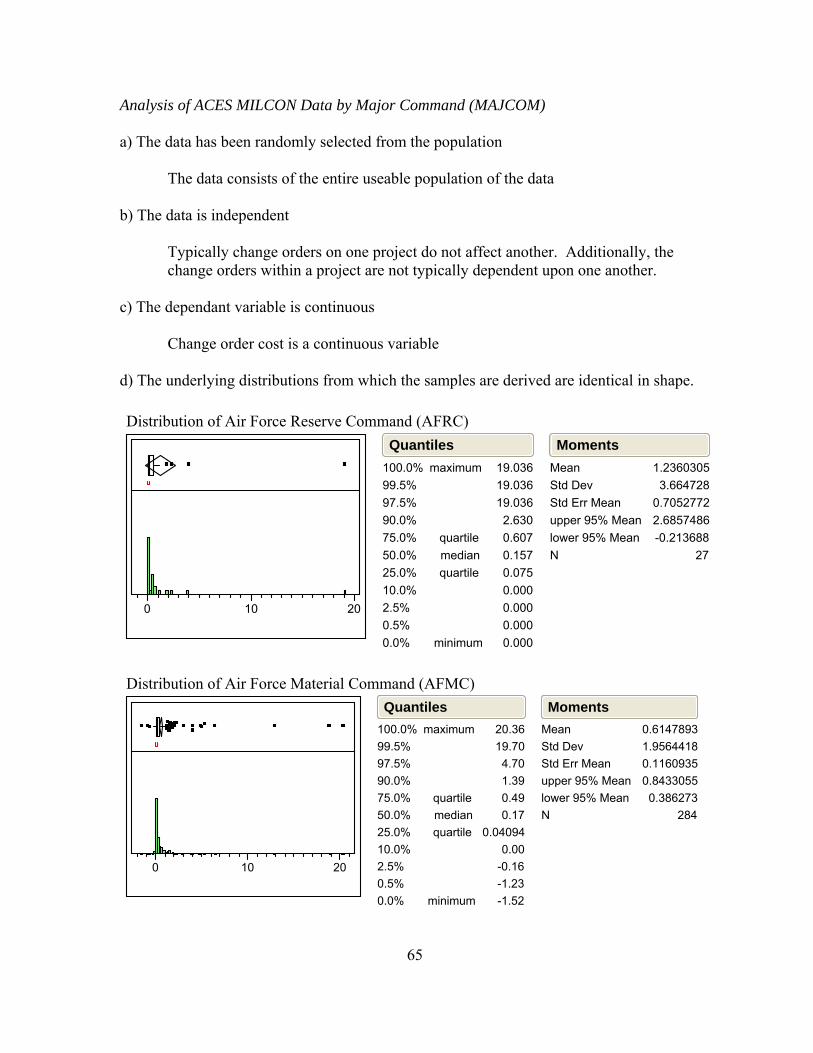
65
Analysis of ACES MILCON Data by Major Command (MAJCOM)
a) The data has been randomly selected from the population The data consists of the entire useable population of the data b) The data is independent
Typically change orders on one project do not affect another. Additionally, the change orders within a project are not typically dependent upon one another.
c) The dependant variable is continuous Change order cost is a continuous variable d) The underlying distributions from which the samples are derived are identical in shape.
Distribution of Air Force Reserve Command (AFRC)
0 10 20
100.0%99.5%97.5%90.0%75.0%50.0%25.0%10.0%2.5%0.5%0.0%
maximum
quartilemedianquartile
minimum
19.03619.03619.0362.6300.6070.1570.0750.0000.0000.0000.000
QuantilesMeanStd DevStd Err Meanupper 95% Meanlower 95% MeanN
1.23603053.664728
0.70527722.6857486-0.213688
27
Moments
Distribution of Air Force Material Command (AFMC)
0 10 20
100.0%99.5%97.5%90.0%75.0%50.0%25.0%10.0%2.5%0.5%0.0%
maximum
quartilemedianquartile
minimum
20.3619.704.701.390.490.17
0.040940.00
-0.16-1.23-1.52
QuantilesMeanStd DevStd Err Meanupper 95% Meanlower 95% MeanN
0.61478931.95644180.11609350.84330550.386273
284
Moments
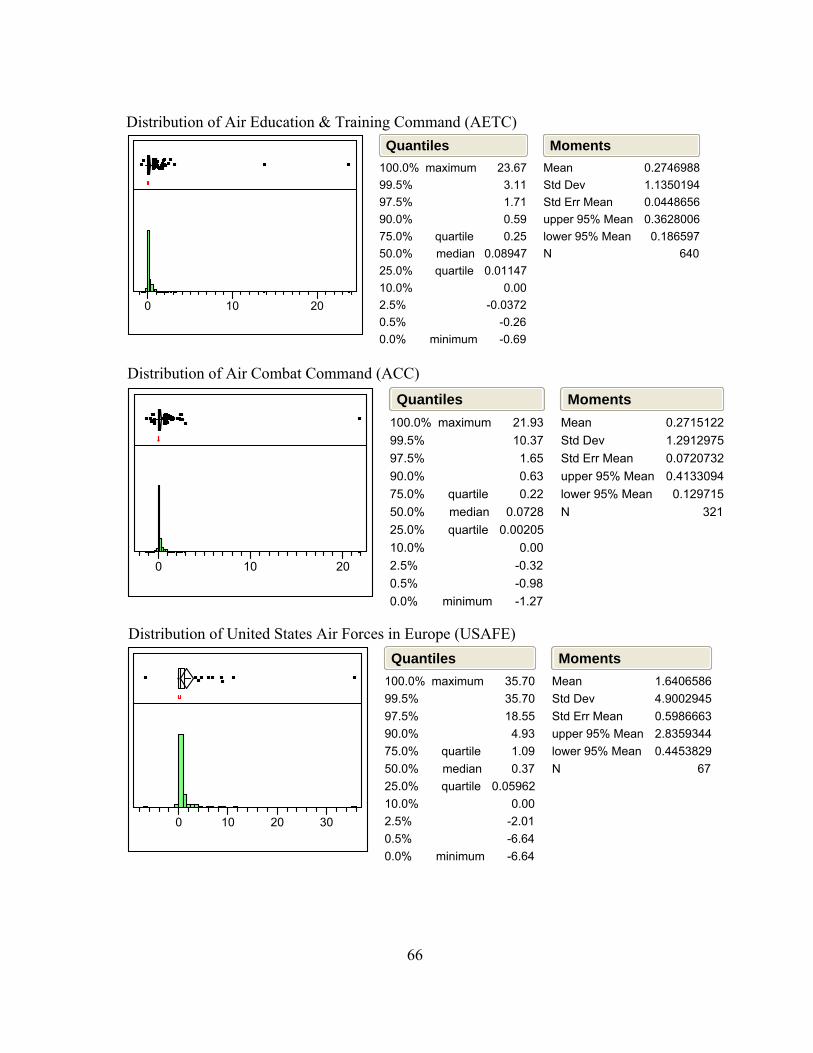
66
Distribution of Air Education & Training Command (AETC)
0 10 20
100.0%99.5%97.5%90.0%75.0%50.0%25.0%10.0%2.5%0.5%0.0%
maximum
quartilemedianquartile
minimum
23.673.111.710.590.25
0.089470.01147
0.00-0.0372
-0.26-0.69
QuantilesMeanStd DevStd Err Meanupper 95% Meanlower 95% MeanN
0.27469881.13501940.04486560.36280060.186597
640
Moments
Distribution of Air Combat Command (ACC)
0 10 20
100.0%99.5%97.5%90.0%75.0%50.0%25.0%10.0%2.5%0.5%0.0%
maximum
quartilemedianquartile
minimum
21.9310.371.650.630.22
0.07280.00205
0.00-0.32-0.98-1.27
QuantilesMeanStd DevStd Err Meanupper 95% Meanlower 95% MeanN
0.27151221.29129750.07207320.41330940.129715
321
Moments
0 10 20 30
100.0%99.5%97.5%90.0%75.0%50.0%25.0%10.0%2.5%0.5%0.0%
maximum
quartilemedianquartile
minimum
35.7035.7018.554.931.090.37
0.059620.00
-2.01-6.64-6.64
QuantilesMeanStd DevStd Err Meanupper 95% Meanlower 95% MeanN
1.64065864.90029450.59866632.83593440.4453829
67
Moments
Distribution of United States Air Forces in Europe (USAFE)
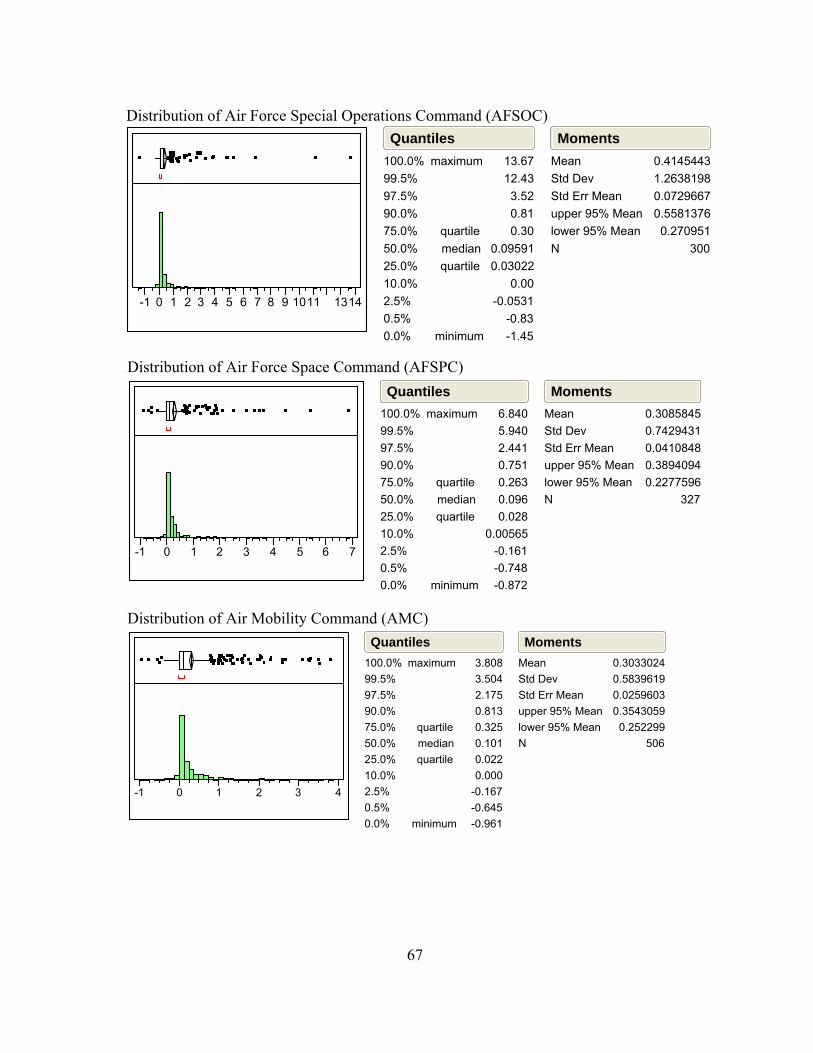
67
-1 0 1 2 3 4 5 6 7 8 9 1011 1314
100.0%99.5%97.5%90.0%75.0%50.0%25.0%10.0%2.5%0.5%0.0%
maximum
quartilemedianquartile
minimum
13.6712.433.520.810.30
0.095910.03022
0.00-0.0531
-0.83-1.45
QuantilesMeanStd DevStd Err Meanupper 95% Meanlower 95% MeanN
0.41454431.26381980.07296670.55813760.270951
300
Moments
Distribution of Air Force Special Operations Command (AFSOC)
Distribution of Air Force Space Command (AFSPC)
-1 0 1 2 3 4 5 6 7
100.0%99.5%97.5%90.0%75.0%50.0%25.0%10.0%2.5%0.5%0.0%
maximum
quartilemedianquartile
minimum
6.8405.9402.4410.7510.2630.0960.028
0.00565-0.161-0.748-0.872
QuantilesMeanStd DevStd Err Meanupper 95% Meanlower 95% MeanN
0.30858450.74294310.04108480.38940940.2277596
327
Moments
Distribution of Air Mobility Command (AMC)
-1 0 1 2 3 4
100.0%99.5%97.5%90.0%75.0%50.0%25.0%10.0%2.5%0.5%0.0%
maximum
quartilemedianquartile
minimum
3.8083.5042.1750.8130.3250.1010.0220.000
-0.167-0.645-0.961
QuantilesMeanStd DevStd Err Meanupper 95% Meanlower 95% MeanN
0.30330240.58396190.02596030.35430590.252299
506
Moments
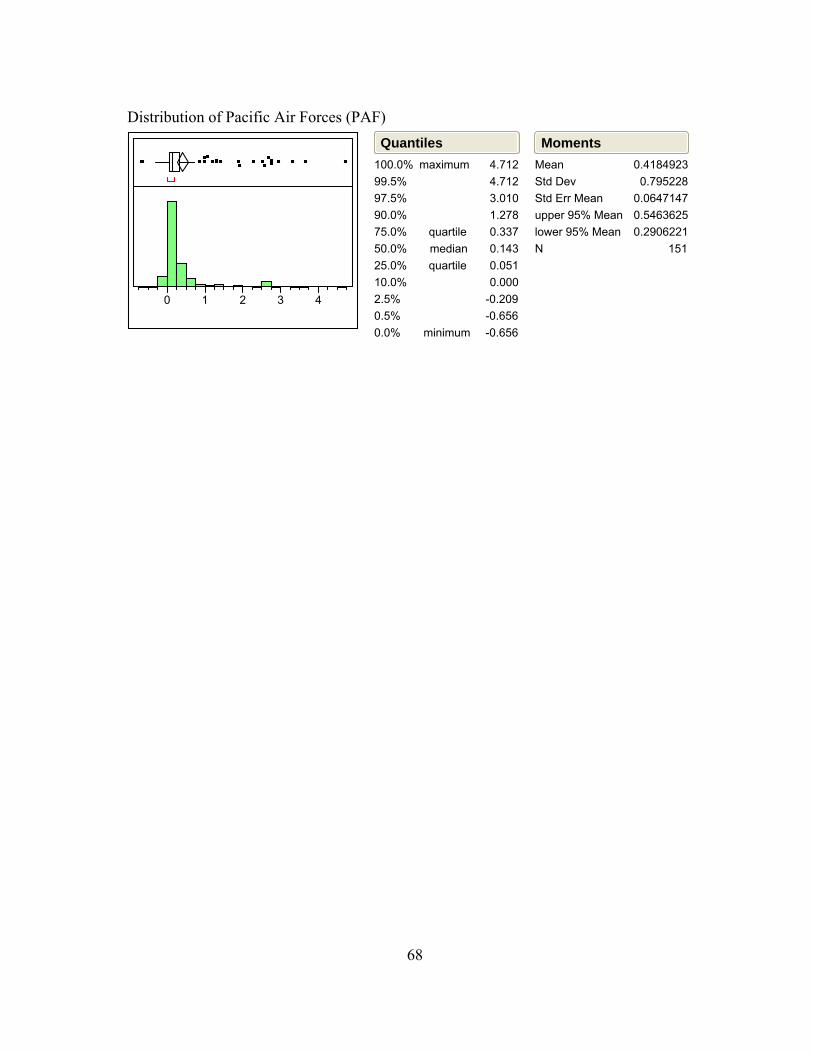
68
Distribution of Pacific Air Forces (PAF)
0 1 2 3 4
100.0%99.5%97.5%90.0%75.0%50.0%25.0%10.0%2.5%0.5%0.0%
maximum
quartilemedianquartile
minimum
4.7124.7123.0101.2780.3370.1430.0510.000
-0.209-0.656-0.656
QuantilesMeanStd DevStd Err Meanupper 95% Meanlower 95% MeanN
0.41849230.795228
0.06471470.54636250.2906221
151
Moments
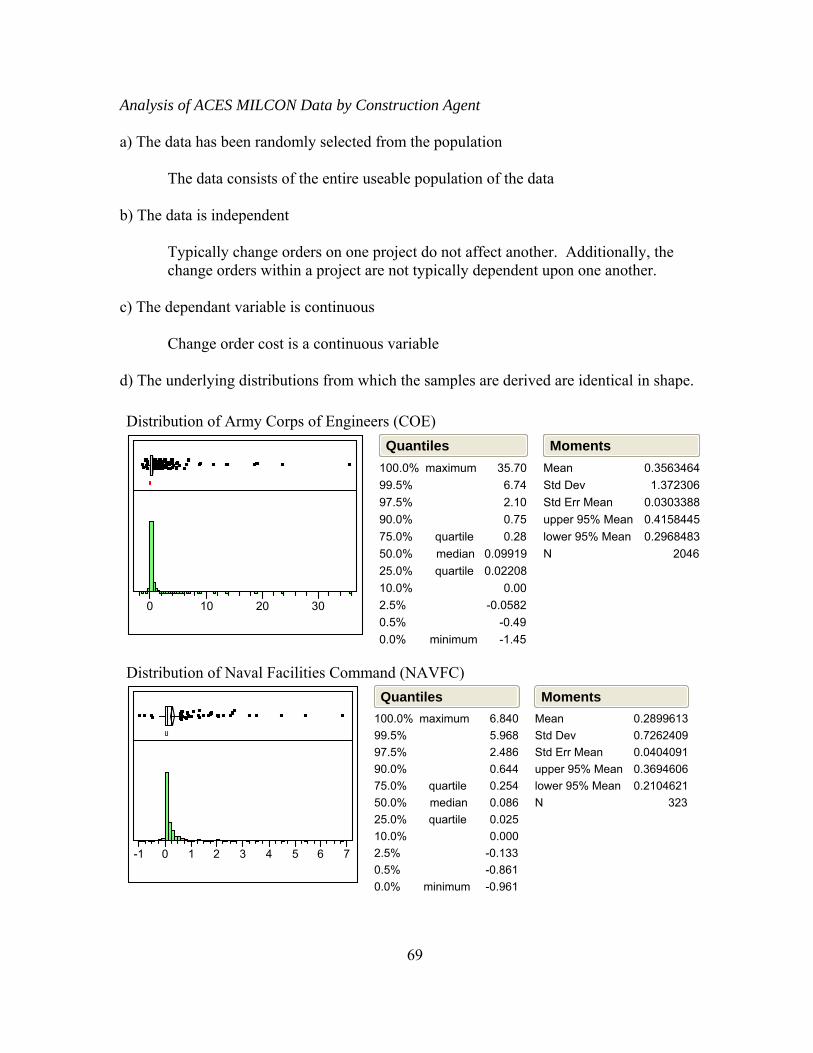
69
Analysis of ACES MILCON Data by Construction Agent
a) The data has been randomly selected from the population The data consists of the entire useable population of the data b) The data is independent
Typically change orders on one project do not affect another. Additionally, the change orders within a project are not typically dependent upon one another.
c) The dependant variable is continuous Change order cost is a continuous variable d) The underlying distributions from which the samples are derived are identical in shape.
Distribution of Army Corps of Engineers (COE)
0 10 20 30
100.0%99.5%97.5%90.0%75.0%50.0%25.0%10.0%2.5%0.5%0.0%
maximum
quartilemedianquartile
minimum
35.706.742.100.750.28
0.099190.02208
0.00-0.0582
-0.49-1.45
QuantilesMeanStd DevStd Err Meanupper 95% Meanlower 95% MeanN
0.35634641.372306
0.03033880.41584450.2968483
2046
Moments
Distribution of Naval Facilities Command (NAVFC)
-1 0 1 2 3 4 5 6 7
100.0%99.5%97.5%90.0%75.0%50.0%25.0%10.0%2.5%0.5%0.0%
maximum
quartilemedianquartile
minimum
6.8405.9682.4860.6440.2540.0860.0250.000
-0.133-0.861-0.961
QuantilesMeanStd DevStd Err Meanupper 95% Meanlower 95% MeanN
0.28996130.72624090.04040910.36946060.2104621
323
Moments
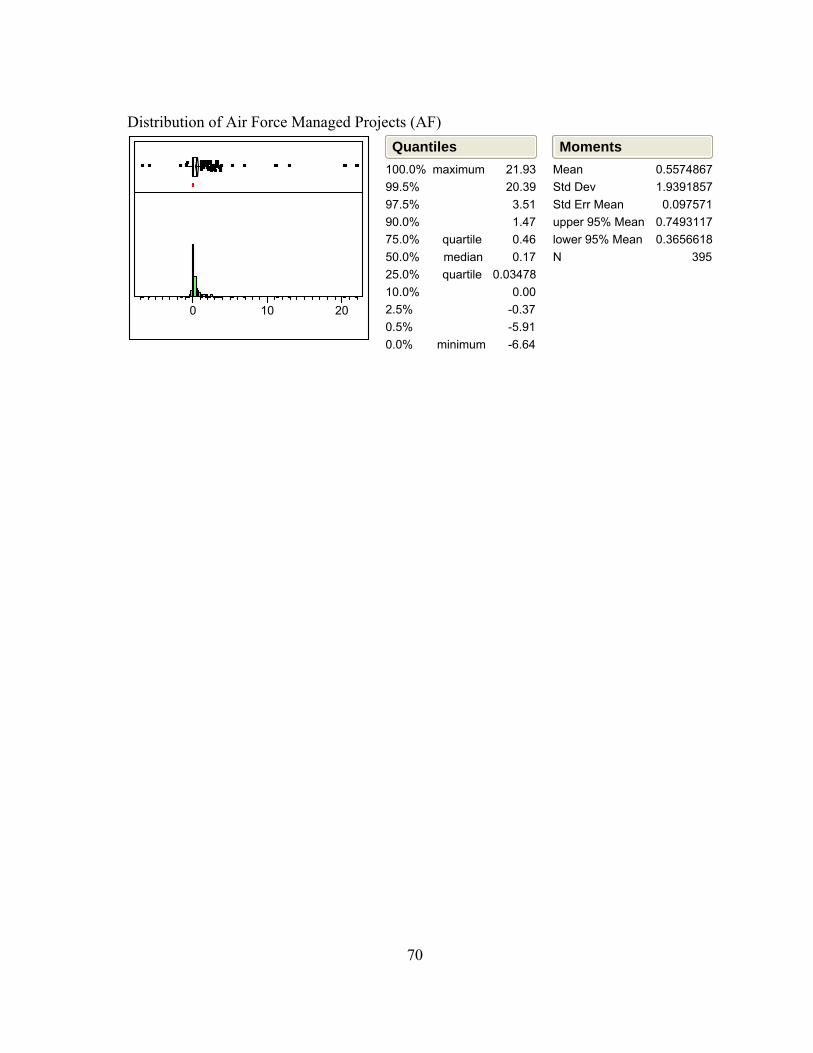
70
Distribution of Air Force Managed Projects (AF)
0 10 20
100.0%99.5%97.5%90.0%75.0%50.0%25.0%10.0%2.5%0.5%0.0%
maximum
quartilemedianquartile
minimum
21.9320.393.511.470.460.17
0.034780.00
-0.37-5.91-6.64
QuantilesMeanStd DevStd Err Meanupper 95% Meanlower 95% MeanN
0.55748671.93918570.097571
0.74931170.3656618
395
Moments
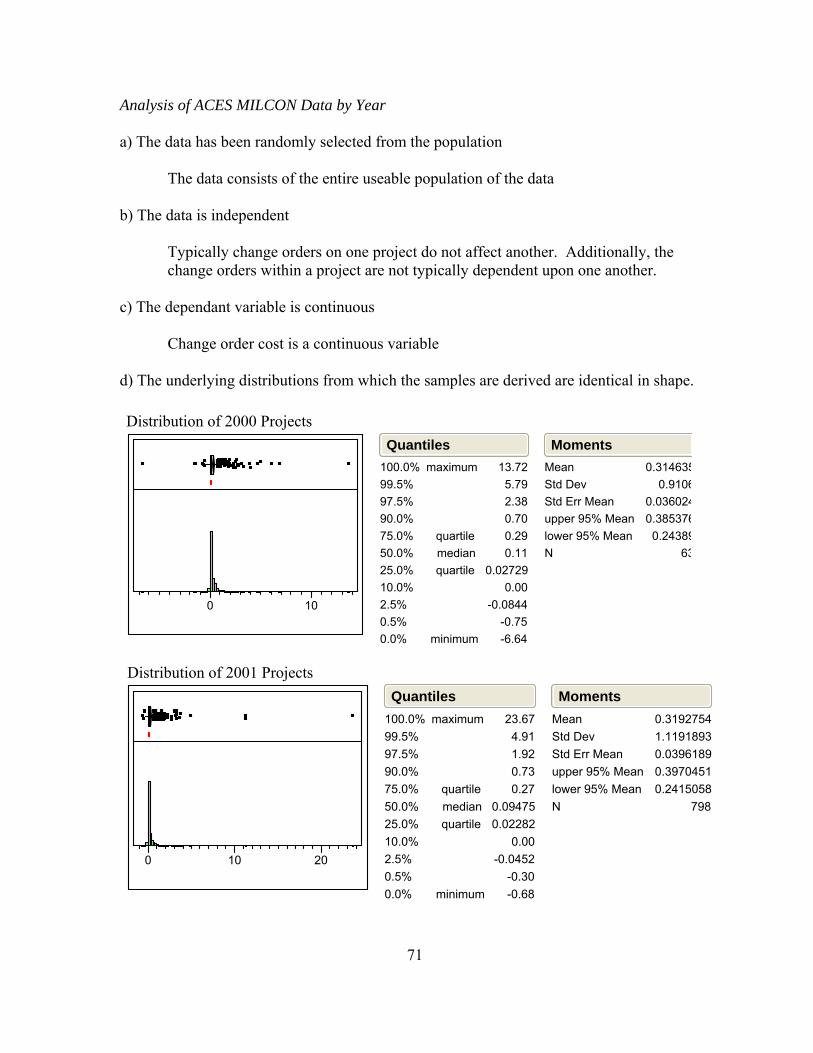
71
Analysis of ACES MILCON Data by Year
a) The data has been randomly selected from the population The data consists of the entire useable population of the data b) The data is independent
Typically change orders on one project do not affect another. Additionally, the change orders within a project are not typically dependent upon one another.
c) The dependant variable is continuous Change order cost is a continuous variable d) The underlying distributions from which the samples are derived are identical in shape.
Distribution of 2000 Projects
0 10
100.0%99.5%97.5%90.0%75.0%50.0%25.0%10.0%2.5%0.5%0.0%
maximum
quartilemedianquartile
minimum
13.725.792.380.700.290.11
0.027290.00
-0.0844-0.75-6.64
QuantilesMeanStd DevStd Err Meanupper 95% Meanlower 95% MeanN
0.3146350.9106
0.0360240.3853760.24389
63
Moments
Distribution of 2001 Projects
0 10 20
100.0%99.5%97.5%90.0%75.0%50.0%25.0%10.0%2.5%0.5%0.0%
maximum
quartilemedianquartile
minimum
23.674.911.920.730.27
0.094750.02282
0.00-0.0452
-0.30-0.68
QuantilesMeanStd DevStd Err Meanupper 95% Meanlower 95% MeanN
0.31927541.11918930.03961890.39704510.2415058
798
Moments
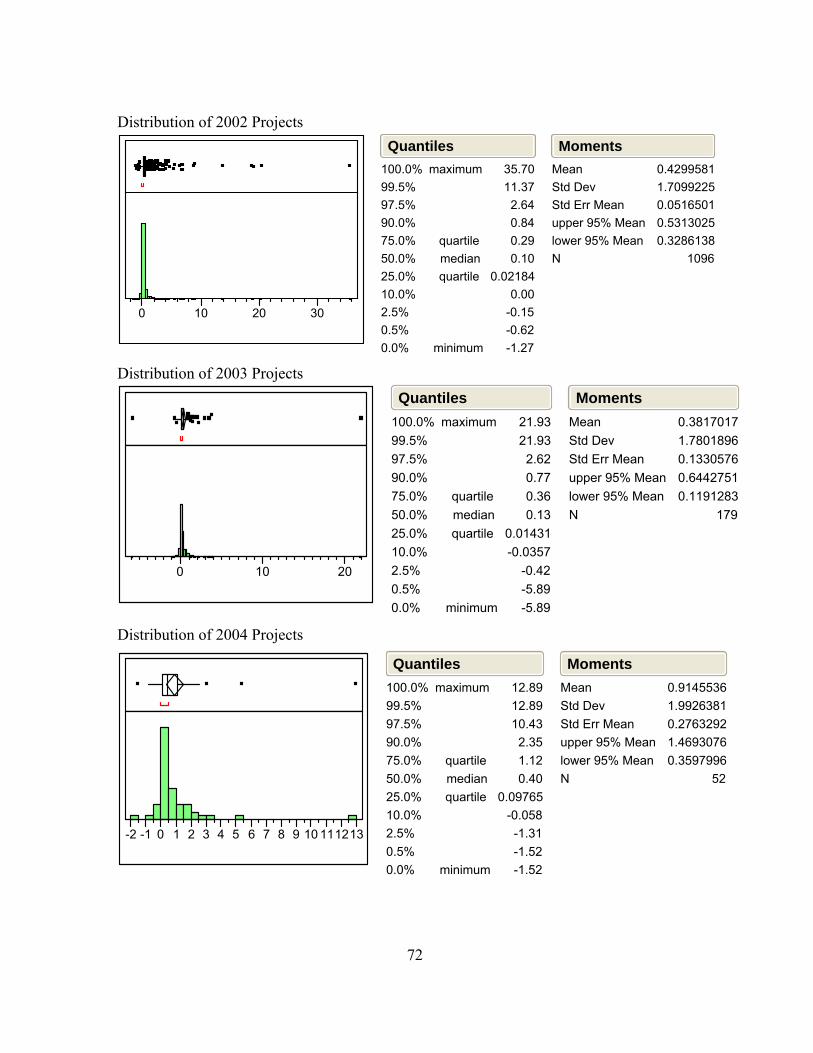
72
Distribution of 2002 Projects
0 10 20 30
100.0%99.5%97.5%90.0%75.0%50.0%25.0%10.0%2.5%0.5%0.0%
maximum
quartilemedianquartile
minimum
35.7011.372.640.840.290.10
0.021840.00
-0.15-0.62-1.27
QuantilesMeanStd DevStd Err Meanupper 95% Meanlower 95% MeanN
0.42995811.70992250.05165010.53130250.3286138
1096
Moments
Distribution of 2003 Projects
0 10 20
100.0%99.5%97.5%90.0%75.0%50.0%25.0%10.0%2.5%0.5%0.0%
maximum
quartilemedianquartile
minimum
21.9321.932.620.770.360.13
0.01431-0.0357
-0.42-5.89-5.89
QuantilesMeanStd DevStd Err Meanupper 95% Meanlower 95% MeanN
0.38170171.78018960.13305760.64427510.1191283
179
Moments
Distribution of 2004 Projects
-2 -1 0 1 2 3 4 5 6 7 8 9 10 111213
100.0%99.5%97.5%90.0%75.0%50.0%25.0%10.0%2.5%0.5%0.0%
maximum
quartilemedianquartile
minimum
12.8912.8910.432.351.120.40
0.09765-0.058-1.31-1.52-1.52
QuantilesMeanStd DevStd Err Meanupper 95% Meanlower 95% MeanN
0.91455361.99263810.27632921.46930760.3597996
52
Moments
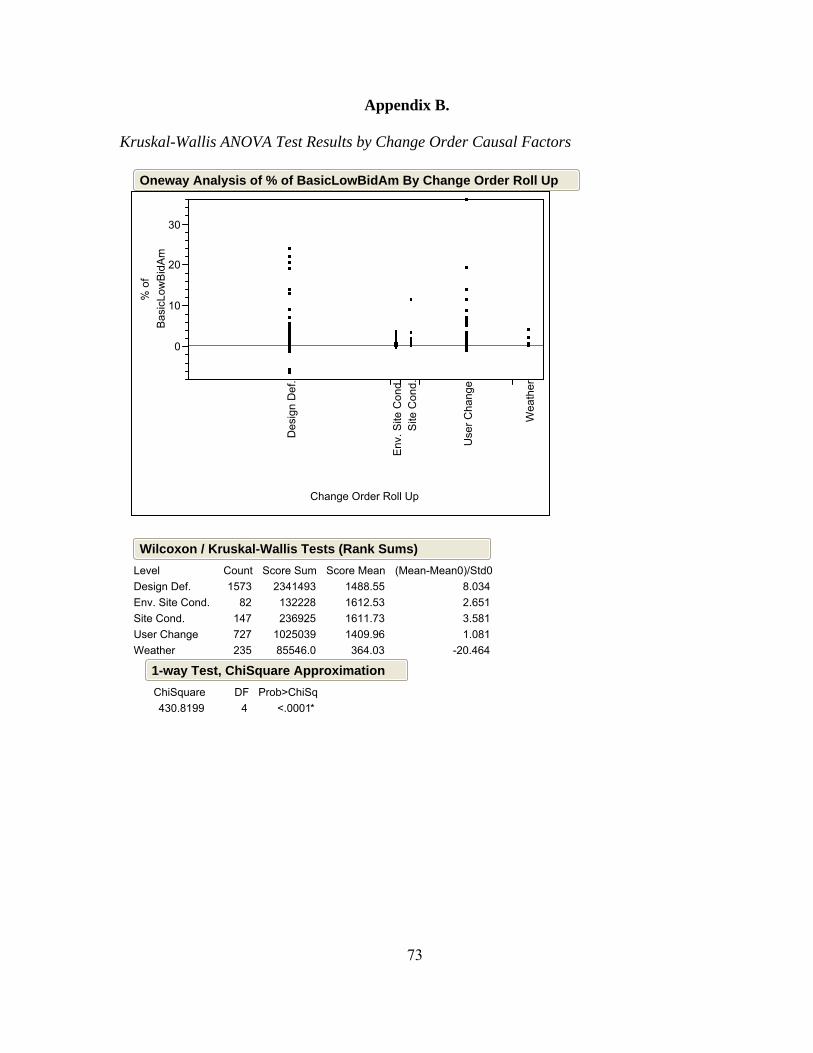
73
Appendix B. Kruskal-Wallis ANOVA Test Results by Change Order Causal Factors
0
10
20
30
% o
fB
asic
Low
Bid
Am
Des
ign
Def
.
Env
. Site
Con
d.S
ite C
ond.
Use
r Cha
nge
Wea
ther
Change Order Roll Up
Oneway Analysis of % of BasicLowBidAm By Change Order Roll Up
Design Def.Env. Site Cond.Site Cond.User ChangeWeather
Level1573
82147727235
Count2341493132228236925
102503985546.0
Score Sum1488.551612.531611.731409.96364.03
Score Mean8.0342.6513.5811.081
-20.464
(Mean-Mean0)/Std0
430.8199ChiSquare
4DF
<.0001*Prob>ChiSq
1-way Test, ChiSquare Approximation
Wilcoxon / Kruskal-Wallis Tests (Rank Sums)
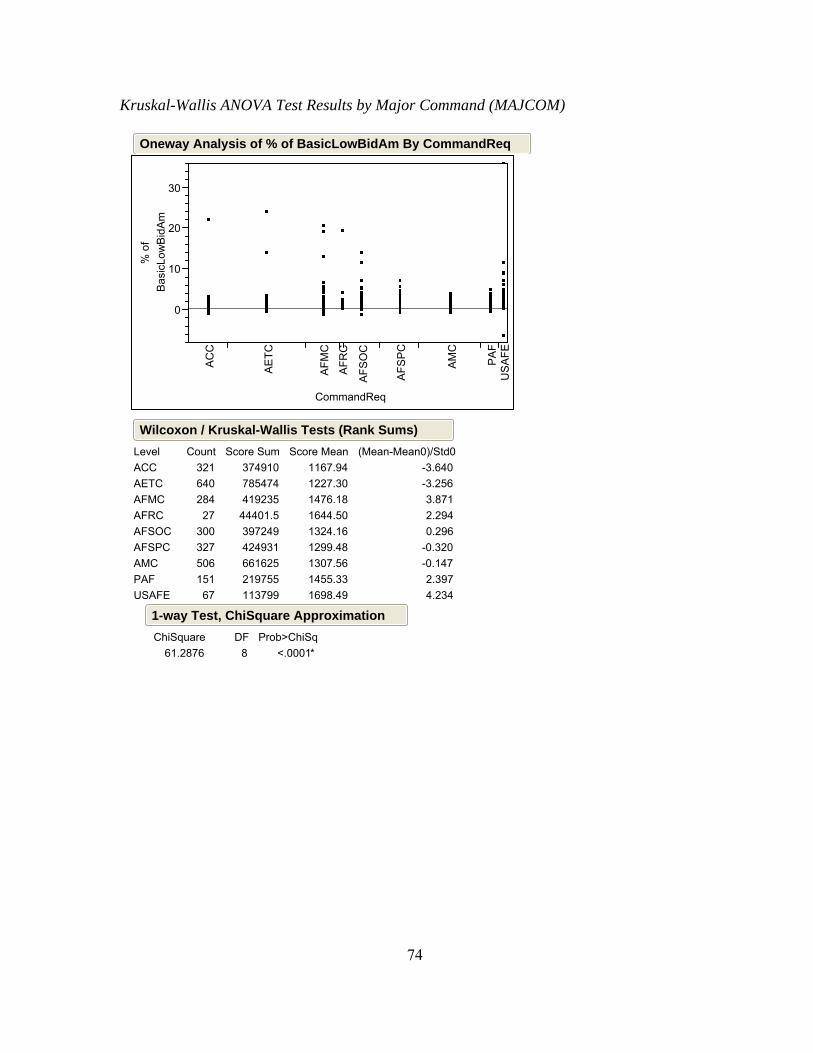
74
Kruskal-Wallis ANOVA Test Results by Major Command (MAJCOM)
0
10
20
30
% o
fB
asic
Low
Bid
Am
AC
C
AE
TC
AFM
C
AFR
C
AFS
OC
AFS
PC
AM
C
PA
FU
SA
FE
CommandReq
Oneway Analysis of % of BasicLowBidAm By CommandReq
ACCAETCAFMCAFRCAFSOCAFSPCAMCPAFUSAFE
Level32164028427
30032750615167
Count37491078547441923544401.5397249424931661625219755113799
Score Sum1167.941227.301476.181644.501324.161299.481307.561455.331698.49
Score Mean-3.640-3.2563.8712.2940.296
-0.320-0.1472.3974.234
(Mean-Mean0)/Std0
61.2876ChiSquare
8DF
<.0001*Prob>ChiSq
1-way Test, ChiSquare Approximation
Wilcoxon / Kruskal-Wallis Tests (Rank Sums)
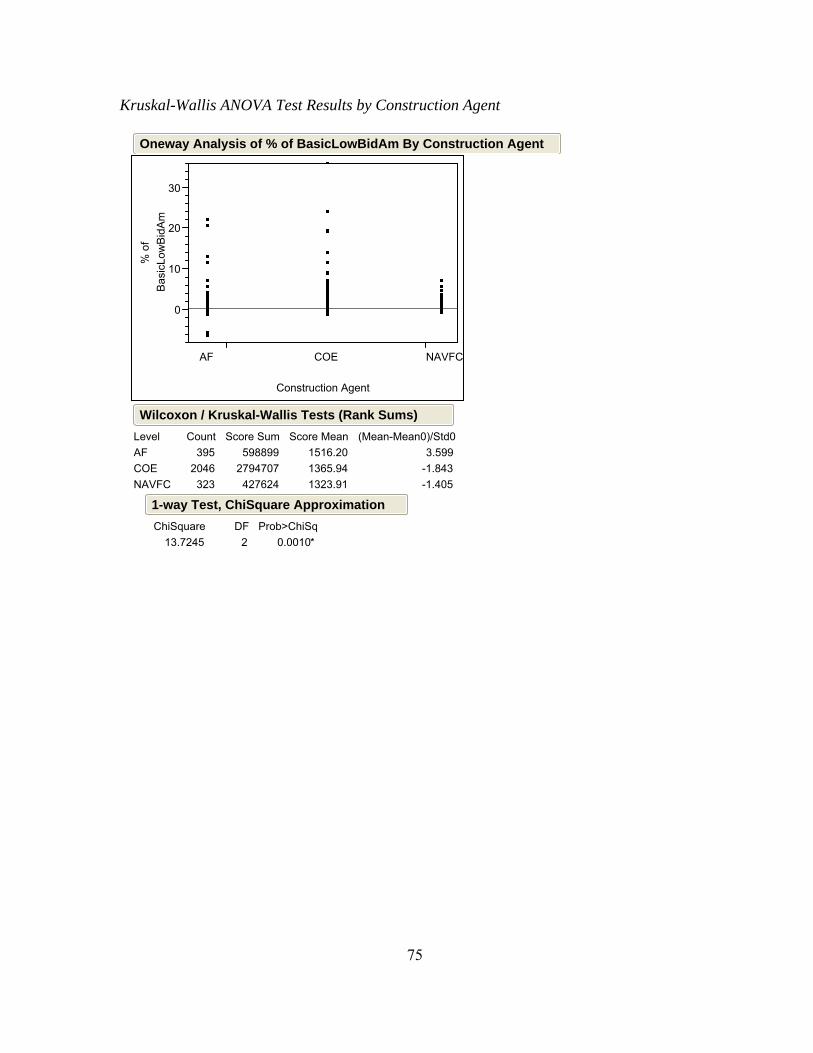
75
Kruskal-Wallis ANOVA Test Results by Construction Agent
0
10
20
30
% o
fB
asic
Low
Bid
Am
AF COE NAVFC
Construction Agent
Oneway Analysis of % of BasicLowBidAm By Construction Agent
AFCOENAVFC
Level395
2046323
Count598899
2794707427624
Score Sum1516.201365.941323.91
Score Mean3.599
-1.843-1.405
(Mean-Mean0)/Std0
13.7245ChiSquare
2DF
0.0010*Prob>ChiSq
1-way Test, ChiSquare Approximation
Wilcoxon / Kruskal-Wallis Tests (Rank Sums)
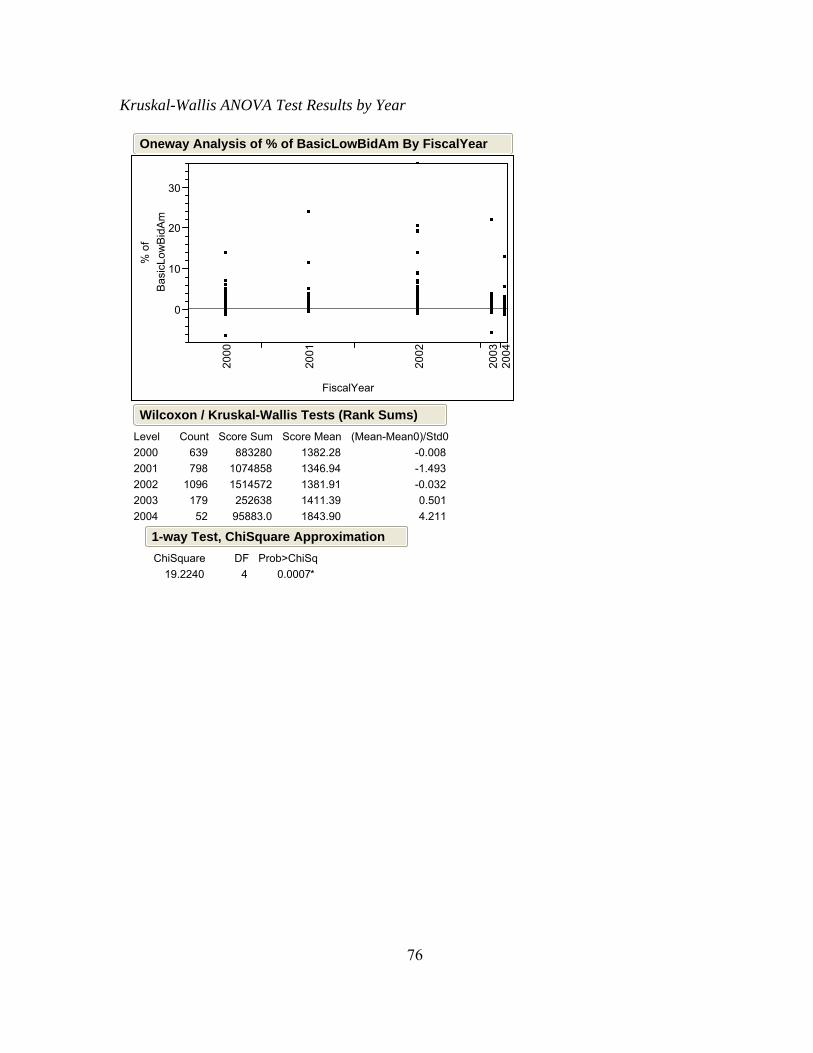
76
Kruskal-Wallis ANOVA Test Results by Year
0
10
20
30
% o
fB
asic
Low
Bid
Am
2000
2001
2002
2003
2004
FiscalYear
Oneway Analysis of % of BasicLowBidAm By FiscalYear
20002001200220032004
Level639798
109617952
Count883280
1074858151457225263895883.0
Score Sum1382.281346.941381.911411.391843.90
Score Mean-0.008-1.493-0.0320.5014.211
(Mean-Mean0)/Std0
19.2240ChiSquare
4DF
0.0007*Prob>ChiSq
1-way Test, ChiSquare Approximation
Wilcoxon / Kruskal-Wallis Tests (Rank Sums)
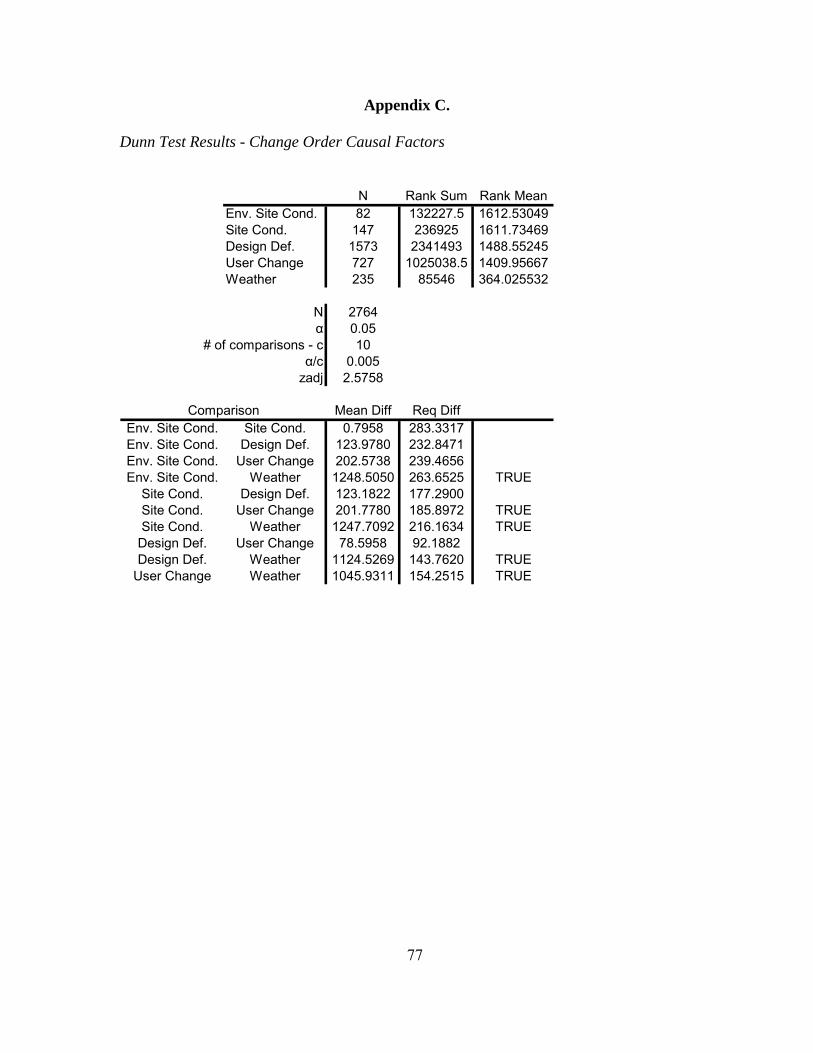
77
Appendix C. Dunn Test Results - Change Order Causal Factors
N Rank Sum Rank MeanEnv. Site Cond. 82 132227.5 1612.53049Site Cond. 147 236925 1611.73469Design Def. 1573 2341493 1488.55245User Change 727 1025038.5 1409.95667Weather 235 85546 364.025532
N 2764α 0.05
# of comparisons - c 10α/c 0.005
zadj 2.5758
Mean Diff Req DiffEnv. Site Cond. Site Cond. 0.7958 283.3317Env. Site Cond. Design Def. 123.9780 232.8471Env. Site Cond. User Change 202.5738 239.4656Env. Site Cond. Weather 1248.5050 263.6525 TRUE
Site Cond. Design Def. 123.1822 177.2900Site Cond. User Change 201.7780 185.8972 TRUESite Cond. Weather 1247.7092 216.1634 TRUE
Design Def. User Change 78.5958 92.1882Design Def. Weather 1124.5269 143.7620 TRUE
User Change Weather 1045.9311 154.2515 TRUE
Comparison
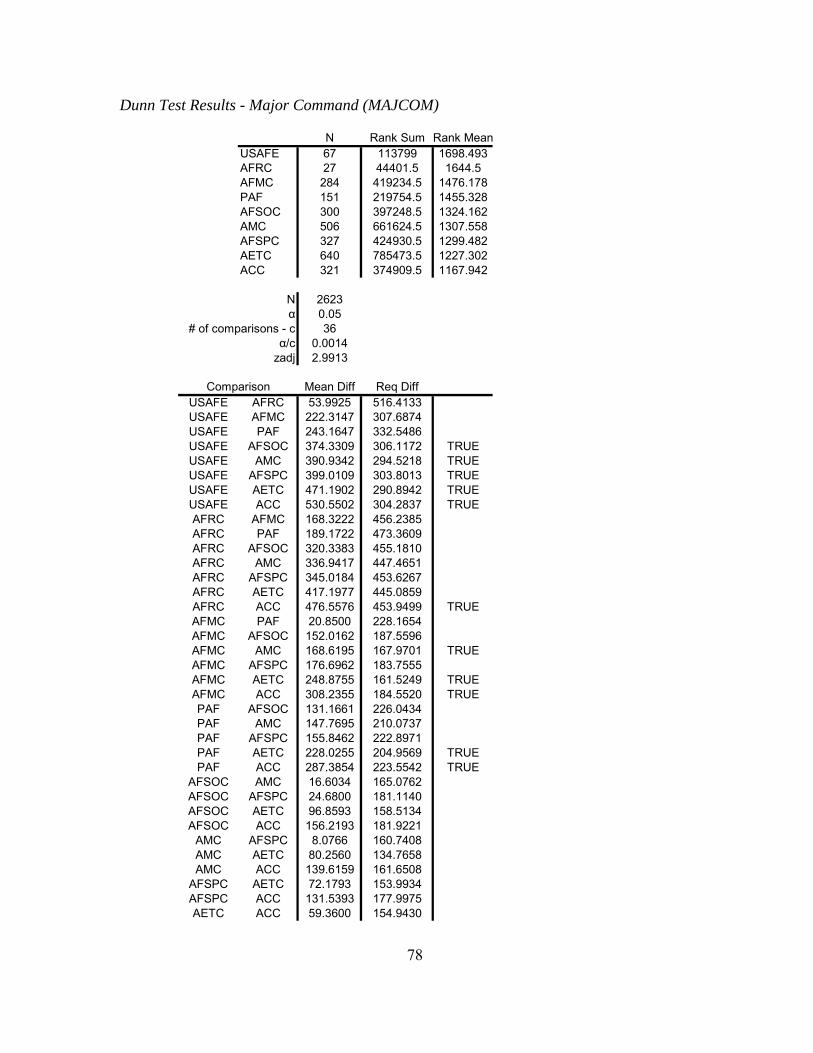
78
Dunn Test Results - Major Command (MAJCOM)
N Rank Sum Rank MeanUSAFE 67 113799 1698.493AFRC 27 44401.5 1644.5AFMC 284 419234.5 1476.178PAF 151 219754.5 1455.328AFSOC 300 397248.5 1324.162AMC 506 661624.5 1307.558AFSPC 327 424930.5 1299.482AETC 640 785473.5 1227.302ACC 321 374909.5 1167.942
N 2623α 0.05
# of comparisons - c 36α/c 0.0014
zadj 2.9913
Mean Diff Req DiffUSAFE AFRC 53.9925 516.4133USAFE AFMC 222.3147 307.6874USAFE PAF 243.1647 332.5486USAFE AFSOC 374.3309 306.1172 TRUEUSAFE AMC 390.9342 294.5218 TRUEUSAFE AFSPC 399.0109 303.8013 TRUEUSAFE AETC 471.1902 290.8942 TRUEUSAFE ACC 530.5502 304.2837 TRUEAFRC AFMC 168.3222 456.2385AFRC PAF 189.1722 473.3609AFRC AFSOC 320.3383 455.1810AFRC AMC 336.9417 447.4651AFRC AFSPC 345.0184 453.6267AFRC AETC 417.1977 445.0859AFRC ACC 476.5576 453.9499 TRUEAFMC PAF 20.8500 228.1654AFMC AFSOC 152.0162 187.5596AFMC AMC 168.6195 167.9701 TRUEAFMC AFSPC 176.6962 183.7555AFMC AETC 248.8755 161.5249 TRUEAFMC ACC 308.2355 184.5520 TRUEPAF AFSOC 131.1661 226.0434PAF AMC 147.7695 210.0737PAF AFSPC 155.8462 222.8971PAF AETC 228.0255 204.9569 TRUEPAF ACC 287.3854 223.5542 TRUE
AFSOC AMC 16.6034 165.0762AFSOC AFSPC 24.6800 181.1140AFSOC AETC 96.8593 158.5134AFSOC ACC 156.2193 181.9221
AMC AFSPC 8.0766 160.7408AMC AETC 80.2560 134.7658AMC ACC 139.6159 161.6508
AFSPC AETC 72.1793 153.9934AFSPC ACC 131.5393 177.9975AETC ACC 59.3600 154.9430
Comparison
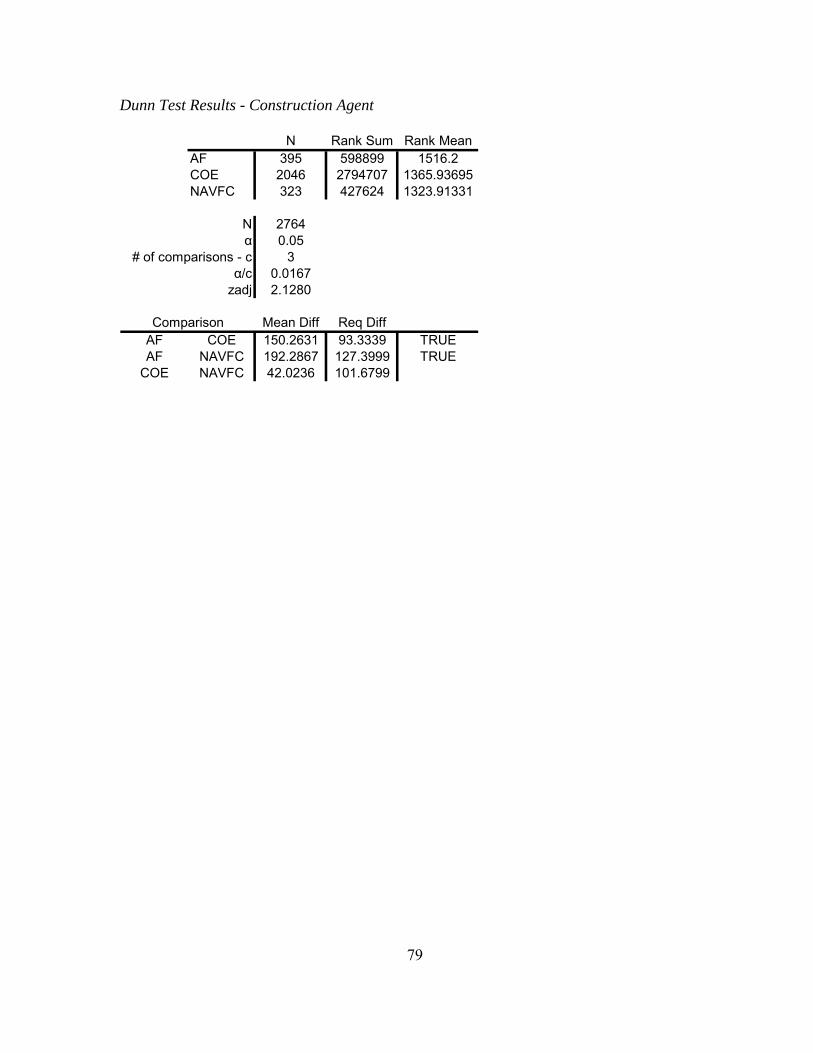
79
Dunn Test Results - Construction Agent
N Rank Sum Rank MeanAF 395 598899 1516.2COE 2046 2794707 1365.93695NAVFC 323 427624 1323.91331
N 2764α 0.05
# of comparisons - c 3α/c 0.0167
zadj 2.1280
Mean Diff Req DiffAF COE 150.2631 93.3339 TRUEAF NAVFC 192.2867 127.3999 TRUE
COE NAVFC 42.0236 101.6799
Comparison
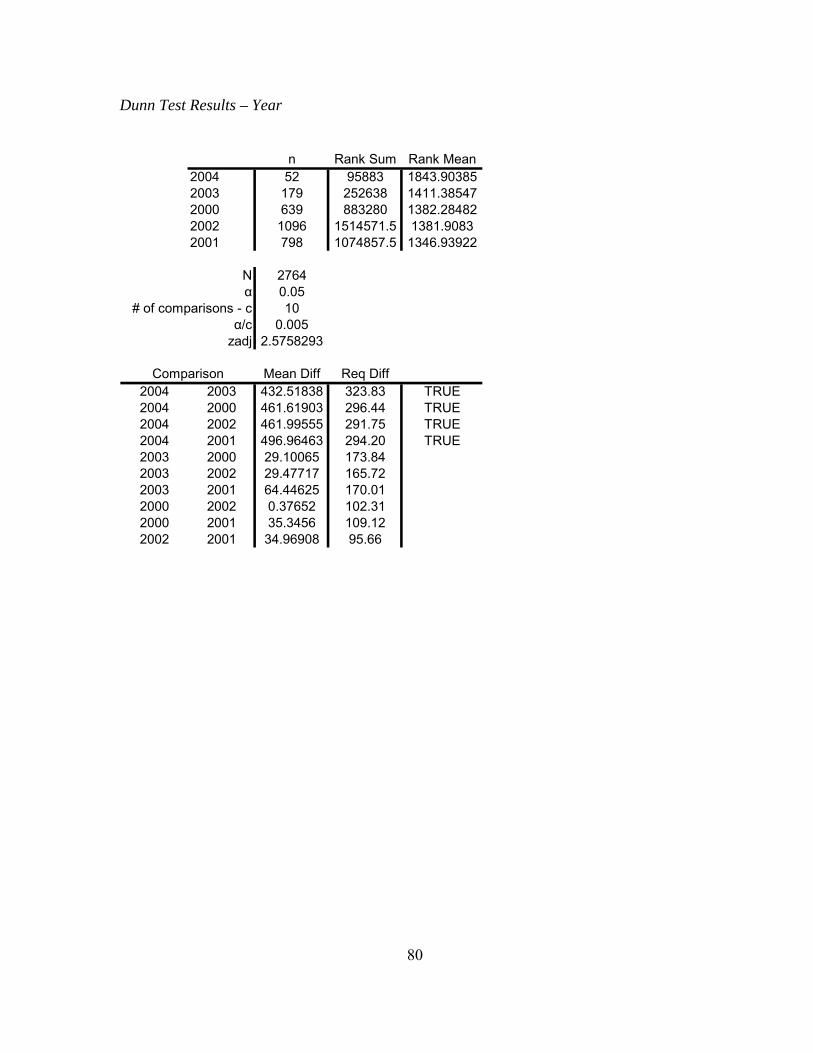
80
Dunn Test Results – Year
n Rank Sum Rank Mean2004 52 95883 1843.903852003 179 252638 1411.385472000 639 883280 1382.284822002 1096 1514571.5 1381.90832001 798 1074857.5 1346.93922
N 2764α 0.05
# of comparisons - c 10α/c 0.005
zadj 2.5758293
Mean Diff Req Diff2004 2003 432.51838 323.83 TRUE2004 2000 461.61903 296.44 TRUE2004 2002 461.99555 291.75 TRUE2004 2001 496.96463 294.20 TRUE2003 2000 29.10065 173.842003 2002 29.47717 165.722003 2001 64.44625 170.012000 2002 0.37652 102.312000 2001 35.3456 109.122002 2001 34.96908 95.66
Comparison
81
Bibliography
Al-Momani, A. H. (2000/2). Construction delay: A quantitative analysis. International Journal of Project Management, 18(1), 51-59.
Arditi, D., Akan, G. T., & Gurdamar, S. (1985). Cost overruns in public projects. Project Management, 3(4), 218-224.
Arin, J. A. (1989). Evaluating user change requests in facility construction. Unpublished Masters Thesis, Air Force Institute of Technology, Wright Patterson AFB OH.
Assaf, S. A., & Al-Hejji, S. (2006). Causes of delay in large construction projects. International Journal of Project Management, 24(4), 349-357.
Barrientez, J. I. (1995). Causes and effects of change orders at naval air station corpus christi, texas (Technical Report No. ADA301512). Austin, TX: University of Texas at Austin.
Burati, J. L., Farrington, J. J., & Ledbetter, W. B. (1992). Causes of quality deviations in design and construction. Journal of Construction Engineering and Management, 118(1), 34-48.
Chan, A. P. C., & Yeong, C. M. (1995). A comparison of strategies for reducing variations. Construction Management & Economics, 13(6), 467.
Chao-Hui, W., Ting-Ya, H., Wen-Lon, C., & Shih-Tong, L. (2004). Grey relation analysis of causes for change orders in highway construction. [Grey relation analysis of causes for change orders in highway construction.] Construction Management & Economics, 22(5), 509-520.
Choy, W. C., & Sidwell, A. C. (1991). Sources of variations in austrailian construction contracts. The Building Economist, 30(3), 25-30.
Code of Federal Regulations (CFR), Title 10, Subtitle A, Part IV, Chapter 169, Subchapter III, § 2851
Cook, J. J. (2006). Estimating required contingency funds for construction projects using multiple linear regression. Unpublished Masters Thesis, Air Force Institute of Technology, Wright Patterson AFB OH.
Cox, I. D., Morris, J. P., Rogerson, J. H., & Jared, G. E. (1999). A quantitative study of post contract award design changes in construction. Construction Management & Economics, (17), 427-439.
82
Cox, R. K. (1997) Managing change orders and claims. Journal of Management in Engineering, 13(1), 24.
Dantata, N. A., Touran, A., & Schneck, D. C. (2006). Trends in U.S. rail transit project cost overrun. 2006 Annual Meeting, Transportation Research Board of the National Academies, Washington, D.C. , TRB 2006 Annual Meeting CD-ROM
Diekmann, J. E., & Nelson, M. C. (1985). Construction claims: Frequency and severity. Journal of Construction Engineering and Management, 111(1), 74-81.
Dlakwa, M. M., & Culpin, M. F. (1990). Reasons for overrun in public sector projects in nigeria. Project Management, 8(4), 237-241.
Dodge, T. (Feb 16, 2006). Air force MILCON program. 2006 P+PS MILCON Briefing, Washington D.C.
Ehrenreich-Hansen, F. (1994). Change order management for construction projects. Cost Engineering, 36(3), 25-28.
Federal acquisition regulation (FAR), code of federal regulations, sec 48, ch 1(2005). . Washington D.C.: U.S. General Services Administration.
Flyvbjerg, B., Holm, M. K. S., & Buhl, S. L. (2004). What causes cost overrun in transport infrastructure projects? Transport Reviews, 24(1), 3-18.
Frimpong, Y., & Oluwoye, J. (2003). Significant factors causing delay and cost overruns in construction of groundwater projects in ghana. Journal of Construction Research, 4(2), 175.
Georgy, M. E., Luh-Maan Chang, & Lei Zhang. (2005). Engineering performance in the US industrial construction sector. Cost Engineering, 47(1), 27-36.
Gunduz, M., & Hanna, A. S. (2005/8). Benchmarking change order impacts on productivity for electrical and mechanical projects. Building and Environment, 40(8), 1068-1075.
Günhan, S., Arditi, D., & Doyle, J. (2007). Avoiding change orders in public school construction. Journal of Professional Issues in Engineering Education & Practice, 133(1), 67-73.
Günhan, S., Arditi, D., & Doyle, J. (2007). Avoiding change orders in public school construction. Journal of Professional Issues in Engineering Education & Practice, 133(1), 67-73.
83
Hanna, A. S., Russel, J. S., & Thomack, D. (1998). Quantifying the effect of change orders on electrical construction labor efficiency. Cost Engineering, 40(2), 36-41.
Hanna, A. S., & Gunduz, M. (2004). Impact of change orders on small labor-intensive projects. Journal of Construction Engineering and Management, 130(5), 726-733.
Hanna, A. S., Camlic, R., Peterson, P. A., & Nordheim, E. V. (2002). Quantitative definition of projects impacted by change orders. Journal of Construction Engineering & Management, 128(1), 57.
Hanna, A. S., & Russel, J. S. Impact of change orders on labor efficiency for electrical construction. Journal of Construction Engineering & Management, 125(4), 224.
Hanna, A. S., Russell, J. S., & Vandenberg, P. J. (1999). The impact of change orders on mechanical construction labour efficiency. Construction Management & Economics, 17(6), 721-730.
Hsieh, T., Lu, S., & Wu, C. (2004/11). Statistical analysis of causes for change orders in metropolitan public works. International Journal of Project Management, 22(8), 679-686.
Ibbs, C. W. (1997). Quantitative impacts of project change: Size issues. Journal of Construction Engineering & Management, 123(3), 308.
Jahren, C. T., & Ashe, A. M. (1990). Predictors of cost-overrun rates. Journal of Construction Engineering & Management, 116(3), 548-552.
Leonard, C. A. (1987, August). The effect of change orders on productivity. The Revay Report, 6(2) 1-4.
Leonard, C. A., Fazio, P., & Moselhi, O. (1988). Construction productivity: Major causes of impact. American Association of Cost Engineers.Transactions of the American Association of Cost Engineers, , D.10.1.
Love, P. E. D., & Heng Li. (2000). Quantifying the causes and costs of rework in construction. Construction Management & Economics, 18(4), 479-490.
McClave, J. T., Benson, P. G., & Sincich, T. (2005). Statistics for business and economics (9th ed.). New Jersey: Pearson Prentice Hall.
Military Construction (12 February 2005). (DoDD 4270.5 ed.). Washington D.C: U.S. Department of Defense.
84
Nassar, K. M., Nassar, W. M., & Hegab, M. Y. (2005). Evaluating cost overruns of asphalt paving project using statistical process control methods. Journal of Construction Engineering & Management, 131(11), 1173-1178.
Odeck, J. (2004). Cost overruns in road construction - what are their sizes and determininants? Transport Policy, 11(1), 43-53.
Richey, J. L., & Walulik, D. W. (2001). Change orders can create unexpected costs. Construction Law & Business Journal, 2(4), 1.
Rosmond, J. R. (1984). Analylsis of low bidding and change order rates for navy facilities construction contracts. Unpublished (ADA150828), Naval Post Graduate School, Monteray CA.
Rowland, Henry J., Jr. (1981). The causes and effects of change orders on the construction process. Unpublished (ADA133837), Georgia Institute of Technology, Atlanta GA.
Sheskin, D. (2007). Handbook of parametric and nonparametric statistical prodcedures (4th ed.). Florida: Chapman & Hall/CRC.
The Air Force Center for Engineering and the Environment (AFCEE). (2000). The united states air force project managers guide for design and construction. Texas: AFCEE.
Thomas, H. R., & Napolitan, C. L. (1995). Quantitative effects of construction changes on labor productivity. Journal of Construction Engineering and Management, , 290-296.
U.S. General Accounting Office (GAO). (1997). Transportation infrastructure: Managing the costs of large-dollar highway projects No. GAO/RCED -97-47). Washington D.C.: U.S. General Accounting Office.
U.S. Government Accountability Office (GAO). (2005). Courthouse construction: Information on project cost and size changes would help to enhance oversight No. GAO-05-673). Washington D.C.: U.S. Government Accountability Office (GAO);.
U.S. Government Accountability Office (GAO). (2007). Department of energy: Major construction projects need a consistent approach for assessing technology readiness to help avoid cost increases and delay No. GAO-07-336). Washington D.C.: U.S. Government Accountability Office.
Vandenberg, P. J. (1996). The impact of change orders on mechanical construction labor efficiency. Unpublished Master of Science, University of Wisconsin - Madison.

85
Wu, C., Hsieh, T., Cheng, W., & Lu, S. (2004). Grey relation analysis of causes for change orders in highway construction. Construction Management & Economics, 22(5), 509-520.
Wu, C., Hsieh, T., & Cheng, W. (2005/10). Statistical analysis of causes for design change in highway construction on taiwan. International Journal of Project Management, 23(7), 554-563.
86
REPORT DOCUMENTATION PAGE Form Approved OMB No. 074-0188
The public reporting burden for this collection of information is estimated to average 1 hour per response, including the time for reviewing instructions, searching existing data sources, gathering and maintaining the data needed, and completing and reviewing the collection of information. Send comments regarding this burden estimate or any other aspect of the collection of information, including suggestions for reducing this burden to Department of Defense, Washington Headquarters Services, Directorate for Information Operations and Reports (0704-0188), 1215 Jefferson Davis Highway, Suite 1204, Arlington, VA 22202-4302. Respondents should be aware that notwithstanding any other provision of law, no person shall be subject to an penalty for failing to comply with a collection of information if it does not display a currently valid OMB control number. PLEASE DO NOT RETURN YOUR FORM TO THE ABOVE ADDRESS. 1. REPORT DATE (DD-MM-YYYY) June-2007
2. REPORT TYPE Master’s Thesis
3. DATES COVERED (From – To) Aug 2005 – Dec 2007
5a. CONTRACT NUMBER
5b. GRANT NUMBER
4. TITLE AND SUBTITLE Characterizing Patterns of MILCON Project Contract Modifications
5c. PROGRAM ELEMENT NUMBER
5d. PROJECT NUMBER 5e. TASK NUMBER
6. AUTHOR(S) Nielsen, Tyler K., Captain, USAF
5f. WORK UNIT NUMBER
7. PERFORMING ORGANIZATION NAMES(S) AND ADDRESS(S) Air Force Institute of Technology Graduate School of Engineering and Management (AFIT/EN) 2950 Hobson Way WPAFB OH 45433-7765
8. PERFORMING ORGANIZATION REPORT NUMBER
AFIT/GEM/ENV/07D-01
10. SPONSOR/MONITOR’S ACRONYM(S) N/A
9. SPONSORING/MONITORING AGENCY NAME(S) AND ADDRESS(ES) Col. Andrew Scrafford HQ USAF/ILE 1260 Air Force Pentagon Washington, DC 20330-1260
11. SPONSOR/MONITOR’S REPORT NUMBER(S) N/A
12. DISTRIBUTION/AVAILABILITY STATEMENT APPROVED FOR PUBLIC RELEASE; DISTRIBUTION UNLIMITED
13. SUPPLEMENTARY NOTES 14. ABSTRACT Change orders are used by project managers of construction projects to account for unplanned for events. This may include everything from weather events to last minute changes requested by the user . This effort analyzes data from the U.S. Air Force military construction program to find the major causes of change orders. The data is also analyzed to find trends over time, by construction agent, and by major command to detect possible trends. Design deficiencies are found to be the most common cause of change orders however; the data from the military database is insufficient to determine a conclusive statistical ranking. Evidence is discovered to suggest one major command may have a higher cost per change order than the others, but it is not conclusive.
15. SUBJECT TERMS Construction, Cost Overruns, Modification, Rank Order Statistics,
16. SECURITY CLASSIFICATION OF:
19a. NAME OF RESPONSIBLE PERSON Alfred E. Thal, PhD., AFIT/ENV
REPORT U
ABSTRACT U
c. THIS PAGE U
17. LIMITATION OF ABSTRACT UU
18. NUMBER OF PAGES 79 19b. TELEPHONE NUMBER (Include area code)
(937) 255-6565, ext 7401; e-mail: [email protected] Standard Form 298 (Rev: 8-98) Prescribed by ANSI Std. Z39-18