CHARACTERIZING NEW YORK STATE’S CLEANTECH …
98
CHARACTERIZING NEW YORK STATE’S CLEANTECH ECOSYSTEM AND THE ROLE OF NYSERDA’S ICBD PROGRAM Prepared For: New York State Energy Research and Development Authority (NYSERDA) Albany, NY Patricia Gonzales, NYSERDA Project Manager Prepared By: Industrial Economics, Incorporated (IEc) Cambridge, Massachusetts Cynthia Manson, Project Manager APPENDICES Appendix A: Indicators and Data Sources used in the MCA Appendix B: Primary Research Methods Appendix C: Critical Resources – Additional Findings and Analysis Appendix D: Additional findings and analysis from primary research Appendix E: Emerging Geographic Clusters of Resources NYSERDA Contract 32883 May 2017
Transcript of CHARACTERIZING NEW YORK STATE’S CLEANTECH …

CHARACTERIZING NEW YORK STATE’S CLEANTECH ECOSYSTEM
AND THE ROLE OF NYSERDA’S ICBD PROGRAM
Prepared For:
New York State Energy Research and Development Authority (NYSERDA)
Albany, NY
Patricia Gonzales, NYSERDA Project Manager
Prepared By:
Industrial Economics, Incorporated (IEc)
Cambridge, Massachusetts
Cynthia Manson, Project Manager
APPENDICES
Appendix A: Indicators and Data Sources used in the MCA
Appendix B: Primary Research Methods
Appendix C: Critical Resources – Additional Findings and Analysis
Appendix D: Additional findings and analysis from primary research
Appendix E: Emerging Geographic Clusters of Resources
NYSERDA Contract 32883 May 2017

1
Appendix A: Indicators and Data Sources
A1. Summary of the MCA indicators and data sources addressed in the MCA Report
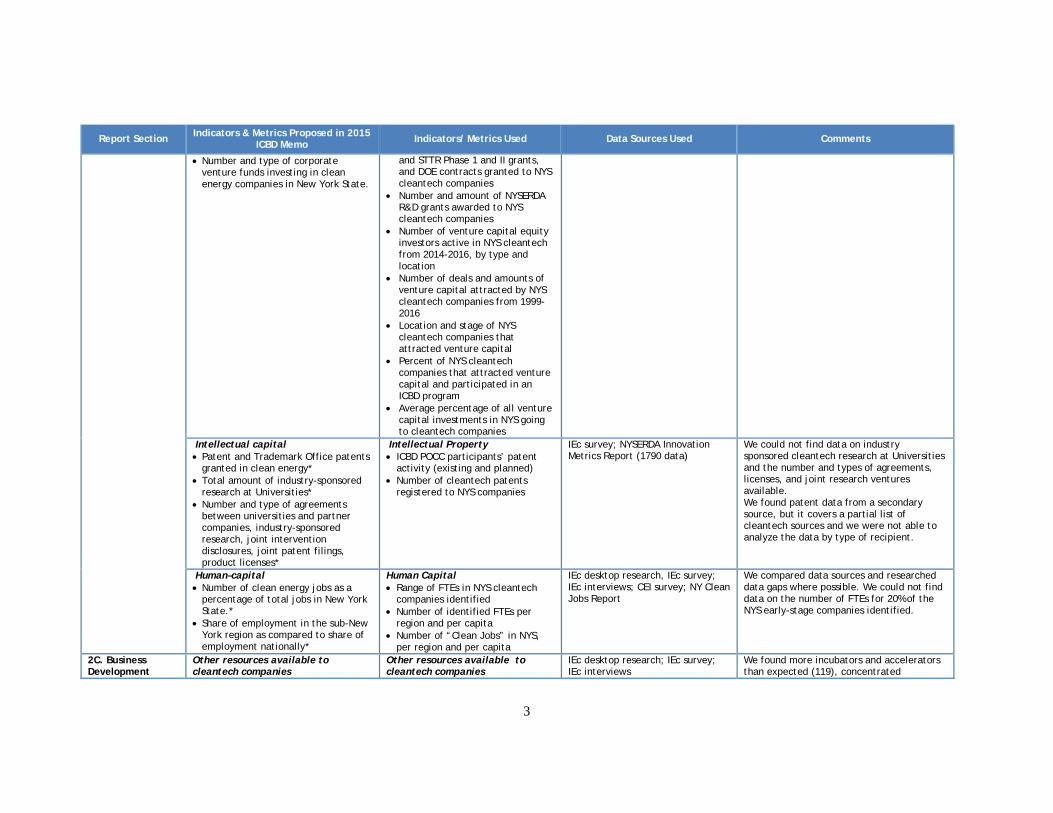
Figure A.1 below provides a summary view of the different indicators and data sources reviewed and used in the MCA Report. In this Figure:
The first column provides the section of the MCA Report in which they appear;
The second column lists the initial set of indicators proposed by IEc as part of the interim Memo discussing indicators and metrics1. * in this column indicates that no data was found to support this indicator;
The third column lists the final set of indicators used in the main body of the MCA Report. Note that additional indicators and the results of other analyses conducted are provided in Appendixes 2-4 but these are not shown in the Figure below;
The fourth column lists the data sources used for each of the indicators chosen for the main body of the MCA Report or in the Appendix; and
The fifth column provides comments about the indicators and data sources used, and those initially expected in the work-plan but ultimately excluded for the report.
Report Section Indicators & Metrics Proposed in 2015 ICBD Memo Indicators/ Metrics Used Data Sources Used Comments
2A. The Population of NYS Early-Stage Cleantech Companies
Business formation Number of business establishment
openings by year Net change in business
establishments in key industry sectors*
Number of start-up companies by year of formation.
Number of years in operation.
Business formation Number of NYS early-stage
cleantech companies o by stage of growth (nascent,
start-up, growth) o by year of incorporation o by primary cleantech
segments o by NYS region (total and
normalized per capita)
CBI, CEI, Cleantech i3, IEc Survey, IEc Interviews, NYSERDA R&D Metrics Database, Desktop research.
We used several data sources to establish year of incorporation and manually researched any gaps. We could not determine the year of incorporation for 4% of companies. We excluded datasets from NY State company registrations, Bureau of Labor Statistics or Census Bureau as needed cleantech specific NAICs codes & large task to sort and find companies.
Number of firms in target markets Total number of clean energy
companies in New York State funded
Number of firms funded by VCs Percent of NYS cleantech
companies identified funded by VC
Cleantech i3; IEc survey; CEI Survey We compared and crosschecked data across various sources.
1 IEc. 2015. Key findings from the Literature Review and Metrics Map to inform the MCA for the ICBD Program. Internal Memo Submitted to NYSERDA.

2
Report Section Indicators & Metrics Proposed in 2015 ICBD Memo Indicators/ Metrics Used Data Sources Used Comments
by venture capital and angel investors
investors
Entrepreneurial activity Number of entrepreneurs starting
new businesses Percentage of adults becoming
entrepreneurs in a given month in NYS*
Entrepreneurial activity Total early stage entrepreneurial
activity (TEA) in NYS Number of ICBD POCC participants
intending to start a new company
IEc survey of POCC participants; NYSERDA program files (R&D metrics database)
IEc survey data on POCC participants provided some indications of entrepreneurial activity, but not comprehensive. The GEM data we explored is indicative of the trends and compares NY to other states in the US; however, it is not specific to cleantech.
Business closings Number of business closings as share
of total establishments* Other exits* Number of bankruptcies* Number of years from formation to
firm closing*
No Indicators N/A We did not find reliable data sources that consistently track closings or bankruptcies. We did not research exit events i.e. M&A and IPOs for VC backed companies.
Size of companies Total number of persons employed by
enterprise
Size of companies Median and average staff size of
NYS early-stage cleantech companies (overall and by age of company)
Data gained directly from companies (CEI and ICBD surveys, interviews); Cleantech i3; additional desktop research from companies’ websites
We manually compiled and crosschecked data between sources. We could not find data on the number of FTEs for 20% of companies.
EIR Program participants Number and types of entrepreneurs-
in-residence*
Participation in NYSERDA Programs Number and percent of NYS
cleantech companies identified participating in NYSERDA Programs (ICBD, other-NYSERDA program)
IEc survey; IEc interviews; NYSERDA program files (R&D metrics database)
We manually crosschecked company data in NYSERDA program files.
Sales/ market penetration Sales revenue (international
domestic)
Median and average annual revenues of NYS early-stage cleantech companies (overall and by stage of growth)
Data gained directly from companies through the ICBD survey; CEI Inventory data; IEc Survey; Cleantech i3 data
We combined and compared data sources, and we could not find revenue data for 58% of companies. For companies that also operate outside NYS, we could not find information to separate domestic from international revenue.
2B. Critical Resources Supporting NYS Cleantech
Financial capital Amount of federal grants & awards
made to New York State clean energy companies, entrepreneurs, universities.
Amount and number of venture capital and angel investors
Financial capital Number and type of Federal and
State fiscal incentives available for NYS cleantech companies
Number of cleantech companies registered in START-UP NY
Amount of DOE, ARPA-E, DOE SBIR
DSIRE; DOE; SBA; Cleantech i3; START-UP NY Program; NYSERDA Program files; IEc desktop research; IEc survey; IEc Interviews.
We did not find reliable data on angel investment rounds. We combined and compared data sources for each company then analyzed raw data from all sources We conducted some desktop research to fill gaps.
3
Report Section Indicators & Metrics Proposed in 2015 ICBD Memo Indicators/ Metrics Used Data Sources Used Comments
Number and type of corporate venture funds investing in clean energy companies in New York State.
and STTR Phase 1 and II grants, and DOE contracts granted to NYS cleantech companies
Number and amount of NYSERDA R&D grants awarded to NYS cleantech companies
Number of venture capital equity investors active in NYS cleantech from 2014-2016, by type and location
Number of deals and amounts of venture capital attracted by NYS cleantech companies from 1999-2016
Location and stage of NYS cleantech companies that attracted venture capital
Percent of NYS cleantech companies that attracted venture capital and participated in an ICBD program
Average percentage of all venture capital investments in NYS going to cleantech companies
Intellectual capital Patent and Trademark Office patents
granted in clean energy* Total amount of industry-sponsored
research at Universities* Number and type of agreements
between universities and partner companies, industry-sponsored research, joint intervention disclosures, joint patent filings, product licenses*
Intellectual Property ICBD POCC participants’ patent
activity (existing and planned) Number of cleantech patents
registered to NYS companies
IEc survey; NYSERDA Innovation Metrics Report (1790 data)
We could not find data on industry sponsored cleantech research at Universities and the number and types of agreements, licenses, and joint research ventures available. We found patent data from a secondary source, but it covers a partial list of cleantech sources and we were not able to analyze the data by type of recipient.
Human–capital Number of clean energy jobs as a
percentage of total jobs in New York State.*
Share of employment in the sub-New York region as compared to share of employment nationally*
Human Capital Range of FTEs in NYS cleantech
companies identified Number of identified FTEs per
region and per capita Number of “Clean Jobs” in NYS,
per region and per capita
IEc desktop research, IEc survey; IEc interviews; CEI survey; NY Clean Jobs Report
We compared data sources and researched data gaps where possible. We could not find data on the number of FTEs for 20% of the NYS early-stage companies identified.
2C. Business Development
Other resources available to cleantech companies
Other resources available to cleantech companies
IEc desktop research; IEc survey; IEc interviews
We found more incubators and accelerators than expected (119), concentrated

4
Report Section Indicators & Metrics Proposed in 2015 ICBD Memo Indicators/ Metrics Used Data Sources Used Comments
Resources for Cleantech Companies in NYS
No indicator proposed Number, location and type of incubators, accelerators and POCCs in state by type
Percent of incubators/ accelerators and POCCs funded by NYSERDA
Degree to which ICBD services provided are valued by ICBD participants
Most useful services received by ICBD participants
Additional services desired by ICBD participants
Median number of companies / teams participating in BD service programs in NYS
in/around NYC.
2D. Drivers and Barriers Gaps and Needs in the NYS Cleantech Ecosystem
Key drivers and barriers for cleantech companies
No indicator proposed
Key drivers and barriers for cleantech companies Key drivers for NYS cleantech
companies according to survey respondents and interviewees
Key barriers for New York State’s Cleantech Companies according to survey respondents and interviewees
Key barriers by respondent group (type of organization)
Most commonly mentioned reasons why cleantech Companies fail
IEc survey; IEc interviews We found that the survey and interview results are consistent with literature.
1
Appendix B: Primary Research Methods B.1. Survey
B.1.1 Survey Administration IEc conducted a survey to deepen the characterization of NYS’s cleantech entrepreneurial ecosystem, reaching a wider group of stakeholders. The survey used an online platform, and employed pre-test (five respondents) with feedback from NYSERDA and pre-testers by telephone, as well as follow-up with emails and phone calls to encourage survey responses. Respondents had the option to complete the survey online or by phone; most opted for online.
The survey asked respondents to provide basic demographic information, details about their companies/organizations, and their perceptions about the drivers and barriers facing entrepreneurs in NYS’s cleantech ecosystem. The survey used skip logic to ensure that only the appropriate individuals were asked questions about their companies and their participation in the different ICBD programs. The survey invitation letter and questionnaire is provided in this Appendix, below.
IEc administered the survey in two stages:
Stage One focused on past or present recipients or providers of business development services from NYSERDA-funded incubators, POCCs, and EIRs. We coordinated with NYSERDA to request contact information from directors of the NYSERDA-funded incubators, POCCs, and EIR program. We requested information on all current and past clients and service providers. All but one incubator sent contact information directly to us; the one who did not provide contact information sent a general survey URL to their email list for us. The completeness of the contact information varied by source. After cleaning the contact information and removing duplicates, we sent the survey to the 475 contacts for whom we had direct contact information, and one incubator director sent the survey link directly to their 75 contacts. All told, the Stage One survey was sent to 550 contacts (475 direct contacts plus 75) and was completed by 248 respondents, yielding an overall response rate of 45%.1
The Stage Two survey was sent to 114 contacts identified by the initial respondents in Stage One to round out our characterization of the market with a broader set of stakeholders. A total of 63 contacts completed the Stage Two survey, a response rate of 55%.2
IEc coded open-ended responses to the survey, and analyzed survey responses, comparing responses by region, type of organization, and type of technology focus.
1 The target response rate for Stage One in our work plan was 50%. This was very nearly achieved (49%) for the contacts where the IEc team received direct contact information, as we were able to conduct targeted follow-up by email and phone. We were not able to conduct similar follow-up with the 75 contacts in the incubator that distributed the survey link directly to their contacts as we did not have their contact information, and the response rate for that group was considerably lower (17%). 2 This comfortably exceeds our target response rate of 25% for Stage Two. Our target response rate was lower for Stage Two because it included individuals who have not been directly involved in the ICBD program.

2
B.1.2 Survey gaps and limitations
In Stage One, IEc attempted to conduct a full census of all past and present participants and service providers affiliated with ICBD-funded incubators, POCCs, and the EIR program. In the end, IEc received contact information from the POCCs and EIR program, and from five of the six incubators. Contact information provided by some of the incubators was partial and incomplete; also, IEc was not able to examine the completeness of the 75 contacts for the incubator who sent the survey link directly to their distribution list. As such, we cannot be sure that the survey sample was perfectly representative of the general population.
Phase Two used an opportunistic sample, based on contact information furnished by respondents in Phase One, so again, we do not know if Phase Two is representative of the general population. However, a comparison between Phase One and Phase Two responses did not reveal any systematic differences between the two groups; the response patterns were generally consistent. Additionally, the information collected through interviews was generally consistent with the survey data on most topics, which lends confidence to our overall conclusions.
B.1.3 Survey Transmittal letter from NYSERDA Dear [NAME]: The New York State Energy Research and Development Authority (NYSERDA) is conducting a survey of the State’s clean energy sector. The survey will help NYSERDA identify drivers and barriers that affect the success of early-stage clean energy companies and entrepreneurs in New York State. The survey results will help NYSERDA improve programs that serve New York. Within the next few days, you will receive an email that contains the survey link. The email will come directly from APPRISE and Opinion America, independent research firms that are administering the survey on behalf of NYSERDA. The survey should take approximately 10 minutes to complete. We are administering the survey in stages. You or your organization were selected to take the survey because a respondent from an earlier stage indicated they have interacted with you or your organization regarding business development, product development, investment, or other clean energy issues in New York State. If there is another person in your organization who would be a more appropriate contact for the survey, please forward this email to him or her. Your participation in this survey is very important as NYSERDA works to improve programs that support new businesses and clean energy technology. We are interested in your feedback regardless of whether or not your organization has ever received services from NYSERDA. Your knowledge and feedback are greatly appreciated. The information you provide will be kept private to the extent permitted by law. The analysis will only use summary level data; no individual respondents or firms will be identified. Should you have any questions about the survey, please contact Patricia Gonzales at NYSERDA at [email protected] or 518-862-1090, ext. 3338. You may also contact APPRISE’s Daniel Bausch at [email protected] or 609-252-9050. If you do not wish to participate or receive additional communications, you may opt-out by replying to this e-mail. Thank you for your time and participation.
Sincerely, Patricia GSenior Pro NYSERD17 Colum518-862-Patricia.Gnyserda.follow : fr
B.1.4 Su Dear [NA You were(NYSERDidentify dentreprenemessage wadministe To take th{LINK} Survey ID You or yoindicated developmyour orga The surveimportanttechnologreceived s The informuse summ If you preShould yoPatricia.GBausch at Thank you
,
Gonzales, Ph.Doject Manage
DA mbia Circle | -1090, ext. [email protected] riend : conne
urvey Tran
AME]:
e recently conDA) regardingdrivers and bareurs in New Ywith the surveering the surve
he survey, ple
D: INCXXX
our organizatithey have int
ment, investmeanization who
ey should taket as NYSERDgy. We are intservices from
mation you prmary level data
efer to take thou have any q
Gonzales@nyst daniel-bausc
u for your tim
D. er, Performanc
Albany, NY 3338 nyserda.ny.g
ect with NYS
nsmittal let
ntacted by the g a survey of rriers that affYork State. Iney link from Aey on behalf o
ease click on t
ion were selecteracted with yent, or other c would be a m
e approximateDA works to imterested in youNYSERDA.
rovide will bea; no individu
e survey by pquestions abouserda.ny.gov ch@apprisein
me and partici
ce and Marke
12203-6399
gov
SERDA
tter from A
New York Stf the State’s clfect the succesn that email, NAPPRISE andof NYSERDA
the link below
cted to take thyou or your o
clean energy imore appropri
ely 10 minutemprove progrur feedback r Your knowle
e kept privateual responden
phone, please ut the survey,or 518-862-1
nc.org or 609-
ipation.
3
et Standards
9
APPRISE an
tate Energy Rlean energy sess of early-staNYSERDA ind Opinion AmA.
w or copy and
his survey becorganization rissues in Newiate contact, p
es to completerams that supregardless of wedge and feed
e to the extentnts or firms w
respond to th, please conta090, ext. 333252-9050.
nd OA
Research andector. The surage clean enendicated that merica, indepe
d paste it into
cause a previoregarding bus
w York State. please forwar
e. Your particpport new buswhether or nodback are grea
t permitted bywill be identifi
his e-mail or cact Patricia Go38. You may a
Developmentrvey will help
ergy companieyou would reendent resear
your web bro
ous survey resiness developIf there is ano
rd this email t
cipation in thiinesses and cot your organatly appreciat
y law. The anied.
call toll-free aonzales at NYalso contact A
t Authority p NYSERDAes and eceive a followch firms that
owser.
espondent pment, producother person ito him or her.
is survey is veclean energy ization has evted.
nalysis will on
at 866-519-28YSERDA at APPRISE’s D
A
w-up are
ct in
ery
ver
nly
846.
Daniel
Sincerely, Patricia GSenior Pro NYSERD17 Colum518-862-Patricia.Gnyserda.follow : fr
B.1.5 Su
Introduct Thank youserve earl This surve Identi
servichow N
Identiincub
Identi Most respvaluable a NYSERDthe surveyconfidentinot attribu Please clic Part I: Ba
1. W
,
Gonzales, Ph.Doject Manage
DA mbia Circle | -1090, ext. [email protected] riend : conne
urvey Instr
tion
u for participy-stage clean
ey aims to: ify the driversces currently pNYSERDA anify business oator, proof-ofify other clean
pondents will and we apprec
DA has hired iy. IEc and APial to the exteute any answe
ck “next” to b
ckground
What is your n
D. er, Performanc
Albany, NY 3338 nyserda.ny.g
ect with NYS
rument
ICB
ating in this sn energy comp
s of entreprenprovided to cnd its partner
outcomes for if-concept cenn energy entr
be able to comciate your inp
independent cPPRISE are inent permitted ers to you as a
begin the surv
name? [short
ce and Marke
12203-6399
gov
SERDA
BD SURV
survey. Your panies and en
neurial succeslean energy e
rs can help filindividuals an
nter, and entreepreneurs, co
mplete the suput.
contractors, Inndependent reby law. The can individual.
vey.
text box – fir
4
et Standards
9
VEY INSTR
responses wilntrepreneurs in
ss in the Stateentrepreneurs l these gaps. nd companiesepreneurs in rompanies, and
urvey in appro
ndustrial Econesearchers. Thcontractors w.
rst name; shor
RUMENT
ll help NYSEn New York S
e’s clean energand early-sta
s that have recresidence servd service prov
oximately 15
nomics (IEc) he informatio
will report all r
rt text box – l
T
ERDA improvState.
gy sector, ideage companie
ceived NYSEvices. viders in New
minutes. We
and APPRISn you provideresponses in a
last name]
ve programs t
entify gaps in es, and explor
ERDA-funded
w York State.
know your ti
SE, to adminise will be keptaggregate, an
that
e
d
ime is
ster t d will

5
2. What is the name of your current company or organization? [short text box]
3. Did your company or organization change its name in the last six years?
1. Yes 2. No [SKIP TO Q5]
[If yes, continue to Question 4. If no, skip to Question 5.]
4. What was the former name of your company or organization? [short text box]
5. In which New York State region(s) is your company or organization located? Select all that
apply.
a. Long Island: Nassau and Suffolk counties b. New York City: Brooklyn, Bronx, Manhattan, Queens and Staten Island c. Lower Hudson Valley: Dutchess, Orange, Putnam, Rockland, Sullivan, Ulster and
Westchester counties d. Capital Region/Northern Catskills: Albany, Columbia, Delaware, Greene,
Montgomery, Otsego, Rensselaer, Schenectady and Schoharie counties e. Eastern Adirondacks/Lake Champlain: Clinton, Essex, Franklin, Fulton, Hamilton,
Saratoga, Warren and Washington counties f. Western Adirondacks/Eastern Lake Ontario: Herkimer, Jefferson, Lewis, Oneida and
St. Lawrence counties g. Central New York: Broome, Cayuga, Chenango, Cortland, Madison, Onondaga,
Oswego, Tioga and Tompkins counties h. Western Finger Lakes: Chemung, Genesee, Livingston, Monroe, Ontario, Orleans,
Schuyler, Seneca, Steuben, Wayne and Yates counties i. Western New York: Allegany, Chautauqua, Cattaraugus, Erie, Niagara and Wyoming
counties j. Some of my company’s/organization’s locations are outside of New York State. k. All of my company’s/organization’s locations are outside of New York State.
6. With which clean energy sector(s) does your company or organization most closely identify?
Select all that apply.
a. Solar b. Wind c. Renewable fuels d. Marine e. Bioenergy f. Biomass g. Fuel cells h. Geothermal i. Waste to energy j. Cogeneration k. Transportation (including vehicles, charging infrastructure, and traffic management) l. Advanced buildings m. Smart grid n. Energy storage (including batteries, thermal storage, mechanical storage, ultra-capacitors,

6
and hydrogen storage) o. Materials p. Industrial equipment q. Information technology (including software, measurement and analytics, data centers and
devices) r. Clean energy services s. Balance of system services (e.g., installation) t. Clean energy finance u. Other (please specify)
7. Do you currently have a senior leadership role in your organization?
1. Yes 2. No
8. Which of the following terms best describes your organization? Select all that apply.
a. Company b. Proof of concept center (POCC) c. Proof of concept center team d. Incubator e. Incubator client f. Entrepreneur in Residence g. Government Agency h. University or college i. Other (please specify)
[If respondent selects “Proof of concept center team”, “Incubator client”, or “Other” AND “company” is not selected, go to Q9.] [If respondent selects “Company”, proceed to Part II (Q10), even if other options are picked]. [If respondent selects “Proof of concept center (POCC)”, “Incubator”, or “Entrepreneur in Residence” AND “company”, “Proof of concept center team”, “Incubator client”, and “other” are NOT selected, skip to Part III (Q21)
9. [ASK IF Q8 = E, G, OR I AND Q8=A IS NOT SELECTED] Do you intend to start a new
company with connections to the clean energy sector?
1. Yes, within the next 6 months. 2. Yes, within the next 1-2 years. 3. Yes, but I’m at least 2 years away. 4. No.
[For respondents who answered Question 9, Skip to Part III: Drivers of Clean Energy Entrepreneurship in New York State.]
Part II: Business Lifecycle [ASKED IF RESPONDENT SELECTED “COMPANY” IN Q8]
10. In what year was your company formally established? [date field with year]
11. How much time elapsed from the initial business idea to company formation?
7
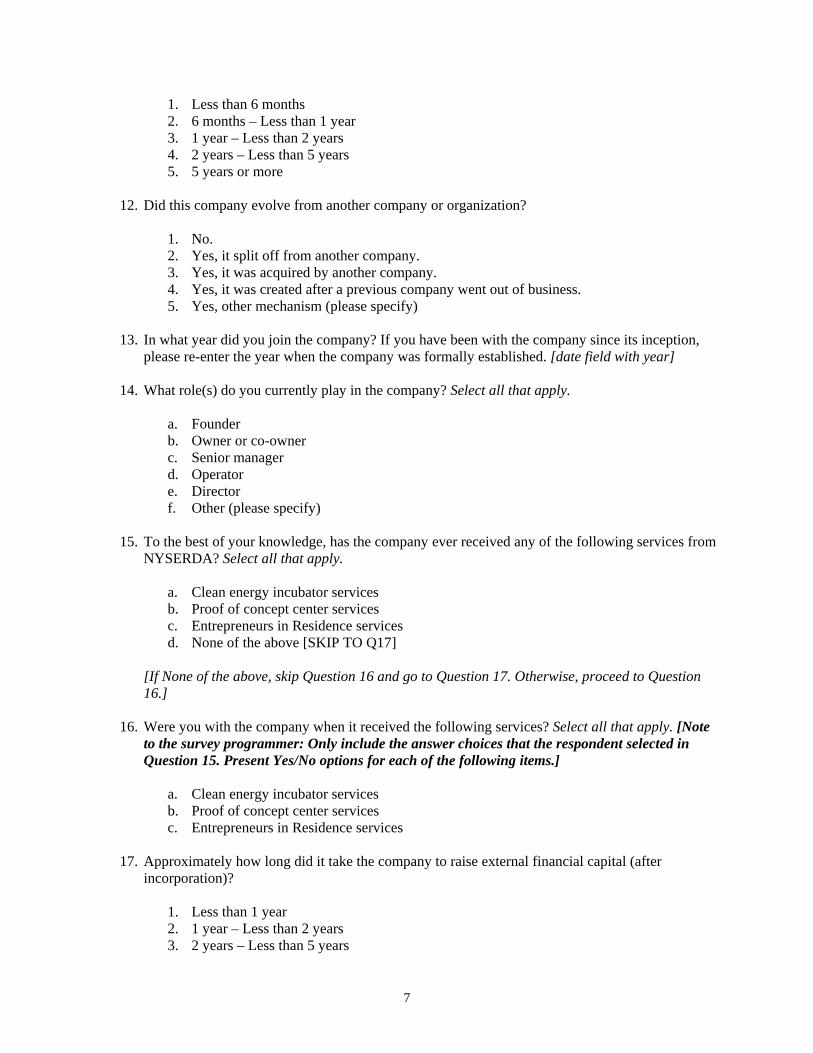
1. Less than 6 months 2. 6 months – Less than 1 year 3. 1 year – Less than 2 years 4. 2 years – Less than 5 years 5. 5 years or more
12. Did this company evolve from another company or organization?
1. No. 2. Yes, it split off from another company. 3. Yes, it was acquired by another company. 4. Yes, it was created after a previous company went out of business. 5. Yes, other mechanism (please specify)
13. In what year did you join the company? If you have been with the company since its inception,
please re-enter the year when the company was formally established. [date field with year]
14. What role(s) do you currently play in the company? Select all that apply.
a. Founder b. Owner or co-owner c. Senior manager d. Operator e. Director f. Other (please specify)
15. To the best of your knowledge, has the company ever received any of the following services from
NYSERDA? Select all that apply.
a. Clean energy incubator services b. Proof of concept center services c. Entrepreneurs in Residence services d. None of the above [SKIP TO Q17]
[If None of the above, skip Question 16 and go to Question 17. Otherwise, proceed to Question 16.]
16. Were you with the company when it received the following services? Select all that apply. [Note
to the survey programmer: Only include the answer choices that the respondent selected in Question 15. Present Yes/No options for each of the following items.]
a. Clean energy incubator services b. Proof of concept center services c. Entrepreneurs in Residence services
17. Approximately how long did it take the company to raise external financial capital (after
incorporation)?
1. Less than 1 year 2. 1 year – Less than 2 years 3. 2 years – Less than 5 years
8
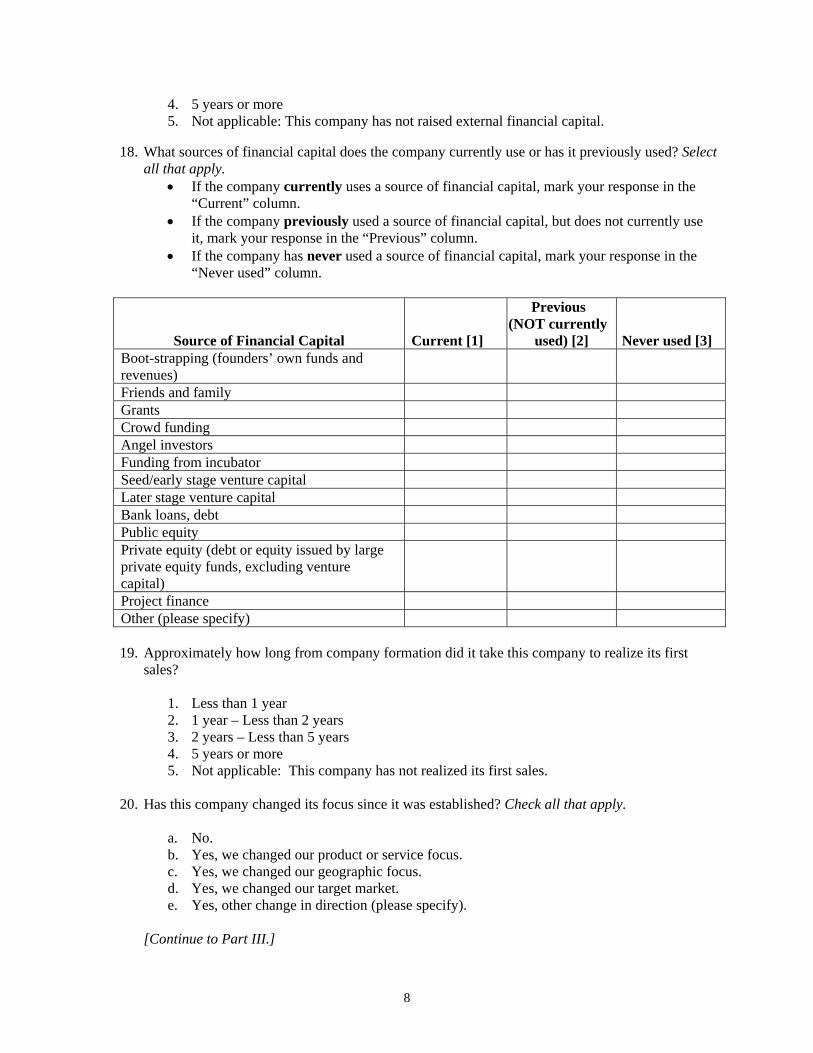
4. 5 years or more 5. Not applicable: This company has not raised external financial capital.
18. What sources of financial capital does the company currently use or has it previously used? Select
all that apply. If the company currently uses a source of financial capital, mark your response in the
“Current” column. If the company previously used a source of financial capital, but does not currently use
it, mark your response in the “Previous” column. If the company has never used a source of financial capital, mark your response in the
“Never used” column.
Source of Financial Capital Current [1]
Previous (NOT currently
used) [2] Never used [3] Boot-strapping (founders’ own funds and revenues)
Friends and family Grants Crowd funding Angel investors Funding from incubator Seed/early stage venture capital Later stage venture capital Bank loans, debt Public equity Private equity (debt or equity issued by large private equity funds, excluding venture capital)
Project finance Other (please specify)
19. Approximately how long from company formation did it take this company to realize its first
sales?
1. Less than 1 year 2. 1 year – Less than 2 years 3. 2 years – Less than 5 years 4. 5 years or more 5. Not applicable: This company has not realized its first sales.
20. Has this company changed its focus since it was established? Check all that apply.
a. No. b. Yes, we changed our product or service focus. c. Yes, we changed our geographic focus. d. Yes, we changed our target market. e. Yes, other change in direction (please specify).
[Continue to Part III.]

9
Part III: Drivers of Clean Energy Entrepreneurship in New York State [ASKED TO ALL]
21. Of the following factors, please select the top three (3) most important DRIVERS or ENABLERS for clean energy entrepreneurship in the State of New York: [Note to survey programmer: Please limit the number of choices that each respondent can select to up to 3.]
a. Supportive State regulatory framework b. Existence of supportive State policies c. Tax incentives and subsidies d. Availability of R&D e. Access to financial capital f. Access to human capital – talent g. Access to large customers in the State h. Networks of other energy entrepreneurs and service providers i. Proximity to large customer base j. Market demand k. Energy prices in the State l. Availability of business services to support entrepreneurial companies m. Help of incubators and accelerators n. Culture of entrepreneurship in the State o. Success stories of energy entrepreneurs in the State p. Adequate supply of necessary materials/production inputs q. Physical infrastructure – transportation r. Physical infrastructure – electrical grid s. Other (please briefly describe – limit number characters)
22. Of the following factors, select the top three (3) most important BARRIERS to clean energy
entrepreneurship in the State of New York: [Note to survey programmer: Please limit the number of choices that each respondent can select to up to 3.]
a. Unsupportive/difficult State regulatory framework b. Lack of supportive State policies c. Lack of tax incentives and subsidies d. High business tax rates e. Lack of R&D capabilities f. Lack of access to financial capital g. Lack of access to human capital – talent h. Lack of access to large customers in the State i. Small customer base j. Energy prices in the State k. Gas prices l. Lack of access to business services to support entrepreneurial companies m. Limited access to incubators and accelerators n. Lack of a strong culture of entrepreneurship in the State o. Lack of success stories of energy entrepreneurs in the State p. Inadequate supply of necessary materials/production inputs q. Physical infrastructure – transportation r. Physical infrastructure – electrical grid s. Other (please briefly describe – limit number characters)

10
Part V: Current and Former NYSERDA-Funded Incubator Clients [ASKED TO ALL]
23. Do you currently or have you previously received services or assistance from a NYSERDA-funded incubator? These include the following:
CEBIP: Clean Energy Business Incubator Program (CEBIP) at Stony Brook University Clean Tech Center: Clean Tech Center at The Tech Garden Directed Energy: Directed Energy at University at Buffalo iClean: iClean at SUNY Polytechnic Institute ACRE: ACRE at NYU Tandon School of Engineering Venture Creations: Venture Creations at Rochester Institute of Technology
1. Yes, currently 2. Yes, previously 3. No [SKIP TO SECTION VI]
[If yes, go to Q24. If no, skip to Section VI.]
24. [IF Q23 = A or B] Please indicate which NYSERDA-funded incubator you currently are or
previously were involved with.
1. CEBIP: Clean Energy Business Incubator Program (CEBIP) at Stony Brook University 2. Clean Tech Center: Clean Tech Center at The Tech Garden 3. Directed Energy: Directed Energy at University at Buffalo 4. iClean: iClean at SUNY Polytechnic Institute 5. ACRE: ACRE at NYU Tandon School of Engineering 6. Venture Creations: Venture Creations at Rochester Institute of Technology 7. Don’t Know
25. In what year did you join the incubator?
1. 2006 2. 2007 3. 2008 4. 2009 5. 2010 6. 2011 7. 2012 8. 2013 9. 2014 10. 2015 11. 2016
26. What are the three (3) most useful services that you received from the incubator to help you
achieve your business goals? Select up to three of the following options. [Note to survey programmer: Please limit the number of choices that each respondent can select to up to 3.]
a. General information b. Direct technical assistance c. Business services (e.g., legal, accounting, administrative support) d. Office space/ lab space e. Direct funding

11
f. Introductions to new customers g. Introductions to investors h. Feedback on business plan and/or strategy i. Mentoring/support j. Other service provided (please specify)
27. Are there any additional services that you wish the incubator had provided or would provide?
1. Yes 2. No
[IF YES, GO TO Q28. IF NO, SKIP TO Q29.]
28. What additional services, beyond those already provided, would you like or would you have liked
to receive from the incubator? [short text box]
29. Did you receive any business development assistance from other service providers (outside the incubator) during the same time period?
1. Yes 2. No [SKIP TO Q32]
[IF YES, GO TO Q30. IF NO, SKIP TO Q32.]
30. Please provide the name(s) of the organization(s) that provided the services. [text box]
31. Please identify the three (3) most useful services that you received from the other organization(s)
that you identified in the previous question. Select up to three of the following options. [Note to survey programmer: Please limit the number of choices that each respondent can select to up to 3.]
a. General information b. Direct technical assistance c. Business services (e.g., legal, accounting, administrative support) d. Office space/ lab space e. Direct funding f. Introductions to new customers g. Introductions to investors h. Feedback on business plan and/or strategy i. Mentoring/support j. Other service provided (please specify)
32. Does your company currently have sales revenue?
1. Yes 2. No [SKIP TO SECTION VI]
[IF YES, GO TO Q33. IF NO, SKIP TO SECTION VI.]
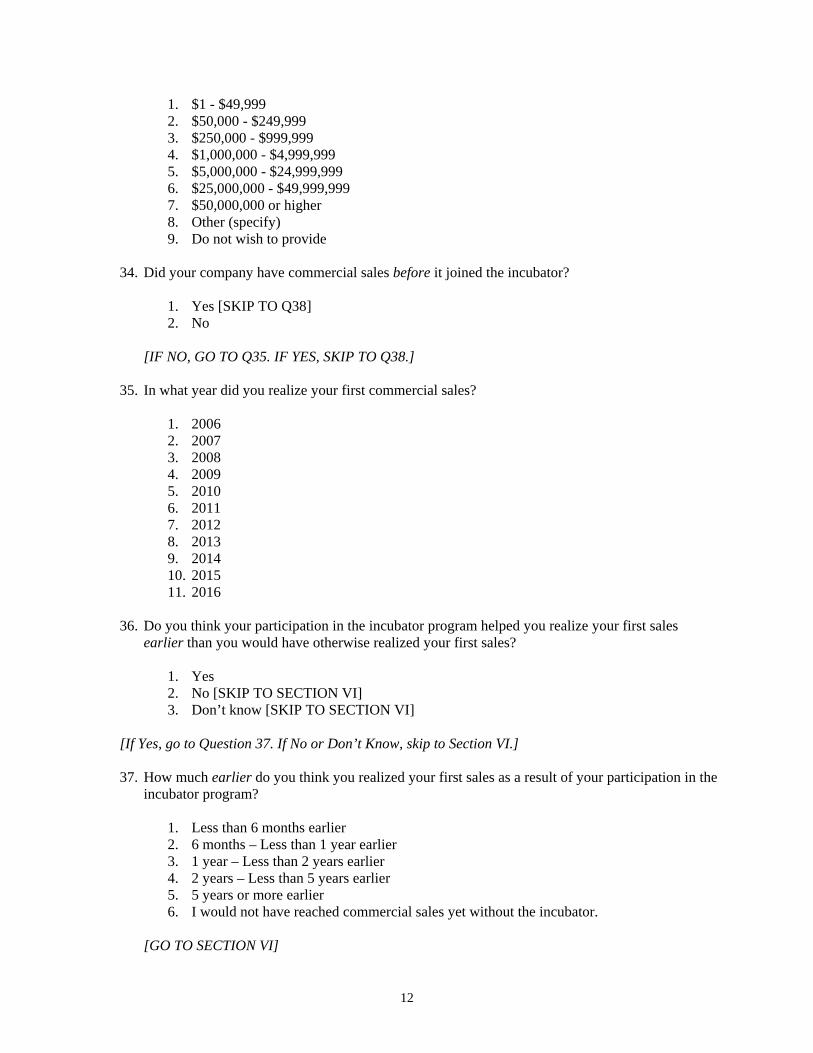
33. What are your approximate current annual sales?
12
1. $1 - $49,999 2. $50,000 - $249,999 3. $250,000 - $999,999 4. $1,000,000 - $4,999,999 5. $5,000,000 - $24,999,999 6. $25,000,000 - $49,999,999 7. $50,000,000 or higher 8. Other (specify) 9. Do not wish to provide
34. Did your company have commercial sales before it joined the incubator?
1. Yes [SKIP TO Q38] 2. No
[IF NO, GO TO Q35. IF YES, SKIP TO Q38.]
35. In what year did you realize your first commercial sales?
1. 2006 2. 2007 3. 2008 4. 2009 5. 2010 6. 2011 7. 2012 8. 2013 9. 2014 10. 2015 11. 2016
36. Do you think your participation in the incubator program helped you realize your first sales
earlier than you would have otherwise realized your first sales?
1. Yes 2. No [SKIP TO SECTION VI] 3. Don’t know [SKIP TO SECTION VI]
[If Yes, go to Question 37. If No or Don’t Know, skip to Section VI.]
37. How much earlier do you think you realized your first sales as a result of your participation in the
incubator program?
1. Less than 6 months earlier 2. 6 months – Less than 1 year earlier 3. 1 year – Less than 2 years earlier 4. 2 years – Less than 5 years earlier 5. 5 years or more earlier 6. I would not have reached commercial sales yet without the incubator.
[GO TO SECTION VI]

13
38. Since joining the incubator, have your sales increased, decreased, or stayed about the same?
1. Increased 2. Decreased [SKIP TO Q40] 3. Stayed about the same [SKIP TO Q40]
[IF INCREASED, GO TO Q39. IF DECREASED OR STAYED THE SAME, SKIP TO Q40.]
39. How influential was the incubator in helping you increase your sales volume? Please answer on a
scale from 1 to 5, where 1 means not at all influential and 5 means extremely influential.
1. Not at all influential 2. Slightly influential 3. Somewhat influential 4. Very influential 5. Extremely influential
[GO TO SECTION VI.]
40. Do you think your sales today would be higher, lower, or about the same if you had not
participated in the incubator program?
1. Higher 2. Lower 3. About the same
Part VI: Current and Former NYSERDA-Funded POCC Clients [ASKED TO ALL]
41. Do you currently or have you previously received services or assistance from a NYSERDA-funded Proof of Concept Center (POCC)? These include the following:
PowerBridge NY (Columbia University and NYU-Polytechnic/Tandon School of Engineering)
NEXUS-NY (High Tech Rochester)
1. Yes, currently 2. Yes, previously 3. No [SKIP TO SECTION VII]
[If yes, go to Q42. If no, skip to Section VII.]
42. [IF Q41= A or B] Please indicate which NYSERDA-funded Proof of Concept Center you
currently are or previously were involved with.
1. PowerBridge NY (Columbia University and NYU-Polytechnic/Tandon School of Engineering)
2. NEXUS-NY (High Tech Rochester) 3. Don’t Know
43. In what year did you join the Proof of Concept Center?

14
1. 2013 2. 2014 3. 2015 4. 2016
44. How many people are currently involved in your Proof of Concept Center team? [numeric box]
45. How would you describe the people on your Proof of Concept team? Select all that apply.
a. Employees b. Contractors c. Academic research partners d. Business advisors e. Other (please specify)
46. Do you plan on hiring additional people within the next year?
1. Yes 2. No [SKIP TO Q48]
[If yes, continue to Q47. If no, skip to Q48.] 47. Approximately how many people do you plan on hiring within the next year? [numeric field]
48. Do you have a company that you formed during or after your time in the Proof of Concept
Center?
1. Yes 2. No [SKIP TO Q50]
[If yes, continue to Q49. If no, skip to Q50.]
49. How many years elapsed from the time you joined the Proof of Concept Center to the time you
formed your company?
1. Less than 6 months 2. 6 months – Less than 1 year 3. 1 year – Less than 2 years 4. 2 years – Less than 5 years 5. 5 years or more
[Skip to Q51.]
50. Do you intend to form a company with connections to the clean energy sector?
1. Yes, within the next 6 months. 2. Yes, within the next 1 year. 3. Yes, within the next 2-3 years. 4. Yes, but I’m at least 3 years away. 5. No.

15
51. Have you sought and/or raised external financial capital? [SELECT ONE ONLY]
1. We have raised external financial capital. 2. We have sought – but not yet raised – external financial capital. [SKIP TO Q53] 3. We have not sought or raised external financial capital. [SKIP TO Q54]
[If respondent selects (a), go to Q52. If respondent selects (b), go to Q53. If respondent selects (c), go to Q54.]
52. From which source(s) have you raised external financial capital?
a. Boot-strapping (founders’ own funds and revenues) b. Friends and family c. Grants d. Crowd funding e. Angel investors f. Funding from incubator g. Seed/early stage venture capital h. Later stage venture capital i. Bank loans, debt j. Public equity k. Private equity (debt or equity issued by large private equity funds, excluding venture
capital) l. Project finance m. Other – please specify
[Go to Q54.]
53. From which source(s) have you sought external financial capital?
a. Boot-strapping (founders’ own funds and revenues) b. Friends and family c. Grants d. Crowd funding e. Angel investors f. Funding from incubator g. Seed/early stage venture capital h. Later stage venture capital i. Bank loans, debt j. Public equity k. Private equity (debt or equity issued by large private equity funds, excluding venture
capital) l. Project finance m. Other – please specify
54. Have you filed for any patents based on the research conducted during your time in the Proof of
Concept Center? 1. Yes, we filed for and received one or more patents. 2. Yes, we have filed for one or more patents, but have not yet received them. [SKIP TO Q57] 3. No, but we expect to file for a patent in the future. [SKIP TO Q57]

16
4. No, and we do not expect to file for any patents. [SKIP TO Q57]
[If respondent selects (a), continue to Q55. Otherwise, skip to Q57.]
55. How many patents have you received in connection with research conducted during your time with the Proof of Concept Center? [enter number in numeric response field]
56. What type(s) of patent(s) have you received in connection with research conducted during your time with the Proof of Concept Center? Select all that apply.
a. Design patent b. Utility patent c. Plant patent d. Reissue patent e. Statutory invention registration
57. Is/was any of the research conducted during your time with the Proof of Concept Center
sponsored by industry?
1. Yes 2. No [SKIP TO Q61]
[If yes, continue to Q58. Otherwise, skip to Q61.]
58. Was the industry-sponsored research formalized in an agreement(s) with your industry sponsor?
1. Yes 2. No [SKIP TO Q60]
[If yes, continue to Q59. If no, skip to Q60.]
59. How many agreements did you sign with your industry sponsor(s)? [enter number in numeric
response field]
60. Which of the following resulted from your industry-sponsored research? Select all that apply.
a. Joint invention disclosure b. Joint patent filing c. Product license(s) d. Direct investment by industry sponsor e. Other agreement f. None of the above
61. Please indicate the importance of your participation in the Proof of Concept Center in each of the
following areas. Please answer on a scale from 1 to 5, where 1 means not at all important and 5 means extremely important.

17
1) Not at all important
2) Slightly important
3) Somewhat important
4) Very important
5) Extremely important
Strengthening or reinforcing your desire to be an entrepreneur [A]
Introducing you to valuable business contacts (including but not limited to members of your team) [B]
Helping you achieve your entrepreneurial goals [C]
Part VII: Current and Former EIR Clients [ASKED TO ALL]
62. Are you currently or were you previously receiving business development assistance/services from an Entrepreneur in Residence (EIR)?
a. Yes, currently b. Yes, previously c. No [SKIP TO Q71]
[If yes, continue to Q63. If no, skip to end of the survey.]
63. In what year did you begin receiving services from an EIR?
a. 2006 b. 2007 c. 2008 d. 2009 e. 2010 f. 2011 g. 2012 h. 2013 i. 2014 j. 2015 k. 2016
64. What types of services are/were you currently or previously receiving from your EIR? Select all
that apply.
a. General business information b. Feedback on business plan or strategy c. Introductions to new investors d. Introductions to new customers e. Mentoring f. Other (please specify)

18
65. Have you participated in any NYSERDA-sponsored networking events that your EIR introduced you to?
a. Yes b. No [SKIP TO Q69]
[If yes, continue to Q66. If no, skip to Q69.]
66. How many of these networking events have you participated in?
a. 1 to 3 b. 4 to 6 c. More than 6
67. Did you make any valuable contacts during these networking events?
a. Yes b. No [SKIP TO Q69]
[If yes, continue to Q68. If no, skip to Q69]
68. What type of valuable contact(s) did you make during the networking events? Select all that apply.
a. Business partner b. Investor c. Supplier d. Manufacturer e. Distributor f. Customer g. Large company (potential acquirer or partner) h. Acquisition target i. Mentor(s) j. Other entrepreneur(s) k. Other (please specify)
69. Have you signed any contracts with contacts that were facilitated by your EIR. Select all that
apply.
a. Yes, with a business partner. b. Yes, with a supplier. c. Yes, with a manufacturer. d. Yes, with a distributor. e. Yes, with a new customer. f. Yes, with a large company. g. Yes, with other (please specify). h. No.
70. How important or unimportant was/is your relationship with your EIR in helping achieve your
entrepreneurial goals? Please answer on a scale from 1 to 5, where 1 means not at all important and 5 means extremely important.

19
1. Not at all important 2. Slightly important 3. Somewhat important 4. Very important 5. Extremely important
71. [ASK TO ALL] NYSERDA is interested in learning who you think are the top leaders in your
field in New York State. In the table below, please list who you think are the top individuals in your field in New York State, as well as the organization they are affiliated with. You can provide as much information as you would like. You can click “Next” when you are ready to proceed.
Name Organization #1 #2 #3
CONTINUE NEXT [GOES TO SCREEN 1 FOR Q72 BELOW]
Question 72 Approach
SCREEN 1: You are almost finished with this survey! Thank you again for your time. For this final section, NYSERDA is interested in learning about other individuals and organizations that you interact with regarding clean energy business development, product development, investment, or other clean energy issues in New York State. NYSERDA wants to use this information to deepen its understanding of the State’s clean energy sector, and to potentially contact these individuals and organizations to participate in a similar survey about their experiences and feedback. In the table below, we would like you to provide up to five individuals and organizations that you have interacted with regarding clean energy issues in New York State in the past six years. You can provide as much information as you would like. If you do not wish to provide any information, you can click “Next” to proceed.
Contact Name Contact Organization Contact #1 Contact #2 Contact #3 Contact #4 Contact #5
CONTINUE NEXT [GOES TO CLOSING SCREEN]
20
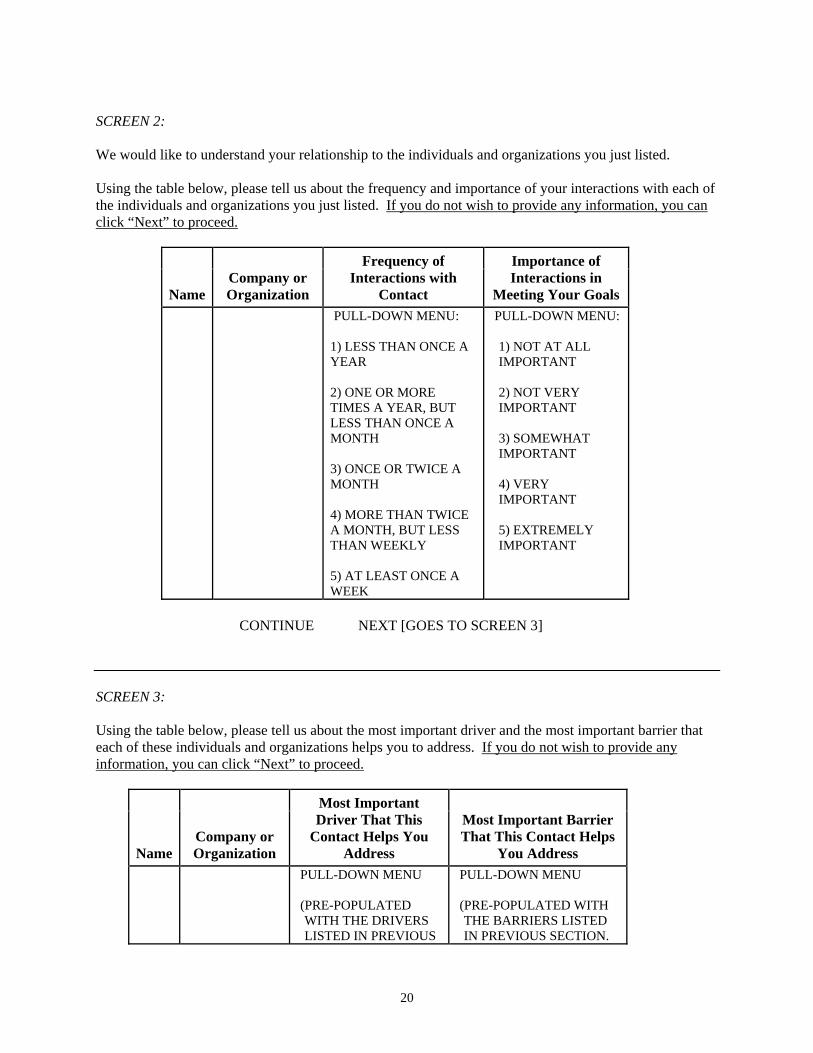
SCREEN 2: We would like to understand your relationship to the individuals and organizations you just listed. Using the table below, please tell us about the frequency and importance of your interactions with each of the individuals and organizations you just listed. If you do not wish to provide any information, you can click “Next” to proceed.
Name Company or Organization
Frequency of Interactions with
Contact
Importance of Interactions in
Meeting Your Goals PULL-DOWN MENU:
1) LESS THAN ONCE A YEAR 2) ONE OR MORE TIMES A YEAR, BUT LESS THAN ONCE A MONTH 3) ONCE OR TWICE A MONTH 4) MORE THAN TWICE A MONTH, BUT LESS THAN WEEKLY 5) AT LEAST ONCE A WEEK
PULL-DOWN MENU: 1) NOT AT ALL IMPORTANT 2) NOT VERY IMPORTANT 3) SOMEWHAT IMPORTANT 4) VERY IMPORTANT 5) EXTREMELY IMPORTANT
CONTINUE NEXT [GOES TO SCREEN 3]
SCREEN 3: Using the table below, please tell us about the most important driver and the most important barrier that each of these individuals and organizations helps you to address. If you do not wish to provide any information, you can click “Next” to proceed.
Name Company or Organization
Most Important Driver That This
Contact Helps You Address
Most Important Barrier That This Contact Helps
You Address
PULL-DOWN MENU (PRE-POPULATED WITH THE DRIVERS LISTED IN PREVIOUS
PULL-DOWN MENU (PRE-POPULATED WITH THE BARRIERS LISTED IN PREVIOUS SECTION.

21
Name Company or Most Important Most Important Barrier SECTION.
INCLUDE N/A AND DON’T KNOW)
INCLUDE N/A AND DON’T KNOW)
CONTINUE NEXT [GOES TO SCREEN 4] SCREEN 4: We would like to understand if the individuals and organizations you listed provide services to you or receive services from you. Using the table below, please tell us if the individuals and organizations you listed provide each service to you, if your organization provides the service to the contact, or if your organization and the contact’s organization both provide this service to each other. If you do not wish to provide any information, you can click “Next” to proceed.
Name Company or Organization
General Infor-mation
Direct Technical Assistance
Direct Funding
Intro-ductions to new
customers or
investors
Feedback on
business plan or strategy
Mentoring /
support PROVIDES
TO US WE PROVIDE BOTH Neither/ Not Applicable
PROVIDES TO US WE PROVIDE BOTH Neither/ Not Applicable
PROVIDES TO US WE PROVIDE BOTH Neither/ Not Applicable
PROVIDES TO US WE PROVIDE BOTH Neither/ Not Applicable
PROVIDES TO US WE PROVIDE BOTH Neither/ Not Applicable
PROVIDES TO US WE PROVIDE BOTH Neither/ Not Applicable
CONTINUE NEXT [GOES TO SCREEN 5]
SCREEN 5: For each of the individuals that you listed, please provide their contact information. We may use the information that you provide to contact these individuals to participate in a similar survey about their experiences and feedback. If you do not wish to provide any information, you can click “Next” to proceed.

22
Contact Name Contact Organization Contact E-mail Contact Phone
CONTINUE NEXT [GOES TO CLOSING SCREEN]
CLOSING SCREEN: You have completed the survey! Thank you for your time and participation. Have a great day.

23
B.2. Interviews
B.2.1 Interview Steps
We conducted 68 semi-structured interviews with ICBD program staff, incubator and POCC directors, entrepreneurs in residence, entrepreneurs, large companies, and investors.
Interview steps taken were:
We identified five key stakeholder groups for the study – providers of business development and support services, entrepreneurial cleantech companies, large companies active in the cleantech economy, academic and research centers, and investors in cleantech companies
Semi-structured phone interviews lasted 30 and 45 minutes
We coded responses and categorized respondents using qualitative data analysis software NVivo, and used the data to examine insights into themes identified from the literature review and extract qualitative and quantitative findings for each section of the report.
Interview gaps and limitations:
Our final set of 68 interviews did not include companies that had gone out of business or low-growth companies that did not participate in incubators, as initially intended.
We conducted fewer interviews than planned with corporate research centers and large companies, and conducted more interviews than planned with investors and entrepreneurial companies.
Question order and wording varied across interviews to support semi-structured, open discussion. In some cases interviews did not cover every question.
Interview questions did not fully align with survey questions. This limits the extent to which we can compare interview and survey results on the same themes, as noted in the analysis.
B.2.2 Interview Questions
Questions to NYSERDA & ICBD Program Staff
1. Characterizing the existing “entrepreneurial ecosystem” for clean energy companies in New York State
a. Do you know of any existing or emerging clean energy clusters (by geography and/or technology) in New York State today? If yes, where/what are they?
b. What key resources does New York State have that enable clean energy entrepreneurship?
c. How do these resources compare to other similar or nearby States? d. Finish this sentence: “The New York State clean energy entrepreneurial
ecosystem would be in trouble without the presence of …..”
2. Gaps and opportunities for developing the NYS clean energy entrepreneurial ecosystem
a. What would you say are some of the key gaps in the entrepreneurial ecosystem in New York State?
24
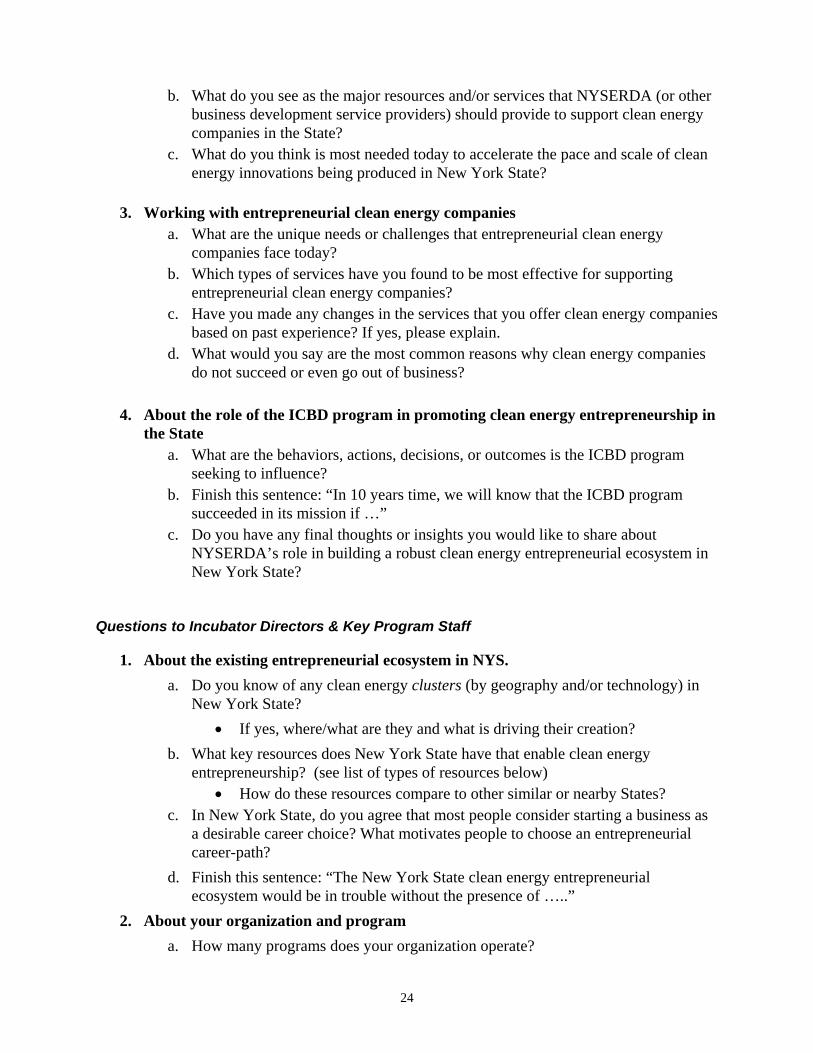
b. What do you see as the major resources and/or services that NYSERDA (or other business development service providers) should provide to support clean energy companies in the State?
c. What do you think is most needed today to accelerate the pace and scale of clean energy innovations being produced in New York State?
3. Working with entrepreneurial clean energy companies
a. What are the unique needs or challenges that entrepreneurial clean energy companies face today?
b. Which types of services have you found to be most effective for supporting entrepreneurial clean energy companies?
c. Have you made any changes in the services that you offer clean energy companies based on past experience? If yes, please explain.
d. What would you say are the most common reasons why clean energy companies do not succeed or even go out of business?
4. About the role of the ICBD program in promoting clean energy entrepreneurship in
the State a. What are the behaviors, actions, decisions, or outcomes is the ICBD program
seeking to influence? b. Finish this sentence: “In 10 years time, we will know that the ICBD program
succeeded in its mission if …” c. Do you have any final thoughts or insights you would like to share about
NYSERDA’s role in building a robust clean energy entrepreneurial ecosystem in New York State?
Questions to Incubator Directors & Key Program Staff
1. About the existing entrepreneurial ecosystem in NYS. a. Do you know of any clean energy clusters (by geography and/or technology) in
New York State? If yes, where/what are they and what is driving their creation?
b. What key resources does New York State have that enable clean energy entrepreneurship? (see list of types of resources below)
How do these resources compare to other similar or nearby States? c. In New York State, do you agree that most people consider starting a business as
a desirable career choice? What motivates people to choose an entrepreneurial career-path?
d. Finish this sentence: “The New York State clean energy entrepreneurial ecosystem would be in trouble without the presence of …..”
2. About your organization and program a. How many programs does your organization operate?
25
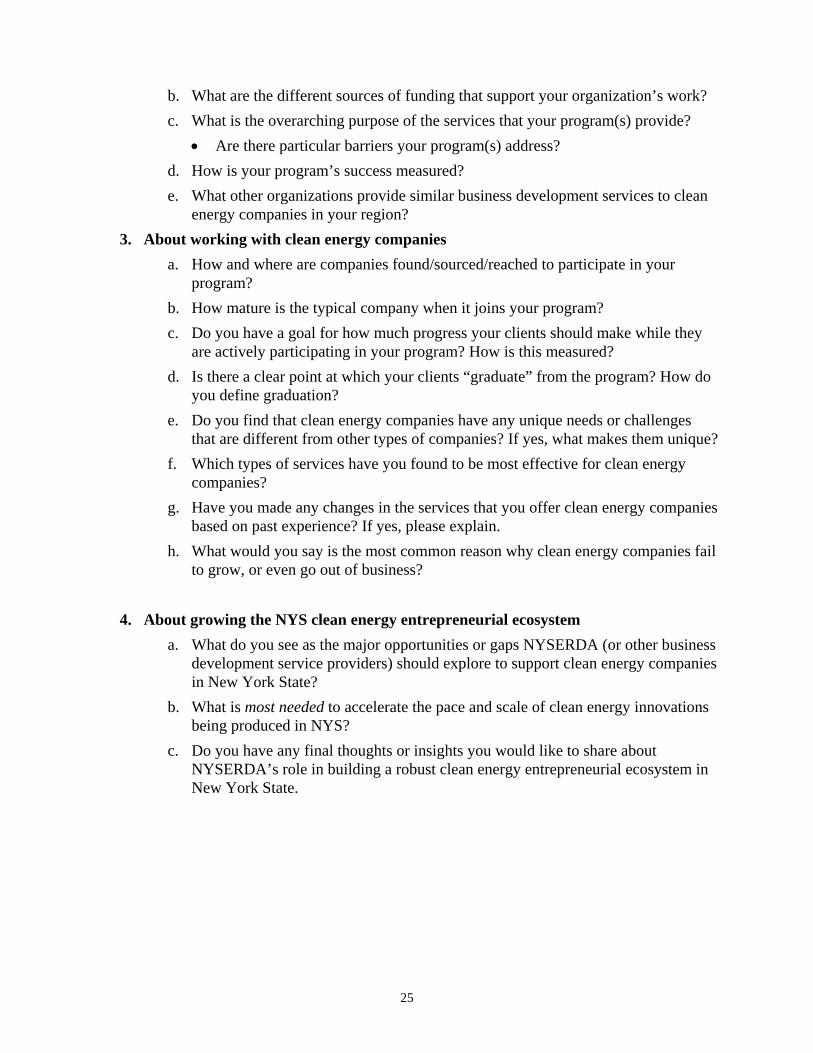
b. What are the different sources of funding that support your organization’s work? c. What is the overarching purpose of the services that your program(s) provide?
Are there particular barriers your program(s) address? d. How is your program’s success measured? e. What other organizations provide similar business development services to clean
energy companies in your region? 3. About working with clean energy companies
a. How and where are companies found/sourced/reached to participate in your program?
b. How mature is the typical company when it joins your program? c. Do you have a goal for how much progress your clients should make while they
are actively participating in your program? How is this measured? d. Is there a clear point at which your clients “graduate” from the program? How do
you define graduation? e. Do you find that clean energy companies have any unique needs or challenges
that are different from other types of companies? If yes, what makes them unique? f. Which types of services have you found to be most effective for clean energy
companies? g. Have you made any changes in the services that you offer clean energy companies
based on past experience? If yes, please explain. h. What would you say is the most common reason why clean energy companies fail
to grow, or even go out of business?
4. About growing the NYS clean energy entrepreneurial ecosystem a. What do you see as the major opportunities or gaps NYSERDA (or other business
development service providers) should explore to support clean energy companies in New York State?
b. What is most needed to accelerate the pace and scale of clean energy innovations being produced in NYS?
c. Do you have any final thoughts or insights you would like to share about NYSERDA’s role in building a robust clean energy entrepreneurial ecosystem in New York State.
26
Questions to POCC Center Directors
1. About the existing entrepreneurial ecosystem in NYS. a. Do you know of any clean energy clusters (by geography and/or technology) in
New York State? If yes, where/what are they and what is driving their creation?
b. What key resources does New York State have that enable clean energy entrepreneurship? (see list of types of resources below)
How do these resources compare to other similar or nearby States? c. In New York State, do you agree that most people consider starting a business as
a desirable career choice? What motivates people to choose an entrepreneurial career-path?
d. Finish this sentence: “The New York State clean energy entrepreneurial ecosystem would be in trouble without the presence of …..”
2. About your organization and program a. How many programs does your organization operate? b. What are the different sources of funding that support your organization’s work? c. What is the overarching purpose of the services that your program(s) provide?
Are there particular barriers your program(s) address? d. How is your program’s success measured? e. What other organizations provide similar business development services to clean
energy companies in your region? 3. About working with clean energy companies
a. How and where are companies found/sourced/reached to participate in your program?
b. How mature is the typical company when it joins your program? c. Do you have a goal for how much progress your clients should make while they
are actively participating in your program? How is this measured? d. Is there a clear point at which your clients “graduate” from the program? How do
you define graduation? e. Do you find that clean energy companies have any unique needs or challenges
that are different from other types of companies? If yes, what makes them unique? f. Which types of services have you found to be most effective for clean energy
companies? g. Have you made any changes in the services that you offer clean energy companies
based on past experience? If yes, please explain.
27
h. What would you say is the most common reason why clean energy companies fail to grow, or even go out of business?
4. About growing the NYS clean energy entrepreneurial ecosystem a. What do you see as the major opportunities or gaps NYSERDA (or other business
development service providers) should explore to support clean energy companies in New York State?
b. What is most needed to accelerate the pace and scale of clean energy innovations being produced in NYS?
c. Do you have any final thoughts or insights you would like to share about NYSERDA’s role in building a robust clean energy entrepreneurial ecosystem in New York State
Questions to Entrepreneurs in Residence
1. About the existing entrepreneurial ecosystem in NYS. a. Do you know of any clean energy clusters (by geography and/or technology) in
New York State? If yes, where/what are they and what is driving their creation?
b. What key resources does New York State have that enable clean energy entrepreneurship? (see list of types of resources below)
How do these resources compare to other similar or nearby States? c. In New York State, do you agree that most people consider starting a business as
a desirable career choice? What motivates people to choose an entrepreneurial career-path?
d. Finish this sentence: “The New York State clean energy entrepreneurial ecosystem would be in trouble without the presence of …..”
2. About your organization and program a. How many programs does your organization operate? b. What are the different sources of funding that support your organization’s work? c. What is the overarching purpose of the services that your program(s) provide?
Are there particular barriers your program(s) address? d. How is your program’s success measured? e. What other organizations provide similar business development services to clean
energy companies in your region? 3. About working with clean energy companies
a. How and where are companies found/sourced/reached to participate in your program?
b. How mature is the typical company when it joins your program?
28
c. Do you have a goal for how much progress your clients should make while they are actively participating in your program? How is this measured?
d. Is there a clear point at which your clients “graduate” from the program? How do you define graduation?
e. Do you find that clean energy companies have any unique needs or challenges that are different from other types of companies? If yes, what makes them unique?
f. Which types of services have you found to be most effective for clean energy companies?
g. Have you made any changes in the services that you offer clean energy companies based on past experience? If yes, please explain.
h. What would you say is the most common reason why clean energy companies fail to grow, or even go out of business?
4. About growing the NYS clean energy entrepreneurial ecosystem a. What do you see as the major opportunities or gaps NYSERDA (or other business
development service providers) should explore to support clean energy companies in New York State?
b. What is most needed to accelerate the pace and scale of clean energy innovations being produced in NYS?
c. Do you have any final thoughts or insights you would like to share about NYSERDA’s role in building a robust clean energy entrepreneurial ecosystem in New York State.
Questions to Economic Development Policy Officers NYS
1. Your observations about the existing entrepreneurial ecosystem in New York State a. Do you know of any clean energy or other technology clusters (by geography
and/or technology) in New York State? If yes, where/what are they?
b. What key resources does New York State have that enable clean energy entrepreneurship?
How do these resources compare to other similar or nearby States? c. What role is NYSERDA playing in this ecosystem today? d. What would you say is the most common reason why entrepreneurial companies
in New York do not grow as planned, or go out of business? Is this the same as for clean energy?
e. In New York State, do you agree that most people consider starting a business as a desirable career choice? What do you think most drives people to start companies?
29
2. About your organization and its programs a. How many programs does your organization run? b. Does your organization have a formal relationship (such as a partnership, or
MOU) with NYSERDA? c. What is the overarching purpose of the services that you provide? d. What behaviors, actions, decisions, or outcomes are you trying to influence? e. Are there any particular barriers your organizations’ services seek to overcome? f. How mature is the typical company when your organization gets involved with
them? g. Do you have a goal for how much progress your clients should make while they
are actively participating in your program? h. Is there a clear point at which your clients “graduate” from working with your
organization? 3. About working with clean energy companies
a. To what extent does your organization work with clean energy companies and entrepreneurs?
b. Are the services that your organization offer clean energy companies different from services provided to other (non-clean energy) companies? If yes, how so?
c. Do you find that clean energy companies have any unique needs or challenges that are different from other types of companies?
d. Which types of advice and services have you found to be most effective for clean energy companies?
e. Have you made any changes in the services that you offer clean energy companies based on past experience?
4. Gaps and opportunities for developing the NYS clean energy entrepreneurial ecosystem
a. Finish this sentence: “The New York State clean energy entrepreneurial ecosystem would be in trouble without the presence of …..”
b. What do you see as the major opportunities or gaps NYSERDA (or other business development service providers) should explore to support clean energy companies in New York State?
c. What is most needed to accelerate the pace and scale of clean energy innovations being produced in NYS?
30
Questions to other leading & nearby CE/innovation states
1. About your organization and program: a. What is the overarching purpose of the services that your program(s) provide? b. What behaviors, actions, decisions, or outcomes are your program(s) trying to
influence? c. Are there any particular barriers your program(s) address?
2. Based on your experience, what have you learned about working with clean energy companies?
a. How mature is the typical company when you get involved with them? b. Do you have a goal for how much progress your clients should make while they
are actively participating in your program? c. Is there a clear point at which your clients “graduate” from working with your
organization? If yes, how do you define graduation? f. Do clean energy companies have any unique needs or challenges that are different
from other types of companies? If yes, please explain. g. Which types of services have you found to be most effective for clean energy
companies? h. Have you made any changes in the services that you offer clean energy companies
based on past experience? If yes, please explain. i. What would you say is the most common reason why clean energy companies
close/ go out of business? 3. Your observations about the existing entrepreneurial ecosystem in your State.
a. Do you know of any clean energy or other technology clusters (by geography and/or technology) in your State? If yes, where/what are they?
b. What other organizations provide business development services to clean energy companies in your State? If yes, who? What do they do?
c. What would you say is the most common reason why clean energy entrepreneurial companies close or go out of business?
d. In your State, do you agree that most people consider starting a business as a desirable career choice?
4. What do you see as the main gaps and opportunities for developing the clean energy entrepreneurial ecosystem?
a. Finish this sentence: “My State’s clean energy entrepreneurial ecosystem would be in trouble without the presence of …..”
b. What is most needed to accelerate the pace and scale of clean energy innovations being produced?
c. What do you see as the major opportunities or gaps that NYSERDA (or other business development service providers) should explore to support clean energy companies?

31
Questions to: Non-ICBD Clean Energy Business Dev. Service Providers
1. About the existing entrepreneurial ecosystem in New York State a. Do you know of any clean energy or other technology clusters (by geography
and/or technology) in New York State? If yes, where/what are they?
b. What key resources does New York State have that enable entrepreneurship? (see below for a list of types of “resources”)
How do these resources compare to other similar or nearby States? Are there any resources unique to clean energy in New York State?
c. How would you characterize NYSERDA’s role in the New York State entrepreneurial ecosystem today?
d. What would you say is the most common reason why entrepreneurial companies in New York do not grow as planned, or go out of business?
Is this the same as for clean energy companies? e. In New York State, do you agree that most people consider starting a business as
a desirable career choice? What do you think most drives people to start companies?
a. Finish this sentence: “New York’s entrepreneurial ecosystem would be in trouble without the presence of …..”
2. About your organization and its programs a. How many programs does your organization run? b. Does your organization have a formal relationship (such as a partnership, or
MOU) with NYSERDA? c. What is the overarching purpose of the services that your organization provides?
What behaviors, actions, decisions, or outcomes are you trying to influence?
Are there any particular barriers your organizations’ services seek to overcome?
d. How mature is the typical company when your organization gets involved with them?
e. Do you have a goal for how much progress your clients should make while they are actively participating in your program?
f. Is there a clear point at which your clients “graduate” from working with your organization?
3. About working with clean energy companies a. Do clean energy companies have any unique needs or challenges that are different
from other types of companies? b. Which types of business development services are most effective for clean energy
companies?

32
4. About developing the entrepreneurial ecosystem in New York State a. What is most needed to accelerate the pace and scale of clean energy innovations
being produced in New York? b. What do you see as the major opportunities or gaps that NYSERDA (or other
business development service providers) should explore to support clean energy companies?
c. Do you have any final thoughts or insights you would like to share about NYSERDA’s role in building a robust clean energy entrepreneurial ecosystem in New York State?
Questions to existing start-up companies in incubators/POCCs
1. Please tell us more about your company: It’s products, markets, location, team and financing.
a. What is your current role, and how long have you been with this company? b. What segment of the clean tech economy does your company mainly work in?
(see list of clean energy technology segments below) c. Has your company participated in any NYSERDA programs, or received any
NYSERDA grants? If yes, which ones? d. Has your company changed its’ focus since being formed? e. Do your products and/or services serve any other markets than clean tech? f. What types of customers does your company primarily serve? Where are they
based? g. How long have you been in your current location? Why did your company choose
this location? h. What sources of financial capital support your company today? i. How much time elapsed from the initial idea to your company being formally
established (incorporated)? j. Approximately how long from company formation did it take your company to
realize its first sales? k. How long did it take your company to raise external financial capital (after
incorporation?) l. How easy or difficult was it to find the right team to join your company? Do you
still find it easy/difficult? 2. Please provide your observations about the entrepreneurial ecosystem for clean tech
companies in New York State. a. What would you say are the most important drivers affecting New York State’s
clean energy ecosystem? (See a list of potential drivers provided below) Do you consider any of these drivers as being specific to New York
State and/or to clean tech? If yes, why? Do these drivers vary widely by different clean tech technologies?

33
b. What are the most important barriers constraining New York State’s clean tech ecosystem today? (See a list of potential barriers provided below)
Do you consider any of these barriers as being specific to New York State and/or to clean tech? If yes, why?
Do these barriers vary widely by different clean tech technologies? c. Do you know of any geographic and/or technological clusters of clean tech
innovation in New York State? If yes, where/what are they? d. Finish this sentence: “The New York State clean tech entrepreneurial ecosystem
would be in trouble without the presence of …..”
3. About NYSERDA’s role in fostering a vibrant clean energy entrepreneurial ecosystem
a. If you participated in a NYSERDA program, what are the three (3) most useful services that you received from NYSREDA to help you achieve your business goals?
b. Are there any additional services that you wish NYSERDA had provided or would provide?
c. What additional services, beyond those currently provided, would you like or would you have liked to receive from the NYSERDA?
d. What should NYSERDA do to attract more investment in clean tech companies and support the growth of early stage clean energy companies?
4. Other service providers.
a. Can you think of any other organizations (beyond NYSERDA) that provide business development services to entrepreneurial companies in the State? If yes, who? What do they do?
b. Who gives reliable and trusted advice to companies like yours? Who do you turn to?
5. Final thoughts. a. What is most needed to accelerate the pace and scale of clean tech innovations
being produced in New York State?
Question to Eexisting start-up companies NOT in incubators/POCCs
1. Please tell us more about your company: Its products, markets, location, team and financing.
a. What is your current role, and how long have you been with this company? b. What segment of the clean tech economy does your company mainly work in?
(see list of clean energy technology segments below) c. Has your company participated in any NYSERDA programs, or received any
NYSERDA grants? If yes, which ones?

34
d. Has your company changed its focus since formation? e. Do your products and/or services serve any other markets besides clean tech? f. What types of customers does your company primarily serve? Where are they
based? g. How long have you been in your current location? Why did your company choose
this location? h. What sources of financial capital support your company today? i. How much time elapsed from the initial idea to your company being formally
established (incorporated)? j. Approximately how long did it take your company to realize its first sales after
incorporation? k. How long did it take your company to raise external financial capital (after
incorporation?) l. How easy or difficult was it to find the right team to join your company? Do you
still find it easy/difficult? 2. Please provide your observations about the entrepreneurial ecosystem for clean tech
companies in New York State. a. What would you say are the most important drivers affecting New York State’s
clean energy ecosystem? (See a list of potential drivers provided below) Do you consider any of these drivers as being specific to New York
State and/or to clean tech? If yes, why? Do these drivers vary widely by different clean tech technologies?
b. What are the most important barriers constraining New York State’s clean tech ecosystem today? (See a list of potential barriers provided below)
Do you consider any of these barriers as being specific to New York State and/or to clean tech? If yes, why?
Do these barriers vary widely by different clean technologies? c. Do you know of any geographic and/or technological clusters of clean tech
innovation in New York State? If yes, where/what are they? d. Finish this sentence: “The New York State clean tech entrepreneurial ecosystem
would be in trouble without the presence of …..”
3. About NYSERDA’s role in fostering a vibrant clean energy entrepreneurial ecosystem
a. If you participated in a NYSERDA program, what are the three (3) most useful services that helped you achieve your business goals?
b. Are there any additional services that you wish NYSERDA had provided or would provide?
c. What additional services, beyond those currently provided, would you like or would you have liked to receive from NYSERDA?

35
d. What should NYSERDA do to attract more investment in clean tech companies and support the growth of early stage clean energy companies?
4. Other service providers.
a. Can you think of any other organizations (beyond NYSERDA) that provide business development services to entrepreneurial companies in the State? If yes, who? What do they do?
b. Who gives reliable and trusted advice to companies like yours? Who do you turn to?
5. Final thoughts. a. What is most needed to accelerate the pace and scale of clean tech innovations in
New York State
Questions to Discontinued Companies
1. Please tell us more about your former company and its trajectory
a. What was your role, and how long were you with this company? b. What segment of the clean energy economy did this company mainly work in?
(see list of clean energy technology segments below) c. Did the company change its’ focus during its tenure? d. Did the company’s products and/or services serve any other markets than clean
energy? e. What types of customers did your company primarily serve? Where were these
customers mainly based? f. How long was your company in its last location? Why did your company choose
that location? g. What sources of financial capital supported your company? h. How much time elapsed from the initial idea to your company being formally
established (incorporated)? i. Approximately how long from company formation did it take your company to
realize its first sales? j. How long did it take your company to raise external financial capital (after
incorporation?), if any? k. How easy or difficult was it to find the right team to join your former company? l. When did the company formally stop business/ closed? m. What were some of the reasons the company closed? n. What is your work now? Is it still in clean energy?

36
2. Please provide your observations about the entrepreneurial ecosystem for clean energy companies in New York State.
a. What would you say is the most common reason why clean energy companies close or go out of business?
b. What would you say are the most important drivers affecting New York State’s clean energy ecosystem? (See a list of potential drivers provided below)
Do you consider any of these drivers as being specific to New York State and/or to clean energy? If yes, why?
Do these drivers vary widely by different clean energy technologies? c. What are the most important barriers constraining New York State’s clean energy
ecosystem today? (See a list of potential barriers provided below) Do you consider any of these barriers as being specific to New York
State and/or to clean energy? If yes, why? Do these barriers vary widely by different clean energy technologies?
d. Finish this sentence: “The New York State clean energy entrepreneurial ecosystem would be in trouble without the presence of …..”
3. About NYSERDA’s role in fostering a vibrant clean energy entrepreneurial ecosystem
a. Did you ever consider applying to NYSERDA programs or participating in a NYSERDA program?
If yes, what happened? If not, why not?
b. What other organizations provide business development services to entrepreneurial companies in the State? Did you ever use these services?
c. What do you think should NYSERDA to better help entrepreneurial clean energy companies survive and thrive?
d. Could NYSERDA have provided any particular service that would have changed the trajectory of your former company?
4. Final thoughts. a. What is most needed to accelerate the pace and scale of clean energy innovations
being produced in New York State?
Questions to large companies with Headquarters in NYS
1. About your company and its work in clean energy a. What is your current role, and how long have you worked with your company? b. Please provide an overview of the different ways in which your company works
with clean energy; and clean energy innovations in particular. c. What segment of the clean energy economy does your company mainly work in?
(see list of clean energy technology segments below)
37
d. When did the company start working actively with these clean energy innovations? e. How would you characterize your company’s contribution to New York State’s
clean energy ecosystem? 2. Please describe the nature of your company’s interaction with clean energy
entrepreneurial companies a. Does your company work directly with clean energy entrepreneurs and start-up
companies based in New York State? b. If your company does regularly interact with clean energy entrepreneurs and start-
up companies, can you provide some detail on the nature of the interaction, and which companies/entrepreneurs were involved? For example, do you do any of the following:?
Pilot test technologies or products developed by start-up clean energy company(ies)
License technologies or products developed by start-up clean energy company(ies)
Buy technologies or products from start-up clean energy company(ies) Participate in joint-ventures with start-up clean energy company(ies) Have acquired, or look to acquire, clean energy company(ies) Expect to soon acquire clean energy company(ies) Co-brand or retail technologies or products developed by start-up clean
energy company(ies) Manufacture or assemble technologies or products developed/designed by
clean energy company(ies) Other commercial relationship
c. In your experience, what are some of the opportunities and challenges involved in working with clean energy entrepreneurs and start-up companies?
3. Please provide your observations about the entrepreneurial ecosystem for clean energy companies in New York State. a. Are there any geographic and/or technological clusters of clean energy innovation
in New York State? Where/what are they? b. What would you say are the most important drivers affecting New York State’s
clean energy ecosystem? (See a list of potential drivers provided below) Are any of these specific to New York State? Are any of these specific to clean energy? Are any of these specific to large companies or smaller companies? Do these drivers vary widely by different clean energy technologies?
c. What are the most important barriers constraining New York State’s clean energy ecosystem today? (See a list of potential barriers provided below)
Are these specific to New York State?
38
Are these specific to clean energy? Are any of these specific to large companies or smaller companies? Do these barriers vary widely by different clean energy technologies?
d. Finish this sentence: “The New York State clean energy entrepreneurial ecosystem would be in trouble without the presence of …..”
e. In New York State, do you agree that most people consider starting a business as a desirable career choice?
4. About NYSERDA’s role in fostering a vibrant clean energy entrepreneurial ecosystem a. Does your company participate in any NYSERDA programs or events (as
described below)? If yes, please describe the nature of the participation. If yes, what additional services, beyond those currently provided, would
you like to receive from the programs or events? b. What other organizations provide business development services to clean energy
companies in the State? If yes, who are they and what do they do? 5. What’s most needed
a. What is most needed to accelerate the pace and scale of clean energy innovations being produced in New York State?
b. What do you think should NYSERDA do to attract more investment in clean energy companies and support the growth of early stage clean energy companies in the State?
Questions to Academic and Corporate Research Centers
1. Please tell us about your company and its work in clean energy a. What is your current role, and how long have you worked with your organization? b. What services does your organization provide that relate to clean energy and
entrepreneurship? c. What is the overarching purpose of the services that your organization provides? d. What segment of the clean energy economy does your organization mainly work
in? (see list of clean energy technology segments below) e. When did the organization start working actively with these clean energy
innovations? f. Does your organization develop intellectual property or innovations in clean
energy itself? g. Have any individuals or organizations directly tied with your organization ever
filed a patent in the clean energy space? a. What types of patents are usually filed? (i.e. Design, Utility, Process,
Plant, Re-Issue, Statutory invention registration, other). h. What other actors in the clean energy ecosystem (broadly defined) do you
regularly interact with? (for example: large companies, other academic/research entities, investors, lawyers, events, etc.)

39
i. How would you characterize your organization’s contribution to New York State’s clean energy ecosystem?
2. Please provide your observations about the entrepreneurial ecosystem for clean
energy companies in New York State. a. Are there any geographic and/or technological clusters of clean energy innovation
in New York State? Where/what are they? Why do you think this cluster emerged where and when it did?
b. What would you say are the most important drivers affecting New York State’s clean energy ecosystem? (See a list of potential drivers provided below)
Are any of these specific to New York State? Are any of these specific to clean energy? Do these drivers vary widely by different clean energy technologies?
c. What are the most important barriers constraining New York State’s clean energy ecosystem today? (See a list of potential barriers provided below)
Are these specific to New York State? Are these specific to clean energy? Do these barriers vary widely by different clean energy technologies?
d. Finish this sentence: “The New York State clean energy entrepreneurial ecosystem would be in trouble without the presence of …..”
e. In New York State, do you agree that most people consider starting a business as a desirable career choice?
f. Do you see many students and or faculty wanting to participate in New York State’s clean energy ecosystem? Has this interest changed over time?
3. Please share your thoughts about NYSERDA’s role in fostering a vibrant clean
energy entrepreneurial ecosystem a. Does your organization participate in any NYSERDA programs or events (as
described below)? If yes, please describe them. b. If yes, what additional services, beyond those currently provided, would you like
or would you have liked to receive from the program or events? c. What other organizations provide business development services to clean energy
companies in the State? If yes, who are they and what do they do? d. What should NYSERDA do to attract more investment in clean energy companies
and support the growth of early stage clean energy companies in the State? e. What should NYSERDA do to help develop more intellectual capital/property by
academic research centers’ in New York State?
40
4. And finally, what do you think is most needed? a. What is most needed to accelerate the pace and scale of clean energy innovations
being produced in New York State?
Questions to Finance Providers
1. Please share with us some information about your investment fund and interest in clean energy.
a. How long has your investment fund invested in clean energy? b. How many clean energy companies do you currently invest in? How many
companies do you currently have in your pipeline? c. What segment of the clean energy economy are you mainly interested in, and
why? (see list of clean energy technology segments below) d. Do you focus on a particular stage of company in clean energy? If yes, which
stage, and why? e. What makes a clean energy company attractive as an investment opportunity? f. How did you find your current clean energy investee companies? g. Have any of your investee companies participated in NYSERDA programs
such as the incubators or proof of concept centers? h. What other actors in the clean energy ecosystem (broadly defined) do you
regularly interact with? (for example: large companies, start-up companies, other academic/research entities, other investors, lawyers, events, etc.)
2. Please provide your observations about the entrepreneurial ecosystem for clean energy companies in New York State.
a. What investment funds do you consider the leaders in clean energy in New York State?
b. Are there any geographic and/or technological clusters of clean energy innovation in New York State? Where/what are they?
c. What would you say are the most important drivers affecting New York State’s clean energy ecosystem? (See a list of potential drivers provided below)
Are any of these specific to New York State? Are any of these specific to clean energy? Do these drivers vary widely by different clean energy technologies?
d. What are the most important barriers constraining New York State’s clean energy ecosystem today? (See a list of potential barriers provided below)
e. Are these specific to New York State? f. Are these specific to clean energy? g. Do these barriers vary widely by different clean energy technologies?
41
h. Finish this sentence: “The New York State clean energy entrepreneurial ecosystem would be in trouble without the presence of …..”
i. In New York State, do you agree that most people consider starting a business as a desirable career choice?
3. Consider NYSERDA’s role in fostering a vibrant clean energy entrepreneurial ecosystem:
a. Does your organization participate in any NYSERDA programs or events (as described below)? If yes, please describe them.
b. If yes, what additional services, beyond those currently provided, would you like or would you have liked to receive from the program or events?
c. Can you think of any other organizations (beyond NYSERDA) that provide business development services to clean energy companies in the State? If yes, who? What do they do?
d. What should NYSERDA do to attract more investment in clean energy companies and support the growth of early stage clean energy companies in the State?
e. Which State’s do this work well?
4. Please share any final thoughts you have on what’s most needed a. What is most needed to accelerate the pace and scale of clean energy innovations
being produced in New York State?

42
B.2.3 Supporting Definitions and Lists for all Interview Questions
Clean energy entrepreneurial ecosystemThe clean energy entrepreneurial ecosystem is the mix of factors that directly or indirectly clear a path for entrepreneurs to carry out their ambitions (or on the downside, throw obstacles in their path). Ecosystem elements can encourage or inhibit the choice to become an entrepreneur, and affect the probabilities of success following the launch of a clean energy company. Ecosystem elements that affect rates and successes of entrepreneurship include regulatory and policy frameworks, non-governmental services and networks, market conditions, research communities, investment communities, and competition that drive or impede entrepreneurial performance in general. This project studies the entrepreneurial ecosystem for clean energy in New York State. NYSERDA’s CEBD/ICDB Program NYSERDA’s Clean Energy Business Development (CEBD) is one of four programs in NYSERDA’s Technology and Market Development portfolio that is designed to develop the clean energy infrastructure in New York State. Under NYSREDA’s new Clean Energy Fund, the program will continue as Innovation Capacity and Business Development (ICBD). ICBD seeks to develop a vibrant, self-sustaining cleantech innovation ecosystem that will accelerate the pace and scale or clean energy innovation in New York State. This program offers incubator services, entrepreneur-in-residence programs, proof of concept centers.
Potential drivers for clean energy entrepreneurship Access to financial capital – debt Access to financial capital – equity (VC, angel, friends and family) Access to financial capital – grants Access to human capital – talent Access to large customers in the State Adequate supply of necessary materials/production inputs Availability of business services to support entrepreneurial companies Availability of R&D Culture of entrepreneurship in the State Energy prices in the State Existence of supportive State policies Help of incubators and accelerators Market demand Networks of other energy entrepreneurs and service providers Other? Physical infrastructure – electrical grid Physical infrastructure – transportation Proximity to large customer base Success stories of energy entrepreneurs in the State Supportive State regulatory framework Tax incentives and subsidies

43
Potential barriers for clean energy entrepreneurship Energy prices in the State Gas prices High business tax rates Inadequate supply of necessary materials/production inputs Lack of a strong culture of entrepreneurship in the State Lack of access to business services to support entrepreneurial companies Lack of access to financial capital – debt Lack of access to financial capital – equity (VC, angel, friends and family) Lack of access to financial capital – grants Lack of access to human capital – talent Lack of access to large customers in the State Lack of R&D capabilities Lack of success stories of energy entrepreneurs in the State Lack of supportive State policies Lack of tax incentives and subsidies Limited access to incubators and accelerators Physical infrastructure – electrical grid Physical infrastructure – transportation Small customer base Unsupportive/difficult State regulatory framework Other barriers
Clean energy technology segments Advanced buildings Balance of system services (e.g., installation) Bioenergy Biomass Clean energy finance Clean energy services Cogeneration Energy storage (incl. batteries, thermal storage, mechanical storage, ultra-capacitors, and hydrogen storage) Fuel cells Geothermal Industrial equipment Information technology (including software, measurement and analytics, data centers and devices) Marine Materials Renewable fuels Smart grid Solar Transportation (including vehicles, charging infrastructure, and traffic management) Waste to energy Wind
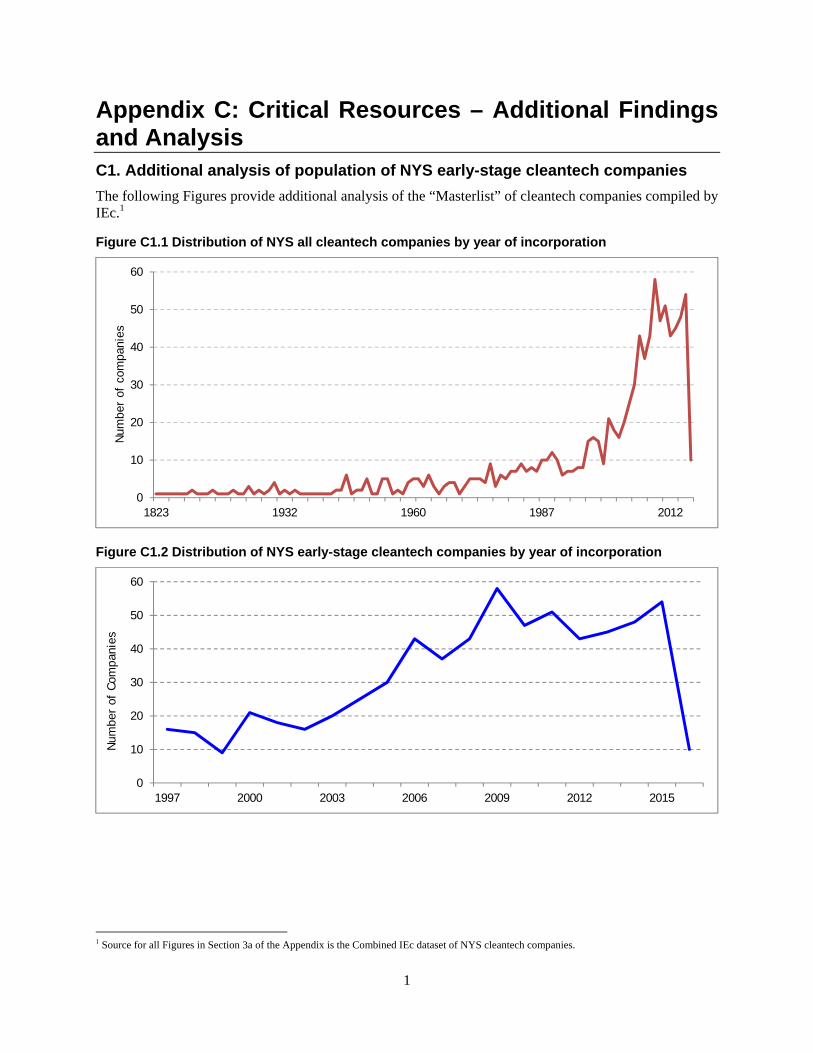
1
Appendix C: Critical Resources – Additional Findings and Analysis C1. Additional analysis of population of NYS early-stage cleantech companies The following Figures provide additional analysis of the “Masterlist” of cleantech companies compiled by IEc.1
Figure C1.1 Distribution of NYS all cleantech companies by year of incorporation
Figure C1.2 Distribution of NYS early-stage cleantech companies by year of incorporation
1 Source for all Figures in Section 3a of the Appendix is the Combined IEc dataset of NYS cleantech companies.
0
10
20
30
40
50
60
1823 1932 1960 1987 2012
Num
ber
of c
ompa
nies
0
10
20
30
40
50
60
1997 2000 2003 2006 2009 2012 2015
Num
ber
of C
ompa
nies

2
Figure C1.3 Distribution of early-stage cleantech companies in NYS regions (n=649)
Figure C1.4 Breakdown of NYS early-stage cleantech companies by stage (n=649)
Figure C1.5 Distribution of early-stage companies by primary segment (n=649)
Primary Sector Number of Companies
Percent of All Companies
Renewable energy generation 232 36%
Efficiency 180 28%
Transportation 35 5%
Air & environment 41 6%
Clean industry 112 17%
Water 11 2%
1.73
1.89
2.31
2.34
2.62
4.45
6.58
6.71
6.83
0 1 2 3 4 5 6 7
Lower Hudson Valley
Eastern Adirondacks/Lake Champlain
Long Island
Western Adirondacks/Eastern Lake Ontario
New York City
Western New York
Western Finger Lakes
Central New York
Capital Region/Northern Catskills
Number of companies per 100,000 people in each region
3%
3%
8%
11%
10%
9%
12%
16%
30%
1%
4%
7%
10%
13%
14%
10%
41%
30%
10%
10%
40%
10%
0% 20% 40% 60% 80% 100%
Eastern Adirondacks/Lake Champlain
Western Adirondacks/Eastern Lake Ontario
Lower Hudson Valley
Capital Region/Northern Catskills
Western New York
Long Island
Central New York
Western Finger Lakes
New York City
Growth Companies (6-20 years old)
Start-up Companies (1-5 years old)
Nascent Companies (<1 year old)

3
Primary Sector Number of Companies
Percent of All Companies
Agriculture 16 2%
Other 22 3%
Figure C1.6 Breakdown of NYS early-stage cleantech companies within the “renewable energy generation” segment (n=232)2
Secondary Sector Number of Companies
Percent of All Companies
Wind 22 9%
Solar 91 39%
Renewable fuels 20 8%
Marine 6 3%
Biomass 14 6%
Geothermal 3 1%
Fuel cells 16 7%
Waste-to-energy 13 6%
Emerging 5 2% Measurement & analytics 2 1%
Batteries 32 14%
Thermal storage 4 2%
Mechanical storage 2 1%
Super/ultracapacitors 6 3%
Figure C1.7 Breakdown of NYS early-stage cleantech companies in the “clean industry” segment (n=112)
Secondary Sector Number of Companies
Percent of All Companies
Materials innovation 63 56%
Production 15 13%
Equipment efficiency 17 15%
Advanced packaging 2 2%
Design innovation 12 11% Monitoring & compliance 3 3%
2 Note, four companies occupy more than one renewable energy generation sector.

4
Figure C1.8 Breakdown of NYS early-stage cleantech companies in the “efficiency” segment (n=180)
Secondary Sector Number of Companies
Percent of All Companies
Smart grid 22 9%
Green building 95 40%
Data centers & devices 46 19%
Semiconductors 6 3% Collaborative consumption systems 9 4%
Cogeneration 1 0%
Other 1 0%
Figure C1.9 Percent of NYS early-stage cleantech companies that are have energy-related innovations
Category Nascent Companies
(<1 year old) Start-up Companies
(1-5 years old) Growth Companies
(6-20 years old)
Energy 80% 46% 52%
Non-Energy 20% 53% 48%
Figure C1.10 Percent of NYS early-stage cleantech companies that are energy-related by stage
80%
46%52%
0%
25%
50%
75%
Nascent Companies(<1 year old)
Start-up Companies(1-5 years old)
Growth Companies(6-20 years old)
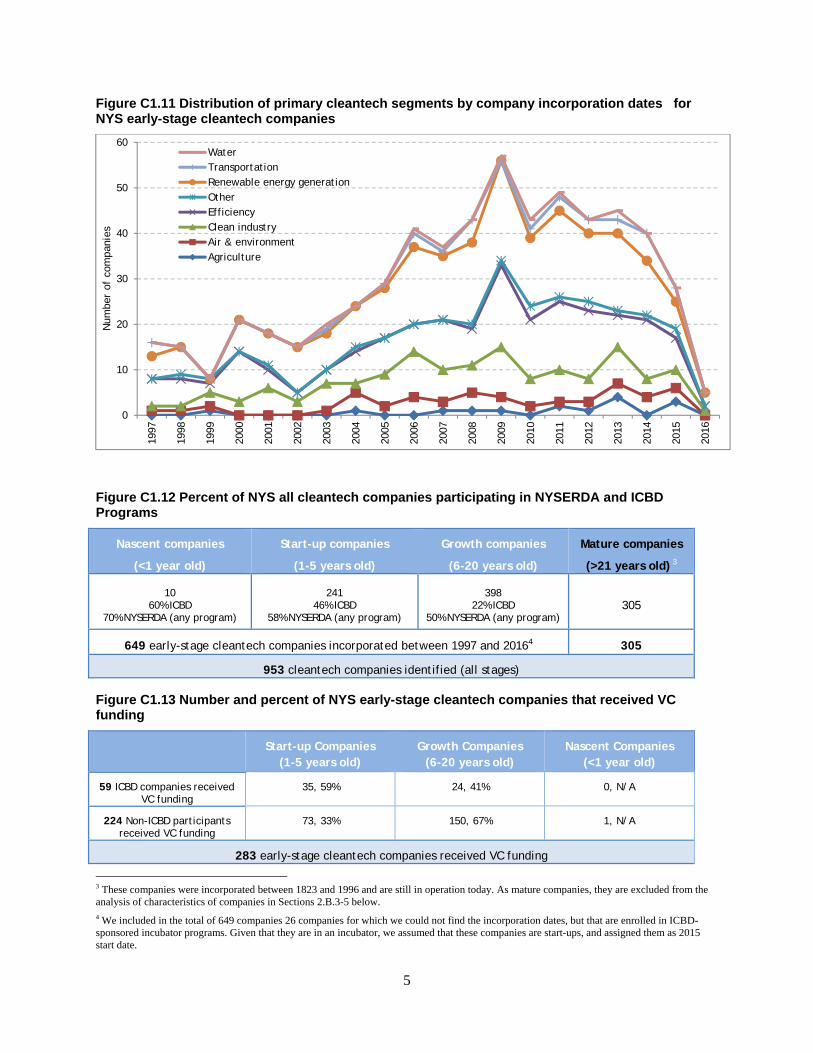
5
Figure C1.11 Distribution of primary cleantech segments by company incorporation dates for NYS early-stage cleantech companies
Figure C1.12 Percent of NYS all cleantech companies participating in NYSERDA and ICBD Programs
Nascent companies
(<1 year old)
Start-up companies
(1-5 years old)
Growth companies
(6-20 years old)
Mature companies
(>21 years old) 3
10 60% ICBD
70% NYSERDA (any program)
241 46% ICBD
58% NYSERDA (any program)
398 22% ICBD
50% NYSERDA (any program) 305
649 early-stage cleantech companies incorporated between 1997 and 20164 305
953 cleantech companies identified (all stages)
Figure C1.13 Number and percent of NYS early-stage cleantech companies that received VC funding
Start-up Companies (1-5 years old)
Growth Companies (6-20 years old)
Nascent Companies (<1 year old)
59 ICBD companies received VC funding
35, 59% 24, 41% 0, N/A
224 Non-ICBD participants received VC funding
73, 33% 150, 67% 1, N/A
283 early-stage cleantech companies received VC funding
3 These companies were incorporated between 1823 and 1996 and are still in operation today. As mature companies, they are excluded from the analysis of characteristics of companies in Sections 2.B.3-5 below. 4 We included in the total of 649 companies 26 companies for which we could not find the incorporation dates, but that are enrolled in ICBD-sponsored incubator programs. Given that they are in an incubator, we assumed that these companies are start-ups, and assigned them as 2015 start date.
0
10
20
30
40
50
6019
97
1998
1999
2000
2001
2002
2003
2004
2005
2006
2007
2008
2009
2010
2011
2012
2013
2014
2015
2016
Num
ber
of c
ompa
nies
WaterTransportationRenewable energy generationOtherEfficiencyClean industryAir & environmentAgriculture

6
Figure C1.14 Regional spread of NYS early-stage cleantech companies shown as a percent of total companies, and total companies per capita (Source: IEc Combined Dataset)
Figure C1.15: General Entrepreneurship Rates in NYS
The Global Entrepreneurship Monitor (GEM) study provides the following insights into the broader entrepreneurship environment in NYS relative to the U.S.:
A higher percentage of NYS entrepreneurs have a graduate-level education on average compared to the U.S. average.
NYS reports a higher than average “fear of failure” (which could prevent them from setting up a business) at 34%, compared to the U.S. average of 29%.
New York has a higher percentage of international-oriented entrepreneurs and established business owners compared to the national average, and this rate has grown between 2012 and 2015. Internationalization is measured as the share of entrepreneurs with more than 25% of their business sales to customers residing outside the U.S.
TEA rates for women and men are equal in NYS, whereas most other states tend to report more male entrepreneurs.
TEA rates are highest for the 18-24 years age group in NYS; and TEA rates in NYS are above the national average for the 55-plus age group.
28% of NYS participants in the study personally know an entrepreneur, which is right on average for the U.S. Knowing an entrepreneur, according to the GEM study, increases the likelihood of entrepreneurial intentions.5
5 Kelley, et. al. (2015) Global Entrepreneurship Monitor: 2015 United States Report. See http://www.gemconsortium.org/about/gem
0%
1%
4%
7%
10%
10%
13%
14%
41%
Eastern Adirondacks/LakeChamplain
WesternAdirondacks/Eastern Lake…
Lower Hudson Valley
Capital Region/NorthernCatskills
Western New York
Western Finger Lakes
Long Island
Central New York
New York City
Percent of total number of start-up companies in NYS
9%
30%
5%
1%
37%
13%
3%
1%
2%
Eastern Adirondacks/LakeChamplain
WesternAdirondacks/Eastern Lake…
Lower Hudson Valley
Capital Region/NorthernCatskills
Western New York
Western Finger Lakes
Long Island
Central New York
New York City
Percent of number of start-up companies per capita

7
C2. Additional data and analysis of financial resources
Figure C2.1 Number and type of federal and state fiscal incentives available for NYS cleantech companies6
Figure C2.2 Total number and amount of NYSERDA grants awarded to entrepreneurial companies, 2014-20167
6 IEC analysis of data from the Database of State Incentives for Renewables & Efficiency (DSIRE) database. Accessed Online 7 January, 2017 at: http://www.dsireusa.org/ 7 NYSERDA (2017). Files transmitted to IEc.
1
1
3
1
4
2
4
4
2
4
46
1
1
1
1
3
2
8
7
Corporate Depreciation
Corporate Tax Deduction
Corporate Tax Exemption
Green Building Incentive
Other Incentive
Personal Tax Exemption
PACE Financing
Corporate Tax Credit
Performance-Based Incentive
Personal Tax Credit
Property Tax Incentive
Sales Tax Incentive
Loan Program
Grant Program
Rebate Program
NY
US
$ 18,215 M
$ 20,974 M
$ 3,154 M
56
48
14
0
10
20
30
40
50
60
$ 5 M
$ 10 M
$ 15 M
$ 20 M
$ 25 M
2014 2015 2016
Num
ber
of G
rant
s
Tota
l Am
ount
Aw
arde
d
Total Grant Amount
Number of Grants

8
Figure C2.3 Amounts of ARPA-E grants received by NY State entities by region, 2010-20158
Region Total Investment
Amount Percent of Total
Central New York $12,762,990 32%
New York City $12,349,325 31%
Long Island $7,141,590 18%
Lower Hudson Valley $5,087,564 13%
Western Finger Lakes $1,483,369 4%
Capital Region/Northern Catskills $803,907 2%
Eastern Adirondacks/Lake Champlain $0 0%
Western Adirondacks/Eastern Lake Ontario $0 0%
Western New York $0 0%
TOTAL FOR NYS $39,628,745 100%
Figure C2.4 Number of Equity Investors in NYS Cleantech from 2014 through 2016 by Investor Type
8 IEc analysis of ARPA-E projects in NYS. See: https://arpa-e.energy.gov/?q=project-listing .
1246791013
75
Public Sector
Investment/Merchant Banker
Private Equity
Accelerator / IncubatorOther
Corporation
Corporate Venture
Angel Investor / Individual
Venture Capital
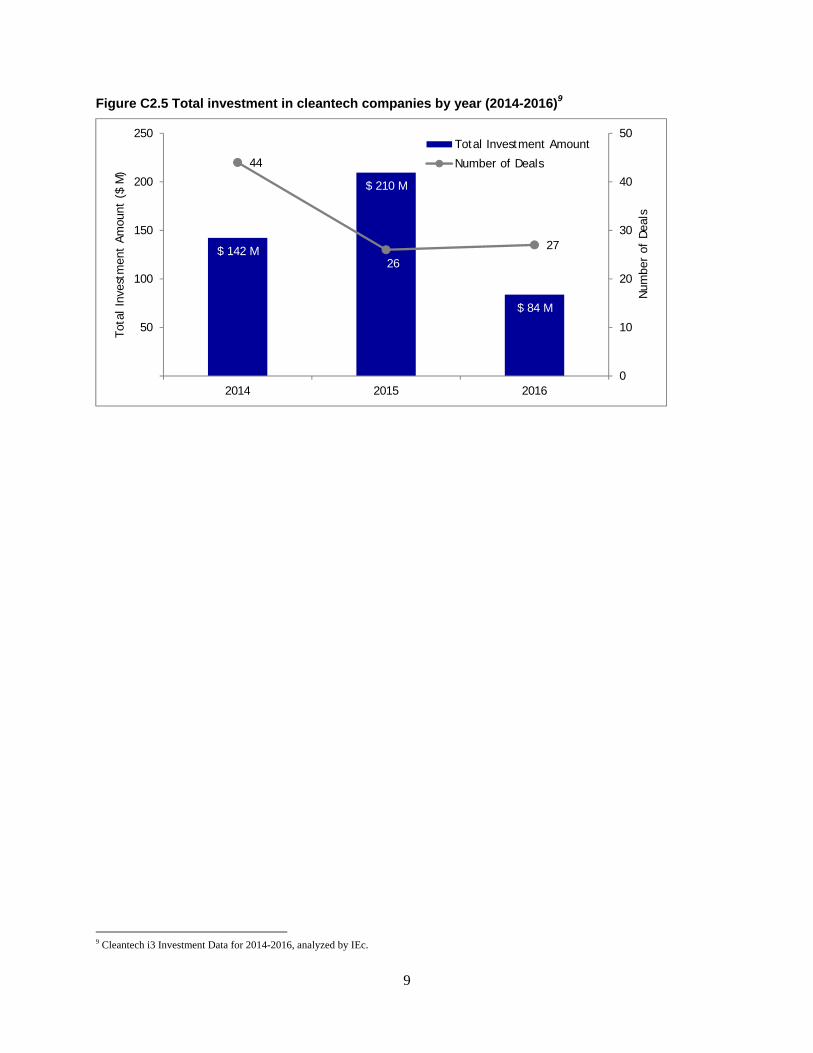
9
Figure C2.5 Total investment in cleantech companies by year (2014-2016)9
9 Cleantech i3 Investment Data for 2014-2016, analyzed by IEc.
$ 142 M
$ 210 M
$ 84 M
44
26
27
0
10
20
30
40
50
50
100
150
200
250
2014 2015 2016
Num
ber
of D
eals
Tota
l Inv
estm
ent
Amou
nt (
$ M
)
Total Investment Amount
Number of Deals
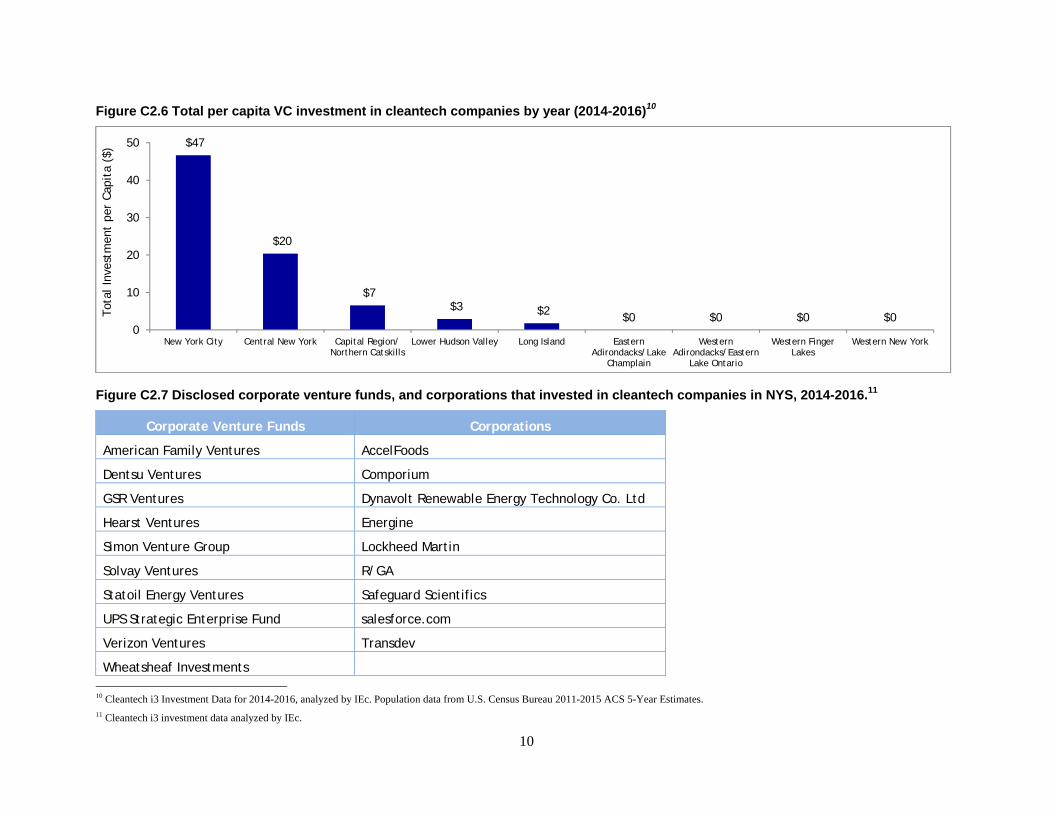
10
Figure C2.6 Total per capita VC investment in cleantech companies by year (2014-2016)10
Figure C2.7 Disclosed corporate venture funds, and corporations that invested in cleantech companies in NYS, 2014-2016.11
Corporate Venture Funds Corporations
American Family Ventures AccelFoods
Dentsu Ventures Comporium
GSR Ventures Dynavolt Renewable Energy Technology Co. Ltd
Hearst Ventures Energine
Simon Venture Group Lockheed Martin
Solvay Ventures R/GA
Statoil Energy Ventures Safeguard Scientifics
UPS Strategic Enterprise Fund salesforce.com
Verizon Ventures Transdev
Wheatsheaf Investments 10 Cleantech i3 Investment Data for 2014-2016, analyzed by IEc. Population data from U.S. Census Bureau 2011-2015 ACS 5-Year Estimates. 11 Cleantech i3 investment data analyzed by IEc.
$47
$20
$7 $3 $2 $0 $0 $0 $0
0
10
20
30
40
50
New York City Central New York Capital Region/Northern Catskills
Lower Hudson Valley Long Island EasternAdirondacks/Lake
Champlain
WesternAdirondacks/Eastern
Lake Ontario
Western FingerLakes
Western New York
Tota
l Inv
estm
ent
per
Capi
ta (
$)

11
Figure C2.8 Location of disclosed investors in NYS cleantech between 2014 and 201612
Figure C2.9 Total investment in cleantech companies by year (2014-2016)13
12 Cleantech i3 investment data analyzed by IEc. 13 Cleantech i3 investment data analyzed by IEc.
New York State39%
Other US States48%
International13%
N = 127
New York City, $ 393 M
Central New York, $ 24 M
Lower Hudson Valley, $ 7 M
Capital Region/ Northern
Catskills, $ 6 M
Long Island, $ 5 M
Total Investment Amount (2014 - 2016)

12
Figure C2.10 Total number of disclosed cleantech deals and investment amounts for NYS companies (1999 – 2016)14
Figure C2.11 VC investment deals in cleantech companies by year and investment type (1999 – 2016)15
14 Cleantech i3 investment data analyzed by IEc. 15 Cleantech i3 investment data analyzed by IEc.
$5$5 $16 $10 $12 $5 $17
$73 $62$43 $43
$129
$60$38
$142 $210
$841
2 2 1 2
6 7
13 13
9
16
22
31 32
44
26 27
0
10
20
30
40
50
50
100
150
200
25019
99
2000
2002
2003
2004
2005
2006
2007
2008
2009
2010
2011
2012
2013
2014
2015
2016
Num
ber
of D
eals
Tota
l Inv
estm
ent
Amou
nt (
$ M
)
Total Investment Amount $(M)
Number of Deals
50% 50%
50% 43%
38%
44%31%
23%32%
41% 41% 38%52%
100%
50%
100% 100%
50% 57%
85%
31% 22%56%
36%
42%47%
45% 35% 30%50%
15%31% 33%
13%
41%26%
13% 14%27%
19%
0
10
20
30
40
50
0%
20%
40%
60%
80%
100%
1999 2000 2002 2003 2004 2005 2006 2007 2008 2009 2010 2011 2012 2013 2014 2015 2016
Num
ber
of D
eals
Perc
ent
of N
umbe
r of
Dea
ls
Series B Series A Seed Total Number of Deals

13
Figure C2.12 VC investment deals in cleantech companies by year and investment type (1999 – 2016)16
Figure C2.13 Rate of change in amount of all VC investments in NYS vs. rate of change in amount of VC investments in cleantech from 1999 to 201617
Figure C2.14: Summary of VC investment deals in cleantech companies (1999 – 2016)18
Average Median Annual number of seed deals (as % of all deals) 31% 38%
Annual number of series A & B deals (as % of all deals) 69% 62%
Annual total amount of seed funding $4,552,341 $1,525,000
Annual total amount of series A and B funding $51,620,031 $38,885,672
16 Cleantech i3 investment data analyzed by IEc. 17 IEC comparison of all VC investment in NYS from PwC Moneytree to VC investment in cleantech from Cleantech i3 data 18 Cleantech i3 investment data analyzed by IEc.
50% 50% 50%43%
38%
44%
31% 23%32%
41% 41% 38%
52%
100% 50% 50% 100% 100% 50% 57% 100% 62% 56% 69% 77% 68% 59% 59% 62% 48%
1 2 2 1 26 7
13 139
16
22
31 3244
26 27
0
10
20
30
40
50
0%
20%
40%
60%
80%
100%
1999 2000 2002 2003 2004 2005 2006 2007 2008 2009 2010 2011 2012 2013 2014 2015 2016
Num
ber
of D
eals
Perc
ent
of N
umbe
r of
Dea
ls
Series A & B Seed Total Number of Deals
-2.00
-1.50
-1.00
-0.50
0.00
0.50
1.00
1.50
2.00
2.50
2000 2005 2010 2015
Rate
of
chan
ge in
am
ount
of
VC
Inve
stm
ent
in N
YS
All VC investment
Cleantech VC investment only

14
Average Median Seed amount per deal $841,193.39 $275,000 Series A amount per deal $3,825,369.26 $2,000,000 Series B amount per deal $8,880,873.29 $5,100,000
C3. Additional data and analysis of human resources
Figure C3.1 Sectors in which IEc ICBD survey who consider lack of human capital the top barrier (n=194).19
19 IEc ICDB Survey, 2016.
0% 2% 4% 6% 8% 10%
Balance of energy systems
Geothermal
Other
Wind
Marine
Cogeneration
Smart grid
Industrial equipment
Clean energy finance
Information technology
Clean energy services
Transportation
Bioenergy
Biomass
Renewable fuels
Fuel cells
Waste to energy
Energy storage
Solar
Advanced buildings
Materials
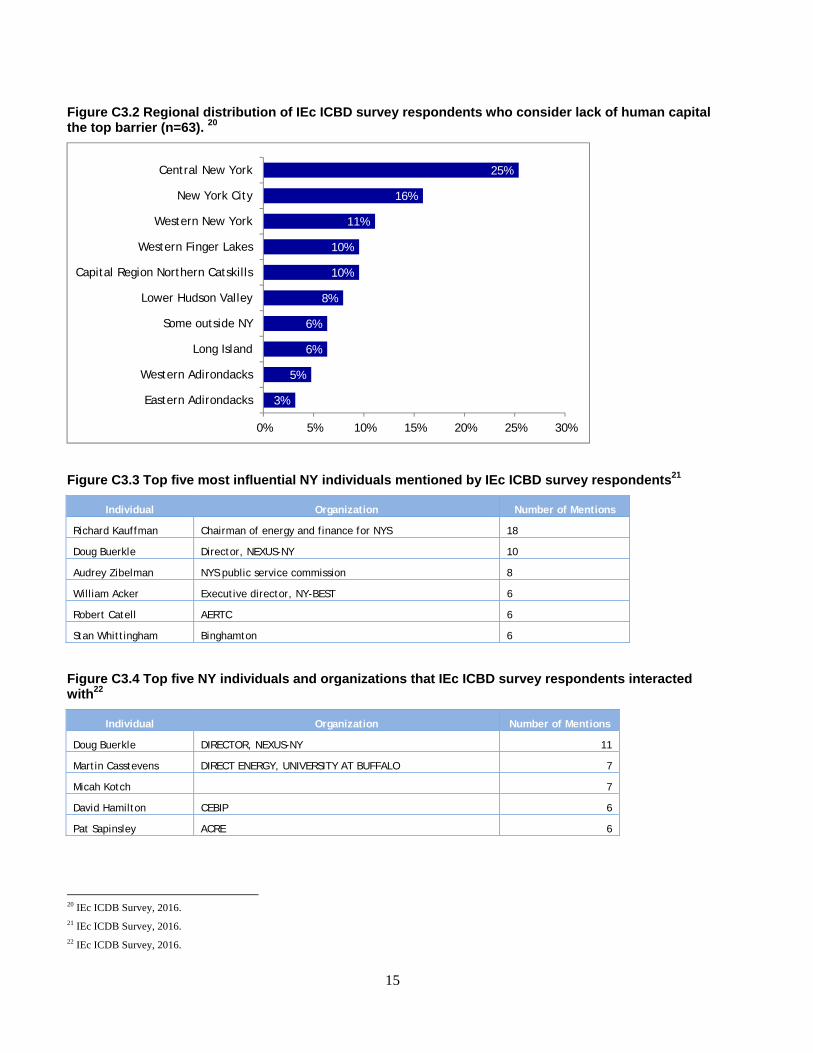
15
Figure C3.2 Regional distribution of IEc ICBD survey respondents who consider lack of human capital the top barrier (n=63). 20
Figure C3.3 Top five most influential NY individuals mentioned by IEc ICBD survey respondents21
Individual Organization Number of Mentions
Richard Kauffman Chairman of energy and finance for NYS 18
Doug Buerkle Director, NEXUS-NY 10
Audrey Zibelman NYS public service commission 8
William Acker Executive director, NY-BEST 6
Robert Catell AERTC 6
Stan Whittingham Binghamton 6
Figure C3.4 Top five NY individuals and organizations that IEc ICBD survey respondents interacted with22
Individual Organization Number of Mentions
Doug Buerkle DIRECTOR, NEXUS-NY 11
Martin Casstevens DIRECT ENERGY, UNIVERSITY AT BUFFALO 7
Micah Kotch 7
David Hamilton CEBIP 6
Pat Sapinsley ACRE 6
20 IEc ICDB Survey, 2016. 21 IEc ICDB Survey, 2016. 22 IEc ICDB Survey, 2016.
3%
5%
6%
6%
8%
10%
10%
11%
16%
25%
0% 5% 10% 15% 20% 25% 30%
Eastern Adirondacks
Western Adirondacks
Long Island
Some outside NY
Lower Hudson Valley
Capital Region Northern Catskills
Western Finger Lakes
Western New York
New York City
Central New York
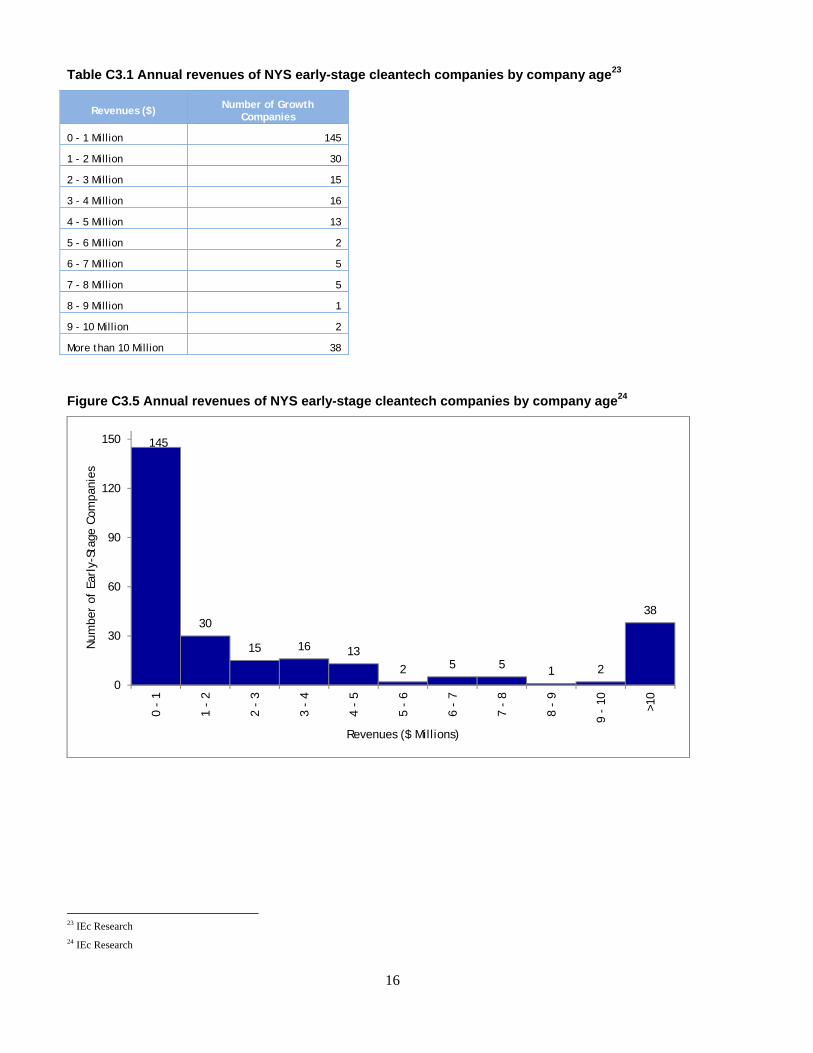
16
Table C3.1 Annual revenues of NYS early-stage cleantech companies by company age23
Revenues ($) Number of Growth Companies
0 - 1 Million 145
1 - 2 Million 30
2 - 3 Million 15
3 - 4 Million 16
4 - 5 Million 13
5 - 6 Million 2
6 - 7 Million 5
7 - 8 Million 5
8 - 9 Million 1
9 - 10 Million 2
More than 10 Million 38
Figure C3.5 Annual revenues of NYS early-stage cleantech companies by company age24
23 IEc Research 24 IEc Research
145
30
15 16 13
2 5 5 1 2
38
0
30
60
90
120
150
0 -
1
1 -
2
2 -
3
3 -
4
4 -
5
5 -
6
6 -
7
7 -
8
8 -
9
9 -
10 >10
Num
ber
of E
arly
-Sta
ge C
ompa
nies
Revenues ($ Millions)

17
Figure C3.6 Estimated number of clean jobs in NYS by region in 201525
According to the 2016 Clean Jobs Report, 76% of the total cleantech employment in NYS was in installation, while sales and distribution comprised 11%, and professional services employ 9 percent of the workforce. The remaining sectors each represented under three percent of employment.
Figure C3.7 Estimated number of NYS clean jobs per capita by region in 201526
C4. Additional data on intellectual property resources According to the 2016 NYSERDA Innovation Metrics Report:
378 patents were registered by NYS entities in electric vehicle, hybrid, and fuel cell technologies from 2012 to 2014 by companies such as GM, Delphi Automotive, Plug Power and General Electric (GE). In the same period, Michigan entities registered 642 patents, and Californian entities 411 patents in this category.27
165 patents were registered by NYS entities in solar technologies (including solar electric or photovoltaic technology) from 2012-2014 by companies such as IBM, General Electric and Precursor Energetics. In the same period, Californian entities registered 855 patents in this category.28
25 BW Research Partnership and The Economic Advancement Research Institute. (May 2016). Clean Jobs New York Report. 26 IEc analysis of BW Research Partnership and The Economic Advancement Research Institute. (May 2016). Clean Jobs New York Report. Population data from U.S. Census Bureau 2011-2015 ACS 5-Year Estimates. 27 SRI International (2015) NYSERDA Clean Energy Technologies Innovation Metrics Report. Page 21. 28 Ibid. Page 20.
1,568
2,479
4,647
5,008
5,037
5,045
11,927
16,798
32,689
Western Adirondacks/Eastern Lake Ontario
Eastern Adirondacks/Lake Champlain
Central New York
Western Finger Lakes
Capital Region/Northern Catskills
Western New York
Lower Hudson Valley
Long Island
New York City
0 0.002 0.004 0.006
Western Adirondacks/Eastern Lake Ontario
Western New York
Western Finger Lakes
New York City
Central New York
Eastern Adirondacks/Lake Champlain
Lower Hudson Valley
Capital Region/Northern Catskills
Long Island
Number of Clean Energy Jobs per Capita

18
66 patents were registered by NYS entities in wind power from 2012-2014 by companies such as General Electric and Vestas. This puts NYS third in terms of total patents in wind power in the same period: Californian entities registered 115 patents in this category, and South Carolina registered 102 patents.29
29 patents were registered by NYS entities in energy infrastructure technology (including power transmission, smart grid, and smart meter technology) technologies from 2012 to 2014 by companies such as Electro Industries Gauge Tech, General Electric, Current Communications Group, and Legrand.
Figure C4.1: Primary cleantech segments for IEc ICBD survey respondents who have applied for, or intend to apply for patents 30
29 Ibid. Page 20. 30 IEc ICDB Survey, 2016.
5
6
7
8
9
11
11
13
13
13
14
19
19
20
21
23
27
Cogeneration
Geothermal
Marine
Data centers & devices
Equipment efficiency
Bioenergy
Transportation
Wind
Renewable fuels
Biomass
Smart grid
Waste to energy
Fuel cells
Solar
Batteries
Materials innovation
Green buildings

C
Fas
31 httM
C5. Additio
igure C5.1 Ms of 2016.31
IEc research and atps://upload.wikim
Map_of_New_York_
nal data an
Map of ICBD f
analysis of BD ser
media.org/wikipedi_Economic_Region
nd analysis
funded and n
vice providers, 20ia/commons/thumbns.svg.png
s of Busin
non-ICBD inc
17. Regions showb/3/3d/Map_of_Ne
19
ess Develo
cubators, PO
wn on map are baseew_York_Economi
opment res
OCCs and ac
ed on the 10 regionic_Regions.svg/12
sources
ccelerators o
ns in the following280px-
operating in N
g map:
NYS
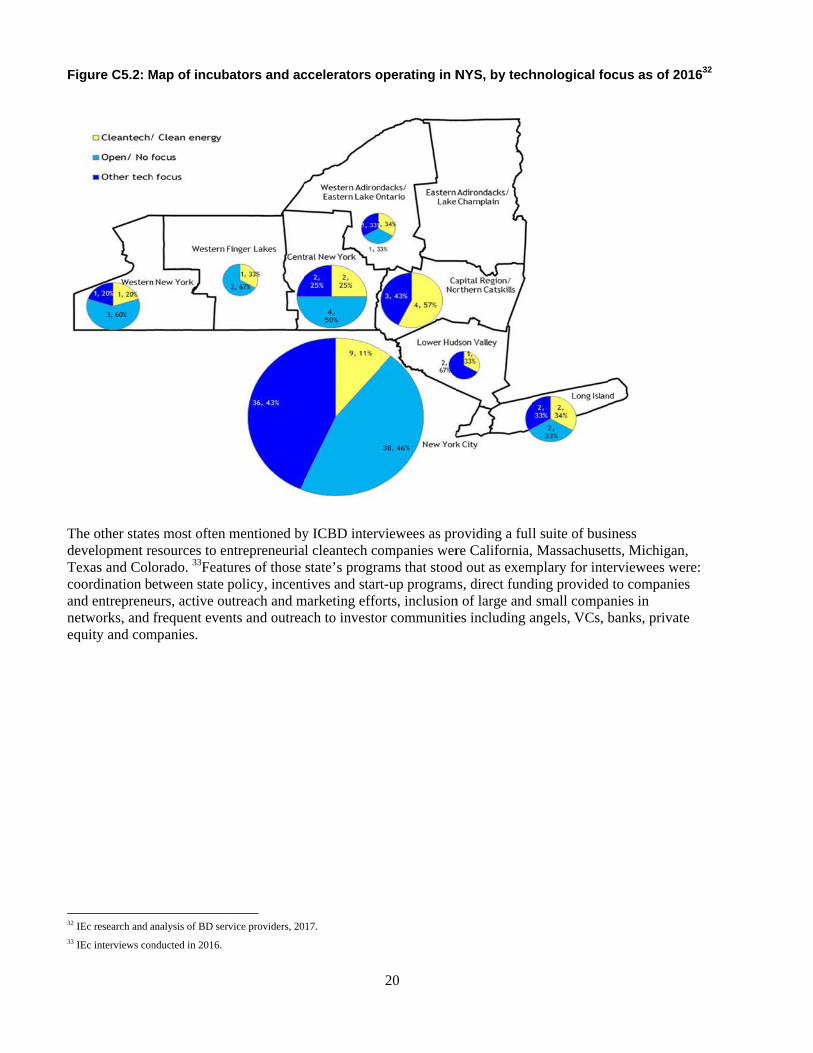
F
TdeTcoanneeq
32 33
igure C5.2: M
he other stateevelopment reexas and Coloordination bnd entrepreneetworks, and quity and com
IEc research and a
IEc interviews con
Map of incub
es most often esources to enorado. 33Featuetween state p
eurs, active oufrequent even
mpanies.
analysis of BD ser
nducted in 2016.
bators and ac
mentioned byntrepreneuriaures of those policy, incentutreach and mnts and outrea
vice providers, 20
ccelerators o
y ICBD interval cleantech costate’s progratives and start
marketing effoach to investo
17.
20
operating in N
viewees as prompanies werams that stoodt-up program
orts, inclusionor communitie
NYS, by tech
roviding a fulre California,d out as exem
ms, direct fundn of large and es including a
hnological fo
l suite of busi Massachuset
mplary for inteding provided
small compaangels, VCs, b
ocus as of 20
iness tts, Michiganerviewees we
d to companieanies in banks, private
01632
n, ere: s
e

1
Appendix D: Additional Findings and Analysis from IEc ICBD Survey and Interviews DA. IEc ICBD Survey findings- crosstab analysis
Top Drivers by Segment – Q21 cross-tabbed with Q6 Main takeaway: No single clean energy sector appears to stand out more with regards to drivers identified.
Sola
r
Win
d
Rene
wab
le
fuel
s
Mar
ine
Bioe
nerg
y
Biom
ass
Fuel
cel
ls
Geo
ther
mal
Was
te t
o en
ergy
Coge
nera
tion
Tran
spor
tati
on
Adv
ance
d bu
ildin
gs
Smar
t gr
id
Ener
gy s
tora
ge
Mat
eria
ls
Indu
stri
al
equi
pmen
t
Info
rmat
ion
tech
nolo
gy
Clea
n en
ergy
se
rvic
es
Bala
nce
of
ener
gy s
yste
ms
Clea
n en
ergy
fi
nanc
e
Oth
er
Supportive State regulatory framework
20 11 7 0 7 7 7 4 10 8 9 15 19 24 3 3 12 16 3 7 12
Existence of supportive State policies
30 18 15 0 11 12 10 4 11 9 11 22 20 25 10 3 13 18 1 8 12
Tax incentives and subsidies
32 16 12 0 11 13 9 6 13 6 9 18 16 20 14 5 17 22 5 9 9
Availability of R&D 20 13 15 4 14 14 13 4 16 7 13 24 13 26 28 8 9 15 2 5 14
Access to financial capital
45 25 30 6 28 23 26 6 30 14 25 35 20 47 28 15 27 26 3 16 19
Access to human capital/talent
19 11 12 5 8 8 15 2 10 7 14 23 15 18 14 11 18 13 4 8 10

2
Top Drivers by Segment – Q21 cross-tabbed with Q6 Main takeaway: No single clean energy sector appears to stand out more with regards to drivers identified.
Sola
r
Win
d
Rene
wab
le
fuel
s
Mar
ine
Bioe
nerg
y
Biom
ass
Fuel
cel
ls
Geo
ther
mal
Was
te t
o en
ergy
Coge
nera
tion
Tran
spor
tati
on
Adv
ance
d bu
ildin
gs
Smar
t gr
id
Ener
gy s
tora
ge
Mat
eria
ls
Indu
stri
al
equi
pmen
t
Info
rmat
ion
tech
nolo
gy
Clea
n en
ergy
se
rvic
es
Bala
nce
of
ener
gy s
yste
ms
Clea
n en
ergy
fi
nanc
e
Oth
er
Access to large customers in the State
9 5 5 1 4 4 8 1 4 4 9 18 12 15 8 6 13 13 2 7 6
Networks of other energy entrepreneurs/service providers
16 8 9 5 7 8 9 7 13 9 8 14 9 17 13 5 8 8 4 6 5
Proximity to large customer base
10 5 5 1 3 3 7 2 4 6 6 15 11 12 5 1 10 7 1 6 5
Market demand 22 18 19 2 11 14 11 3 14 6 14 23 17 26 10 6 14 17 7 9 13
Energy prices in State
12 7 10 1 7 6 8 4 8 5 7 9 11 12 4 2 4 4 4 3 5
Availability of business services
11 11 7 3 6 7 9 3 7 6 13 13 8 11 12 4 6 7 1 5 9
Help of incubators and accelerators
20 8 13 1 11 12 13 4 15 9 14 23 14 23 24 7 19 16 2 6 17
Culture of entrepreneurship
11 7 8 1 6 7 8 3 5 1 13 11 7 13 8 3 11 8 0 3 8
Success stories 2 0 1 0 1 1 0 0 1 0 1 1 0 2 1 1 1 0 0 0 1

3
Top Drivers by Segment – Q21 cross-tabbed with Q6 Main takeaway: No single clean energy sector appears to stand out more with regards to drivers identified.
Sola
r
Win
d
Rene
wab
le
fuel
s
Mar
ine
Bioe
nerg
y
Biom
ass
Fuel
cel
ls
Geo
ther
mal
Was
te t
o en
ergy
Coge
nera
tion
Tran
spor
tati
on
Adv
ance
d bu
ildin
gs
Smar
t gr
id
Ener
gy s
tora
ge
Mat
eria
ls
Indu
stri
al
equi
pmen
t
Info
rmat
ion
tech
nolo
gy
Clea
n en
ergy
se
rvic
es
Bala
nce
of
ener
gy s
yste
ms
Clea
n en
ergy
fi
nanc
e
Oth
er
Adequate supply of materials/production inputs
3 2 2 0 3 2 2 1 1 2 2 3 1 3 6 2 1 1 0 0 0
Physical infrastructure - transportation
1 2 0 0 0 0 0 0 0 0 0 1 2 1 1 0 0 0 0 0 0
Physical infrastructure - electrical grid
0 0 0 0 0 0 0 0 0 0 0 1 1 1 0 0 0 0 0 0 1
Other 7 7 8 2 4 6 7 2 5 7 2 10 7 9 5 5 8 5 2 2 9
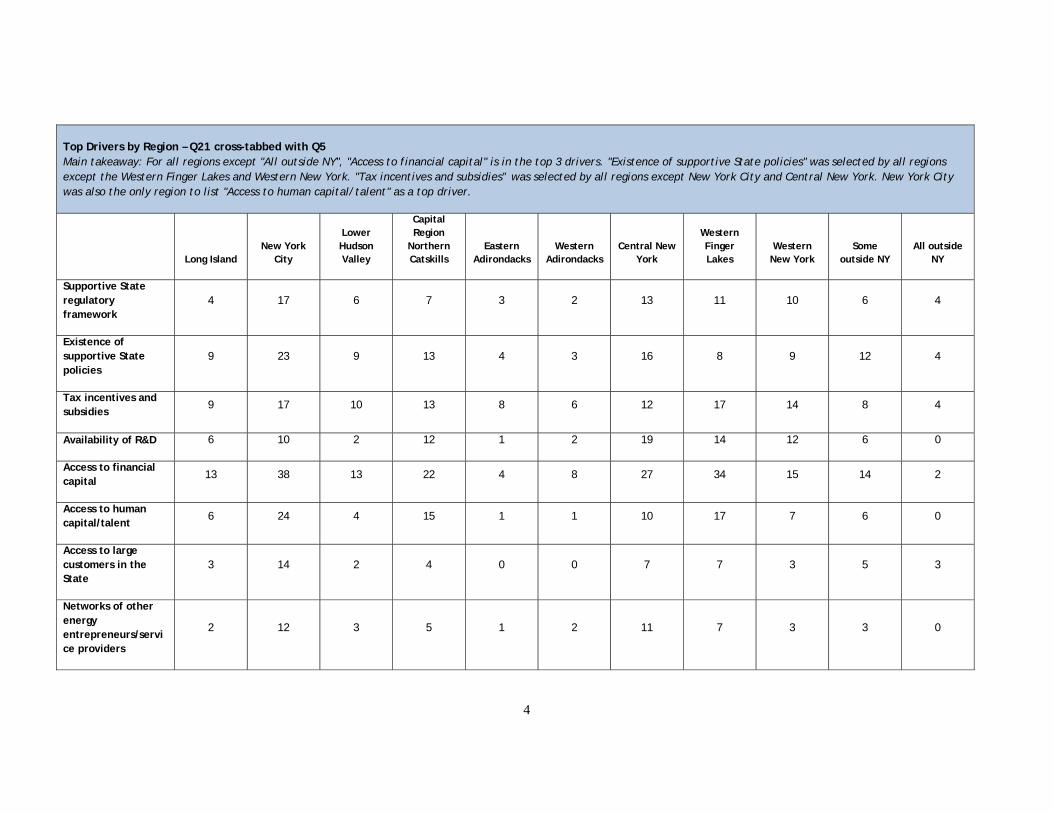
4
Top Drivers by Region – Q21 cross-tabbed with Q5 Main takeaway: For all regions except "All outside NY", "Access to financial capital" is in the top 3 drivers. "Existence of supportive State policies" was selected by all regions except the Western Finger Lakes and Western New York. "Tax incentives and subsidies” was selected by all regions except New York City and Central New York. New York City was also the only region to list "Access to human capital/talent" as a top driver.
Long Island New York
City
Lower Hudson Valley
Capital Region
Northern Catskills
Eastern Adirondacks
Western Adirondacks
Central New York
Western Finger Lakes
Western New York
Some outside NY
All outside NY
Supportive State regulatory framework
4 17 6 7 3 2 13 11 10 6 4
Existence of supportive State policies
9 23 9 13 4 3 16 8 9 12 4
Tax incentives and subsidies
9 17 10 13 8 6 12 17 14 8 4
Availability of R&D 6 10 2 12 1 2 19 14 12 6 0
Access to financial capital
13 38 13 22 4 8 27 34 15 14 2
Access to human capital/talent
6 24 4 15 1 1 10 17 7 6 0
Access to large customers in the State
3 14 2 4 0 0 7 7 3 5 3
Networks of other energy entrepreneurs/service providers
2 12 3 5 1 2 11 7 3 3 0

5
Top Drivers by Region – Q21 cross-tabbed with Q5 Main takeaway: For all regions except "All outside NY", "Access to financial capital" is in the top 3 drivers. "Existence of supportive State policies" was selected by all regions except the Western Finger Lakes and Western New York. "Tax incentives and subsidies” was selected by all regions except New York City and Central New York. New York City was also the only region to list "Access to human capital/talent" as a top driver.
Long Island New York
City
Lower Hudson Valley
Capital Region
Northern Catskills
Eastern Adirondacks
Western Adirondacks
Central New York
Western Finger Lakes
Western New York
Some outside NY
All outside NY
Proximity to large customer base
3 18 4 2 2 1 5 4 3 6 1
Market demand 7 20 6 10 3 3 10 14 12 7 3
Energy prices in State
3 10 4 2 2 2 7 5 8 4 2
Availability of business services
2 9 2 5 0 1 9 6 7 4 0
Help of incubators and accelerators
7 19 7 5 1 0 16 15 11 6 0
Culture of entrepreneurship
2 13 1 6 1 1 6 6 5 2 1
Success stories 0 0 0 0 0 0 2 1 3 1 0
Adequate supply of materials/production inputs
0 0 0 1 1 1 5 1 2 0 0
Physical infrastructure - transportation
0 2 0 1 0 0 0 0 1 0 0
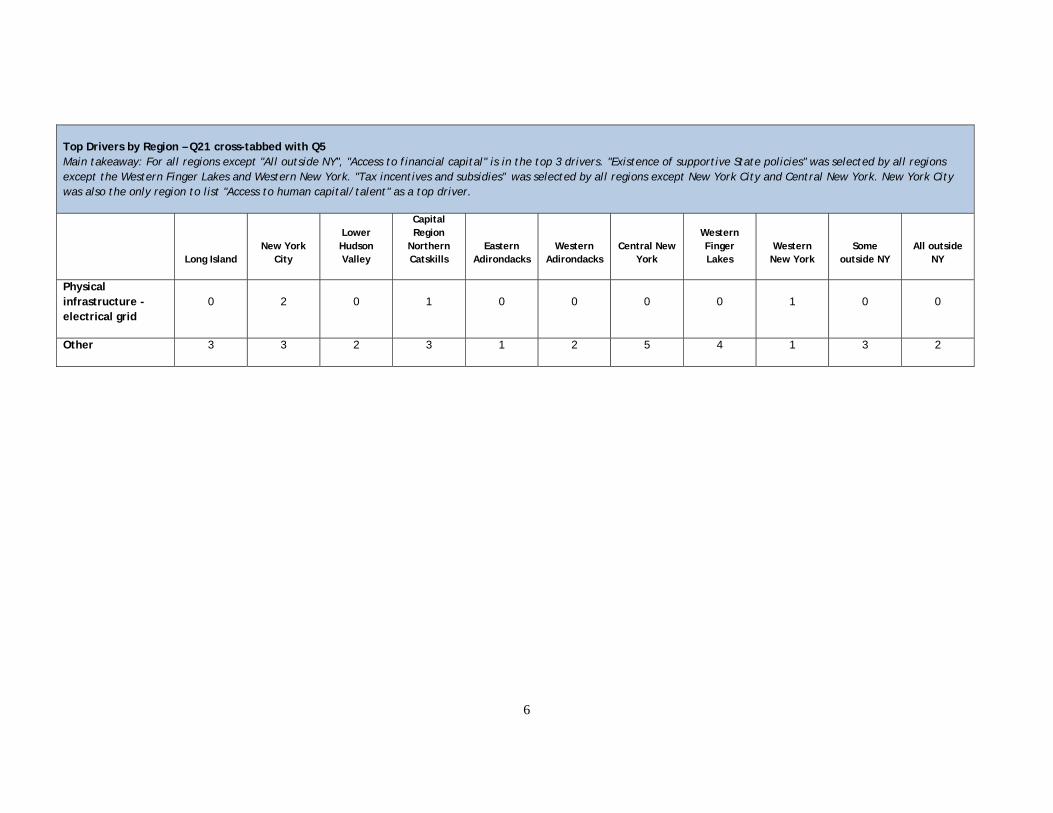
6
Top Drivers by Region – Q21 cross-tabbed with Q5 Main takeaway: For all regions except "All outside NY", "Access to financial capital" is in the top 3 drivers. "Existence of supportive State policies" was selected by all regions except the Western Finger Lakes and Western New York. "Tax incentives and subsidies” was selected by all regions except New York City and Central New York. New York City was also the only region to list "Access to human capital/talent" as a top driver.
Long Island New York
City
Lower Hudson Valley
Capital Region
Northern Catskills
Eastern Adirondacks
Western Adirondacks
Central New York
Western Finger Lakes
Western New York
Some outside NY
All outside NY
Physical infrastructure - electrical grid
0 2 0 1 0 0 0 0 1 0 0
Other 3 3 2 3 1 2 5 4 1 3 2
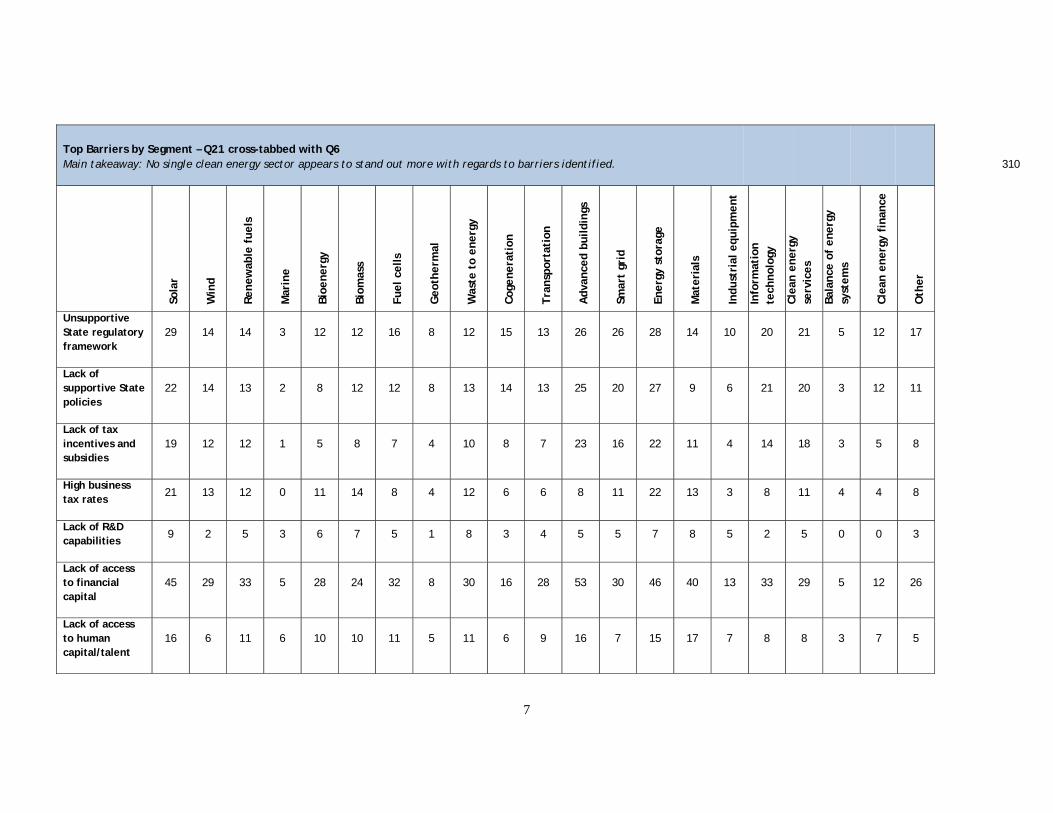
7
Top Barriers by Segment – Q21 cross-tabbed with Q6 Main takeaway: No single clean energy sector appears to stand out more with regards to barriers identified. 310
Sola
r
Win
d
Rene
wab
le f
uels
Mar
ine
Bioe
nerg
y
Biom
ass
Fuel
cel
ls
Geo
ther
mal
Was
te t
o en
ergy
Coge
nera
tion
Tran
spor
tati
on
Adv
ance
d bu
ildin
gs
Smar
t gr
id
Ener
gy s
tora
ge
Mat
eria
ls
Indu
stri
al e
quip
men
t
Info
rmat
ion
tech
nolo
gy
Clea
n en
ergy
se
rvic
es
Bala
nce
of e
nerg
y sy
stem
s
Clea
n en
ergy
fin
ance
Oth
er
Unsupportive State regulatory framework
29 14 14 3 12 12 16 8 12 15 13 26 26 28 14 10 20 21 5 12 17
Lack of supportive State policies
22 14 13 2 8 12 12 8 13 14 13 25 20 27 9 6 21 20 3 12 11
Lack of tax incentives and subsidies
19 12 12 1 5 8 7 4 10 8 7 23 16 22 11 4 14 18 3 5 8
High business tax rates
21 13 12 0 11 14 8 4 12 6 6 8 11 22 13 3 8 11 4 4 8
Lack of R&D capabilities
9 2 5 3 6 7 5 1 8 3 4 5 5 7 8 5 2 5 0 0 3
Lack of access to financial capital
45 29 33 5 28 24 32 8 30 16 28 53 30 46 40 13 33 29 5 12 26
Lack of access to human capital/talent
16 6 11 6 10 10 11 5 11 6 9 16 7 15 17 7 8 8 3 7 5

8
Top Barriers by Segment – Q21 cross-tabbed with Q6 Main takeaway: No single clean energy sector appears to stand out more with regards to barriers identified. 310
Sola
r
Win
d
Rene
wab
le f
uels
Mar
ine
Bioe
nerg
y
Biom
ass
Fuel
cel
ls
Geo
ther
mal
Was
te t
o en
ergy
Coge
nera
tion
Tran
spor
tati
on
Adv
ance
d bu
ildin
gs
Smar
t gr
id
Ener
gy s
tora
ge
Mat
eria
ls
Indu
stri
al e
quip
men
t
Info
rmat
ion
tech
nolo
gy
Clea
n en
ergy
se
rvic
es
Bala
nce
of e
nerg
y sy
stem
s
Clea
n en
ergy
fin
ance
Oth
er
Lack of access to large customers in the State
9 7 7 2 5 5 2 1 6 5 9 13 6 10 11 9 8 10 1 5 2
Small customer base
7 4 6 3 5 5 5 1 6 4 7 8 5 12 10 3 4 7 2 2 3
Energy prices in State
12 7 10 0 8 9 5 1 9 2 3 6 6 11 7 1 5 3 2 2 7
Gas prices 9 5 7 1 4 5 3 2 3 1 3 5 3 5 3 0 2 3 1 2 2
Lack of access to business services
17 12 9 2 7 9 6 5 8 2 21 21 8 12 13 5 7 13 2 4 7
Limited access to incubators and accelerators
4 2 1 0 3 3 4 1 4 0 3 4 3 4 3 0 2 2 0 1 1
Lack of a culture of entrepreneurs-hip 18 14 8 1 6 6 12 2 9 5 24 12 16 24 6 4 12 11 2 10 8

9
Top Barriers by Segment – Q21 cross-tabbed with Q6 Main takeaway: No single clean energy sector appears to stand out more with regards to barriers identified. 310
Sola
r
Win
d
Rene
wab
le f
uels
Mar
ine
Bioe
nerg
y
Biom
ass
Fuel
cel
ls
Geo
ther
mal
Was
te t
o en
ergy
Coge
nera
tion
Tran
spor
tati
on
Adv
ance
d bu
ildin
gs
Smar
t gr
id
Ener
gy s
tora
ge
Mat
eria
ls
Indu
stri
al e
quip
men
t
Info
rmat
ion
tech
nolo
gy
Clea
n en
ergy
se
rvic
es
Bala
nce
of e
nerg
y sy
stem
s
Clea
n en
ergy
fin
ance
Oth
er
Lack of success stories 13 7 9 1 6 5 9 2 10 3 5 14 10 17 5 7 14 9 2 7 6
Inadequate supply of materials/production inputs 3 1 0 0 0 0 0 0 3 0 2 5 1 5 4 2 4 3 1 1 4
Physical infrastructure - transportation 2 1 1 1 1 0 1 0 1 0 3 5 2 2 1 0 3 2 0 0 2
Physical infrastructure - electrical grid 6 7 6 1 5 6 3 2 6 4 5 6 9 6 4 1 1 5 1 3 0
Other 16 11 13 1 8 8 12 2 8 10 4 16 10 16 12 6 11 8 4 5 17

10
Top Barriers by Region – Q22 cross-tabbed with Q5 Main takeaway: For all regions except Eastern Adirondacks and All outside NY, "Lack of access to financial capital" was listed as a top 3 barrier. There was much less consensus amongst the regions as to what the top barriers are than there was for drivers, but "Unsupportive State regulatory framework" was listed by 7 of the 11 regions.
Long Island
New York City
Lower Hudson Valley
Capital Region/
Northern Catskills
Eastern Adiron-dacks
Western Adiron-dacks
Central New York
Western Finger Lakes
Western New York
Some outside NY
All outside NY
Unsupportive State regulatory framework
6 23 7 12 4 1 13 18 7 5 4
Lack of supportive State policies
8 20 7 15 4 2 9 11 11 6 3
Lack of tax incentives and subsidies
4 25 8 12 6 4 7 8 8 9 4
High business tax rates 4 11 4 8 3 2 10 18 12 8 1
Lack of R&D capabilities 4 6 0 0 0 0 10 2 5 3 1
Lack of access to financial capital
9 41 12 22 3 5 32 39 14 12 2
Lack of access to human capital/talent
4 10 5 6 2 3 16 6 7 4 0
Lack of access to large customers in the State
1 9 1 5 0 0 7 7 5 4 0
Small customer base 3 7 1 6 0 0 6 2 8 2 1
Energy prices in State 3 8 2 2 2 4 9 7 7 6 0

11
Top Barriers by Region – Q22 cross-tabbed with Q5 Main takeaway: For all regions except Eastern Adirondacks and All outside NY, "Lack of access to financial capital" was listed as a top 3 barrier. There was much less consensus amongst the regions as to what the top barriers are than there was for drivers, but "Unsupportive State regulatory framework" was listed by 7 of the 11 regions.
Long Island
New York City
Lower Hudson Valley
Capital Region/
Northern Catskills
Eastern Adiron-dacks
Western Adiron-dacks
Central New York
Western Finger Lakes
Western New York
Some outside NY
All outside NY
Gas prices 0 3 1 1 0 0 3 3 7 3 1
Lack of access to business services
4 16 4 13 3 4 10 5 5 5 0
Limited access to incubators and accelerators
1 2 1 2 1 1 1 1 3 2 0
Lack of a culture of entrepreneurship
5 13 4 7 1 1 8 16 7 5 2
Lack of success stories 5 16 4 3 1 1 6 10 5 3 2
Inadequate supply of materials/production inputs
1 5 2 1 0 0 4 1 1 1 0
Physical infrastructure - transportation
1 3 0 1 0 0 0 2 0 0 0
Physical infrastructure - electrical grid
1 6 2 2 2 2 3 4 2 4 0
Other 8 13 6 5 1 3 12 9 3 5 3

12
DB. Additional interview and survey findings: Initial ICBD Program Outcomes
DB.1 Findings for incubators
In the IEc ICBD survey, incubator clients were also asked about their sales and the incubators’ effect on sales timing and volume. Of the 127 current or former incubator clients who responded to the IEc ICBD survey, 54% do not currently have sales revenue and 46% currently have sales revenue; the following Figure summarizes the responses of the 58 companies reporting revenue in the IEc ICBD Survey. Figure 4B.1: Current Annual Sales of Current and Former Incubator Clients (n = 58)1
Range Number Percent
$1 - $49,999 6 10.34%
$50,000 - $249,999 9 15.52%
$250,000 - $999,999 14 24.14%
$1,000,000 - $4,999,999 14 24.14%
5,000,000 - $24,999,999 4 6.90%
$25,000,000 - $49,999,999 1 1.72%
$50,000,000+ 1 1.72%
Do not wish to provide 6 10.34%
Other 3 5.17%
Of these 58 companies, roughly half (31) reported commercial sales before they joined the incubator; half of the companies who made their first sales after joining the incubator (16) credited their participation in the incubator program with helping them realize their first sales earlier than they would have otherwise. Specifically, seven companies credited the incubator with accelerating their first sales by six months to one year earlier, six companies stated the incubator accelerated their first sales by less than six months, and three stated the incubator accelerated their first sales by one to two years. Eleven companies did not know if the incubator had accelerated their first sales, and four companies believed that it had not.
The 27 incubator companies who had commercial sales prior to joining the incubator were asked about their change in sales since joining; 20 (74%) reported an increase in sales, six reported their sales had stayed about the same (22%), and one did not answer the question (4%). Eight of the 20 respondents who reported an increase in sales stated the incubator was “somewhat influential” in helping increase their sales volume. Three reported “very influential,” two reported “slightly influential,” and seven reported “not at all influential.”
DB.2 Findings for POCCs
The IEc ICBD survey asked 87 current or former participants in NYSERDA-funded POCCs to indicate the importance of their participation in the POCC in a variety of areas. Respondents selected a rating of not at all important, slightly important, somewhat important, very important, or extremely important for each area.
A strong majority of IEc ICBD survey respondents stated that POCCs were “very important” or “extremely important” in introducing them to valuable business contacts (82%), helping them achieve their entrepreneurial goals (75%), and strengthening or reinforcing their desire to be entrepreneurs (67%).
1 IEc ICBD Survey, 2016.

13
DB.3. Findings for EIRs
The IEc ICBD survey also asked 85 current or former recipients of EIR services about the services they received. A solid majority of respondents have received feedback on their business plan or strategy (73%) and mentoring (72%) from their EIR. Over half have received general business information (56%), and 27% have received introductions to new investors; 18% have received introductions to new customers. Nine percent reported receiving other services.
When asked about the importance of their relationship with their EIR in achieving entrepreneurial goals, 47% indicated extremely (22%) or very important (25%), 27% indicated somewhat important, 18% slightly important, and 8% not at all important.
The IEc ICBD survey asked EIR recipients whether they have participated in any NYSERDA-sponsored networking events that their EIR introduced them to, and if so, the contacts they made at those events. Of the 85 respondents, 45 (53%) have participated in such events.
Thirty-one respondents (69%) have participated in between one and three events, 12 respondents (27%) have participated in four to six events, and the remaining two respondents (4%) have participated in more than six events.
Thirty-four of the 45 respondents (76%) have made valuable contacts during networking events.
The most commonly mentioned valuable contacts made at these events were other entrepreneurs (68%) and mentors (41%), followed by customers (35%), investors (29%), and large companies (potential acquirers or partners) (24%).
Six respondents (18%) made valuable contacts with manufacturers, four (12%) with distributors, three (9%) with suppliers, and two (6%) with business partners.
EIR respondents were also asked if they had signed any contracts with contacts that were facilitated by their EIR. 85% of respondents indicated they have not done so. Among the 15% who have, five signed contracts with a new customer (6%), three with a business partner (4%), two with a manufacturer (2%), two with a large company (2%), and four with others (5%).
DB4. Additional business development services needed according to stakeholders The IEc ICBD interviews also asked respondents more open-ended questions to solicit ideas on what else NYSERDA’s ICBD program should do to support cleantech companies in NYS. Analysis of the interviewee’s responses are provided below.
Adopt a more holistic and strategic approach to ICBD programming (n = 28). A common interview theme was that NYSERDA should adopt a more holistic and integrated approach to supporting the NYS cleantech ecosystem. For instance, a POCC director stated, “If someone goes through a POCC and hits certain milestones, they should have a stamp of approval and go to the top of the stack for a PON. They should map out all of NYSERDA’s programs, look at the overlaps, and identify gaps so they build things that flow well.”
At the same time, some interviewees suggested that NYSERDA should adopt a targeted program focus. Said one incubator director, “The POCCs and incubators are running out of steam because they are trying to do everything for everyone – they need to be more targeted and specialize on specific industry clusters or specific technology sectors. We need more integration and coordination amongst incubators and POCCs to specialize in specific things.”
Change technology/segment focus (n = 22). Interview respondents voiced a wide variety of opinions about the technology areas where NYSERDA should place more or less focus. Some respondents stated that NYSERDA focuses too much on solar and manufacturing. Others stated that NYSERDA focuses too little on energy efficiency, biomass, and transportation. Still other respondents advocated for more focus on distributed generation, micro-grids, software, and water/energy. As one respondent stated, “We need to funnel the funds to those that have the

14
largest potential in a more streamlined manner.” In contrast, others advocated for keeping programs technology agnostic given that very early stage companies don’t necessarily know yet which market segment they should belong.
Invest more strategically/change funding strategy (n = 21). Relatedly, many interview respondents suggested that NYSERDA narrow its focus to fund a smaller number of companies with a greater chance of success. Stated an incubator director, “NYSERDA says it’s not their goal to pick winners; this is a problem. My view is its okay to see a wide portfolio, but they have to put more money in the companies that will provide better returns.” Stated a company, “NYSERDA should be focusing its efforts … in order to have a more impactful result.”
Other respondents encouraged NYSERDA to focus on developing clusters within NYS, focusing on areas with high potential that are not already developing (or well-developed) on their own. For example, a large company headquartered in NYS explained, “It would be good to get more clusters – NYS is very diverse. Maybe the State can pick one spot, and not spread out their investment too much. They should support a more central upcoming area, and not fund a balanced already self-sustaining area.”
A number of respondents suggested that NYSERDA provide direct funding to companies on the commercialization pathway. One respondent suggested that NYSERDA could provide a $100,000 grant to companies at the beginning of the commercialization process, which would enable companies to pursue SBIR and other federal funding. Others suggested that NYSERDA provide grants to companies after they hit certain milestones. An interviewee from a venture capital firm stated, “The timeframe of when a technology comes out of a university or research lab and when it will be in the market is very long, up to 15 years… They should provide some support for technology adoption, and say: If you hit all these milestones in an incubator and finish in the top five, then you get $250,000 towards deployment.” Some respondents also noted that the ICBD program not investing directly in companies contrasts with approaches taken by accelerators/incubators in other states even within NYS, such as the Massachusetts Clean Energy Center.
Other respondents suggested that NYSERDA should not invest in companies on its own, but should co-invest alongside venture capital firms; one respondent cited the Connecticut Innovations Fund as a good model. A respondent from upstate New York added that NYSERDA’s investment has a signalling effect, stating, “If we go out and try to attract investors it’s difficult; they only come when NYSERDA is involved, and that’s because of NYSERDA’s name recognition and reputation. The private money is there but it needs to be co-invested alongside NYSERDA dollars.”
Find and attract CEOs, entrepreneurs, companies and investors (n = 15). Business development service providers and companies identified a need to find and attract companies, investors, and entrepreneurs. A POCC director suggested that NYSERDSA should create “a pool of potential CEOs”, serial entrepreneurs who are interested in helping early-stage companies. A start-up company expanded suggesting that NYSERDA fund an entrepreneur fellowship program that attracted experienced entrepreneurs, paid them a stipend, and placed them in accelerators and companies. This could help address a gap in NYS, that is, experienced entrepreneurial leaders who can both build companies and commercialize technologies. Similarly, an angel investor recommended, “a grant to hire a real $200-250,000 level CEO so we grow the companies and the executives at the same time.”
On the investment side, some respondents stated that NYSERDA should help companies raise or leverage external financial capital, which is in part what the NY Green Bank is doing. One suggested that NYSERDA could develop targeted profiles of mid-stage cleantech companies and bring together a consortium of “non-traditional investors” to fund them. An interviewee from private equity suggested that NYSERDA could help companies to borrow money towards raising VC funds. Still other respondents suggested that NYSERDA should try to get out-of-state companies to locate in NYS.

15
ICBD programs can (and to a certain extent already do) assist their clients by helping find or even fund directly such pre-seed financial resources, and preparing companies for fundraising with VC investors (for example by helping them write business plans, presentations, practicing their “pitch” and so on). They can also help clients to identify and connect with potential investors; and if they gain traction, advise them on deal terms and conditions.
Networking, events, connections, and relationships (n = 15). Interviewees affirmed the value of NYSERDA’s networking events and highlighted NYSERDA’s role in forging connections within the cleantech ecosystem. Several respondents noted that relationships and connections are fundamental to building a well-functioning ecosystem. As a VC interviewee said, “So much of the success of things like this is driven by the ecosystem and by that I mean the people, so I think we need more events to bring people together to network.” Similarly, an EIR program participant stated, “For a small company it’s all about the relationships you develop with potential customers.” Overall, interviewees perceive high value in the networking events, although several respondents (with different backgrounds and affiliations) suggested that the ICBD program could do even more to connect companies, innovators, investors, universities, and economic development officers.
Disseminate information and success stories (n = 12). Interviewees’ suggestions in this area focused on the need to get the word out about ICBD services and success stories. One incubator director suggested that when NYSERDA sends response letters to PON applicants (both successful and unsuccessful), the letter should mention the availability of incubator services. Interviewees outside of the ICBD program expressed interest in learning more about the incubators and/or other opportunities to engage with NYSERDA. Stated a large company with headquarters in NYS, “I know there are incubators but I don’t know where to find them – is there a central website where I can find them?” A private equity respondent stated, “I’ve never had NYSERDA reach out to me – it’s so difficult to access and understand NYSERDA.”
Interviewees also expressed a need for NYSERDA to communicate success stories to attract more companies and investors to NYS. Stated an angel investor, “One big success from NYSERDA on an annual basis would be great… we need one big success story that will stick and attract more companies.” A business development service provider who is not affiliated with NYSERDA noted that communication needs may differ across the state and referred to an “upstate/downstate” or “City/non-City divide.” This respondent further noted that at a recent conference, a group of venture investors from California were very surprised to learn about cleantech entrepreneurial activity in upstate New York: “They couldn’t believe that upstate was doing this stuff – so we need to push for the prominent success story.”
NYSERDA processes (n = 12). Though more general to NYSERDA and not specific to the ICBD program, in 12 instances respondents provided feedback on NYSERDA’s processes. Two specific areas identified were: providing more clarity about what NYSERDA will and will not fund; connecting between different NYSERDA programs; and implementing easier/less bureaucratic solicitation and contracting processes. Strong opinions were heard on this topic

1
APPENDIX E: GEOGRAPHIC CONCENTRATIONS OF RESOURCES
E1. Emerging Concentrations of Resources supporting cleantech in NYS One indicator of a robust entrepreneurial ecosystem is the existence of a concentration of economic activity around a key technology or emerging market. When focused around a specific technology, this is often called a “cluster,” though the definition of a cluster can vary.
However, to support the development of both clusters, a health ecosystem should have both a geographic concentration of companies and by the proximity of a range of different ecosystem resources, including university or other research facilities, skilled workers, investors and other financial resources, and firms at different and complementary stages on the production and supply chain.
Data gathered for this MCA provide the basis for examining the extent to which resources are concentrated in different areas around areas where cleantech companies are also concentrated. These areas could potentially support development of technology-driven clusters (e.g., in areas such as solar manufacturing, energy storage and energy efficiency) though no single technology currently dominates in New York State. The CEI study, which mapped technology capabilities within clean energy companies (both early-stage and mature) found that:
Within energy efficiency, high efficiency lighting technologies (such as solid state or LEDs) are emerging as a sector, as is building automation, HVAC, and refrigeration
NYS has “clear strengths” in mechanical assembly and electrical assembly technical competencies
While this MCA does not have the data to support a formal cluster analysis, IEc did examine the geographic concentrations and distributions of nine different indicators of “health” in the NYS entrepreneurial ecosystem, to identify areas where resources might support a concentration of entrepreneurial activity. A simple scoring technique assigns integer values to the following metrics at a county level:
Density of cleantech companies: Number of young cleantech companies per 100,000 people (score of 0 for counties with a density of less than 1 to a score of 3 for counties with a density higher than 5)
Density of higher education institutions: Number of four year colleges, universities, and community colleges per capita (score of 0 if less than one per 100,000 people, up to score of 2 for higher than 2 per 100,000 people)
Density of patent-generating companies: (score of 0 for no companies, 1 for 1-10 companies, and 2 if more than 10 companies per county)
Number of clean energy jobs per 100,000 people (score from 0 if no jobs, to 2 if 3.5 jobs or higher)
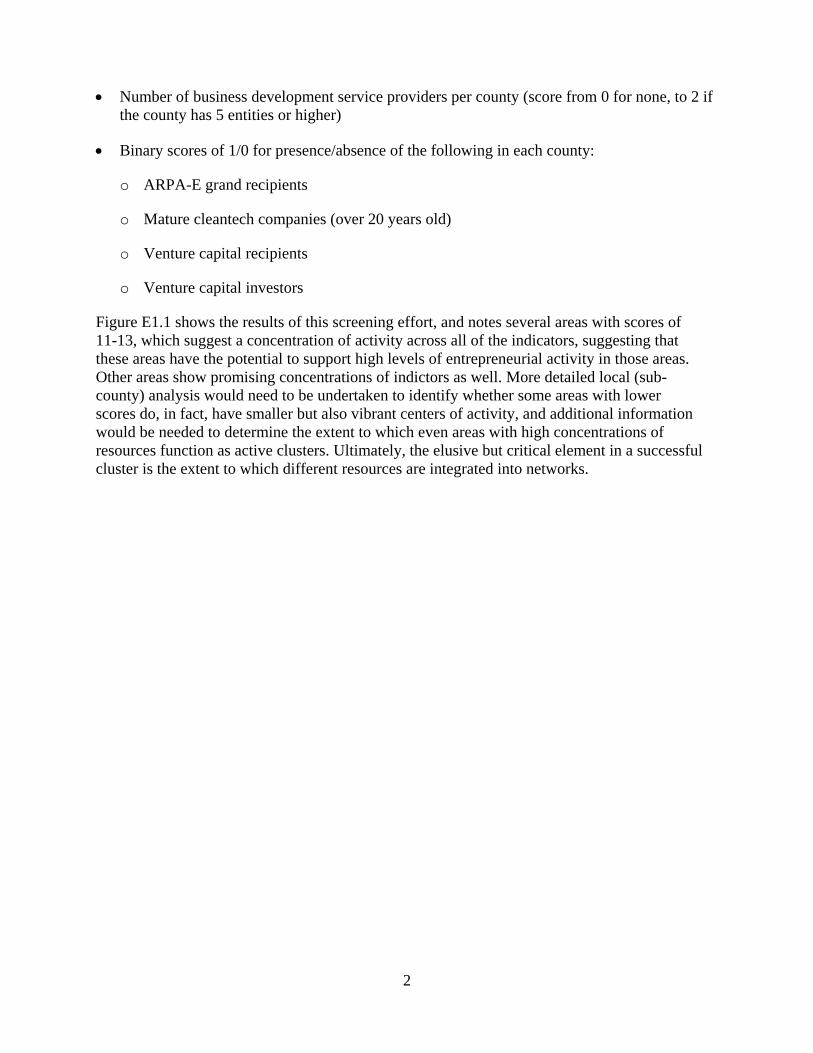
2
Number of business development service providers per county (score from 0 for none, to 2 if the county has 5 entities or higher)
Binary scores of 1/0 for presence/absence of the following in each county:
o ARPA-E grand recipients
o Mature cleantech companies (over 20 years old)
o Venture capital recipients
o Venture capital investors
Figure E1.1 shows the results of this screening effort, and notes several areas with scores of 11-13, which suggest a concentration of activity across all of the indicators, suggesting that these areas have the potential to support high levels of entrepreneurial activity in those areas. Other areas show promising concentrations of indictors as well. More detailed local (sub-county) analysis would need to be undertaken to identify whether some areas with lower scores do, in fact, have smaller but also vibrant centers of activity, and additional information would be needed to determine the extent to which even areas with high concentrations of resources function as active clusters. Ultimately, the elusive but critical element in a successful cluster is the extent to which different resources are integrated into networks.

Figure E1
E2. AnaThis sectcompanieworkers,
IEc combfrom integaps fromon incorp
IEc gatheecosystemprovidedto generacounty ra
1.1 Summary
alysis and tion describees and differfinancial re
bined variouerviews andm the primarporation date
ered data on m, and assig
d for each couate a score ofanged from o
y of Regiona
Data es the steps trent ecosystesources, and
us data sourd survey resury sources. Fe, location, n
nine indicesgned integer unty in Exhif cleantech aone (lowest a
l Concentrat
taken to charem resourcesd business de
rces includinults, and coFor examplenumber of em
s that measuscores to eacibit E2.2. IEcactivity for eactivity), to
3
tions of Reso
racterize the s in New Yoevelopment s
ng results fronducted sig, by lookingmployees, et
ure the healthch county inc then used t
each county. 13 (highest
ources to su
geographic ork State, incservice prov
from our prignificant desg up compantc.
h of a cleanten NYS as desthe sum of thThe scores activity).
pport Entrep
concentratiocluding univviders in the
mary researsktop researcnies’ website
ech entreprescribed in Exhe scores forof cleantech
preneurs
on of cleanteversities, skilstate.
rch for the Mch to fill in
es for inform
eneurial xhibit E2.1 ar the nine in
h activity by
ech lled
MCA n data mation
and ndices
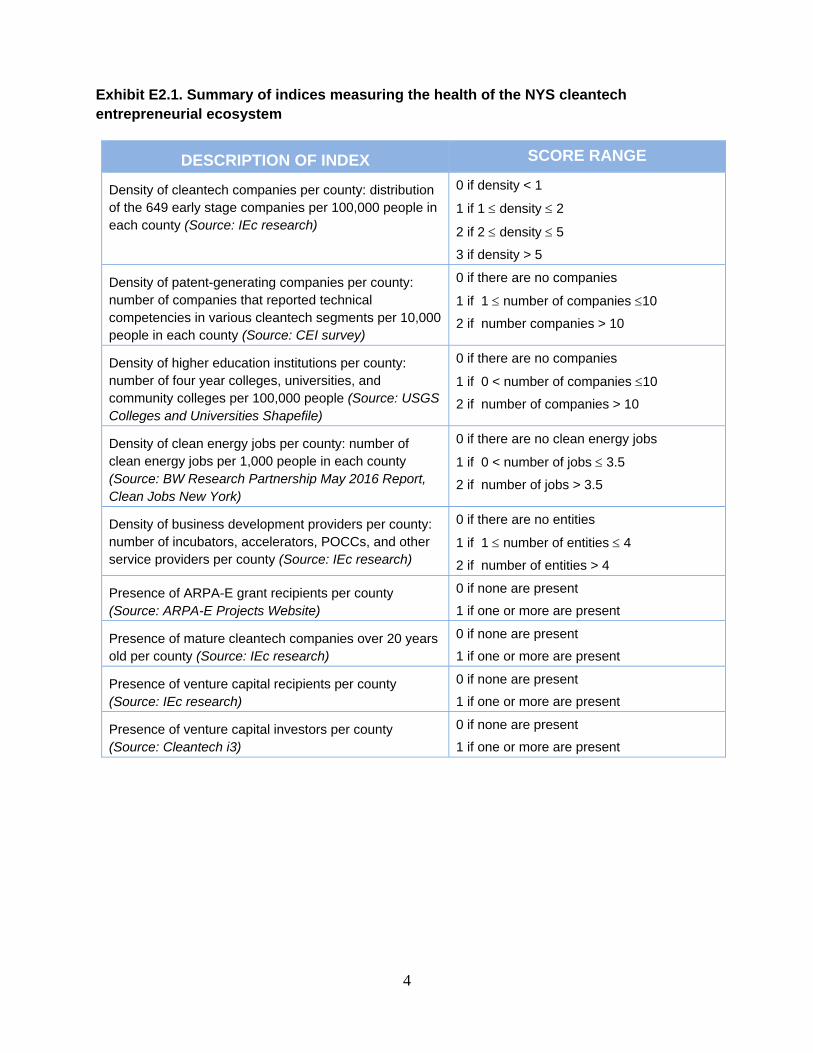
4
Exhibit E2.1. Summary of indices measuring the health of the NYS cleantech entrepreneurial ecosystem
DESCRIPTION OF INDEX SCORE RANGE
Density of cleantech companies per county: distribution of the 649 early stage companies per 100,000 people in each county (Source: IEc research)
0 if density < 1
1 if 1 density 2
2 if 2 density 5
3 if density > 5
Density of patent-generating companies per county: number of companies that reported technical competencies in various cleantech segments per 10,000 people in each county (Source: CEI survey)
0 if there are no companies
1 if 1 number of companies 10
2 if number companies > 10
Density of higher education institutions per county: number of four year colleges, universities, and community colleges per 100,000 people (Source: USGS Colleges and Universities Shapefile)
0 if there are no companies
1 if 0 < number of companies 10
2 if number of companies > 10
Density of clean energy jobs per county: number of clean energy jobs per 1,000 people in each county (Source: BW Research Partnership May 2016 Report, Clean Jobs New York)
0 if there are no clean energy jobs
1 if 0 < number of jobs 3.5
2 if number of jobs > 3.5
Density of business development providers per county: number of incubators, accelerators, POCCs, and other service providers per county (Source: IEc research)
0 if there are no entities
1 if 1 number of entities 4
2 if number of entities > 4
Presence of ARPA-E grant recipients per county (Source: ARPA-E Projects Website)
0 if none are present
1 if one or more are present
Presence of mature cleantech companies over 20 years old per county (Source: IEc research)
0 if none are present
1 if one or more are present
Presence of venture capital recipients per county (Source: IEc research)
0 if none are present
1 if one or more are present
Presence of venture capital investors per county (Source: Cleantech i3)
0 if none are present
1 if one or more are present

5
Exhibit E2.2. Summary of cleantech activity indices by County
CO
UN
TY
EAR
LY-S
TAG
E C
LEA
NTE
CH
C
OM
PAN
IES
IND
EX
PATE
NT-
GEN
ERA
TIN
G
CO
MPA
NIE
S IN
DEX
HIG
HER
ED
. IN
DEX
JOB
S IN
DEX
BU
S. D
EV.
IND
EX
AR
PA-E
G
RA
NTS
IN
DEX
MA
TUR
E C
LEA
NTE
CH
C
OM
PAN
IES
IND
EX
VC
INVE
STEE
S IN
DEX
VC IN
VEST
OR
IN
DEX
SCO
RE
OF
CLE
AN
TEC
H
AC
TIVI
TY
Albany 3 2 2 0 2 0 1 0 1 11 Allegany 1 1 2 1 0 0 0 0 0 5 Bronx 1 0 0 0 2 0 0 0 0 3 Broome 3 2 1 2 1 0 1 0 0 10 Cattaraugus 1 1 2 1 0 0 0 0 0 5 Cayuga 1 2 2 1 0 0 1 0 0 7 Chautauqua 2 0 1 2 1 0 1 0 1 8 Chemung 1 2 2 1 0 0 0 0 0 6 Chenango 2 1 1 1 0 0 0 0 0 5 Clinton 1 0 2 2 0 0 0 0 0 5 Columbia 1 1 0 2 0 0 0 0 0 4 Cortland 1 0 2 1 0 0 0 0 0 4 Delaware 1 1 2 2 0 0 1 0 0 7 Dutchess 2 2 2 0 0 0 0 0 0 6 Erie 3 2 1 0 1 0 1 0 0 8 Greene 2 1 0 1 0 0 0 0 0 4 Hamilton 0 0 0 2 0 0 0 0 0 2 Herkimer 0 1 1 1 0 0 1 0 0 4 Jefferson 1 0 0 1 1 0 0 0 0 3 Kings 3 2 1 0 2 0 0 1 0 9 Livingston 1 0 1 1 0 0 0 0 0 3 Madison 0 1 2 1 0 0 0 0 0 4 Monroe 3 2 1 0 1 1 1 0 0 9 Nassau 3 2 1 0 1 0 1 0 1 9 New York 0 2 2 0 2 1 1 1 0 9 Niagara 3 0 1 1 0 0 1 0 0 6 Oneida 0 1 2 1 1 0 1 0 0 6 Onondaga 3 2 1 0 1 1 1 1 0 10 Ontario 2 1 1 2 0 0 1 0 0 7 Orange 1 0 1 0 1 0 1 1 0 5 Otsego 1 1 2 1 1 0 0 0 0 6 Queens 2 1 0 0 1 0 0 1 1 6 Rensselaer 3 2 2 2 1 1 1 1 0 13

6
CO
UN
TY
EAR
LY-S
TAG
E C
LEA
NTE
CH
C
OM
PAN
IES
IND
EX
PATE
NT-
GEN
ERA
TIN
G
CO
MPA
NIE
S IN
DEX
HIG
HER
ED
. IN
DEX
JOB
S IN
DEX
BU
S. D
EV.
IND
EX
AR
PA-E
G
RA
NTS
IN
DEX
MA
TUR
E C
LEA
NTE
CH
C
OM
PAN
IES
IND
EX
VC
INVE
STEE
S IN
DEX
VC IN
VEST
OR
IN
DEX
SCO
RE
OF
CLE
AN
TEC
H
AC
TIVI
TY
Richmond 1 1 0 0 1 0 0 0 1 4 Rockland 2 2 2 0 1 0 1 0 0 8 Saratoga 3 2 1 0 0 0 1 0 0 7 Schenectady 3 1 1 2 0 0 0 1 0 8 Schoharie 1 2 2 2 0 0 0 0 0 7 Seneca 1 1 2 1 0 0 0 0 0 5 St Lawrence 2 0 2 0 0 0 0 0 0 4 Steuben 2 2 2 1 1 0 1 0 0 9 Suffolk 3 2 0 0 2 1 1 1 0 10 Sullivan 1 0 2 2 0 0 0 0 0 5 Tompkins 3 2 1 2 1 1 1 1 0 12 Ulster 3 2 2 2 0 0 1 0 1 11 Warren 1 0 1 2 0 0 0 0 1 5 Wayne 1 0 1 1 0 0 1 0 0 4 Westchester 3 1 2 0 1 1 1 1 0 10 Wyoming 1 0 0 1 0 0 0 0 0 2 Putnam 0 0 0 2 0 0 0 0 0 2 Essex 0 0 0 2 0 0 0 0 0 2 Fulton 0 0 0 2 0 0 0 0 1 3 Yates 0 0 2 2 0 0 0 0 0 4 Genesee 0 0 1 1 0 0 0 0 0 2 Schuyler 0 0 0 1 0 0 0 0 1 2 Franklin 0 0 1 1 0 0 1 0 1 4 Lewis 0 0 0 1 0 0 0 0 0 1 Oswego 0 0 1 1 0 0 0 0 0 2 Montgomery 0 0 1 1 0 0 1 0 0 3 Tioga 0 0 0 1 0 0 0 0 0 1 Washington 0 0 0 1 0 0 0 0 0 1 Orleans 0 0 0 1 0 0 0 0 0 1

E3. AddThe followhere the
Figure E
1 IEc combi
ditional datowing figureere are conc
E3.1 Summa
ned dataset of N
ta and anas break out eentrations of
ary of the Ea
NYS cleantech co
lysis of regeach of the nf activity jus
arly-Stage C
ompanies.
7
gional connine indices st for that sp
Cleantech C
ncentrationof cleantechecific set of
Companies
ns
h activity in Nf data.
Index by C
NYS, showi
ounty1
ing
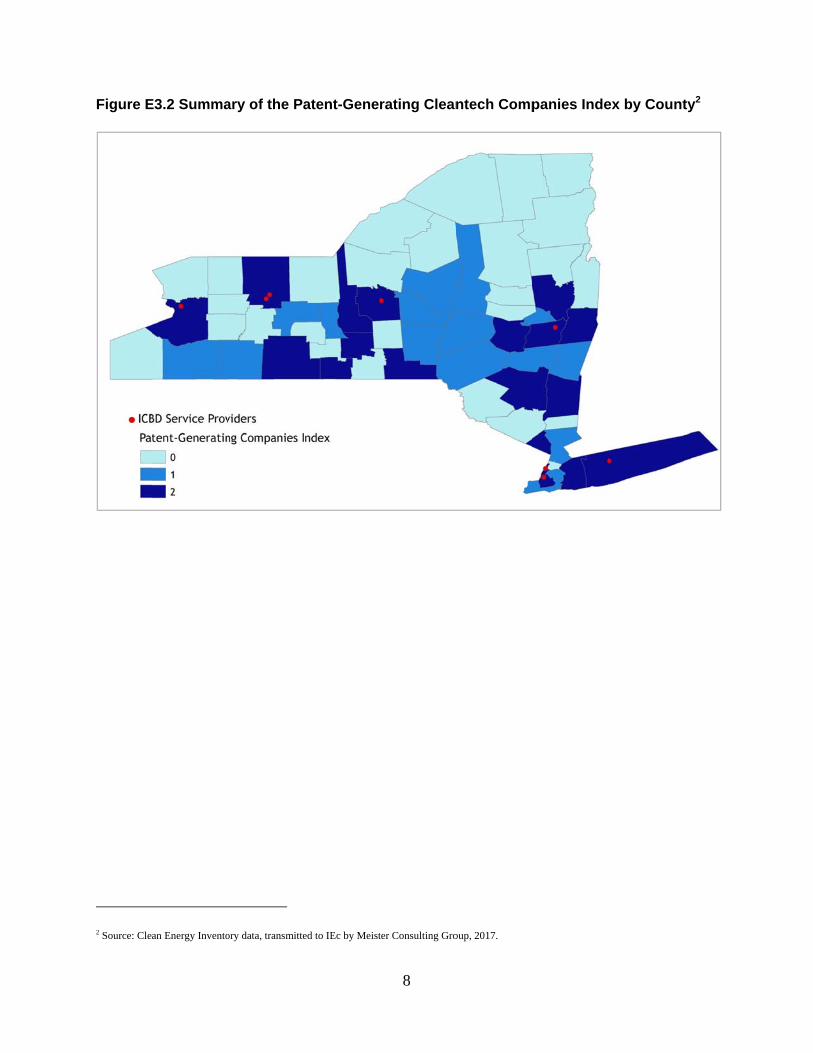
Figure E
2 Source: Cle
E3.2 Summa
an Energy Invento
ary of the Pa
ory data, transmitte
atent-Gener
ed to IEc by Meist
8
rating Clean
ter Consulting Gro
ntech Comp
oup, 2017.
panies Indeex by Count
ty2

Figure E
3 United Sta
E3.3 Summa
ates Geological S
ary of the H
Survey (USGS) C
igher Educa
Colleges and Un
9
ation Institu
niversities Shape
utions Index
efile, 2017.
x by Countyy3

Figure E
4 BW Resea
E3.4 Summa
arch Partnership
ary of the C
p May 2016 Repo
lean Energy
ort, Clean Jobs N
10
y Jobs Inde
New York
ex by Countty4
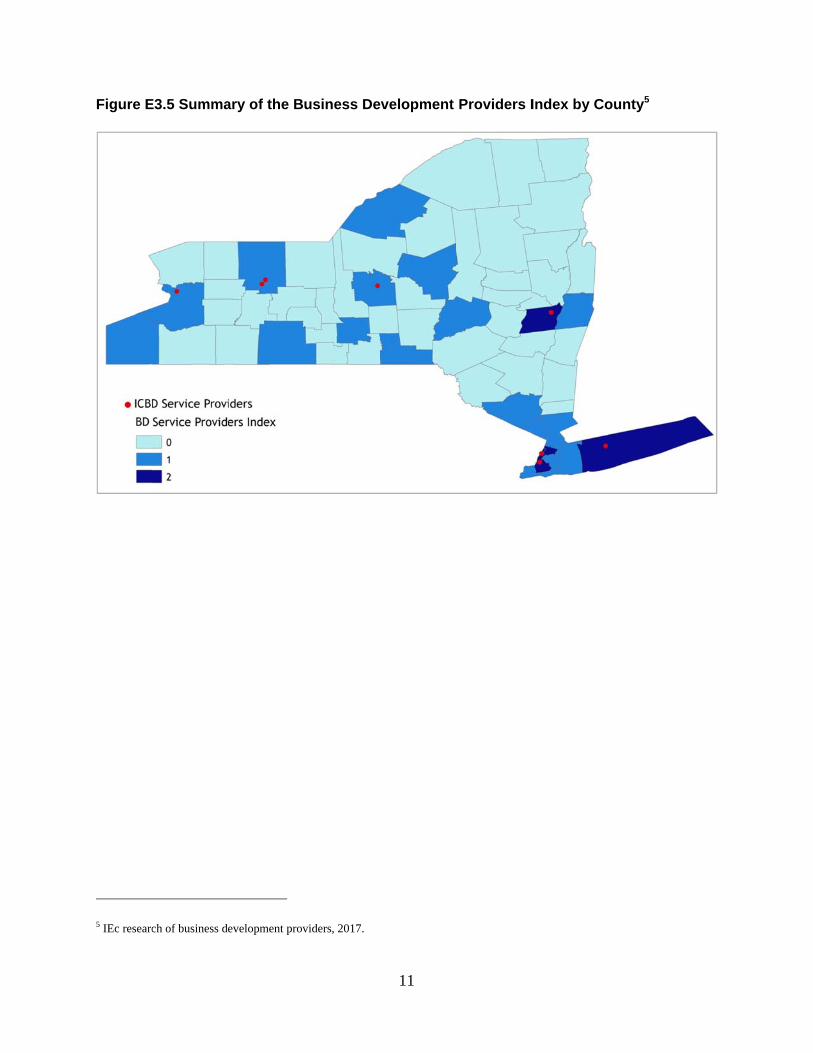
Figure E
5 IEc researc
E3.5 Summa
ch of business d
ary of the B
evelopment prov
usiness De
viders, 2017.
11
velopment Providers IIndex by Coounty5

Figure E
6 IEc analys
E3.6 Summa
sis of ARPA-E P
ary of the A
Projects. Data Ac
RPA-E Gran
ccessed online Ja
12
nts Index by
anuary 2017 at: h
y County6
https://arpa-e.ennergy.gov/?q=arppa-e-site-page/p
rojects

Figure E(Source:
E3.7 Summa: IEc Resea
ary of the Mrch)
ature Clean
13
ntech Comppanies Index by County

Figure E
7 IEc analys
E3.8 Summa
sis of Cleantech i
ary of the Ve
i3 data.
enture Capi
14
ital Investeees Index byy County7

Figure E
8 IEc analys
E3.9 Summa
sis of Cleantech i
ary of the Ve
i3 data.
enture Capi
15
ital Investors Index byy County8