Characterization, Source, and Risk in RO Membrane Method ...
13
Page 1/13 Development of a Headspace-Gas Chromatography-Mass Spectrometry Method Based on Matrix-Matched Calibration for Evaluating VOC Content, Characterization, Source, and Risk in RO Membrane Mingtao Hou China Building Materials Academy Hui-xue Ren ( [email protected] ) Shandong Jianzhu University https://orcid.org/0000-0002-5389-1084 Wenqing Cheng Shandong Jianzhu University Lingjie Li Shandong Jianzhu University Shuai Zhang Shandong Jianzhu University Yanxue Chen Shandong University Chunfeng Yu Energy Research Institute of Shandong Academy of Sciences Fangjun Li Shandong Sanqi Energy Co.LTD Naichao Chi China Building Materials Academy Wenxiu Wang China Association for Quality Zhe Deng China Household Appliance Research Institute Research Article Keywords: RO membrane, Volatile organic compounds, HS-GC/MS, Matrix effect, Risk assessment Posted Date: May 10th, 2021 DOI: https://doi.org/10.21203/rs.3.rs-404558/v1 License: This work is licensed under a Creative Commons Attribution 4.0 International License. Read Full License Version of Record: A version of this preprint was published at Polymer Testing on January 1st, 2022. See the published version at https://doi.org/10.1016/j.polymertesting.2022.107474.
Transcript of Characterization, Source, and Risk in RO Membrane Method ...
Page 1/13
Development of a Headspace-Gas Chromatography-Mass SpectrometryMethod Based on Matrix-Matched Calibration for Evaluating VOC Content,Characterization, Source, and Risk in RO MembraneMingtao Hou
China Building Materials AcademyHui-xue Ren ( [email protected] )
Shandong Jianzhu University https://orcid.org/0000-0002-5389-1084Wenqing Cheng
Shandong Jianzhu UniversityLingjie Li
Shandong Jianzhu UniversityShuai Zhang
Shandong Jianzhu UniversityYanxue Chen
Shandong UniversityChunfeng Yu
Energy Research Institute of Shandong Academy of SciencesFangjun Li
Shandong Sanqi Energy Co.LTDNaichao Chi
China Building Materials AcademyWenxiu Wang
China Association for QualityZhe Deng
China Household Appliance Research Institute
Research Article
Keywords: RO membrane, Volatile organic compounds, HS-GC/MS, Matrix effect, Risk assessment
Posted Date: May 10th, 2021
DOI: https://doi.org/10.21203/rs.3.rs-404558/v1
License: This work is licensed under a Creative Commons Attribution 4.0 International License. Read Full License
Version of Record: A version of this preprint was published at Polymer Testing on January 1st, 2022. See the published version athttps://doi.org/10.1016/j.polymertesting.2022.107474.
Page 2/13
AbstractAnalytical method have been developed to determine volatile organic compounds (VOCs) in reverse osmosis (RO) membrane using headspace with gaschromatographic mass spectrometry (HS-GC/MS). The operating parameters, including incubation temperature, incubation time and the choice of matrixmodi�er, were investigated. The existence of matrix effect was checked and the VOC-free RO membrane was selected as the best material for developingmatrix-matched calibration curve. At optimum operating conditions, the established method performed good linearity (R > 0.996), repeatability (< 9.5%), VOCrecoveries (84.7%—123%) and detection limits (3.44—748 µg/kg). The method was applied to determining thirty-seven common VOCs for RO membrane andtoluene and N,N-dimethylformamide were the most abundant VOCs in measured samples, with average contents of 90 087 µg/kg and 249 957 µg/kgrespectively. Besides, compounds including acetone, dichloromethane, hexane, chloroform, 1,2-dichloroethane, benzene, chlorobenzene, ethylbenzene, xylene,styrene were also found with content between N.D.—112 419 µg/kg in detection rate between 40%—100%. The analysis of VOC distribution showed thesolvents used during the production of the RO membrane were the main source of VOCs in commercial RO membrane. Of these VOCs, dichloromethane,chloroform, 1,2-dichloroethane, and toluene were hardly removed by pre-washing. The relationship between the content of VOCs in RO membrane and theircorresponding concentration in �ltrated water showed highly positive correlation and the safety limit values for the four compounds were evaluated as2.6×102–3.8×10⁵ µg/kg, but more accurate and completed guideline values should be formulated to guarantee the RO membrane quality.
1. IntroductionWater pollution in surface water and underground water is becoming serious in worldwide nowadays. Heavy metals and organic compounds are the mostfocused pollutants in water sources and for decades, many water treatment technologies, including biological process, electrochemistry, chemical reduction,and physic-chemical method, are used in water disposal (Hou et al., 2018; Hou et al., 2015; Ren et al., 2016; Sharma and Bhattacharya, 2016). Of thesetechnologies, the reverse osmosis (RO) membrane technology has been extensively employed in urban households and poverty-stricken regions all over theworld, because it is able to synchronously remove contaminants, including heavy metals, organic compounds, and bacteria (Sharma and Bhattacharya, 2016).
The primary concept of RO was started by Loeband Sourirajan in the 1960s through the introduction of asymmetric cellulose acetate membrane, butcommercial application in this �eld thrived with the development of thin �lm composite (TFC) RO membrane owing to its salt rejection, resistance to pressurecompaction, and wide operating temperature range and pH range (Kang and Cao, 2012; Li and Wang, 2010; Liu et al., 2011). For decades, studies have beenintensively focused on the development of the RO membranes by using novel materials and methods for synthesis to increase the RO membrane’sperformance in terms of high water �ux, long lifetime, and resistance to chlorine and membrane fouling (Shi et al., 2017; Wei et al., 2010; Zhang et al., 2013).Notably, many volatile organic compounds (VOCs), such as toluene (Tol), hexane (Hex), and N,N-dimethylformamide (DMF), are widely used as solventsduring the synthesis and modi�cation of the RO membrane (Emadzadeh et al., 2015; Guillen et al., 2011; Rana et al., 2015). For this reason, removing theresidual organic compounds during the production process of RO membrane is an essential step which is performed by squeezing using a roll rubber, drying atambient temperature − 90°C, and washing by pure water (Liu et al., 2014; Yan et al., 2016; Zhao et al., 2017). However, before the use, pre-washing for a certaintime is still a required step in RO operation speci�cation to ensure the quality of e�uent water. Nevertheless, residual organic contamination in commercial ROmembrane is also a crucial problem even if few studies have been published about it.
Countries in the worldwide have formulated standards to ensure the quality of the materials in contact with water. National Sanitation Foundation of UnitedStates (NSF) has established a series of standards for evaluating the materials and units for drinking water treatment, and these criteria have also beenquoted as the American National Standard (NSF/ANSI, 2015; 2017; 2018). Of these criteria, NSF-58 Reverse Osmosis — Drinking Water Treatment Systemswas the main reference used for the evaluation of the health effects of RO membrane, and it introduced a classical method referred to as the extractiontesting. According to this method, samples were completely �lled with exposure water which contained 50 ± 5 mg/L of total dissolved solids and 0.5 ± 0.05mg/L of free available chlorine and have a pH of 6.75 ± 0.25, and maintained for 24 h at an ambient temperature of 23 ± 2°C. At least 2 L of exposure watershall be collected for analysis and the above process shall be repeated to give a total of three times. Similarly, State Bureau of Technical Supervision of Chinaalso published criteria in accordance with NSF’s method to ensure the health security of water-contact materials used in drinking water treatment and toluene(Tol), dichloromethane (DCM) and trichloromethane (TCM) were selected as the candidates in the testing of RO membrane (SBTS, 1998). However, theshortcomings of this method are that it required plenty of time for preprocessing, and the products which were certi�cated by NSF standards were possible tocause problems in practice since there existed deviations between extraction testing and the actual use (Heim and Dietrich, 2007; Triantafyllidou et al., 2012).In addition, common solvents, such as DMF and Hex, are not limited by above criteria. Therefore, developing a fast and comprehensive method for thedetermination of the residual organic components in RO membranes is signi�cant to ensure their sanitary safety for household use.
In this investigation, we developed an analytical method for the determination of VOCs in RO membrane using headspace-gas chromatography-massspectrometry (HS-GC/MS). The in�uence of parameters, including matrix modi�er selection, incubation time and temperature, were optimized. The effect ofthe existence of matrix effect was also studied. The method developed in this paper was used to analyze the VOC content of commercial RO membranes, andsources of various VOCs were also discussed. In addition, risk assessment conducted by evaluating the relationship between speci�c VOC content in ROmembrane and their concentration in e�uent water was also investigated. The results obtained in this study could provide the foundation for futurecontamination analysis and development of the RO membrane.
2. Experimental
2.1 Chemicals and standard solutionsMethanol and acetonitrile were HPLC grade and purchased from Fisher Chemical, China. VOC standard solutions, nylon membrane and mixed cellulose estermembrane were obtained from ANPEL Scienti�c Instrument Co., Ltd., China. Deionized water was obtained with a Milli-Q puri�cation system. A stock solution

Page 3/13
of the VOCs was prepared in methanol and stored in a refrigerator at 4°C for no more than 12 h.
2.2 RO membrane samplesTo estimate the VOC content in RO membrane, various samples purchased from different manufacturers were used in the experiments (RO1–RO10). Beforethe experiments, each sample of RO membrane was dismantled into three parts, namely, the outer packing gummed paper, RO membrane, and gauze element.The dismantled RO membranes were stored in sealed valve bags away from light and analyzed within 2 h. Before analysis, RO membrane samples wererapidly cut down to a size of 5 cm×2 cm, and the samples at 0.2 g were placed into a headspace bottle that was contained by a certain matrix modi�er (ifhave). Afterward, the headspace bottles were closed with an aluminum seal and waited for analysis. The incubation time for equaling samples was in therange of 15–180 min, and the oven temperature was in the range 45°C–140°C. The injection volume was 1000 µL. Calibration curves were constructed byplotting the peak areas against the content of each analyte, and then, the contents of VOCs in RO membranes were calculated according to the followingformula:
where ρ is the content of VOCs in RO membrane (µg/kg), and c is the mass of the measured individual VOCs by HS-GC/MS (ng). m is the sample mass (g),and w is the moisture content (%) of each sample.
2.3 Pre-washing of RO membraneA RO water puri�er (Fig. 1) without other puri�cation crafts was used to investigate the practical effect of residual VOCs in RO membrane on puri�ed waterquality. The RO membrane used was in the same batch as the above experiments. Deionized water without VOC background was pumped into theexperimental RO membrane at speed of 0.5 L/min, and the VOC concentration in e�uent water was determined within 24 h.
2.4 Instrument and sample analysisAn automated headspace instrumentation (Dani, HSS 86.50, U.S.A) set at certain temperature (45°C–140°C) was used for the pretreatment of the samples.The loop (1000 µL) and line transmission line temperatures were 150°C and 170°C, respectively. The VOC content of the RO membrane was analyzed in a gaschromatograph system (Shimadzu, 2010 plus, Japan) equipped with a mass detector (Shimadzu, QP 2020, Japan). A 624MS chromatographic column (30 m× 0.25 mm × 1.4 µm, Shimadzu, Japan) was used to separate individual VOCs. Helium (99.999%) was used as carrier gas at 1.17 mL/min, and the injectorwas operated in a split of 1:5 ratio. The injector temperature was 230°C, and the results were obtained using the following program: the column temperaturewas initially at 40°C for 5 min after injection and then increased at 20°C/min to 200°C. For mass spectrometry, ionization was carried out by electronic impact(EI) with a voltage of 70 eV and full scan mode in the m/z range of 35–400. The ion and transference temperatures were set at 230°C and 200°C, respectively.Analyte retention times and the ions for analysis in HS-GC/MS are shown in Table S1.
The VOC concentration in e�uent water was measured by a standard method under the instrumental conditions mentioned above (MEP, 2016). The DMF’sconcentration in water was detected by high-performance liquid chromatography (Shimadzu, Japan) with an InertSustain C18 column (150 mm × 4.6 mm, 5µm) and UV detection at 198 nm. The mobile phase was acetonitrile and water (5: 95 V/V%) with a �ow rate of 0.8 mL/min. The column oven was set at 35°C.After �ltration through a 0.22 µm �lter membrane, the DMF in samples was measured with direct injection method.
3. Results And Discussion
3.1 Experimental conditions optimizationTo accurately analyze the VOCs in RO membrane, investigating the effects of various experimental conditions was necessary. A preliminary screening of VOCsshowed that DCM, Tol, DMF, chlorobenzene (PhCl), and xylene (Xyl) were abundant in the RO membrane (Fig. 2). Thus, they were employed to optimize theoperation parameters of the headspace. In this study, the matrix modi�er, incubation temperature, and incubation time were investigated by comparing thevariations in GC/MS spectrum peak areas under various experimental conditions.
The matrix modi�er aiming at improving the recovery rates or the signal abundance was typically used for the analysis of VOCs in aqueous/solid phase as itcould decrease or eliminate the effect from the studied matrix without altering the natural levels of the analyte of the interest (Cavalcante et al., 2010). Inparticular, saturated NaCl solution or phosphoric–NaCl solution were extensively used in standard methods widely (MEP, 2016; USEPA, 1996). As we known,headspace formation methodologies contribute to signal intensity, thus the addition of a salt modi�er in sample system that is not saline favors wouldincrease the signal intensity. However, Cavlcante et al. observed the VOCs determination was not dependent on salinity and pH change (Cavalcante et al.,2010), and the similar results was also obtained by Menendez et al. when using NaCl saturation for sample preparation (Menendez et al., 2000). On the otherhand, direct analysis of VOCs in samples without the addition of any modi�er has been practiced in material testing owing to its convenience and highsensitivity (Hwang et al., 2019; Lim et al., 2014; Seo and Shin, 2010).
In these experiments, the variations in GC/MS spectrum peak areas under various experimental conditions are shown in Fig. 3. It can be seen that the sampleused did contain VOCs and Tol showed the highest peak areas among the �ve VOCs. The peak areas obtained by direct analysis were apparently higher thanthose with the addition of matrix modi�er (Fig. 3A), especially for Tol, DMF, and Xyl. The reason for this could be partly because these VOCs are both di�cultto escape into aqueous phase from samples and into gas phase from aqueous solution. Thus, the modi�er used in experiments decreased the gas phaseconcentration of the targeted compounds.

Page 4/13
Incubation temperature often plays an important role on headspace analysis because the higher the incubation temperature is, the higher the diffusion rate foranalytes from the sample to the headspace is. As shown in Fig. 3B, the area peak for the �ve VOCs slowly increased with increasing incubation temperaturesfrom 45°C to 80°C, but then dramatically increased when the incubation temperature was increased from 80°C to 140°C. However, the higher incubationtemperatures requires more energy consumption and lead to a higher interior pressure and more water vapor in the head space bottle. In this study, when theincubation temperature was beyond 100°C, the risk of top lid bursting greatly increased.
Incubation time is also an important parameter that affects the sensitivity on the measurement of the VOCs in the samples. Figure 3C shows that the VOCpeak areas sharply increased with the 15–60 min equilibrium time and then slowly decreased with 60–180 min equilibrium time. The result illustrated theVOCs, even with the low boiling point, required a relatively long time for release. Thus, the optimal experiment conditions for headspace were determined asfollows: headspace equilibrium without matrix modi�er, equilibrium temperature of 100°C, and equilibrium time of 60 min.
3.2 Evaluation of the matrix effect and method validationMatrix effect is often essential to the in�uent of the component of the aqueous/solid matrix in the GC/MS determination, and the ways to combat matrixeffects in GC–MS have been extensively studied (Cavalcante et al., 2010; Ferrer et al., 2011; Garcia Pinto et al., 2011). However, each of the approaches hasadvantages and disadvantages in certain aspects and among the approaches, matrix-matched calibration is widely used due to its wide applicability andeconomic bene�ts (Kwon et al., 2012).
In this study, in order to explore the matrix effect, several matrixes including Nylon Membrane, Mixed Cellulose Ester Membrane, and RO Membrane (samplesRO1) were selected as the matched matrixes. For the preparation of calibration curve, all matrix materials were baked in 105°C for a certain period for thepreparation of VOC-free matrix. The prepared matrix with mass at 0.20 g was �lled into the headspace bottle, and 1 µL of VOC standard solution atconcentration 100–2000 ng/µL (2 000—20 000 and 50 000–500 000 ng/µL for Tol and DMF, respectively) was injected rapidly into the matrix materials. Then,the top lid of the headspace bottle was soon compressed by a speci�c tool. The calibration cure was established with peak areas of quantitative ions and themass of the added VOCs using external standard method.
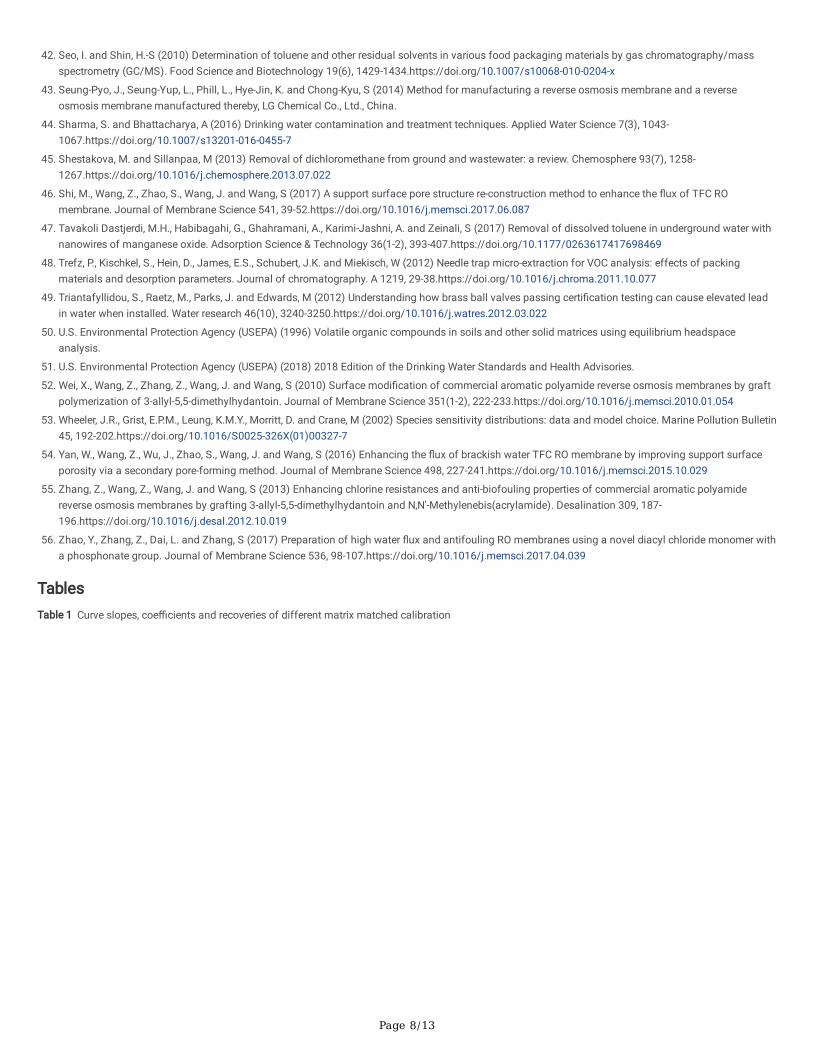
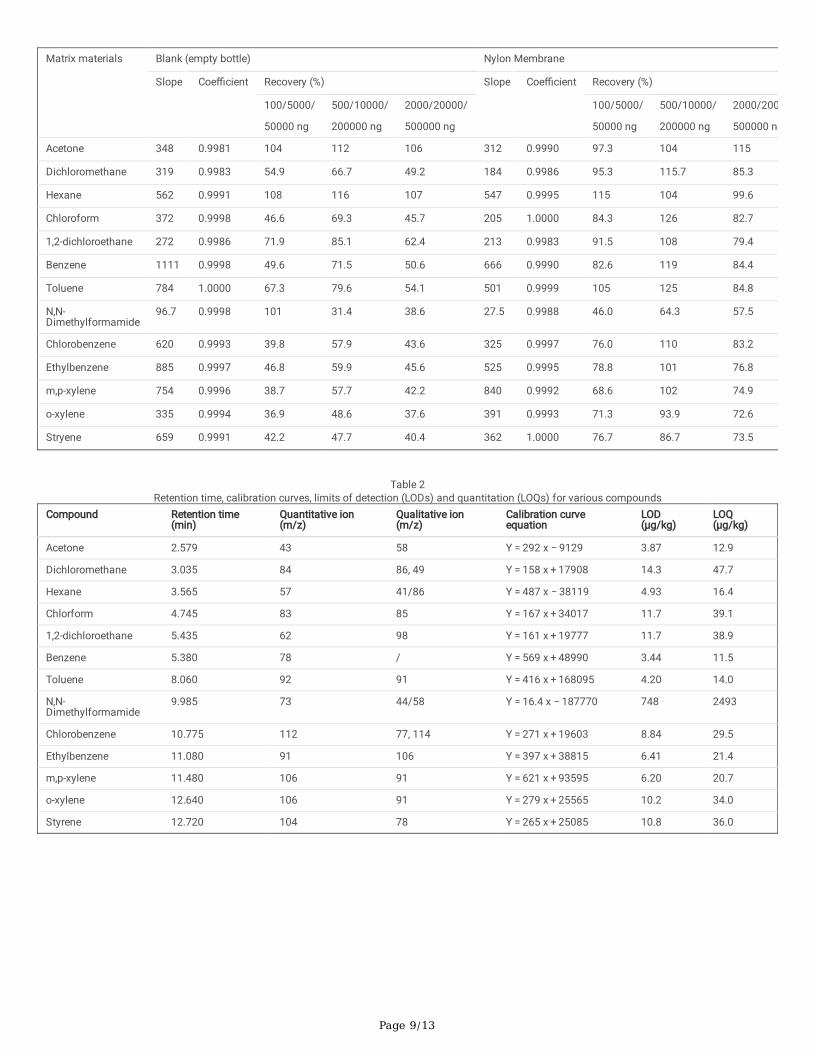
Correlation coe�cients (r), relative standard deviations (RSDs), recoveries, limits of detection (LODs), and limits of quantitation (LOQs) were employed to verifythe validation of the proposed method under optimized headspace condition. Table 1 gives an overview of calibrations for all substances analyzed by meansof the matrix-matched method (only showed the VOCs detected in testing samples). All of the selected matched matrixes showed good linearity in theconcentration range of 100–2 000 ng or 2 000—20 000 ng or 50 000–500 000 ng with the correlation coe�cients (r) ranging from 0.9960 to 1.0000. However,the slopes of the curve developed by different matrix showed signi�cant differences. For instances, the slopes obtained were in the range 167 to 372 for TCMand 5.83 to 96.7 for DMF, demonstrating that the matrix effect had a great in�uence on the determination of VOCs in RO membranes (Garcia Pinto et al.,2011).
For recoveries, three levels of the standard adding (5 000, 10 000, 20 000 ng for Tol and 50 000, 200 000, and 500 000 ng for DMF and 100, 500, 2000 ng forothers) were used to verify the method validation. It can be seen that by matrix-matched calibration, most targeted compounds (except DMF) showed goodresults of 70–130% (Table 1), but the calibration developed without adding matrix (empty gas) showed higher slope and insu�cient recovery rate for most ofthese compounds, indicating the absorption of VOCs in matrix decreased their concentration in vapor phase. It is worthily noting that DMF showed very poorrecoveries, except when the VOC-free RO membrane used as the matrix material. Afterwards, the VOC-free matrix-matched calibration was used for evaluatingthe reproducibility of different VOCs and the RSD values of the analytic VOCs were all below 9.5% at above three content levels (n = 6), indicating the proposedmethod had good reproducibility.
Limits of detections (LODs) and quantitation (LOQs) were measured by means of the signal to noise ratio. Noise was determined experimentally from theblank samples and LOD was de�ned as S/N of 3, LOQ as S/N of 10 (Trefz et al., 2012). Table 2 shows the LODs and LOQs, as well as the correspondingretention time, quantitative ions, qualitative ions, and calibration curve for various VOCs. Most of the compounds presented LODs of no more than 15 µg/kgand LQDs of no more than 48 µg/kg. However, compared with these compounds, DMF (a universal solvent) showed a much higher LOD (748 µg/kg) and LQD(2493 µg/kg) mainly due to its high boiling point and strong absorption on matrix materials.
3.3 VOC distribution and VOC sourcesVOCs in 10 RO membrane samples from different manufacturers were determined by the developed method. Table 3 illustrated the analysis results of ROmembrane samples. Clearly, all experimental samples contained at least four VOCs. The total amount of VOCs (Σ VOCs) in various RO membrane samplesvaried from 107 309 to 1 189 847 µg/kg dry weight with a mean concentration of 371 574 µg/kg.
Among the screened 37 VOCs (Table S1), only DMK, DCM, Hex, TCM, DCA, benzene (PhH), Tol, DMF, PhCl, ethylbenzene, Xyl, and stryene were detected. Thedetection rate of each VOCs in RO membrane was in the following order: DMF (100%) = Tol (100%) = Xyl (100%) > ethylbenzene (90%) > PhCl (80%) > DMK(70%) = Hex (70%) = PhH (70%) = styrene (70%) > TCM (60%) = DCA (60%) > DCM (40%). This order showed that these VOCs were used in RO membraneproduction at different degrees. Tol and DMF were relatively abundant with mean contents of 90 087 and 249 957 µg/kg, representing 24.2% and 67.3% ofmean Σ VOCs, respectively. For individual sample, the contents of Tol and DMF were also dramatically higher than those of other VOCs, and their content wererespectively accounting for 5.80–60.0% and 27.9–89.3% of ΣVOCs over the tested samples. As the VOCs should originate from the production and processingof RO membrane and the VOC content, such as DMK, DCM and TCM, showed discrepancies between various samples (Table 3), in this study, only the possiblesources for those VOCs are discussed exploratory. .
Nowadays, the mainstream technology currently used for the preparation of commercial RO membranes is interfacial polymerization on support materials viatwo steps (Gholami et al., 2018; Rana et al., 2015). In the �rst step, support membrane (the most common is Polysulfone (PSF), Fig. S1) is prepared accordingto the phase inversion method by casting their monomer solution on non-woven fabric. In the second stage, polyamide barrier layer on the top of support

Page 5/13
membrane is prepared by in situ interfacial polymerization process between m-phenylenediamine (MPD) in the aqueous phase and trimesoyl chloride (TMC)in the organic phase (Kong et al., 2011; Lalia et al., 2013; Mohan and Kullová, 2012).
VOC contamination could be introduced during the above steps. Usually, DMF was the most common solvent for dissolving PSF. However, in practice, theorganic reagents used (e.g. TCM, Tol, DCA and etc.) might contain two or more solvents/addictives to obtain a designed membrane for a particular application(Guillen et al., 2011; Herrero et al., 2014; Seung-Pyo et al., 2014). Thus, they should be the main sources of the high level residual VOCs (e.g. DMF) into ROmembranes. Besides, the boundary reaction between MPD and TMC could also result in organic contamination, because the organic phase, primarily is Hex, isused as the solvent for dissolving TMC and as the cleaning agent for rinsing the membrane surface after the interfacial polymerization reaction (Gholami etal., 2018; Klaysom et al., 2013). The synthesis of the PSF raw materials could also be another possible sources of VOCs entering RO membranes. Thenucleophilic substitution reaction between diphenol and bis(4-chlorophenyl)sulfone is a classical reaction that is widely used for commercial PSF production(Sahre et al., 2006). However, this reaction lead to the formation of the by-product water, which has a serious effect adverse to this reaction, for this reason,azeotropes such as Tol and Xyl are often synchronously added (Ates et al., 2011; Gao et al., 2017; Ma et al., 2020). Additionally, in industry production, theorganic solvents used were often not pure enough, thus impurities in solvent (e.g., Xyl, PhH in Tol) may also be an important source of the VOCs (Han et al.,2015; Joshi et al., 2016).
In general, the results implied that the productive process of support materials could be the major source of the VOCs residual in RO membranes. Althoughmany methods were available for removing the organic solvent, our study showed there still presented a considerable amount of residues. Thus, the ROmembrane users always need to beware of the harmful effect of VOCs from their purity devices with a RO element.
3.4 Drinking water quality and risk assessmentTo evaluate the migration of VOCs into e�uent water, each experimental RO membrane was washed by 10 L of deionized water and then the e�uent waterwas collected for the analysis of aqueous VOCs. Maximum contamination level (MCL) of drinking water from U.S. Environmental Protection Agency (USEPA),Ministry of Health, Labor and Welfare of Japan (MHLW), and Ministry of Health of China (MHC) were used to evaluate the potential adverse effect of VOCs ine�uent water �ltrated by RO membrane (JMHL, 2015; MHC/SAC, 2006; USEPA, 2018). In this study, concentration over MCL suggested the VOC was deemedto have a speci�c adverse effect on e�uent water. Maximum VOCs in 10 L of e�uent in measured samples are shown in Table 4. The results showed that theconcentrations of DMK, Hex and Styrene were not detected in all samples. PhH, PhCl, ethylbenzene, and Xyl were far from the MCL, which indicated that thesafety hazard for these substances was low.
DMF was often not limited in the drinking water quality criteria, and it possessed very high concentration in the initial e�uent (780–5234 µg/L in 0 L).However, fortunately, with the increase of the e�uent volume, its concentration rapidly decreased owing to its high solubility in water (Fig. S2), indicating itwas not a key contaminant that was di�cult to be removed by pre-washing. However, the concentrations of DCM, TCM, DCA, and Tol in e�uent waterdecreased slowly with pre-washing (Fig. S2) and their concentration did have the risk to surpass the MCL after 10 L pre-washing. As DCM, TCM, DCA and Tolare all considered as the toxic substances which not only give the drinking water a bad taste or smell but also increase the risk of illness such as cancer,kidney, and nervous system problems (Al-Baldawi, 2018; Hrudey, 2009; Shestakova and Sillanpaa, 2013; Tavakoli Dastjerdi et al., 2017), users need to continueincreasing the pre-washing volume to ensure their drinking water’s quality.
3.5 Recommended VOC limit valueAs the VOCs in RO membrane did affect the e�uent water quality, it is necessary for practitioners to evaluate the safety limit values of VOCs in RO membrane.Species sensitivity distributions (SSDs) are commonly used to derive the limit values of contaminants in a �eld based on their limit values in a linked �eld (e.g.obtaining unknown soil thresholds for heavy metal from the food quality standard) (Ding et al., 2016; Ding et al., 2018). Countries around the world have setthe drinking water standards to ensure the drinking water quality, but considering there were only limited data in our study and the SSDs is accomplished withthe establishment of complex models and requires great experimental results (Wheeler et al., 2002), therefore, in this study, we tentatively assessed the safetycontamination limits (SCLs) of VOCs in RO membrane by investigating the relationship between the VOC contents in RO membranes and their concentrationsin e�uent water.
The VOCs in e�uent water that were higher in concentration than the one of the MCLs from USEPA, MHLW, or MHC were discussed. Figure 4 presents therelationship of the concentration of VOCs in 10 L e�uent water with their contents in RO membranes. Clearly, with the increasing DCM, TCM, DCA, and Tolcontents in RO membranes, their concentrations in e�uent also proportionately increased signi�cantly (r > 0.995, Fig. S3), indicating the proposed method canbe used for calculation statistically. The MCL of each contaminant in drinking water is presented in Fig. 4, and the SCL of a VOC can be obtain by calculatingthe intersection points between the line of VOC MCL in drinking water with the column of VOC content in RO membranes. By this method, the SCLs of DCM,TCM, DCA, and Tol calculated from USEPA, MHLW and MHC were 1.2×10³–4.9×10³, 6.3×10³–7.4×10³, 2.6×10²–2.0×10³, and 3.8×10⁵ µg/kg, respectively. So,when the VOCs in RO membranes exceeded these values, their concentrations in the e�uent within 10 L were more possible not able to reach the MCLs.
4. ConclusionA method based on HS-GC/MS was developed for the analysis of common VOCs in RO membrane. The existence of matrix effect had a reverse effect on theaccuracy of quanti�cation, but the matrix-matched calibration established by VOC-free RO membranes provided good linearity, low detection, reproducibilityand accuracy. Twelve VOCs were detected in RO membranes with contents in the range of N.D.–961 186 μg/kg and after pre-washing of the RO membranes,most of them showed no high-risk to the e�uent quality. However, DCM, TCM, DCA, and Tol were more abundant in RO membranes and likely made waterundrinkable. The investigation provide a basis for comparison for the contamination level in RO membranes and indicated that more accurate guidelinevalues are necessary to be established to guarantee RO membrane quality.

Page 6/13
DeclarationsEthical Approval: Not applicable.
Consent to Participate: Not applicable.
Consent to Publish: Not applicable
Author contributions Mingtao HOU: Conceptualization, Methodology, Writing-original draft. Huixue REN: acquisition, Methodology, Writing-review&editing.Wenqing CHENG: Investigation, Formal analysis, Supervision. Lingjie LI: Formal analysis, Validation. Shuai ZHANG: Validation, Visualization. Yanxue CHEN:Investigation,Supervision. Chunfeng YU: Supervision, Validation. Fangjun LI: Validation, Visualization.Naichao CHI: Supervision, Visualization. Wenxiu WANG :Validation, Visualization. Zhe DENG:Supervision,Validation. All authors read and approved the �nal manuscript.
Funding: The work was �nancially supported by Shandong Provincial Major Scienti�c and Technological Innovation Project (MSTIP) (2019JZZY020211), theNational Key Research and Development Program of China (2017YFF0209903, 2017YFF0209904) Natural Science Foundation of Shandong ProvinceZR2016EEM01).
Competing Interests: The authors declare that they have no competing interests.
Availability of data and materials: All data generated or analysed during this study are included in this published article.
References1. Al-Baldawi, I.A (2018) Removal of 1,2-Dichloroethane from real industrial wastewater using a sub-surface batch system with Typha angustifolia L.
Ecotoxicology and environmental safety 147, 260-265.https://doi.org/10.1016/j.ecoenv.2017.08.022
2. Ates, S., Dizman, C., Aydogan, B., Kiskan, B., Torun, L. and Yagci, Y (2011) Synthesis, characterization and thermally activated curing of polysulfones withbenzoxazine end groups. Polymer 52(7), 1504-1509.https://doi.org/10.1016/j.polymer.2011.01.051
3. Cavalcante, R.M., de Andrade, M.V.F., Marins, R.V. and Oliveira, L.D.M (2010) Development of a headspace-gas chromatography (HS-GC-PID-FID) methodfor the determination of VOCs in environmental aqueous matrices: Optimization, veri�cation and elimination of matrix effect and VOC distribution on theFortaleza Coast, Brazil. Microchemical Journal 96(2), 337-343.https://doi.org/10.1016/j.microc.2010.05.014
4. Ding, C., Ma, Y., Li, X., Zhang, T. and Wang, X (2016) Derivation of soil thresholds for lead applying species sensitivity distribution: A case study for rootvegetables. Journal of hazardous materials 303, 21-27.https://doi.org/10.1016/j.jhazmat.2015.10.027
5. Ding, C., Ma, Y., Li, X., Zhang, T. and Wang, X. (2018) Determination and validation of soil thresholds for cadmium based on food quality standard andhealth risk assessment. The Science of the total environment 619-620, 700-706.https://doi.org/10.1016/j.scitotenv.2017.11.137
�. Emadzadeh, D., Lau, W.J., Rahbari-Sisakht, M., Daneshfar, A., Ghanbari, M., Mayahi, A., Matsuura, T. and Ismail, A.F (2015) A novel thin �lmnanocomposite reverse osmosis membrane with superior anti-organic fouling a�nity for water desalination. Desalination 368, 106-113.https://doi.org/10.1016/j.desal.2014.11.019
7. Ferrer, C., Lozano, A., Aguera, A., Giron, A.J. and Fernandez-Alba, A.R (2011) Overcoming matrix effects using the dilution approach in multiresiduemethods for fruits and vegetables. Journal of chromatography. A 1218(42), 7634-7639.https://doi.org/10.1016/j.chroma.2011.07.033
�. Gao, H., Sun, X. and Gao, C (2017) Antifouling polysulfone ultra�ltration membranes with sulfobetaine polyimides as novel additive for the enhancementof both water �ux and protein rejection. Journal of Membrane Science 542, 81-90.https://doi.org/10.1016/j.memsci.2017.07.053
9. Garcia Pinto, C., Herrero Martin, S., Perez Pavon, J.L. and Moreno Cordero, B (2011) A simpli�ed Quick, Easy, Cheap, Effective, Rugged and Safe approachfor the determination of trihalomethanes and benzene, toluene, ethylbenzene and xylenes in soil matrices by fast gas chromatography with massspectrometry detection. Analytica chimica acta 689(1), 129-136.https://doi.org/10.1016/j.aca.2011.01.023
10. Gholami, S., Rezvani, A., Vatanpour, V. and Cortina, J.L (2018) Improving the chlorine resistance property of polyamide TFC RO membrane by polyethyleneglycol diacrylate (PEGDA) coating. Desalination 443, 245-255.https://doi.org/10.1016/j.desal.2018.06.004
11. Guillen, G.R., Pan, Y., Li, M. and Hoek, E.M.V (2011) Preparation and Characterization of Membranes Formed by Nonsolvent Induced Phase Separation: AReview. Industrial & Engineering Chemistry Research 50(7), 3798-3817.https://doi.org/10.1021/ie101928r
12. Han, B., Chen, J., Zheng, L., Zhou, T., Li, J., Wang, X. and Wang, J (2015) Development of an impurity-pro�ling method for source identi�cation of spilledbenzene series compounds by gas chromatography with mass spectrometry: Toluene as a case study. Journal of separation science 38(18), 3198-3204.https://doi.org/10.1002/jssc.201500086
13. Heim, T.H. and Dietrich, A.M (2007) Sensory aspects and water quality impacts of chlorinated and chloraminated drinking water in contact with HDPE andcPVC pipe. Water research 41(4), 757-764.https://doi.org/10.1016/j.watres.2006.11.028
14. Herrero, M., Martos, A.M., Varez, A., Galván, J.C. and Levenfeld, B (2014) Synthesis and characterization of polysulfone/layered double hydroxidesnanocomposite membranes for fuel cell application. International Journal of Hydrogen Energy 39(8), 4016-4022.https://doi.org/10.1016/j.ijhydene.2013.06.041
15. Hou, M., Pu, Y., Qi, W.-k., Tang, Y., Wan, P., Yang, X.J., Song, P. and Fisher, A (2018) Enhanced electrocatalytic reduction of aqueous nitrate by modi�edcopper catalyst through electrochemical deposition and annealing treatment. Chemical Engineering Communications 205(5), 706-715.https://doi.org/10.1080/00986445.2017.1413357

Page 7/13
1�. Hou, M., Tang, Y., Xu, J., Pu, Y., Lin, A., Zhang, L., Xiong, J., Yang, X.J. and Wan, P (2015) Nitrate reduction in water by aluminum–iron alloy particlescatalyzed by copper. Journal of Environmental Chemical Engineering 3(4), 2401-2407.https://doi.org/10.1016/j.jece.2015.08.014
17. Hrudey, S.E (2009) Chlorination disinfection by-products, public health risk tradeoffs and me. Water research 43(8), 2057-2092.https://doi.org/10.1016/j.watres.2009.02.011
1�. Hwang, J.B., Lee, S., Yeum, J., Kim, M., Choi, J.C., Park, S.-J. and Kim, J (2019) HS-GC/MS method development and exposure assessment of volatileorganic compounds from food packaging into food simulants. Food Additives & Contaminants: Part A 36(10), 1574-1583.https://doi.org/10.1080/19440049.2019.1642520
19. Japanese Ministry of Health, Labour, and Welfare (JMHL), 2015. Water Quality Standard.
20. Joshi, O., Gide, P. and Nimkar, N (2016) Development and Validation of Gas Chromatographic Method for Residual Solvents Determination in DifenoxinHydrochloride. International Journal of Pharma Res earch & Review 5(3), 1-6.
21. Kang, G.D. and Cao, Y.M (2012) Development of antifouling reverse osmosis membranes for water treatment: A review. Water research 46(3), 584-600.https://doi.org/10.1016/j.watres.2011.11.041
22. Klaysom, C., Hermans, S., Gahlaut, A., Van Craenenbroeck, S. and Vankelecom, I.F.J (2013) Polyamide/Polyacrylonitrile (PA/PAN) thin �lm compositeosmosis membranes: Film optimization, characterization and performance evaluation. Journal of Membrane Science 445, 25-33.https://doi.org/10.1016/j.memsci.2013.05.037
23. Kong, C., Shintani, T., Kamada, T., Freger, V. and Tsuru, T (2011) Co-solvent-mediated synthesis of thin polyamide membranes. Journal of MembraneScience 384(1-2), 10-16.https://doi.org/10.1016/j.memsci.2011.08.055
24. Kwon, H., Lehotay, S.J. and Geis-Asteggiante, L (2012) Variability of matrix effects in liquid and gas chromatography-mass spectrometry analysis ofpesticide residues after QuEChERS sample preparation of different food crops. Journal of chromatography. A 1270, 235-245.https://doi.org/10.1016/j.chroma.2012.10.059
25. Lalia, B.S., Kochkodan, V., Hashaikeh, R. and Hilal, N (2013) A review on membrane fabrication: Structure, properties and performance relationship.Desalination 326, 77-95.https://doi.org/10.1016/j.desal.2013.06.016
2�. Li, D. and Wang, H (2010) Recent developments in reverse osmosis desalination membranes. Journal of Materials Chemistry 20(22),4551.https://doi.org/10.1039/B924553G
27. Lim, S.K., Shin, H.S., Yoon, K.S., Kwack, S.J., Um, Y.M., Hyeon, J.H., Kwak, H.M., Kim, J.Y., Kim, T.Y., Kim, Y.J., Roh, T.H., Lim, D.S., Shin, M.K., Choi, S.M., Kim,H.S. and Lee, B.M (2014) Risk assessment of volatile organic compounds benzene, toluene, ethylbenzene, and xylene (BTEX) in consumer products.Journal of toxicology and environmental health. Part A 77(22-24), 1502-1521.https://doi.org/10.1080/15287394.2014.955905
2�. Liu, L.-F., Cai, Z.-B., Shen, J.-N., Wu, L.-X., Hoek, E.M.V. and Gao, C.-J (2014) Fabrication and characterization of a novel poly(amide-urethane@imide) TFCreverse osmosis membrane with chlorine-tolerant property. Journal of Membrane Science 469, 397-409.https://doi.org/10.1016/j.memsci.2014.06.029
29. Liu, M., Chen, Z., Yu, S., Wu, D. and Gao, C (2011) Thin-�lm composite polyamide reverse osmosis membranes with improved acid stability and chlorineresistance by coating N-isopropylacrylamide-co-acrylamide copolymers. Desalination 270(1-3), 248-257.https://doi.org/10.1016/j.desal.2010.11.052
30. Ma, Y., Zeng, J., Zeng, Y., Zhou, H., Liu, G., Liu, Y., Zeng, L., Jian, J. and Yuan, Z (2020) Preparation and performance of poly(4-vinylpyridine)-b polysulfone-b-poly(4-vinylpyridine) triblock copolymer/polysulfone blend membrane for separation of palladium (II) from electroplating wastewaters. Journal ofhazardous materials 384, 121277.https://doi.org/10.1016/j.jhazmat.2019.121277
31. Menendez, J.C.F., Sanchez, M.L.F., Uria, J.E.S., Martinez, E.F. and Sanzmedel, A (2000) Static headspace, solid-phase microextraction and headspace solid-phase microextraction for BTEX determination in aqueous samples by gas chromatography. Analytica chimica acta 415(1), 9-20.https://doi.org/10.1016/S0003-2670(00)00862-X
32. Ministry of Environmental Protection (MEP) (2016) Water quality — Determination of volatile organic compounds — Headspace/Gas chromatographymass spectrometry.
33. Ministry of Health of China/Standardization Administration of China (MHC/SAC) (2006) Standard for Drinking Water Quality.
34. Mohan, D.J. and Kullová, L (2012) A study on the relationship between preparation condition and properties/performance of polyamide TFC membraneby IR, DSC, TGA, and SEM techniques. Desalination and Water Treatment 51(1-3), 586-596.https://doi.org/10.1080/19443994.2012.693655
35. National Sanitation Foundation International (NSF) (2015) NSF International Standard/American National Standard 53: Drinking Water Treatment Units—Health Effects.
3�. National Sanitation Foundation International (NSF) (2017) NSF International Standard/American National Standard 61: Drinking WaterSystemComponents-Health Effects.
37. National Sanitation Foundation International (NSF) (2018) NSF International Standard/American National Standard 58: Reverse Osmosis — DrinkingWater Treatment Systems.
3�. Rana, H.H., Saha, N.K., Jewrajka, S.K. and Reddy, A.V.R (2015) Low fouling and improved chlorine resistant thin �lm composite reverse osmosismembranes by cerium(IV)/polyvinyl alcohol mediated surface modi�cation. Desalination 357, 93-103.https://doi.org/10.1016/j.desal.2014.11.013
39. Ren, H., Jiang, J., Wu, D., Gao, Z., Sun, Y. and Luo, C (2016) Selective Adsorption of Pb(II) and Cr(VI) by Surfactant-Modi�ed and Unmodi�ed NaturalZeolites: A Comparative Study on Kinetics, Equilibrium, and Mechanism. Water, Air, & Soil Pollution 227(4).https://doi.org/10.1007/s11270-016-2790-6
40. Sahre, K., Hoffmann, T., Pospiech, D., Eichhorn, K.-J., Fischer, D. and Voit, B (2006) Monitoring of the polycondensation reaction of bisphenol A and 4,4′-dichlorodiphenylsulfone towards polysulfone (PSU) by real-time ATR–FTIR spectroscopy. European Polymer Journal 42(10), 2292-2301.https://doi.org/10.1016/j.eurpolymj.2006.05.025
41. State Bureau of Technical Supervision (SBTS) (1998) Standard for Safety Evaluation of Equipment and Protective Materials in Drinking Water System.
Page 8/13
42. Seo, I. and Shin, H.-S (2010) Determination of toluene and other residual solvents in various food packaging materials by gas chromatography/massspectrometry (GC/MS). Food Science and Biotechnology 19(6), 1429-1434.https://doi.org/10.1007/s10068-010-0204-x
43. Seung-Pyo, J., Seung-Yup, L., Phill, L., Hye-Jin, K. and Chong-Kyu, S (2014) Method for manufacturing a reverse osmosis membrane and a reverseosmosis membrane manufactured thereby, LG Chemical Co., Ltd., China.
44. Sharma, S. and Bhattacharya, A (2016) Drinking water contamination and treatment techniques. Applied Water Science 7(3), 1043-1067.https://doi.org/10.1007/s13201-016-0455-7
45. Shestakova, M. and Sillanpaa, M (2013) Removal of dichloromethane from ground and wastewater: a review. Chemosphere 93(7), 1258-1267.https://doi.org/10.1016/j.chemosphere.2013.07.022
4�. Shi, M., Wang, Z., Zhao, S., Wang, J. and Wang, S (2017) A support surface pore structure re-construction method to enhance the �ux of TFC ROmembrane. Journal of Membrane Science 541, 39-52.https://doi.org/10.1016/j.memsci.2017.06.087
47. Tavakoli Dastjerdi, M.H., Habibagahi, G., Ghahramani, A., Karimi-Jashni, A. and Zeinali, S (2017) Removal of dissolved toluene in underground water withnanowires of manganese oxide. Adsorption Science & Technology 36(1-2), 393-407.https://doi.org/10.1177/0263617417698469
4�. Trefz, P., Kischkel, S., Hein, D., James, E.S., Schubert, J.K. and Miekisch, W (2012) Needle trap micro-extraction for VOC analysis: effects of packingmaterials and desorption parameters. Journal of chromatography. A 1219, 29-38.https://doi.org/10.1016/j.chroma.2011.10.077
49. Triantafyllidou, S., Raetz, M., Parks, J. and Edwards, M (2012) Understanding how brass ball valves passing certi�cation testing can cause elevated leadin water when installed. Water research 46(10), 3240-3250.https://doi.org/10.1016/j.watres.2012.03.022
50. U.S. Environmental Protection Agency (USEPA) (1996) Volatile organic compounds in soils and other solid matrices using equilibrium headspaceanalysis.
51. U.S. Environmental Protection Agency (USEPA) (2018) 2018 Edition of the Drinking Water Standards and Health Advisories.
52. Wei, X., Wang, Z., Zhang, Z., Wang, J. and Wang, S (2010) Surface modi�cation of commercial aromatic polyamide reverse osmosis membranes by graftpolymerization of 3-allyl-5,5-dimethylhydantoin. Journal of Membrane Science 351(1-2), 222-233.https://doi.org/10.1016/j.memsci.2010.01.054
53. Wheeler, J.R., Grist, E.P.M., Leung, K.M.Y., Morritt, D. and Crane, M (2002) Species sensitivity distributions: data and model choice. Marine Pollution Bulletin45, 192-202.https://doi.org/10.1016/S0025-326X(01)00327-7
54. Yan, W., Wang, Z., Wu, J., Zhao, S., Wang, J. and Wang, S (2016) Enhancing the �ux of brackish water TFC RO membrane by improving support surfaceporosity via a secondary pore-forming method. Journal of Membrane Science 498, 227-241.https://doi.org/10.1016/j.memsci.2015.10.029
55. Zhang, Z., Wang, Z., Wang, J. and Wang, S (2013) Enhancing chlorine resistances and anti-biofouling properties of commercial aromatic polyamidereverse osmosis membranes by grafting 3-allyl-5,5-dimethylhydantoin and N,N′-Methylenebis(acrylamide). Desalination 309, 187-196.https://doi.org/10.1016/j.desal.2012.10.019
5�. Zhao, Y., Zhang, Z., Dai, L. and Zhang, S (2017) Preparation of high water �ux and antifouling RO membranes using a novel diacyl chloride monomer witha phosphonate group. Journal of Membrane Science 536, 98-107.https://doi.org/10.1016/j.memsci.2017.04.039
TablesTable 1 Curve slopes, coe�cients and recoveries of different matrix matched calibration
Page 9/13
Matrix materials Blank (empty bottle) Nylon Membrane
Slope Coe�cient Recovery (%) Slope Coe�cient Recovery (%)
100/5000/
50000 ng
500/10000/
200000 ng
2000/20000/
500000 ng
100/5000/
50000 ng
500/10000/
200000 ng
2000/200
500000 ng
Acetone 348 0.9981 104 112 106 312 0.9990 97.3 104 115
Dichloromethane 319 0.9983 54.9 66.7 49.2 184 0.9986 95.3 115.7 85.3
Hexane 562 0.9991 108 116 107 547 0.9995 115 104 99.6
Chloroform 372 0.9998 46.6 69.3 45.7 205 1.0000 84.3 126 82.7
1,2-dichloroethane 272 0.9986 71.9 85.1 62.4 213 0.9983 91.5 108 79.4
Benzene 1111 0.9998 49.6 71.5 50.6 666 0.9990 82.6 119 84.4
Toluene 784 1.0000 67.3 79.6 54.1 501 0.9999 105 125 84.8
N,N-Dimethylformamide
96.7 0.9998 101 31.4 38.6 27.5 0.9988 46.0 64.3 57.5
Chlorobenzene 620 0.9993 39.8 57.9 43.6 325 0.9997 76.0 110 83.2
Ethylbenzene 885 0.9997 46.8 59.9 45.6 525 0.9995 78.8 101 76.8
m,p-xylene 754 0.9996 38.7 57.7 42.2 840 0.9992 68.6 102 74.9
o-xylene 335 0.9994 36.9 48.6 37.6 391 0.9993 71.3 93.9 72.6
Stryene 659 0.9991 42.2 47.7 40.4 362 1.0000 76.7 86.7 73.5
Table 2Retention time, calibration curves, limits of detection (LODs) and quantitation (LOQs) for various compounds
Compound Retention time(min)
Quantitative ion(m/z)
Qualitative ion(m/z)
Calibration curveequation
LOD(µg/kg)
LOQ(µg/kg)
Acetone 2.579 43 58 Y = 292 x − 9129 3.87 12.9
Dichloromethane 3.035 84 86, 49 Y = 158 x + 17908 14.3 47.7
Hexane 3.565 57 41/86 Y = 487 x − 38119 4.93 16.4
Chlorform 4.745 83 85 Y = 167 x + 34017 11.7 39.1
1,2-dichloroethane 5.435 62 98 Y = 161 x + 19777 11.7 38.9
Benzene 5.380 78 / Y = 569 x + 48990 3.44 11.5
Toluene 8.060 92 91 Y = 416 x + 168095 4.20 14.0
N,N-Dimethylformamide
9.985 73 44/58 Y = 16.4 x − 187770 748 2493
Chlorobenzene 10.775 112 77, 114 Y = 271 x + 19603 8.84 29.5
Ethylbenzene 11.080 91 106 Y = 397 x + 38815 6.41 21.4
m,p-xylene 11.480 106 91 Y = 621 x + 93595 6.20 20.7
o-xylene 12.640 106 91 Y = 279 x + 25565 10.2 34.0
Styrene 12.720 104 78 Y = 265 x + 25085 10.8 36.0

Page 10/13
Table 3VOCs distribution in experimental samples (µg/kg)
Compounds
Samples
Acetone Dichloromethane Hexane Chloroform 1,2-dichloroethane
Benzene Toluene N,N-dimethylformamide
Chlorobenzene
RO1 1193 N.D. N.D. N.D. 850 303 50449 129033 56.3
RO2 779 660 342 15072 N.D. 118 199366 961186 901
RO3 475 19.7 61.5 1287 882 166 400982 186220 9003
RO4 1133 1078 319 369 55.8 34.0 11981 90419 N.D.
RO5 587 N.D. 4348 N.D. N.D. 64.3 10931 135879 1218
RO6 N.D. N.D. 247 95.6 40.3 41.2 75371 86556. 3467
RO7 430 8121 57.0 352 74.6 N.D. 10190 153519 1990
RO8 507 N.D. N.D. 12498 2471 40.3 84968 465429 16017
RO9 N.D. N.D. N.D. N.D. N.D. N.D. 15291 135532 647
RO10 N.D. N.D. 1022 N.D. N.D. N.D. 41345 155801 N.D.
Mean 512 991 640 2969 439 77.1 90087 249957 3331
Proportionin meanΣVOCs,%
0.14 0.27 0.17 0.80 0.12 0.02 24.2 67.3 0.90
Table 4
MCL values for VOCs in drinking water and the ratios of over MCL numbers in total sample numbersCompound Maximum value in 10L e�uent
µg/LMCL µg/L Over MCL numbers/total numbers
US’sEPA
Japan’sMHLW
China’sMHC
US’sEPA
Japan’sMHLW
China’s MHC
Acetone N.D. - - - - - -
Dichloromethane 32.9 5 20 20 2/10 1/10 1/10
Hexane N.D. - - - - - -
Chlorform 143 70 60 60 2/10 2/10 2/10
1,2-dichloroethane 37.9 5 4 30 3/10 3/10 1/10
Benzene 0.9 5 10 10 0/10 0/10 0/10
Toluene 420 1000 400 700 0/10 1/10 0/10
N,N-Dimethylformamide
28.0 - - - - - -
Chlorobenzene 10.2 100 - 300 0/10 - 0/10
Ethylbenzene 0.2 700 - 300 0/10 - 0/10
Xylene 6.7 10000 400 500 0/10 0/10 0/10
Styrene N.D. 100 - 20 0/10 - 0/10
Figures

Page 11/13
Figure 1
Device of �ltration test
Figure 2
Total Ion Chromatography (TIC) of the preliminary screening of VOCs in RO membrane

Page 12/13
Figure 3
Effect of a) matrix modi�er, b) incubation temperature and c) incubation time on the response of VOCs on mass spectrum detector, initial condition:incubation time = 80 °C, incubation time = 30 min, sample mass = 0.2 g.

Page 13/13
Figure 4
VOCs concentration in 10 L e�uent as a function of their content in RO membrane, a) DCM, b) TCM, c) DCA, d) Tol; Experimental condition: total �ow rate =0.5 L/min, ratio of puri�ed water and waste water = 0.9 – 1.2.
Supplementary Files
This is a list of supplementary �les associated with this preprint. Click to download.
SupplementalmaterialHou20210407.docx