
physical properties, characterization and interaction mechanism ...

PAPER IN FOREFRONT
Characterization of the specific interaction between the DNAaptamer sgc8c and protein tyrosine kinase-7 receptorsat the surface of T-cells by biosensing AFM
Michael Leitner1 & Alexandra Poturnayova2,3 & Constanze Lamprecht1 & Sabine Weich1&
Maja Snejdarkova3 & Ivana Karpisova2 & Tibor Hianik2& Andreas Ebner1
Received: 21 December 2016 /Revised: 18 January 2017 /Accepted: 31 January 2017 /Published online: 22 February 2017# The Author(s) 2017. This article is published with open access at Springerlink.com
Abstract We studied the interaction of the specificDNA aptamer sgc8c immobilized at the AFM tip withits corresponding receptor, the protein tyrosine kinase-7(PTK7) embedded in the membrane of acute lympho-blas t ic leukemia (ALL) ce l ls (Jurkat T-cel ls ) .Performing single molecule force spectroscopy (SMFS)experiments, we showed that the aptamer sgc8c boundwith high probability (38.3 ± 7.48%) and high specificityto PTK7, as demonstrated by receptor blocking experi-ments and through comparison with the binding behav-ior of a nonspecific aptamer. The determined kineticoff-rate (koff = 5.16 s−1) indicates low dissociation ofthe sgc8c–PTK7 complex. In addition to the pullingforce experiments, simultaneous topography and recog-nition imaging (TREC) experiments using AFM tipsfunctionalized with sgc8c aptamers were realized onthe outer regions surface of surface-immobilized Jurkatcells for the first time. This allowed determination ofthe distribution of PTK7 without any labeling and atnear physiological conditions. As a result, we couldshow a homogeneous distribution of PTK7 moleculeson the outer regions of ALL cells with a surface densityof 325 ± 12 PTK7 receptors (or small receptor clusters)per μm2.
Keywords DNA aptamer . PTK7 . T-cell . Singlemoleculeforce spectroscopy . Energy landscape .Molecularrecognition . Recognition imaging
Introduction
Cancer is a major societal challenge and its detectionand identification at the earliest stage are crucial forefficient and successful treatment. Acute lymphoblasticleukemia (ALL) is a common type of blood cancer. It ischaracterized by aggressive and uncontrolled division ofabnormal lymphocytes, which spread to various parts ofthe body and penetrate and destroy healthy body tissue[1]. Rapid identification and classification of the patho-genic cells is important for choosing the correct therapyfor ALL patients. Conventional diagnosis comprises acombination of methods, including morphologic, cyto-chemical, cytogenetic, or immunologic tests [2, 3], aswell as bone marrow biopsy [4]. Additional techniquesto further classify the type of leukemia include flowcytometric immunophenotyping [5] and polymerasechain reaction studies [4, 6, 7]. A novel approach thatmay render these elaborate and invasive procedures un-necessary is based on the recognition of cancer-specificbiomarkers on the surface of cancer cells by DNA/RNAaptamers [8].
Aptamers are synthetic short single-stranded DNA orRNA oligonucleotides that fold into unique three-dimensional shapes. These structures enable highly se-lective and specific targeting of molecules with highaffinities comparable to those of antibodies. The smallsize and rather simple structure of aptamers relative toantibodies makes them easier to be synthesized andchemically modified. Moreover, they display low to no
* Andreas [email protected]
1 Institute of Biophysics, Johannes Kepler University Linz,Gruberstrasse 40, 4020 Linz, Austria
2 Faculty of Mathematics, Physics, and Informatics, ComeniusUniversity, Mlynska dolina F1, 842 48 Bratislava, Slovakia
3 Institute of Biochemistry and Animal Genetics, Slovak Academy ofSciences, Moyzesova 61, 900 28 Ivanka pri Dunaji, Slovakia
Anal Bioanal Chem (2017) 409:2767–2776DOI 10.1007/s00216-017-0238-5
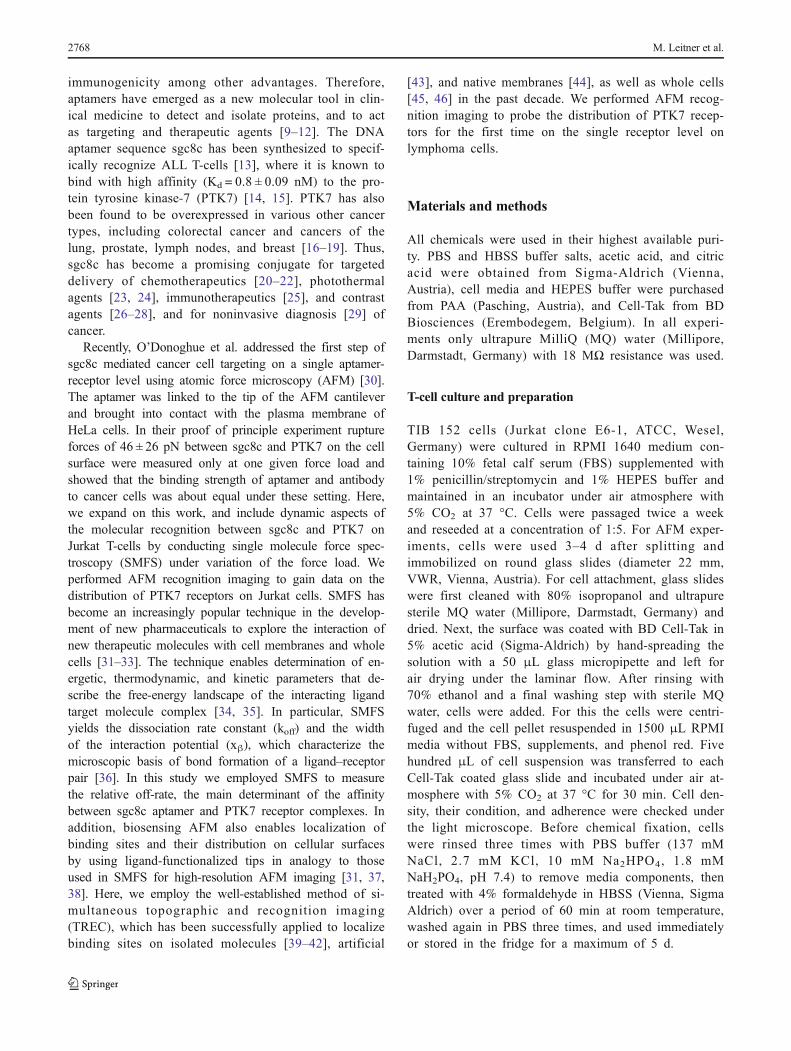
immunogenicity among other advantages. Therefore,aptamers have emerged as a new molecular tool in clin-ical medicine to detect and isolate proteins, and to actas targeting and therapeutic agents [9–12]. The DNAaptamer sequence sgc8c has been synthesized to specif-ically recognize ALL T-cells [13], where it is known tobind with high affinity (Kd = 0.8 ± 0.09 nM) to the pro-tein tyrosine kinase-7 (PTK7) [14, 15]. PTK7 has alsobeen found to be overexpressed in various other cancertypes, including colorectal cancer and cancers of thelung, prostate, lymph nodes, and breast [16–19]. Thus,sgc8c has become a promising conjugate for targeteddelivery of chemotherapeutics [20–22], photothermalagents [23, 24], immunotherapeutics [25], and contrastagents [26–28], and for noninvasive diagnosis [29] ofcancer.
Recently, O’Donoghue et al. addressed the first step ofsgc8c mediated cancer cell targeting on a single aptamer-receptor level using atomic force microscopy (AFM) [30].The aptamer was linked to the tip of the AFM cantileverand brought into contact with the plasma membrane ofHeLa cells. In their proof of principle experiment ruptureforces of 46 ± 26 pN between sgc8c and PTK7 on the cellsurface were measured only at one given force load andshowed that the binding strength of aptamer and antibodyto cancer cells was about equal under these setting. Here,we expand on this work, and include dynamic aspects ofthe molecular recognition between sgc8c and PTK7 onJurkat T-cells by conducting single molecule force spec-troscopy (SMFS) under variation of the force load. Weperformed AFM recognition imaging to gain data on thedistribution of PTK7 receptors on Jurkat cells. SMFS hasbecome an increasingly popular technique in the develop-ment of new pharmaceuticals to explore the interaction ofnew therapeutic molecules with cell membranes and wholecells [31–33]. The technique enables determination of en-ergetic, thermodynamic, and kinetic parameters that de-scribe the free-energy landscape of the interacting ligandtarget molecule complex [34, 35]. In particular, SMFSyields the dissociation rate constant (koff) and the widthof the interaction potential (xβ), which characterize themicroscopic basis of bond formation of a ligand–receptorpair [36]. In this study we employed SMFS to measurethe relative off-rate, the main determinant of the affinitybetween sgc8c aptamer and PTK7 receptor complexes. Inaddition, biosensing AFM also enables localization ofbinding sites and their distribution on cellular surfacesby using ligand-functionalized tips in analogy to thoseused in SMFS for high-resolution AFM imaging [31, 37,38]. Here, we employ the well-established method of si-multaneous topographic and recognition imaging(TREC), which has been successfully applied to localizebinding sites on isolated molecules [39–42], artificial
[43], and native membranes [44], as well as whole cells[45, 46] in the past decade. We performed AFM recog-nition imaging to probe the distribution of PTK7 recep-tors for the first time on the single receptor level onlymphoma cells.
Materials and methods
All chemicals were used in their highest available puri-ty. PBS and HBSS buffer salts, acetic acid, and citricacid were obtained from Sigma-Aldrich (Vienna,Austria), cell media and HEPES buffer were purchasedfrom PAA (Pasching, Austria), and Cell-Tak from BDBiosciences (Erembodegem, Belgium). In all experi-ments only ultrapure MilliQ (MQ) water (Millipore,Darmstadt, Germany) with 18 MΩ resistance was used.
T-cell culture and preparation
TIB 152 cells (Jurkat clone E6-1, ATCC, Wesel,Germany) were cultured in RPMI 1640 medium con-taining 10% fetal calf serum (FBS) supplemented with1% penicillin/streptomycin and 1% HEPES buffer andmaintained in an incubator under air atmosphere with5% CO2 at 37 °C. Cells were passaged twice a weekand reseeded at a concentration of 1:5. For AFM exper-iments, cells were used 3–4 d after splitting andimmobilized on round glass slides (diameter 22 mm,VWR, Vienna, Austria). For cell attachment, glass slideswere first cleaned with 80% isopropanol and ultrapuresterile MQ water (Millipore, Darmstadt, Germany) anddried. Next, the surface was coated with BD Cell-Tak in5% acetic acid (Sigma-Aldrich) by hand-spreading thesolution with a 50 μL glass micropipette and left forair drying under the laminar flow. After rinsing with70% ethanol and a final washing step with sterile MQwater, cells were added. For this the cells were centri-fuged and the cell pellet resuspended in 1500 μL RPMImedia without FBS, supplements, and phenol red. Fivehundred μL of cell suspension was transferred to eachCell-Tak coated glass slide and incubated under air at-mosphere with 5% CO2 at 37 °C for 30 min. Cell den-sity, their condition, and adherence were checked underthe light microscope. Before chemical fixation, cellswere rinsed three times with PBS buffer (137 mMNaCl, 2.7 mM KCl, 10 mM Na2HPO4, 1.8 mMNaH2PO4, pH 7.4) to remove media components, thentreated with 4% formaldehyde in HBSS (Vienna, SigmaAldrich) over a period of 60 min at room temperature,washed again in PBS three times, and used immediatelyor stored in the fridge for a maximum of 5 d.
2768 M. Leitner et al.

Preparation of sgc8c aptamer AFM sensors
The sequence of the PTK7 specific DNA aptamer sgc8c was:5′ (SH- or) NH2- ATCTAACTGCTGCGCCGCGAAAATACT GTA CGG TTA GA-3′. For the specificity proof thenonspecific DNA aptamers TDO5 was used: 5′ NH2- CACCGGGAGGATAGTTCGGTGGCTGTTCAGGGTCTCCTCCCGGTG-3′. The sequences of the aptamers were takenfrom the paper by Huang et al. [20]. Both aptamers werepurchased from Thermo Fischer Scientific GmbH(Darmstadt, Germany). All aptamer solutions were preparedby dissolving lyophilized oligonucleotides in TE buffer(1 mM EDTA, 10 mM Tris, pH 8).
TREC measurements were performed with magneticallycoated cantilevers MACLever Type VII (Keysight, SantaRosa, USA). SMFS experiments were done with MSCTprobes (Bruker, Karlsruhe, Germany). For both TREC andSMFS experiments the identical cantilever functionalizationprotocols were applied in which DNA aptamers were tetheredto the apex of silicon(nitride) tips using a distensibleheterobifunctional poly(ethylene) glycol linker. As silicon(nitride) is known to be an inert material, the tip was firstchemically activated by deposition of APTES from the gasphase to ensure a sufficient number of reactive sites, but with-out forming a 3D network of the functionalization agent thatwould cause variations in the unbinding length of ruptureevents. For this, silicon (MACLevers) or silicon-nitride(MSCT) tips, respectively, were amino-functionalized accord-ing to the gas-phase deposition protocol published previously[47]. In brief, chloroform-cleaned cantilevers were placed inan argon filled 5 L desiccator together with a vial filled with60 μL freshly distilled amino-propyl-triethoxysilane (APTES,Sigma-Aldrich, Vienna, Austria) and another vial with 20 mLtrimethylamine (TEA, Sigma-Aldrich, Vienna, Austria), andallowed to react for 120 min. Then the desiccator was flushedwith argon gas for 5 min and left for 48 h for curing process.For tethering the aptamers, either the NHS-PEG-acetal linker[48] was employed to covalently couple amine terminatedaptamer NH2-sgc8c to the AFM tip or the NHS-PEG-PDPlinker [49] to bind thiol terminated aptamer SH-sgc8c.Attachment of the reference aptamer TDO5 was doneanalogically.
In the case of NH2-terminated aptamers, freshly APTEScoated tips were incubated in a chamber containing a solutionof 1 mg NHS-PEG-acetal linker dissolved in 500 μL chloro-form. Thirty μL TEA was added as catalyst. After 120 minreaction time, tips were washed with chloroform and ethanol(three times for 5 min.) and dried again in a gentle nitrogen gasstream. To obtain the aldehyde function, tips were immersedfor 10 min in 1% citric acid solution, washed three times inwater, and dried under N2 gas. The aldehyde functionalizedtips were immersed in ~40 μL PBS solution containing 1 μMNH2-sgc8c aptamer and 2 μL freshly prepared aqueous
solution of 1 M NaCNBH3 (Sigma-Aldrich, Vienna,Austria) was added to the drop, mixed carefully, and allowedto react for 1 h. Ten min before washing the tips, 5 μL of 1 Methanolamine in water was added to the solution in order topassivate unreacted aldehyde groups. Finally, the tips werewashed three times with PBS buffer and stored in PBS bufferat 4 °C until use.
Alternatively, coupling via the thiol residue of SH-sgc8cwas done as follows. After APTES silanization as describedbefore, cantilevers were in a solution of 1 mg NHS-PEG-PDPdissolved in 500 μL chloroform to which 30 μL TEA wereadded, and the cantilevers were allowed to react for 120 min.Subsequently, they were washed with chloroform and driedgently by N2 gas. Then the PDP functionalized tips were im-mersed in an SH2-sgc8c aptamer solution (10 μM in PBS) for1 h, washed three times with PBS buffer, and used immedi-ately or stored in PBS buffer at 4 °C for use within 5 d.
Single molecule force spectroscopy (SMFS)
SMFS experiments were conducted on a PicoPlus 5500 AFMsetup (Keysight, Santa Rosa, USA) equipped with a fluidchamber to allow measurements in PBS, and an opticalCCD camera to facilitate cantilever alignment withimmobilized T-cells on the substrate. Pulling experimentswere performed in PBS using sgc8c functionalized MSCTcantilevers with nominal spring constants between 0.01 and0.03 N m−1 under variation of the pulling velocity to yieldloading rates (i.e., product of pulling velocity and effectivespring constant) ranging from ~400 to 105 pN s−1. The max-imum indentation force was set to 500 pN to avoid any dam-age to the cells. At each pulling velocity, 1000 to 2000 forcedistance cycles (FDCs) were performed. To ensure position-independent results, the position on the cell was shifted by250 nm μm after 250 FDCs. The delay between approachingand retraction period (i.e., the hold time) was varied from 0 to1 s to ensure sufficient contact time for ligand–receptor bondformation.
The spring constant of each cantilever was determined ac-cording to the thermal noise method [50]. Statistical analysisof all FDCs were done to determine the probability ofaptamer–receptor complex formation (binding probability,BP), the distribution of detected unbinding forces and lengths,as well as the effective spring constant (spring constant in themoment of rupture). The BP is defined as the number of FDCsexhibiting an unbinding event divided by the total number ofcollected FDCs. Each individual rupture force of a single un-binding event was plotted against its individual correspondingforce loading rate r (determined from the effective spring con-stant multiplied by the pulling velocity) and finally mergedinto a dynamic force spectra plot. The loading rate-dependentunbinding forces were evaluated with a maximum likelihoodapproach [51] to fit a statistical model based on the Evans
Specific interaction of the aptamer sgc8c and the receptor PTK7 2769

theory [52] that allows calculation of the dissociation rateconstant (koff) and the width of the energy barrier xβ basedon the equation fu(r) = (kBT/x)ln[rx/(kBTkoff)], where x is theseparation of the energetic barrier to the equilibrium position,koff the dissociation constant at zero force, kBT the thermalenergy, and fu(r) the most probable unbinding force at theloading rate r.
Simultaneous topography and recognition imaging(TREC)
In TREC magnetically coated and ligand functionalized can-tilevers are excited by an alternating magnetic field to oscillateclose to their resonance during scanning. The resonance fre-quency of biofunctionalized MACLevers Type VII was deter-mined by recording a frequency plot, and the actuation fre-quency was typically set about 0.5 kHz below the maximumof the resonance. Then the cantilever was positioned above theT-cell of interest and slowly approached to avoid damage ofthe tip coating and/or the cell. Since the cells appeared verysoft, recognition imaging was only performed on the outerarea of the cells (i.e., the area of the cells that have the higherdistance to the middle of the cell). TREC measurements weredone in PBS buffer at 1 Hz line frequency. The amplitude wasset to a value obtained by force distance cycles, which ensuressufficient damping of the upper part of the oscillation in caseof molecular (sgc8c–PTK7) interaction, but at the same timeallows remaining in a bound state while measuring above therecognition site [53]. All other measurement parameters wereidentical to the SMFS experiments.
For data evaluation, the threshold of recognition spots wasset to five times the root mean square (rms) of the flattenedrecognition image. The spot size for recognition was set to atypical value of 15 pixels for a 1 × 1 μm scan at 512 pixel/line.A mask overlay of the determined recognition spots with thecorresponding topographic image was generated usingGwyddion FreeSPM software (ver. 2.44).
Results and discussion
The DNA aptamer sgc8c (Fig. 1A) has been designed tospecifically recognize the receptor PTK7 in the plasmamembrane. It is an important player in extracellular sig-naling and highly expressed on the surface of leukemiacells and especially T-ALL cells. In this study, we usedcultured T-cells of the Jurkat non-Hodgkin’s lympho-blastic leukemia cell line as an accurate representationof the native state of PTK7 in lymphoma cells.
For characterization of the specific interaction ofsgc8c with PTK7 on the cell surface at the molecularlevel by SMFS, the DNA aptamer was chemically at-tached to the apex of the silicon (nitride) tip of theAFM cantilever via heterobifunctional crosslinkers(Fig. 1B). After aminofunctionalization (Fig. 1B-1), de-pending on the coupling group of the aptamer, whichwas either 5′aminofunctionalized (NH2-sgc8c) or 5′thiolated (SH2-sgc8c), an NHS-PEG-acetal [48] or anNHS-PEG-PDP [49] was covalently bound to the tip,respectively (Fig. 1B-2a, 2b). Thiolated sgc8c wascoupled without further derivatisation simply throughincubation to the PDP terminus of the tip-bound linker(Fig. 1B-3a). Binding of NH2-sgc8c required de-protection of the free acetal end of the linker to producean aldehyde residue (Fig. 1B-3b) for reaction with theamine terminus of the aptamer followed by hydration ofthe formed bond after coupling.
T-cells, like all lymphocytes, circulate in the blood streamwithout adhesion to blood and lymphatic vessels, and adhe-sion and migration through the wall of vessels usually hap-pens only in response to inflammation. Thus, Cell-Tak wasused as adhesive coating to immobilize T-cells on glass coverslips for AFM investigation [54]. The cell suspension washandled carefully to avoid cell lysate of broken cells thatmay inactivate Cell-Tak and result in inefficient adherenceof intact T-cells. Next, cells were chemically fixed. This wasnecessary since T-cell adhesion as the first step in immune
sgc8captamer
A BFig. 1 (A) DNA sequence of theused sgc8c aptamer. (B) Tipchemistry. (1) Inert silicon nitridecantilever are amino-functionalized using APTES gasphase silanization. Theheterobifunctional crosslinkerNHS-PEG-PDP (2a) or NHS-PEG-Acetal (2b) is coupledallowing binding NH2-terminated(4) DNA aptamers [afterdeprotection of the acetal group(3b)] or SH-terminated sgc8captamers (3a) respectively
2770 M. Leitner et al.
response is known to start a cascade of changes of the cellularstate that include rolling, cell arrest, strengthening of adhesionsites, followed by migration [55]. Incubation with 4% form-aldehyde for 60 min was performed, which has been reportedto properly fix cells without loss of functionality of PTK7receptors on the plasma membrane [56].
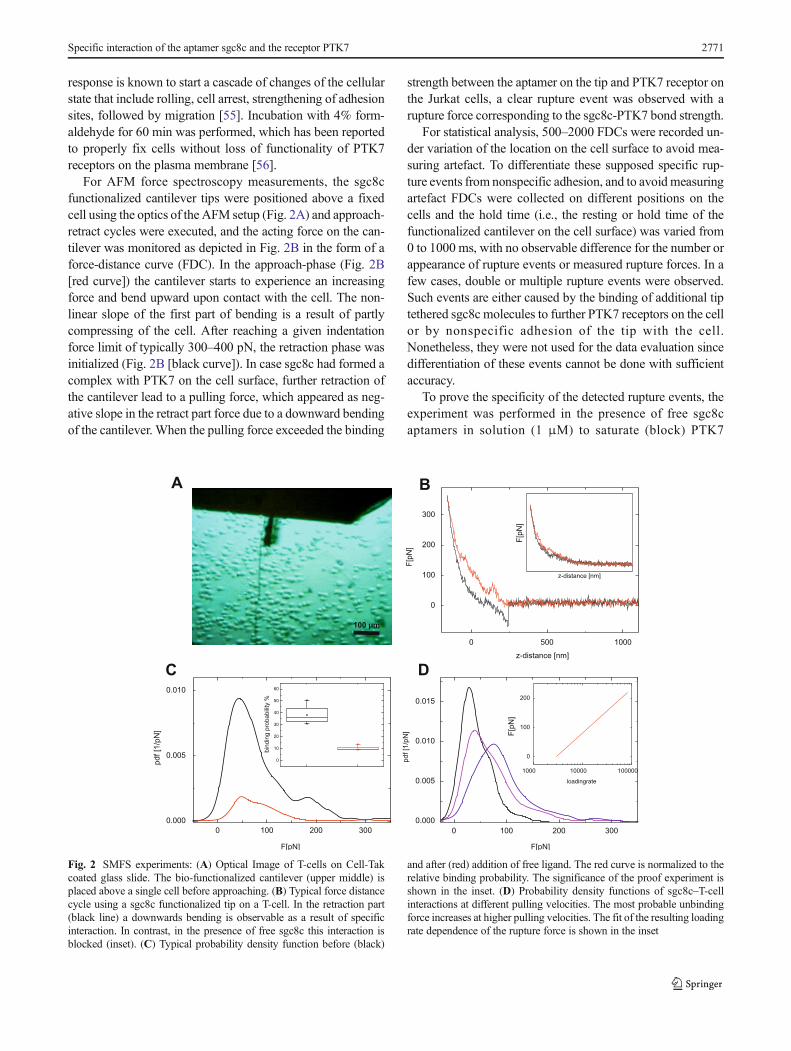
For AFM force spectroscopy measurements, the sgc8cfunctionalized cantilever tips were positioned above a fixedcell using the optics of the AFM setup (Fig. 2A) and approach-retract cycles were executed, and the acting force on the can-tilever was monitored as depicted in Fig. 2B in the form of aforce-distance curve (FDC). In the approach-phase (Fig. 2B[red curve]) the cantilever starts to experience an increasingforce and bend upward upon contact with the cell. The non-linear slope of the first part of bending is a result of partlycompressing of the cell. After reaching a given indentationforce limit of typically 300–400 pN, the retraction phase wasinitialized (Fig. 2B [black curve]). In case sgc8c had formed acomplex with PTK7 on the cell surface, further retraction ofthe cantilever lead to a pulling force, which appeared as neg-ative slope in the retract part force due to a downward bendingof the cantilever. When the pulling force exceeded the binding
strength between the aptamer on the tip and PTK7 receptor onthe Jurkat cells, a clear rupture event was observed with arupture force corresponding to the sgc8c-PTK7 bond strength.
For statistical analysis, 500–2000 FDCs were recorded un-der variation of the location on the cell surface to avoid mea-suring artefact. To differentiate these supposed specific rup-ture events from nonspecific adhesion, and to avoid measuringartefact FDCs were collected on different positions on thecells and the hold time (i.e., the resting or hold time of thefunctionalized cantilever on the cell surface) was varied from0 to 1000 ms, with no observable difference for the number orappearance of rupture events or measured rupture forces. In afew cases, double or multiple rupture events were observed.Such events are either caused by the binding of additional tiptethered sgc8c molecules to further PTK7 receptors on the cellor by nonspecific adhesion of the tip with the cell.Nonetheless, they were not used for the data evaluation sincedifferentiation of these events cannot be done with sufficientaccuracy.
To prove the specificity of the detected rupture events, theexperiment was performed in the presence of free sgc8captamers in solution (1 μM) to saturate (block) PTK7
0 100 200 300
0.000
0.005
0.010
0.015
pd
f [1
/pN
]
pd
f [1
/pN
]
F[pN]F[pN]
F[p
N]
F[p
N]
F[p
N]
0 500 1000
0
100
200
300
z-distance [nm]
z-distance [nm]
A B
0 100 200 300
0.000
0.005
0.010
0
10
20
30
40
50
60
bin
din
g p
robability %
1000 10000 100000
0
100
200
loadingrate
C D
100 µm
Fig. 2 SMFS experiments: (A) Optical Image of T-cells on Cell-Takcoated glass slide. The bio-functionalized cantilever (upper middle) isplaced above a single cell before approaching. (B) Typical force distancecycle using a sgc8c functionalized tip on a T-cell. In the retraction part(black line) a downwards bending is observable as a result of specificinteraction. In contrast, in the presence of free sgc8c this interaction isblocked (inset). (C) Typical probability density function before (black)
and after (red) addition of free ligand. The red curve is normalized to therelative binding probability. The significance of the proof experiment isshown in the inset. (D) Probability density functions of sgc8c–T-cellinteractions at different pulling velocities. The most probable unbindingforce increases at higher pulling velocities. The fit of the resulting loadingrate dependence of the rupture force is shown in the inset
Specific interaction of the aptamer sgc8c and the receptor PTK7 2771

receptors on the cell surface. This resulted in a significantlylowered binding probability. In Fig. 2C the distribution ofmeasured rupture forces is plotted in the form of a mathemat-ical probability density function (pdf) before (black) and after(red) the addition of the blocking is shown for a representativecell. The red curve is normalized to the relative binding prob-ability. The existence of a remnant BPmay be explained by anincomplete block of accessible PTK7 receptors on the cellsurface. The averaged binding probability of 38.3 ± 7.48%before the block was reduced to 10.15 ± 1.93% after additionof sgc8c to the Jurkat cells (Fig. 2C, inset). An additional,complementing specificity proof was performed with a tip thatwas functionalized with the TDO5 DNA aptamer that recog-nizes Ramos cell of the Burkitt’s lymphoma type, but does notbind to PTK7. The binding probability was only 8.27 ±1.53%.
The rupture force of a ligand–receptor complex is depen-dent on the kinetics of the experiment, in particular the forceramp of the pulling force acting on the complex during rup-ture, and is termed the loading rate [52, 57]. From extrapola-tion of the rupture force dependence on the loading rate, thedissociation rate constant koff and the width of the interactionpotential xβ of the sgc8c-PTK7 interaction on the cell surfacecan be calculated. Experimentally, the loading rate is the prod-uct of the pulling speed and the effective spring constant at thepoint of rupture. Hence, variation of the loading rate isachieved by a change of pulling speed of the cantilever. Theeffective spring, on the other hand, is determined from a fit ofthe slope of the force curve at the point. Datasets were mea-sured at pulling speeds ranging from 500 to 24000 nm s−1 andthe rupture forces, rupture lengths, and effective spring con-stants for each single rupture event were identified. Statisticalanalysis at a given pulling speed showed that the increase ofthe pulling velocity caused an increase of the rupture forces, asillustrated by a shift of the maximum of the pdf (Fig. 2D). Thisis in good agreement with Evans’ theory for a single energybarrier in the ligand–receptor interaction potential in the ther-mally activated regime [52]. For calculation of koff and xβfrom the loading rate dependence, all individual ruptureevents were plotted as a data cloud to account for the influenceof the effective spring constant that varies strongly at a givenpulling velocity as a result of the position-dependent elasticityof the cell [58]. A fit of the data by a maximum likelihoodapproach (as described in more detail in [51]) yielded a disso-ciation constant koff of 5.16 ± 0.19 s−1 with a width of theenergy barrier xβ of 0.65 ± 0.01 Å. The kinetic off rate isindicative of a slow dissociation of the complex, which isfavorable in terms of an extended interacting time betweenthe aptamer and the PTK7 in the cell membrane.
In SMFS the functionalized AFM cantilever probes thesurface Bblindly,^ which has an influence on the probabilityto form ligand–receptor complexes to measure their rupture.Whereas the binding probability on a dense layer of isolated
receptors can be as high as 70 to 80%, binding probabilities oncells range typically below 20% due to a less dense and lesshomogenous distribution of receptors and possibly preferen-tial location in more specified membrane domains [59]. In thepresented study, an uncommonly high average binding prob-ability of nearly 40% was detected, leading us to investigatethe distribution of PTK7 on the surface of Jurkat T-cells moreclosely by TREC.
The method of TREC is illustrated in Fig. 3A; a magneticallycoated cantilever with a quality factor in liquid of ~1 carries ansgc8c aptamer tethered to the tip via a flexible linker. The tiposcillates above the cell surface driven by an alternating magnet-ic field (MACmode). During lateral scan at a rate of 0.5–1.0 Hz,sgc8c can bind to PTK7 in the downward swing of the oscilla-tion, which leads to linker stretching and reduction of the upwardswing. Separation of the bottom part of the oscillation amplitudethat contains the topographic information from the top part that isonly influenced by binding events, a topography image and rec-ognition map are created from a single scan with lateral resolu-tion of a few nanometer [53]. To provide for sufficient contacttime that enables ligand–receptor complex formation and in or-der to achieve high lateral resolution, surface scans were per-formed at 1.5 × 1.5 μm2 scan range (Fig 3B). However, due tothe very soft behavior and high compressibility of the gentlyfixed spherical T-cells, TREC imaging on top of a cell turnedout to bemore challenging. Hence, all images displayed in Fig. 3were captured towards the border area of a cell. The topographyrevealed a rather smooth surface (Fig. 3B-1, C-1) but a highnumber of pronounced dark patches (recognition spots) that re-flect positions of aptamer binding sites on the Jurkat cell(Fig. 3B-2). Figure 3B-3 shows the overlay of the recognitionevents indicated in red with the topography image and show thatPTK7 was evenly distributed over the scan area. In order toprove that the detected aptamer binding sites were indeed thelocations of PTK7 receptor molecules sgc8c saturated T-cellswere scanned using the identical AFM tips with the same imag-ing parameters and settings [53]. Whereas the topography im-ages showed the same features before (Fig. 3B-1) and after block(Fig. 3C-1), the recognition signals were nearly completelyabolished (Fig. 3C-2) due to block of the PTK7 receptors bythe added sgc8c DNA aptamers, as illustrated by the cartoon inFig. 3C-3, proving that the recognition image in 3B2 shows thedistribution of PTK7 in the cell membrane. The TREC imagingrevealed a homogeneous distribution of PTK7 molecules on theouter regions of ALL cells with a surface density of 325 ± 12PTK7 receptors (or small receptor clusters) per μm2.
Conclusions
In this study, we demonstrated the specificity of the interactionof the sgc8c DNA aptamer and PTK7 receptor in the plasmamembrane of intact Jurkat T-cell lymphoma, and measured
2772 M. Leitner et al.

rupture forces of the ligand–receptor complex under differentloading rates using SMFS. The kinetic off rate of the studiedsystem (koff = 5.16 s−1) indicates slow dissociation of the com-plex. Furthermore, we demonstrated the possibility ofperforming recognition imaging experiments on T-cells forthe first time. TREC represents a powerful imaging tool inwhich topography and recognition of specific biological mol-ecules are simultaneously mapped. Our results show thataptamers covalently coupled to an AFM probe recognize spe-cific receptors at nanometer lateral resolution and with highspecificity. More importantly, we were able to visualize andquantify the distribution of PTK7 receptors in the cell mem-brane, showing a high density and homogenous lateral distri-bution in ALL-cells, making it an ideal target. This studyprovides new insight into the mode of the action of the sgc8cDNA aptamers as a diagnostic and targeting agent for acutelymphoblastic leukemia. As the continuing advancements ofthe cell SELEX technique [60] yield a growing library ofaptamers for various cancer markers, they may prove particu-larly useful for identification and capturing of circulating tu-mor cells (CTC) [61]. Moreover, our study presents validationof the method of AFM biosensing for the detection of cancer
markers and reveals potential for future clinical diagnostics. Incombination with traditional histology-based analysis of biop-sies, the method could reduce tumor misclassification [62].Also, with the expression level of tumor markers being relatedto the clinical stage of the disease, determination of the markerdensity on the cell surface by TREC might allow for assess-ment of disease progression as well as the efficacy of cancertherapies.
Acknowledgements Open access funding provided by JohannesKepler University Linz. This work was supported by OEAD, byAgency for Promotion Research and Development (project no. APVV-14-0267 and SK-AT-2015-0004), by grant agency VEGA (project no.2/0055/14), and EU Horizon 2020 Marie Sklodowska-Curie Grant656842. The authors are grateful for support by Dr. Christian Rankl indata evaluation and with the evaluation software.
Compliance with ethical standards
Conflict of interest The authors declare no conflict of interest.This article does not contain any research with human participants or
animals.
0
200
B1 B3B2
Recognition
Image
Topography
Image
Sgc8c
T-cell
A
Sgc8c
PTK7
0
230
C1 C2 C3
T-cell
Topography Recognition
Fig. 3 TREC experiments: (A)Schematic of TREC setup. Theupper part of the oscillation isused to gain the recognitionimage, whereas the lower part isinfluenced by the sampletopography. Topography (B1) andsimultaneously acquiredrecognition (B2) image on a T-cell membrane using sgc8c func-tionalized tips. A superposition oftopography and recognition isshown at image (B3). After addi-tion of free aptamers the topogra-phy (C1) remains unchanged,whereas the recognition spots(C2) is completely abolished as aresult of blocked PTK7 receptors(illustrated in C3). Scale bar forall AFM images is 500 nm
Specific interaction of the aptamer sgc8c and the receptor PTK7 2773

Open Access This article is distributed under the terms of the CreativeCommons At t r ibut ion 4 .0 In te rna t ional License (h t tp : / /creativecommons.org/licenses/by/4.0/), which permits unrestricted use,distribution, and reproduction in any medium, provided you give appro-priate credit to the original author(s) and the source, provide a link to theCreative Commons license, and indicate if changes were made.
References
1. Jemal A, Siegel R, Ward E, Murray T, Xu J, Thun MJ. Cancerstatistics, 2007. CA Cancer J Clin. 2007;57:43–66.
2. Kawasaki ES, Clark SS, Coyne MY, Smith SD, Champlin R, WitteON, et al. Diagnosis of chronic myeloid and acute lymphocyticleukemias by detection of leukemia-specific messenger-RNA se-quences amplified in vitro. Proc Natl Acad Sci U S A. 1988;85:5698–702.
3. Ramaswamy S, Tamayo P, Rifkin R, Mukherjee S, Yeang CH,Angelo M, et al. Multiclass cancer diagnosis using tumor gene ex-pression signatures. Proc Natl Acad Sci U S A. 2001;98:15149–54.
4. Mason J, GriffithsM.Molecular diagnosis of leukemia. Expert RevMolec Diag. 2012;12:511–26.
5. Craig FE, Foon KA. Flow cytometric immunophenotyping for he-matologic neoplasms. Blood. 2008;111:3941–67.
6. Eckert C, Biondi A, Seeger K, CazzanigaG, HartmannR, BeyermannB, et al. Prognostic value of minimal residual disease in relapsedchildhood acute lymphoblastic leukemia. Lancet. 2001;358:1239–41.
7. Haferlach T, Kern W, Schnittger S, Schoch C. Modern diagnosticsin acute leukemias. Crit Rev Oncol Hematol. 2005;56:223–34.
8. Wu X, Chen J, Wu M, Zhao JX. Aptamers: active targeting ligandsfor cancer diagnosis and therapy. Theranostics. 2015;5:322–44.
9. Zhu GZ, YeM, DonovanMJ, Song E, Zhao Z, TanW. Nucleic acidaptamers: an emerging frontier in cancer therapy. Chem Commun.2012;48:10472–80.
10. Radom F, Jurek PM, Mazurek MP, Otlewski J, Jeleń F. Aptamers:molecules of great potential. Biotech Adv. 2013;31:1260–74.
11. Zhou JH, Rossi JJ. Cell type-specific, aptamer-functionalized agents fortargeted disease therapy. Mol Therapy-Nucleic Acids. 2014;3, e169.
12. Zhu GZ, Niu G, Chen X. Aptamer-drug conjugates. BioconjugChem. 2015;26:2186–97.
13. Yang ML, Jiang GH, Li W, Qiu K, Zhang M, Carter CM, et al.Developing aptamer probes for acute myelogenous leukemia detectionand surface protein biomarker discovery. J Hematol Oncol. 2014;7:5.
14. Shangguan D, Li Y, Tang Z, Cao ZC, Chen HW, Mallikaratchy P,et al. Aptamers evolved from live cells as effective molecular probesfor cancer study. Proc Natl Acad Sci U S A. 2006;103:11838–43.
15. Shangguan D, Tang ZW, Mallikaratchy P, Xiao Z, Tan W.Optimization andmodifications of aptamers selected from live can-cer cell lines. Chem Biochem. 2007;8:603–6.
16. Peradziryi H, Tolwinski NS, Borchers A. The many roles of PTK7:a versatile regulator of cell–cell communication. Arch BiochemBiophys. 2012;524:71–6.
17. Gartner S, Gunesch A, Knyazeva T, Wolf P, Högel B, Eiermann W,et al. PTK 7 is a transforming gene and prognostic marker for breastcancer and nodal metastasis involvement. PLoS One. 2014;9, e84472.
18. Kim JH, Kwon J, Lee HW, KangMC, Yoon HJ, Lee ST, et al. Proteintyrosine kinase 7 plays a tumor suppressor role by inhibiting ERK andAKT phosphorylation in lung cancer. Oncol Rep. 2014;31:2708–12.
19. ZhangHT,WangAD, Qi S, Cheng S, Yao B, XuY. Protein tyrosinekinase 7 (PTK7) as a predictor of lymph node metastases and anovel prognostic biomarker in patients with prostate cancer. Int JMol Sci. 2014;15:11665–77.
20. Huang YF, Shangguan DH, Liu H, Phillips JA, Zhang X,Chen Y, et al. Molecular assembly of an aptamer-drug con-jugate for targeted drug delivery to tumor cells. ChemBiochem. 2009;10:862–8.
21. Taghdisi SM, Abnous K, Mosaffa F, Behravan J. Targeteddelivery of daunorubicin to T-cell acute lymphoblastic leu-kemia by aptamer. J Drug Target. 2010;18:277–81.
22. Zhu GZ, Zheng J, Song E, Donovan M, Zhang K, Liu C,et al. Self-assembled, aptamer-tethered DNA nanotrains fortargeted transport of molecular drugs in cancer theranostics.Proc Natl Acad Sci U S A. 2013;110:7998–8003.
23. Huang YF, Sefah K, Bamrungsap S, Chang HT, Tan W.Selective photothermal therapy for mixed cancer cells usingaptamer-conjugated nanorods. Langmuir. 2008;24:11860–5.
24. Wang J, You MX, Zhu G, Shukoor MI, Chen Z, Zhao Z, et al.Photosensitizer-gold nanorod composite for targeted multimodaltherapy. Small. 2013;9:3678–84.
25. Kang HZ, O’Donoghue MB, Liu H, Tan W. A liposome-basednanostructure for aptamer directed delivery. Chem Commun.2010;46:249–51.
26. Shi H, He XX, Wang K, Wu X, Ye X, Guo Q, et al.Activatable aptamer probe for contrast-enhanced in vivo can-cer imaging based on cell membrane protein-triggered con-formation alteration. Proc Natl Acad Sci U S A. 2011;108:3900–5.
27. Jacobson O, Weiss ID, Wang L, Wang Z, Yang X, Dewhurst A,et al. F-18-labeled single-stranded DNA aptamer for PET imagingof protein tyrosine kinase-7 expression. J Nuclear Med. 2015;56:1780–5.
28. Li H, Hu HT, Zhao Y, Chen X, Li W, Qiang W, et al.Multifunctional aptamer-silver conjugates as theragnosticagents for specific cancer cell therapy and fluorescence-enhanced cell imaging. Anal Chem. 2015;87:3736–45.
29. Zheng FY, Cheng Y, Wang J, Lu J, Zhang B, Zhao Y, et al.Aptamer-functionalized barcode particles for the capture and detec-tion of multiple types of circulating tumor cells. Adv Mater.2014;26:7333–8.
30. O’Donoghue MB, Shi XL, Fang X, Tan W. Single-moleculeatomic force microscopy on live cells compares aptamer andantibody rupture forces. Anal Bioanal Chem. 2012;402:3205–9.
31. Lamprecht C, Hinterdorfer P, Ebner A. Applications of bio-sensing atomic force microscopy in monitoring drug andnanoparticle delivery. Expert Opin Drug Del. 2014;11:1237–53.
32. Wang N, Liu NQ, Hao J, Bai X, Li H, Zhang Z, et al. Singlemolecular recognition force spectroscopy study of a DNA aptamerwith the target epithelial cell adhesion molecule. Analyst.2015;140:6226–9.
33. Beaussart A, Abellan-Flos M, El-Kirat-Chatel S, Stéphane P,Vincent SP, Dufrêne YF. Force nanoscopy as a versatileplatform for quantifying the activity of antiadhesion com-pounds targeting bacterial pathogens. Nano Lett. 2016;16:1299–307.
34. Evans E. Energy landscapes of biomolecular adhesion and receptoranchoring at interfaces explored with dynamic force spectroscopy.Faraday Discus. 1998;111:1–16.
35. Friddle RW, Noy A, De Yoreo JJ. Interpreting the wide-spread nonlinear force spectra of intermolecular bonds.Proc Natl Acad Sci U S A. 2012;109:13573–8.
36. Alsteens D, Pfreundschuh M, Zhang CH, Spoerri PM, CoughlinSR, Kobilka BK, et al. Imaging G protein-coupled receptors while
2774 M. Leitner et al.

quantifying their ligand-binding free-energy landscape. NatMethods. 2015;12:845–51.
37. Dufrene YF, Martinez-Martin D,Medalsy I, Alsteens D,Muller DJ.Multiparametric imaging of biological systems by force-distancecurve-based AFM. Nat Methods. 2013;10:847–54.
38. Li Q, Zhang T, Pan YG, Ciacchi LC, Xu BQ, Wei G. AFM-basedforce spectroscopy for bioimaging and biosensing. RSC Adv.2016;6:12893–912.
39. Stroh C, Wang H, Bash R, Ashcroft B, Nelson J, Gruber H, et al.Single-molecule recognition imaging microscopy. Proc Natl AcadSci U S A. 2004;101:12503–7.
40. Stroh CM, Ebner A, Geretschläger M, Freudenthaler G, KienbergerF, Kamruzzahan AS, et al. Simultaneous topography and recogni-tion imaging using force microscopy. Biophys J. 2004;87:1981–90.
41. Leitner M, Mitchell N, Kastner M, Schlapak R, Gruber HJ,Hinterdorfer P, et al. Single-molecule AFM characterization of in-dividual chemically tagged DNA tetrahedra. ACS Nano. 2011;5:7048–54.
42. Leitner M, Stock LG, Traxler L, Leclercq L, Bonazza K,Friedbacher G, et al. Mapping molecular adhesion sites insideSMIL coated capillaries using atomic force microscopy recognitionimaging. Anal Chim Acta. 2016;930:39–48.
43. Tang J, Ebner A, Badelt-Lichtblau H, Völlenkle C, Rankl C,Kraxberger B, et al. Recognition imaging and highly ordered mo-lecular templating of bacterial S-layer nanoarrays containing affin-ity-tags. Nano Lett. 2008;8:4312–9.
44. Ebner A, Nikova D, Lange T, Häberle J, Falk S, Dübbers A, et al.Determination of CFTR densities in erythrocyte plasmamembranesusing recognition imaging. Nanotechnology. 2008;19:384017.
45. Chtcheglova LA, Atalar F, Ozbek U, Wildling L, Ebner A,Hinterdorfer P. Localization of the ergtoxin-1 receptors on the volt-age sensing domain of hERG K+ channel by AFM recognitionimaging. Pflugers Arch - Eur J Physiol. 2008;456:247–54.
46. Duman M, Pfleger M, Zhu R, Rankl C, Chtcheglova LA,Neundlinger I, et al. Improved localization of cellular membranereceptors using combined fluorescence microscopy and simulta-neous topography and recognition imaging. Nanotechnology.2010;21:115504.
47. Ebner A, Hinterdorfer P, Gruber HJ. Comparison of differentaminofunctionalization strategies for attachment of single antibod-ies to AFM cantilevers. Ultramicroscopy. 2007;107:922–7.
48. Wildling L, Unterauer B, Zhu R, Rupprecht A, Haselgrübler T,Rankl C, et al. Linking of sensor molecules with amino groups toamino-functionalized AFM tips. Bioconj Chem. 2011;22:1239–48.
49. Kamruzzahan ASM, Ebner A,Wildling L, Kienberger F, Riener CK,Hahn CD, et al. Antibody linking to atomic force microscope tips viadisulfide bond formation. Bioconjug Chem. 2006;17:1473–81.
50. Butt HJ, Jaschke M. Calculation of thermal noise in atomic forcemicroscopy. Nanotechnology. 1995;6:1–7.
51. Neundlinger I, Puntheeranurak T, Wildling L, Rankl C, Wang LX,Gruber HJ, et al. Forces and dynamics of glucose and inhibitorbinding to sodium glucose co-transporter SGLT1 studied by singlemolecule force spectroscopy. J Biol Chem. 2014;289:21673–83.
52. Evans E, Ritchie K. Dynamic strength of molecular adhesionbonds. Biophys J. 1997;72:1541–55.
53. Preiner J, Ebner A, Chtcheglova L, Zhu R, Hinterdorfer P.Simultaneous topography and recognition imaging: physical aspectsand optimal imaging conditions. Nanotechnology. 2009;20:215103.
54. Jena B. Fusion pore or porosome: structure and dynamics. JEndocrinol. 2003;176:169–74.
55. Schmidt S, Moser M, Sperandio M. The molecular basis ofleukocyte recruitment and its deficiencies. Mol Immunol.2013;55:49–58.
56. Thavarajah R, Mudimbaimannar VK, Elizabeth J, Rao UK,Ranganathan K. Chemical and physical basics of routine form-aldehyde fixation. J Oral Maxillofacial Pathol. 2012;16:400–5.
57. Baumgartner W, Hinterdorfer P, Ness W, Raab A, Vestweber D,Schindle H, et al. Cadherin interaction probed by atomic force mi-croscopy. Proc Natl Acad Sci U S A. 2000;97:4005–10.
58. Lamprecht C, Plochberger B, Ruprecht V, Wieser S, Rankl C,Heister E, et al. A single-molecule approach to explore binding,uptake, and transport of cancer cell targeting nanotubes.Nanotechnology. 2014;25:125704.
59. Hu YS, Cang H, Lillemeier BF. Super-resolution imaging revealsnanometer- andmicrometer-scale spatial distributions of T-cell recep-tors in lymph nodes. Proc Natl Acad Sci U S A. 2016;113:7201–6.
60. Zhu X, Lu PY, Rosato RR, TanW, Zu Y. Oligonucleotide aptamers:new tools for targeted cancer therapy. Molec Therapy - NucleicAcids. 2014;3, e182.
61. Dickey DD, Giangrande PH. Oligonucleotide aptamers: Anext-generation technology for the capture and detection ofcirculating tumor cells. Methods. 2016;97:94–103.
62. Spence T, De Souza R, Dou Y, Stapleton S, Reilly RM, Allen C.Integration of imaging into clinical practice to assess the deliveryand performance ofmacromolecular and nanotechnology-based on-cology therapies. J Control Release. 2015;219:295–312.
Michael Leitner received hisPhD in Biophysics in 2012 fromthe Johannes Kepler UniversityLinz, Austria. He is a biophysicistand medical technique engineerwith more than 10 years of expe-rience in bio-AFM, topography,and recognition imaging and sin-gle molecule force spectroscopy.
Alexandra Po turnayovadefended her PhD thesis in2012 at the Institute of AnimalBiochemistry and Genetics of theSlovak Academy of Sciences,Ivanka pri Dunaji, Slovakia. Sheis a research fellow at this instituteand partially at the Faculty ofMathematics, Physics , andI n f o r m a t i c s , C o m e n i u sUniversity in Bratislava. Her sci-entific interests include mass-sensitive biosensors and surfacecharacterization by AFM.
Specific interaction of the aptamer sgc8c and the receptor PTK7 2775

Constanze Lamprecht receivedher PhD in Biophysics in 2010from the Johannes KeplerUniversity Linz (JKU) (Austria)followed by post-doctoral posi-t ions a t the Univers i ty ofWaterloo (Canada) and theUniversity of Kiel (Germany).She is currently affiliated againwith the Institute of Biophysicsat JKU where she uses AFM andfluorescence microscopy to studycell transformations that lead tothe initiation and progression ofcancer.
Sabine Weich successfully fin-ished her Master’s degree inB i o t e c h n o l o g y a n dEnvironmental Technology in2013 at the Univers i ty ofApplied Sciences, Wels, Austria,and performed AFM-based mo-lecular recognition studies at theJohannes Kepler University,Linz, Austria.
Maja Snejdarkova defended herPhD thesis in 1980 at MasarykUn i v e r s i t y, B r n o , C z e c hRepublik. She was a research of-ficer at the Institute of AnimalBiochemistry and Genetics of theSlovak Academy of Sciences,Ivanka pri Dunaji, Slovakia. In2016 she retired, but continuedworking in Professor T. Hianik’slaboratory. Her scientific interestsinclude mass-sensitive and elec-trochemical biosensors.
Ivana Karpisova is an externalPhD student at the Faculty ofMathematics, Physics , andI n f o r m a t i c s , C o m e n i u sUniversity, Bratislava, Slovakia,working under supervision ofProfessor T. Hianik. Her work isfocused onmass-sensitive biosen-sors and AFM. Since 2016 shehas been working as associatesafety review special is t atPremier Research.
Tibor Hianik defended his PhDthesis in 1979 and D.Sc thesis in1987 at Faculty of Physics ofM.V. Lomonosov Moscow StateUniversity. Since 1989 he hasb e e n F u l l P r o f e s s o r o fB iophys i c s a t Facu l t y o fMathematics, Physics , andIn fo rma t i c s o f Comen iu sUn ive r s i t y i n Br a t i s l a va ,Slovakia. Currently he is Headof Biophysics Laboratory of theDepartment of Nuclear Physicsand Biophysics. The fields of hisinterest involve biophysics of
biomembranes and model membranes, nanomaterials, and aptamer bio-sensors.
Andreas Ebner received his PhDinBiophysics in 2007. Since 2016he has beenAssociate Professor atthe Institute of Biophysics andDeputy Head of the Departmento f App l i e d Expe r imen t a lBiophysics at the JohannesKepler University Linz, Austria.His research expertise includesbiosensing atomic force micros-copy and spectroscopy, and singlemolecule sensor tip chemistry.
2776 M. Leitner et al.