![Thymine Dimers for DNA Nanocircuitry Applications · Thymine dimers are formed through [2+2] cycloadditions between adjacent thymine bases on the same strand of DNA, forming a covalently-bound](https://static.fdocuments.in/doc/165x107/60781a254e14ea36e9186694/thymine-dimers-for-dna-nanocircuitry-applications-thymine-dimers-are-formed-through.jpg)
CHARACTERIZATION OF THE cis-syn THYMINE DIMER LESION IN ...
109
CHARACTERIZATION OF THE cis-syn THYMINE DIMER LESION IN DUPLEX DNA WITH NUCLEAR MAGNETIC RESONANCE By Belinda B. Wenke A thesis presented to the faculty of Mount Holyoke College in partial fulfillment of the requirements for the degree of Bachelor of Arts with Honors Department of Chemistry Mount Holyoke College South Hadley, Massachusetts May, 2011
Transcript of CHARACTERIZATION OF THE cis-syn THYMINE DIMER LESION IN ...

CHARACTERIZATION OF THE cis-syn THYMINE DIMER LESION IN
DUPLEX DNA WITH NUCLEAR MAGNETIC RESONANCE
By
Belinda B. Wenke
A thesis presented to the faculty of Mount Holyoke College in partial
fulfillment of the requirements for the degree of Bachelor of Arts with Honors
Department of Chemistry
Mount Holyoke College
South Hadley, Massachusetts
May, 2011

This thesis was prepared under
the direction of Dr. Megan E. Núñez
for eight credits of independent study.

ACKNOWLEDGEMENTS
I owe my deepest gratitude to my research advisor, Professor Megan
Núñez for her endless patience, guidance, and encouragement. She has
supported me in every facet of being a human being in academia, and I am
truly grateful for the year of challenge she has offered me. I also extend my
gratitude to Professors Darren Hamilton and Craig Woodard, for serving as
members of this thesis committee. Thank you for all your guidance and
contribution, and for being outstanding mentors. Thanks to the folks of the
Mount Holyoke College Chemistry Department, who have contributed in
innumerable ways by shaping my understanding and appreciation of science.
I am infinitely grateful to the sage assistance in the nuclear magnetic
resonance studies from Dr. Charles Dickinson, who has worked with truly
impressive patience on optimizing the parameters for these experiments. His
appreciation for NMR is both remarkable and transcendent; I can only hope to
one day be as capable. I would also like to thank my fellow students in the
Núñez research group for their emotional support and camaraderie, and for a
truly excellent summer of friendship I will never forget.
I would also like to extend thanks to my family, for their unconditional
love and strangely persistent interest in my project, especially to Michael,
from whom I would someday appreciate a job. I extend a final thank you to
my favorite people in the world: Ivica, Dan, Seong, Alyce, Mackenzie, and all
my sisters on the MHC Equestrian Team.

TABLE OF CONTENTS
List of Figures and Tables…………………………………………………..v
1. Abstract………………………………………………………………….vii
2. Introduction……………………………………………………………….1
2.1. DNA Damage and the Thymine Dimer Lesion………………......1
2.2. Structure and Effect of the cis-syn Thymine Dimer……………11
2.3. Thymine Dimer Repair…………………………………………14
2.4. Activation of Repair Mechanisms and Base Pair Opening…….16
2.5. Nuclear Magnetic Resonance Techniques:…………………….19
1D and 2D NOESY
2.6. Exchange Experiments…………………………………………25
3. Materials and Methods…………………………………………………...28
3.1. Buffer Preparation…………………………...…………………..28
3.2. Sample Preparation………………………………………….…..28
3.3. NMR Sample Parameters……….…………………………..…..30
3.4. NMR Instrument Parameters……………………………….…..32
4. Results……………………………………………………………….…....35
4.1. Experimental Sequences ………………………………….…....35
4.2. NMR Resonance Assignment………………………….………..36
4.3. One-Dimensional Spectra…………………………………….....40
4.4. Two-Dimensional NOESY Spectra……………………………..44
4.5. Assigned One-Dimensional Spectra………………………….....52
4.6. Exchange Experiments………………………………………….62
5. Discussion………………………………………………………………82
5.1. Sequence Selection……………………………………………82
5.2. NMR Resonance Assignment: Duplexes KK56 and KK5TT6….83
5.3. NMR Resonance Assignment: Duplexes KK34 and KK3TT4..85
5.4. Exchange Experiments………………………………………….89
5.5. Relation to Homologous Research………………………………93
6. Conclusion…………………………………………………………….….96
7. References………………………………………………………….…….97

v
LIST OF FIGURES
Figure 1. Canonical Watson-Crick base pairing 4
of the four nitrogenous bases
Figure 2. The structure of a cyclobutane pyrimidine 7
dimer (CPD) formation induced by UV-C radiation
Figure 3. The multiple valence isomers of the cyclobutane 10
pyrimidine dimer photoproduct
Figure 4. A crystal structure of the cis-syn thymine dimer 13
lesion incorporated into a duplex of DNA
Figure 5. A schematic of the interior of an NMR Spectrometer 20
Figure 6. A sample 2D NOESY assignment, from a 23
simple DNA sequence of 5’- G G A -3’
Figure 7. Sample 2D NOESY proton spectrum 24
Figure 8. Sample diagram of a trimer 5’- A G C -3’ 39
Figure 9.1D spectrum of KK34 41
Figure 10. Imino region of KK34, with no assignment 43
Figure 11. Expanded imino proton region (12-14 ppm) 45
of 2D NOESY spectrum of KK56
Figure 12. Expanded imino proton region (12-14 ppm) 47
of 2D NOESY spectrum of KK5TT6
Figure 13. Expanded imino proton region (12-14 ppm) 49
of 2D NOESY spectrum of KK34
Figure 14. Expanded imino proton region (12-14 ppm) 51
of 2D NOESY spectrum of KK3TT4
Figure 15. 1D spectrum of imino proton region (12-14 ppm) 53
of the parent strand KK56
Figure 16. 1D spectrum of imino proton region (12-14 ppm) 56
of the dimer strand KK5TT6
Figure 17. 1D spectrum of imino proton region (12-14 ppm) 59

vi
of the parent strand KK34
Figure 18. 1D spectrum of the expanded imino 61
proton region (12-14 ppm) of KK3TT4
Figure 19. Water inversion and recovery 63
Figure 20. KK34 parent imino proton spectra as a 65
function of mixing time, in 40 mM ammonia catalyst
Figure 21. KK3TT4 dimer imino proton spectra as a 67
function of mixing time, in 40 mM ammonia catalyst
Figure 22. Individual imino protons of KK34 in 69
40 mM ammonia catalyst
Figure 23. Individual imino protons of KK3TT4 in 71
40 mM ammonia catalyst
Figure 24. Overlaid imino regions of KK34 for five 73
increasing catalyst concentrations
Figure 25. KK3TT4 imino region at four increasing 75
ammonia catalyst concentrations of 40, 80, 120 and 200 mM
Figure 26. Exchange rates for each residue plotted 78
against ammonia concentration
Figure 27. Plot of KK3TT4 exchange rate per residue 80
as a function of ammonia catalyst concentration for four
concentrations
Figure 28. Chemical shift changes in the KK34 to KK3TT4 duplex 87

vii
LIST OF TABLES
Table 1. Extinction coefficients. 30
Table 2. Experimental process and mixing time. 34
Table 3. Sequence of 12-mer DNA Oligonucleotide Duplexes. 35
Table 4. Sequence of 10-mer DNA Oligonucleotide 36
Duplexes, from Taylor et al.
Table 5. Chemical shifts (in ppm) of imino proton resonances 57
in the parent (KK56) complex versus dimer complex (KK5TT6).
Table 6. Chemical shifts (in ppm) of imino proton resonances 62
in the parent (KK34) complex versus dimer complex (KK3TT4).
Table 7. Exchange rates and base pair lifetimes. 77
Table 8. Values for equilibrium constant of opening for each residue. 81

viii
1. ABSTRACT
Ultraviolet irradiation from sun exposure can lead to permanent,
covalent damage in DNA. The damaged sites can block the progression of
polymerases, thereby preventing replication or transcription. The frequent
occurrence of lesions in the genome necessitates rapid and effective internal
repair mechanisms, as well as a highly sensitive detection mechanism to
initiate repair. Perturbations in the three-dimensional solution-state structure
of the DNA duplex may alert repair proteins to a damage site. Our
experiments model the occurrence of a cis-syn thymine cyclobutane dimer
lesion, hereafter called the thymine dimer, which results as the major
photoproduct of UV irradiation of two adjacent thymines. The two bases form
a cyclobutane ring via a [2+2] cycloaddition. The thymine dimer has been
considered a bulky and destabilizing lesion; published structures of the
thymine dimer lesion reveal that the backbone around the lesion is pinched,
the DNA is kinked, and the canonical Watson Crick base pairing with the
opposite adenines is disrupted through the loss of one hydrogen bond,
weakening the interactions with the complementary strand. We hypothesize
that the hydrogen bond disruption from the formation of the lesion results in
an increased rate of imino proton exchange from the affected thymine bases.
We further predict that an increased rate of proton exchange would correlate
to an increased rate at which the bases spontaneously flip out of the double
helix conformation, alerting repair enzymes to a damage site.

ix
Two-dimensional NMR was used to characterize the imino region of a
10-mer and 12-mer undamaged parent complexes and dimer-containing lesion
complexes. Assignment of resonances to specific exchangeable base protons
was accomplished through sequential connection of Nuclear Overhauser
Effect (NOE) cross-peaks, which result from through-space (rather than
through-bond) interactions between protons that are less than ~ 6Å apart.
In comparing the imino region of the parent and dimer 12-mer duplex
spectra, we observed that the thymines associated with the dimer (T6 and T7)
exhibit noticeable upfield shifts in resonance frequency. The thymine at the 5’
end of the dimer (T6) is isolated and does not overlap with neighboring peaks.
However, in both the parent and dimer sequences, the thymine residue on the
3’ side of the lesion, T7, is overlaid with a second peak. In the parent,
thymines 7 and 9 overlap, and in the dimer, thymine 7 and guanine 14 are
overlaid. The position of T7 is not ideal, especially compared with the clarity
of T6. Since T7 overlaps with other peaks, we cannot accurately observe
changes in behavior once the dimer is introduced. In the 10-mer duplex, a
similar upfield shifting effect was observed, but every residue (including
dimer residues T5 and T6) is well resolved in both parent and dimer
structures. Thus, the 10-mer sequence was used to measure quantitatively the
kinetic destabilization using imino exchange experiments.
From the exchange experiments, the 5’ thymine dimer residue T5 had
an equilibrium constant of opening of 0.11 10-6
M-1
s-1
in the parent complex,
and increased more than tenfold to 1.4 10-6
M-1
s-1
in the dimer form.

x
Significant increases in equilibrium constants of opening were also observed
for the flanking thymine residues T14 and T17, with a modest increase in T6.
The increase in equilibrium opening constant for T5 indicates that there is a
kinetic effect of the dimer that allows rapid, frequent exchange of the imino
proton. Our data support the suggestion that the cis-syn cyclobutane thymine
dimer destabilizes the DNA duplex enough to augment base opening to the
solvent significantly.

1
2. INTRODUCTION
2.1. DNA Damage and the Thymine Dimer Lesion
Deoxyribonucleic acid (DNA) is the fundamental genetic material in
modern organisms. Genetic material is iteratively copied to generate
successive generations, and stability of the genome is essential in preventing
degradation of the genetic information with each successive inheritance.
Considering that efficient, accurate replication of DNA is critical to the
success of every organism, researchers initially incorrectly assumed that DNA
was infrequently exposed to or easily able to resist chemical modification. (1)
The stability of DNA is not actually a result of resistance to modification, but
in large part to the ability of the complex DNA repair networks to edit and
restore genetic material. DNA is under constant attack by both endogenous
and exogenous sources. Endogenous sources include hydrolytic and oxidative
damage that occur from the hostile cellular environment, which is aqueous
and constantly infiltrated by reactive oxygen byproducts from metabolism. (2)
Exogenous sources are generated outside the cell, and include physical and
chemical agents that damage DNA. The accumulation of damage can lead to
mutations in the DNA sequence, ultimately causing uninhibited cellular
proliferation (cancer), cellular senescence (aging), or cellular apoptosis
(death). Thus, it is necessary to understand the formation and consequences of
DNA damage.

2
DNA is a polymer made of monomeric units composed of nitrogenous
bases and ribose sugars, connected by phosphodiester linkages. The DNA
molecule is prone to damage at any site, but damage to the nitrogenous bases
is of particular interest, since the bases code for the genetic material. Four
nitrogenous bases compose normal DNA structure: adenine, thymine, cytosine
and guanine (Figure 1). The bases are stabilized within a DNA double helix
superstructure through hydrogen bonding to their canonical Watson-Crick
base pair. The strands of the helix are oriented in an anti-parallel fashion, with
the bases flat in a plane perpendicular to the sugar-phosphate backbone.
Polymerization of each stand is continued by bonding a 5’ carbon phosphate
group of one nucleotide to the 3’ carbon hydroxyl group of a second
nucleotide through a phosphodiester linkage. The strand orientation is thus
described by “5’ to 3’”, which describes the orientation of the non-bonded 5’
or 3’ carbon end. Stability of the duplex structure derives from both the
hydrogen bonding complementarity of the nitrogenous bases, and the van der
Waals stacking interactions of the hydrophobic bases. The aromaticity of the
bases could allow π electrons to freely diffuse along the central axis of the
helix, but this theory is controversial and remains an area of dispute in the
field.
The conformation of the DNA duplex can adopt multiple forms. The
structure elucidated by Watson and Crick is of B-form DNA, which is
characterized by a wide major groove and narrow minor groove, and right-
handed helical turns. B-DNA contains a 3.4 nm helical repeat distance, and a

3
0.34 nm distance between two neighboring bases, such that 10 base pairs
complete one turn (3). A-form DNA is a right-handed helix form that occurs
in high salt concentrations, i.e. those larger than physiological salt
concentration of 0.15 M KCl, 0.004 M MgCl2 (4). A-DNA also has a helical
pitch of 2.3 nm with 11 base pairs per turn, and the differences in the major
and minor groove are less distinct, due to the lengthening along the central
axis of the overall duplex. Z-DNA is a left-handed form, with a helical pitch
of 4.6 nm or 12 base pairs per turn. Z-DNA often forms at sites of
transcription, where duplex DNA is unwound to accommodate replicating
polymerases, and also at particular GC alternating sites in high salt
concentrations (5).
4
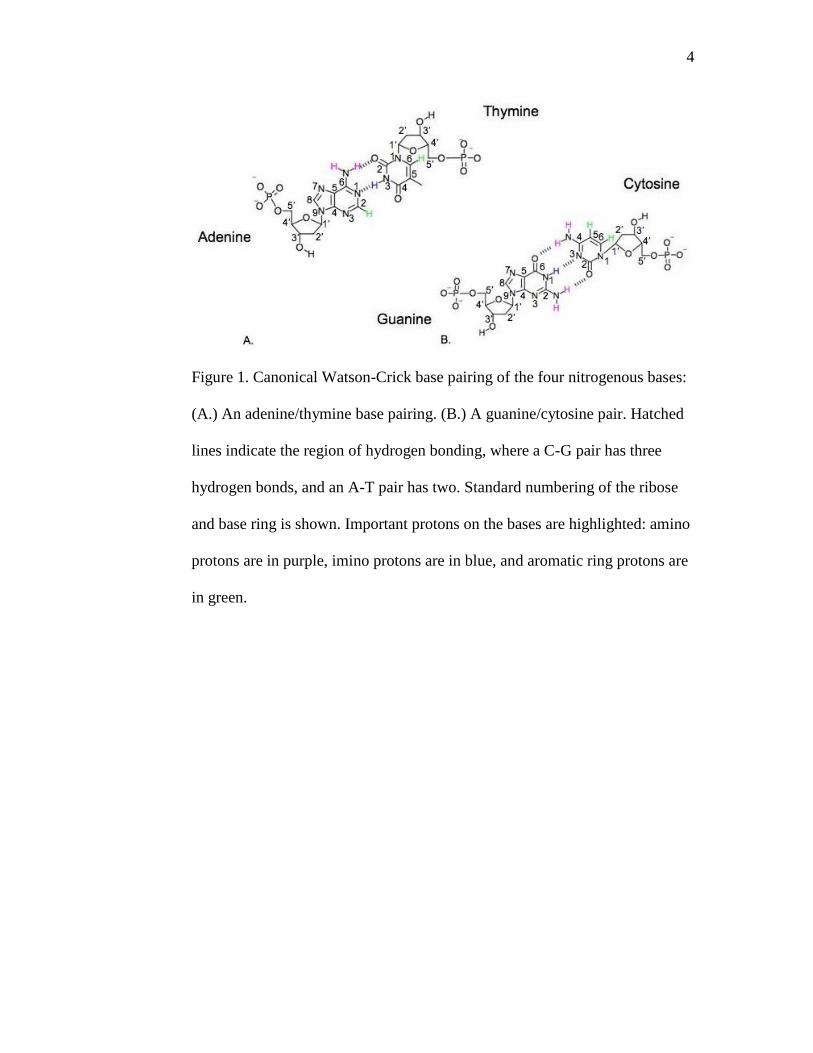
Figure 1. Canonical Watson-Crick base pairing of the four nitrogenous bases:
(A.) An adenine/thymine base pairing. (B.) A guanine/cytosine pair. Hatched
lines indicate the region of hydrogen bonding, where a C-G pair has three
hydrogen bonds, and an A-T pair has two. Standard numbering of the ribose
and base ring is shown. Important protons on the bases are highlighted: amino
protons are in purple, imino protons are in blue, and aromatic ring protons are
in green.

5
Multiple forms of exogenous DNA damage can occur spontaneously.
For example, adenine, guanine and cytosine contain amine groups that can be
spontaneously cleaved from the base at physiological pH (7.5) and
temperature (37C) (2). The deamination can result in mismatched pairing
during the replication process, since the amine group is critical in the normal
hydrogen bonding (Figure 1). Similarly, bases can be spontaneously cleaved
out of the duplex at the N-glycosyl bond, leaving an abasic site and exposing
the phosphodiester backbone to ester hydrolysis. The mechanism of
hydrolysis follows a sequence of protonation of the base, then direct cleavage
of the N-glycosyl bond. Both purines and pyrimidines can be lost from the
duplex at significant rates in acidic pH by acid catalysis. Cleavage of the
backbone can result in single-strand breaks (nicks), or full double stranded
breaks, which can lead to severe heritable mutations (2).
Oxidative DNA damage is more common than spontaneous
hydrolysis. Reactive oxygen species are continuously produced as a by-
product of aerobic metabolism during which oxygen becomes the final
electron acceptor. Molecular oxygen (O2) is relatively unreactive towards
DNA, but unpaired orbitals can accept single electrons to create radical
oxygen (O2-). Radical dioxygen itself is not very reactive to DNA, but it can
easily form superoxide (H2O2), which can decompose to generate hydroxyl
radicals (OH). Multiple processes such as release of antioxidants and
degradative enzymes help control the population of reactive oxygen species,
but often the redox equilibrium is upset by exposure to radiation and redox-

6
active chemicals (2). Oxygen radicals can perform a variety of reactions on
DNA bases in particular; hydroxyl radicals can abstract hydrogen atoms from
the sugar rings or add across double bonds in the DNA bases. A common
lesion resulting from oxygen free radicals is 7,8-dihydro-8-oxoguanine, a
mutation of guanine with an oxidized imidazole ring. The oxidation of
guanine causes the base to more readily adopt the syn conformation, which
can mismatch through the formation of hydrogen bonds with adenine. The
mismatch often leads to errors in replication (6).
A classic system in which to study DNA base lesions is the irradiation
of cells with ultraviolet (UV) light. Studies of UV light effects are of
particular biological relevance, because organisms must contend with constant
solar UV radiation. UV light is subdivided by wavelength into UV-A (320 to
400 nm), UV-B (295-320 nm) and UV-C (100-295 nm). The atmospheric
ozone layer only allows penetration of mainly UV-A and UV-B, but
frequently, UV-C light is used to induce DNA damage in vitro. DNA absorbs
at 260 nm, unlike most proteins, and is thus efficiently and specifically excited
by UV-C irradiation (2). Ultraviolet light irradiation induces multiple kinds of
DNA damage, most commonly cyclobutane pyrimidine dimers. A lesion
results as the major photoproduct of light-promoted [2+2] cycloaddition of
two adjacent pyrimidine bases, in a Diels-Alder –like reaction (Figure 2).

7
Figure 2. The structure of a cyclobutane pyrimidine dimer (CPD) formation
induced by UV-C radiation. The minor 6-4 photoproduct is also shown. Taken
from Li et al., 2006. (7)

8
Adjacent pyrimidines become covalently bonded by cyclobutane ring
formation between the carbon 5 and 6 positions, destabilizing the bases
through loss of aromaticity. Cyclobutane ring formation can yield several
isomeric conformers: cis-syn, cis-anti, trans-syn, or trans-anti. (Figure 3) The
variability of the structural isomers is dependent on the orientation of the
nitrogenous base to the sugar ring, as well as the position of the nitrogenous
bases relative to each other. The cis-trans conformation of the CPD occurs
from the variation of the position of the base relative to the ring, and the syn-
anti conformation is dependent on whether the C5-C6 bond of each base are
parallel to each other, or anti-parallel, respectively (8).
Most commonly in regular B-form DNA, adjacent thymines are
susceptible to dimerization in the cis-syn orientation in which the C5-C6
bonds are parallel and the thymine is in the cis conformation to the ribose
ring. The cis-syn thymine dimer is often abbreviated T<>T. The trans-syn
dimer can be more commonly formed in partially denatured DNA, where the
bases have more freedom of conformation. In regions of active transcription
where the duplex DNA is often unwound to accommodate polymerases,
cyclobutane pyrimidine dimers can occur between nonadjacent pyrimidines
(2).
In naturally occurring genomes, dimerization between thymines
occurs more frequently than dimerization between two cytosines or between a
thymine and a cytosine. The ratio of thymine-thymine dimers (T<>T) to
cytosine-thymine dimers (C<>T) to thymine-cytosine dimers (T<>C) to
9
cytosine-cytosine dimers (C<>C) is 68:13:16:3 in human cells irradiated with
UV-B radiation at 254 nm (9). The occurrence of thymine dimer lesions
reaches photochemical equilibrium once 7% of the thymines in the sequence
have been converted to dimers (10). At photochemical equilibrium, the rate of
dimer formation and dimer dissociation are equal. Dimer formation can be
reversed by photo-reversal, when a sufficiently high dose of UV radiation can
break the covalent bonds of the cyclobutane dimer.
In almost all other contexts, the thymine dimer is a very stable
structure. The lesion is resistant to extremes of pH as well as temperature.
Complete acid hydrolysis of the DNA superstructure will yield thymine dimer
units that can be separated from the remaining nucleic acids (2).
Many characteristics of the thermodynamic properties of the thymine
dimer lesion are known. Duplex formation of two single stranded
oligonucleotides, one containing a thymine dimer lesion, occurs readily at
room temperature with a large negative Gibbs free energy. Compared to the
Gibbs free energy of duplex formation of non-damaged strands, the change in
free energy is very low, suggesting the dimer has a low level of
thermodynamic effect. Although previous studies have suggested that the
destabilization is an entropic effect, the opposite thermodynamic effect is
observed in samples with other oligonucleotide lengths and sequences (11).

10
Figure 3. The multiple valence isomers of the cyclobutane pyrimidine dimer
photoproduct. The cis-trans conformation is dependent on the position of the
base relative to the ring, and the syn-anti conformation is dependent on the
parallel or anti-parallel orientation of the C5-C6 bonds. Taken from Douki et
al., 2003. (8)

11
2.2. Structure and Effect of the cis-syn Thymine Dimer
Cyclobutane pyrimidine dimers have classically been considered as
bulky and helix-distorting. The thymine dimer lesion is known to have
destabilizing effects on the DNA superstructure by creating a pinching effect
in the phosphodiester backbone and kinking the regular B-DNA form. The
presence of the lesion weakens interactions with the complementary strand
through loss of one hydrogen bond with the opposite adenines (12). CPDs
were assumed to be unconditionally non-coding lesions, causing a
discontinuation in the activity of RNA polymerases to transcribe the DNA. In
the cis-syn thymine dimer, disruption is based on the chemical structure of the
lesion, in which the hydrogen bonding to the opposite strand is affected. The
distortion in the helix structure can create a bubble of single-stranded DNA,
causing polymerases to pause (2).
In some instances, the thymine dimer lesion causes disruptions by
blocking the progression of DNA and RNA polymerases, but polymerases in
the error-prone Y super family can bypass a variety of CPD lesions, by virtue
of large, accommodating active sites (2). In vivo, the lesion can be eliminated
or repaired by transcription-coupled repair (TCR) and nucleotide excision
repair (NER) pathways in eukaryotes, or by photoreversal through continued
UV radiation. In TCR, the first step of repair is when RNA polymerase pauses
at the lesion site. (13)
Although the presence of the lesion is described as highly
destabilizing, the cis-syn thymine dimer lesion can be effectively incorporated

12
into B-DNA double helix structure, and maintain some hydrogen bonding to
the opposite strand (2). X-ray crystallographic methods have previously been
used to characterize the lesion within an overall helix, and comparisons to
regular B-form DNA indicate little overall disruption, only local distortion
within the helix (14). The fused ring structure participates in normal base
stacking, which is the primary source of DNA duplex stability. Quantitative
distortions within the helix are disputed, but X-ray crystallographic methods
from Park et al. show that the cis-syn thymine dimer creates a 30° bend in the
DNA towards the major groove, introducing a region of widened minor grove.
The bend angle is in contrast to previous NMR studies by Kim et al. that
report a 9° bend towards the major groove. (15) However, the data from Park
et al. is consistent with prediction of a 27° bend from mathematical modeling.
(14)
In other observations, there is a consensus. From the crystal structure
from Park et al., (Figure 4) the minor groove is pinched proximal to the 3’
side of the thymine dimer lesion, but long-range effects show the major and
minor groves are widened 3’ and 5’ of the lesion for the whole duplex. The
DNA is unwound 9°, in agreement with early structural estimates. The crystal
structures showed only minor deviations from regular B-form DNA, which
indicates that the overall DNA helix accepts the strain at the lesion site by
conformational stress immediately near the lesion, instead of distributing the
distortion throughout the duplex.

13
Figure 4. A crystal structure of the cis-syn thymine dimer lesion incorporated
into a duplex of DNA. Regular B-DNA is shown in green, and the thymine-
dimer containing duplex is shown in red. (A) Side view of the helical axis,
with 30 bend towards the major groove, away from the helical axis, is
indicated. (B) Top view of the duplex. Taken from Park et al., 2002. (15)

14
2.3 Thymine Dimer Repair
Lesion repair and removal necessitates activation of repair enzymes,
and although the distortions to the overall helix are not catastrophically
disturbing, the lesion site must be significantly different from regular B-form
DNA to trigger repair. The cis-syn thymine dimer can be repaired by
enzymatic photoreactivation in prokaryotes, or by nucleotide excision repair
(NER) in eukaryotes. (2)
Photolyases are a class of enzymes that can transduce external light for
catalytic purposes. Photoproduct-DNA (PD-DNA) photolyases exist in class I
and class II forms, identified only in prokaryotes and fungi. PD-DNA
photolyases contain two non-covalently bound chromophore moieties that
absorb environmental light of specific wavelengths (2). The photolyases can
absorb visible light and perform catalysis in a two-step process. The
association of the enzyme to the DNA duplex containing the CPD is referred
to as the “dark reaction”, and the dissociation of the enzyme from a repaired
DNA duplex is the “light reaction”. In the “dark reaction” activity is
performed without light of wavelengths 300 and 500 nm (photoreactivation
wavelengths). E. coli PD-DNA photolyase can bind to the DNA duplex in a
specific manner, at about 2 105 M
-1 (16). The relative specificity of the
binding suggests that the photolyase can target the site of CPD lesion, instead
of randomly binding other thymine bases. In the “light reaction”, a
chromophore transfers a blue-light photon to a flavin cofactor, which donates
the electron to the dimer lesion, breaking the cyclobutane ring. (16)

15
In eukaryotes, CPDs and other lesions resulting from UV-light damage
are repaired through nucleotide excision repair (NER). The purpose of NER
is to remove particularly bulky and helix-distorting lesions, as opposed to the
more specific base excision repair (BER) pathway. In BER, enzymes can
locate and excise individual bases, breaking the N-glycosyl bond between the
base and the sugar, allowing polymerases to fill the site. In NER, a brief
single-stranded DNA region is removed altogether.
In E. coli, the UvrABC endonuclease enzyme complex controls the
NER pathway. The E. coli system is well characterized, consisting of the Uvr
family of proteins: UvrA, UvrB, UvrC, and DNA helicase II, or UvrD. The
NER mechanism works through initial scanning of the genome by a Uvr-A,
UvrB complex. The UvrA subunit can detect distortions in the helix, such as
those created by CPDs. Upon recognition of a lesion site, UvrA dissociates
from the complex, and is replaced by UvrC, which dimerizes with UvrB. A
12-base pair long stretch of DNA is cleaved by the UvrB-UvrC complex;
UvrB creates a single-strand break four bases to the 3’ of the lesion site, and
UvrC breaks the phosphodiester backbone eight bases to the 5’ side of the
lesion. The action of removing the single-stranded oligonucleotide is
completed by DNA helicase II, which breaks the Watson-Crick hydrogen
bonds between the strands. The unaffected single-stranded DNA can be used
as a template for fresh synthesis by DNA polymerase I and DNA ligase (5).
The NER pathway in eukaryotes contains greater complexity than the
well-studied cascade in E. coli. The protein cascade is less well known for
16
higher eukaryotes, but the proteins involved in the E. coli system are
homologous to those in eukaryotes. Compared to E. coli, a large segment of
25-30 nucleotides are excised and replaced by DNA polymerase or (5).
2.4 Activation of Repair Mechanisms and Base Pair Opening
The cascade of protein recruitment has been well studied, but the exact
mechanism of initial enzyme recruitment to the lesion site is still debated. As
previously stated, the specificity of an enzyme complex to a lesion site
suggests that the repair enzymes are somehow alerted and summoned to the
damaged site, by a very sensitive mechanism.
A mechanism of repair enzyme activation may be dependent on a
kinetic signal. The dynamic motions of DNA in solution could be useful to
enzymes in detecting minor perturbations in normal motion of the duplex
structure. There are many forms of DNA motion: DNA bending occurs on a
slow timescale, whereas vibrations on the bases occur very fast (on the order
of picoseconds). Kinetic movements of DNA include spontaneous base
opening. In solution, bases within a helix structure are dynamic, and bases can
flip out to face the solvent using the glycosidic bond as a hinge. Base pair
opening is classified as a two-state model, characterized by an open state in
which the imino proton of guanine or thymine can exchange with the solvent,
and a closed state in which no exchange occurs due to involvement of the
imino proton in hydrogen bonding (17). The two state model is limited as it is
not known when imino exchange occurs during the flipping event. The open

17
base has a lifetime on the order of nanoseconds and capturing the exact
moment of proton dissociation is difficult. Exchange could occur from
flipping out the base containing the imino proton (guanine or thymine), or it
could occur from opening its Watson-Crick pair (cytosine or adenine). The
known value for a G•C base pair lifetime is approximately 10-50 ms, and the
corresponding lifetime for an A•T base pair is 1-5 ms. Similarly, the
equilibrium constant for open and closed states is known to be on the order of
10-6
– 10-7
(17).
However, the model of base pair opening can be useful in determining
the rate constant for opening and closing, as based on experiments suggested
by Guéron and Leory. The theory of imino exchange experiments is based on
the exchange of a proton between an imino proton bonded to a nucleotide
(Nuc) and a proton acceptor (acc): (18)
NucH + acc NucHacc Nucacc+H Nuc
- + acc
+H (1)
The first step is the complex formation, the second is the proton transfer (with
a rate ktr), and the third step is dissociation, leading to the final step of
completed transfer (with a rate kex). To complete the assumption of the
system, the pH of the solution must be smaller than the pKa of the nucleotide,
so that most nucleosides in solution are protonated and available for exchange.
In this case, the rate-limiting step is nucleoside deprotonation. Similarly, the
experiments also assume that the rate of proton exchange (kex) is equal to the
rate of transfer from nucleoside to acceptor (ktr). The rate of transfer (ktr) is
defined, according to standard collision theory, as the product of the fraction

18
of productive dissociations leading to transfer (F) and the rate of complex
formation, which is defined as the rate constant of collision (kcoll) and the
concentration of acceptor:
ktr = F*kcoll*[acc] (2)
The fraction of productive collisions is related to the pKa’s of the donor and
acceptor. The system parameters allow exchange time () to be defined as
ktr 1/i = kcoll[acc] /(1 + 10pK(nuc)-pK(acc)
) (3)
in which i refers explicitly to the exchange lifetime of a nucleotide free in
solution.
Within the double helix structure, the complexity increases, because
exchange is also dependent on the rate of base pair opening since exchange
cannot occur without an opening event. Exchange lifetime for a base in a
duplex (ex) is defined as the sum of:
ex= 0 + i(1 + 1/Kdiss)/ (4)
The exchange time (ex), is dependent on base pair lifetime (0), with several
corrections for the dissociation of the proton and involvement of the active
catalyst (included in a constant, ). (18)
With a sufficiently high catalyst concentration, exchange can occur for
each opening event, in which case the exchange time can be called the base-
pair lifetime. Exchange times have been found to be strongly dependent on the
concentration of an exchange catalyst. Extrapolating to infinite catalyst
concentration models an exchange event occurring with every opening (19).

19
In our experiments, the exchange rate (kex) is experimentally determined, and
from exchange rate (kex), we take the inverse to find base pair lifetime (0).
2.5 Nuclear Magnetic Resonance Techniques: 1D and 2D NOESY
Nuclear magnetic resonance spectroscopy (NMR) uses the magnetic
properties of nuclei to determine physical and chemical properties, including
information about the structure and dynamics of molecules. Every nucleus has
a specific resonance frequency depending on chemical environment, and from
this principle, structure can be characterized. Additionally, exchange
experiments can yield exchange rates through measuring the intensity of any
exchangeable peak as a function of mixing time.
The NMR instrument consists of three main components: a coil of
superconducting wire to create a strong magnetic field, a probe that can send
and receive radio-frequency signals, and a computer that can convert radio-
frequency signal that can be interpreted to yield information of chemical
environment. Within the core of the NMR, a strong magnetic field is produced
in the Z-direction (Figure 5). Nuclei with a dipole moment will align
themselves according to the magnetic field (B0) at equilibrium. Radio-
frequency signals, or pulses, are delivered to the sample in the X-Y plane,
perpendicular to the Z-axis, causing the nuclei to orient their magnetic
moments in that direction. As the nuclei return to equilibrium, radio frequency
signals are emitted, which can be Fourier-transformed into readable peaks.

20
A.
B.
Figure 5. (A) A schematic of the interior of an NMR spectrometer. The
applied magnetic field B0 is shown, oriented in the Z direction. The nuclei are
shown to have a dipole moment (), and a Larmour frequency (). (B) A
simple 90º pulse. Taken from Bishop, 2011. (20)

21
The DNA duplex structure can be elucidated through two-dimensional
NMR methods that take advantage of the overlaps in radio-frequency
emissions of neighboring nuclei in space. The simple one-dimensional NMR
experiment yields a spectrum with intensity on the Y-axis and frequency on
the X-axis. The sample is pulsed, and the data are collected over a mixing
time to yield the spectrum. In two-dimensional NMR, there are two mixing
times at which data is collected. In this case, the spectra are reported with two
frequency axes, corresponding to the two peak intensities found as a function
of two mixing times.
A common 2D method for structure characterization is Nuclear
Overhauser Effect Spectroscopy (NOESY). NOESY is a technique that shows
the Nuclear Overhauser Effect (NOE) interaction between nuclei, represented
as a cross-peak on the spectrum (Figure 6). NOE’s are observed between
nuclei in a through-space (rather than scalar through-bond) interaction, as
their resonances interact. Two nuclei must be less than 6Å apart to observe the
effect. In Figure 6, a sample NOESY can be generated from a sequence of
nucleic acids showing interactions between the ribose ring protons (H1’) and
the nitrogenous base protons (H6 for C and T, and H8 for A and G). The
radio-frequency signals reflect these interactions that can be transformed into
peaks relaying the same information. From these peaks, a “walk” connects
them. The H1’ proton has a 2D NOE cross-peak at a specific frequency that
aligns with the frequency of an H6 or H8 aromatic ring proton of a neighbor,
as well as an alignment with the H6 or H8 on its own ring. Each type of

22
proton has its own specific range of frequencies. The applications are diverse,
since every proton can yield cross-peaks, given that it has a neighbor to
interact with. An assignment of the cross-peaks in a DNA sequence involves
laborious understanding of both the molecular structure of the DNA (what
protons can interact with each other?), as well as the sequence (logically,
which protons belonging to which residues should interact?). Assigning an
NOE walk becomes challenging for large molecules because the peak density
is increased, and part of the assignment includes deciphering which peaks are
noise, and which peaks are relevant protons. The determination of significant
peaks requires careful assignment of the residues that “see themselves”, and
examining the spectrum along that resonance frequency for neighbors. In a
typical NOESY spectrum (Figure 7), a strong diagonal series of peaks is
observed, correlating to the internal interactions of a base. Cross-peaks off of
and symmetrical along the diagonal represent the NOE interactions. The
structure of a DNA duplex can be unambiguously elucidated from connecting
the cross-peaks of the nuclei, through the NOE walk mentioned previously.
Neighboring nuclei will share a cross-peak, and from the logical solution of
the spectrum, the structure can be determined.
23
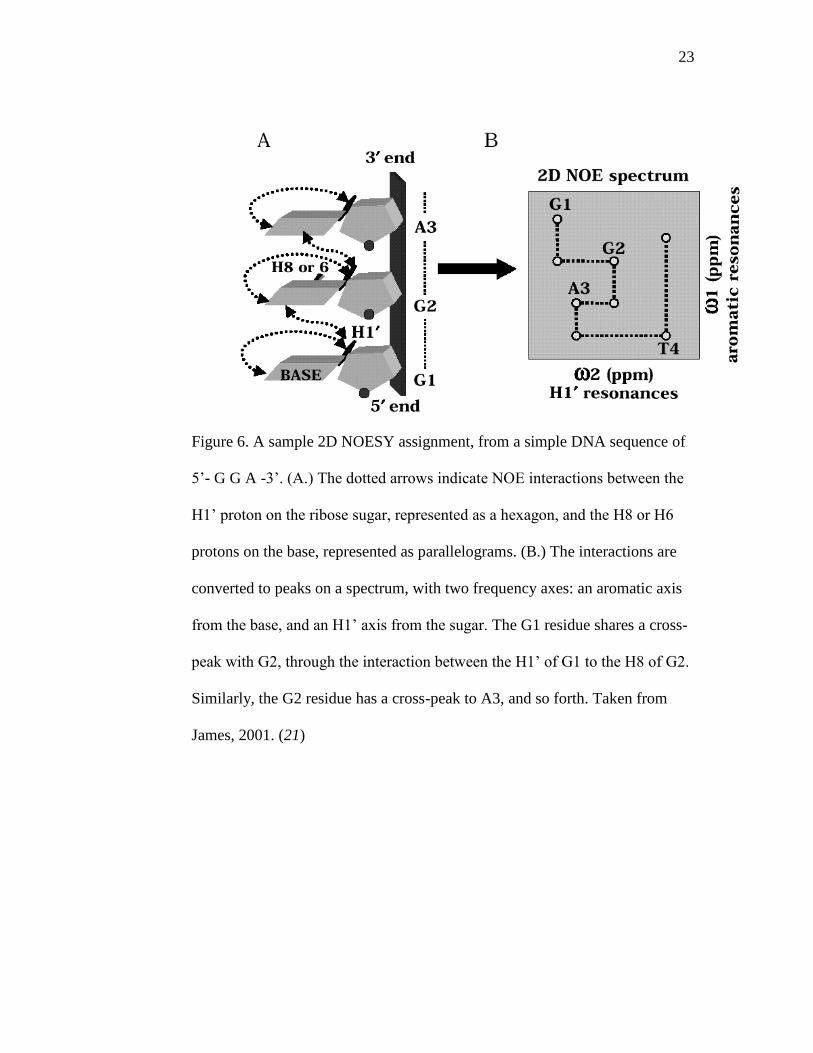
Figure 6. A sample 2D NOESY assignment, from a simple DNA sequence of
5’- G G A -3’. (A.) The dotted arrows indicate NOE interactions between the
H1’ proton on the ribose sugar, represented as a hexagon, and the H8 or H6
protons on the base, represented as parallelograms. (B.) The interactions are
converted to peaks on a spectrum, with two frequency axes: an aromatic axis
from the base, and an H1’ axis from the sugar. The G1 residue shares a cross-
peak with G2, through the interaction between the H1’ of G1 to the H8 of G2.
Similarly, the G2 residue has a cross-peak to A3, and so forth. Taken from
James, 2001. (21)

24
Figure 7. Sample 2D NOESY proton spectrum. The two frequency axes are
noted in ppm. The strong diagonal peak is noticeable, with cross-peaks
observed on either side. Taken from Fawzi et al., 2008. (22)

25
2.6. Exchange Experiments
To determine the opening lifetime (Equation 3), we will measure the
exchange rate of the imino protons. In order to determine exchange rate (kex),
NMR experiments can be used to magnetically label solvent protons, which
exchange with imino protons on the DNA duplex. In our experiments, solvent
protons are magnetically labeled by selective 180º inversion, which then
undergo catalyzed exchange with imino base protons on the duplex with and
without a cis-syn thymine dimer lesion.
Initial inversion-recovery experiments of the solvent water protons can
be accomplished to determine the frequency and magnetically label the
protons with precision. Relaxation rate (Rlw) of the water protons recovering
from the 180° pulse are related to the intensity of the water signal at
equilibrium (Wz) as a function of mixing time (tmix):
W (x ) Weq (1.0 E exRl w ) (5)
The water protons and imino protons relax to equilibrium simultaneously. The
exchange rate for each imino proton in the duplex can be found by fitting the
peaks to the variables exchange rate (kex) and imino proton relaxation rate
(Rli):
Iz(tmix )
Iz eq
1 Ekex
eRl itmix eRl w tmix
Rlw Rl i
(6)
The intensity of the imino peaks at and off equilibrium are Iz(tmix) and Iz,eq.
Other pertinent factors include the efficiency of water inversion (E), which is
ideally -2 for 100% efficiency. Exchange rate kex can be obtained for each

26
imino proton at multiple catalyst concentrations [B]. The rates of base pair
opening and closing (kop and kcl,) can then be found with the relationship:
1
kex
= 1
kop
kcl
kop
[B]* kB k
int (7)
This equation shows that the inverse of exchange rate is related to the inverse
of the rate of opening, plus a second term. The second term includes the rate
of closing divided by rate of opening (which is equal to Kop, the equilibrium
constant of opening), the correction term (for the dissociation of the proton
and involvement of the active catalyst), and a term for the catalyst
concentration B, the collision rate kB, and the rate of internal catalysis on the
base. So, the inverse exchange rate is equal to the inverse rate of opening, plus
the equilibrium constant of opening, with a correction factor.
A variety of base catalysts have been used in proton exchange
experiments, such as ammonia, trimethylamine and glycine. Ammonia has an
advantage over other catalysts in that it has an observable effect at a low
concentration (milli-molar range). Catalysts that require higher concentrations
can influence structural or dynamic properties of the duplex DNA, and skew
the equilibrium constant for closed and open states. Ammonia at the milli-
molar range has little effect on the overall duplex structure, and it has been
found to increase the relaxation rates of exchangeable protons by 50% (23).
An additional benefit is that all the ammonia protons exchange completely
with the solution so that no additional ammonia peak appears in the NMR
data.

27
The concentration of active ammonia catalyst [B] can be found by
using the Henderson-Hasselbalch equation, knowing the pKa of ammonia is
9.25 and the system pH is 7.5. Roughly 18 ammonia ions are active out of
1000, or 1 in 56.
In equation 7, kB is a term for the molecular collision rate and the
relative ability of the base to abstract the proton from the nucleoside.
kB
=kD
110pKa(Nuc)
pKa(B)
(8)
In our data, we approximated that our catalyst concentration was still
sufficiently low, and therefore the exchange rate is so slow that that the 1/kop
term is negligible thus the points can be fit to a line (24), where
kex
= k[B]*Kop
*[B]Kop
*Kint
(9)
This linear approximation dramatically simplifies the fit.
Considering the duplex in solution, the dimer presence is likely to
induce more subtle changes, such as increasing the rate of base pair opening,
and thus imino proton exchange. We hypothesize that the hydrogen bond
disruption from the formation of the lesion results in an increased rate of
imino proton exchange from the involved thymine bases. In our experiments,
a 10-mer oligonucleotide duplex is examined via NMR methods to examine
rate of imino exchange by an ammonia exchange catalyst.

28
3. MATERIALS AND METHODS.
3.1. Buffer Preparation
Experiments were carried out in an NMR buffer of 100 mM sodium
phosphate and 50 mM NaCl at pH 7.5. The buffer was prepared using dH2O
purified by a MilliQ Millipore filtration system. All chemicals used to prepare
the buffers were purchased from Fischer or Sigma Aldrich.
For the HPLC purification, 100% acetonitrile is used with filtered 25
mM ammonium acetate buffer at pH 7.5.
For ammonia, the constant kD is about 1.0 x10⁹ M
-1s
-1, the pKa of
guanine is 9.5, and the pKa of thymine is 9.9, while the pKa of the first
dissociable proton on the dimer is 10.65. For thymine kB is 1.8108 M
-1s
-1, for
guanine kB is 3.6108M
-1s
-1, and for the thymine dimer, kB is 0.3810
8 M
-1s
-1.
3.2. Sample Preparation
Unmodified DNA oligonucleotides were commercially synthesized by
phosphoramidite synthesis by Integrated DNA Technologies. The
oligonucleotides were obtained lyophilized in single-stranded form and
purified using reverse phase HPLC on an Agilent Technologies 1100 HPLC,
with a reversed phase 189.4 mm x 25 cm Zorbax Eclipse XDB-C18 column.
A 25 mM ammonium acetate aqueous buffer at pH 7.4 is used as an eluent
with acetonitrile to buffer against rapid pH changes. The flow was set to 3.7
mL/min and the maximum pressure is 350 bar. The oligonucleotides elute at
roughly 12 minutes at a 89.28% aqueous phase (ammonium acetate buffer)
29
and 10.7% acetonitrile, indicated by a tall, thick peak appearing at an
absorbance of 260-280 nm. For all the oligonucleotides used, the percent
aqueous phase was varied in a linear gradient between 95%-80%, with a low
percentage of acetonitrile. Single-stranded oligonucleotides containing a
thymine dimer were commercially synthesized by solid-phase
phosphoramidite synthesis by Midland Certified Reagent Company. The
thymine-dimer containing oligomers were purified by HPLC by Midland and
certified through ESI mass spectrometry. Following HPLC purification,
samples were lyophilized with a Labconco Freeze Dry System/Freezone 4.5
instrument, and resuspended in NMR buffer (see above). NaCl content was
originally reduced from 100 mM to 50 mM to enhance the NMR spectra.
Increased salt content adversely affects the spectra by increasing line
broadening. (25) The DNA samples were dialyzed overnight at 4°C in 1X
NMR buffer to reduce the residual ammonium and acetate content from
lyophilization. The DNA samples were divided into aliquots of 100 L and
then dialyzed with GE Healthcare Mini-dialysis tubes (250 L) at a 1 KDa
cutoff. Complementary strands were annealed by heating equimolar amounts
to 90°C on a heat block and cooling slowly to room temperature for 3 hours.
The concentration of duplex DNA was measured using a Varian
Cary50 Bio UV-Visible spectrophotometer at 260 nm using a 1 cm path
length in a quartz cuvette. Concentrations were found using Beer’s law using
the extinction coefficients provided by IDT/Midland in Table 1.

30
Table 1. Extinction coefficients.
Oligonucleotide Strand Extinction Coefficient (L/mol*cm)
KK3 95,200
KK4 104,000
KK3T<>T 77,000
KK5 106,300
KK6 121,700
KK5T<>T 88,700
Ammonia exchange catalyst solution was made up in a 4M stock.
Aliquots of 100 L DNA samples in phosphorus buffer were dialyzed
overnight against 1L of 40 mM ammonia buffer at 4°C. To achieve higher
catalyst concentrations of 80 mM, 100 mM, 120 mM and 200 mM, small
volumes of 4 M ammonia stock were titrated directly into the NMR tube and
mixed by pipetting. We titrated directly into the NMR tube to preserve the
concentration of DNA. Excessively pipetting the DNA sample would leave
residual sample on pipette tips, eventually decreasing the concentration of
DNA. Peak height in the NMR spectra is a function of proton concentration,
and we would observe shortening of the peaks with sample loss, interfering
with our analysis of catalyst effect.
3.3 NMR Sample Parameters
NMR studies were performed on a Bruker AVANCE Ultrashield 400
MHz spectrometer, using a 5 mm broad-band inverse (BBI) probe with Z
gradient. Samples were not spun. We completed one-dimensional and two-
dimensional homonuclear 1H-NOESY experiments in a 90% H2O and 10%

31
D2O 1X 100 mM sodium phosphate, 50 mM NaCl NMR buffer solution with
a total volume of 450 µL and a DNA concentration of 700 µM. D2O was
purchased from Sigma Aldrich. A percentage of deuterium is required in the
buffer even though it is not intended to label the DNA sample, because the
NMR uses a deuterium frequency-field lock to prevent the drifting of the
applied magnetic field B0. The NMR constantly monitors the deuterium signal
to maintain a constant frequency. Exchangeable and non-exchangeable
protons were first determined by running 1D-1H and 2D homonuclear
1H
NOESY experiments at 100% D2O. 5 mm NMR tubes were used, by Shigemi
Inc. All experiments were performed at 7°C. To ensure temperature control,
the samples were stored in a modified Frigidaire wine refrigerator, which kept
a constant 7°C. The DNA samples are sensitive to deviation from the desired
7°C; higher temperature would cause denaturation and the disappearance of
imino signals in our NMR spectra. Dropping below 7°C causes cold
denaturation, causing a similar distortion of the resultant NMR spectra. The
melting temperature of the DNA samples is suppressed due to the shortness of
the sequence and added presence of the dimer in KK3TT4. The pre-chilled
samples were then placed into the pre-chilled NMR, which had been slowly
cooled to 7°C.
All spectra were phased, cropped, Fourier-transformed and baselined
in the NMR Pipe Suite of programs. Spectral processing was competed with
MestReNova NMR software version 6.0.4-5850. The peaks were fit using a
non-linear least squares fitting algorithm in Matlab (Mathworks, Natick MA).

32
3.4. NMR Instrument Parameters
We obtained one-dimensional spectra by a 1D pulse sequence
provided by Bruker Avance version 02/05/31. The pulse program consisted of
a single 90 pulse. Data acquisition of the free induction decay (FID) was
obtained during the T2 relaxation. Water suppression was accomplished by a
Watergate 3-9-19 pulse sequence with gradients. The number of scans was
512 and the time domain was 32768.
NOESY experiments were run with a pulse program provided by
Bruker Avance version 00/02/07, 2D homonuclear correlation via dipolar
coupling. The water suppression used a Watergate 3-9-19 pulse sequence with
gradients. Mixing time was 0.15s, and the number of points was 2048, with 40
scans. The NOESY pulse sequence consists of three 90 pulses. The first
pulse equalizes the energy level differences in the sample proton population
through transverse magnetization. The pulse is followed by an evolution time
(t1) that allows the population nuclei to freely rotate, or precess, and the
chemical shift of the nuclei is obtained. The second 90 pulse is in the Z
direction. Mixing (m), or longitudinal magnetization transfer between nuclei,
follows. In NOESY, the magnetization transfer occurs through dipolar
interactions, creating the nuclear Overhauser effect (NOE). The magnitude of
the mixing time (m) is chosen specifically to be close to the magnitude of the
spin-lattice relaxation time (T1). Mixing time is also kept constant throughout
the NOESY. The third 90 pulse is in the XY plane, and data acquisition
follows (t2). During the data acquisition of the transverse magnetization, the

33
chemical shift of the nuclei is determined for the second time. The signals of
the protons were recorded as a function of two transverse magnetization times
t1 and t2. The two-dimensional Fourier transform gives a spectrum with two
frequency axes, as opposed to the one-dimensional spectrum with intensity
versus frequency (represented by chemical shift in parts per million).
Exchange rates were determined using magnetization transfer
methods. Water protons were magnetically labeled by selective 180º inversion
by a DANTE pulse sequence. The DANTE sequence contains a series of hard
and soft pulses completed by a hard Z-gradient to eliminate transverse
relaxation. Water suppression was accomplished with a jump-and-return
sequence, based off of the experiments of Plateau and Guéron in 1982 (24).
Time domain was optimized to 32000. With each exchange experiment, 40
separate NMR experiments were completed at a range of mixing times shown
in Table 5. In experiment 1, water was referenced, and in experiment 2, water
was inverted. Experiments 1 and 2 provide the data to calculate the efficiency
of water inversion (E). Experiments 3-16 probed the inversion and recovery of
water at a variety of mixing times to calculate water relaxation (Rlw) as
described in equation 5. The inversion-recovery experiment was first
performed to account for the water’s own relaxation to the Z-axis magnetic
field created by the NMR, B0. Experiments 17-40 applied a range of mixing
times to elucidate the exchange rate for the imino protons. The exchange rate
of the labeled water and the imino protons was obtained by measuring the
intensity of the imino peaks as a function of mixing time. The imino peaks

34
were fit to an exponential function to determine the exchange rate, as
described in equation 6. Experiments 1-40 were repeated for each catalyst
concentration.
Table 2. Experimental process and mixing time.
Experiment Number Mixing Time
(delay8)
Experiment
Number Mixing Time
(delay8) Efficiency of Water
Inversion (E)
Imino Exchange
(kex)
1 3s (Water
Reference) 17 520 us
2 3s (Water
Inversion) 18 600 ms
Water Relaxation
(Rlw) 19 10 ms
3 1.2 ms 20 150 ms
4 0.4 ms 21 1.5 ms
5 10 s 22 350 ms
6 1.6 s 23 500 ms
7 2.8 s 24 1 ms
8 3.6 s 25 250 ms
9 15 s 26 1.5 s
10 0.8 s 27 3 ms
11 3.2 s 28 75 ms
12 2 s 29 300 ms
13 4 s 30 20 ms
14 1.2 s 31 1 s
15 2.4 s 32 400 ms
16 6 s 33 100 ms
34 750 ms
35 200 ms
36 450 ms
37 50 ms
38 2 s
39 2.5 s
40 1.75 s

35
4. RESULTS
4.1 Experimental Sequences
First we characterized a double stranded 12-base pair oligo-
deoxynucleotide sequence KK56. The duplex sequence is shown in Table 3.
The parent and dimer duplex structures are identical except for the addition of
the cis-syn thymine dimer fusing T6 and T7.
Table 3. Sequence of 12-mer DNA Oligonucleotide Duplexes
Parent Duplex 5 and 6
Strand 5 5’– C1 C2 G3 T4 G5 T6 T7 A8 T9 G10 C11 C12–3’
Strand 6 3’– G24 G23 C22 A21 C20 A19 A18 T17 A16 C15 G14 G13–5’
Dimer Duplex 5TT and 6
Strand 5TT 5’– C1 C2 G3 T4 G5 T6 T7 A8 T9 G10 C11 C12–3’‡
Strand 6 3’– G24 G23 C22 A21 C20 A19 A18 T17 A16 C15 G14 G13–5’
‡
The center dot represents the location of the cis-syn thymine dimer lesion
site, such that T6 and T7 are fused by the cyclobutane ring.
We also characterized a second sequence, a double-stranded 10 base
pair oligodeoxynucleotide with the sequence shown in Table 4, originally
designed by John Stephen Taylor (12). Both duplex structures are identical
except for the addition of the cis-syn thymine dimer. In the thymine-dimer
containing 10-mer duplex, the lesion site occupies thymine 5 (T5) and
thymine 6 (T6).

36
Table 4. Sequence of 10-mer DNA Oligonucleotide Duplexes, Taylor et al.
Parent Duplex 3 and 4
Strand 3 5’– C1 G2 T3 A4 T5 T6 A7 T8 G9 C10 –3’
Strand 4 3’– G20 C19 A18 T17 A16 A15 T14 A13 C12 G11 –5’
Dimer Duplex 3TT and 4
Strand 3TT 5’– C1 G2 T3 A4 T5 • T6 A7 T8 G9 C10 –3’‡
Strand 4 3’– G20 C19 A18 T17 A16 A15 T14 A13 C12 G11 –5’
‡
The center dot represents the location of the cis-syn thymine dimer lesion
site, such that T5 and T6 are fused by a cyclobutane ring.
The parent complex (KK34) and dimer complex (KK3TT4) are non-
palindromic and were selected based on well-resolved one-dimensional NMR
spectra (Figure 10). A palindromic sequence was eliminated due to the
possible formation of hairpin structures during annealing. The sequence was
designed to be short in length, as a longer sequence would increase the
number of imino proton signals and result in increased probability of peak
overlap in the NMR spectra.
4.2 NMR Resonance Assignment
We used NMR spectroscopy during multiple stages of the experiment.
We obtained one-dimensional spectra of the sequences to acquire a snapshot
of the peak dispersion and resolution in the imino region, where “dispersion”
refers to how much the peaks are spread out, and “resolution” to whether two
neighboring peaks can be discerned as two separate signals. We used
exchange experiments to determine the rate of exchange (kex) by fitting the
one-dimensional spectra to Equation 6. We assigned the peaks of the 1D to

37
specific residues in the sequence from the two-dimensional homonuclear
NOESY experiment. The two-dimensional NMR experiment shows through-
space couplings that can reveal the DNA sequence. COSY (correlation
spectroscopy) experiments reveal the through-bond, scalar couplings between
neighbors. In contrast, NOESY (Nuclear Overhauser Effect Spectroscopy)
experiments reveal the through-space, non-scalar interactions between protons
that are less than ~ 6Å apart.
We identified exchangeable and non-exchangeable imino protons
through spectra collection in deuterium oxide (100% D2O) in 100 mM
phosphate buffer. In pure deuterated solvent, amino and imino hydrogens on
the duplex exchange with solvent deuterons, and the NMR signals associated
with these hydrogens disappear on the resultant spectra. Deuterium has a
unique magnetic moment compared to hydrogen, and since the instrument is
tuned to pick up the resonance frequency of hydrogen, deuterium-labeled sites
produce no detectable signal. The purely deuterated solvent samples served as
a reference to the water samples. The focus of our study is the imino protons
in the center of the DNA duplex, which are only available to the solvent
during base pair opening. The 100% D2O spectra show only the sugar and
aromatic base protons. In 95% water, the exchangeable imino base protons
were sequentially assigned through Nuclear Overhauser Effect (NOE) cross-
peaks in the 11-13 ppm region of the spectrum between neighboring imino
protons on adjacent bases. These assignments were confirmed by
connectivities to aromatic and sugar proton regions. The two-dimensional
38
homonuclear 1H-NOESY spectrum imino region was assigned for both parent
(non-dimer-containing) and dimer-containing complexes. The connection of
the sequential NOE connectivities, the “NOE walk”, was completed following
the H1 imino protons of guanine and the H3 iminos of thymine along the
sequence. Numbering conventions follow standard guidelines.
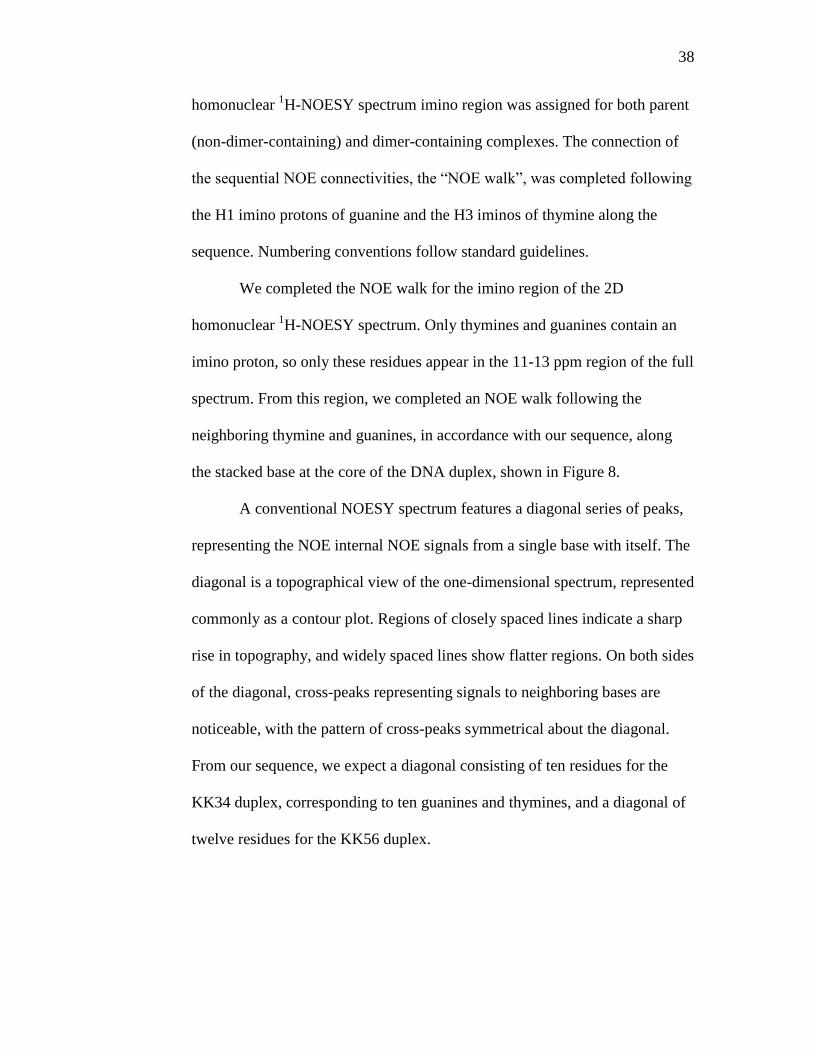
We completed the NOE walk for the imino region of the 2D
homonuclear 1H-NOESY spectrum. Only thymines and guanines contain an
imino proton, so only these residues appear in the 11-13 ppm region of the full
spectrum. From this region, we completed an NOE walk following the
neighboring thymine and guanines, in accordance with our sequence, along
the stacked base at the core of the DNA duplex, shown in Figure 8.
A conventional NOESY spectrum features a diagonal series of peaks,
representing the NOE internal NOE signals from a single base with itself. The
diagonal is a topographical view of the one-dimensional spectrum, represented
commonly as a contour plot. Regions of closely spaced lines indicate a sharp
rise in topography, and widely spaced lines show flatter regions. On both sides
of the diagonal, cross-peaks representing signals to neighboring bases are
noticeable, with the pattern of cross-peaks symmetrical about the diagonal.
From our sequence, we expect a diagonal consisting of ten residues for the
KK34 duplex, corresponding to ten guanines and thymines, and a diagonal of
twelve residues for the KK56 duplex.
39
Figure 8. Sample diagram of a trimer 5’- A G C -3’. The imino proton for
each complete base pair and the NOE interaction between them is highlighted
in blue. A NOESY spectrum of the imino region would reflect the NOE
interaction between each imino proton with the neighboring imino proton
directly above or directly below.

40
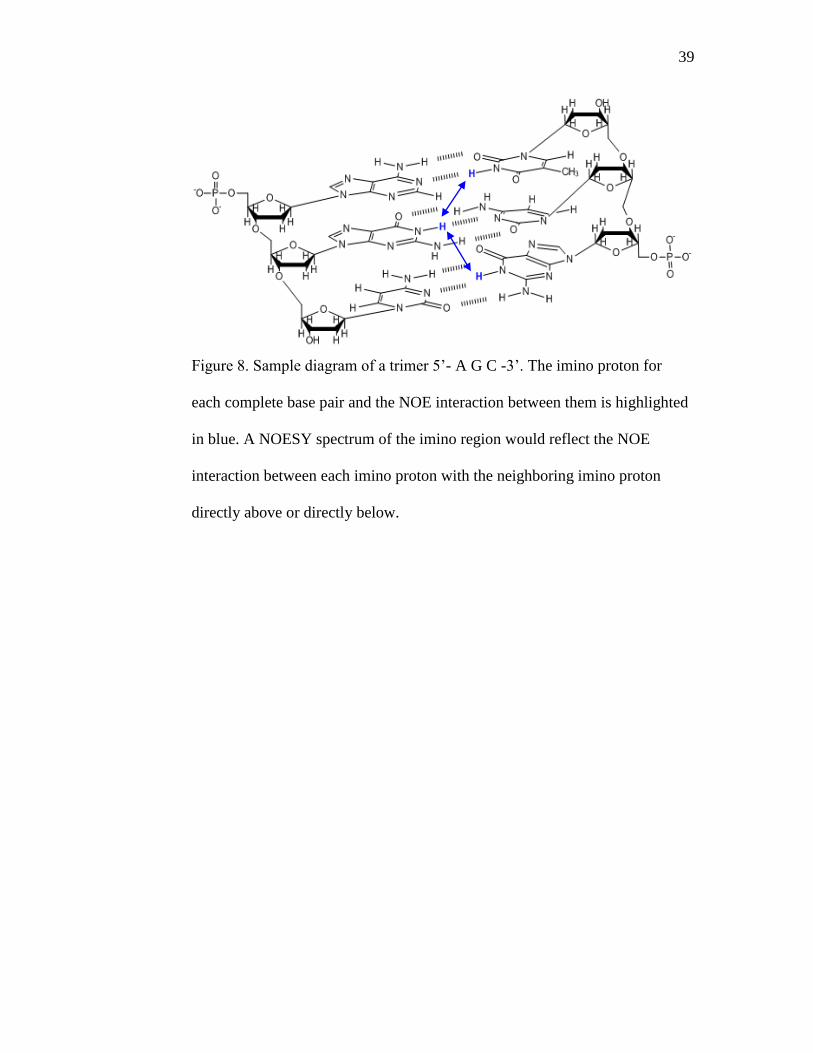
4.3 One-Dimensional Spectra
To predict the peak dispersion in the two-dimensional experiment, we
obtained one-dimensional 1H-NMR spectra for the 12-mer and 10-mer parent
and dimer complex. The full one-dimensional spectrum for the parent KK34 is
shown below (Figure 9). Several key features can be elucidated from the
spectrum, indicating correct data acquisition by the NMR experiment. The
most obvious feature of the spectrum is the solvent peak, which in our case is
water, at about 4.6 ppm. The tall, jagged peaks between 4.5 and 4.6 ppm
indicate that the water suppression pulse sequence is working, and the tallest,
most intense region of the water peak has been largely cancelled out. The
Watergate water suppression technique pulses the solvent 90 to the X-Y
plane, followed by a delay time (), followed by a second 90 pulse returning
the solvent signal to the Z-axis. The technique effectively cancels the water
signal, so that the peak displayed during data acquisition is “squashed”.
Without the technique, the water signal, which is present in a 106 :1 ratio with
the DNA solute, would be so enormous that it would distort the baseline, and
the DNA peaks would be lost in the feet of the water signal. In the figure
below, the water peak is suppressed and the baseline is horizontal, with very
little noise compared to the DNA signals. For DNA, the spectrum is expected
to include the presence of tall methyl peaks (~1-1.5 ppm), a range of sugar
peaks (1.5-2.5 ppm), and nitrogenous base peaks. On the bases, the amino and
aromatic ring protons should appear in the 6.5-8.5 ppm range, and the imino
protons should be isolated in the 11-13 ppm range, much farther downfield
than the majority of the signals.
41
Figure 9.1D spectrum of KK34, the parent strand, (90% H2O 10% D2O 1X
100mM phosphate NMR buffer at 7°C) with typical regions of a DNA
spectrum labeled.

42
From the full spectrum of KK34, regions typical of a DNA oligomer
are indicated. The thymine methyl protons, identified by an upfield,
characteristic triplet, are strongly observed at 0.8 ppm. We expect the sugar
protons H2’ and H3’ in the region of 2-2.5 ppm, and although the peaks were
not explicitly assigned, characteristic peaks can be identified in that region,
with some overlap. H4’, H5’ and H5’’ are expected at 4-4.5 ppm. H4’, H5’
and H5’’ are often observed to have poor dispersion and further two-
dimensional COSY or TOCSY experiments would be needed to clarify the
signals. The water peak at 4.7 ppm is suppressed, but the signal is still large
enough to interfere with the sugar protons H1’ and H3’, which would be
expected downfield of water, at around 5.7 and 5 ppm respectively. Amino
protons from cytosine, guanine and adenine are visible flanking the aromatic
ring protons. The aromatic region, previously assigned by John Stephen
Taylor for this sequence, was not assigned here. (12) As the furthest
observable downfield cluster of signals, the resolution of the imino region is
not impeded by any other interfering signals.
We collected one-dimensional spectra for each sequence. The imino
region (11-13 ppm) was isolated using Bruker Topspin, and the peaks in the
region were hand phased and evaluated for the characteristics of dispersion
and resolution. The peaks could not yet be assigned to thymine and guanine
residues; the assignment comes from the two-dimensional NOESY. A sample
unassigned region of KK34 is shown below. (Figure 10)

43
Figure 10. Imino region of KK34, with no assignment. Peaks are well
resolved, with nine individual peaks, including one short, broad peak probably
corresponding to the end residues.

44
4.4. Two-Dimensional NOESY Spectra
As previously discussed, NOESY is a 2D NMR technique that reveals
Nuclear Overhauser Effect (NOE) interactions between nuclei, represented as
a cross-peak on the spectrum. NOE’s are observed between nuclei in a non-
covalent, through-space interaction, as their resonances interact in the
magnetic field. Following the cross-peak connectivities can indicate the
spatial configuration of the atoms in the molecule.
The two-dimensional homonuclear 1H- NOESY experiment of the
KK56 parent reveals the cross-peaks between the residues (Figure 11). At first
inspection, the imino peaks are very well resolved. The diagonal, which
represents the NOE interactions of the residues with themselves, has sharp
points, and the center of each peak is easily identified. The two-dimensional
NOESY spectrum can be viewed as a topographical contour plot of the one-
dimensional spectrum, with the addition of symmetrical cross-peaks
indicating NOE interactions about the diagonal. The symmetry indicates good
phasing. The noise of the spectrum is very low, as evidenced by the complete
assignment of all cross-peaks off the diagonal. The ability to follow the NOE
interactions from G23, to G3, to T4, etc, to the last residue G14, indicates that
the DNA sample is annealed. The ends are not observed, but they can fray in
solution and lose their neighboring protons to the solvent on the timescale of
the NOESY experiment.

45
Figure 11. Expanded imino proton region (12-14 ppm) of 2D NOESY
spectrum of KK56 d(CCGTGTTATGCC)d(GGCACAATACGG), in 90%
H2O 10% D2O 1x NMR buffer at 7°C. The path indicates the NOE walk, or
the successive imino protons. For example, T6 has cross-peaks to T7 and G5,
as we would predict from the sequence (Table 3).
46
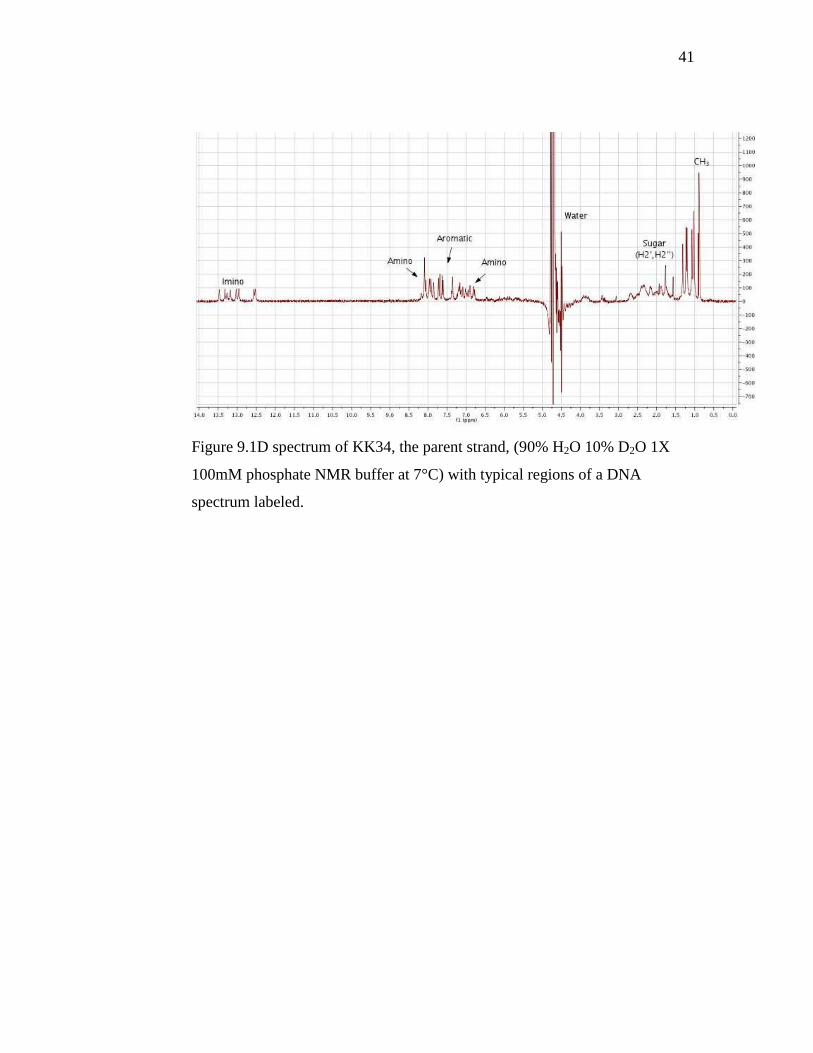
The two-dimensional homonuclear NOESY of KK5TT6 (Figure 12) is
less sharp compared to the parent NOESY. The signals of the cross-peaks are
much shorter than the signals in the diagonal. In order to see the cross-peaks
at all, we lowered the threshold significantly, allowing bands of noise to
appear on the spectrum as smears at 12.8, 12.55 and 12.1 ppm. Toggling the
threshold could eliminate the noise to produce a clean spectrum, but some of
the cross-peaks would have been lost. Since the noise floor was lowered, the
peak tips of the diagonal are truncated. To perform the NOE walk, two
separate spectra were used; one spectrum containing the peak tips and one
spectrum containing the complete set of cross-peaks. Due to the limitations of
Bruker Topspin, the two spectra could not be overlaid, and instead had to be
manually compared. Only the spectrum containing the complete set of cross-
peaks is shown below.
In comparing the parent to the dimer, the thymine dimer 5’ T6 residue
is a strong, clear signal farther upfield than all of the guanines in the sequence,
and has shifted significantly from its position in the parent. The NOESY also
highlights the clustered overlap of G23, T17, G14 and T7. T4 and T9 are
overlaid, and in the case of G14 and T7, the cross-peaks indicate very slightly
different positions to the peak, but the resolution of the spectrum was too poor
to adequately distinguish the two. There is some overlap at the base of G10
and G5, but the peaks appear to be sufficiently resolved.

47
Figure 12. Expanded imino proton region (12-14 ppm) of 2D NOESY
spectrum of KK5TT6 d(CCGTGT<>TATGCC)d(GGCACAATACGG), in
90% H2O 10% D2O 1x NMR buffer at 7°C. The path indicates the NOE walk,
among the imino protons. For example, T6 has cross-peaks to G5 and T7.
Smears of noise are noted at 12.8, 12.55 and 12.1 ppm.
G 14

48
In two-dimensional homonuclear NOESY of KK34 (Figure 13),
similarly to the KK56 sequence, we attributed peaks to each of the non-end
thymine or guanine residues. We did not observe diagonal peaks for the end
guanines involved in the termini base pairs C1•G20 and C10•G11, due to
fraying in solution and rapid exchange with water. It is possible the gap in
between T14 and G2 contains the end peaks, but they might be too short and
broad to appear on the spectrum with a minimum intensity threshold set to
eliminate background noise. They could also be under other peaks, but it is
hard to tell from the two-dimensional spectrum alone; the intensity is difficult
to evaluate by the contour lines, and presently all the peaks on the diagonal
are intense. The one-dimensional spectrum we acquire later will aid in solving
the dispersion issue. The residues G2 and G9, and T3 and T17 are closely
clustered, but we can still resolve the peak apexes from the contour plot, and
these appear to be sharp. The cross-peaks in the KK34 spectrum are also much
shorter than the diagonal peaks, and we lowered the noise threshold to resolve
them. As a result, bands of noise are vaguely present at 13.0 and 13.35 ppm.
However, the resolution of the cross-peaks is sufficient to differentiate them
from noise peaks.

49
Figure 13. Expanded imino proton region (12-14 ppm) of 2D NOESY
spectrum of KK34 d(CGTATTATGC)· d(GCATAATACG) in 90% H2O 10%
D2O 1x NMR buffer at 7°C. The path indicates the NOE walk, or the
successive imino protons. For example, T6 has cross-peaks to T5 and T14.
Noise appears at 13.35 and 13.0 ppm.

50
The two-dimensional homonuclear NOESY of KK3TT4 (Figure 14) produced
an observable change from the parent NOESY, confirming the presence of the
dimer in KK3TT4. The loss of aromaticity to T5 and T6 caused upfield shifts
of both resonances, but with a larger difference observed in T5. T5 is shifted
much farther upfield (11.78 ppm) from the normal chemical shift range of a
canonical Watson Crick A•T basepair (26). T6 has a smaller chemical shift
change compared to T5, but its position is again closer to the guanine residues
than would be expected for a canonical A•T basepair. The ends are again
unresolved but they may be between T14 and G2 at 12.75 ppm, as expected
from the parent. The ends are likely to be buried under the much stronger T14
and T6 signals. T14 and T6 appear to be tightly clustered, but there is no
significant interference. We observed that the T3 and T17 resonances shift
from the parent complex. Both T3 and T17 residues are on the 5’ side of the
dimer, which suggests a greater perturbation upstream from the dimer than
downstream. The effect is supported by the relative lack of movement of T8,
the only thymine residue on the 3’ side of the dimer.

51
Figure 14. Expanded imino proton region (12-14 ppm) of 2D NOESY
spectrum of KK3TT4, d(CGTAT<>TATGC)· d(GCATAATACG) in 90%
H2O 10% D2O 1x NMR buffer at 7°C.

52
4.5. Assigned One-Dimensional Spectra
Using the data from the NOESY experiments, we assigned the
sequential connectivities to cross-peaks and diagonal peaks to residues in the
sequence.
We sequentially assigned the KK56 parent peaks from an expansion of
the imino region (Figure 15). Superficially, nine distinct peaks are visible. For
a 12-mer we expect 12 peaks, which suggests that one or more peaks represent
more than one residue. The peak height is homogenous, consistent with the
fact that the intensity of the signal is directly proportional to the number of
protons. The peaks at 13.25 and 12.55 ppm are roughly double the height of
the neighboring signals, which we interpret as the peaks that represent
multiple residues. However, the peaks appear well dispersed on first
impression, and we observe little overlap. The critical residue of T6, which
will later be involved in the thymine dimer lesion, is neatly isolated at
13.7ppm. The signal to noise ratio is very good, and we observe that the
baseline is completely horizontal with the DNA peaks rising up sharply.
53
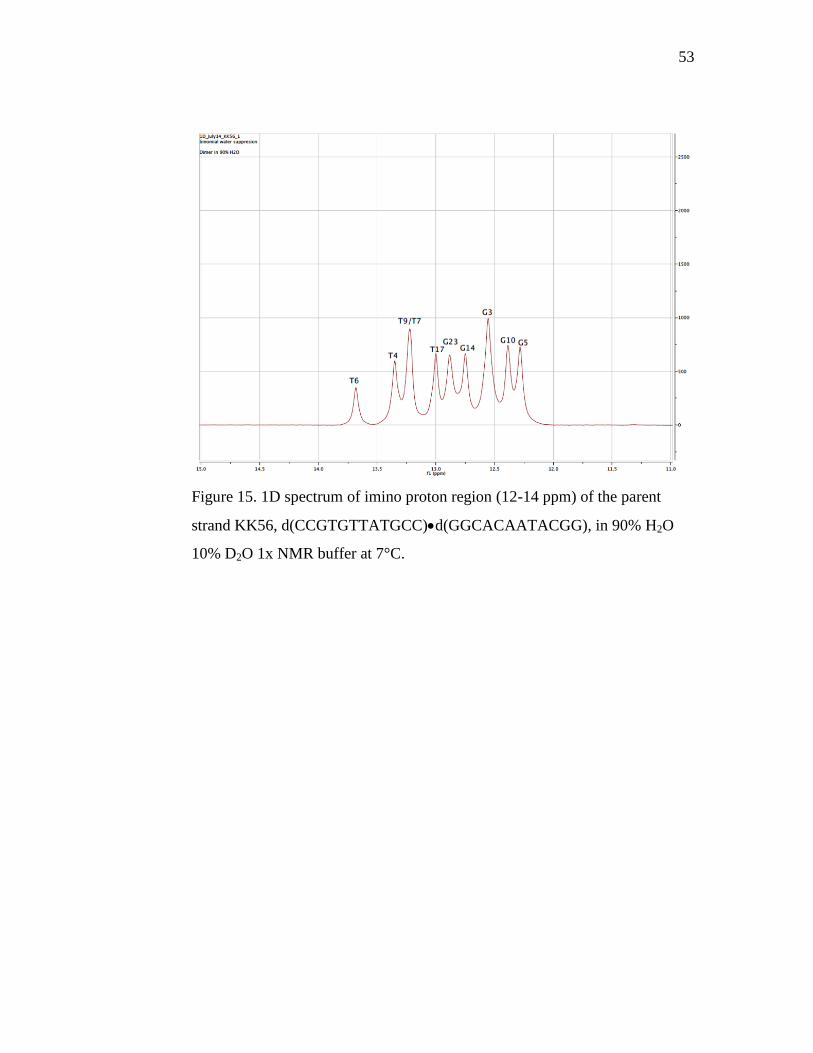
Figure 15. 1D spectrum of imino proton region (12-14 ppm) of the parent
strand KK56, d(CCGTGTTATGCC)d(GGCACAATACGG), in 90% H2O
10% D2O 1x NMR buffer at 7°C.

54
Even though the isolation of T6 is ideal, we observe T7 is overlapped
with T9. The T7/T9 peak also partially overlaps with the T4 residue. T7, T9
and T4 are all towards the center of the sequence, and have very similar
electronic environments. Towards the center of the imino region, T17, G23
and G14 are spaced very closely, and the three signals overlap significantly
close to the baseline. Even though each signal is clearly resolved, the peaks
themselves are grouped tightly. When exchange catalyst is added, we expect
these peaks to broaden, and the tight cluster of signals could prove
problematic once the secondary experiments are performed, since we want to
obtain rate constants for every residue. T17 is buried in the center of the
sequence, and has the furthest upfield shift, as expected. G23 and G14 are the
penultimate bases in the sequence, and we expect them to have very similar
chemical environments. G3 is uncharacteristically intense for a single residue
signal, compared with a signal like T6. We interpreted the intensity of the
signal to contain the unassigned end bases, G23 and G13. The residues are
buried underneath, increasing the number of protons represented and
significantly adding to the peak height. We expect the end residues to be
missing or too broad to be defined based on the consistent lack of end residues
in the parent/dimer sequences. G5 and G10 are the furthest upfield signals,
corresponding to residues buried close to the middle of the sequence.
We acquired one-dimensional spectra for the dimer duplex KK5TT6
(Figure 16). In comparing the imino region of the parent and dimer 12-mer
duplex spectra, we observed the thymines associated with the dimer (T6 and

55
T7) exhibit noticeable shifts in frequency. In the dimer complex, T6 migrates
1.58 ppm upfield, compared to its position in the parent. T7 migrates a shorter
distance, but the residue does shift 0.46 ppm upfield. In the parent spectrum,
T6 is the furthest downfield peak, and in the dimer strand, T6 is the furthest
upfield, surpassing the normal range for thymine residues, and even guanine
residues. Previous studies document a significant upfield shift of the dimer
residues, so the T6/T7 shift confirms the presence of the dimer in our
sequence. The isolation of T6 from the other peaks on the diagonal is ideal for
subsequent peak fitting, especially paired with its isolation in the parent
duplex. However in both the parent and dimer sequences, T7 is overlaid with
a second peak. In the parent, T7 and T9 overlap, and in the dimer, T7 and G14
are overlaid. The position of T7 is not ideal, especially compared with the
clarity of T6. Additionally, G23 and T17 are almost completely overlapping
with the G14/T7 peak, and the broadness of these peaks close to the baseline
suggest that the ends are buried underneath. Similarly G10 and G5 are
partially overlapping and T4 and T9 are completely overlapping. The vast
majority of the peaks in sequence KK56/KK5TT6 will be extremely difficult
to resolve and fit once they broaden in the presence of exchange catalyst.
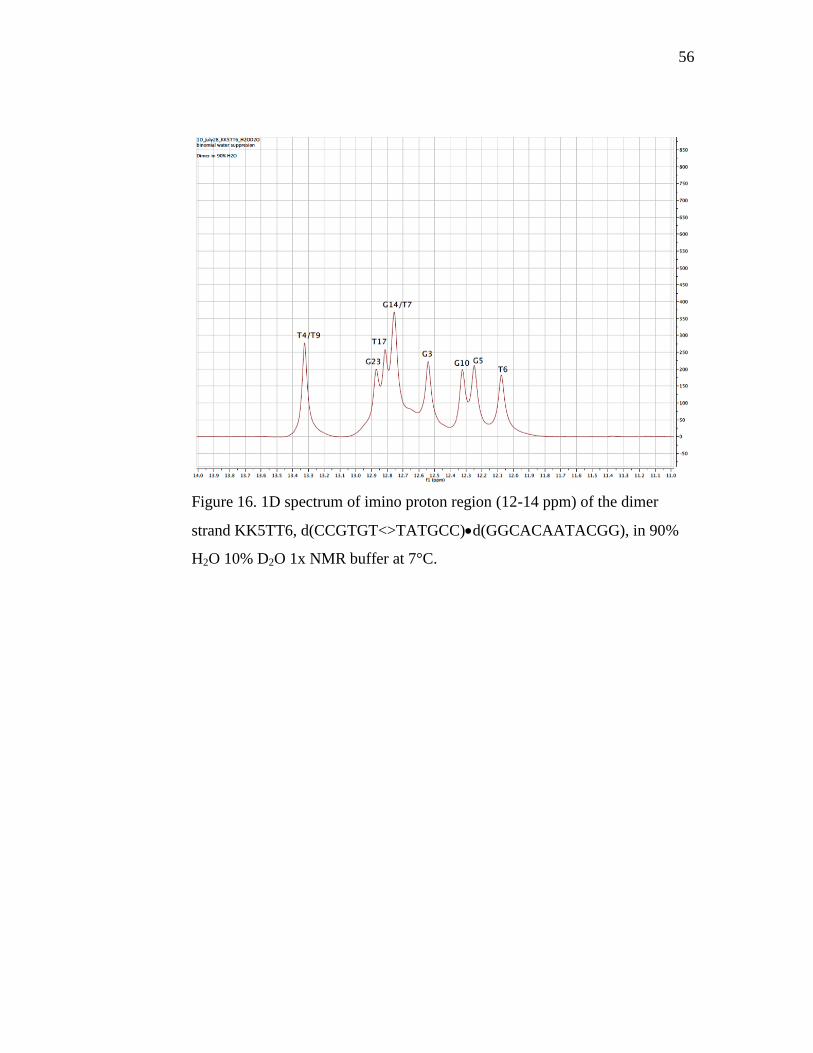
56
Figure 16. 1D spectrum of imino proton region (12-14 ppm) of the dimer
strand KK5TT6, d(CCGTGT<>TATGCC)d(GGCACAATACGG), in 90%
H2O 10% D2O 1x NMR buffer at 7°C.

57
A summary of chemical shifts we observed is in Table 5 below.
Table 5. Chemical shifts (in ppm) of imino proton resonances in the
parent (KK56) complex versus dimer complex (KK5TT6).
Base
Parent (KK56) -
NH
Dimer (KK5TT6)
-NH
ppm
G24 12.57 12.58 0.01
G23 13.90 12.87 -1.03
G3 12.57 12.57 0.00
T4 13.35 13.37 0.02
G5 12.10 12.26 0.16
T6 13.70 12.09 -1.61
T7 13.23 12.74 -0.49
T17 13.01 12.83 -0.18
T9 13.23 13.37 0.14
G10 12.40 12.33 -0.07
G14 12.76 12.77 0.01
G13 ~ 12.75 (un-resolved) N/A
Due to the overlapping problems of the critical T7 residue in the
KK56/ KK5TT6 sequence, we considered the sequence of KK34/KK3TT4.
The sequence was shortened by two base pairs to decrease the overlap and
remedy the crowding of the imino signals. The KK34 sequence was originally
studied by John Stephen Taylor et al., and the two-dimensional spectrum has
been previously solved in the aromatic region, but notably not in the imino
region.
The one-dimensional spectrum imino region of KK34 (Figure 17)
coincides with our expectation of at least eight distinct peaks for the sequence.

58
We resolve nine peaks, but the ends are expected to have poorly resolved
peaks, which is consistent with the 2D spectrum. We assigned peaks to each
of the six thymine residues, and two of the four guanine imino peaks. The
guanine peaks are tall, but not so tall as to expect the peaks to represent
multiple residues. The 1D shows a broad, flat peak at 12.75 ppm, between
T14 and G2, which can be attributed to the unaccounted guanines of the
terminal pairs C1•G20 and C10•G11 pairs. In the case of KK34, the end peaks
are distinct, and are not hidden under the peak of another residue.
Importantly, the spectra show that the thymines involved in the dimer,
T5 and T6, are easily identified. We observe that T6 has some overlap with
T14, but the peaks are sufficiently resolved. The thymine residues flanking
T5/T6 have very similar chemical environments, indicated by the close
proximity of their peaks (T8, T3, T17). G2 and G9 also contain a high degree
of overlap, but the peaks are distinct and the behavior of the guanine residues
is not critical to the experiment.

59
Figure 17. 1D spectrum of imino proton region (12-14 ppm) of the parent
strand KK34, d(CGTATTATGC) d(GCATAATACG), in 90% H2O 10%
D2O 1x NMR buffer at 7°C.

60
We obtained one-dimensional spectra for the dimer duplex KK3TT4
(Figure 18). The imino region of the dimer duplex shares the same spectral
resolution as the parent complex with little broadening of the signals. We
attributed the minimum of eight peaks to each non-end residue. Importantly,
we assigned the 5’ end dimer-containing thymine, T5, to a peak abnormally
upfield of the expected thymine and guanine region. Recall that in the
KK5TT6 one-dimensional spectrum, the upfield-shifted T6 was at 12.1 ppm,
close to the guanine residues. In KK3TT4, the upfield-shifted T5 is close to
11.8 ppm, and is within 0.6 ppm of the closest guanine residue, corresponding
to a significant gap in the spectrum. The thymine fused to T5, T6, also has an
observed upfield shift compared to the parent. T17 and T3 have very similar
chemical environments as observed by a large amount of spectral overlap, but
the peaks are just dispersed enough for sufficient resolution. T14 and T6 also
share some overlap. T14 is almost double the heights of the neighboring
peaks, so we can assume that the guanines in the end pairs of C1•G20 and
C10•G11 are buried underneath.
A summary of the chemical shifts for the KK34/KK3TT4
exchangeable imino protons is listed below (Table 6). The T5 residue
undergoes a 1.66 ppm shift upfield from parent to dimer, and T6 undergoes a
0.25 ppm upfield shift. The changes in chemical shift per guanine or thymine
residue can be mapped onto a model of our sequence.
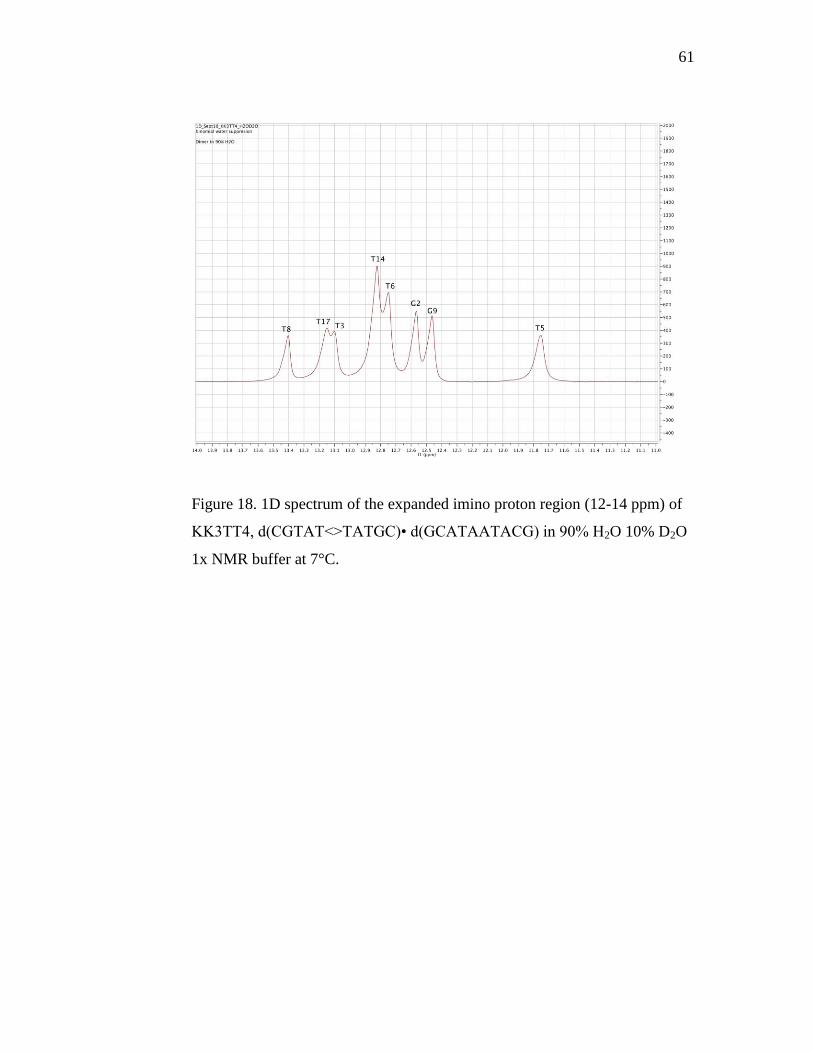
61
Figure 18. 1D spectrum of the expanded imino proton region (12-14 ppm) of
KK3TT4, d(CGTAT<>TATGC)• d(GCATAATACG) in 90% H2O 10% D2O
1x NMR buffer at 7°C.

62
Table 6. Chemical shifts (in ppm) of imino proton resonances in the
parent (KK34) complex versus dimer complex (KK3TT4).
Base, 5’ 3’
Parent (KK34) -
NH
Dimer (KK3TT4)
-NH
ppm
G2 12.57 12.58 0.01
T3 13.23 13.1 -0.13
T5 13.44 11.78 -1.66
T6 13.02 12.77 -0.25
T8 13.3 13.4 0.10
G9 12.52 12.48 -0.04
G11 ~ 12.75 (un-resolved) N/A
T14 12.96 12.92 -0.04
T17 13.17 13.18 0.01
G20 ~ 12.75 (un-resolved) N/A
4.6. Exchange Experiments
To determine the rate of base pair opening, we used one-dimensional
1H NMR to monitor changes in the imino region of the parent and dimer
duplex in ammonia catalyst. We titrated ammonia directly into the NMR tube,
and at each concentration, we obtained1D spectra at a range of mixing times.
Initially, we referenced and inverted the water peak. From the inversion
experiment, we obtained the efficiency of inversion, E. In the ideal case, the
value of E is -2. We relaxed the water peak at a range of mixing times from
1.2 ms to 15 s. The intensity of the water peak (W) is plotted versus mixing
time (Figure 19).

63
Figure 19. Water inversion. The trend indicates that the water peak is
successfully inverted, and then relaxes back to the applied magnetic field B0
(equilibrium) at full intensity, reaching a plateau with increased mixing time.

64
The water relaxation, Rlw can be found using Equation 5.
W (x ) Weq (1.0 E exRl w ) (5)
Where x represents mixing time, E is the efficiency of water inversion and Rlw
is the relaxation of water. The process is described by Equation 1, from which
the efficiency of inversion, E, and the relaxation rate of the water protons, Rlw,
can be obtained. On our instrument, E ranges from -1.7 to -1.97, and Rlw
ranges from 0.46-0.55.
In solution, base pairs in the DNA duplex “breathe” and bases open
periodically to the solvent. The previously bonded imino protons are exposed
to the solvent, and the imino protons exchange with the inverted water protons
with a rate kex, causing the peaks to decrease in height for about 0.5 s.
Simultaneously, the water and imino protons relax with rates of Rlw and Rli
respectively (Eq. 6), and the imino peaks return to their original heights. The
change in imino proton height as a function of mixing time is graphically
represented in Figure 20. The amplitudes of the imino peaks change as a
function of mixing time as base protons exchange with solvent protons.
At 40mM ammonia catalyst, the parent KK34 maintained excellent
peak dispersion at a range of mixing times from 520 s to 2 s. Line
broadening did not interfere significantly with the peak resolution.

65
Figure 20. KK34 parent imino proton spectra as a function of mixing time, in
40 mM ammonia catalyst. The peaks change in intensity as a function of
mixing time, reaching a minimum around 0.5 s. Note that spacing on the
mixing time axis is not proportional to time.
Mixing Time (s)
ppm
Intensity

66
A similar plot can be made for the dimer sample (Figure 21). In comparison to
the parent KK34 imino proton spectra, the KK3TT4 dimer imino proton
spectra rapidly decay in peak height with mixing time. The drop in peak
amplitude is significant in the longer mixing times, around 0.5 s. At short
mixing times (0.01 s), the peaks are at their greatest amplitude indicating that
few protons have exchanged with the labeled water. The imino protons then
recover in height at long mixing times (2 s). In the dimer sample at 40 mM
ammonia catalyst, peak resolution became poor around 0.5 s, when line
broadening distorted the peak resolution of the residues G2 and G9, at the
center of the sequence. At 40 mM some peaks at the center of the sequence
were slightly negative, these peaks likely correspond to the ends, which are
already frayed and exchanging quickly with the solvent, as predicted by the
two-dimensional and one-dimensional experiments.
At each increase in the catalyst concentration, we measured a series of
one-dimensional spectra in the imino region over a range of mixing times. As
the catalyst concentration increases, we expect existing imino peaks to
decrease in height or disappear altogether in a quick relaxation to equilibrium.

67
Figure 21. KK3TT4 dimer imino proton spectra as a function of mixing time,
in 40 mM ammonia catalyst. The change in peak heights is observed at a
range of mixing times, with some peaks at a negative intensity at 0.5 s.
Mixing Time (s) ppm
Intensity

68
Individual imino proton peaks can be more meaningfully represented
in an exchange graph, with peak intensity as a function of mixing time. The
curves generated for each imino peak can be fit to Equation 5, since we know
the efficiency of water inversion (E). The equation fits the variables of the
exchange rate (kex) and the imino proton relaxation rate (Rli).
We converted the stacked plot of one-dimensional imino region
spectra to an exchange curve for KK34 (Figure 22) by integrating the area
under each curve. The peaks are arranged in order of most downfield to most
upfield. The broad, flat end peak observed in 100 mM phosphate buffer at
12.75 ppm, between T14 and G2, was not observed at 40 mM ammonia, due
to rapid exchange. At a catalyst concentration of 40 mM ammonia, none of
the parent imino protons were negative in intensity at any mixing time. All of
the imino peaks follow the same trend in intensity with mixing time. The
imino protons were observed to have a peak minimum at 0.5 s. At the short
exchange times between 0 and 0.5 s, peak height rapidly decreased, and
slowly recovered from 0.5 to 2.5 s.

69
Figure 22. Individual imino protons of KK34 in 40mM ammonia catalyst.
Peaks are labeled according to chemical shift. All of the imino residues
remained positive throughout the range of mixing times. T3, G2 and G9
dropped to the lowest observable intensities.
T5
T8
T3
T17
T6
T14
G2
G9

70
We converted the stacked plot of the dimer KK3TT4 one-dimensional
imino region spectra to an exchange curve (Figure 23). The peaks are
numbered sequentially in order of most downfield to most upfield, reflecting
the changes in chemical shifts of the residues from the parent sequence to the
dimer. As in the parent, no end residues were distinguishable due to rapid
exchange and overlap with the guanine resides G2 and G9. At a catalyst
concentration of 40 mM ammonia, some peaks inverted partially, including
G2, T17, T3, T5 (the 5’ end dimer thymine) and G9. T6, the other dimer
residue remained positive at all mixing times. The inversion of residues in the
sequence was varied, but with more catalyst concentration points, a more clear
trend develops. All of the imino peaks follow the same trend in intensity with
mixing time as observed in the parent spectra.

71
Figure 23. Individual imino protons of KK3TT4 in 40 mM ammonia catalyst.
Peaks are labeled according to chemical shift. Noticeably, T5 has a negative
intensity at a low range of mixing times, whereas T6 remains completely
positive. We observed the residues of G2, T3, T17, T5 and G9 to have
negative peaks.
T8
T17
T3
T14
T6
G2
G9
T5

72
We recorded 1Ds at ammonia catalyst concentrations of 40, 80, 100,
120 and 200 mM in KK34 and KK3TT4. (Figure 24) Although the peaks are
not normalized in intensity to the phosphate buffer sample, the trend is clear.
At 40 mM the peaks are well-resolved and indistinguishable from the
phosphate buffer one-dimensional spectra taken previously (Figure 17). The
end residues at 13.05 ppm are visible at this concentration. At 100 mM
ammonia, there is significant shortening of the peaks, but little broadening.
The penultimate guanine residues G2 and G9 observed at 12.7 ppm begin to
shorten considerably, becoming very difficult to resolve. At catalyst
concentrations higher than 40 mM, the end peaks are indistinguishable from
the baseline. We noticed that the NMR tube was cracked at the top, and the
solution volume was dropping due to evaporation. Since ammonia is a volatile
chemical, we dialyzed the parent sample in 120 mM ammonia, and then
recorded spectra for 120 mM and 200 mM. Unfortunately, the dialysis greatly
diluted our sample, and as a result, the peaks for these titration points are
shorter than expected. At 120 and 200 mM, all the peaks are uniformly
broadened and shortened into the baseline. Since some very broad peaks are
still observed at 200 mM, we have yet to hit the catalyst threshold of
extremely fast exchange, and can still increase concentrations to 400 mM and
800 mM ammonia.

73
Figure 24. Overlaid imino regions of KK34 for five increasing catalyst
concentrations. As catalyst concentration is increased, the peaks become
uniformly shorter, with the exception of the 40 mM ammonia sample. The
penultimate guanine residues are broadening, and the peak dispersion,
especially at 12.7 ppm, is poor. At catalyst concentrations higher than 40 mM,
the end peak at 13.05 ppm exchanges too fast to show a peak. At 200 mM, the
peaks are all extremely short and broad, almost disappearing into the baseline.

74
Similarly, we overlaid a plot of the dimer sequence (Figure 25). For the dimer
sample, we overlaid only four ammonia catalyst concentrations of 40, 80, 120
and 200 mM. Possibly due to cold denaturation of the sample, the 100 mM
spectrum was poorly resolved and will be repeated. In comparison to the
parent complex, the signal-to-noise ratio is much worse, with the baseline
blurred, particularly in the 200 mM ammonia catalyst. The peaks at 40 mM
ammonia are most intense, and follow a trend of decreasing in height with
increased catalyst. The shortening and broadening trend of the peaks differs
from the parent complex in significant residues. At 11.75 ppm, the 5’ thymine
dimer residue T5 shortens and broadens significantly from 40 mM ammonia
to 80 mM ammonia, especially compared to the other peaks. At 120 and 200
mM, the T5 residue is very broad and begins to disappear into the noise of the
baseline. Conversely, the 3’ thymine dimer residue T6 at 12.75 ppm does not
shorten and broaden in any significant or irregular way. Consistently, the
penultimate guanines G2 and G9 at 12.6-12.4 ppm shorten and broaden
quickly, at a slightly slower rate than T5. The peaks become so broad that they
meld into a single peak. The nondescript mid-sequence T17 and T3 also
broaden into a single peak.

75
Figure 25. KK3TT4 imino region at four increasing ammonia catalyst
concentrations of 40, 80, 120 and 200 mM. The 100 mM spectrum was poorly
resolved and will be repeated. The signal-to-noise ratio is much worse
compared to the parent, especially in the 200 mM sample (indicated in
purple). The 5’ thymine dimer residue T5 at 11.75 ppm quickly shortens and
broadens, compared to the other peaks. The penultimate guanines G2 and G9
at 12.6-12.4 ppm also shorten and broaden into one peak, as observed in the
parent. T17 and T3 also broaden into a single peak. The 3’ thymine dimer
residue T6 at 12.75 ppm does not appear to broaden.

76
Using Matlab, we fitted the peaks to find the exchange rate per residue at each
concentration of ammonia catalyst (40, 80, 120 and 200 mM), for both the
parent and dimer duplexes. By taking the inverse of exchange rate, we
calculated the base pair lifetime, shown below (Table 7).
The exchange rates for each residue in the parent duplex were plotted
against ammonia concentration at five points: 40, 80, 100, 120 and 200 mM
(Figure 26). The trend of positive slopes indicates with increasing ammonia
catalyst concentration, an increase in the rate of exchange is observed. As
consistent with previous data, the penultimate end residues G2 and G9 show
the greatest increase in exchange rate as catalyst concentration increases. The
data is fit to a straight line consistent with equation 9. More catalyst
concentration points will create a clearer trend.
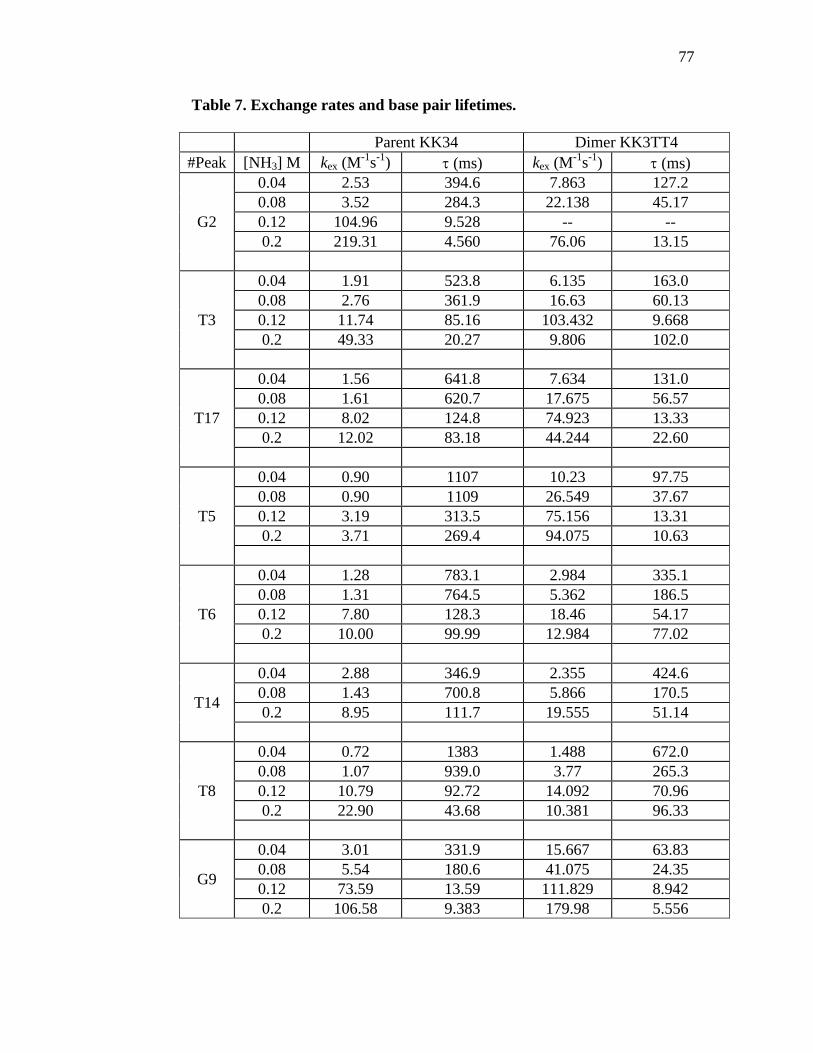
77
Table 7. Exchange rates and base pair lifetimes.
Parent KK34 Dimer KK3TT4
#Peak [NH3] M kex (M-1
s-1
) (ms) kex (M-1
s-1
) (ms)
G2
0.04 2.53 394.6 7.863 127.2
0.08 3.52 284.3 22.138 45.17
0.12 104.96 9.528 -- --
0.2 219.31 4.560 76.06 13.15
T3
0.04 1.91 523.8 6.135 163.0
0.08 2.76 361.9 16.63 60.13
0.12 11.74 85.16 103.432 9.668
0.2 49.33 20.27 9.806 102.0
T17
0.04 1.56 641.8 7.634 131.0
0.08 1.61 620.7 17.675 56.57
0.12 8.02 124.8 74.923 13.33
0.2 12.02 83.18 44.244 22.60
T5
0.04 0.90 1107 10.23 97.75
0.08 0.90 1109 26.549 37.67
0.12 3.19 313.5 75.156 13.31
0.2 3.71 269.4 94.075 10.63
T6
0.04 1.28 783.1 2.984 335.1
0.08 1.31 764.5 5.362 186.5
0.12 7.80 128.3 18.46 54.17
0.2 10.00 99.99 12.984 77.02
T14
0.04 2.88 346.9 2.355 424.6
0.08 1.43 700.8 5.866 170.5
0.2 8.95 111.7 19.555 51.14
T8
0.04 0.72 1383 1.488 672.0
0.08 1.07 939.0 3.77 265.3
0.12 10.79 92.72 14.092 70.96
0.2 22.90 43.68 10.381 96.33
G9
0.04 3.01 331.9 15.667 63.83
0.08 5.54 180.6 41.075 24.35
0.12 73.59 13.59 111.829 8.942
0.2 106.58 9.383 179.98 5.556

78
Figure 26. Exchange rates for each residue plotted against ammonia
concentration for five points: 40, 80, 100, 120 and 200 mM. The positive
slopes indicate that with increasing ammonia catalyst, there is an increase in
the rate of exchange. The penultimate end residues G2 and G9 show the
greatest increase in exchange rate.

79
In the dimer duplex (Figure 27) , the positive slopes indicate that increased
exchange rate is proportional to increased catalyst concentration. The steepest
slope corresponds to the most quickly increasing exchange rate. In the dimer
sample, the G9 residue, a penultimate guanine residue, is the fastest-
exchanging across all catalyst concentrations. Interestingly, the 5’ T5 dimer
residue has a fast exchange for each catalyst concentration as well. The T5
residue has consistently fast exchange rates compared to the other residues.
Pertinently, the 3’ T6 dimer residue has exchange rates similar to other
thymines flanking the dimer, with no exceptional increase in exchange rate for
these catalyst concentrations. The remaining thymine residues are clustered
together at a relatively slow exchange rate.

80
Figure 27. Plot of KK3TT4 exchange rate per residue as a function of
ammonia catalyst concentration for four concentrations. The slope for each
curve is positive, indicating increased exchange rate with increased catalyst
concentration. The most quickly exchanging peak is the G9 residue, a
penultimate guanine residue. The second-fastest exchanging residue is the 5’
T5 dimer residue. The 3’ T6 dimer residue is normal compared to the other
residues.

81
The equilibrium constant of opening, Kop can be estimated from the
slopes through the relationship
m = kB
*Kop
(10)
using the kB values for guanine and thymine respectively listed in section 3.1
These values are show in Table 8.
Table 8. Values for equilibrium constant of opening for each residue.
Parent Kop (M-1
s-1
) 10-6
Dimer Kop (M-1
s-1
) 10-6
G2 2.0 0.81
T3 1.7 1.8
T17 0.40 6.9
T5 0.11 1.4
T6 0.34 1.8
T14 0.34 2.3
T8 0.84 1.8
G9 4.2 3.0
It is clear from Table 8 that the 5’ dimer residue T5, T17, and T14
demonstrated the greatest increase in equilibrium constants of opening. The 3’
dimer residue T6 shows a modest increase. T8 and T3 do not change
significantly, and nor do the penultimate residues G2 and G9. The G2 and G9
residues are beginning to exchange so quickly in our experiments, that an
accurate measurement for the rate constant is not currently available. The
increase in the opening equilibrium constant of T5 is supportive of our theory
that increased base pair opening is related to the destabiliziation of the duplex
structure through the cis-syn thymine dimer lesion.

82
5. DISCUSSION
5.1. Sequence Selection
The 10 base pair oligonucleotide duplex KK34 and the 12 base pair
duplex KK56 were compared for sequence optimization. The goal of the
sequence design was to strike a balance between a small number of well-
dispersed peaks, and a long-enough sequence to maintain the annealed
structure in solution. A decamer was selected to form a complete turn of a B-
DNA helix. A dodecamer was selected to encourage duplex formation even
with the destabilizing lesion (12). The increase in sequence length adds
stability to the duplex structure, contributing to reliably reproducible spectra.
Enhanced peak dispersion could be accomplished by increasing magnet
strength of the NMR instrument by moving up from a 400 MHz instrument to
a 500 MHz, or by choosing a short sequence with fewer signals. In both KK34
and KK56, the lesion site was embedded in the center of the sequence, where
the duplex is most stable. Considering the Brownian motion of the molecules
in solution, we anticipated that the ends of the duplexes would fray
spontaneously, so the exchange rates would be increased by the hidden
variable of the duplex movement. The ends of both sequences are two C•G
base pairs, to discourage fraying. C•G pairs are stronger than A•T pairs,
because of an additional hydrogen bond.
Additionally, the dimer site was embedded in a length of unmodified
DNA to examine the long-range effects of the lesion. A largely distorting
lesion would be expected to change the overall structure of the duplex through

83
kinking the backbone as previous studies suggested (14). The kink would
position residues that were previously farther than 6Å apart into close
proximity, to change the NOE signals in the resultant NMR spectra. The
dimer is flanked by alternating purine-pyrimidine residues to model an in vivo
sequence where a cis-syn dimer would form after UV irradiation.
KK34 and KK56 were designed to be non-palindromic sequences,
meaning the forward sequence is different than the reverse; when read from
the 5’ to 3’, the sequence is unique compared to the 3’ to 5’. A symmetric,
palindromic sequence would be more thermodynamically stable in a single-
stranded, homoduplex hairpin form, and the hairpin structure would be the
predominant product during annealing, instead of forming a double-stranded
helical structure.
5.2. NMR Resonance Assignment: Duplexes KK56 and KK5TT6
The full spectra of KK56 and KK5T6 correspond generally to the
previously assigned double-stranded DNA spectrum (Figure 9). The thymine
methyl protons are easily identified at 0.8 ppm by intense, clear signals. The
sugar protons H2’ and H3’ are visible but not easily resolved at 2-3.5 ppm,
and H4’, H5’ and H5’’ appear at 4-4.5 ppm. The water peak at 4.7 ppm is
suppressed, but obscures the sugar proton H3’. At the base of the large water
peak, no ringing can be observed, which is identified by a sinusoidal
undulation of the baseline that distorts the DNA peaks and occurs due to an
imprecise suppression of water. In the deuterium oxide spectra, only the sugar
and aromatic protons are visible, because we expect the deuterium to

84
exchange with the thymine and guanine imino and amino protons. In the water
spectrum, amino peaks appear from cytosine, guanine and adenine at 6.5-8.5
ppm, flanking the aromatic ring protons at 7-8 ppm. The imino region is clear
and far downfield at 11-13 ppm. The presence of the sugar, amino, and imino
protons in the water spectrum indicates that the DNA was annealed and stable
at the experimental temperature of 7C. No unexplained peaks are present,
which is indicative of a lack of impurities in our sample. Additionally, no
spinning sidebands, which are tall peaks symmetrical about the water signal,
are observed, which indicates good shimming and that the sample is
homogenous in the magnetic field at the core of the NMR.
In the imino region of the parent KK56 in H2O, nine distinct peaks are
visible. Though we expect twelve peaks ideally, we would be content with ten
peaks lacking the terminal base resonances. One missing peak suggests that
one peak represents two residues, probably T7 and T9, because it appears
significantly taller than the others. Since we would like to monitor the rate of
exchange of each base pair individually, the overlap indicates that the
sequence is not ideal. The two-dimensional spectrum allowed an unambiguous
assignment of the imino region. The critical residue of T6, which will later be
involved in the thymine dimer lesion, is isolated and well-resolved at 13.70
ppm.
In the dimer duplex KK5TT6, T6 shifts 1.61ppm to a position of 12.09
ppm, noticeably far upfield compared to all the other imino signals for the
duplex. The shift, observed in previously published literature, is indicative of

85
the loss of aromaticity of T6 after the creation of the cyclobutane ring in the
lesion. T7 migrates a shorter distance, but does shift 0.46 ppm upfield. In the
parent spectrum, T6 is the furthest downfield peak, and in the dimer strand, T6
is the furthest upfield.
The duplex KK56 was rejected for the exchange experiments because
of the poor peak dispersion and the overlap of peaks at the critical T7 residue.
In the parent, T7 and T9 overlap, and in the dimer, T7 and G14 are overlaid.
Ideally, T6 and T7 should be readily distinguishable from neighboring peaks.
Deconvoluting and fitting overlapping peaks is a mathematically challenging
task that becomes near-impossible as the peak heights begin to shorten and
broaden as exchange catalyst is added.
5.3. NMR Resonance Assignment: Duplexes KK34 and KK3TT4
The full 1D spectrum of KK34 is very similar to the KK56 spectrum
and to the general case of double-stranded DNA, exhibiting the same
components (Figure 9). The presence of the sugar, amino, and imino protons
in the water spectra indicate that the DNA was annealed in solution.
In the imino region, peaks for the KK34 sequence with and without the
lesion showed good spectral resolution and allowed for mathematically
straightforward peak fitting for the imino exchange experiments. None of the
peaks are taller than the others, consistent with the equal concentrations of
each kind of base pair, and every residue except the end peaks can be
assigned. Eight peaks were observed, with two residues missing per end. This
indicates that the critical T5 and T6 residues containing the dimer each have

86
its own distinct peak, which is the ideal case when we calculate an exchange
rate for each imino of each residue. However, the peaks appear in a cluster,
with overlap towards the baseline. Since the peak apexes can be distinguished,
the overlap is not problematic. The sequence could be solved in a
straightforward and unambiguous manner through the standard NOE
sequential assignment. Though most of the residues in this duplex sequence
have been assigned by Taylor et al., the imino peaks were not assigned (12).
In our experiments, the imino region has been completely assigned, without
gaps, from G2 to G9, excluding the terminal imino protons. In the parent
duplex, the 5’ end thymine dimer T5 is resolved at 13.44 ppm, and in the
dimer complex, there is an obvious upfield shift to 11.78 ppm, as seen
previously in the KK56/KK5TT6 duplex comparison. The 3’ end thymine
dimer T6 is originally resolved at 13.02ppm in the parent, but it also shifts
upfield to 12.77 ppm. As expected, T5 has a more severe shift, due to the
weakening of the hydrogen bonding interactions at the 5’ end of the lesion.
Taylor et al. suggest that the significant upfield shift (1.66 ppm) of the 5’ T5
is due to ring current effects (12). The 3’ end T6 has a less severe shift of
0.25ppm, since the hydrogen bond on the 3’ side is less effected and remains
close to normal.
Within the duplex structure, the chemical shifts of each residue are
only significant for the 5’ thymine (T5, in the case of KK34), as shown in
Figure 28.

87
Figure 28. Chemical shift changes in the KK34 to KK3TT4 duplex. The black
parallelogram represents the approximate position of the thymine dimer
lesion, created with Nucleic Acid Builder.

88
We noticed the most radical change for T5, then for T6. The residues
immediately flanking the dimer are also slightly perturbed, with the
magnitude of the perturbations decreasing exponentially with distance from
the lesion site. The chemical shifts of residues G2 and T3 upstream of the
dimer, on the 5’ side, have almost no chemical shift change (0.01 ppm
change). The residues T6-G20 on the 3’ side have more noticeable changes
(up to 0.1 in the case of T8). The pattern of the shift change indicates that the
lesion creates a downstream distortion, affecting the duplex structure towards
the 3’ side. These observations verify the suggestions made by Taylor on the
KK34 sequence. Since Taylor et al. did not completely assign the imino
region, the detrimental effect of the dimer on the 3’ end was speculative. (12)
Taylor et al. proposed crystal structures indicating that the cis-syn dimer has
the 5’ thymine of the dimer in the anti orientation, mimicking a normal
conformation of a regular B-form thymine. Their group speculated that the
lesion is not radically destabilizing from their model, and our NMR
experiments suggest that the lesion is not extremely destabilizing (with
disturbances below 2 ppm shifts), but there is a definitive destabilizing effect
of the lesion within the duplex. From our work, we observe that the magnitude
of the destabilization decreases with distance from the lesion, with a greater
disturbance indicated on the 3’ end.
The specific upfield shifting of T5, the 5’ thymine, is indicative of the
loss of aromaticity with the cyclobutane bond formation fusing the adjacent
thymines. The change in the chemical environment of T5 is suggestive of a

89
change in the electronic structure of the dimer, since the -stacking through
the bases is interrupted. Additionally, nine rotatable bonds are made static in
upon creation of the dimer: the two glycosyl bonds, the two sugar rings, and
the five inter-nucleotide bonds. (12) In his paper, Taylor suggests the
electronic structural change is due to ring current effects.
We decided to proceed with the exchange experiments using the 10-
mer KK34 duplex. The peaks for the sequence with and without the lesion
showed good spectral resolution and allowed for mathematically
straightforward peak fitting for the imino exchange experiments because each
residue on the duplex could be assigned to a well-resolved peak. The
resolution of each peak allows for rate constants to be calculated for each
guanine or thymine.
5.4. Exchange Experiments
The exchange experiments were designed to elucidate the rate of base
pair opening using a series of one-dimensional 1H NMR spectra of the imino
region of the parent and dimer duplex in ammonia catalyst. 1D spectra are
obtained at a range of mixing times to monitor how the height of each imino
proton changes over time. The peak heights are integrated and the volumes are
plotted at each mixing time.
To determine the rate of base pair opening, one-dimensional 1H NMR
spectra are taken at a range of mixing times. By graphically stacking the 24
different spectra at 24 different mixing times, we can observe the sample is
functioning as expected in the NMR, and the peak heights change in intensity

90
with mixing time. (Figure 20, 21) Our model predicts that the bases open to
the solvent, and the imino protons exchange with the water protons with a rate
kex. As the water protons are pulsed, they invert and recover, along with the
imino protons, with rates of Rlw and Rli respectively. A minimum height is
observed at 0.5 ms.
In the parent sequence at 40 mM, T3, G2 and G9 have the fastest
exchange rates, indicated by the significant dip in peak intensity on the
volume versus mixing time plot. These residues are closest to the ends, and
are expected to be exposed more often to the solvent since the residues on the
ends are frayed and are completely open to solvent exchange. The residues at
the center of the complex, such as T5 and T6, have the slowest exchange
rates, indicated by the shallowest slopes at any given point on the exchange
curve. (Figure 22, 23) Neither T5 nor T6 show a dramatic decrease in peak
height, and remain at a fairly high peak intensity throughout the exchange
experiment (0-3 s mixing time).
In the dimer duplex, the residues of G2, T3, T17, T5 and G9 are
observed to have fast exchange. The penultimate residues of G2 and G9, and
the antepenultimate residue T3 remain residues of fast exchange from the
parent to the dimer. Interestingly, we observed that T17 and T5 have fast
exchange in the dimer. As the 5’ thymine dimer residue, the T5 residue
complies with our hypothesis that the lesion presence augments exchange rate.
Notably, the 3’ end residue, T6, does not share the fast exchange. It is possible
that at higher catalyst concentrations T6 will join T5 in fast exchange.

91
Interestingly, we observed that T17 has a very vast exchange in the dimer.
T17 is the 5’ neighbor of T5, and this result indicates that the exchange rate
perturbation is more significant upstream of the dimer. This adds an
interesting insight on the kinetics of the duplex, considering the one-
dimensional NMR chemical shift changes indicated that the region of greatest
chemical change was to the 3’ end.
It is known that AT and GC base pairs have different opening
lifetimes; adjacent AT pairs exchange with a lifetime of ~ 0 to 50 ms, whereas
adjacent GC pairs stay closed longer, on the order of from 50 to 350 ms. (26)
The lifetimes are sequence dependent, and another group has reported values
of 10-50 ms for G-C pairs, and 1-5 ms for A-T pairs. (17) Previous research
has indicated that in increasing ammonia catalyst concentration, the exchange
rate is not limited by individual base-pair dynamics. At infinite catalyst
concentration, the exchange rate is reflecting the entire duplex movement of
exchange. Conversely, at the lowest or zero catalyst concentration, the rate
constant can be expected to be the largest.
From the exchange rate data, we calculated the base pair lifetime per
residue for 40, 80, 120, and 200 mM ammonia. The expected lifetime for a
cytosine-guanine pair is 10-50 ms, and an adenine-thymine pair is 1-5 ms
(17). In the parent duplex at 40 mM ammonia, we are far from this range; our
values for lifetime of T5 is 642 ms, and for G2 it is 394 ms. At the next
titration point of 80 mM, we observe a shortening of the lifetime; for T5
dropped to 620 ms and G2 dropped to 284 ms. Still, compared to the literature

92
values, we are far away from the catalyst concentration to observe those
lifetimes. At our highest concentration of 200 mM, T5 is at 269 ms. However,
we are trending in the correct direction, and larger steps in ammonia catalyst
concentration will help us approach the ideal concentration, in which one
exchange per opening event can be assumed. The effect is more drastic in the
dimer sequence; in 40 mM, G2 has a much lower lifetime than the parent, at
127 ms. Comparatively, T5 has a lifetime of 97 ms in 40 mM ammonia. At
our highest concentration, T5 is approaching the correct range with 22 ms
opening, and G2 has fallen within the range, at 13 ms.
Thus, we plan to add more ammonia catalyst, up to a concentration of
1 M, if possible. Currently, our data reflects the ammonia concentrations of
40, 80, 100, 120 and 200 mM total ammonia. It is important to consider that
even with achieving a high concentration, such that we can model one
exchange event per opening, we do not know the mechanism of base flipping
initiation. It is possible that exchange can occur from the thymine flipping out,
and it is equally possible that the opposite adenine opens, allowing for
exchange.
The rates of base pair opening and closing (kop and kcl,) could not be
found using Equation 7 with only four data points. However, Kop could be
approximated by a linear fit to a plot of exchange rate (kex) versus catalyst
concentration [B] as described by equation 9 (Figures 26, 27). In the parent
complex, the 5’ thymine dimer residue T5 had an equilibrium constant of
opening of 0.11 10-6
M-1
s-1
in the parent complex, and increased to 1.4 10-6

93
M-1
s-1
in the dimer form. Significant increases in equilibrium constants of
opening were also observed for dimer-flanking residues T14 and T17. T6 had
a modest increase in Kop, but interestingly less than that of T14 and T17. The
exciting result of the increase in equilibrium opening constant for T5 indicates
that there is a thermodynamic and probably also kinetic effect of the dimer
that allows rapid, frequent exchange of the imino proton. Our data supports
the suggestion that the cis-syn cyclobutane thymine dimer destabilizes the
DNA duplex enough, leading to base opening to the solvent at an augmented
rate.
5.5. Relation to Homologous Research
Insight into the mechanism of thymine base flipping has been gained
previously using uracil. The repair mechanism of uracil DNA glycosylase
(UDG), the repair enzyme for unwanted uracil bases, was modified to be
catalytically active against thymine after selective amino acid replacement.
(27) Imino proton exchange experiments were performed on the UDG and
uracil containing-DNA. Cao et al. found that the binding of the enzyme UDG
accelerates the imino proton exchange of thymine; the thymine resonance
being excised was found to have an exchange 25-fold faster compared to that
in the free DNA. In comparison, the thymine imino resonance near the end of
the DNA sequence showed a five-fold increase in exchange rate after binding.
Pertinently, the UDG was found to have no effect on the imino proton
exchange of guanine, suggesting that the enzyme uses the flexibility of the AT
basepair (containing only two hydrogen bonds), compared to the more rigid

94
CG basepair (containing three hydrogen bonds). The excised guanine
resonance was observed to have a four-fold increase in exchange rate, which
can be explained by local perturbation of the duplex when UDG binds. UDG
preferentially opened the AT pair, because of the fewer number of hydrogen
bonds. In the exchange experiments, the exchange rate was dependent
strongly on catalyst concentration and could be fit to find the rate constants
for base pair opening and closing, as well as the equilibrium constant for base
pair opening (Kop = kop / kcl). The authors found that UDG increases the
opening equilibrium for the excised thymine base by 75- to 280-fold.
Comparatively, the excised guanine only observed a 2-fold increase. The
enzyme itself is likely to be stabilizing the DNA duplex, maintaining the open,
solvent-exposed state of the excised bases. The authors concluded that the
repair enzyme traps the open state of the AT basepair, without significantly
altering the rate of base pair opening. The enzyme increases the Kop term by
reducing the rate of closing (kcl). Concerning uracil, the group found that the
enzyme advantageously used the instability of uracil to initiate the
spontaneous flipping out of the duplex, generating a high-energy intermediate.
UDG can then weakly interact with the DNA backbone, trapping the high-
energy uracil, and cleave at the glycosidic bond. Using equation 3, the authors
Cao et al. plotted inverse exchange rate (1/kex) versus inverse catalyst
concentration (1/[B]), to generate a curve that described the relative
magnitude of catalyst exchange kB[B] and rate of internal catalysis kint. (27)
95
In a follow-up study on UDG, the stabilization of the open complex
was shown to flatten the energy landscape for base flipping. In this way, the
thymine being excised can be rotated away from the base stack in a series of
energetically downhill steps. (28)
In our system of a dimer-repairing enzyme, a similar mechanism could
be acting. The increased opening at the thymine dimer site could be helpful to
an enzyme that must rotate out the dimer, while stabilizing the opposite
strand. The cyclobutane ring involved in the dimer is a particularly rigid
structure, and the locked conformation could be useful to an enzyme involved
in repair.

96
6. CONCLUSION
The results from the one-dimensional NMR comparisons of the parent
and dimer duplexes indicated significant changes in the chemical
environments of the protons, correlating to a destabilizing effect of the dimer
lesion. In KK56/KK5TT6, we observed the thymines associated with the
dimer (T6 and T7) to exhibit noticeable shifts in frequency from the parent to
the dimer. In the 10-mer duplex KK34/KK3TT4, a similar shifting effect was
observed, but every residue (including dimer residues T5 and T6) is well
resolved in both parent and dimer structures. We used the 10-mer sequence to
consider the kinetic destabilization through the imino exchange experiments.
The perturbations in chemical shift were more significant downstream of the
dimer, on the 3’ end, compared to the 5’ end.
From the exchange experiments, the 5’ thymine dimer residue T5 had
an equilibrium constant of opening Kop of 0.11 10-6
M-1
s-1
in the parent
complex, and increased to 1.4 10-6
M-1
s-1
in the dimer form. The base pair
lifetime calculations indicate that we are not at the ideal catalyst concentration
to model one exchange event per opening. The increase in equilibrium
opening constant for T5 suggests that there is a kinetic effect of the dimer that
allows rapid, frequent exchange of the imino proton involved in the hydrogen
bonding between strands. Our data support the suggestion that the cis-syn
cyclobutane thymine dimer destabilizes the DNA duplex enough to allow base
opening to the solvent at an augmented rate.

97
7. REFERENCES
(1) Friedberg, E.C. (1997) Correcting the Blueprint of Life: a Historical
Account of the Discovery of DNA Repair Mechanisms. Cold Spring Harbor
Laboratory Press, Cold Spring Harbor, N.Y.
(2) Friedberg, E. C.; Walker, G.C.; Siede, W.; Wood, R.D.; Schultz, R.A.;
Ellenberger, T. (2006) DNA Repair and Mutagenesis. ASM Press,
Washington, DC. 2nd
Ed.
(3) Watson, J.D. and Crick, F.H.C. (1953) Molecular structure of nucleic
acids. Nature. 171: 737-738.
(4) Lodish, H.; Berk, A.; Kaiser, C. A.; Krieger, M.; Scott, M. P.; Bretscher,
A.; Ploegh, H. (2008). Molecular Cell Biology. Macmillan, New York, NY.
5th
Ed.
(5) Nelson, D.L.; Lehninger, A.L.; Cox, M.M.; Freeman, W.H. (2008)
Lehninger Principles of Biochemistry. Freeman Publishing. 5th
Ed.
(6) Cheng, K.C.; Cahill, D.S.; Kasai, H.; Nishimura, S.; Loeb, L.A. (1992) 8-
Hydroxyguanine, an abundant form of oxidative damage, causes G T and
A C substitutions. J. Biol. Chem. 33: 166-171.
(7) Li, J.; Uchida, T.; Todo, T.; Kitagawa, T. (2006) Similarities and
differences between cyclobutane pyrimidine photolyase and (6-4) photolyase
as revealed by resonance Raman spectroscopy. J. Biol. Chem. 281: 25551-
25559.
(8) Douki, T.; Laporte, G.; Cadet, J. (2003) Inter-strand photoproducts are
produced in high yield within A-DNA exposed to UVC radiation. Nucl. Acids
Res. 31: 3134-3142
(9) Mitchell , D.L.; Jen, J.; Cleaver, J.E. (1992) Sequence specificity of
cyclobutane pyrimidine dimers in DNA treated with solar (ultraviolet B)
radiation. Nucl. Acid. Res. 20: 225-229.
(10) Radany, E.H.; Love, J.D.; Friedberg, E.C. (1981) The use of direct
photoreversal of UV-irradiated DNA for the demonstration of pyrimidine
dimer-DNA glycosylase activity, Chromosome Damage and Repair. Plenum
Publishing Corp, New York, NY.

98
(11) Frankel. E.F.; (2011) Thermodynamic Effects of the cis-syn Thymine
Dimer Lesion on Duplex DNA. Mount Holyoke College Senior Symposium.
April 2011.
(12) Taylor, J.S.; Garrett, D.S.; Brockie, I.R.; Svoboda, D.L.; Tesler, J. (1990) 1H NMR Assignment and Melting Temperature Study of cis-syn and trans-syn
Thymine Dimer Containing Duplexes of d(CGTATTATGC)·
d(GCATAATACG). Biochemistry 29, 8858-8866.
(13) Johnson, R.E.; Prakash, S.; Prakash, L. (1999) Efficient bypass of a
thymine-thymine dimer by yeast DNA polymerase, pol eta. Science 283.
1001-1004.
(14) Park, H.; Zhang, K.; Ren, Y.; Nadji, S.; Sinha, N.; Taylor, J.S.; Kang, C.
(2002) Crystal structure of a DNA decamer containing a cis-syn thymine
dimer. Proc. Natl. Acad. Sci. USA 99. 15965-15970.
(15) Kim, J.K.; Patel, D.; Choi, B.S. (1995) Contrasting structural impacts
induced by cis-syn cyclobutane dimer and (6-4) adduct in DNA duplex
decamers: implication in mutagenesis and repair activity. Photochem.
Photobiol. 62: 44-50.
(16) Sancar, A. (2008) Photolyase and in vivo enzymology: 50th
anniversary.
Biol. Chem. 283: 32153-32157.
(17) Priyakumar, U.D. and MacKerell, A.D. (2006) NMR imino proton
exchange experiments on duplex DNA primarily monitor the opening of
purine bases. J. Am. Chem. Soc. 128: 678-679.
(18) Guéron, M.; Kochoyan, M,; Leroy JL. (1987) A single mode of DNA
base-pair opening drives imino proton exchange. Nature. 328: 89-92.
(19) Warmlander, S.; Sen, A.; Leijon, M. (2000) Imino proton exchange in
DNA catalyzed by ammonia and trimethylamine: evidence for a secondary
long-lived open state of the base pair. Biochemistry. 39: 607-615.
(20) Bishop, K.D. (2011) Structure Determination by NMR.
www.nmr2.buffalo.edu/resources/edu/matr/structure-determination.ppt.
Accessed March, 2011.
(21) James, T.L. (2001) NMR Determination of Oligonucleotide Structure.
Curr. Prot. Nucl. Acid Chem. 7.2.1.-7.2.16.
(22) Fawzi N.L.; Phillips A.H.; Ruscio J.Z.; Doucleff M.; Wemmer D.E.;
Head-Gordon T. (2008) Structure and dynamics of the Abeta(21-30) peptide

99
from the interplay of NMR experiments and molecular simulations. J. Am.
Chem. Soc. 130: 6145-58.
(23) Folta-Stogniew, E. and Russu, I. (1996) Base-catalysis of imino proton
exchange in DNA: effects of catalyst upon DNA structure and dynamics.
Biochem. 25. 8439-8449.
(24) Plateau, P.; Guéron, M. (1982) Exchangeable proton NMR without base-
line distortions, using new strong-pulse sequences, J. Am. Chem. Soc. 104:
7310–7311.
(25) Chen, C.; Cohen, J.; Behe, M. (1983) B to Z Transition of Double-
Stranded Poly[deoxyguanylyl(3’-5’)-5-methyldeoxycytidine] in Solution by
Phosphorus-31 and Carbon -13 Nuclear Magnetic Resonance Spectroscopy.
Biochemistry. 22: 2136-2142.
(26) Dhavan, G.M.; Lapham, J.; Shuwei, Y.; Crothers, D.M. (1999) Decreased
imino proton exchange and base-pair opening in the IHF-DNA complex
measured by NMR. J. Mol. Biol. 288: 659-671.
(27) Cao, C.; Jiang, Y. L.; Stivers, J.T.; Song, F. (2004) Dynamic opening of
DNA during the enzymatic search for a damaged base. Nat. Struc. Molec.
Biol. 11: 1230-1236.
(28) Parker, J.B.; Bianchet, M.A.; Krosky, D.J.; Friedman, J. I.; Amzel, L.M.;
Stivers, J.T. (2007) Enzymatic capture of an extrahelical thymine in search for
uracil in DNA. Nature. 449: 433-437.