Characterization of Reuse Activities at Contaminated Sites
47
Working Paper Series U.S. Environmental Protection Agency National Center for Environmental Economics 1200 Pennsylvania Avenue, NW (MC 1809) Washington, DC 20460 http://www.epa.gov/economics Characterization of Reuse Activities at Contaminated Sites Angela Vitulli, Charlotte Dougherty, and Kimberly Bosworth Working Paper # 04-03 April, 2004
Transcript of Characterization of Reuse Activities at Contaminated Sites
Working Paper Series
U.S. Environmental Protection AgencyNational Center for Environmental Economics1200 Pennsylvania Avenue, NW (MC 1809)Washington, DC 20460http://www.epa.gov/economics
Characterization of Reuse Activities at Contaminated Sites
Angela Vitulli, Charlotte Dougherty, and Kimberly Bosworth
Working Paper # 04-03April, 2004
Characterization of Reuse Activities at Contaminated Sites
Angela Vitulli, Charlotte Dougherty, and Kimberly Bosworth
NCEE Working Paper Series
Working Paper # 04-03April, 2004
DISCLAIMERThe views expressed in this paper are those of the author(s) and do not necessarily representthose of the U.S. Environmental Protection Agency. In addition, although the research describedin this paper may have been funded entirely or in part by the U.S. Environmental ProtectionAgency, it has not been subjected to the Agency's required peer and policy review. No officialAgency endorsement should be inferred.
Correspondence:
Kimberly BosworthIndustrial Economics, Incorporated
2067 Massachusetts AvenueCambridge, MA 02140
617 354 0074
April 2, 20041
Characterization of Reuse Activities at Contaminated Sites
Angela Vitulli, Charlotte Dougherty, and Kimberly Bosworth
Industrial Economics, Incorporated2067 Massachusetts Avenue
Cambridge, MA 02140617 354 0074
Abstract: Given the increased focus on reuse activity within EPA and state site cleanupprograms, policy makers would benefit from looking across programs to betterunderstand the extent and nature of reuse; examine site characteristics that influencereuse; leverage lessons learned; and coordinate reuse activities, data collection, andinformation management. This research paper begins to examine these issues. It reportsthe results of a preliminary review and analysis of available EPA and state program dataon the extent and nature of reuse and factors influencing site reuse. Numerous factorscan influence the reuse potential of contaminated sites. Characteristics include on-sitefactors (e.g., site size and configuration, prior use, type and extent of contamination), aswell as off-site factors such as local real estate market conditions. We provide apreliminary analysis of the roles of site contamination type and prior use in influencingreuse potential. To put this analysis in broader context, we also review the literature onthe role of off-site factors, and specifically local real estate market conditions, inaffecting the reuse potential of contaminated sites. An important finding of this analysisis that EPA and state programs currently do not collect data needed to fully characterizethe nature and extent of contaminated site reuse within and across programs, or todetermine the relative influence of various factors that influence the potential for reuseafter cleanup.
Subject Areas: Hazardous Waste (8), Land Use (26), and Environmental Policy (52)
Keywords: contaminated sites, site reuse, Superfund, brownfields, RCRA, undergroundstorage tanks
This research was funded by the US Environmental Protection Agency through Contract68-W-02-046, Task Order 35. However, the findings, interpretations, and conclusionsexpressed in this paper are entirely those of the authors and do not necessarily representthose of the U.S. Environmental Protection Agency.
April 2, 20042
I. Introduction and Overview
The Environmental Protection Agency’s primary role in addressing contaminated
sites has historically focused on remediation to mitigate human health and environmental
risks. The Superfund Program was established to facilitate the assessment and cleanup of
the nation's most contaminated sites. EPA oversees cleanups conducted by parties
responsible for the contamination, or can cleanup up sites itself using federal dollars in
cases where responsible parties cannot be identified. The Resource Conservation and
Recovery Act (RCRA) Corrective Action Program was designed to address the cleanup
of contaminated areas of facilities that treat, store, and dispose of RCRA-regulated
hazardous wastes. The Underground Storage Tank (UST) Program focuses on the
assessment and cleanup of releases from underground storage tanks and petroleum-
contaminated sites.
In recent years, EPA has focused more attention on returning contaminated sites
to productive reuse in addition to remediating them. The Land Revitalization Initiative of
2003 established the goal of integrating land reuse into all EPA cleanup programs. The
EPA Brownfields Program, launched in 1996, was specifically designed to promote the
integration of cleanup and reuse of contaminated, or potentially contaminated,
brownfields. EPA’s Office of Solid Waste and Emergency Response (OSWER)
programs, including Superfund, RCRA, UST, Brownfields, and the Federal Facilities
Restoration and Reuse Program, are now actively engaging in activities to encourage
reuse as well as cleanup, and these programs are making significant progress in
addressing barriers to reuse and in promoting and tracking reuse activities. State
voluntary cleanup and brownfields programs are engaging in similar activities. While all
April 2, 20043
of these activities and initiatives have the common goal of promoting the reuse of
contaminated sites, they are based in programs with very different historical contexts and
missions.
Given the increase in reuse activity of EPA and state programs and the likely
future focus on reuse, policy makers would benefit from looking across programs to:
better understand the extent and nature of reuse; examine site characteristics that
influence reuse; leverage lessons learned that help direct limited resources; and
coordinate reuse activities, data collection, and information management. This research
paper begins to examine these issues. It first reports the results of a preliminary review
and analysis of available EPA and state program data on the extent and nature of reuse
and factors influencing site reuse. Numerous factors can influence the reuse potential of
contaminated sites. Characteristics include on-site factors (e.g., site size and
configuration, prior use, type and extent of contamination), as well as off-site factors such
as local real estate market conditions. EPA and state programs often collect data on on-
site factors, but do not collect data on off-site factors. Therefore, this analysis addresses
only on-site factors. To put our analysis of on-site factors in broader context, we also
review the literature on the role of off-site factors, and specifically local real estate
market conditions, in affecting the reuse potential of contaminated sites. We first present
findings of the quantitative analysis of program data, followed by findings of the
literature review. We then summarize our findings and conclude by discussing the
implications of the results for future efforts to advance the understanding of the reuse
potential of contaminated sites.
April 2, 20044
II. Role of Reuse and Program Data1
Over the past decade, the Superfund, RCRA, and UST programs have established
initiatives to integrate future land use considerations into the cleanup process. In 1996,
the Office of Brownfields Cleanup and Redevelopment (OBCR) was established to
incorporate reuse as a central component of cleanup activities, and the office has worked
with state and local governments to test strategies for promoting the reuse of brownfields
sites. Many states work in cooperation with EPA to cleanup Superfund sites and manage
delegated RCRA and UST programs, and have developed and implemented brownfields
programs; states are also increasingly focused on promoting reuse within these cleanup
programs. Thus, many different programs managed by public agencies at all levels share
the common goal of promoting reuse of contaminated lands and are conducting similar
activities—financial assistance, technical assistance, liability assurance—to promote
reuse. Until now, however, there has been no comprehensive effort look across available
program data to understand the extent and nature of reuse or the factors that influence
reuse. EPA led a recent effort to collect cross-program information on reuse and local
impacts of reuse at 25 sites which included Superfund, brownfields, RCRA, UST sites
across the country. Results of the research were presented in a series of site fact sheets.
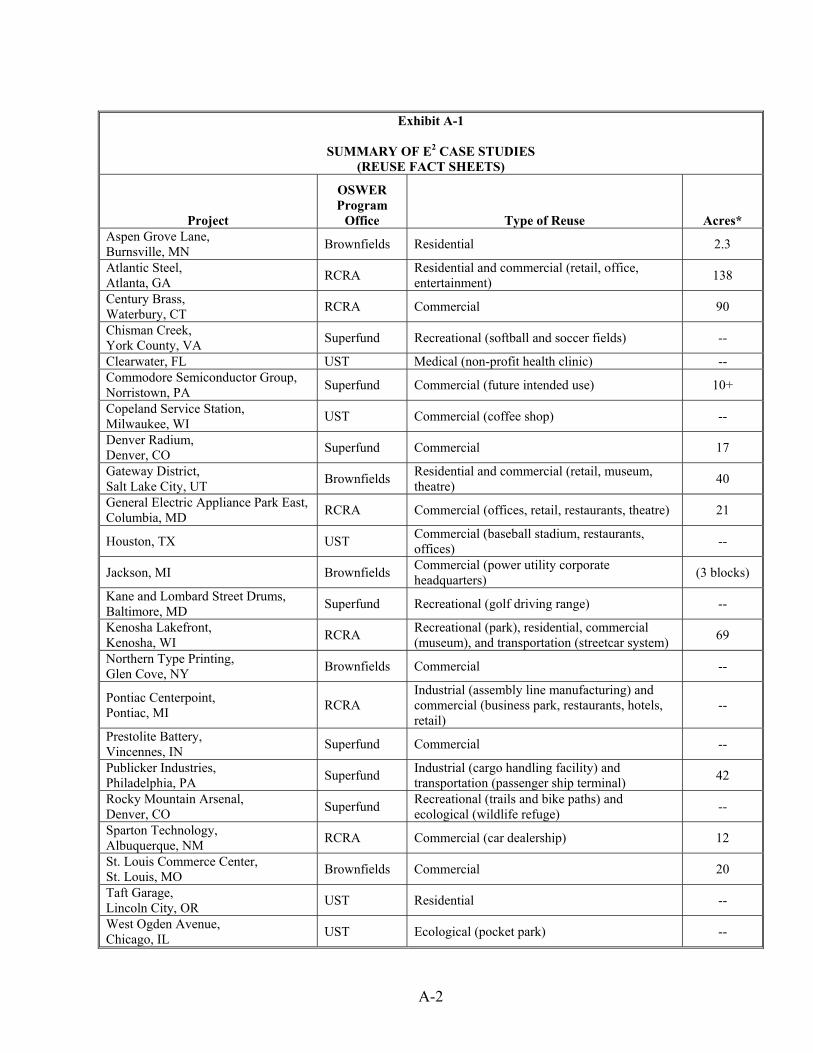
A summary of the site characterization information extracted from these fact sheets is
presented in Appendix A. The sample consists of 25 sites and the sites were selected to
cover a diverse range of reuse types. The case studies provide some insights regarding
reuse but it is difficult to draw program-wide conclusions from them because the sample
of 25 sites is relatively small and not random.2
April 2, 20045
While most EPA cleanup programs have not formally implemented the collection
and management of reuse data in program procedures, the Superfund and Brownfields
programs have made significant progress in developing a framework for tracking
environmental indicators related to cleanup and reuse. Once implemented, resulting
indicator data will provide a starting point for characterizing the extent and nature of
reuse. In this section, we provide an overview of the role of reuse in EPA and state
cleanup programs, and review and analyze available data pertaining to characterizing
reuse within each program. Available data related to the beneficial effects of reuse are
not addressed.3
Superfund
The Superfund Program was established by statute in 1980 to facilitate cleanup of
the nation's most contaminated sites. Superfund Program activities include removal of
hazardous materials, assessments of potentially contaminated sites, oversight of site
cleanups, and research on remediation technologies. Sites covered by Superfund include
abandoned or uncontrolled industrial sites, federal facilities, landfills, and hazardous
waste disposal areas. Superfund sites that pose especially high risks to human health or
the environment are placed on the National Prioritites List (NPL) and given access to
federal cleanup funds; cleanup of NPL sites is typically overseen by EPA as opposed to
state agencies.
In 1999, EPA created the Superfund Redevelopment Program to help put
Superfund sites back in productive reuse. The program provides funding to local
governments to participate in the cleanup of Superfund sites and plan for future reuse.
April 2, 20046
Since 1999, EPA has provided funding to nearly 70 pilot cities to assist with activities
such as remedy selection, and reuse planning, and community outreach.4 The goal of the
program is to establish an effective process and provide the tools and information needed
to fully explore future uses, before the cleanup remedy is implemented. This should result
in remedies that are consistent with the likely future site uses, and improves opportunities
for communities to benefit from productive use of sites following cleanup.
Extent and Nature of Reuse at NPL Sites
We examined the extent and nature of reuse at NPL sites using two main data
sources the Superfund Redevelopment (SURE) database and the Superfund CERCLIS
database. SURE was recently developed by the Superfund Redevelopment Program to
track the reuse of Superfund sites that have been reused or are planned for reuse.
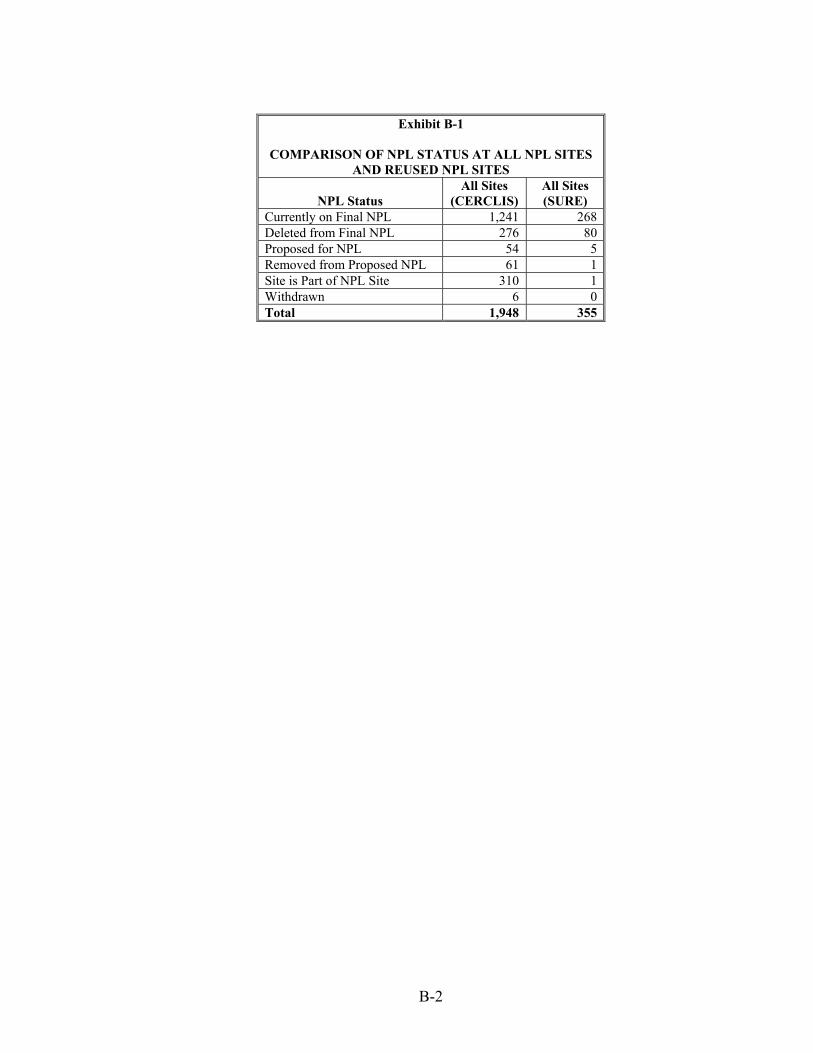
Currently, the database contains information on 375 sites, 355 of which are NPL sites and
all are reused sites. The database includes data on site characteristics, reuse, and
economic impacts.5 The SURE database is still under development and therefore
documentation on its contents and methods of data collection are not currently available.
While the database is purported to include all reused Superfund sites, there may be
Superfund sites with reuse activities underway or completed that are not included in the
SURE database, and there may be sites included that are not truly reused sites. The lack
of documentation available on the database makes it difficult to assess its quality. While
the SURE database only includes information on reused sites, the Superfund CERCLIS
database tracks information on location, status, contaminants, and cleanup activities for
all Superfund sites being assessed as potential or current NPL sites.
April 2, 20047
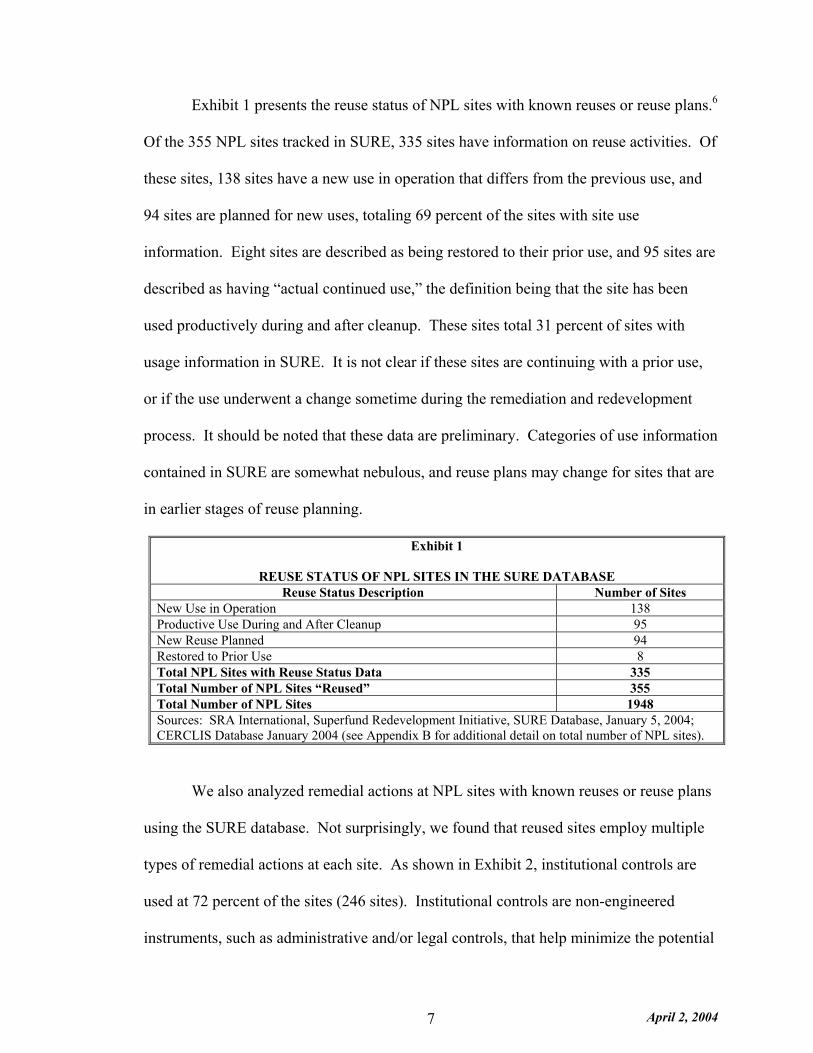
Exhibit 1 presents the reuse status of NPL sites with known reuses or reuse plans.6
Of the 355 NPL sites tracked in SURE, 335 sites have information on reuse activities. Of
these sites, 138 sites have a new use in operation that differs from the previous use, and
94 sites are planned for new uses, totaling 69 percent of the sites with site use
information. Eight sites are described as being restored to their prior use, and 95 sites are
described as having “actual continued use,” the definition being that the site has been
used productively during and after cleanup. These sites total 31 percent of sites with
usage information in SURE. It is not clear if these sites are continuing with a prior use,
or if the use underwent a change sometime during the remediation and redevelopment
process. It should be noted that these data are preliminary. Categories of use information
contained in SURE are somewhat nebulous, and reuse plans may change for sites that are
in earlier stages of reuse planning.
Exhibit 1
REUSE STATUS OF NPL SITES IN THE SURE DATABASEReuse Status Description Number of Sites
New Use in Operation 138Productive Use During and After Cleanup 95New Reuse Planned 94Restored to Prior Use 8Total NPL Sites with Reuse Status Data 335Total Number of NPL Sites “Reused” 355Total Number of NPL Sites 1948Sources: SRA International, Superfund Redevelopment Initiative, SURE Database, January 5, 2004;CERCLIS Database January 2004 (see Appendix B for additional detail on total number of NPL sites).
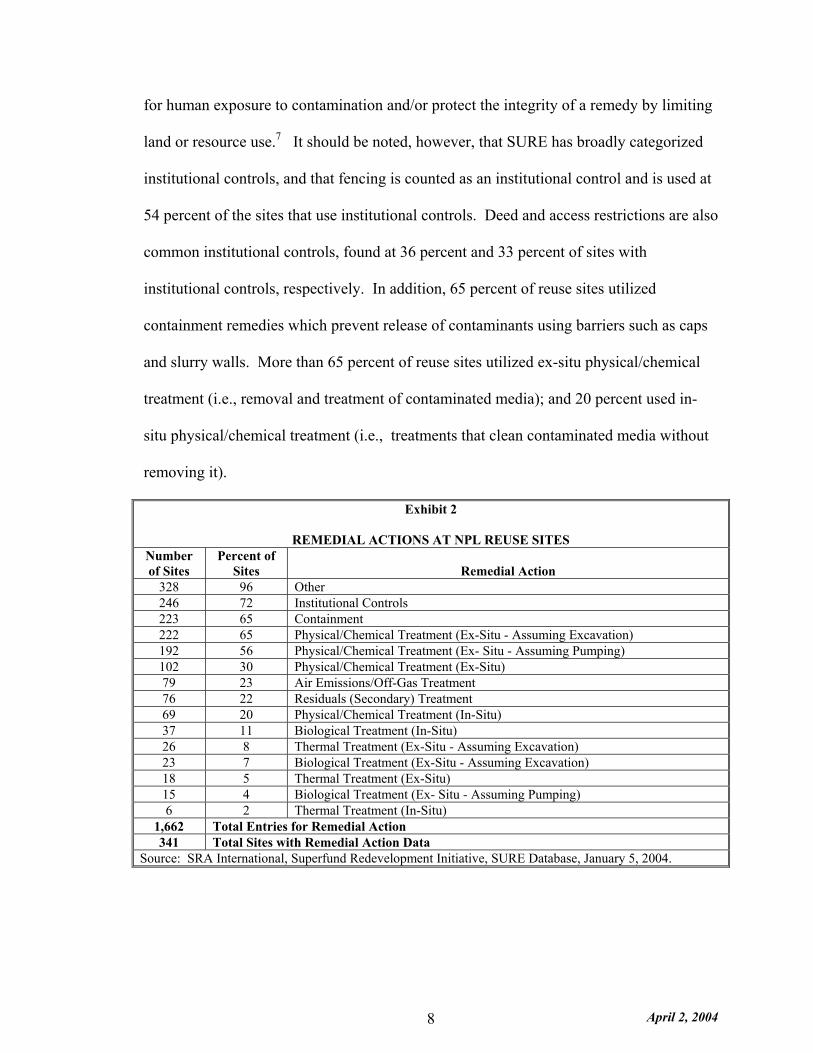
We also analyzed remedial actions at NPL sites with known reuses or reuse plans
using the SURE database. Not surprisingly, we found that reused sites employ multiple
types of remedial actions at each site. As shown in Exhibit 2, institutional controls are
used at 72 percent of the sites (246 sites). Institutional controls are non-engineered
instruments, such as administrative and/or legal controls, that help minimize the potential
April 2, 20048
for human exposure to contamination and/or protect the integrity of a remedy by limiting
land or resource use.7 It should be noted, however, that SURE has broadly categorized
institutional controls, and that fencing is counted as an institutional control and is used at
54 percent of the sites that use institutional controls. Deed and access restrictions are also
common institutional controls, found at 36 percent and 33 percent of sites with
institutional controls, respectively. In addition, 65 percent of reuse sites utilized
containment remedies which prevent release of contaminants using barriers such as caps
and slurry walls. More than 65 percent of reuse sites utilized ex-situ physical/chemical
treatment (i.e., removal and treatment of contaminated media); and 20 percent used in-
situ physical/chemical treatment (i.e., treatments that clean contaminated media without
removing it).
Exhibit 2
REMEDIAL ACTIONS AT NPL REUSE SITESNumberof Sites
Percent ofSites Remedial Action
328 96 Other246 72 Institutional Controls223 65 Containment222 65 Physical/Chemical Treatment (Ex-Situ - Assuming Excavation)192 56 Physical/Chemical Treatment (Ex- Situ - Assuming Pumping)102 30 Physical/Chemical Treatment (Ex-Situ)79 23 Air Emissions/Off-Gas Treatment76 22 Residuals (Secondary) Treatment69 20 Physical/Chemical Treatment (In-Situ)37 11 Biological Treatment (In-Situ)26 8 Thermal Treatment (Ex-Situ - Assuming Excavation)23 7 Biological Treatment (Ex-Situ - Assuming Excavation)18 5 Thermal Treatment (Ex-Situ)15 4 Biological Treatment (Ex- Situ - Assuming Pumping)6 2 Thermal Treatment (In-Situ)
1,662 Total Entries for Remedial Action341 Total Sites with Remedial Action Data
Source: SRA International, Superfund Redevelopment Initiative, SURE Database, January 5, 2004.
April 2, 20049
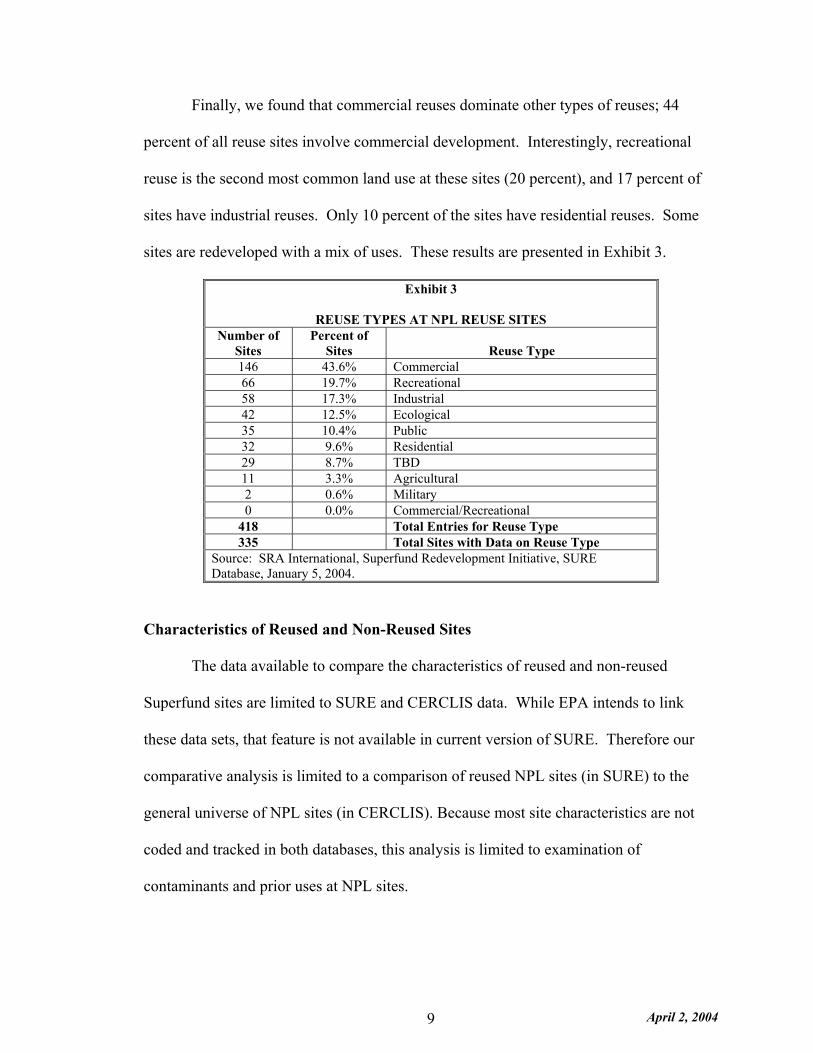
Finally, we found that commercial reuses dominate other types of reuses; 44
percent of all reuse sites involve commercial development. Interestingly, recreational
reuse is the second most common land use at these sites (20 percent), and 17 percent of
sites have industrial reuses. Only 10 percent of the sites have residential reuses. Some
sites are redeveloped with a mix of uses. These results are presented in Exhibit 3.
Exhibit 3
REUSE TYPES AT NPL REUSE SITESNumber of
SitesPercent of
Sites Reuse Type146 43.6% Commercial 66 19.7% Recreational 58 17.3% Industrial42 12.5% Ecological35 10.4% Public32 9.6% Residential 29 8.7% TBD 11 3.3% Agricultural2 0.6% Military0 0.0% Commercial/Recreational
418 Total Entries for Reuse Type335 Total Sites with Data on Reuse Type
Source: SRA International, Superfund Redevelopment Initiative, SUREDatabase, January 5, 2004.
Characteristics of Reused and Non-Reused Sites
The data available to compare the characteristics of reused and non-reused
Superfund sites are limited to SURE and CERCLIS data. While EPA intends to link
these data sets, that feature is not available in current version of SURE. Therefore our
comparative analysis is limited to a comparison of reused NPL sites (in SURE) to the
general universe of NPL sites (in CERCLIS). Because most site characteristics are not
coded and tracked in both databases, this analysis is limited to examination of
contaminants and prior uses at NPL sites.
April 2, 200410
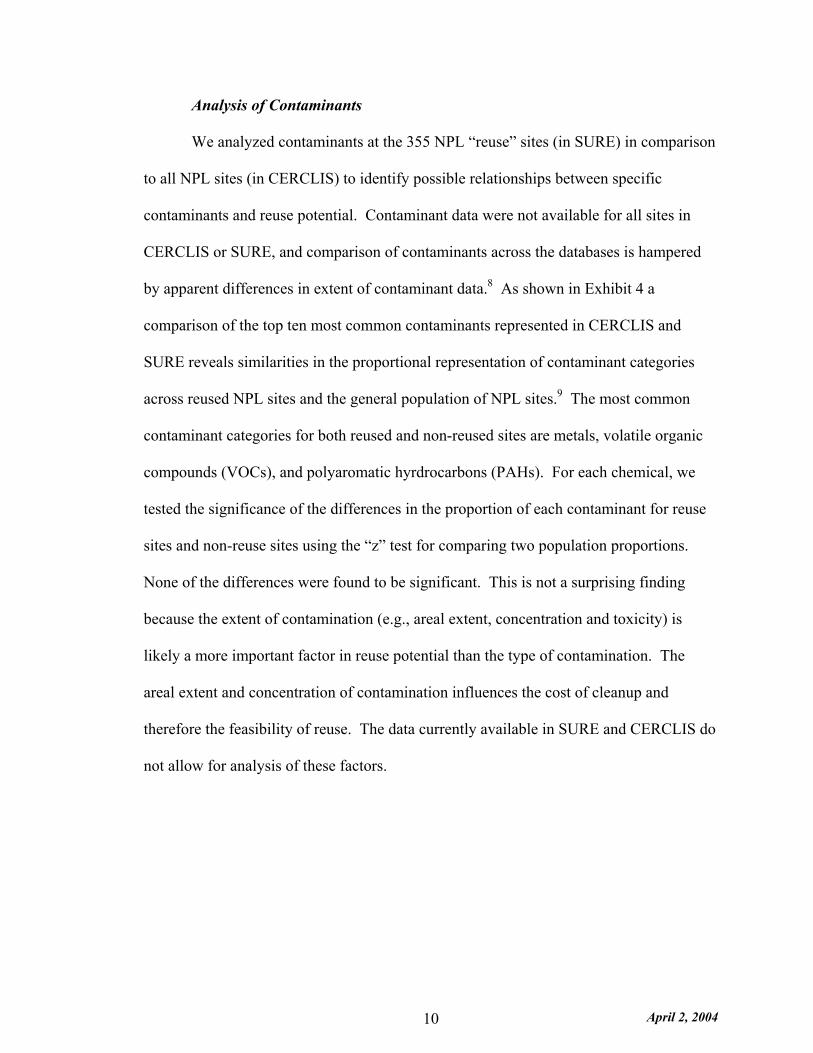
Analysis of Contaminants
We analyzed contaminants at the 355 NPL “reuse” sites (in SURE) in comparison
to all NPL sites (in CERCLIS) to identify possible relationships between specific
contaminants and reuse potential. Contaminant data were not available for all sites in
CERCLIS or SURE, and comparison of contaminants across the databases is hampered
by apparent differences in extent of contaminant data.8 As shown in Exhibit 4 a
comparison of the top ten most common contaminants represented in CERCLIS and
SURE reveals similarities in the proportional representation of contaminant categories
across reused NPL sites and the general population of NPL sites.9 The most common
contaminant categories for both reused and non-reused sites are metals, volatile organic
compounds (VOCs), and polyaromatic hyrdrocarbons (PAHs). For each chemical, we
tested the significance of the differences in the proportion of each contaminant for reuse
sites and non-reuse sites using the “z” test for comparing two population proportions.
None of the differences were found to be significant. This is not a surprising finding
because the extent of contamination (e.g., areal extent, concentration and toxicity) is
likely a more important factor in reuse potential than the type of contamination. The
areal extent and concentration of contamination influences the cost of cleanup and
therefore the feasibility of reuse. The data currently available in SURE and CERCLIS do
not allow for analysis of these factors.
April 2, 200411
Exhibit 4
COMPARISON OF TOP TEN CONTAMINANTS AT ALL NPLSITES AND REUSED NPL SITESALL SITES (CERCLIS) REUSE SITES (SURE)
Contaminant% Contaminant
Occurrences% Sites withContaminant
% ContaminantOccurrences
% Sites withContaminant
VOC 18.8% 51.8% 18.7% 84.6%Metals 18.2% 50.2% 18.8% 84.9%PAH 13.3% 36.8% 12.6% 57.0%Base Neutral Acids 11.7% 32.2% 11.4% 51.5%Inorganics 10.3% 28.3% 9.7% 43.8%Pesticides 8.0% 22.1% 7.3% 33.1%PCBs 7.8% 21.5% 7.5% 33.8%Dioxins/Dibenzofurans 3.9% 10.8% 4.8% 21.7%Organics 2.6% 7.1% 2.8% 12.5%Nitroaromatics 1.3% 3.5% 1.7% 7.7%Other 4.1% 11.2% 4.6% 20.6%% Total 100% 100%
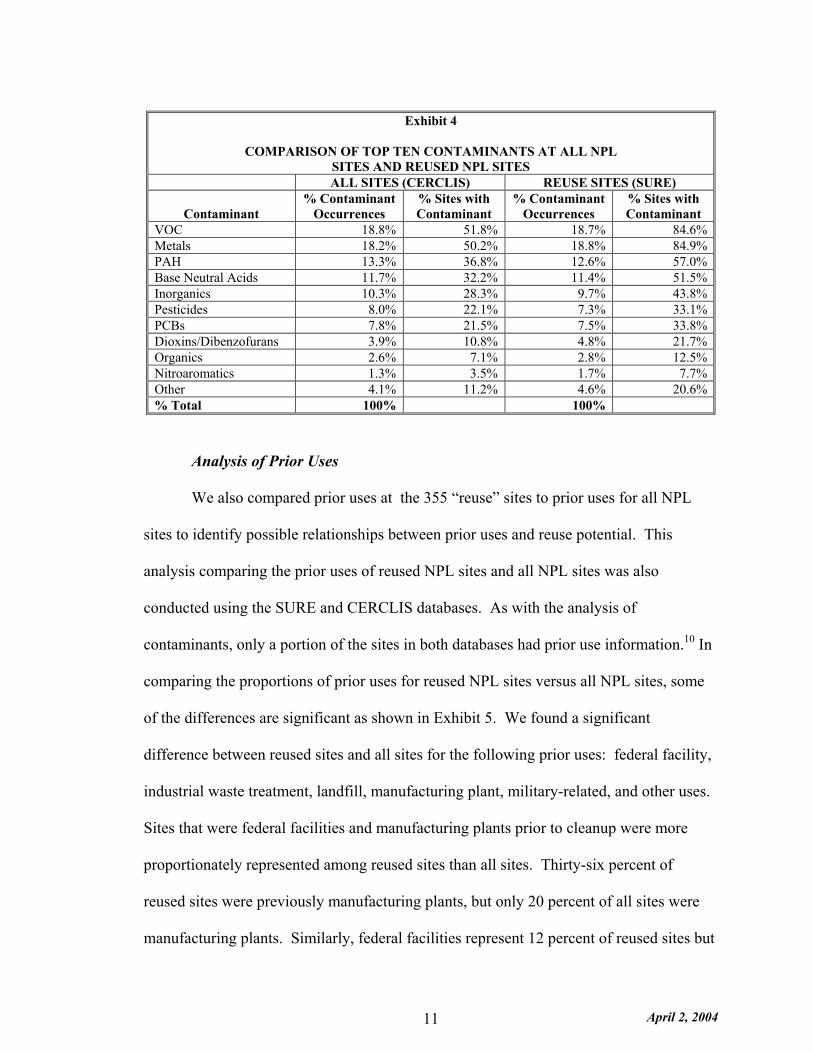
Analysis of Prior Uses
We also compared prior uses at the 355 “reuse” sites to prior uses for all NPL
sites to identify possible relationships between prior uses and reuse potential. This
analysis comparing the prior uses of reused NPL sites and all NPL sites was also
conducted using the SURE and CERCLIS databases. As with the analysis of
contaminants, only a portion of the sites in both databases had prior use information.10 In
comparing the proportions of prior uses for reused NPL sites versus all NPL sites, some
of the differences are significant as shown in Exhibit 5. We found a significant
difference between reused sites and all sites for the following prior uses: federal facility,
industrial waste treatment, landfill, manufacturing plant, military-related, and other uses.
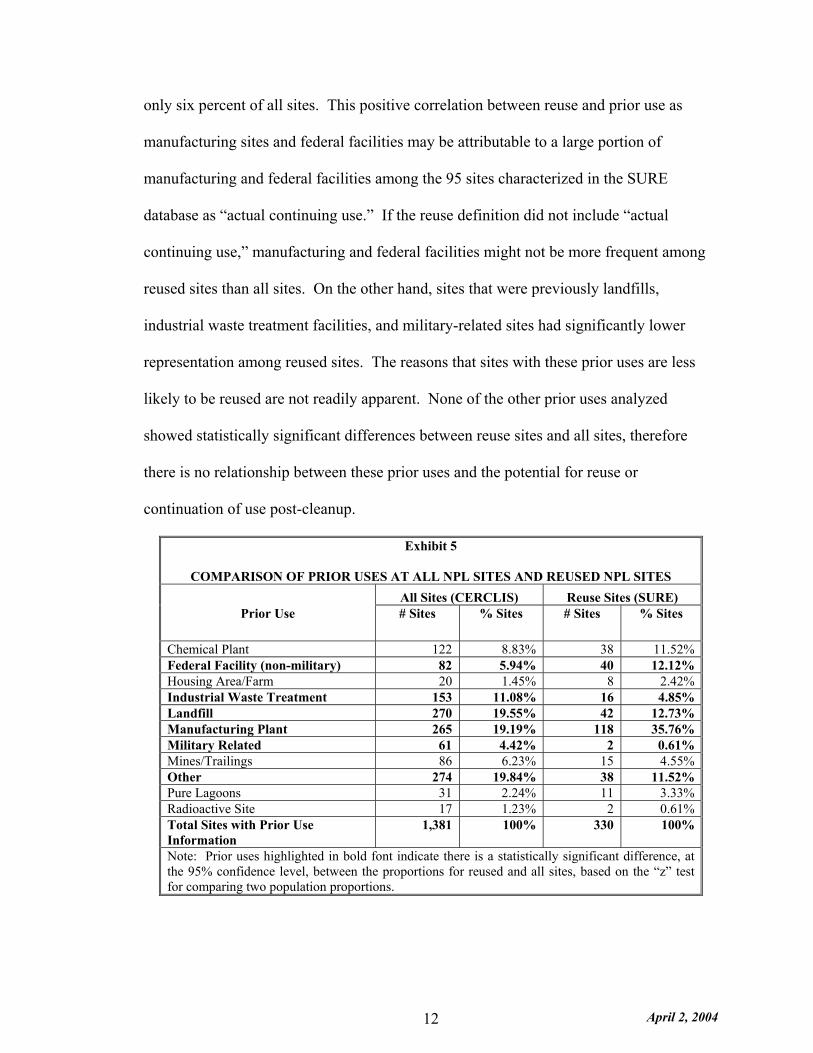
Sites that were federal facilities and manufacturing plants prior to cleanup were more
proportionately represented among reused sites than all sites. Thirty-six percent of
reused sites were previously manufacturing plants, but only 20 percent of all sites were
manufacturing plants. Similarly, federal facilities represent 12 percent of reused sites but
April 2, 200412
only six percent of all sites. This positive correlation between reuse and prior use as
manufacturing sites and federal facilities may be attributable to a large portion of
manufacturing and federal facilities among the 95 sites characterized in the SURE
database as “actual continuing use.” If the reuse definition did not include “actual
continuing use,” manufacturing and federal facilities might not be more frequent among
reused sites than all sites. On the other hand, sites that were previously landfills,
industrial waste treatment facilities, and military-related sites had significantly lower
representation among reused sites. The reasons that sites with these prior uses are less
likely to be reused are not readily apparent. None of the other prior uses analyzed
showed statistically significant differences between reuse sites and all sites, therefore
there is no relationship between these prior uses and the potential for reuse or
continuation of use post-cleanup.
Exhibit 5
COMPARISON OF PRIOR USES AT ALL NPL SITES AND REUSED NPL SITESAll Sites (CERCLIS) Reuse Sites (SURE)
Prior Use # Sites % Sites # Sites % Sites
Chemical Plant 122 8.83% 38 11.52%Federal Facility (non-military) 82 5.94% 40 12.12%Housing Area/Farm 20 1.45% 8 2.42%Industrial Waste Treatment 153 11.08% 16 4.85%Landfill 270 19.55% 42 12.73%Manufacturing Plant 265 19.19% 118 35.76%Military Related 61 4.42% 2 0.61%Mines/Trailings 86 6.23% 15 4.55%Other 274 19.84% 38 11.52%Pure Lagoons 31 2.24% 11 3.33%Radioactive Site 17 1.23% 2 0.61%Total Sites with Prior UseInformation
1,381 100% 330 100%
Note: Prior uses highlighted in bold font indicate there is a statistically significant difference, atthe 95% confidence level, between the proportions for reused and all sites, based on the “z” testfor comparing two population proportions.
April 2, 200413
Brownfields
Unlike other EPA programs that currently address reuse of contaminated
properties, the EPA Brownfields Program was specifically designed to promote the reuse
of brownfield sites, "properties, the expansion, redevelopment, or reuse of which may be
complicated by the presence of a hazardous substance, pollutant or contaminant."11 As
such, an important focus since its inception in 1995, has been on the integration of
cleanup and reuse. The stated mission of the program is "to empower states,
communities, and other stakeholders in economic development to work together in a
timely manner to prevent, assess, safely clean up, and sustainably reuse brownfields."12
To fulfill this mission, the Office of Brownfields Cleanup and Redevelopment (OBCR)
provides financial and technical assistance for brownfields revitalization, including grants
for environmental assessment and cleanup awarded to local governments and non-profit
organizations, and grants to assist states and tribes in the development of state
brownfields programs. Through these collaborations, EPA's assistance leverages state,
local, and private investments in brownfields redevelopment.
Given its focus on reuse, the Brownfields Program is intent on collecting reuse
information, including data on site characteristics and community impacts of reuse, but
data collection is complicated by the program’s implementation at the local level. As
part of the Brownfields Economic Redevelopment Initiative, the Brownfields
Management System (BMS) database was developed to track performance measure
information reported by EPA Brownfields Program grantees. To date, however, the data
available from BMS are of limited use in characterizing the nature of reuse because of
incomplete reporting. Of the 437 pilot communities that have received EPA Brownfields
April 2, 200414
Program pilot funding, 40 percent report that they have reuse activities underway.
Within these communities, EPA knows of 732 properties with reuse activities reported.13
However, pilot community reporting is variable and the proportion of pilot communities
reporting reuse activities is not known, so the above reuse statistics likely underestimate
the extent of reuse at sites in communities receiving EPA Brownfields Program funding.
Information on the types of reuse activities at brownfields sites is in text form and is not
consistently reported. Property- and parcel-level data fields in the BMS include acreage,
media affected, contaminants, former uses, and cleanup activities; however, data
collection and population of these fields is limited.14
The recent development of a new protocol developed by OBCR for collecting
data on specific environmental indicators will likely enable more comprehensive analyses
of site characteristics and the extent and nature of reuse on brownfields properties
receiving EPA Brownfields Program funding. The new Property Profile Form, which
grantees will be required to complete and maintain, contains data fields for the type of
contamination, current use, prior use, media affected, institutional controls, response
actions, acres cleaned up, redevelopment activities, and acres of green space created.
RCRA
The Resource Conservation and Recovery Act (RCRA) was enacted in 1976 with
the primary goals to protect human health and the environment from the potential hazards
of waste disposal, to conserve energy and natural resources, to reduce the amount of
waste generated, and to ensure that wastes are managed in an environmentally sound
April 2, 200415
manner. Activities at facilities that treat, store or dispose of hazardous wastes sometimes
release hazardous waste or hazardous constituents into the environment. Owners or
operators of these facilities are responsible for investigating and cleaning up releases
from their facilities. EPA's RCRA Corrective Action Program oversees these cleanups,
although some cleanups are overseen by states. There are approximately 3,800 sites in
the Corrective Action program nationally.
Some RCRA Corrective Action facilities are potential RCRA Brownfields,
defined by EPA as "a RCRA facility or portion of a RCRA facility that is not in full use,
where there is redevelopment potential, and where reuse or redevelopment of that site is
slowed due to real or perceived concerns about actual or potential contamination,
liability, and RCRA requirements."15 The RCRA Brownfields Prevention Initiative was
launched in 1998 to encouraged the reuse of potential RCRA Brownfields. The goal of
the initiative is to capitalize on the redevelopment potential of RCRA Brownfields to
achieve successful cleanup and long-term sustainable reuse that benefits communities.
EPA has undertaken several efforts that enhance its RCRA Brownfields Prevention
Initiative goals, including a RCRA Brownfields Pilot Program to encourage and
showcase innovative approaches to RCRA cleanups at potential RCRA Brownfields, and
the Targeted Site Effort Program to spur cleanup at RCRA sites with significant reuse
potential.
While the Superfund and Brownfield Programs are making significant strides
towards tracking reuse information, there is no parallel effort within the RCRA Program
to collect reuse data. Information on the extent of reuse in the RCRA Program is limited
April 2, 200416
to general reporting in program reports; pilot project descriptions; and success stories on
RCRA Cleanup Reforms, the RCRA Brownfields Prevention Initiative, and the Targeted
Site Effort Initiative. RCRA success stories and pilot project descriptions related to these
initiatives include anecdotal reuse information, such as reuse type, prior use, surrounding
use, acreage, contaminant, and response actions. Because project descriptions are
available for only a select few RCRA sites, a characterization of the extent of reuse
across all RCRA sites is not currently possible. Also, it is likely that continued use or
restored use would be more prevalent than a new reuse at RCRA Corrective Action sites,
given that a large proportion of Corrective Action sites continue to operate during
cleanup.
The RCRA Program does maintain databases with site information related to
contamination and cleanup: Resource Conservation and Recovery Act Information
(RCRAInfo) and RCRA Corrective Action Implementation Database (RCAID).
RCRAInfo provides general information, site location, and cleanup activities for
hazardous waste handlers. RCAID includes the type, extent, and impact of
contamination, remedial actions selected, and current land use for a random sample of
RCRA Corrective Action facilities. Neither database includes reuse information that
would enable an analysis of the extent of reuse across all RCRA facilities.
UST
The UST Program focuses on the assessment and cleanup of releases from
underground storage tanks and petroleum-contaminated sites. The Office of Underground
Storage Tanks (OUST) was created in 1985 to carry out a Congressional mandate, under
April 2, 200417
RCRA Subtitle I, to develop and implement a regulatory program to address the threat
that leaking underground storage tanks (USTs) pose to groundwater. Because of the large
universe of regulated USTs, OUST designed a program that is implemented by the states.
In addition to regulations requiring preventative measures, UST regulations require
corrective action at sites where leaks have occurred. OUST manages the Leaking
Underground Storage Tank Trust Fund which is used to oversee and enforce cleanups,
and pay for cleanups at sites where the owner/operator is unknown or unable to pay.
The Office of Underground Storage Tanks is responsible for promoting the
cleanup of UST sites. Of the 440,000 UST sites nationwide, 300,000 have completed
cleanups (68 percent), and many more are underway. One key element of this program is
to work together with federal, state, and local organizations and private partners to foster
the reuse and subsequent economic recovery of petroleum-contaminated sites. An
important tool for supporting this activity is federal brownfields assessment and cleanup
grant funding. Recognizing that many of the nation's brownfields are impacted by
underground storage tanks or some type of petroleum contamination, Congress expanded
the original EPA Brownfields Program to make petroleum sites eligible for brownfields
assessment and cleanup grant funding, in the January 2002 Small Business Liability
Relief and Brownfields Revitalization Act. Prior to the enactment of this law, petroleum-
contaminated sites were eligible for funding through the USTfields Initiative. A total of
50 high-priority petroleum-impacted sites were each awarded up to $100,000 for
assessment, clean up, and preparation for reuse.
April 2, 200418
There is no current effort within the UST Program to collect comprehensive data
on site reuse. Summaries of pilot projects provide brief backgrounds and information on
objectives, local partners, and contacts for each pilot project. The intended future use of
sites is reported consistently across all pilot summaries, whereas information on site
characteristics varies significantly. Site characteristics mentioned in the pilot summaries
include prior use, surrounding land use, general economic status of the community,
extent of contamination, type of contamination, site acreage, and response actions.
The UST Program reports semi-annually on its activities. These reports provide
aggregated information on the number of releases, cleanups initiated, cleanups
completed, and emergency responses for underground storage tank sites across regions
and states.16 Information on site reuse has not been tracked and included in these reports.
State Programs
States have their own hazardous waste site cleanup programs to address properties
that are not addressed under federal programs. EPA works closely with states and tribes
to develop partnerships that encourage cleanup of non-NPL hazardous waste sites.
Accordingly, EPA provides funding to assist states in building the capacity of their
voluntary cleanup programs. This funding supports effective state and tribal programs
and promotes cooperation between states, tribes, and regions in the cleanup of
contaminated properties.
While most states collect data and report on many factors related to site cleanup,
the availability of reuse information is less comprehensive and varies across states. Some
April 2, 200419
states provide aggregated reuse information in program reports, while others provide
more site-specific data through case study descriptions.
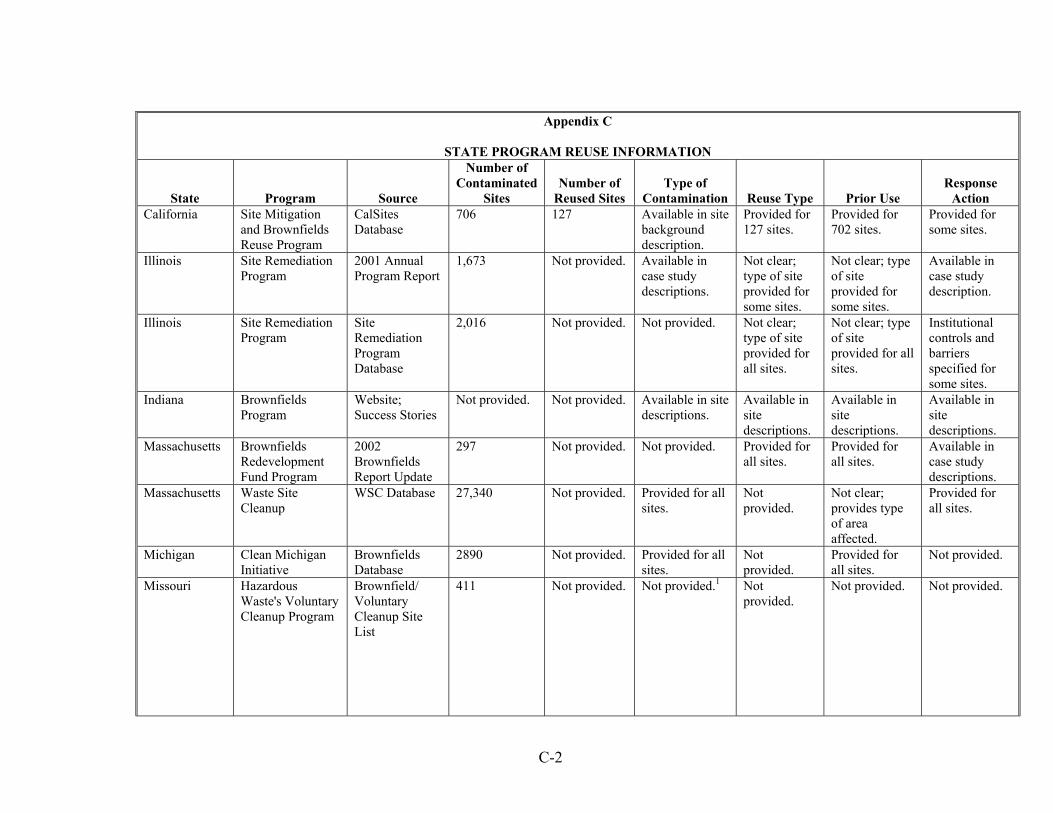
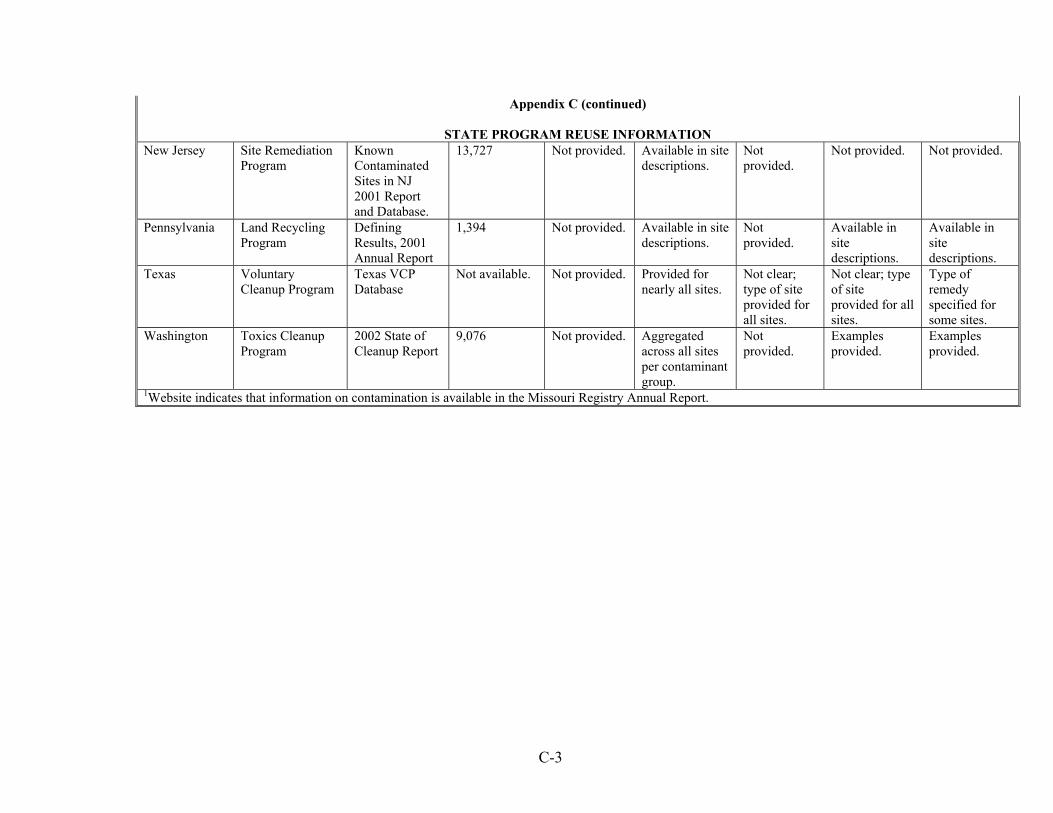
We identified 12 states with well-established reuse initiatives and searched for
data on reuse frequency and characteristics for each of those states. Appendix C
summarizes our research on the availability of state program information on such reuse
indicators as the number of contaminated sites, number of reused sites, contaminants,
reuse type, prior use, and response action. For most of the 12 states, reuse information is
collected through the states' brownfields and/or voluntary cleanup programs. Six of the
12 states California, Illinois, Massachusetts, Michigan, New Jersey, and Texas
have developed databases to track site-specific information related to cleanup, as part of
their efforts to evaluate progress in cleanup programs. Although indicators vary across
states, most of these state databases provide information on site location, type of
contamination, cleanup status, and response action. Of the six databases reviewed,
California is the only state that has compiled reuse information in a publicly-available
database.17
Given the availability of reuse information in California's CalSites database, we
analyzed the types of reuse and prior use of high priority, contaminated sites in California
(i.e., state Superfund sites). Of the 706 sites included in CalSites, 135 (19 percent) are
reported to have been reused. The remaining 571 sites do not report type of reuse, and
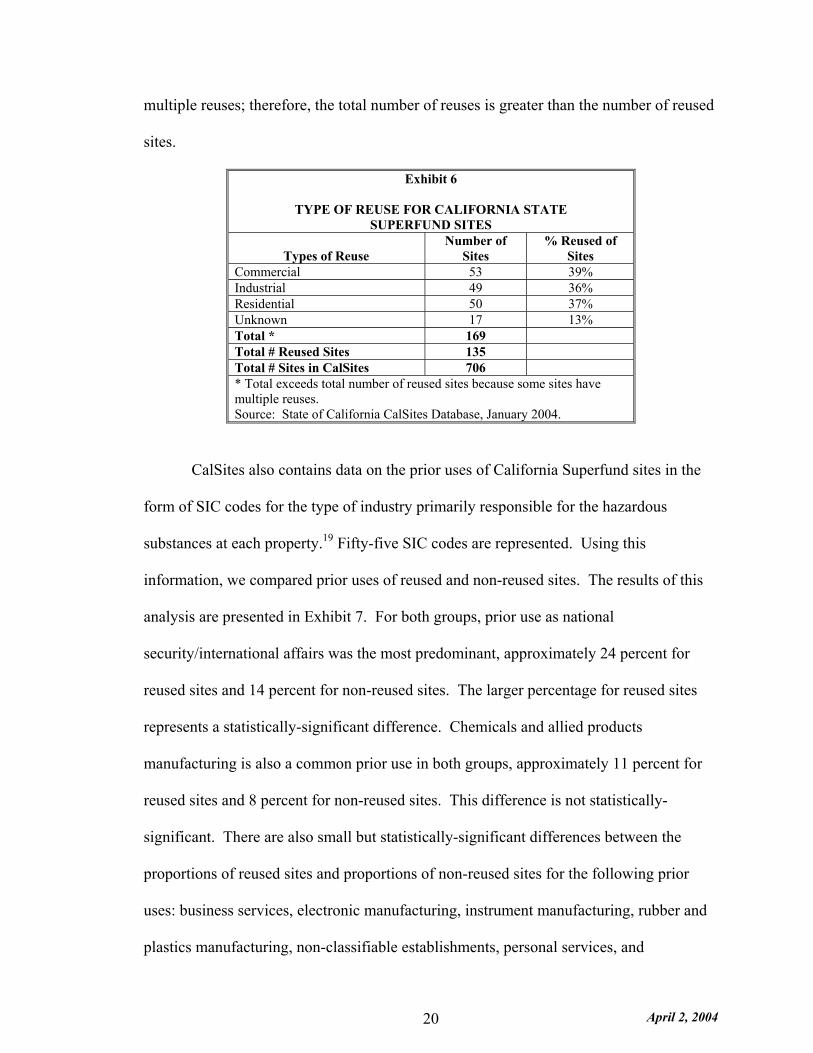
are therefore assumed not to have been reused.18 As shown in Exhibit 6, reuse types are
split very evenly among commercial, industrial, and residential development in
California, each occurring at between 36 and 39 percent of reused sites. Some sites had
April 2, 200420
multiple reuses; therefore, the total number of reuses is greater than the number of reused
sites.
Exhibit 6
TYPE OF REUSE FOR CALIFORNIA STATESUPERFUND SITES
Types of ReuseNumber of
Sites% Reused of
SitesCommercial 53 39%Industrial 49 36%Residential 50 37%Unknown 17 13%Total * 169Total # Reused Sites 135Total # Sites in CalSites 706* Total exceeds total number of reused sites because some sites havemultiple reuses.Source: State of California CalSites Database, January 2004.
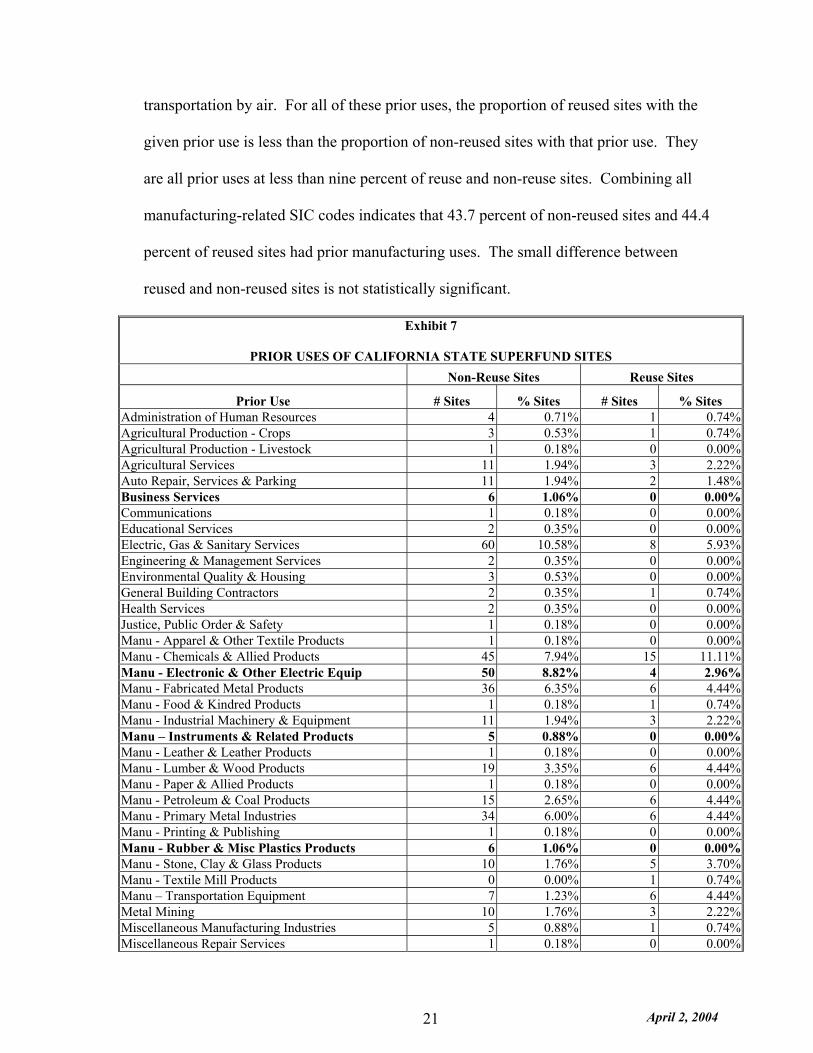
CalSites also contains data on the prior uses of California Superfund sites in the
form of SIC codes for the type of industry primarily responsible for the hazardous
substances at each property.19 Fifty-five SIC codes are represented. Using this
information, we compared prior uses of reused and non-reused sites. The results of this
analysis are presented in Exhibit 7. For both groups, prior use as national
security/international affairs was the most predominant, approximately 24 percent for
reused sites and 14 percent for non-reused sites. The larger percentage for reused sites
represents a statistically-significant difference. Chemicals and allied products
manufacturing is also a common prior use in both groups, approximately 11 percent for
reused sites and 8 percent for non-reused sites. This difference is not statistically-
significant. There are also small but statistically-significant differences between the
proportions of reused sites and proportions of non-reused sites for the following prior
uses: business services, electronic manufacturing, instrument manufacturing, rubber and
plastics manufacturing, non-classifiable establishments, personal services, and
April 2, 200421
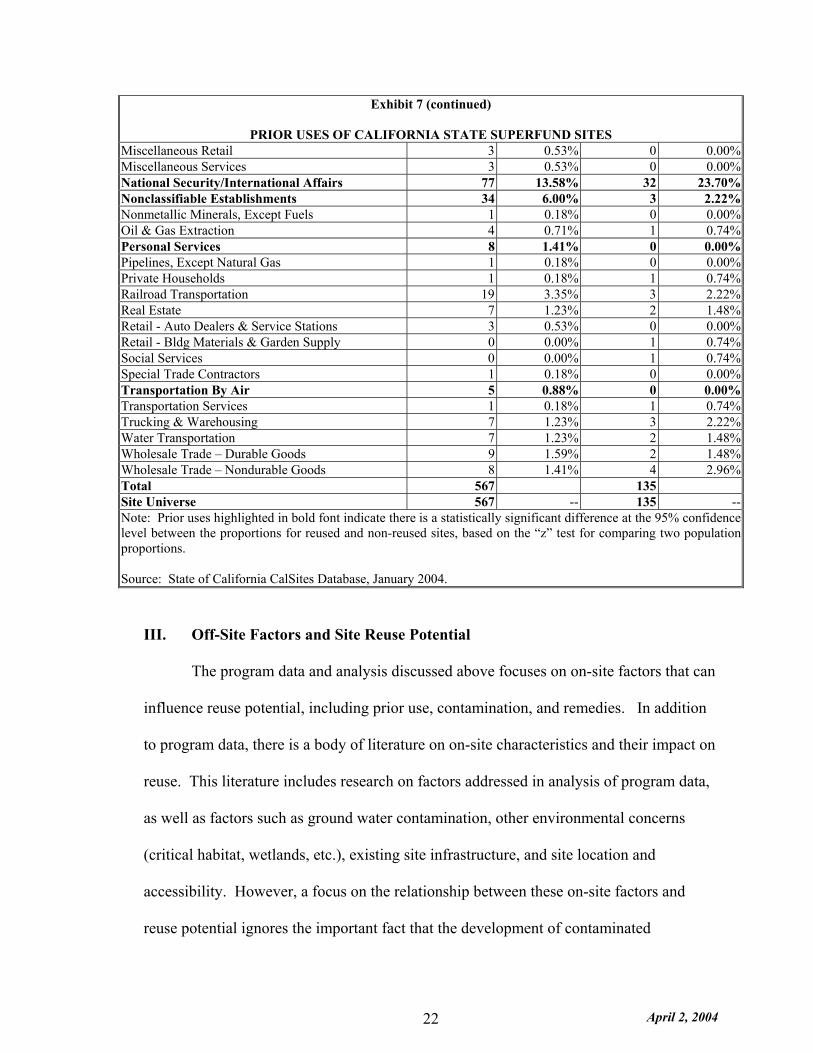
transportation by air. For all of these prior uses, the proportion of reused sites with the
given prior use is less than the proportion of non-reused sites with that prior use. They
are all prior uses at less than nine percent of reuse and non-reuse sites. Combining all
manufacturing-related SIC codes indicates that 43.7 percent of non-reused sites and 44.4
percent of reused sites had prior manufacturing uses. The small difference between
reused and non-reused sites is not statistically significant.
Exhibit 7
PRIOR USES OF CALIFORNIA STATE SUPERFUND SITESNon-Reuse Sites Reuse Sites
Prior Use # Sites % Sites # Sites % SitesAdministration of Human Resources 4 0.71% 1 0.74%Agricultural Production - Crops 3 0.53% 1 0.74%Agricultural Production - Livestock 1 0.18% 0 0.00%Agricultural Services 11 1.94% 3 2.22%Auto Repair, Services & Parking 11 1.94% 2 1.48%Business Services 6 1.06% 0 0.00%Communications 1 0.18% 0 0.00%Educational Services 2 0.35% 0 0.00%Electric, Gas & Sanitary Services 60 10.58% 8 5.93%Engineering & Management Services 2 0.35% 0 0.00%Environmental Quality & Housing 3 0.53% 0 0.00%General Building Contractors 2 0.35% 1 0.74%Health Services 2 0.35% 0 0.00%Justice, Public Order & Safety 1 0.18% 0 0.00%Manu - Apparel & Other Textile Products 1 0.18% 0 0.00%Manu - Chemicals & Allied Products 45 7.94% 15 11.11%Manu - Electronic & Other Electric Equip 50 8.82% 4 2.96%Manu - Fabricated Metal Products 36 6.35% 6 4.44%Manu - Food & Kindred Products 1 0.18% 1 0.74%Manu - Industrial Machinery & Equipment 11 1.94% 3 2.22%Manu – Instruments & Related Products 5 0.88% 0 0.00%Manu - Leather & Leather Products 1 0.18% 0 0.00%Manu - Lumber & Wood Products 19 3.35% 6 4.44%Manu - Paper & Allied Products 1 0.18% 0 0.00%Manu - Petroleum & Coal Products 15 2.65% 6 4.44%Manu - Primary Metal Industries 34 6.00% 6 4.44%Manu - Printing & Publishing 1 0.18% 0 0.00%Manu - Rubber & Misc Plastics Products 6 1.06% 0 0.00%Manu - Stone, Clay & Glass Products 10 1.76% 5 3.70%Manu - Textile Mill Products 0 0.00% 1 0.74%Manu – Transportation Equipment 7 1.23% 6 4.44%Metal Mining 10 1.76% 3 2.22%Miscellaneous Manufacturing Industries 5 0.88% 1 0.74%Miscellaneous Repair Services 1 0.18% 0 0.00%
April 2, 200422
Exhibit 7 (continued)
PRIOR USES OF CALIFORNIA STATE SUPERFUND SITESMiscellaneous Retail 3 0.53% 0 0.00%Miscellaneous Services 3 0.53% 0 0.00%National Security/International Affairs 77 13.58% 32 23.70%Nonclassifiable Establishments 34 6.00% 3 2.22%Nonmetallic Minerals, Except Fuels 1 0.18% 0 0.00%Oil & Gas Extraction 4 0.71% 1 0.74%Personal Services 8 1.41% 0 0.00%Pipelines, Except Natural Gas 1 0.18% 0 0.00%Private Households 1 0.18% 1 0.74%Railroad Transportation 19 3.35% 3 2.22%Real Estate 7 1.23% 2 1.48%Retail - Auto Dealers & Service Stations 3 0.53% 0 0.00%Retail - Bldg Materials & Garden Supply 0 0.00% 1 0.74%Social Services 0 0.00% 1 0.74%Special Trade Contractors 1 0.18% 0 0.00%Transportation By Air 5 0.88% 0 0.00%Transportation Services 1 0.18% 1 0.74%Trucking & Warehousing 7 1.23% 3 2.22%Water Transportation 7 1.23% 2 1.48%Wholesale Trade – Durable Goods 9 1.59% 2 1.48%Wholesale Trade – Nondurable Goods 8 1.41% 4 2.96%Total 567 135Site Universe 567 -- 135 --Note: Prior uses highlighted in bold font indicate there is a statistically significant difference at the 95% confidencelevel between the proportions for reused and non-reused sites, based on the “z” test for comparing two populationproportions.
Source: State of California CalSites Database, January 2004.
III. Off-Site Factors and Site Reuse Potential
The program data and analysis discussed above focuses on on-site factors that can
influence reuse potential, including prior use, contamination, and remedies. In addition
to program data, there is a body of literature on on-site characteristics and their impact on
reuse. This literature includes research on factors addressed in analysis of program data,
as well as factors such as ground water contamination, other environmental concerns
(critical habitat, wetlands, etc.), existing site infrastructure, and site location and
accessibility. However, a focus on the relationship between these on-site factors and
reuse potential ignores the important fact that the development of contaminated
April 2, 200423
properties, like all real estate development, is heavily influenced by off-site factors.
These off-site factors include surrounding land uses and neighborhood characteristics,
and most importantly local real estate market conditions.
This section discusses the relationship between contaminated site reuse and the
confluence of on-site and off-site factors that affect the feasibility of site reuse, with a
specific focus on the role of local real estate conditions. It also discusses the roles of
public policies and community involvement in stimulating reuse. The section focuses on
the issue from the perspective of private developers, who are an important target for land
reuse programs and whose investment decisions regarding site reuse potential are most
affected by local real estate markets.
Real Estate Market Conditions
Environmental protection specialists tend to view the cleanup and reuse of
contaminated sites as an environmental problem first, and an economic development
challenge second. Research on this subject, however, strongly suggests that the
feasibility of reusing contaminated land is primarily a real estate equation, one that is
complicated but not dominated by environmental and other on-site factors. Real estate
literature concerning the reuse of contaminated sites indicates that the local real estate
market is a primary determinant of value for any property, whether contaminated or not.20
Market factors affecting all properties include location, surrounding land uses, and local
economic conditions. Related issues, including local crime rates, school quality, and
proximity to amenities, also affect the value of sites for reuse. Available research
indicates that these factors are the predominant determinants of site reuse potential. A
April 2, 200424
2000 report by the Economic Development Agency notes that brownfield properties tend
to be located in neighborhoods with significant problems affecting development
potential, including “poor infrastructure or transportation access, crime, and related
ills.”21 A 1997 joint redevelopment study of the Urban Institute, the Northeast-Midwest
Institute, the University of Louisville, and the University of Northern Kentucky found
that environmental concerns are never the single obstacle that dooms development deals
involving contaminated land. In contrast, the study cited market conditions as a critical
factor, and noted that contamination issues exacerbate existing concerns related to weak
or uncertain market demand.22 In other words, contaminated properties are often viable
for private cleanup and reuse if located within communities with a high demand for
development and/or scarcity of developable properties, whereas other properties with
similar contamination problems may not be financially feasible to reuse in saturated
markets.
Both reports noted that environmental issues matter more when there is little or no
difference in the availability and price between properties in greenfield and urbanized
areas. The availability of developable greenspace in close proximity to brownfields
makes brownfields less attractive investments. For decades, transportation policies, tax
policies, and other public policies have essentially subsidized greenfield development,
leaving urban areas where brownfields are typically found at a comparative disadvantage
in terms of value.23 In addition, developers often find urban development more difficult
than suburban development for a host of reasons that have nothing to do with
contamination (e.g., building permit delays, higher development fees, parking
April 2, 200425
requirements), which is a disadvantage to the reuse of brownfields simply due to their
typical location in older urban areas.24
Superfund sites, which are often large industrial complexes, landfills and waste
treatment centers, and federal facilities tend to be located at the outskirts of urban areas or
in more isolated areas than typical brownfields sites. These locations harbor their own
real estate challenges apart from contamination, including the quality of infrastructure
and roads, and proximity to labor, markets, and suppliers.25
Public Policies
Over the past decade, federal, state, and local agencies have spent significant
resources to promote reuse of contaminated sites, using subsidies, technical assistance,
and liability assurances.26 Existing research indicates that if a potential reuse project is
marginal in terms of financial feasibility, public policies and programs aimed at
promoting reuse can positively affect feasibility. For example, the Urban
Institute/NEMW/University study noted that developers lacking experience with
contaminated properties often had misperceptions regarding liability and cleanup costs
that contributed to their reluctance to redevelop contaminated sites. When public
programs interceded to correct those misperceptions and aid developers in the
environmental due diligence process, many projects succeeded that would otherwise not
have gone forward.27 Another example of the potential impact of public policies is in
addressing the disparity of risk preferences between developers and lenders; although
developers may be willing to accept the financial risk associated with contaminated
properties, they are dependent on lenders, who may be more conservative.28 Public
programs that provide access to capital in the form of grants, low interest loans, loan
April 2, 200426
guarantees, and low cost environmental insurance can help reuse projects meet financial
feasibility thresholds. In addition, for developers concerned about delays in development
caused by the need for environmental assessment and cleanup, expedited review and
permitting can bolster the feasibility of redevelopment projects.29
The challenge for policy makers is to focus programs on sites that fall within the
“gray area” of feasibility, to avoid spending limited public resources on sites that will
likely be developed without assistance, as well as to avoid wasting resources trying to
stimulate private investment in properties that cannot meet real estate investment
requirements.30
Community Involvement
The interests and involvement of community groups impacted by redevelopment
can also play an important role in redevelopment decisions. Community involvement can
motivate redevelopment at some sites and present obstacles at others. The influence that
communities have is often exerted on issues related to the establishment of cleanup levels
and decisions regarding future land use. While the public’s input regarding land use
decisions is crucial, public refusal to accept anything less than the highest level of
cleanup, regardless of future use, can impede reuse.31 Regarding land use decisions,
residents may be wary of such issues as overcrowding of schools and increased
congestion that can result from large redevelopment projects, while municipalities may
be attracted to potential revenue increases from property taxes. The concerns and
perceived benefits of reuse are different for different stakeholders and very site-specific.
Thus, designation of cleanup levels and implementation of reuse plans often proves to be
April 2, 200427
a difficult task as agencies attempt to maintain a balance between environmental
protection, economic feasibility, and community interests.
IV. Conclusions
This paper focuses on reviewing available information to characterize the extent
and nature of reuse across EPA and state programs that address remediation and reuse of
contaminated property, and where possible analyzing characteristics of contaminated
sites and their relationship to site reuse. Characteristics that can influence reuse include
both on-site factors (e.g., contamination, prior use, site size) and off-site factors (e.g.,
local real estate market conditions), and public policies (subsidies, technical assistance,
and liability assurances). There are limited data available to examine on-site factors in
any comprehensive analytic manner. Therefore our analysis is limited to examination of
prior use at NPL and California Superfund sites, as well as an analysis of common
contaminants at NPL sites. We also reviewed the literature on the role of off-site factors,
particularly real estate market conditions, on the reuse potential of contaminated sites.
Overall, the research leaves many unanswered questions regarding the extent and
nature of reuse and the characteristics of sites that are being reused. It is not clear how
many sites addressed in different programs (particularly RCRA and UST) are reused, or
how they are being reused and whether the reuse is sustainable. In addition, sites that are
reused are not well characterized in terms of the on-site and off-site factors that increased
their reuse potential, or in terms of the relative contributions of various on-site and off-
site factors to reuse. In this section, we discuss the findings of our research as they relate
to data needs and limitations, the extent of reuse, the influence of on-site characteristics
April 2, 200428
on reuse, and relative contributions of on-site and off-site factors to contaminated site
reuse.
Data Needs and Limitations
One major finding of this research is that useable data to assess the extent of reuse
at contaminated sites within and across reuse programs is largely lacking. The lack of
reuse data is understandable given the missions of OSWER programs which, with the
exception of the Brownfields Program, focus on site cleanup as opposed to reuse.
Superfund is the only EPA program that currently has data to analyze the characteristics
of reused sites and the potential to compare them to the characteristics of non-reused
sites. The SURE database is a supplemental effort to collect reuse characteristics
information for NPL sites. Because it is a supplemental effort, however, data elements in
SURE are inconsistent with similar data elements in CERCLIS, making comparative
analysis difficult. In addition, analyses that rely on these data are hampered by a lack of
data on some potentially important characteristics (e.g., site size).
Given OSWER’s increasing focus on reuse and interest in characterizing the
extent and nature of reuse across its programs, expanding OSWER program data
collection efforts to include site characteristics and reuse information would improve
research and analytical opportunities. Specifically, OSWER programs could expand
existing databases to include reuse information, or develop new and comprehensive
systems for collecting and managing cleanup and reuse data. The Brownfields Program
has recently undertaken efforts to greatly enhance its collection and integration of reuse
data by requiring grantees to maintain individual site profiles that contain site
April 2, 200429
characteristics and reuse data. The Brownfields Program will then enter these data into
its expanded Brownfields Management System where it will be available for analytical
purposes. This approach could serve as a model for other programs, and may actually be
easier to implement in other OSWER programs because EPA has more control over data
collection and management outside of the grantee/grantor relationship of the Brownfields
Program.
Extent of Reuse
There is limited information available on the extent of reuse occurring at formerly
contaminated sites. From what we know, it appears as though the frequency of reuse of
Superfund sites is relatively low. Among NPL sites, the Superfund Redevelopment
Program estimates that 335 of 1,948 NPL sites (17 percent) have been reused or are
slated for reuse. Of these, 138 (41 percent) have new uses in operation, 94 (28 percent)
are slated for reuse, and 103 (31 percent) are sites that have continued or restored prior
uses. Based on the State of California’s data on the state’s Superfund sites, we estimate
that 127 of 706 sites, or 19 percent, have been returned to reuse after cleanup. This
proportion of reuse is similar to the proportion of NPL sites reused (17 percent). While
the extent of reuse cannot be estimated for other programs reviewed, we would expect the
proportions to be higher, particularly if continued and restored use are included, because
RCRA and UST sites tend to be less contaminated and house more active facilities.
Influence of On-site Characteristics on Reuse
Our preliminary analyses of on-site characteristics are limited by lack of data and
the results are mixed and inconclusive. The analysis of contaminants at NPL sites does
April 2, 200430
not show any one category of contaminant to be correlated with reuse. We expect that
the concentration and toxicity of contaminants might have more of an impact on reuse
potential than contaminant type. The analysis of NPL site prior uses shows a positive
correlation between site reuse and manufacturing and federal facility prior use. This may
be partially explained if manufacturing and federal facilities dominate the 103 sites where
prior uses may have been continued or restored during and after cleanup. The results also
indicate that landfill, waste treatment, and military prior uses are less common among
reused sites than all sites. The preliminary analysis of California Superfund sites reveals
that of the eight prior use categories with significant differences in proportions between
reused and non-reused sites, all except national security/international affairs are less
common among reuse sites than all sites, including three manufacturing categories.
National security/international affairs is the only prior use that is more common among
reuse sites.
Assessing Disparate Factors that Influence Reuse
The literature review of real estate market conditions and contaminated site reuse
potential clearly demonstrates that real estate market conditions are a primary driver of
reuse at all sites, regardless of contamination, and that contamination is a complicating
but typically not a determining factor in the feasibility of reuse. The importance of off-
site factors in reuse decisions suggests that information on on-site characteristics are
limited in their ability to characterize site reuse potential. In addition, there are likely
confounding factors that influence results. For example, although the NPL analysis
shows that manufacturing sites are positively correlated with a reuse, causation may lie in
the location of these sites or the existing infrastructure at them.
April 2, 200431
Ideally, policy makers could conduct analyses of contaminated site reuse potential
that would integrate on-site and off-site characteristics. However, currently available
data do not support such analyses and there is a disconnect between available program
data and the literature on reuse characteristics; it is difficult to use one set of information
to substantiate the findings of the other. To enable more integrated analyses, EPA or
state programs could conduct local case study analyses to assess the relative contributions
of reuse factors. Such analyses might require in-depth data collection on contaminated
sites in a particular locale, and would include all of the relevant on-site factors (e.g., site
size, type and extent of contamination, prior uses), as well off-site factors (e.g., real estate
market trends, site accessibility, availability of public policy incentives and subsidies).
Results from such local analyses would be valuable in identifying the relative
contributions of various reuse factors in characterizing reuse potential.
A-1
Appendix A
SUMMARY OF E2 CASE STUDIES(REUSE FACT SHEETS)
A-2
Exhibit A-1
SUMMARY OF E2 CASE STUDIES(REUSE FACT SHEETS)
Project
OSWERProgram
Office Type of Reuse Acres*Aspen Grove Lane,Burnsville, MN Brownfields Residential 2.3
Atlantic Steel,Atlanta, GA RCRA Residential and commercial (retail, office,
entertainment) 138
Century Brass,Waterbury, CT RCRA Commercial 90
Chisman Creek,York County, VA Superfund Recreational (softball and soccer fields) --
Clearwater, FL UST Medical (non-profit health clinic) --Commodore Semiconductor Group,Norristown, PA Superfund Commercial (future intended use) 10+
Copeland Service Station,Milwaukee, WI UST Commercial (coffee shop) --
Denver Radium,Denver, CO Superfund Commercial 17
Gateway District,Salt Lake City, UT Brownfields Residential and commercial (retail, museum,
theatre) 40
General Electric Appliance Park East,Columbia, MD RCRA Commercial (offices, retail, restaurants, theatre) 21
Houston, TX UST Commercial (baseball stadium, restaurants,offices) --
Jackson, MI Brownfields Commercial (power utility corporateheadquarters) (3 blocks)
Kane and Lombard Street Drums,Baltimore, MD Superfund Recreational (golf driving range) --
Kenosha Lakefront,Kenosha, WI RCRA Recreational (park), residential, commercial
(museum), and transportation (streetcar system) 69
Northern Type Printing,Glen Cove, NY Brownfields Commercial --
Pontiac Centerpoint,Pontiac, MI RCRA
Industrial (assembly line manufacturing) andcommercial (business park, restaurants, hotels,retail)
--
Prestolite Battery,Vincennes, IN Superfund Commercial --
Publicker Industries,Philadelphia, PA Superfund Industrial (cargo handling facility) and
transportation (passenger ship terminal) 42
Rocky Mountain Arsenal,Denver, CO Superfund Recreational (trails and bike paths) and
ecological (wildlife refuge) --
Sparton Technology,Albuquerque, NM RCRA Commercial (car dealership) 12
St. Louis Commerce Center,St. Louis, MO Brownfields Commercial 20
Taft Garage,Lincoln City, OR UST Residential --
West Ogden Avenue,Chicago, IL UST Ecological (pocket park) --

A-3
Exhibit A-1 (continued)
SUMMARY OF E2 CASE STUDIES(REUSE FACT SHEETS)
Westinghouse Electric,Emeryville, CA Brownfields Residential and commercial 20
Whitney Screw,Nashua, NH UST Commercial (retail, offices) 5.4
* All values are approximate. Dashes indicate that acreage data are not available.
B-1
Appendix B
ANALYSIS OF EXTENT AND NATURE OFREUSE OF SUPERFUND SITES
B-2
Exhibit B-1
COMPARISON OF NPL STATUS AT ALL NPL SITESAND REUSED NPL SITES
NPL StatusAll Sites
(CERCLIS)All Sites(SURE)
Currently on Final NPL 1,241 268Deleted from Final NPL 276 80Proposed for NPL 54 5Removed from Proposed NPL 61 1Site is Part of NPL Site 310 1Withdrawn 6 0Total 1,948 355
B-3
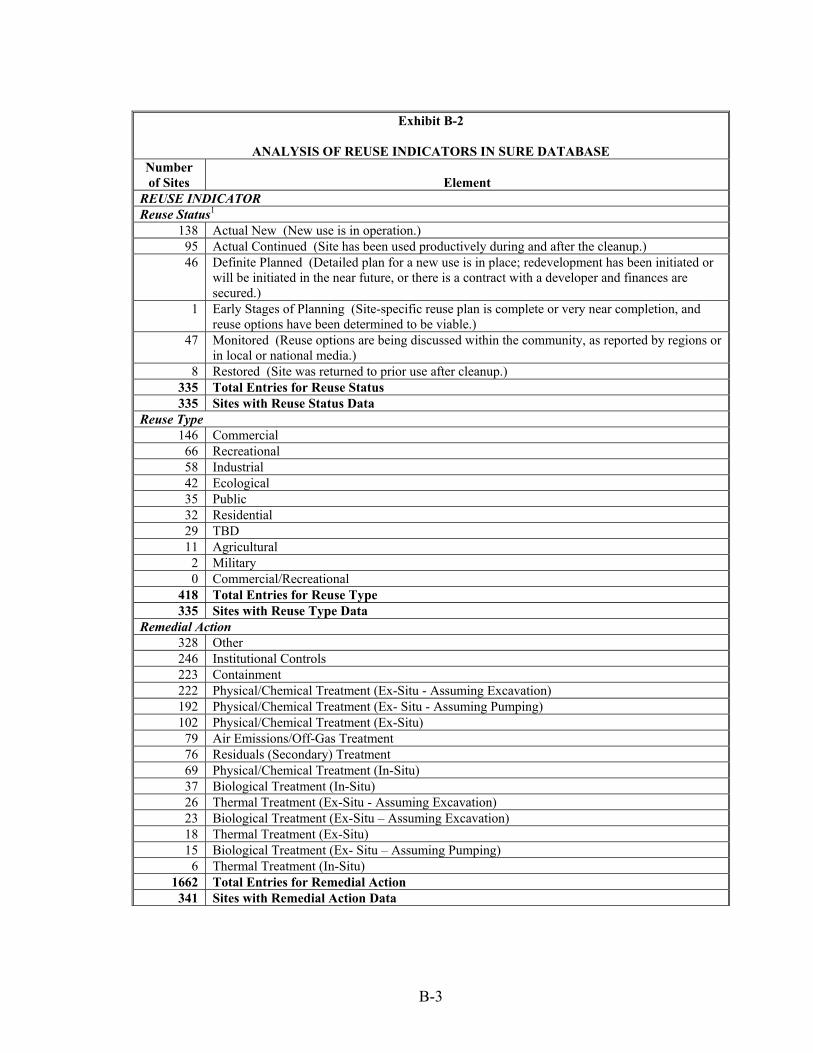
Exhibit B-2
ANALYSIS OF REUSE INDICATORS IN SURE DATABASENumberof Sites Element
REUSE INDICATORReuse Status1
138 Actual New (New use is in operation.)95 Actual Continued (Site has been used productively during and after the cleanup.)46 Definite Planned (Detailed plan for a new use is in place; redevelopment has been initiated or
will be initiated in the near future, or there is a contract with a developer and finances aresecured.)
1 Early Stages of Planning (Site-specific reuse plan is complete or very near completion, andreuse options have been determined to be viable.)
47 Monitored (Reuse options are being discussed within the community, as reported by regions orin local or national media.)
8 Restored (Site was returned to prior use after cleanup.)335 Total Entries for Reuse Status335 Sites with Reuse Status Data
Reuse Type 146 Commercial 66 Recreational58 Industrial42 Ecological35 Public32 Residential 29 TBD 11 Agricultural
2 Military0 Commercial/Recreational
418 Total Entries for Reuse Type335 Sites with Reuse Type Data
Remedial Action328 Other246 Institutional Controls223 Containment222 Physical/Chemical Treatment (Ex-Situ - Assuming Excavation)192 Physical/Chemical Treatment (Ex- Situ - Assuming Pumping)102 Physical/Chemical Treatment (Ex-Situ)79 Air Emissions/Off-Gas Treatment76 Residuals (Secondary) Treatment69 Physical/Chemical Treatment (In-Situ)37 Biological Treatment (In-Situ)26 Thermal Treatment (Ex-Situ - Assuming Excavation)23 Biological Treatment (Ex-Situ – Assuming Excavation)18 Thermal Treatment (Ex-Situ)15 Biological Treatment (Ex- Situ – Assuming Pumping)
6 Thermal Treatment (In-Situ)1662 Total Entries for Remedial Action341 Sites with Remedial Action Data
B-4
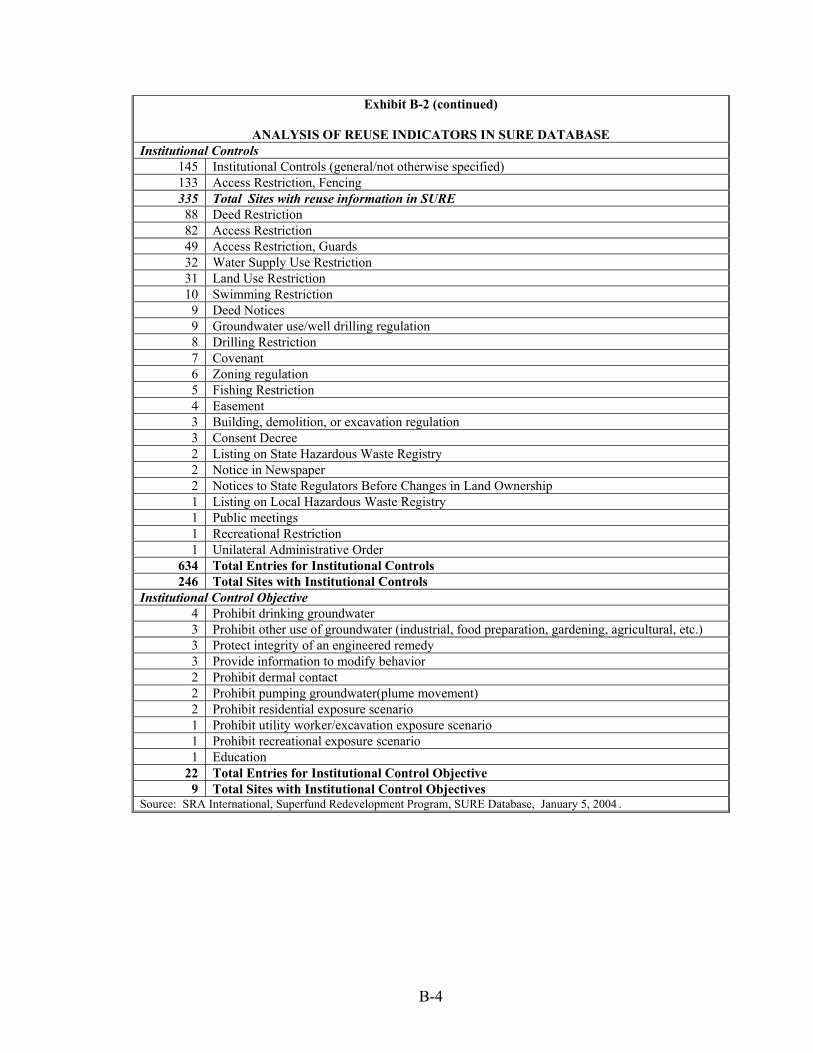
Exhibit B-2 (continued)
ANALYSIS OF REUSE INDICATORS IN SURE DATABASEInstitutional Controls
145 Institutional Controls (general/not otherwise specified)133 Access Restriction, Fencing335 Total Sites with reuse information in SURE88 Deed Restriction82 Access Restriction49 Access Restriction, Guards32 Water Supply Use Restriction31 Land Use Restriction10 Swimming Restriction
9 Deed Notices9 Groundwater use/well drilling regulation8 Drilling Restriction7 Covenant6 Zoning regulation5 Fishing Restriction4 Easement3 Building, demolition, or excavation regulation3 Consent Decree2 Listing on State Hazardous Waste Registry2 Notice in Newspaper2 Notices to State Regulators Before Changes in Land Ownership1 Listing on Local Hazardous Waste Registry1 Public meetings1 Recreational Restriction1 Unilateral Administrative Order
634 Total Entries for Institutional Controls246 Total Sites with Institutional Controls
Institutional Control Objective4 Prohibit drinking groundwater3 Prohibit other use of groundwater (industrial, food preparation, gardening, agricultural, etc.)3 Protect integrity of an engineered remedy3 Provide information to modify behavior2 Prohibit dermal contact2 Prohibit pumping groundwater(plume movement)2 Prohibit residential exposure scenario1 Prohibit utility worker/excavation exposure scenario1 Prohibit recreational exposure scenario1 Education
22 Total Entries for Institutional Control Objective9 Total Sites with Institutional Control Objectives
Source: SRA International, Superfund Redevelopment Program, SURE Database, January 5, 2004 .
B-5
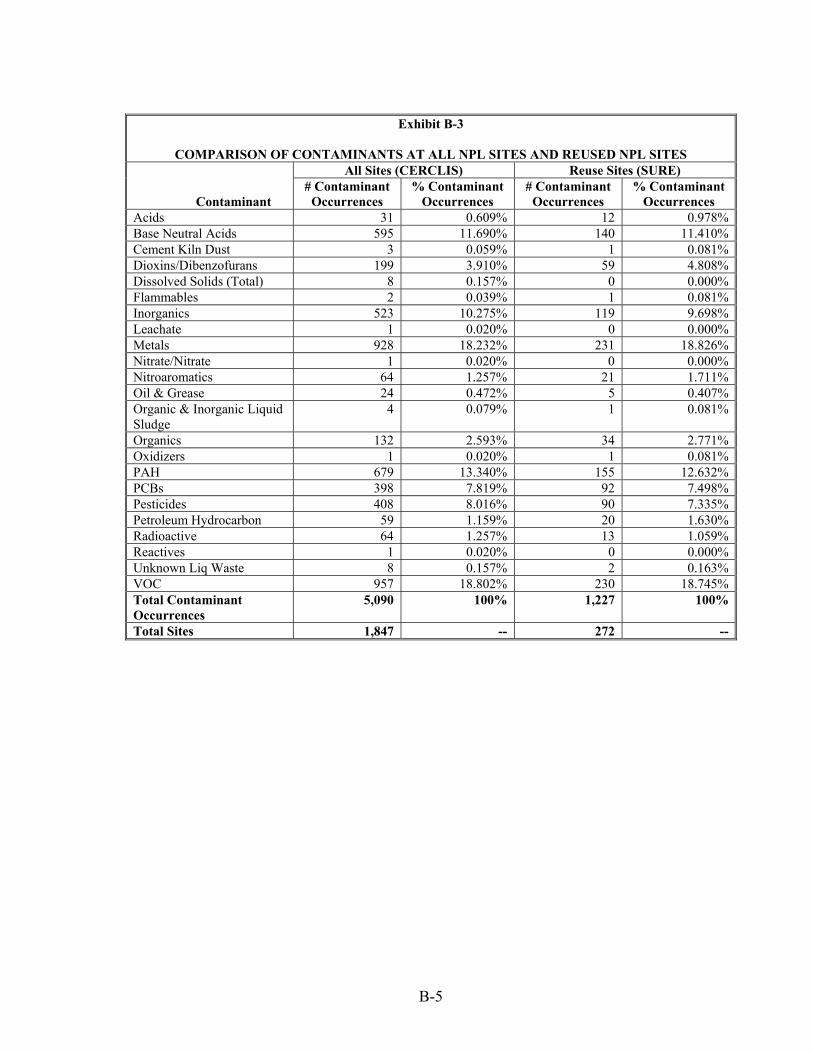
Exhibit B-3
COMPARISON OF CONTAMINANTS AT ALL NPL SITES AND REUSED NPL SITESAll Sites (CERCLIS) Reuse Sites (SURE)
Contaminant# Contaminant
Occurrences% Contaminant
Occurrences# Contaminant
Occurrences% Contaminant
OccurrencesAcids 31 0.609% 12 0.978%Base Neutral Acids 595 11.690% 140 11.410%Cement Kiln Dust 3 0.059% 1 0.081%Dioxins/Dibenzofurans 199 3.910% 59 4.808%Dissolved Solids (Total) 8 0.157% 0 0.000%Flammables 2 0.039% 1 0.081%Inorganics 523 10.275% 119 9.698%Leachate 1 0.020% 0 0.000%Metals 928 18.232% 231 18.826%Nitrate/Nitrate 1 0.020% 0 0.000%Nitroaromatics 64 1.257% 21 1.711%Oil & Grease 24 0.472% 5 0.407%Organic & Inorganic LiquidSludge
4 0.079% 1 0.081%
Organics 132 2.593% 34 2.771%Oxidizers 1 0.020% 1 0.081%PAH 679 13.340% 155 12.632%PCBs 398 7.819% 92 7.498%Pesticides 408 8.016% 90 7.335%Petroleum Hydrocarbon 59 1.159% 20 1.630%Radioactive 64 1.257% 13 1.059%Reactives 1 0.020% 0 0.000%Unknown Liq Waste 8 0.157% 2 0.163%VOC 957 18.802% 230 18.745%Total ContaminantOccurrences
5,090 100% 1,227 100%
Total Sites 1,847 -- 272 --
B-6
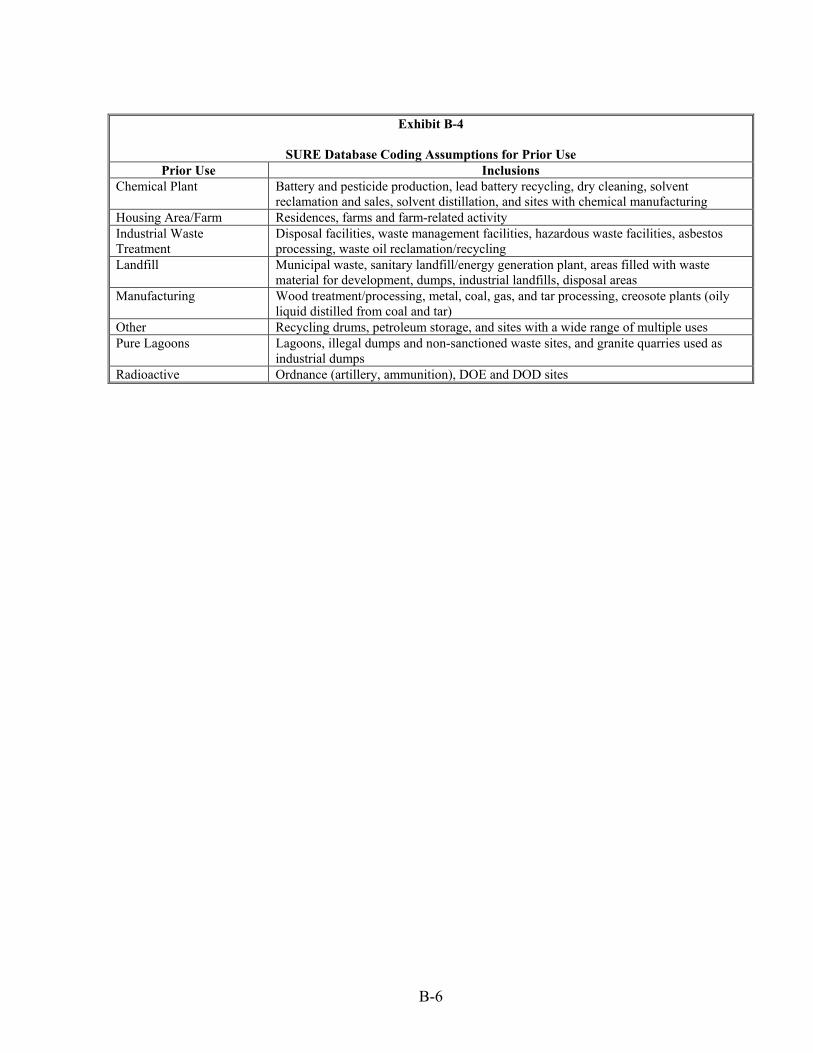
Exhibit B-4
SURE Database Coding Assumptions for Prior UsePrior Use Inclusions
Chemical Plant Battery and pesticide production, lead battery recycling, dry cleaning, solventreclamation and sales, solvent distillation, and sites with chemical manufacturing
Housing Area/Farm Residences, farms and farm-related activityIndustrial WasteTreatment
Disposal facilities, waste management facilities, hazardous waste facilities, asbestosprocessing, waste oil reclamation/recycling
Landfill Municipal waste, sanitary landfill/energy generation plant, areas filled with wastematerial for development, dumps, industrial landfills, disposal areas
Manufacturing Wood treatment/processing, metal, coal, gas, and tar processing, creosote plants (oilyliquid distilled from coal and tar)
Other Recycling drums, petroleum storage, and sites with a wide range of multiple usesPure Lagoons Lagoons, illegal dumps and non-sanctioned waste sites, and granite quarries used as
industrial dumpsRadioactive Ordnance (artillery, ammunition), DOE and DOD sites
C-1
Appendix C
STATE PROGRAM REUSE INFORMATION
C-2
Appendix C
STATE PROGRAM REUSE INFORMATION
State Program Source
Number ofContaminated
SitesNumber of
Reused SitesType of
Contamination Reuse Type Prior UseResponse
ActionCalifornia Site Mitigation
and BrownfieldsReuse Program
CalSitesDatabase
706 127 Available in sitebackgrounddescription.
Provided for127 sites.
Provided for702 sites.
Provided forsome sites.
Illinois Site RemediationProgram
2001 AnnualProgram Report
1,673 Not provided. Available incase studydescriptions.
Not clear;type of siteprovided forsome sites.
Not clear; typeof siteprovided forsome sites.
Available incase studydescription.
Illinois Site RemediationProgram
SiteRemediationProgramDatabase
2,016 Not provided. Not provided. Not clear;type of siteprovided forall sites.
Not clear; typeof siteprovided for allsites.
Institutionalcontrols andbarriersspecified forsome sites.
Indiana BrownfieldsProgram
Website;Success Stories
Not provided. Not provided. Available in sitedescriptions.
Available insitedescriptions.
Available insitedescriptions.
Available insitedescriptions.
Massachusetts BrownfieldsRedevelopmentFund Program
2002BrownfieldsReport Update
297 Not provided. Not provided. Provided forall sites.
Provided forall sites.
Available incase studydescriptions.
Massachusetts Waste SiteCleanup
WSC Database 27,340 Not provided. Provided for allsites.
Notprovided.
Not clear;provides typeof areaaffected.
Provided forall sites.
Michigan Clean MichiganInitiative
BrownfieldsDatabase
2890 Not provided. Provided for allsites.
Notprovided.
Provided forall sites.
Not provided.
Missouri HazardousWaste's VoluntaryCleanup Program
Brownfield/VoluntaryCleanup SiteList
411 Not provided. Not provided.1 Notprovided.
Not provided. Not provided.
C-3
Appendix C (continued)
STATE PROGRAM REUSE INFORMATIONNew Jersey Site Remediation
ProgramKnownContaminatedSites in NJ2001 Reportand Database.
13,727 Not provided. Available in sitedescriptions.
Notprovided.
Not provided. Not provided.
Pennsylvania Land RecyclingProgram
DefiningResults, 2001Annual Report
1,394 Not provided. Available in sitedescriptions.
Notprovided.
Available insitedescriptions.
Available insitedescriptions.
Texas VoluntaryCleanup Program
Texas VCPDatabase
Not available. Not provided. Provided fornearly all sites.
Not clear;type of siteprovided forall sites.
Not clear; typeof siteprovided for allsites.
Type ofremedyspecified forsome sites.
Washington Toxics CleanupProgram
2002 State ofCleanup Report
9,076 Not provided. Aggregatedacross all sitesper contaminantgroup.
Notprovided.
Examplesprovided.
Examplesprovided.
1Website indicates that information on contamination is available in the Missouri Registry Annual Report.
C-4
ENDNOTES
1 The Federal Facilities Restoration and Reuse program activities and reuse information are not discussed in thispaper.2 E2, Cross-OSWER Reuse Fact Sheets, draft version, prepared for US EPA/OSRTI, October 2003.3 Data on the beneficial effects of reuse are discussed in a companion paper entitled, Overview of Existing Studies onCommunity Impacts of Reuse.4 EPA announced 10 Superfund Redevelopment Initiative pilots in 1999, 40 in 2000, and 19 in 2002, for a total of69 pilot cities, http://www.epa.gov/superfund/programs/recycle/pilot/index.htm.5 Data on the NPL status of sites in the SURE database are detailed in Appendix B, Exhibit B-1.6 A more detailed breakout is presented in Appendix B, Exhibit B-2.7 US Environmental Protection Agency, definition of institutional controls, http://www.epa.gov/superfund/action/ic/.8 Because coded contaminant information is not available in the copy of the CERCLIS database used for thisanalysis, we conducted online searches of CERCLIS to determine the frequency of contaminants across sites. Thenumber of sites with each contaminant is systematically higher in SURE compared to CERCLIS, which is likelyattributable to differences in how the two databases handle reporting of multiple contaminants at each site.9 Detailed results are presented in Appendix B, Exhibit B-3.10 In SURE, this information was presented as a description, and therefore was coded to correspond to the respective“site incident” category in CERCLIS. To code these data, we made assumptions that introduce uncertainty into theanalysis; these assumptions are listed in Appendix B, Exhibit B-4. For the purpose of this analysis, prior usecategories were narrowed down to the eleven categories presented in Exhibit 5. All other categories in CERCLIS,including abandoned, city contamination, dioxin, and wells, were grouped into the “Other” category. Each site wascoded with only one prior use in both SURE and CERCLIS.11 U.S. Environmental Protection Agency, Reusing Land and Restoring Hope: A Report to Stakeholders from theUS EPA Brownfields Program, November 20, 2003.12 Brownfields Cleanup and Redevelopment, Brownfields Mission, www.epa.gov/brownfields/mission.htm.13 Provided by the Office of Brownfields Cleanup and Redevelopment, January 22, 2004.14 The low proportion of properties reporting reuse information is a result of the voluntary nature of the program,and the management of the data by local grantees. BMS contains more complete data on some socioeconomicindicators, including jobs and investment dollars leveraged.15 RCRA Brownfields Prevention Initiative web page, www.epa.gov/swerosps/rcrabf/index.html.16 EPA, Office of Underground Storage Tanks, Memorandum: FY 2003 Semi-Annual End-of-Year Activity Report,November 2003.17 Federal brownfields legislation passed in January 2002 requires states to maintain, and make public, informationon future use limitations and institutional controls at brownfields sites in state programs. This legislation may resultin more comprehensive data collection of reuse information across states and the development of state databaseswith cleanup and reuse information.18 Sites assumed not to have been reused have zeroes in the reuse type fields. It is unclear whether zeroes indicateno reuse or incomplete data.19 SIC codes are not included for four Superfund sites that have not been reused.20 Jack Ackerman, Vanasse Hangen Brustlin, “Potential Brownfields Projects: The Good, the Bad, and the Ugly,”
C-5
July 1999, www.environews.com/centers/good.html.21 Ibid and Peter Meyer et al., Reclamation and Economic Regeneration of Brownfields, prepared for the USEconomic Development Administration, 2000.22 Urban Institute, Northeast-Midwest Institute, University of Louisville, University of Northern Kentucky, TheEffects of Environmental Hazards and Regulation on Urban Redevelopment, submitted to U.S. Department of UrbanDevelopment, Office of Policy Development and Research, U.S. Environmental Protection Agency, August 1997.23 Ibid, and Peter Meyer et al., Reclamation and Economic Regeneration of Brownfields, prepared for the USEconomic Development Administration, 2000.24 Beth Mattson-Teig, “Growing Up, Not Out: Cities Use Infill Development to Alleviate Sprawl,” CommercialInvestment Real Estate, November/December 2003.25 Kris Wernstedt, Robert Hersh, and Katherine Probst, Basing Superfund Cleanups on Future Land Uses:Promising Remedy or Dubious Nostrum?, October 1997.26 Northeast/Midwest Institute, Guide to Federal Brownfields Programs, 2000,http://www.nemw.org/FedGuide2000.pdf;27 Urban Institute, Northeast-Midwest Institute, University of Louisville, University of Northern Kentucky, TheEffects of Environmental Hazards and Regulation on Urban Redevelopment, submitted to U.S. Department of UrbanDevelopment, Office of Policy Development and Research, U.S. Environmental Protection Agency, August 1997.28 Peter Meyer et al., Reclamation and Economic Regeneration of Brownfields, prepared for the US EconomicDevelopment Administration, 2000.29 US EPA, Environmental Financial Advisory Board, Expediting Clean-Up and Redevelopment of Brownfields:Addressing the Major Barriers to Private Sector Involvement -- Real or Perceived, December 1997, and GeneralAccounting Office, Hazardous Waste: Remediation Waste Requirements Can Increase the Time and Cost ofCleanups, October 1997, GAO/RCED-98-4.30 Several guidebooks and tools exist to help policy makers triage sites for this purpose, including: ICMA,Brownfields Redevelopment: A Guidebook for Local Governments and Communities—Second Edition, 2001, andIndustrial Economics, Incorporated, An Integrated Approach for Successful Brownfields Redevelopment, preparedfor the Office of Policy, US Environmental Protection Agency, September, 1996.31 Urban Institute, Northeast-Midwest Institute, University of Louisville, University of Northern Kentucky, TheEffects of Environmental Hazards and Regulation on Urban Redevelopment, submitted to U.S. Department of UrbanDevelopment, Office of Policy Development and Research, U.S. Environmental Protection Agency, August 1997,and Kris Wernstedt, Robert Hersh, and Katherine Probst, Basing Superfund Cleanups on Future Land Uses:Promising Remedy or Dubious Nostrum?, October 1997.