CHARACTERIZATION OF PUNCHING SHEAR capacity of thin UHPC plates.pdf

CHARACTERIZATION OF PUNCHING SHEAR CAPACITY OF THIN UHPC PLATES
by
Devin K. Harris
Thesis submitted to the faculty of the
Virginia Polytechnic Institute and State University
in partial fulfillment of the requirements for the degree of
MASTER OF SCIENCE
IN
CIVIL ENGINEERING
APPROVED:
Carin Roberts-Wollmann
Thomas E. Cousins Raymond H. Plaut
December 2004
Blacksburg, Virginia
Keywords: UHPC, Punching shear, Fiber reinforced concrete, Ductal

CHARACTERIZATION OF PUNCHING SHEAR CAPACITY OF THIN UHPC PLATES
by
Devin K. Harris
ABSTRACT
UHPC (ultra-high performance concrete) is a relatively new type of concrete that exhibits
mechanical properties that are far superior to those of conventional concrete and in some
cases rival those of steel. The main characteristics that distinguish UHPC from
conventional reinforced concrete are the improved compressive strength, the tensile
strength, the addition of steel fibers, and the resistance to corrosion and degradation. The
mechanical properties of UHPC allow for smaller, thinner, lighter sections to be designed
while strength is maintained or improved. The use of UHPC has been limited to a few
structural applications due to the high cost of the materials and the lack of established
design guidelines.
A proposed material model based on material and finite element models has served as the
foundation of this research effort. The model was used to minimize the dimension of an
optimum section in order to limit the material usage and maximize the performance. In
the model, the top flange served as the riding surface and contained no reinforcing steel
to resist shear. The lack of steel reinforcement allowed for the possibility of a punching
shear failure to occur from the application of a point load such as a wheel tire patch load.
The model and optimized section served as the foundation for this research, the
characterization of punching shear capacity of thin UHPC plates.
A total of 12 UHPC slabs were tested to failure to determine the boundary between a
flexural failure and a punching shear failure. The variables considered were the slab
thickness and loading plate dimensions. The results of the testing were compared to

iii
existing models for punching shears and other failure modes, with varying success. The
test results aided in the development of a design equation for the prediction of punching
shear in UHPC slabs. After evaluation of the test results, recommendations are made as
to which model predicts the punching shear capacity of UHPC slabs and the minimum
slab thickness required to prevent a punching shear failure.

iv
ACKNOWLEDGEMENTS
I would first like to express my sincere appreciation to the faculty members at Virginia
Polytechnic Institute and State University for their support during my graduate studies at
the MS level. More specifically, I would like to express my appreciation for Dr. Carin
Roberts-Wollmann for her guidance and support during my research efforts and course
work. I would also like to thank Dr. Thomas Cousins for his guidance in the classroom
and for also serving on my committee. I would like to thank Dr. Raymond Plaut for his
guidance inside and outside the classroom. Dr. Plaut was instrumental in my attending
Virginia Tech and has served as an excellent motivator for me during my MS studies.
Thanks also go out to the Federal Highway Administration for sponsoring my research
project, and Lafarge North America for providing the materials.
My research project would not have been possible without the help and support of the
structures laboratory crew, specifically Dennis Huffman and Brett Farmer. A great deal
of appreciation is given to David Martin, Chuck Newhouse, Sean Sullivan and Stephen
Blumenbaum for their assistance in the lab throughout my testing.
Most importantly I would like to thank my wife Arlene for her continual support.
Without it I would have never returned to school and never succeeded.

v
TABLE OF CONTENTS ABSTRACT......................................................................................................................... i
ACKNOWLEDGEMENTS............................................................................................... iv
TABLE OF CONTENTS.................................................................................................... v
LIST OF FIGURES ........................................................................................................... ix
LIST OF TABLES........................................................................................................... xiv
Chapter 1 - Introduction...................................................................................................... 1
1.1 Bridge Market for UHPC.................................................................................... 1
1.2 Project Overview and Scope............................................................................... 2
1.3 Thesis Organization ............................................................................................ 3
Chapter 2 - Literature Review............................................................................................. 5
2.1 Summary of Literature Review........................................................................... 5
2.2 Ultra High-Performance Concrete (UHPC)........................................................ 5
2.2.1 History of UHPC......................................................................................... 5
2.2.2 General Composition .................................................................................. 6
2.2.3 Material Physical Properties ....................................................................... 7
2.2.3.1 Compressive Strength ............................................................................. 7
2.2.3.2 Tensile Strength / Flexural Strength ....................................................... 8
2.2.3.3 Other Physical Properties........................................................................ 9
2.2.4 Advantages.................................................................................................. 9
2.2.5 Disadvantages ........................................................................................... 10
2.3 Model-Based Optimization of UHPC............................................................... 12
2.3.1 UHPC Model and Model Validation ........................................................ 12
2.3.2 UHPC Section Design Formula, Strategy, and Criteria............................ 13
2.3.3 UHPC Simulation ..................................................................................... 14
2.4 ACI Punching Shear ......................................................................................... 15
2.4.1 Brief History of ACI Punching Shear....................................................... 15
2.4.2 General Mechanism of Failure.................................................................. 16
2.4.3 Current ACI Punching Shear Guidelines.................................................. 17
2.5 Existing Models for Punching Shear ................................................................ 19
2.5.1 Yankelevsky and Leibowitz Model .......................................................... 20

vi
2.5.2 Walraven, Pat, and Markov ...................................................................... 20
2.5.3 Shaaban and Gesund Model...................................................................... 21
2.5.4 Narayanan and Darwish Model ................................................................ 21
2.5.5 ACI Concrete Breakout Strength Model................................................... 22
2.6 Summary of Literature Review......................................................................... 23
Chapter 3 - Preliminary Analysis...................................................................................... 24
3.1 Summary of preliminary analysis procedures and assumptions ....................... 24
3.2 Failure Mechanisms .......................................................................................... 24
3.2.1 Flexural Failure Mechanism ..................................................................... 25
3.2.1.1 Yield Line Analysis .............................................................................. 25
3.2.1.2 Flexural Capacity (Ultimate) ................................................................ 27
3.2.1.3 Yield Line Analysis Results for UHPC ................................................ 29
3.2.2 Punching Shear Failure Mechanism ......................................................... 31
3.2.2.1 Tensile Strength of Ductal® ................................................................. 31
3.2.2.2 ACI Approximation .............................................................................. 32
3.2.3 RISA 3-D Model....................................................................................... 34
3.3 Specimen Sizing and Selection......................................................................... 35
3.4 Review of Preliminary Analysis ....................................................................... 35
Chapter 4 - Materials and Testing..................................................................................... 37
4.1 Overview........................................................................................................... 37
4.2 Specimen Fabrication........................................................................................ 37
4.3 Experimental Setup........................................................................................... 38
4.3.1 Frame ........................................................................................................ 39
4.3.2 Instrumentation ......................................................................................... 41
4.4 Test Matrix........................................................................................................ 45
4.4.1 Trial Specimens ........................................................................................ 45
4.4.2 Test Parameters and Series Details ........................................................... 45
4.4.2.1 Series 1.................................................................................................. 45
4.4.2.2 Series 2.................................................................................................. 46
4.4.2.3 Series 3.................................................................................................. 46
4.5 Test Procedures................................................................................................. 47

vii
4.5.1 Loading ..................................................................................................... 47
4.5.2 Testing....................................................................................................... 47
Chapter 5 - Presentation of Results and Analysis............................................................. 48
5.1 Overview........................................................................................................... 48
5.2 Failure Mechanisms .......................................................................................... 48
5.3 Testing Results.................................................................................................. 54
5.3.1 Series 1 Results ......................................................................................... 54
5.3.2 Series 2 Results ......................................................................................... 59
5.3.3 Series 3 Results ......................................................................................... 63
5.4 Comparison of Results to Other Models........................................................... 68
5.4.1 Narayanan and Darwish Equation ............................................................ 68
5.4.2 Shaaban and Gesund Equation.................................................................. 70
5.4.3 Modified ACI Equation for Concrete Breakout Strength ......................... 71
5.4.4 ACI Curve – Fit Equations ....................................................................... 73
5.4.5 Comparison of Results to Model Equations ............................................. 76
5.4.5.1 Preliminary Analysis............................................................................. 76
5.4.5.2 ACI Punching Shear Design Equation.................................................. 77
5.4.5.3 Narayanan and Darwish Equation ........................................................ 78
5.4.5.4 Shaaban and Gesund Equation.............................................................. 78
5.4.5.5 ACI Concrete Breakout Equation ......................................................... 80
5.4.5.6 ACI Curve-Fit Equation........................................................................ 80
5.4.5.7 Comparison of Prediction Equations .................................................... 81
5.5 Proposed Slab Thickness .................................................................................. 83
5.6 Flexural Failures ............................................................................................... 84
5.7 Summary of Results.......................................................................................... 86
Chapter 6 - Summary, Conclusions, Recommendations .................................................. 87
6.1 Summary ........................................................................................................... 87
6.2 Conclusions....................................................................................................... 89
6.3 Recommendations for Future Research ............................................................ 90
References......................................................................................................................... 91
APPENDIX A................................................................................................................... 94

viii
Edge Condition: Four Edges Pinned ............................................................................. 94
Edge Condition: Three Edges Pinned / One Edge Fixed .............................................. 96
Edge Condition: Two Edges Pinned / Two Edges Fixed .............................................. 97
Edge Condition: One Edge Pinned / Three Edges Fixed .............................................. 98
Edge Condition: Four Edges Fixed ............................................................................... 99
Edge Condition: Radial Pattern ..................................................................................... 99
APPENDIX B ................................................................................................................. 100
Summary of Results..................................................................................................... 100
Series 1 ........................................................................................................................ 101
Series 2 ........................................................................................................................ 109
Series 3 ........................................................................................................................ 119
VITA............................................................................................................................... 132

ix
LIST OF FIGURES Figure 2-1 - Representation of Modified Compact Grading............................................... 6
Figure 2-2 - Representation of Fiber Contribution ............................................................. 7
Figure 2-3 - 1 in. thick 6 ft x 10 ft slab supporting 2,000 lb car......................................... 8
Figure 2-4 - Comparison of material section weights for equivalent flexural strength .... 10
Figure 2-5- Comparison of Life Cycle Cost of UHPC vs. Conventional Concrete.......... 11
Figure 2-6 - Equivalent Stress vs. Deflection of Ductal® and conventional HPC............ 12
Figure 2-7 – Comparison of Optimized UHPC Bridge Girder to AASHTO girder ......... 14
Figure 2-8 – Misconception of Punching Shear Failure ................................................... 16
Figure 2-9– Correct Representation of Punching Shear Failure....................................... 17
Figure 2-10– Illustration of d............................................................................................ 18
Figure 2-11– Critical perimeter ........................................................................................ 19
Figure 2-12 – Concrete Breakout Failure Surface ............................................................ 22
Figure 2-13 – Unreinforced Concrete (or Ductal®) Punching Shear Failure Surface....... 23
Figure 3-1 – Generic Failure Mechanism for SS Slab with Uniformly Distributed Load 25
Figure 3-2 – Typical Moment-Curvature Relationship for Reinforced Concrete Slab .... 26
Figure 3-3– Stress vs. Strain Relationship for UHPC....................................................... 27
Figure 3-4– Section model for UHPC Slab ...................................................................... 28
Figure 3-5– Moment-Curvature Relationship for UHPC ................................................. 29
Figure 3-6– Generic Yield Line Analysis Configuration ................................................. 31
Figure 3-7– Risa 3-D Model of UHPC slab (restrained on two sides) ............................. 35
Figure 4-1 – 45 in. x 45 in. Slab layout with block-outs .................................................. 38
Figure 4-2 – Elevation 1 of Frame (all dimensions in inches).......................................... 39
Figure 4-3 – Elevation 2 of Frame (all dimensions in inches).......................................... 40
Figure 4-4 – Photo of Actual Frame ................................................................................. 40
Figure 4-5 – Detail of Frame Restraint System ................................................................ 41
Figure 4-6 – Fully Restrained Yield Line Pattern............................................................. 42
Figure 4-7 – Strain Placement Configurations.................................................................. 43
Figure 4-8 – Ram/Load Cell Combination ....................................................................... 43
Figure 4-9 – Wire Pot Displacement Transducer ............................................................. 44
Figure 4-10 – Linear Variable Displacement Transducer................................................. 44

x
Figure 5-1– Typical Punching Shear Failure for Ductal®................................................. 49
Figure 5-2 - Fiber Orientation vs. Crack Pattern .............................................................. 50
Figure 5-3 - Typical Crack Pattern for Punching Shear Failure ....................................... 50
Figure 5-4 – Typical Flexural Failure for Ductal® ........................................................... 52
Figure 5-5 – Typical Load vs. Displacement Curve for Series 1 - Slab #1 ...................... 55
Figure 5-6 – Typical Load vs. Strain (Diagonal) for Series 1 – Slab #2 (Tensile Face) .. 56
Figure 5-7– Load vs. Strain (Orthogonal) for Series 1 – Slab #2 (Tensile Face) ............. 58
Figure 5-8 – Typical Load vs. Strain for Series 1 – Slab #2 (Loading Face) .................. 58
Figure 5-9 – Typical Load vs. Displacement Curve for Series 2 – Slab #1 (Punching
Shear Failure).................................................................................................................... 60
Figure 5-10– Typical Load vs. Displacement Curve for Series 2 – Slab #2 (Flexural
Failure).............................................................................................................................. 61
Figure 5-11 – Typical Load vs. Strain (Diagonal) for Series 2 – Slab #2 (Tensile Face) 61
Figure 5-12 – Typical Load vs. Strain (Orthogonal) for Series 2 – Slab #2 (Tensile Face)
........................................................................................................................................... 62
Figure 5-13 – Typical Load vs. Strain (Loading Face) for Series 2 – Slab #1 ................. 62
Figure 5-14 – Typical Load vs. Displacement Curve for Series 3 – Slab #3 (Punching
Shear Failure).................................................................................................................... 65
Figure 5-15– Typical Load vs. Displacement Curve for Series 3 – Slab #5 (Flexural
Failure).............................................................................................................................. 65
Figure 5-16 – Typical Load vs. Strain (Diagonal) for Series 3 – Slab #3 ........................ 66
Figure 5-17 – Typical Load vs. Strain (Orthogonal) for Series 3 - Slab #2 ..................... 66
Figure 5-18 – Typical Load vs. Strain (Loading Face) for Series 3 - Slab #5.................. 67
Figure 5-19 – Concrete Breakout Failure Surface ............................................................ 72
Figure 5-20 – Ductal® Breakout (Punching Shear) Failure Surface ................................. 72
Figure 5-21 – Preliminary Analysis Prediction for Punching Shear Capacity vs. Actual 77
Figure 5-22 – ACI 318-02 Prediction for Punching Shear Capacity vs. Actual............... 78
Figure 5-23– Narayanan & Darwish Prediction for Punching Shear Capacity vs. Actual79
Figure 5-24– Shaaban & Gesund Prediction for Punching Shear Capacity vs. Actual .... 79
Figure 5-25 – Modified ACI Prediction for Concrete Breakout (Punching) Capacity vs.
Actual................................................................................................................................ 80

xi
Figure 5-26 – Curve-Fit Prediction for Punching Shear Capacity vs. Actual .................. 81
Figure 5-27 – Yield Line Analysis Prediction for Flexural Capacity vs. Actual.............. 85
Figure A-1 - Case A......................................................................................................... 94
Figure A-2 - Case B .......................................................................................................... 94
Figure A-3 - Case C .......................................................................................................... 95
Figure A-4 - Case D.......................................................................................................... 96
Figure A-5 - Case E .......................................................................................................... 96
Figure A-6 - Case F........................................................................................................... 97
Figure A-7 - Case G.......................................................................................................... 97
Figure A-8 - Case H.......................................................................................................... 97
Figure A-9 - Case I ........................................................................................................... 98
Figure A-10 - Case J ......................................................................................................... 98
Figure A-11 - Case K........................................................................................................ 99
Figure A-12 - Case L ........................................................................................................ 99
Figure B-13 – Failure Surface (2.0 in. slab - 1.5 in. plate) ............................................. 101
Figure B-14 - Load vs. Displacement (2.0 in. slab - 1.5 in. plate).................................. 101
Figure B-15 – Load vs. Diagonal Strain (2.0 in. slab - 1.5 in. plate).............................. 102
Figure B-16 - Load vs. Orthogonal Strain (2.0 in. slab - 1.5 in. plate)........................... 102
Figure B-17 - Load vs. Bottom Strain (2.0 in. slab - 1.5 in. plate) ................................. 103
Figure B-18 – Failure Surface (2.0 in. slab – 2.0 in. plate) ............................................ 103
Figure B-19 - Load vs. Displacement (2.0 in. slab – 2.0 in. plate)................................. 104
Figure B-20 - Load vs. Diagonal Strain (2.0 in. slab – 2.0 in. plate).............................. 104
Figure B-21 - Load vs. Orthogonal Strain (2.0 in. slab – 2.0 in. plate) .......................... 105
Figure B-22 - Load vs. Bottom Strain (2.0 in. slab – 2.0 in. plate) ................................ 105
Figure B-23 – Failure Surface (2.0 in. slab – 1.0 in. plate) ............................................ 106
Figure B-24 - Load vs. Displacement (2.0 in. slab – 1.0 in. plate)................................. 106
Figure B-25 - Load vs. Diagonal Strain (2.0 in. slab – 1.0 in. plate).............................. 107
Figure B-26 - Load vs. Orthogonal Strain (2.0 in. slab – 1.0 in. plate) .......................... 107
Figure B-27 - Load vs. Bottom Strain (2.0 in. slab – 2.0 in. plate) ................................ 108
Figure B-28 – Failure Surface (2.5 in. slab – 2.0 in. plate) ............................................ 109
Figure B-29 - Load vs. Displacement (2.5 in. slab – 2.0 in. plate)................................. 109

xii
Figure B-30 - Load vs. Diagonal Strain (2.5 in. slab – 2.0 in. plate).............................. 110
Figure B-31 - Load vs. Orthogonal Strain (2.5 in. slab – 2.0 in. plate) .......................... 110
Figure B-32 - Load vs. Bottom Strain (2.5 in. slab – 2.0 in. plate) ................................ 111
Figure B-33 – Failure Surface (2.5 in. slab – 3.0 in. plate) ............................................ 111
Figure B-34 - Load vs. Displacement (2.5 in. slab – 3.0 in. plate)................................. 112
Figure B-35- Load vs. Diagonal Strain (2.5 in. slab – 3.0 in. plate)............................... 112
Figure B-36 - Load vs. Orthogonal Strain (2.5 in. slab – 3.0 in. plate) .......................... 113
Figure B-37 - Load vs. Bottom Strain (2.5 in. slab – 3.0 in. plate) ................................ 113
Figure B-38 – Failure Surface (2.5 in. slab – 1.5 in. plate) ............................................ 114
Figure B-39 - Load vs. Displacement (2.5 in. slab – 1.5 in. plate)................................. 114
Figure B-40 - Load vs. Diagonal Strain (2.5 in. slab – 1.5 in. plate).............................. 115
Figure B-41 - Load vs. Orthogonal Strain (2.5 in. slab – 1.5 in. plate) .......................... 115
Figure B-42 - Load vs. Bottom Strain (2.5 in. slab – 1.5 in. plate) ................................ 116
Figure B-43 – Failure Surface (2.5 in. slab – 2.5 in. plate) ............................................ 116
Figure B-44 - Load vs. Displacement (2.5 in. slab – 2.5 in. plate)................................. 117
Figure B-45 - Load vs. Diagonal Strain (2.5 in. slab – 2.5 in. plate).............................. 117
Figure B-46 - Load vs. Orthogonal Strain (2.5 in. slab – 2.5 in. plate) .......................... 118
Figure B-47 - Load vs. Bottom Strain (2.5 in. slab – 2.5 in. plate) ................................ 118
Figure B-48 – Failure Surface (3.0 in. slab – 2.5 in. plate) ............................................ 119
Figure B-49 - Load vs. Displacement (3.0 in. slab – 2.5 in. plate)................................. 119
Figure B-50 - Load vs. Diagonal Strain (3.0 in. slab – 2.5 in. plate).............................. 120
Figure B-51 - Load vs. Orthogonal Strain (3.0 in. slab – 2.5 in. plate) .......................... 120
Figure B-52 - Load vs. Bottom Strain (3.0 in. slab – 2.5 in. plate) ................................ 121
Figure B-53 – Failure Surface (3.0 in. slab – 1.5 in. plate) ............................................ 121
Figure B-54 - Load vs. Displacement (3.0 in. slab – 1.5 in. plate)................................. 122
Figure B-55 - Load vs. Diagonal Strain (3.0 in. slab – 1.5 in. plate).............................. 122
Figure B-56 - Load vs. Orthogonal Strain (3.0 in. slab – 1.5 in. plate) .......................... 123
Figure B-57 - Load vs. Bottom Strain (3.0 in. slab – 1.5 in. plate) ................................ 123
Figure B-58 – Failure Surface (3.0 in. slab – 1.0 in. plate) ............................................ 124
Figure B-59 - Load vs. Displacement (3.0 in. slab – 1.0 in. plate)................................. 124
Figure B-60 - Load vs. Diagonal Strain (3.0 in. slab – 1.0 in. plate).............................. 125
xiii
Figure B-61 - Load vs. Orthogonal Strain (3.0 in. slab – 1.0 in. plate) .......................... 125
Figure B-62 - Load vs. Bottom Strain (3.0 in. slab – 1.0 in. plate) ................................ 126
Figure B-63 – Failure Surface (3.0 in. slab – 2.0 in. plate) ............................................ 126
Figure B-64 - Load vs. Displacement (3.0 in. slab – 2.0 in. plate)................................. 127
Figure B-65 - Load vs. Diagonal Strain (3.0 in. slab – 2.0 in. plate).............................. 127
Figure B-66 - Load vs. Orthogonal Strain (3.0 in. slab – 2.0 in. plate) .......................... 128
Figure B-67 - Load vs. Bottom Strain (3.0 in. slab – 2.0 in. plate) ................................ 128
Figure B-68 – Failure Surface (3.0 in. slab – 1.75 in. plate) .......................................... 129
Figure B-69 - Load vs. Displacement (3.0 in. slab – 1.75 in. plate)............................... 129
Figure B-70 - Load vs. Diagonal Strain (3.0 in. slab – 1.75 in. plate)............................ 130
Figure B-71 - Load vs. Orthogonal Strain (3.0 in. slab – 1.75 in. plate) ........................ 130
Figure B-72 - Load vs. Bottom Strain (3.0 in. slab – 1.75 in. plate) .............................. 131

xiv
LIST OF TABLES Table 2-1 - Comparison of UHPC Composition to HPC.................................................... 6
Table 3-1 – Flexural Capacity (Mu) of UHPC Slabs ........................................................ 28
Table 3-2 – Matrix of Restraint Configuration for Yield Line Analysis .......................... 30
Table 3-3 – Punching Shear Capacity of UHPC vs. 10,000 psi Conventional Mix ......... 34
Table 4-1 – Series 1 Matrix (2.0 in. slabs)........................................................................ 46
Table 4-2 – Series 2 Matrix (2.5 in. slabs)........................................................................ 46
Table 4-3 – Series 3 Matrix (3.0 in. slabs)........................................................................ 47
Table 5-1 – Series 1 Test Results...................................................................................... 54
Table 5-2 – Series 1 Comparison of Predicted vs. Actual ................................................ 59
Table 5-3 – Series 2 Test Results...................................................................................... 59
Table 5-4 – Series 2 Comparison of Predicted vs. Actual ................................................ 63
Table 5-5 – Series 3 Test Results...................................................................................... 64
Table 5-6 – Series 3 Comparison of Predicted vs. Actual ................................................ 68
Table 5-7 – Statistical Results........................................................................................... 82
Table 5-8 – Summary of Flexural Failure Results............................................................ 85
Table B-1 -Summary of Results ..................................................................................... 100
Table B-2 – Summary of Material Properties................................................................. 100

1
Chapter 1 - Introduction
1.1 Bridge Market for UHPC In the ever growing market of bridge construction, the demand for new bridge structures
is outpacing the supply. Some of this backlog stems from the need to rehabilitate and/or
replace existing bridge structures that have deteriorated. Some of these deteriorating
bridges have exceeded their service life and need replacement, while others are no longer
capable of fulfilling the requirements of increased traffic loads. Many of the bridges built
in the past were designed and built with many of the same materials that are in use today,
steel and reinforced concrete. These materials have been proven to be very effective over
the years, and improvements in material properties have allowed for changes to be made
in the design of bridge structures. The improved material properties allow bridge
structures to be lighter, have smaller cross sections, span further distances, and require
less maintenance.
A relatively new material on the market, ultra-high performance concrete (UHPC), relies
on the same principles as conventional concrete, but provides improved mechanical
properties resulting from changes in the blend composition. The compressive strength,
the property most often associated with concrete, of UHPC can exceed the compressive
strength of conventional reinforced concrete by an order of magnitude. Additionally,
UHPC exhibits a tensile strength unheard of in conventional concrete, allowing for the
possibility of eliminating steel reinforcement in some applications. The use of UHPC
allows for section dimensions to be minimized, taking advantage of the improved
material properties while minimizing material usage and cost. In addition to the
improved strength properties, UHPC maintains a very low permeability, making the
material resistant to the corrosion and deterioration often associated with reinforced
concrete and steel structures. This resistance directly correlates to a longer service life
that can be achieved with the use of UHPC, making it an ideal material for a number of
structural applications, particularly bridge structures.

2
The benefits of UHPC are quite substantial, but are offset by the high cost of the material.
With the material being relatively new, there have only been a limited number of
structural applications and the costs have remained high because the material is still
considered to be a specialty product. The expectation is that as design with UHPC
becomes a more common practice, the costs will decrease as the industry becomes more
familiar and comfortable with it.
1.2 Project Overview and Scope
With UHPC being a relatively new material to the industry, only a limited amount of
research has been performed, leaving a number of opportunities for the characterization
of the material’s behavior. The Federal Highway Administration (FHWA) and Virginia
Department of Transportation (VDOT) have spearheaded the research conducted on
UHPC in the United States by testing the response of UHPC in bridge structure
applications. The purpose of their efforts is to determine the feasibility of using UHPC in
bridge structures in the United States. Park et al. (2003) have developed a material
model for UHPC and optimized a section for use as a bridge girder with an integrated
riding surface; the model developed was validated with results from testing performed by
the FHWA. The optimized section minimized the material usage and eliminated the use
of shear reinforcement based on the comparison of the global model to the test results.
However, no test results were available for comparison of the local effects in the
slab/riding surface. With all of the section dimensions minimized, the resulting section
has a thin top flange that also serves as the riding surface. The possibility exists that a
punching shear failure could occur with a tire patch load applied to the surface.
This project’s main objective was to develop a model for the prediction of the punching
shear capacity of UHPC slabs and present a design equation for the prediction of
punching shear capacity. Another objective was to determine the minimum slab
thickness that could be used as a riding surface to prevent a punching shear failure from

3
occurring. The final goal was to minimize the material used due to the high cost of the
material; this would require that test specimens be designed as small as possible and still
be capable of failing in punching shear. Initially a generic model was developed, based
on the ACI 318-02 design equations for punching shear, to predict the punching shear
capacity of UHPC. The predicted response was compared to a prediction of the flexural
capacity determined from yield line analysis to determine which configurations would
cause punching shear failures and which would cause flexural failures. To accomplish
these objectives, a total of 12 – 45 in. x 45 in. (36 in. x 36 in. unsupported area) slabs
were tested to failure to determine the boundary between a ductile flexural failure and a
brittle punching shear failure. The factors that were varied in the testing were the slab
thickness and loading plate area. The results of the testing were then compared to the
prediction models and other proposed models for punching shear, and recommendations
were made as to the best predictor of punching shear strength of UHPC slabs.
1.3 Thesis Organization
The thesis organization follows the path of the progression of the research project. The
second chapter provides a more thorough introduction to UHPC and highlights the
material properties, advantages and disadvantages. More detail is provided on the
optimized model developed at MIT which serves as the foundation for this research. A
brief introduction to the mechanisms of punching shear is also provided, along with the
history and background of the ACI design equations for punching shear. The third
chapter highlights the mechanisms of failure of a two-way slab system and illustrates the
methodology for the development of the preliminary prediction equations. Chapter four
presents the material testing phase of the project and provides insight into the fabrication,
testing, and instrumentation of the slab specimens. The fifth chapter presents the testing
results and provides comparisons to the model developed in the preliminary analysis
phase. This chapter also presents additional models not used in the preliminary analysis
phase and makes comparisons; the best model for the prediction of punching shear

4
capacity is also determined. The final chapter summarizes the research, and provides
conclusions and recommendations for future research.

5
Chapter 2 - Literature Review
2.1 Summary of Literature Review
Limited research has been conducted on the mechanical properties of UHPC, with none
specifically devoted to the punching shear capacity of UHPC slabs. The following
literature review discusses the history, properties, and capabilities of UHPC. In addition,
a brief summary of the modeling optimization study for UHPC conducted at MIT is
provided, as it serves as a cornerstone of this research effort. Some background and
history of the current ACI guidelines, ACI 318-02, for punching shear is included for
comparative purposes. Finally, other models for punching shear are presented.
2.2 Ultra High-Performance Concrete (UHPC)
2.2.1 History of UHPC
Ultra-high performance concrete (UHPC) is a relatively new type of concrete that
provides significant improvements in strength, ductility, workability, and durability when
compared to reinforced concrete or conventional high-performance concrete (HPC). The
distinguishing factor between UHPC and HPC is that these improved characteristics are
inherent to UHPC, whereas with HPC the mix is designed to meet special combinations
of performance and uniformity requirements (Semioli 2001).
The recent development of UHPC has been primarily spearheaded by two independent
French constructors, Bouygues Construction and Eiffage Group (EGI), with the aid of
construction materials companies, Lafarge Corporation and Sika Corporation,
respectively. The independent efforts of both companies created the products, Ductal®,
brand name for Bouygues and BSI (Béton Special Industriel), brand name for EGI, with
similar characteristics. While both materials exhibit similar qualities, the focus of this
research effort is centered on Ductal® as a result of the scope of the research proposal.
6
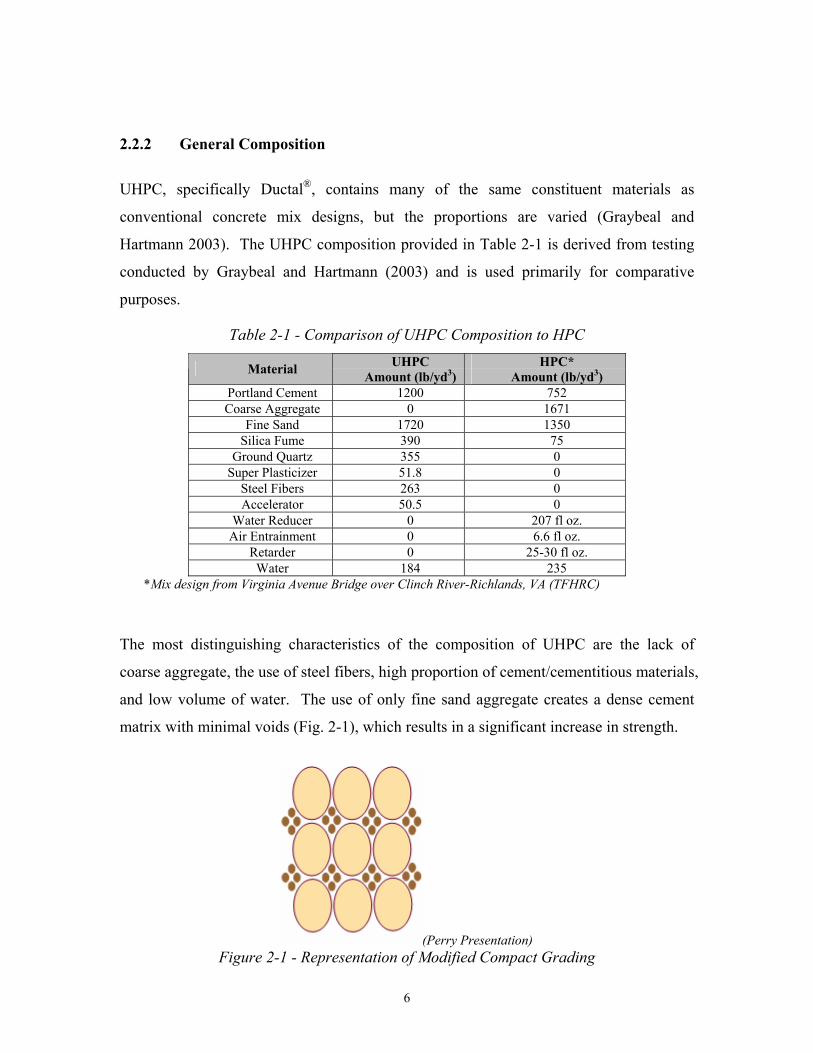
2.2.2 General Composition
UHPC, specifically Ductal®, contains many of the same constituent materials as
conventional concrete mix designs, but the proportions are varied (Graybeal and
Hartmann 2003). The UHPC composition provided in Table 2-1 is derived from testing
conducted by Graybeal and Hartmann (2003) and is used primarily for comparative
purposes.
Table 2-1 - Comparison of UHPC Composition to HPC UHPC HPC* Material Amount (lb/yd3) Amount (lb/yd3)
Portland Cement 1200 752 Coarse Aggregate 0 1671
Fine Sand 1720 1350 Silica Fume 390 75
Ground Quartz 355 0 Super Plasticizer 51.8 0
Steel Fibers 263 0 Accelerator 50.5 0
Water Reducer 0 207 fl oz. Air Entrainment 0 6.6 fl oz.
Retarder 0 25-30 fl oz. Water 184 235
*Mix design from Virginia Avenue Bridge over Clinch River-Richlands, VA (TFHRC)
The most distinguishing characteristics of the composition of UHPC are the lack of
coarse aggregate, the use of steel fibers, high proportion of cement/cementitious materials,
and low volume of water. The use of only fine sand aggregate creates a dense cement
matrix with minimal voids (Fig. 2-1), which results in a significant increase in strength.
(Perry Presentation) Figure 2-1 - Representation of Modified Compact Grading
7
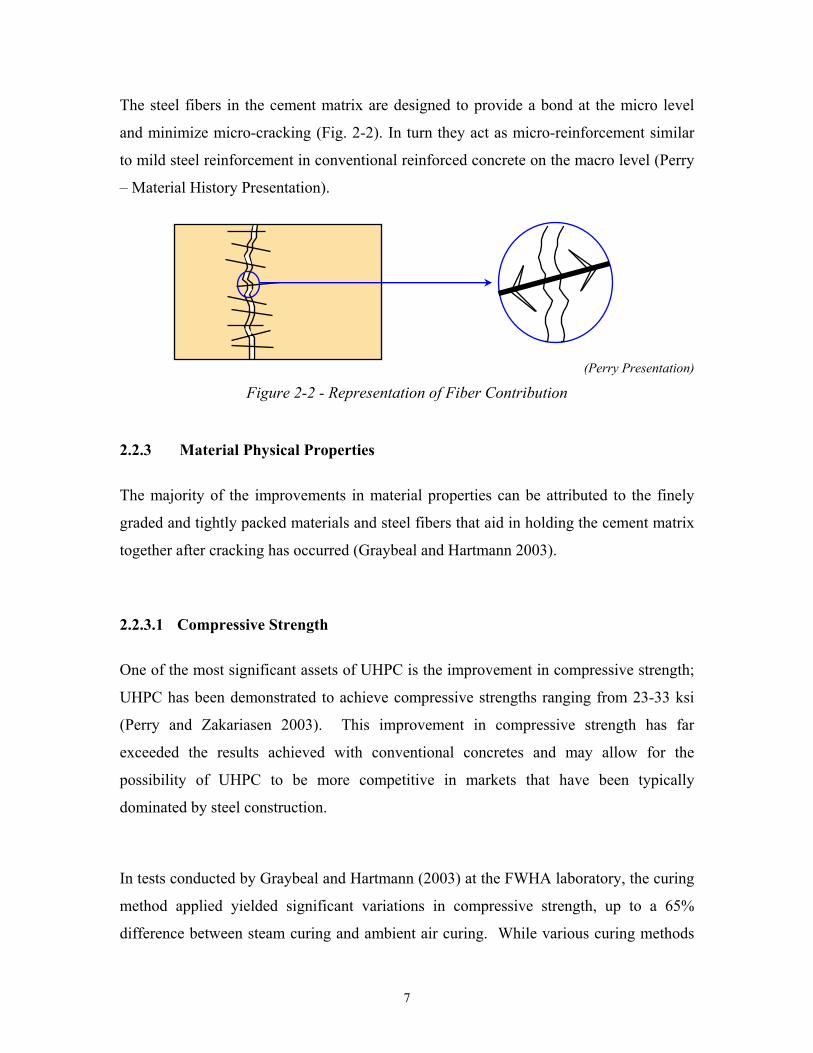
The steel fibers in the cement matrix are designed to provide a bond at the micro level
and minimize micro-cracking (Fig. 2-2). In turn they act as micro-reinforcement similar
to mild steel reinforcement in conventional reinforced concrete on the macro level (Perry
– Material History Presentation).
(Perry Presentation)
Figure 2-2 - Representation of Fiber Contribution
2.2.3 Material Physical Properties
The majority of the improvements in material properties can be attributed to the finely
graded and tightly packed materials and steel fibers that aid in holding the cement matrix
together after cracking has occurred (Graybeal and Hartmann 2003).
2.2.3.1 Compressive Strength
One of the most significant assets of UHPC is the improvement in compressive strength;
UHPC has been demonstrated to achieve compressive strengths ranging from 23-33 ksi
(Perry and Zakariasen 2003). This improvement in compressive strength has far
exceeded the results achieved with conventional concretes and may allow for the
possibility of UHPC to be more competitive in markets that have been typically
dominated by steel construction.
In tests conducted by Graybeal and Hartmann (2003) at the FWHA laboratory, the curing
method applied yielded significant variations in compressive strength, up to a 65%
difference between steam curing and ambient air curing. While various curing methods

8
can be applied in field applications, the quality control on curing methods makes UHPC
more suitable for precast operations.
2.2.3.2 Tensile Strength / Flexural Strength
The significant improvements in compressive strength are complimented by the fact that
UHPC also exhibits tensile strength that has not been demonstrated in conventional
concretes. This tensile strength allows the material to support both pre-cracking and
post-cracking loads without experiencing the brittle failure that would be common in a
conventional concrete. UHPC has demonstrated tensile strengths ranging from 0.9-1.7
ksi with various curing regimes and standard ASTM testing methods (Graybeal and
Hartmann 2003). These tensile strengths were achieved as a result of the interaction of
the steel fibers on the microscopic level and their ability to sustain load after the onset of
cracking.
In addition to the improvements in tensile strength, UHPC can also achieve flexural
strengths ranging from 5,000 – 7,200 psi (Perry and Zakariasen 2003). This combination
of the tensile and flexural strength makes UHPC an extremely ductile material, capable of
supporting significant loads beyond cracking. An example of UHPC’s ductility can be
observed in Fig. 2-3 (Perry – Material History Presentation).
(imagineductal website)
Figure 2-3 - 1 in. thick 6 ft x 10 ft slab supporting 2,000 lb car

9
This combination of the unique physical properties of UHPC allows designers to create
thinner sections, longer spans, and taller structures (Perry and Zakariasen 2003).
2.2.3.3 Other Physical Properties
In addition to improved strength and ductility, UHPC exhibits some characteristics that
make it very attractive for use in a number of applications. Due to the dense cementitious
matrix and small and disconnected pore structure, UHPC maintains a very low
permeability - roughly 1/10 the size of granite (Lafarge). UHPC allows for negligible
carbonation or penetration of chlorides/sulfates and also maintains a high resistance to
acid attack (Perry and Zakariasen 2003). UHPC’s excellent resistance to freeze-thaw
cycles also develops from the dense matrix, making it ideal for virtually any climate
condition.
UHPC also exhibits very low creep and shrinkage when compared to conventional
concretes, making the material suitable for precast/prestressed structures (Perry and
Zakariasen 2003). The material can also be classified as a self-forming (self-
consolidating) concrete due to the ease of flow of the material, which can be poured or
pumped into place with limited or no vibration.
2.2.4 Advantages
With the significantly improved physical properties of UHPC, there are a number of
advantages when compared to conventional concretes and even steel for structural
applications. The high strength of UHPC allows the designer to use smaller sections,
resulting in the use of less material, to yield the same capacity as illustrated in Fig. 2-4.
The properties of UHPC can be optimized when used in conjunction with prestressing,
which maximizes the use of the inherent tensile capabilities.

10
(Perry Presentation)
Figure 2-4 - Comparison of material section weights for equivalent flexural strength
The presence of the steel fiber reinforcement and interaction of the matrix allow for the
elimination of flexural and shear mild reinforcement in a number of cases. This topic
will be discussed further in Chapter 3.
Due to the durability and low permeability, UHPC structures are expected to have a
longer service life than conventional reinforced concrete structures. UHPC is designed to
be able to resist the effects of damaging environments and save money over the life of a
project (Fig. 2-5).
2.2.5 Disadvantages
The biggest disadvantage of using UHPC in today’s market is the initial cost. With
UHPC being relatively new to the industry, there have been only a limited number of
Steel
Pre-stressed Reinforced Concrete
Reinforced Pre-stressed Steel Ductal
MASS (WEIGHT) OF BEAMS
355 313 75 94 lbs/ft
530 467 112 140 kg/m

11
applications. The design and use of the material has not yet been optimized or
streamlined and as a result, the cost is still significantly higher than that of conventional
concrete. The producers expect that as UHPC becomes more common in practice, the
cost of use will decrease and they suggest that savings will be achieved over the life cycle
when compared to conventional solutions as illustrated in Fig. 2-5.
(Lafarge website)
Figure 2-5- Comparison of Life Cycle Cost of UHPC vs. Conventional Concrete
While the strength of UHPC allows for minimization of section properties, design with
UHPC must still meet the stiffness requirements for serviceability. There is a limit as to
how thin or small a member can be and still meet deflection and vibration requirements.
Another difficulty with the use of UHPC in design is that it is more suited for use in a
precasting facility rather than an onsite application. UHPC in standard formwork does
not allow for use of the material to its full potential; however, standard sections can be
minimized (shorter sections, thinner flanges/webs, etc.) to make better use of the material
properties.

12
2.3 Model-Based Optimization of UHPC
2.3.1 UHPC Model and Model Validation
Park et al. (2003) concluded that UHPC can be characterized as a material with two
phases, the high strength cementitious matrix and the high strength fiber reinforcement,
with distinct kinematics and possible mechanical interaction. UHPC is capable of
supporting load until the point of cracking of the cementitious matrix and then can
continue to support additional load after a minimal drop in stress (Fig. 2-6).
A two-phase constitutive model was developed for the material based on this relationship.
The model developed attributes this overall composite behavior to the interaction of the
brittle plastic matrix phase and the elastoplastic fiber phase.
The results of the model were input into a finite element program and compared to
experimental test results from the Federal Highway Administration flexure and shear
tests of UHPC specimens. During these tests, conventional reinforced concrete was
replaced with unreinforced UHPC in standard AASHTO Type II girders and loaded to
failure. The model was modified to take into consideration the effects of prestressing
(Perry Presentation)
Figure 2-6 - Equivalent Stress vs. Deflection of Ductal® and conventional HPC

13
steel on strength, stiffness, and crack pattern, and produced very accurate results when
compared with the experimental data on both the global and local scale.
A maximum crack opening criterion for design purposes was introduced based on the
UHPC design guidelines issued by the French Association of Civil Engineering (AFGC
2002) and were further expanded into a limiting strain criterion.
Limiting crack criterion ωlim = 0.3 mm = 0.012 in for unreinforced UHPC sections
ωlim = min (Lf/4; h/100) for reinforced UHPC sections
Limiting strain criterion εlim ≤ ωlim /lc = 1.5 ωlim /h for unreinforced sections
εlim ≤ ωlim /lc = min (3 Lf /8h; 3/200) for reinforced UHPC sections
where: ωlim = maximum admissible crack opening
Lf = fiber length
εlim = maximum admissible strain
lc = characteristic length = 2/3h
h = height of structure
The limiting crack and strain criteria can be used to determine a lower bound on the
limiting load for a member when coupled with the proposed model and also prevent
excessive deformation in UHPC members.
2.3.2 UHPC Section Design Formula, Strategy, and Criteria
The design strength of UHPC for flexure mimics that of conventional reinforced concrete,
but ties in the effective composite strength of the lower (tensile) flange material. In
conventional reinforced concrete, the tensile contribution is excluded from nominal
strength because concrete exhibits a very low contribution before cracking and none
beyond cracking. Also differing from conventional reinforced concrete design, UHPC

14
employs a limiting crack criterion which may reduce the nominal strength in certain
instances.
The strategy adopted for the design of UHPC follows that of AASHTO LRFD in that
there are two limit states, service limit state (SLS) and ultimate strength limit state (ULS),
that need to be satisfied. The SLS design requirement adopted limits the design member
to no cracking, while the ULS follows the UHPC guidelines developed by the AFGC
previously shown. Using this strategy, an optimized section was developed by allowing
variation in the section height and fixing the other variables to known or suitable
quantities.
2.3.3 UHPC Simulation
The final phase of the model-based optimization process was the implementation into a
real life simulation. The model was applied to a medium span, simply supported,
prestressed bridge girder and optimized using a combination of the material model,
previously developed 3-D optimization techniques, and the crack limitation criterion.
Applying UHPC to a conventional bridge application yielded a smaller section than
conventional bridge girders that integrated the riding surface into the girder (see Fig. 2-7).
(Ulm Presentation)
Figure 2-7 – Comparison of Optimized UHPC Bridge Girder to AASHTO girder
B
Tw
Bf
Ts
Hw
Tf
AASHTO UHPC

15
Limitations on the minimum thickness of the slab section were developed as a result of
the service limit state ‘no cracking’ criterion; the section was capable of meeting the
flexural strength requirements with thin slabs (2 in.), but was unable to satisfy the SLS
requirements with slabs thinner than 4 in. While the limitation to 4 in. slab thickness is
conservative, it serves as a safe lower bound in the absence of experimental data to
support thinner slabs, which will be the focus of this research effort.
2.4 ACI Punching Shear
2.4.1 Brief History of ACI Punching Shear
Shear failure of a member results from a combination of shearing forces and bending
moment and in some cases the addition of axial load and/or torsion (ASCE-ACI Task
Committee 1973). A good understanding of the shear strength of concrete members was
not achieved until the early 1970’s. During the early 1970’s the basic philosophy of the
ACI Building Code changed; the use of stirrup reinforcement to restrain growth of
inclined cracking and provide increased ductility was included in the ACI Building Code
(ASCE-ACI Task Committee 1973). This basic philosophy is more applicable to beam
or flexural members, as conventional stirrups are not frequently used in slab systems.
Due to their multi-dimensional geometry, slab systems are highly redundant structural
systems and are able to achieve a higher degree of ductility than concrete beams (ASCE-
ACI Task Committee 1974). Slab systems are subject to serviceability failures, excessive
deflection and deformation, as a result of this ductility and are also prone to shear failures
at overloads. The serviceability failures are not catastrophic, but shear failures can lead
to the collapse of a floor system and even progressive failure of floor systems below.
With slab systems being capable of developing a considerably larger nominal shear stress
in the presence of principal moments, when compared to beams, the proper design for
punching shear is critical.

16
The general method of analysis used by ACI for shear strength of slabs is considered to
be applicable to the transfer of forces from slabs to columns, transfer of forces from
columns to footings, and the strength of a slab - e.g., a bridge deck supporting a
concentrated or moving load (ASCE-ACI Task Committee 1974). The design procedures
put forth by ACI are based primarily on test data for the development of empirical
formulas with little emphasis placed on the development of a model to characterize the
true failure mechanism (ASCE-ACI Task Committee 1974). This method has proven
effective over the years, but leaves designers without a true understanding of the
punching shear phenomenon. In addition, there are limitations to the design equations of
ACI such as improvement in punching shear capacity as a result of improved
compressive and/or tensile strength.
2.4.2 General Mechanism of Failure
Conventional wisdom does not apply when considering the mechanism of a punching
shear failure; in a slab system with a concentrated load or at a slab column connection,
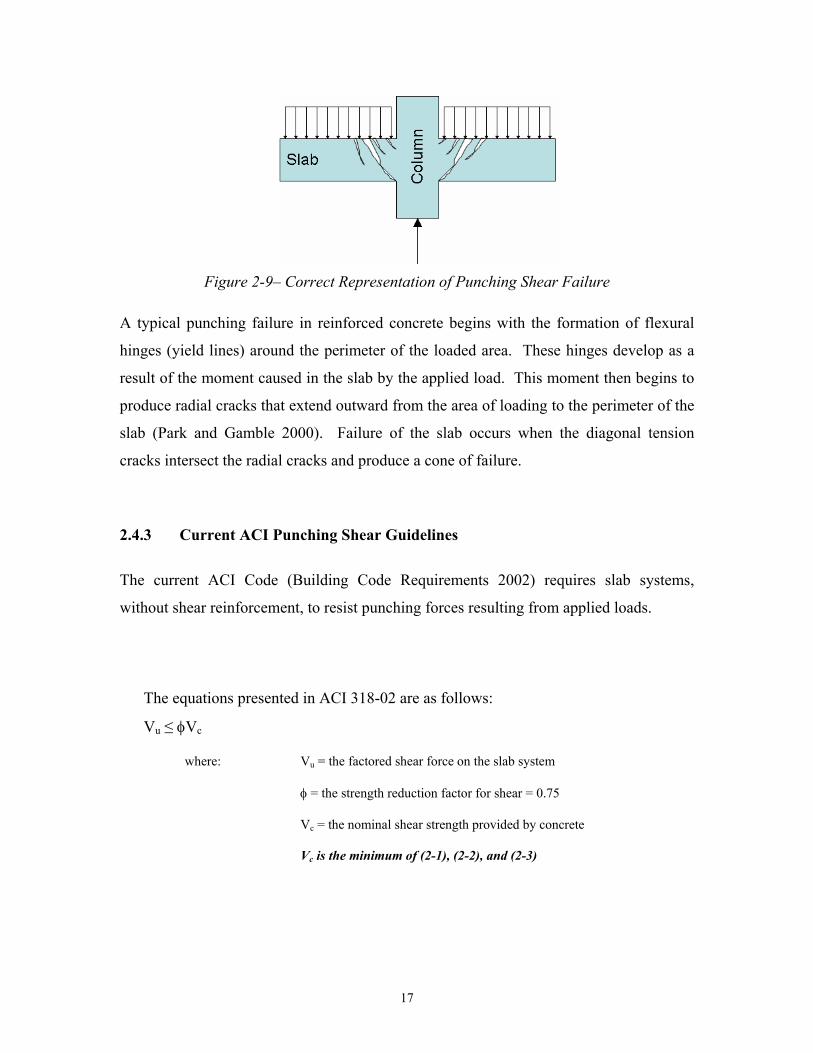
the loaded area is not actually pushed through the slab as shown in Fig. 2-8. Punching
shear failures arise from the formation of diagonal tension cracks around the loaded area,
which result in a conical failure surface as illustrated in Fig. 2-9.
Figure 2-8 – Misconception of Punching Shear Failure
17
Figure 2-9– Correct Representation of Punching Shear Failure
A typical punching failure in reinforced concrete begins with the formation of flexural
hinges (yield lines) around the perimeter of the loaded area. These hinges develop as a
result of the moment caused in the slab by the applied load. This moment then begins to
produce radial cracks that extend outward from the area of loading to the perimeter of the
slab (Park and Gamble 2000). Failure of the slab occurs when the diagonal tension
cracks intersect the radial cracks and produce a cone of failure.
2.4.3 Current ACI Punching Shear Guidelines
The current ACI Code (Building Code Requirements 2002) requires slab systems,
without shear reinforcement, to resist punching forces resulting from applied loads.
The equations presented in ACI 318-02 are as follows:
Vu ≤ φVc
where: Vu = the factored shear force on the slab system
φ = the strength reduction factor for shear = 0.75
Vc = the nominal shear strength provided by concrete
Vc is the minimum of (2-1), (2-2), and (2-3)

18
dbfV occ
c ')42(β
+= Equation 2-1
dbfb
dV oc
o
Sc ')2( +=
α Equation 2-2
dbfV occ '4= Equation 2-3
where: f’c = compressive strength of the concrete
bo = the perimeter of the critical section − critical perimeter (see Fig. 2-11)
d = the distance from the extreme compression fiber to the centroid of the longitudinal
tension reinforcement (see Fig. 2-10)
βc = the ratio of the long side to the short side of the concentrated load or reaction area
αs = a factor for slab column connections based on the location of the column (interior,
exterior, corner)
Figure 2-10– Illustration of d

19
c1
d/2d/2
critical perimeter
critical section
d/2
d/2c1
c2
c1
d/2d/2
critical perimeter
critical section
d/2
d/2c1
c2
Figure 2-11– Critical perimeter
These design equations do not represent the entire design requirements for slab systems,
but rather the ones applicable to the punching shear resistance of concrete slabs without
shear reinforcement. As can be observed from the ACI methodology, this procedure is
not directly applicable to UHPC slab systems primarily as a result of the lack of
reinforcing steel for flexure, but will be used as a starting point for this research effort.
2.5 Existing Models for Punching Shear A number of models, in addition to the ACI 318-02 design equations for punching shear,
were evaluated to determine if they were applicable for predicting the punching shear
capacity of UHPC. Some of the models were deemed not applicable, while others were
given further consideration. This section briefly discusses the various models considered
and specifies whether or not the model was evaluated further. It should be noted that a
number of the models were excluded because the tensile steel reinforcement and the
concrete contribution were integrated and it was not possible to distinguish the two
separate components. This was the case with many of the models proposed in the initial
stages (ASCE-ACI Task Committee 1974) of the development of the current ACI 318-02
design equations for punching shear. More details of the models deemed valid are
presented in Chapter 5.

20
2.5.1 Yankelevsky and Leibowitz Model The model proposed by Yankelevsky and Leibowitz (1999) was developed based on rigid
post-fracture behavior and utilizes post fracture properties of concrete at the rough crack
interfaces. The model attempts to predict the force-displacement resistance, stress
distribution along the cracks, and the shape of the punched conical failure cone. The
assumptions used in developing the model were:
• A single cracked surface already exists
• The cracked surface is divided into two elements, the punch wedge and outer slab
• Reinforcement is neglected
• Deformation and resistance are concentrated along cracked surface
• The failure surface is rough and aggregate interlock provides resistance
This model was not deemed applicable to UHPC for a few reasons. With UHPC not
containing any coarse aggregate, the resistance from aggregate interlock would be
significantly different than in conventional concrete. Additionally no consideration was
given to the reinforcement, which for UHPC would eliminate the fiber contribution all
together.
2.5.2 Walraven, Pat, and Markov Walraven et al. (1987) studied the effects of fiber reinforcement on the punching shear
capacity of reinforced concrete. The testing considered the effect of circular columns
causing a punching shear failure in reinforced concrete slabs with additional fiber
reinforcement. The research focused on determining the effect of the addition of fibers,
whether they increased the strength of a cracked section or enhanced the pre-cracking
strength. A new model was not developed, but empirical models for the concrete
contribution were considered in conjunction with a model for the fiber contribution. The
empirical models used for the concrete contribution were a function of the tensile
reinforcement ratio and considered not to be applicable for UHPC.

21
2.5.3 Shaaban and Gesund Model Shaaban and Gesund (1994) studied the effects of steel fiber volume on the punching
shear strength of reinforced concrete slabs. In their study, thirteen slabs of varying
strength and fiber volume were tested to failure to determine if the punching shear
capacity could be improved through the addition of fibers. The foundation of their
research was developed from earlier findings that indicated that the addition of fibers to
concrete increased the tensile capacity which could be directly related to punching shear,
attributed to be a principal tensile stress failure. The analysis focused on the critical
punching area and how it was affected by the addition of fibers, and it was determined
that there was little difference between the results and the ACI 318-89 model. An
equation based on the ACI design equation that considered the fiber volume in the
prediction for the punching shear capacity was proposed. This equation was deemed
acceptable for comparison because it was of the same form as the ACI design equation
and also considered the fiber contribution. The only significant issue regarding this
model was that the fiber content in the Ductal slabs is constant for all the tests. A more
detailed discussion for this model is provided in Chapter 5.
2.5.4 Narayanan and Darwish Model Naryanan and Darwish (1994) studied the effects of steel fiber reinforcement on the
punching shear capacity of micro-concrete (concrete without coarse aggregate). The test
parameters varied in their investigation were volume fraction of fibers, amount of tensile
reinforcement, and concrete strength. In their study, a total of twelve slabs were tested to
failure and illustrated the improvement achieved in punching shear capacity with the
addition of steel fibers. They also developed an equation that was based on a semi-
empirical model for the ultimate shear of fiber-reinforced concrete beams which
considered the effects of concrete, steel fibers, and tensile reinforcement separately. The
separate consideration of each term allowed for the punching shear capacity of UHPC
slabs to be compared by neglecting the contribution of the tensile reinforcement. The
results from their investigation and those of other researchers were then compared with
22
the prediction equation and good agreement was achieved. Additional testing by Tan and
Paramasivam (1994) further validated the model. This proposed model will be discussed
in more detail in Chapter 5.
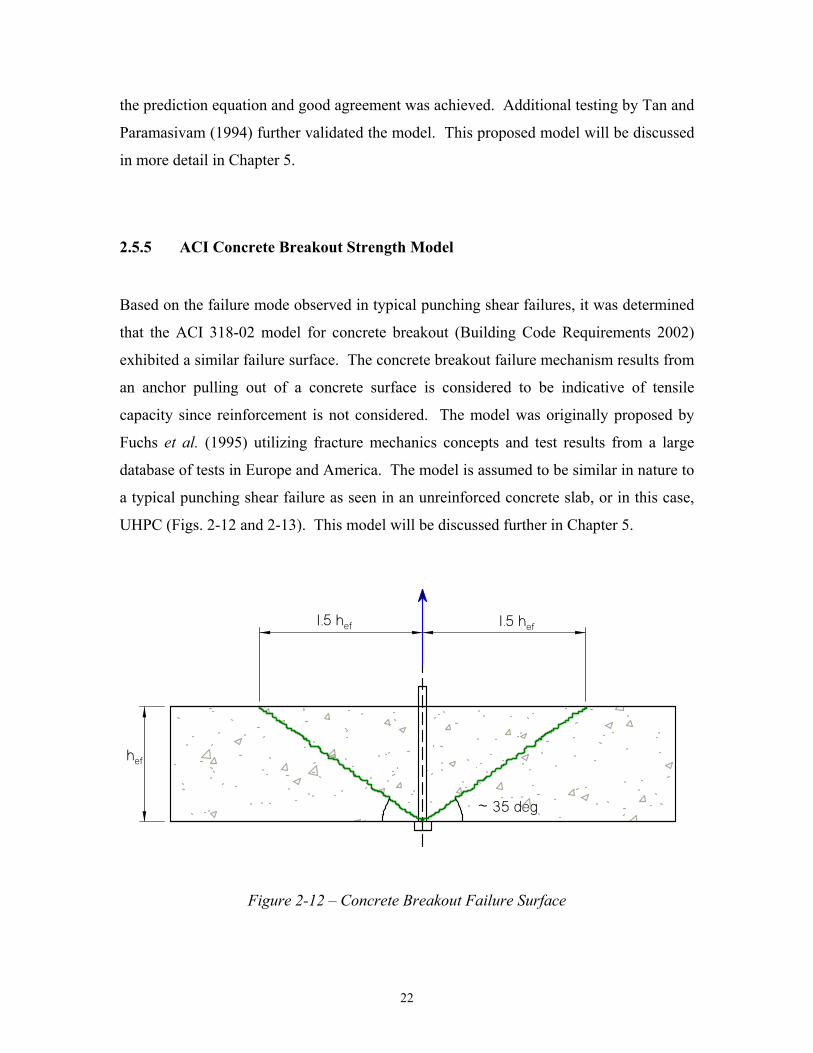
2.5.5 ACI Concrete Breakout Strength Model
Based on the failure mode observed in typical punching shear failures, it was determined
that the ACI 318-02 model for concrete breakout (Building Code Requirements 2002)
exhibited a similar failure surface. The concrete breakout failure mechanism results from
an anchor pulling out of a concrete surface is considered to be indicative of tensile
capacity since reinforcement is not considered. The model was originally proposed by
Fuchs et al. (1995) utilizing fracture mechanics concepts and test results from a large
database of tests in Europe and America. The model is assumed to be similar in nature to
a typical punching shear failure as seen in an unreinforced concrete slab, or in this case,
UHPC (Figs. 2-12 and 2-13). This model will be discussed further in Chapter 5.
Figure 2-12 – Concrete Breakout Failure Surface
~ 35 deg
1.5 hef 1.5 hef
hef

23
Figure 2-13 – Unreinforced Concrete (or Ductal®) Punching Shear Failure Surface
2.6 Summary of Literature Review
This chapter has presented a brief overview of UHPC and its potential impacts in
structural applications. Also presented was a summary of the optimization modeling
research efforts conducted at MIT and an overview of the current ACI 318-02 design
requirements for punching shear as well as other models for characterizing punching
shear strength. The research presented hereafter will attempt to correlate results from
experimental testing with the established guidelines and develop new guidelines for
UHPC slab systems.
~ 20 deg
hslab
1.5 hslab c 1.5 hslab

24
Chapter 3 - Preliminary Analysis
3.1 Summary of preliminary analysis procedures and assumptions
Slab systems differ considerably when compared to beam members due to the multi-
dimensional nature of their configuration. The geometry of a slab makes it a highly
redundant system, capable of undergoing significant rotations and deflections,
maintaining a plastic moment and even redistributing bending moments prior to failure.
As a result of this redundancy, slabs are very complex to analyze, not adhering to simple
analysis procedures that can be used on other members such as beams and columns.
The determination of punching shear capacity of slabs historically has been based on
experimental data obtained from laboratory testing, but no established models exist for
the determination of actual behavior at failure in a slab (ASCE-ACI Task Committee
1974). This chapter aims to establish a preliminary model for the determination of the
punching shear capacity of UHPC slabs based on current ACI guidelines, modified to
account for the properties of UHPC. Significant consideration is given to yield line
analysis which serves as a basis for the determination of the failure mechanism, flexural
failure or punching shear. This preliminary analysis was used to establish the dimensions
of the specimens, the supporting system, and the loading plate sizes.
3.2 Failure Mechanisms
The goal of this research effort is to determine guidelines for the design of UHPC to
resist punching shear. However, in a slab system the mechanism of failure may be either
flexure or punching. In order to quantify the limits of the punching failure load, a good
understanding of the flexural failure load is also required. This will allow the design of
specimens which fail primarily in punching shear.

25
3.2.1 Flexural Failure Mechanism
3.2.1.1 Yield Line Analysis
A common method for the determination of flexural capacity of concrete slabs is yield
line analysis. In yield line analysis a collapse mechanism for the slab is determined, with
consideration given to the boundary conditions, and used in conjunction with the
principle of virtual work to determine the ultimate load of the slab system (Park and
Gamble 2000). A generic representation of a probable collapse mechanism, involving
formation of plastic hinges, for a simply supported slab with a uniformly distributed load
is shown in Fig. 3-1.
Figure 3-1 – Generic Failure Mechanism for SS Slab with Uniformly Distributed Load
The use of yield line analysis requires knowledge of the plastic flexural capacity of the
slab, and the results serve as an upper bound on the ultimate load of the system. The
results of yield line analysis for a given slab are either correct or too high and are highly
dependent on proper selection of a failure mechanism (Park and Gamble 2000).
The critical factors that must be considered when using yield line analysis are the
distribution of the slab reinforcement, the ductility of the slab, and the conditions at the
ultimate load. Yield line analysis is considered applicable for use in slab systems that are
reinforced uniformly, typically in orthogonal directions; it is assumed that UHPC satisfies
this requirement due to the randomly distributed steel fibers in the matrix. While
Plastic hinges

26
conventional concrete uses rebar to provide the reinforcement, the steel fibers in UHPC
serve as the micro-reinforcement in a similar manner. Slabs should also be sufficiently
ductile to allow for plastic hinges to develop throughout the system; the degree of
ductility or ductility factor is typically determined from the moment-curvature
relationship as the ratio of the ultimate curvature (φu) to the yield curvature (φy). The
moment-curvature relationship for a reinforced concrete slab can be represented by a tri-
linear shape consisting of an initially elastic portion, a linear section to yielding of the
reinforcement, and a nearly horizontal region until failure as illustrated in Fig. 3-2 (Park
and Gamble 2000).
Curvature φ
MomentM
φy φu
Mn
Ultimate strain in concrete
First yielding of reinforcement
First cracking of concrete
Figure 3-2 – Typical Moment-Curvature Relationship for Reinforced Concrete Slab
Due to their highly redundant nature, slabs are capable of redistributing moments after
the onset of cracking. When additional load is applied to the system, a large change in
curvature occurs at the locations of first yielding and plastic hinges continue to form until
there are a sufficient number of sections (rigid segments between yield lines) to result in
failure of the slab; at this point the slab is no longer able to support additional load (Park
and Gamble 2000). Yield line analysis allows the designer to place an upper limit of the
capabilities of the slab, and design accordingly.

27
3.2.1.2 Flexural Capacity (Ultimate)
In order to properly perform a yield line analysis for UHPC slabs, the plastic flexural
capacity was required; this would serve as the resistance to rotation and deformation of
the plastic hinges. The model for the stress-strain relationship of UHPC from the work of
Park et al. (2003) is illustrated in Figure 3-3, where Ductal® is assumed to be linear
elastic in the compression zone, linear elastic in the tension region up to the cracking
strain, and elastic perfectly plastic to the limiting strain.
ε
σ
E
tcεεlim
ft
εlim = maximum admissible strain as defined by Park et al. (2003) εtc = strain at which first cracking occurs
Figure 3-3– Stress vs. Strain Relationship for UHPC
This stress-strain relationship was used to determine the flexural capacity, Mn, for various
slab thicknesses using conventional sectional analysis methods; an iterative solution to
balance the forces was required to determine the depth of the compression zone (Fig. 3-4).
The results of this analysis are summarized in Table 3-1.

28
C
T1
T2
d
c
d-c
ft
Eεc
STRAIN STRESS FORCE
εc
εt < εlim
εtc
Figure 3-4– Section model for UHPC Slab
Assumptions: (E = 7820 ksi, ft = 1.1 ksi, ω = 0.012 in. (0.3 mm), and b = 12 in.)
To determine if UHPC was suitable for yield line analysis, the moment curvature
relationships for various plate thicknesses were developed (Fig. 3-5) and compared to the
moment-curvature relationship of conventional reinforced concrete (Fig. 3-2). For UHPC,
specifically Ductal®, the flexural capacity in this analysis was limited by the limiting
strain, εlim, on the tensile face as proposed in the report by Park et al. (2003). As
illustrated in Fig. 3-5, the moment-curvature relationship of UHPC can be approximately
represented by a bi-linear relationship similar in shape to the tri-linear relationship of
reinforced concrete. In UHPC there exists a distinct bend-over point which correlates to
yielding of the reinforcing steel in conventional slabs, and the relationship also plateaus
as it approaches the ultimate moment. For the 3-1/2 in. and 4 in. thick slabs, the region
beyond the bend-over point does not adequately approach the horizontal plateau prior to
Table 3-1 – Flexural Capacity (Mu) of UHPC Slabs
d εt c T1 T2 C Mu in strain in kips kips kips kip-in/in 2 8.86E-03 0.301 0.18 22.06 22.24 23.5
2.5 7.09E-03 0.414 0.27 26.99 27.27 36.2 3 5.91E-03 0.535 0.39 31.77 32.15 51.6
3.5 5.06E-03 0.664 0.52 36.40 36.92 69.4 4 4.43E-03 0.800 0.67 40.90 41.57 89.7

29
the ultimate moment and was not included in this research effort, as this trend is not ideal
for yield line analysis.
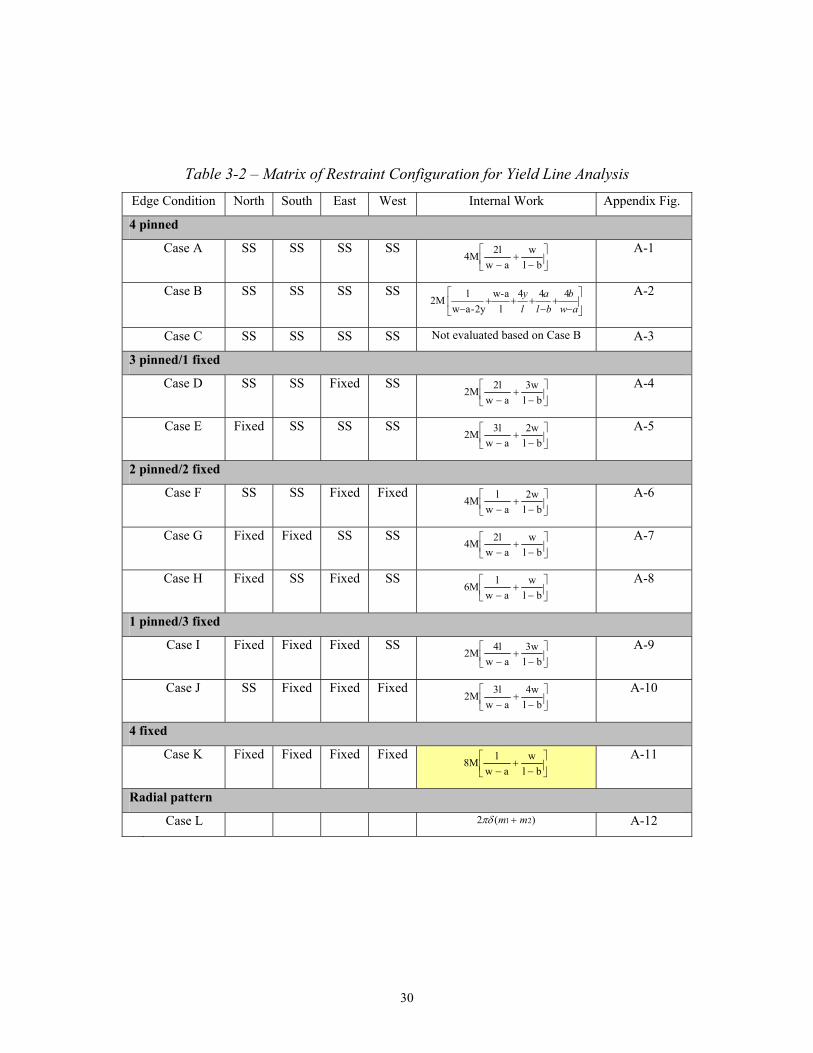
3.2.1.3 Yield Line Analysis Results for UHPC
Based on the moment-curvature relationships developed, yield line analyses were
performed for various slab thicknesses: 2 in., 2-1/2 in., and 3 in.. The yield line analyses
conducted considered a distributed load over an small area (a x b) to simulate the effect
of a standard tire patch load with varying restraint conditions as summarized in Table 3-2.
A generic diagram of the dimensions considered is shown in Fig. 3-6 and detailed
diagrams of each configuration are further illustrated in Appendix A.
Moment Curvature Relationships for UHPC (Ductal®)
0
20
40
60
80
100
0.0E+00 1.0E-03 2.0E-03 3.0E-03 4.0E-03 5.0E-03 6.0E-03
Curvature - φ (in/in)
Mom
ent -
Mu (
kip-
in)
2 in 2.5 in 3 in 3.5 in 4 in Strain Limit
Figure 3-5– Moment-Curvature Relationship for UHPC
30
Table 3-2 – Matrix of Restraint Configuration for Yield Line Analysis Edge Condition North South East West Internal Work Appendix Fig.
4 pinned
Case A SS SS SS SS
−
+− bl
waw
2l4M A-1
Case B SS SS SS SS
−+
−+++
− awb
bla
ly 444
la-w
2y-awl
2M A-2
Case C SS SS SS SS Not evaluated based on Case B A-3
3 pinned/1 fixed
Case D SS SS Fixed SS
−
+− bl
3waw
2l2M A-4
Case E Fixed SS SS SS
−
+− bl
2waw
3l2M A-5
2 pinned/2 fixed
Case F SS SS Fixed Fixed
−
+− bl
2waw
l4M A-6
Case G Fixed Fixed SS SS
−
+− bl
waw
2l4M A-7
Case H Fixed SS Fixed SS
−
+− bl
waw
l6M A-8
1 pinned/3 fixed
Case I Fixed Fixed Fixed SS
−
+− bl
3waw
4l2M A-9
Case J SS Fixed Fixed Fixed
−
+− bl
4waw
3l2M A-10
4 fixed
Case K Fixed Fixed Fixed Fixed
−
+− bl
waw
l8M A-11
Radial pattern
Case L )(2 21 mm +πδ A-12

31
w
l
a
b
fixed
SS
Figure 3-6– Generic Yield Line Analysis Configuration
The results of the analyses demonstrated that a configuration of four fixed edges would
result in the highest load to cause a flexural failure, leaving more probability that a
punching shear failure would occur for small punch sizes. It should be noted that no
consideration was given to corner edge effects. The preliminary analysis for punching
shear is discussed in further detail in the next section.
3.2.2 Punching Shear Failure Mechanism
3.2.2.1 Tensile Strength of Ductal®
Lack of tensile strength is one of the most distinguishing characteristics when comparing
conventional concrete to UHPC. Concrete is known to have a very low tensile capacity
and to be incapable of sustaining load beyond initial cracking, and for this reason
additional reinforcement is required to support tensile loads. UHPC has been shown to
exhibit significantly improved tensile strength, both before and after cracking (Graybeal
and Hartmann 2003). This tensile strength of UHPC is achieved as a result of the
interaction of the randomly oriented steel fibers acting as reinforcement on a micro level
which prevents cracks from forming. After cracking has occurred, the steel fibers are
capable of sustaining additional tensile loads until the fibers are pulled from the matrix

32
and the section severs. The tensile strength in UHPC alone is not sufficient to carry the
loads for many structural applications, but does allow for the designer to reduce the
amount of reinforcement needed to resist tension. The testing conducted by Graybeal and
Hartmann (2003) also indicates that there can be an improvement in the tensile strength
of UHPC depending on the type and time of the curing regime.
3.2.2.2 ACI Approximation
The current ACI Code (Building Code Requirements 2002) does not give significant
consideration to the tensile strength in concrete in flexure and assumes it to be about 10
to 15 percent of the compressive strength. For two-way or punching shear design
equations in the ACI code, the term cf ' (psi) is included because it serves as a measure
of the concrete tensile strength, but is limited to a value of 100 psi (10,000 psi
compressive strength concrete). This limit has been placed due to the limited amount of
experimental test data on concrete with strengths above 10,000 psi compressive strength.
Although there is limited test data for high strength concrete and UHPC does not contain
reinforcement in the conventional sense, the ACI design equations presented below serve
as the foundation for the preliminary prediction of the punching shear capacity of UHPC
slabs.
The equations presented in ACI 318-02 are as follows:
Equation 3-1
Equation 3-2
Equation 3-3
where: f’c = compressive strength of the concrete
bo = the perimeter of the critical section − critical perimeter (see Fig. 2-11)
dbfV occ
c ')42(β
+=
dbfb
dV oc
o
Sc ')2( +=
α
dbfV occ '4=

33
d = the distance from extreme compression fiber to centroid of longitudinal tension
reinforcement (See Fig. 2-10)
βc = the ratio of the long side to the short side of the concentrated load or reaction area
αs = a factor for slab column connections based on the location of the column (interior,
exterior, corner)
To roughly establish the punching shear capacity of UHPC slabs, the failure surface was
assumed to be the same as that previously defined by ACI for punching shear. It was also
assumed that the full tensile strength of the failure surface could be developed prior to
punching. By replacing the tensile contribution of conventional concrete with the tensile
capacity of Ductal, the following equation was developed:
Equation 3-4
where: =DuctalV Punching shear capacity of Ductal slab
=tf Brittle tensile strength of composite matrix - Park et al. (2003) ~ 0.1 ksi
=mk Post-cracking tensile strength of composite matrix - Park et al. (2003) ~ 1.0 ksi
=ob Critical perimeter (defined at a distance d/2 from loading area)
=d Plate thickness (differing from the ACI definition due to the lack of mild reinforcing steel)
This equation was used to determine the punching shear capacity of various plate
thicknesses with varying punch configurations. The results for various plate thicknesses
with a standard wheel patch loading area (8 in. x 20 in.) are summarized in Table 3-3.
Also included for comparison is the punching shear capacity of a 10,000 psi compressive
strength concrete subjected to the same loading conditions with an assumed cover of 3/8
in., further demonstrating the improved capabilities expected from UHPC.
dbkfV omtDuctal )( +=

34
Table 3-3 – Punching Shear Capacity of UHPC vs. 10,000 psi Conventional Mix
d bo A = bod VDuctal V10,000 in in in2 kips kips 2 64 128 140.8 41.6
2.5 66 165 181.5 56.1 3 68 204 224.4 71.4
3.5 70 245 269.5 87.5 4 72 288 316.8 104.4
3.2.3 RISA 3-D Model
RISA-3D was used to model the behavior of the slabs in various configurations;
variations of the plate size, punch area, edge restraints, and plate thickness were all
considered. The primary purpose of these models was to ensure that the stress
distribution remained within the body of the slab and did not exceed the tensile capacity
of the slab. For the smaller plates tested, a 45 in. square plate was sufficient to maintain
the stress distribution within the slab body, while 7 ft x 12 ft slabs were required for large
slabs subjected to the AASHTO wheel patch load. An example of one of the models is
shown below in Fig. 3-7; the contours shown represent the principal stresses on the
bottom (tensile) of a slab loaded from the top and restrained on two edges. The RISA-3D
modeling proved most useful in determining the likely stress distribution that would
occur with variations in the restraint conditions and verified the yield line analysis
conclusion that fixed edges on all four sides would result in the largest failure load. The
model also helped determine the length of plate required so the influence of the free
edges would be minimized.

35
3.3 Specimen Sizing and Selection
Due to the high cost of Ductal, it was prudent to minimize the material used; it was
determined that 3 ft by 3 ft plates with fixed edges would provide a punching shear
failure if the loading areas were sufficiently small. The expectation of the testing was
that a series of plates loaded over small areas would provide sufficient insight into the
punching shear capacity of UHPC which could then be scaled up to accommodate
practical applications.
3.4 Review of Preliminary Analysis
The goal of this research project was to develop guidelines for the design of UHPC to
resist punching shear. With slab systems there are two mechanisms of failure, flexure or
punching shear, each with its own failure mode. In order to quantify the punching shear
capacity of UHPC, the boundary between these two failure mechanisms must be
determined.
An upper bound approach, yield line analysis, was used to determine the flexural capacity
of various slab configurations. This analysis proved to be critical in that the results
demonstrated that the configuration with all sides restrained would require the largest
Figure 3-7– Risa 3-D Model of UHPC slab (restrained on two sides)

36
load to cause failure, providing more opportunity to force a punching shear failure. The
punching shear capacity of UHPC was estimated based on the ACI 318-02 design
equations with modifications to account for the tensile capacity of UHPC. This
preliminary analysis allowed for the determination of specimen sizes to be used in the
experimental testing; these specimens were sized such that a punching shear failure could
be achieved depending on the size of the loading area. This analysis served as the
starting point for the experimental testing to be conducted. The actual test matrix will be
summarized in Chapter 4 – Materials and Testing.
In addition to the small tests, dimensions and support conditions for larger specimens,
more representative of the MIT optimized section, were also determined. The results of
these tests are not presented herein.

37
Chapter 4 - Materials and Testing
4.1 Overview
In order to characterize the punching shear capacity of Ductal® a total of twelve 45 in. x
45 in. slabs were tested to failure. The testing was performed on three slab thicknesses, 2
in., 2-1/2 in., and 3 in., with varying punch areas. One of the objectives of the testing
was to determine the boundary between punching shear and flexural failures. Due to the
uncertainty of the boundary between the failure mechanisms, the determination of the
punch area used was based on the results of the previous test.
4.2 Specimen Fabrication
The twelve slabs used in the testing were fabricated by Prestress Services, Inc. (PSI) in
Lexington, Kentucky in October and November of 2003. The slabs were poured from the
excess Ductal® concrete material used in beam segments for the Federal Highway
Administration (FHWA). The formwork was designed and constructed by PSI to
produce 45 in. x 45 in. slabs with block-outs as illustrated in Fig. 4-1. The forms were
constructed so that they could be reused to coordinate with the Ductal® pours for the
FHWA beams. The block-outs were formed with pieces of PVC in the interior and lifting
eyes in the corner locations; the lifting eyes were installed to allow easy lifting and
positioning of the slabs.
The slabs were poured using a trough system that was similar in width to the slab width.
A mix truck was used to pour the Ductal® into the trough, which was pushed across the
forms in a linear manner to fill the formwork. The slabs were covered with plastic and
then subjected to an initial cure followed at a later date with a post-cure heat treatment.
This curing regime was demonstrated by Graybeal and Hartmann (2003) to provide
improved tensile strength.
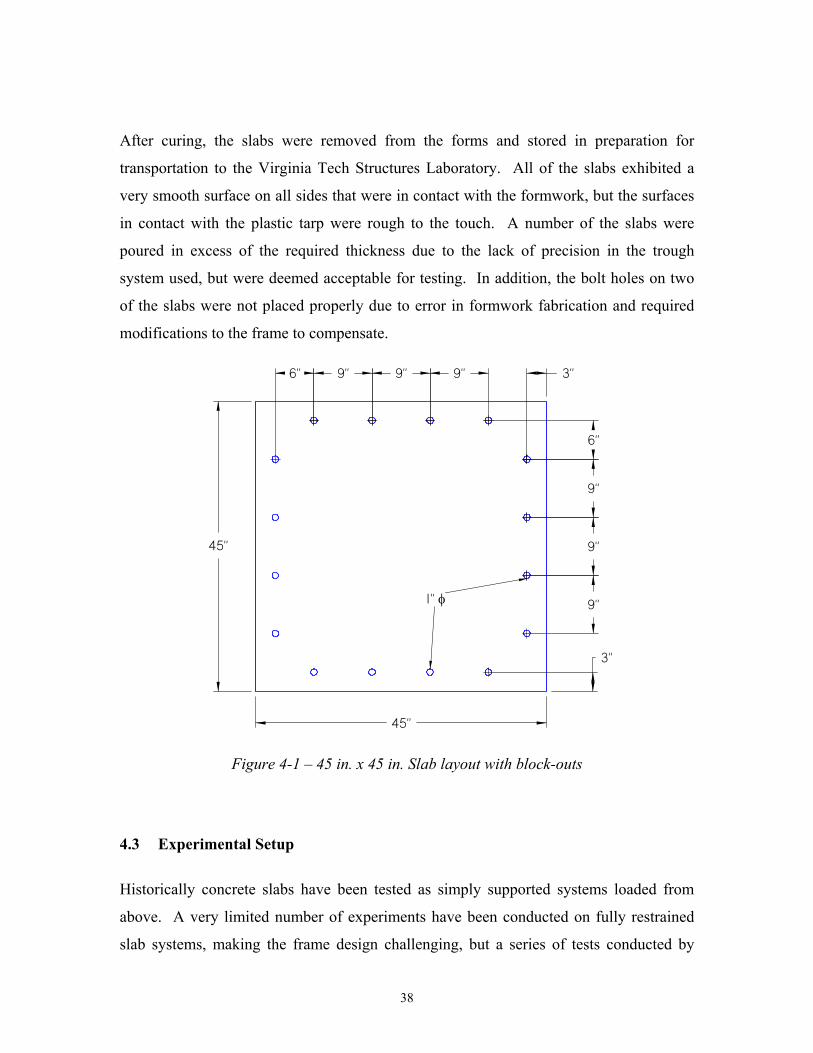
38
After curing, the slabs were removed from the forms and stored in preparation for
transportation to the Virginia Tech Structures Laboratory. All of the slabs exhibited a
very smooth surface on all sides that were in contact with the formwork, but the surfaces
in contact with the plastic tarp were rough to the touch. A number of the slabs were
poured in excess of the required thickness due to the lack of precision in the trough
system used, but were deemed acceptable for testing. In addition, the bolt holes on two
of the slabs were not placed properly due to error in formwork fabrication and required
modifications to the frame to compensate.
9"
9"
9"
6"
3"
45"
45"
9"9"9"6" 3"
1" φ
Figure 4-1 – 45 in. x 45 in. Slab layout with block-outs
4.3 Experimental Setup
Historically concrete slabs have been tested as simply supported systems loaded from
above. A very limited number of experiments have been conducted on fully restrained
slab systems, making the frame design challenging, but a series of tests conducted by
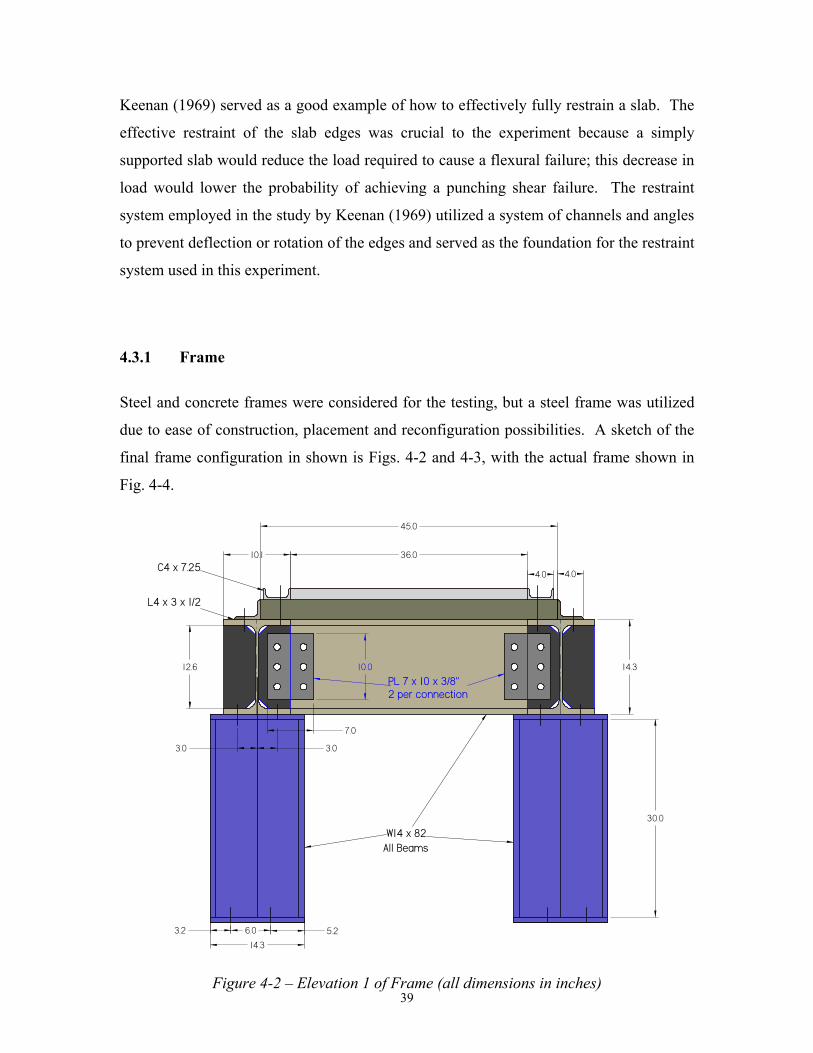
39
Keenan (1969) served as a good example of how to effectively fully restrain a slab. The
effective restraint of the slab edges was crucial to the experiment because a simply
supported slab would reduce the load required to cause a flexural failure; this decrease in
load would lower the probability of achieving a punching shear failure. The restraint
system employed in the study by Keenan (1969) utilized a system of channels and angles
to prevent deflection or rotation of the edges and served as the foundation for the restraint
system used in this experiment.
4.3.1 Frame
Steel and concrete frames were considered for the testing, but a steel frame was utilized
due to ease of construction, placement and reconfiguration possibilities. A sketch of the
final frame configuration in shown is Figs. 4-2 and 4-3, with the actual frame shown in
Fig. 4-4.
36.010.1
4.04.0
14.3
5.23.2 6.0
14.3
45.0
12.6
L4 x 3 x 1/2
C4 x 7.25
30.0
W14 x 82All Beams
PL 7 x 10 x 3/8"2 per connection
10.0
7.0
3.0 3.0
Figure 4-2 – Elevation 1 of Frame (all dimensions in inches)

40
StiffenerLocation
30.0
14.3
36" beam(out of plane)
6.02.1 2.1
.6945.0
58.0
Strong Floor Beams
5.9
1.4 6.0
10.1
6.0 2.3
6.0
Figure 4-3 – Elevation 2 of Frame (all dimensions in inches)
Figure 4-4 – Photo of Actual Frame

41
The slabs were supported by W14 x 82 beams bolted to W14 x 82 columns which were
bolted to the reaction floor. The rotations and deflections of the slabs were restrained by
L4x3x1/2 angles on the perimeter and C4x7.25 channel sections on top of the slab bolted
through the slab and the supporting beam flanges. A detail of the restraint system is
illustrated in Fig. 4-5.
L4 x 3 x 1/2
C4 x 7.25
DUCTAL SLAB
W14 x 82
Figure 4-5 – Detail of Frame Restraint System
4.3.2 Instrumentation
The slabs tested were loaded from the bottom using a 300 ton ram and a 150 kip load cell.
The slabs were loaded with the formed surface facing up; this allowed for observation of
tensile crack propagation on the smooth face of the slab.
Each of the slabs was outfitted with a series of strain gauges on the top and bottom face
to aid in monitoring of the strain response. The placement of the strain gauges was based
on the likely location of crack formation, and adjusted during the testing to account for
inaccuracies in the prediction. The strain gauge nomenclature was based on a relative
reference with respect to the Virginia Tech Structures Laboratory, with East in the

42
direction of the main bay door and North in the direction of the machine shop. The
expected flexural failure mechanism for a slab fully restrained with a point load at the
center is illustrated in Fig. 4-6. The strain gauges were positioned in directions that were
perpendicular to the predicted crack pattern; the goal was to observe the strain response
and compare the results to the limiting strain values proposed by Park et al. (2003). The
general placement locations for strain gauges for the top and bottom faces are illustrated
in Fig. 4-7. It should be noted that the final strain gauge placement was dependent on the
predicted failure mechanism determined prior to testing as well as the failure mechanism
predicted based on previous tests.
A maximum of nine strain gauges were used on each slab due to the limitations on the
data acquisition system used. Vishay Micro-Measurements strain gauges were used on
all slabs with CEA-06-500UW-350 (1/2 in. – 350 Ω - G.F. = 2.100) gauges used on the
first 11 slabs and CEA-06-500UW-120 (1/2 in. – 120 Ω - G.F. = 2.085) gauges used on
the final slab. Prior to mounting the gauges on the slab, the surface was ground with a
masonry grinding pad to ensure a smooth surface for adhesion. The gauges were
fixededge
yield linepattern
Figure 4-6 – Fully Restrained Yield Line Pattern
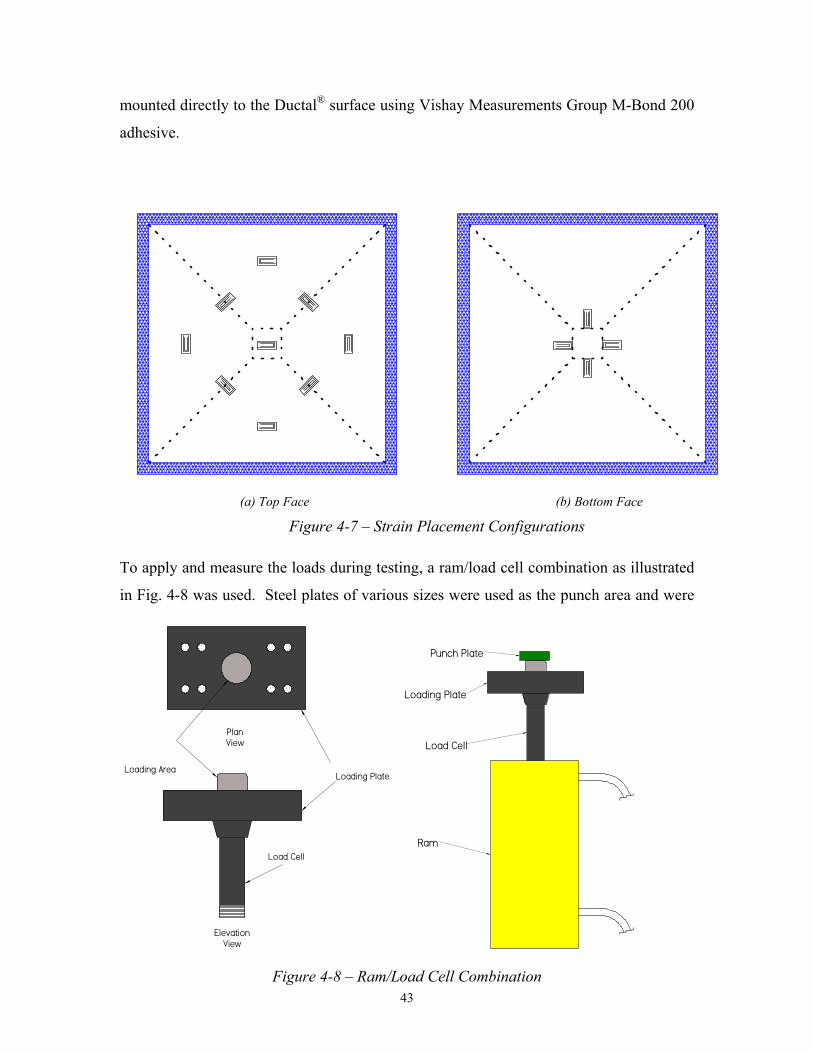
43
mounted directly to the Ductal® surface using Vishay Measurements Group M-Bond 200
adhesive.
(a) Top Face (b) Bottom Face
Figure 4-7 – Strain Placement Configurations
To apply and measure the loads during testing, a ram/load cell combination as illustrated
in Fig. 4-8 was used. Steel plates of various sizes were used as the punch area and were
Load Cell
Loading PlateLoading Area
PlanView
ElevationView
Ram
Load Cell
Loading Plate
Punch Plate
Figure 4-8 – Ram/Load Cell Combination

44
placed on top of the loading area to transfer the load from the ram to the plate specimen.
A list of the punch sizes used are summarized later in this chapter. To measure the
displacement of the slab at the point of load application, one wire pot displacement
transducer was attached to each side of the ram to provide a redundant system for
measuring displacements (Fig. 4-9). The wire pots were not attached directly to the slabs
due to the inability to bore into the slab with a conventional drill and masonry bit.
(Latin Tech website)
Figure 4-9 – Wire Pot Displacement Transducer
During the initial series of tests, two linear variable displacement transducers (LVDTs)
were mounted on the frame and positioned to record the displacement at the top of the
angles on perpendicular faces. The LVDTs were used to verify the stiffness of the angles,
but were not used after the initial series of tests due to the negligible deflections observed.
A generic diagram of a typical LVDT is shown in Fig. 4-10. Due to the number of
unknowns in the design of the frame, assumptions were made about the acceptable
deflections of the angles.
Figure 4-10 – Linear Variable Displacement Transducer
The output was recorded using a Vishay Measurements Group System 5000 Scanner.
The acquisition system used contained two strain gauge cards and two high-level cards
capable of supporting 10 strain gauges and 10 high-level instruments (wire pots, plunger
displacement transducers, and potentiometers). The software used for recording and

45
processing the test data was Smart Strain. For all of the tests, the data was recorded on a
continuous basis with sampling rates varying from 1-2 recordings per second; the
software allowed for real-time monitoring of results during testing.
4.4 Test Matrix
4.4.1 Trial Specimens
Prior to testing the Ductal® slabs in the frame, two conventional concrete slabs reinforced
with welded wire fabric were tested to ensure that the proper failure mechanism was
achieved and that the frame behaved as predicted. This additional testing was important
due to the high cost of Ductal® and the difficulty in producing additional slabs for testing.
4.4.2 Test Parameters and Series Details
The testing was conducted on three series of slabs (2.0 in., 2.5 in., and 3.0 in.) with
varying punch sizes. One of the goals of the testing was to determine the boundary
between a punching shear failure and a flexural failure with the majority of tests failing in
punching so strength could be characterized. The philosophy in determining the
punching area was to produce a punching shear failure in the first test of each series
where the punching shear capacity was determined from the preliminary analysis results.
The subsequent tests varied the plate area to produce failures on both sides of the
spectrum, punching shear and flexure, that would help define the boundary between the
two failure mechanisms.
4.4.2.1 Series 1
The first series tested were the 2.0 in. thick slab specimens. These slabs were tested first
due to the limited knowledge of the behavior of Ductal® in punching shear and the
unlikelihood that a 2.0 in. slab would be used in a bridge application based on the study
by Park et al. (2003). Initially the plan was to test four plates in each series, but due to

46
excessive thickness of one of the 2.0 in. slabs it was evaluated as a 3.0 in. slab in Series 3.
The test matrix for Series 1 is shown in Table 4-1.
Table 4-1 – Series 1 Matrix (2.0 in. slabs)
Test # Punch Area Punch Dimensions Predicted
Failure Load
Predicted Failure
Mechanism
1 2.25 in2 1.5 in. x 1.5 in. 30.8 k Punching
2 4.0 in2 2.0 in. x 2.0 in. 33.2 k Flexural
3 1.0 in2 1.0 in. x 1.0 in. 26.4 k Punching
4.4.2.2 Series 2
The specimens evaluated in Series 2 were 2.5 in. thick slab specimens. These were tested
second in order to provide more results prior to testing the 3.0 in. slabs. Initially only
three slabs were tested because the bolt holes were misaligned on the fourth due to
improper placement of the block-outs during casting, but a total of four slabs were tested
after modifications were made to the frame. The test matrix for Series 2 is shown in
Table 4-2.
Table 4-2 – Series 2 Matrix (2.5 in. slabs)
Test # Punch Area Punch Dimensions Predicted
Failure Load
Predicted Failure
Mechanism
1 4.0 in2 2.0 in. x 2.0 in. 49.5 k Punching
2 9.0 in2 3.0 in. x 3.0 in. 52.7 k Flexural
3 2.25 in2 1.5 in. x 1.5 in. 44.0 k Punching
4 6.25 in2 2.5 in. x 2.5 in. 51.9 k Flexural
4.4.2.3 Series 3 The last specimens evaluated in Series 3 were 3.0 in. thick slab specimens. These slabs
were the most critical in the testing series because 3.0 in. was the minimum allowable
thickness predicted in the study by Park et al. (2003). In Series 3 a total of five slabs

47
were tested due to the additional slab gained from the excessive pouring of a 2.0 in. slab.
The test matrix for Series 3 is shown in Table 4-3.
Table 4-3 – Series 3 Matrix (3.0 in. slabs)
Test # Punch Area Punch Dimensions Predicted
Failure Load
Predicted Failure
Mechanism
1 6.25 in2 2.5 in. x 2.5 in. 72.6 k Punching
2 2.25 in2 1.5 in. x 1.5 in. 59.4 k Punching
3 1.0 in2 1.0 in. x 1.0 in. 52.8 k Punching
4 4.0 in2 2.0 in. x 2.0 in. 66.0 k Punching
5 4.0 in2 1.75” x 1.75” 62.7 k Punching
4.5 Test Procedures
4.5.1 Loading The slabs were brought into the lab using a forklift and placed near the frame. Eyebolts
were then installed in two of the opposite corner block-outs with lifting eyes installed.
The slabs were then lifted into place using the overhead crane with slings threaded
through the eyebolts and lowered into the correct position on the frame.
4.5.2 Testing The slabs were tested through a 300 ton ram with pressure applied through a hydraulic
hand pump that allowed loading to be applied in 0.5 – 1.0 kip increments. The slabs were
loaded in 3 – 5 kip increments and after each increment cracks were marked on the
specimen. The marking for cracks continued until the load was within 6 kips of the
predicted failure load, which was based on the preliminary analysis and previous test
results. For the punching shear failures, the slabs were loaded until a decrease in load
was observed in the load-deflection curve following the peak load. The criterion for
termination of loading on the flexural failures was more subjective and was determined
from the load-deflection curve as the point at which the curve reached a plateau after the
peak load.
48
Chapter 5 - Presentation of Results and Analysis
5.1 Overview
The slabs tested in this research effort failed in one of two mechanisms: punching shear
or flexure. This section summarizes the results from each test and discusses the failure
mechanisms. The results of each test are then compared to the predicted response from
the preliminary analysis and a few other proposed equations for predicting punching
shear capacity. Modifications are then suggested to improve the response prediction for
future experiments.
5.2 Failure Mechanisms
As previously stated, there were two possible failure mechanisms for the slabs tested:
punching shear or flexure. The primary goal of this research effort was to force the
majority of the slabs to fail in punching shear and then determine the boundary for a
flexural failure.
A punching shear failure is typically a brittle failure that occurs with limited warning, and
for the Ductal® slabs this occurred when the slab failed to support additional load
followed by a conical punching failure. An example of a typical punching shear failure
for Ductal® is shown in Fig. 5-1. Cracking on the tensile face began near the center and
radiated out to one of the edges, and as the load was increased the cracking migrated to
the opposite face. For all of the slabs that failed in punching shear, the direction of
cracking tended to be in one direction; this led to the conclusion that the fibers were not
as randomly oriented as expected. This phenomenon was attributed to the casting
technique used where the slabs were poured in a uniaxial direction with a trough system,
resulting in alignment of the fibers parallel to the direction of pour. This enabled the
cracks to form between the fibers (Fig 5-2). This theory is in agreement with the trend
described by the AFGC recommendations (2002) in that the fibers tend to align with the
direction of the pour and along the formwork. Failure of the slab occurred when the cone
of failure radiating outward from the point of load application pushed up through the slab

49
body. At failure the slab was no longer capable of taking additional load and the majority
of the cracking had occurred in one direction, as illustrated in Fig. 5-3.
(a) Tensile face of typical slab failing in punching shear
(b) Loading face of typical slab failing in punching shear
Figure 5-1– Typical Punching Shear Failure for Ductal®

50
Fibers Cracking
Figure 5-2 - Fiber Orientation vs. Crack Pattern
Figure 5-3 - Typical Crack Pattern for Punching Shear Failure
Assumed Fiber Direction

51
Contrary to punching shear failures, a flexural failure is a gradual failure that allows for
the support of a reduced load after the formation of plastic hinges in the slab. A slab is
capable of additional deformation, even after the peak load is achieved, which produces a
more ductile failure, the preferred failure mechanism in design. An example of a typical
flexural failure for Ductal® is shown in Fig. 5-4 with representations for both the tensile
face and the loading face.
(a) Tensile face of typical slab failing in flexure

52
(b) Loading face of typical slab failing in flexure
Figure 5-4 – Typical Flexural Failure for Ductal®
53
Similar to the punching shear failure mechanism, cracks initially formed near the center
of the slab on the tensile face and radiated to the edge. As loading continued, the cracks
along the diagonals on the tensile face widened and extended through the slab thickness
to the loading face with additional cracks forming at the fixed support on the loading face.
The failure load was not as obvious in the flexural failures because there was no distinct
failure cone as in the punching failures. The slabs that failed in flexure reached a peak
load followed by a gradual decrease in load while continuing to deform.
All of the slabs tested failed at loads lower than predicted in both flexure and punching
shear. The overestimation of the flexural failure loads can be attributed to a number of
factors including the use of yield line analysis, inaccurate assumption of moment capacity,
and the degree of fixity at the supports. Yield line analysis serves as an upper bound on
the load carrying capacity of the slabs considered. The use of yield line analysis requires
knowledge of the moment capacity in orthogonal directions, but based on the crack
patterns observed during testing, the two were not the same as assumed in the yield line
analysis. Full restraint of the slab edges was essential for forcing punching shear failures
according to the preliminary analysis because it requires the largest load to cause a
flexural failure. Investigation of the slabs after testing showed that the flexural hinges at
the support face were not as distinct as the diagonal hinges, indicating that the slabs may
not have been fully restrained along the edges. This could have also resulted in a lower
load than predicted from the yield line analysis of a fully restrained slab. It was also
observed that corner effects were not a factor in the flexural failures. The overestimation
of the punching failure loads can simply be attributed to the lack of knowledge about the
punching behavior of Ductal® slabs. As indicated in the preliminary analysis section, the
starting point for the prediction equation was the ACI equation for punching shear, with a
modification to account for the tensile strength of Ductal®. The term that historically
represents the tensile strength of concrete ( cf '4 ) was replaced with the tensile strength
of Ductal® reported by Park et al. (2003). During this experiment the only variables that
were considered were the slab thickness and punch plate area; changes in other variables

54
such as punch plate aspect ratio or percent fiber content may have provided more insight
into the factors that affect the punching shear behavior of Ductal®.
5.3 Testing Results
5.3.1 Series 1 Results
The slabs tested in Series 1 were all approximately 2.0 in. thick specimens. These slabs
were tested first, due to the unlikelihood that slabs this thin would be used in a real bridge
application. The 2.0 in. slabs also served as a good starting point because the data
obtained from testing would provide a good lower bound for the punching shear capacity
of UHPC. The results from the 2.0 in. slabs are shown in Table 5-1. Series 1 consisted
of three tests because one of the slab specimens was poured in excess of 2.0 in. and was
deemed unacceptable for testing as a 2.0 in. slab, but was tested in Series 3 as a 3.0 in.
slab.
Table 5-1 – Series 1 Test Results
Predicted Actual
Test #
Plate
Thickness
(in.)
Punch
Plate
Size
(in.)
Punching
Failure
Load
(kips)
Flexural
Failure
Load
(kips)
Failure
Mechanism
Failure
Mechanism
Failure
Load
(kips)
Average
Maximum
Deflection(midspan)
(in.)
1 2.17 1.5 35.0 38.2 Punching Punching 23.3 .724
2 2.32 2 44.1 44.3 Flexure Punching 27.2 .796
3 2.12 1 29.1 36.1 Punching Punching 22.6 No data
The results from Series 1 indicated that a very small loading area would be required to
force a punching shear failure in Ductal slabs, but further testing was required for a
more accurate interpretation. As shown in Table 5-1, all of the Series 1 specimens tested
failed in punching shear, the slabs were loaded to the maximum load, and the failure
mechanism was abrupt, ending with the slab not capable of supporting additional load.

55
The response is best illustrated with a load-deflection curve as shown in Fig. 5-5. As
expected, the slabs were capable of undergoing a significant amount of deformation prior
to failure, around 3/4 in. for a 2.0 in. slab which equates to approximately L/48. The
failure mode for each of the specimens was similar to the description for punching shear
provided earlier in the chapter.
The strains recorded from the mounted strain gauges were highly dependent on the crack
pattern observed during the test. The strain values on the gauges located on the diagonals
of the slab varied depending on the path of the diagonal cracking, with high tensile strains
observed when the cracking passed near or through the gauge location. An example of
this trend is illustrated in Fig. 5-6 with the NE strain gauge experiencing significantly
higher tensile strain than the other gauges; a major crack likely formed underneath or
within very close proximity to this gauge. It can also be observed that the SE strain
gauge experienced an increase in tensile strain, but at a much higher load than the NE
strain gauge. This likely resulted from the strain induced at the gauge from the growth of
a crack that previously did not have a major influence on the gauge. As previously stated
in Chapter 3, the limiting strain is defined as follows:
Load vs. Displacement
0
5
10
15
20
25
0 0.1 0.2 0.3 0.4 0.5 0.6 0.7 0.8 0.9
Displacement (in)
Load
(kip
s)
Wire Pot 1 - West
Wire Pot 2 - East
Figure 5-5 – Typical Load vs. Displacement Curve for Series 1 - Slab #1

56
Limiting strain criterion εlim ≤ ωlim /lc = 1.5 ωlim /h for unreinforced sections
εlim ≤ ωlim /lc = min (3 Lf /8h; 3/200) for reinforced UHPC sections
where: ωlim = maximum admissible crack opening
Lf = fiber length
εlim = maximum admissible strain
lc = characteristic length = 2/3h
h = height of structure
A consistent measure of the orthogonal strains was not achieved in Series 1 due to
inconsistent placement of the gauges for this series. The orthogonal gauges were placed
at varying locations for Series 1 with no placement duplicated in the series. The
inconsistency in Series 1 resulted from a number of factors, including testing learning
curve factors and strain gauge availability. While a consistent measure of the orthogonal
strains was not achieved within Series 1, the placement on two of the slabs was consistent
Load vs. Strain (Diagonals)
0
5
10
15
20
25
0 1000 2000 3000 4000 5000 6000 7000 8000 9000 10000
Strain (µε)
Load
(kip
s)
North West Strain Gage (top)South West Strain Gage (top)South East Strain Gage (top)North East Strain Gage (top)Limiting Strain
Figure 5-6 – Typical Load vs. Strain (Diagonal) for Series 1 – Slab #2 (Tensile Face)
N
S
E W

57
with slabs tested in the other two series. The general trend was similar to that observed
along the diagonal, with strain response dependent on crack location, and is illustrated in
Fig. 5-7. The strain response of the gauges on the loading face was different as a result of
the gauges being in compression throughout the testing, compression shown as a negative
strain value. The general trend observed in Series 1 is illustrated in Fig. 5-8; the
compressive strain increases proportional to load increases until failure, after which the
compressive strain is relieved as the loading area punches through the plate.
The results from Series 1 were consistent over the limited number of tests, with an
increase in failure load observed with increasing punch plate dimensions. The initial
predictions did not provide very accurate results when compared to the actual results as
shown in Table 5-2. When the compared to the prediction from the preliminary analysis,
the failure load is overestimated in all cases (~62% maximum), but when compared to the
ACI 318-02 design equations (Building Code Requirements 2002) the failure load is
underestimated in all cases (~18% maximum). This trend illustrates that neither equation
provides an accurate measure of the punching shear capacity of Ductal, but the ACI 318-
02 equation (Building Code Requirements 2002) would be conservative for the 2.0 in.
slabs tested in Series 1.

58
Load vs. Strain (Orthogonal)
0
5
10
15
20
25
30
0 1000 2000 3000 4000 5000 6000 7000 8000 9000 10000
Strain (µε)
Load
(kip
s)
North Strain Gage (top)East Strain Gage (top)South Strain Gage (top)Limiting Strain
Figure 5-7– Load vs. Strain (Orthogonal) for Series 1 – Slab #2 (Tensile Face)
Load vs. Strain (Bottom)
0
5
10
15
20
25
30
-1200 -1000 -800 -600 -400 -200 0
Strain (µε)
Load
(kip
s)
West Strain Gage (bottom)
North Strain Gage (bottom)
Figure 5-8 – Typical Load vs. Strain for Series 1 – Slab #2 (Loading Face)
N
S
E W
N
S
E W

59
Table 5-2 – Series 1 Comparison of Predicted vs. Actual
Test
#
Punch
Dimension
(in.)
Actual Failure
Load (kips)
Predicted
Failure Load
(kips)
%
Difference
ACI Equation
Failure Load
(kips)
%
Difference
1 1.5 23.3 35.0 50.4% 22.4 -3.7% 2 2 27.2 44.1 62.1% 28.2 3.8% 3 1 22.6 29.1 28.9% 18.6 -17.5%
5.3.2 Series 2 Results
The slabs tested in Series 2 were all approximately 2.5 in. thick specimens. This series
was tested second in order to provide additional data prior to testing the more critical 3.0
in. slab specimens. The results from Series 2 are shown in Table 5-3. A total of four
slabs were tested in Series 2, but the final slab was not tested immediately after the third
slab due to a fabrication error with the restraint block-out locations, which required
modifications to the testing frame.
As a whole, the results observed from Series 2 were comparable to those from Series 1.
While all of the specimens tested in Series 1 failed in punching shear, the specimens
tested in Series 2 experienced both flexural and punching shear failures. The punching
shear and flexural failures were similar in nature to the descriptions earlier in the chapter.
Table 5-3 – Series 2 Test Results Predicted Actual
Test #
Plate
Thickness
(in.)
Punch
Plate
Size
(in.)
Punching
Failure
Load
(kips)
Flexural
Failure
Load
(kips)
Failure
Mechanism
Failure
Mechanism
Failure
Load
(kips)
Average
Maximum
Deflection(midspan)
(in.)
1 2.61 2 53.1 55.8 Punching Punching 33.0 0.57 2 2.58 3 63.2 55.9 Flexure Flexure 35.9 2.11
3 2.54 1.5 45.2 52.0 Punching Punching 30.5 1.26
4 2.76 2.5 64.0 63.1 Flexure Flexure 34.2 1.87

60
Similar to the specimens from Series 1, the punching shear failure is best illustrated
through the load-deflection curve in Fig. 5-9. The load-deflection curve (Fig. 5-10) for a
flexural failure illustrates the ability of the Ductal® slabs to continue to support a reduced
load while continuing to deform beyond the peak load. The strain response amongst the
two failure mechanisms was observed to be similar in nature and dependent on the
location of the strain gauge placement relative to the crack formation pattern.
Representative load-strain responses for Series 2 are illustrated in Figs. 5-11, 5-12, and 5-
13 for the diagonal, orthogonal, and loading face locations, respectively.
Load vs. Displacement
0
5
10
15
20
25
30
35
0 0.1 0.2 0.3 0.4 0.5 0.6 0.7 0.8 0.9 1
Displacement (in)
Load
(kip
s)
Wire Pot 1 - West
Wire Pot 2 - East
Figure 5-9 – Typical Load vs. Displacement Curve for Series 2 – Slab #1 (Punching Shear Failure)

61
Load vs. Displacement
0
5
10
15
20
25
30
35
40
0 0.5 1 1.5 2 2.5
Displacement (in)
Load
(kip
s)
Wire Pot 1 - WestWire Pot 2 - East
Figure 5-10– Typical Load vs. Displacement Curve for Series 2 – Slab #2 (Flexural Failure) Load vs. Strain (Diagonals)
0
5
10
15
20
25
30
35
40
0 2000 4000 6000 8000 10000 12000
Strain (µε)
Load
(kip
s)
North West Strain Gage (top)South West Strain Gage (top)South East Strain Gage (top)North East Strain Gage (top)Limiting Strain
Figure 5-11 – Typical Load vs. Strain (Diagonal) for Series 2 – Slab #2 (Tensile Face)
N
S
E W
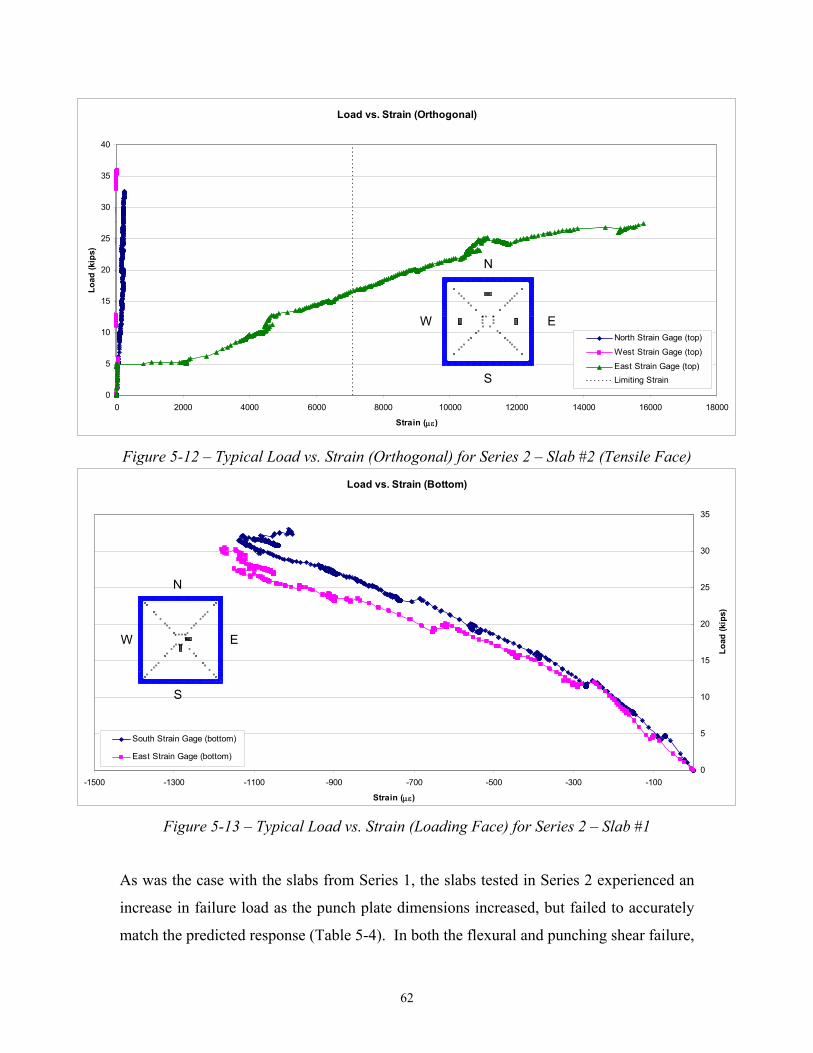
62
Load vs. Strain (Orthogonal)
0
5
10
15
20
25
30
35
40
0 2000 4000 6000 8000 10000 12000 14000 16000 18000
Strain (µε)
Load
(kip
s)
North Strain Gage (top)
West Strain Gage (top)
East Strain Gage (top)Limiting Strain
Figure 5-12 – Typical Load vs. Strain (Orthogonal) for Series 2 – Slab #2 (Tensile Face) Load vs. Strain (Bottom)
0
5
10
15
20
25
30
35
-1500 -1300 -1100 -900 -700 -500 -300 -100
Strain (µε)
Load
(kip
s)
South Strain Gage (bottom)
East Strain Gage (bottom)
Figure 5-13 – Typical Load vs. Strain (Loading Face) for Series 2 – Slab #1
As was the case with the slabs from Series 1, the slabs tested in Series 2 experienced an
increase in failure load as the punch plate dimensions increased, but failed to accurately
match the predicted response (Table 5-4). In both the flexural and punching shear failure,
N
S
E W
N
S
E W

63
the predicted failure loads were higher than the actual failure loads. This trend is
understandable for the flexural failures because the prediction is based on yield line
analysis which provides an upper bound estimate on the failure load; the interpretation of
this difference can likely be attributed to a failure mode different from the predicted
mode (~87% maximum). The comparison to the prediction for the punching shear
capacity further illustrates that the prediction model overestimates the capacity of
Ductal® in punching shear (~61% maximum). Similar to the results from Series 1, the
ACI 318-02 equation (Building Code Requirements 2002) underestimates the punching
shear capacity, but to a lesser degree in Series 2 (~5% maximum). The trend from Series
2 illustrates that the ACI 318-02 equation (Building Code Requirements 2002) is more
accurate in predicting the punching shear capacity of 2.5 in. slabs than the prediction
equation from the preliminary analysis. Unfortunately, this hypothesis carries little
validity because there were only a limited number of tests for comparison in Series 2 and
it is not valid for Series 1.
Table 5-4 – Series 2 Comparison of Predicted vs. Actual
Test
#
Punch
Dimension
(in.)
Actual Failure
Load (kips)
Predicted
Failure Load
(kips)
%
Difference
ACI Equation
Failure Load
(kips)
%
Difference
1 2 33.0 53.1 60.8% 34.0 2.9% 2 3 35.9 55.9 55.6% * - 3 1.5 30.5 45.2 47.8% 28.9 -5.3% 4 2.5 34.2 63.1 84.5% * -
* No ACI Equation for predicting flexural failure load
5.3.3 Series 3 Results
The slabs tested in Series 3 were all approximately 3.0 in. thick specimens. This series
was tested last in order to gain a good understanding of the expected response from the
Series 1 and 2 specimens. During the testing of the slabs from Series 1 and 2, all of the
slabs failed in the predicted mechanism except one slab from Series 1, but all failed at a
load significantly lower than predicted. The results from the previous tests allowed for a
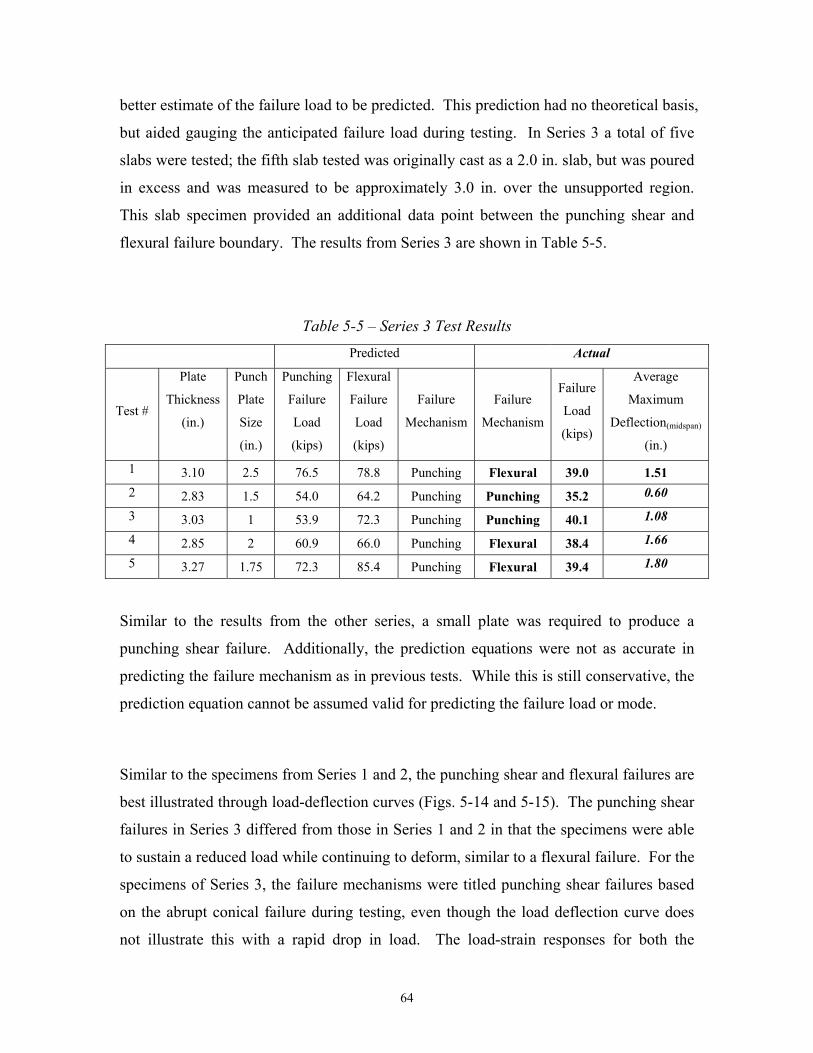
64
better estimate of the failure load to be predicted. This prediction had no theoretical basis,
but aided gauging the anticipated failure load during testing. In Series 3 a total of five
slabs were tested; the fifth slab tested was originally cast as a 2.0 in. slab, but was poured
in excess and was measured to be approximately 3.0 in. over the unsupported region.
This slab specimen provided an additional data point between the punching shear and
flexural failure boundary. The results from Series 3 are shown in Table 5-5.
Similar to the results from the other series, a small plate was required to produce a
punching shear failure. Additionally, the prediction equations were not as accurate in
predicting the failure mechanism as in previous tests. While this is still conservative, the
prediction equation cannot be assumed valid for predicting the failure load or mode.
Similar to the specimens from Series 1 and 2, the punching shear and flexural failures are
best illustrated through load-deflection curves (Figs. 5-14 and 5-15). The punching shear
failures in Series 3 differed from those in Series 1 and 2 in that the specimens were able
to sustain a reduced load while continuing to deform, similar to a flexural failure. For the
specimens of Series 3, the failure mechanisms were titled punching shear failures based
on the abrupt conical failure during testing, even though the load deflection curve does
not illustrate this with a rapid drop in load. The load-strain responses for both the
Table 5-5 – Series 3 Test Results Predicted Actual
Test #
Plate
Thickness
(in.)
Punch
Plate
Size
(in.)
Punching
Failure
Load
(kips)
Flexural
Failure
Load
(kips)
Failure
Mechanism
Failure
Mechanism
Failure
Load
(kips)
Average
Maximum
Deflection(midspan)
(in.)
1 3.10 2.5 76.5 78.8 Punching Flexural 39.0 1.51 2 2.83 1.5 54.0 64.2 Punching Punching 35.2 0.60
3 3.03 1 53.9 72.3 Punching Punching 40.1 1.08
4 2.85 2 60.9 66.0 Punching Flexural 38.4 1.66
5 3.27 1.75 72.3 85.4 Punching Flexural 39.4 1.80

65
flexural and punching shear failures were similar for both failure types and of similar
form to the responses observed in Series 1 and 2. Representative load-strain responses
for Series 3 are illustrated in Figs. 5-16, 5-17, and 5-18 for the diagonals, orthogonal, and
loading face locations, respectively.
Load vs. Displacement
0
5
10
15
20
25
30
35
40
45
0 0.2 0.4 0.6 0.8 1 1.2 1.4
Displacement (in)
Load
(kip
s)
Wire Pot 1 - WestWire Pot 2 - East
Figure 5-14 – Typical Load vs. Displacement Curve for Series 3 – Slab #3 (Punching Shear Failure)
Load Displacement
0
5
10
15
20
25
30
35
40
45
0 0.5 1 1.5 2 2.5 3
Displacement (in)
Load
(kip
s)
Wire Pot 1 - WestWire Pot 2 - East
Figure 5-15– Typical Load vs. Displacement Curve for Series 3 – Slab #5 (Flexural Failure)

66
Load vs. Strain (Diagonals)
0
5
10
15
20
25
30
35
40
45
0 2000 4000 6000 8000 10000 12000 14000 16000
Strain (µε)
Load
(kip
s)
North West Strain Gage (top)South West Strain Gage (top)South East Strain Gage (top)North East Strain Gage (top)Limiting Strain
Figure 5-16 – Typical Load vs. Strain (Diagonal) for Series 3 – Slab #3 Load vs. Strain (Orthogonal)
0
5
10
15
20
25
30
35
40
0 1000 2000 3000 4000 5000 6000 7000 8000
Strain (µε)
Load
(kip
s)
North Strain Gage (top)West Strain Gage (top)South Strain Gage (top)Limiting Strain
Figure 5-17 – Typical Load vs. Strain (Orthogonal) for Series 3 - Slab #2
N
S
E W
N
S
E W

67
Load vs. Strain (Bottom)
0
5
10
15
20
25
30
35
40
45
-1200 -1000 -800 -600 -400 -200 0
Strain (µε)
Load
(kip
s)
West Strain Gage (bottom)North Strain Gage (bottom)
Figure 5-18 – Typical Load vs. Strain (Loading Face) for Series 3 - Slab #5
Similar to results from Series 1 and 2, the slabs tested in Series 3 experienced an increase
in failure load as the punch plate dimensions increased, but failed to accurately match the
predicted response (Table 5-6). For both failure modes, the predicted failure loads were
higher than the actual failure loads. Additionally, the predicted failure mechanism was
not always in agreement with the actual failure mechanism. The overestimation of the
flexural failure loads can again be attributed to the upper bound estimate from the yield
line analysis, but this does not aid in the interpretation of the inaccuracies in the punching
shear prediction. Similar to the results from Series 1 and 2 the prediction equation
consistently overestimates the punching shear capacity (~ 53% maximum). A
comparison of the results to the ACI 318-02 equation (Building Code Requirements 2002)
produces results that are more accurate (~ 14% maximum), but overestimates for one
case and underestimates for the other. Based on the results of Series 3, neither the
equation developed in the preliminary analysis nor the current ACI 318-02 equation
(Building Code Requirements 2002) provide a good prediction for the punching shear
capacity of UHPC, and additional analysis is required.
N
S
E W

68
Table 5-6 – Series 3 Comparison of Predicted vs. Actual
Test
#
Punch
Dimension
(in.)
Actual Failure
Load (kips)
Predicted
Failure Load
(kips)
%
Difference
ACI Equation
Failure Load
(kips)
%
Difference
1 2.5 39.0 78.8 * ** ** 2 1.5 35.2 54.0 53.4% 34.6 -1.8% 3 1 40.1 53.9 34.2% 34.5 -14.1% 4 2 38.4 66.0 * ** ** 5 1.75 39.4 85.4 * ** **
* Original prediction assumed to be punching shear, but failure was flexure (incorrect comparison)
** No ACI Equation for predicting flexural failure load
The results from all tests are included in Appendix B.
5.4 Comparison of Results to Other Models
In this section a series of models and equations will be presented and compared to the
results obtained during testing. Some of the equations presented will be from the work of
other researchers’ studies of punching shear, others will be models from derived from the
ACI 318-02 code (Building Code Requirements 2002), and the last will be equations
modeled to fit the results using curve fitting software. The models are first presented in
this section, then compared to results in section 5.4.5.
5.4.1 Narayanan and Darwish Equation
Narayanan and Darwish (1987) studied the effect of steel fiber reinforcement on the
punching shear capacity of micro-concrete slabs by testing 12 simply supported slabs to
failure. The parameters considered in the study were volume fraction of fibers, amount
of tensile reinforcement, and concrete strength. The results indicated that an increase in
fiber content improved the shear strength and modified the position of the critical
perimeter. The authors proposed that the design of concrete slabs for shear can be similar
to that for beams and suggested the following equation for the prediction of punching
shear

69
)"'( bspfsu BfA νρξν ++⋅= (MPa) Equation 5-1
where: ζs = empirical depth factor A’ = non dimensional constant = 0.24 fspf = split cylinder strength of fiber reinforced concrete (MPa) B” = dimensional constant = 16 ρ = area percent of tensile steel reinforcement (%) νb = vertical fiber pull-out stress along inclined crack (MPa)
The equation proposed by Narayanan and Darwish (1987) was further expanded by Tan
and Paramasivam (1994) as
DLdfsp
duP
ffubs
uu ρτρ
ζν 41.01624.0 ++=
⋅⋅= (MPa) Equation 5-2
where: ub = critical perimeter = )34()55.01( hrDLd ff ⋅⋅+⋅⋅⋅⋅⋅− πρ
h = slab thickness (mm)
r = width of loading platen (mm)
d = average effective depth to tension reinforcement (mm)
ζs = empirical depth factor = )002.06.1( h⋅−
fspf = split cylinder strength of fiber reinforced concrete (MPa)
ρ = area percent of tensile steel reinforcement (%)
τu = average fiber matrix interfacial bond stress = 4.15 MPa
ρf = volume fraction of steel fibers (%)
df = factor for fiber type = 0.5 (round), 0.75 (crimped), 1.0
(duoform-steel fibers)
L = length of fibers (mm)
D = diameter of fibers (mm)
In the form proposed by Tan and Paramasivam (1994), the contribution by the concrete
(term 1), the tensile reinforcement (term 2), and the steel fibers (term 3) can be
distinguished. In order to use this equation, the term that represents the tensile steel

70
contribution was excluded because no tensile reinforcement was used in the Ductal® slabs
tested. The final equation form is
DLdfsp
duP
ffubs
uu ρτ
ζν 41.024.0 +=
⋅⋅= (MPa) Equation 5-3
: .
5.4.2 Shaaban and Gesund Equation
Shaaban and Gesund (1994) studied the effects of steel fibers on the punching shear
strength of reinforced concrete slabs (flat plates), specifically whether the addition of
steel fibers significantly enhanced the punching shear capacity. Thirteen slabs with
varying fiber contents were tested to failure and produced results that demonstrated the
enhancement in punching shear capacity achieved with the addition of fibers. The
authors proposed an equation of the same form as the ACI 318-02 code (Building Code
Requirements 2002) equation for punching shear, but modified it to account for the fiber
contribution. The equation proposed is
( ) dbf
WV oc
fc ⋅⋅
⋅+⋅=
1000'
8.63.0 (kips) Equation 5-4
where: Wf = percent of fibers by weight of concrete (%)
f’c = concrete compressive strength (psi) bo = critical perimeter as defined by ACI (in.) d = average effective depth to tension reinforcement (in.)
The advantage of this equation is that it maintains the general form of the ACI 318-02
code equations for punching shear (Building Code Requirements 2002), but for the
testing performed in this research effort there was no variation in the percent of fibers by
weight of concrete (Wf) because a standard 2% by volume was used in all slabs.
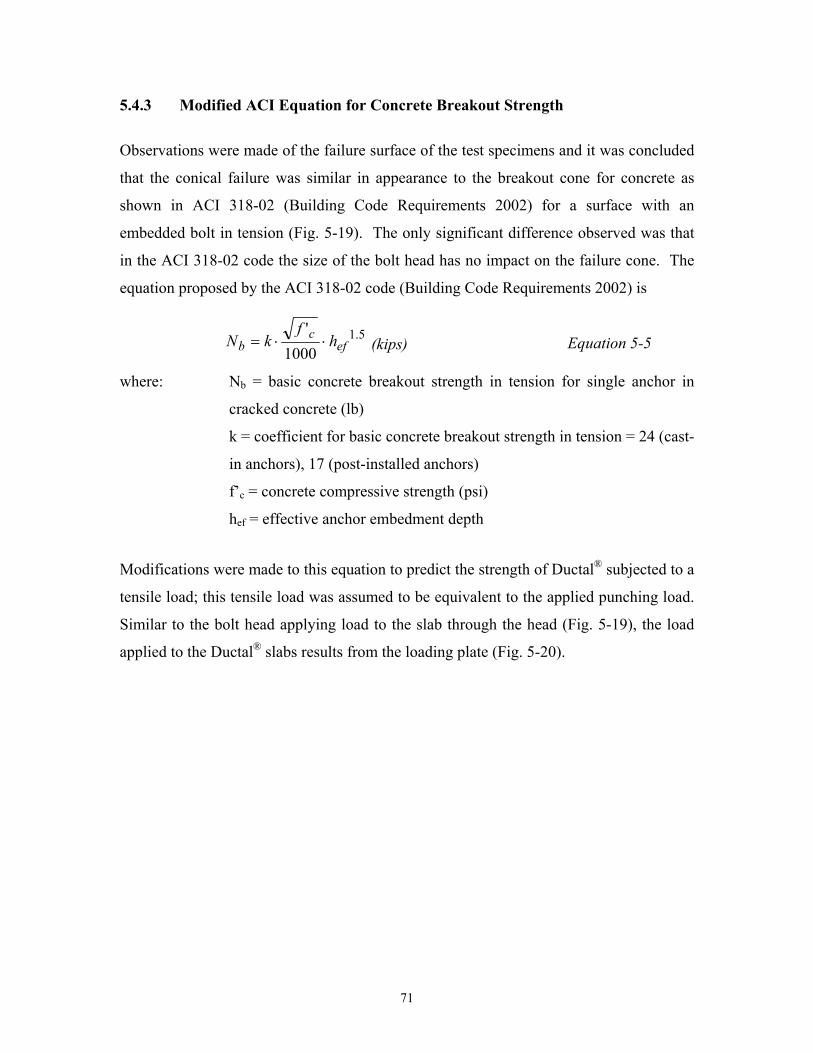
71
5.4.3 Modified ACI Equation for Concrete Breakout Strength
Observations were made of the failure surface of the test specimens and it was concluded
that the conical failure was similar in appearance to the breakout cone for concrete as
shown in ACI 318-02 (Building Code Requirements 2002) for a surface with an
embedded bolt in tension (Fig. 5-19). The only significant difference observed was that
in the ACI 318-02 code the size of the bolt head has no impact on the failure cone. The
equation proposed by the ACI 318-02 code (Building Code Requirements 2002) is
5.11000
'ef
cb h
fkN ⋅⋅= (kips) Equation 5-5
where: Nb = basic concrete breakout strength in tension for single anchor in
cracked concrete (lb)
k = coefficient for basic concrete breakout strength in tension = 24 (cast-
in anchors), 17 (post-installed anchors)
f’c = concrete compressive strength (psi)
hef = effective anchor embedment depth
Modifications were made to this equation to predict the strength of Ductal® subjected to a
tensile load; this tensile load was assumed to be equivalent to the applied punching load.
Similar to the bolt head applying load to the slab through the head (Fig. 5-19), the load
applied to the Ductal® slabs results from the loading plate (Fig. 5-20).

72
Figure 5-19 – Concrete Breakout Failure Surface
Figure 5-20 – Ductal® Breakout (Punching Shear) Failure Surface
For concrete breakout strength, the ACI 318-02 code refers to the work of Fuchs et al.
(1995) which states that the concrete conical failure depends on the tensile capacity of the
concrete, considered to be proportional cf ' . With the increased tensile capacity
achieved with Ductal®, it would be expected that an increase in the concrete breakout
~ 35 deg
1.5 hef 1.5 hef
hef
~ 20 deg
hslab
1.5 hslab c 1.5 hslab

73
strength could be achieved. The proposed equation based on the work by Fuchs et al.
(1995) is
hcchfkNV tbc
22
1)3( −+⋅
⋅⋅== (kips) Equation 5-6
where: =tf split cylinder tensile strength (ksi)
k1 = empirical constant derived using NLREG software = 0.38
h = slab thickness (in.)
c = loading plate dimension (in.)
The proposed equation reduces to the original ACI equation as c approaches zero, and the
modified equation is in terms of h2 as opposed to h1.5 proposed in the ACI equation. The
significant difference between the original ACI equation for concrete breakout strength
and the modified equation is the consideration of the bolt head and loading plate area.
The ACI equation does not consider the area of the bolt head in the conical failure surface,
while the plate area is included and then removed in the modified equation; the difference
is best illustrated in Figs. 5-19 and 5-20.
5.4.4 ACI Curve – Fit Equations
The use of empirical equations, historically, has served as the foundation for the ACI
prediction of punching shear capacity; the equations were developed based on the test
data with little emphasis placed on a model to characterize the true failure mechanism
(ASCE-ACI Task Committee 1974). The use of these empirically developed equations
has continued over the years with only minor changes, but the general form is still
maintained. This illustrates that the use of empirical equations is not uncommon, but the
trend in recent years has been to develop empirical equations that maintain the same
general form of the ACI 318-02 design equations (Building Code Requirements 2002);
this was the method used in the preliminary analysis.

74
Using a nonlinear regression and curve fitting software package (NLREG), numerous
iterations were performed to fit an equation similar in form to the ACI design equations
for punching shear to the test data for the UHPC slabs. The general form of the equation
developed is
haMhacKVc ⋅⋅⋅+⋅+⋅= 4)( (kips) Equation 5-7 where: K = empirical constant representative of material tensile capacity =
0.25
c = loading plate dimension (in.)
a = empirical factor relating slab thickness to equivalent effective
depth = 5.29
h = slab thickness (in.)
M = empirical constant (assumed to represent the fiber contribution to
the critical perimeter) = 7.81 (in.)
The appearance of the equation can be modified to a more familiar format by replacing
the empirical constant representing the tensile capacity with cfk ' , where k is an
empirical constant relating tensile strength to compressive strength:
equivoc
c dbf
kV ⋅⋅⋅=1000
'2 (kips) Equation 5-8
where: k2= empirical constant relating tensile strength to compressive strength
= 0.14
f’c = concrete compressive strength (psi)
bo = critical perimeter = )(4 Mhac +⋅+⋅
c = loading plate dimension (in.)
h = slab thickness (in.)
dequiv = equivalent effective depth = ha ⋅ (in.)
a = empirical factor relating slab thickness to equivalent effective
depth = 5.29

75
M = empirical constant (assumed to represent the fiber contribution to
the critical perimeter) = 7.81 (in.)
Replacing the representative tensile capacity with the actual tensile capacity determined
from split cylinder testing, the equation can be expressed in the following form:
equivotc dbfkV ⋅⋅⋅= 3 (kips) Equation 5-9 where: k3 = empirical constant relating tensile strength to compressive
strength = 0.02
ft = split cylinder tensile strength (ksi)
bo = critical perimeter = )(4 Mhac +⋅+⋅ (in.)
h = slab thickness (in.)
dequiv = equivalent effective depth = ha ⋅ (in.)
a = empirical factor relative slab thickness to equivalent effective
depth = 5.29
M = empirical constant (assumed to represent the fiber contribution to
the critical perimeter) = 7.81 (in.)
These empirical equations were derived with the ACI design equations for punching
shear capacity as the foundation, but were modified to provide a reasonable fit to the test
results. These modifications left some uncertainty in the interpretation of the model; the
empirical factor M cannot be physically defined in the term for the critical perimeter. It
has been assumed that this empirical factor, M, represents the contribution of the fibers to
an increase in the critical perimeter, but based on the limited test data this cannot be
verified.

76
5.4.5 Comparison of Results to Model Equations
In general the various models previously discussed performed well when compared to the
results of the tests. None of the established models was capable of fitting the data with
good precision, but most provided a reasonable representation of the response.
5.4.5.1 Preliminary Analysis
The equation derived during the preliminary analysis overestimated the punching shear
capacity of the test slabs. As illustrated in Fig. 5-21, the predictions are consistently
unconservative with all of the predicted failure loads exceeding the measured capacities.
The results from this equation could be factored down to better match the measured data,
but this would be interpreted as the tensile capacity not being fully utilized. Additionally,
the predicted capacity was calculated based on the tensile capacity (ft + km = 0.1 + 1.0 ksi)
proposed by Park et al. (2003) which was lower than the tensile capacity measured from
the split cylinder tests conducted by Graybeal (2004) which ranged from 1.5 – 1.7 ksi.
Using the actual tensile capacity would make the prediction more unconservative. The
lack of full tensile capacity could be attributed to the fiber orientation that did not appear
to be random as predicted. Random orientation was not likely achieved due to the
thinness of the slab which did not allow for orientation of the fibers perpendicular to the
formed surface. This differs significantly for the tensile test specimens where the fibers
are randomly oriented.

77
Actual vs. Predicted Punching Shear Strength (Preliminary Analysis)
0
10
20
30
40
50
60
0 10 20 30 40 50 60
Predicted Strength (kips)
Mea
sure
d S
tren
gth
(kip
s)
2 in.2.5 in.3.0 in.agreement
Figure 5-21 – Preliminary Analysis Prediction for Punching Shear Capacity vs. Actual
5.4.5.2 ACI Punching Shear Design Equation
The ACI 318-02 punching shear equation (Building Code Requirements 2002) provided a
more reasonable prediction of the punching shear capacity than the preliminary analysis
equation as illustrated in Fig. 5-22. The only observed flaw with this method is that it
considers the effective depth of the tensile reinforcement which was replaced with the
slab thickness because no tensile reinforcement was used in the test slabs. The ACI
equation assumes a constant relationship between the tensile strength (ft) and
compressive strength (f’c), which appears to be reasonable so long as the fiber volume
does not change. The term cf '4 ⋅ is roughly half of the tensile capacity ( ct ff '5.7 ⋅= )
suggested for design by ACI, which is about what was observed in the punching shear
failures.

78
Actual vs. Predicted Punching Shear Strength (ACI Design Equation)
0
10
20
30
40
50
60
0 10 20 30 40 50 60
Predicted Strength (kips)
Mea
sure
d S
tren
gth
(kip
s)
2 in.2.5 in.3.0 in.agreement
Figure 5-22 – ACI 318-02 Prediction for Punching Shear Capacity vs. Actual
5.4.5.3 Narayanan and Darwish Equation
The equation proposed by Narayanan and Darwish (1987) provided an excellent
prediction for some of the test slabs, specifically the 2.0 in. slabs, but was unconservative
for the other thicknesses. The comparison is illustrated in Fig. 5-23.
5.4.5.4 Shaaban and Gesund Equation
The equation proposed by Shaaban and Gesund (1994) provided similar results to the
ACI equation, as expected, because this is the equation from which the form was derived
(Fig. 5-24). The difficulty that arises from using this equation is that the basis for its
derivation is that the fiber content is a factor in the punching shear capacity prediction
and for this experiment the fiber content was not varied.

79
Actual vs. Predicted Punching Shear Strength (Narayanan/Darwish Equation)
0
10
20
30
40
50
60
0 10 20 30 40 50 60
Predicted Strength (kips)
Mea
sure
d S
tren
gth
(kip
s)
2 in.2.5 in.3.0 in.agreement
Figure 5-23– Narayanan & Darwish Prediction for Punching Shear Capacity vs. Actual
Actual vs. Predicted Punching Shear Strength (Shaaban and Gesund Equation)
0
10
20
30
40
50
60
0 10 20 30 40 50 60
Predicted Strength (kips)
Mea
sure
d S
tren
gth
(kip
s)
2 in.2.5 in.3.0 in.agreement
Figure 5-24– Shaaban & Gesund Prediction for Punching Shear Capacity vs. Actual

80
5.4.5.5 ACI Concrete Breakout Equation
The equation for concrete breakout strength from the current ACI 318-02 Code (Building
Code Requirements 2002) is not considered to be an equation for the punching shear
capacity of concrete, but results in a similar failure mechanism. As illustrated in Fig. 5-
25, this equation provides a good prediction of the punching shear capacity, but this is as
a result of the empirical constant being derived from curve-fitting using NLREG. A
similar trend could be observed in the original ACI prediction equation if a curve fit were
used to improve the fit of the curve to the data (i.e., modifications made to the constant
relating compressive strength to tensile strength).
Actual vs. Predicted Punching Shear Strength (Modified ACI Concrete Breakout)
0
10
20
30
40
50
60
0 10 20 30 40 50 60
Predicted Strength (kips)
Mea
sure
d S
treng
th (k
ips)
2 in.2.5 in.3.0 in.agreement
Figure 5-25 – Modified ACI Prediction for Concrete Breakout (Punching) Capacity vs. Actual
5.4.5.6 ACI Curve-Fit Equation
As would be expected with any curve fit equation, the predictions match the actual results
very well. The curve fit was based on the general form of the ACI 318-02 punching
shear equation (Building Code Requirements 2002) with terms for the tensile capacity,
critical perimeter, and effective depth adjusted to provide the best fit to the data set. The
difficulty that arises from using this equation is the limited number of data points to
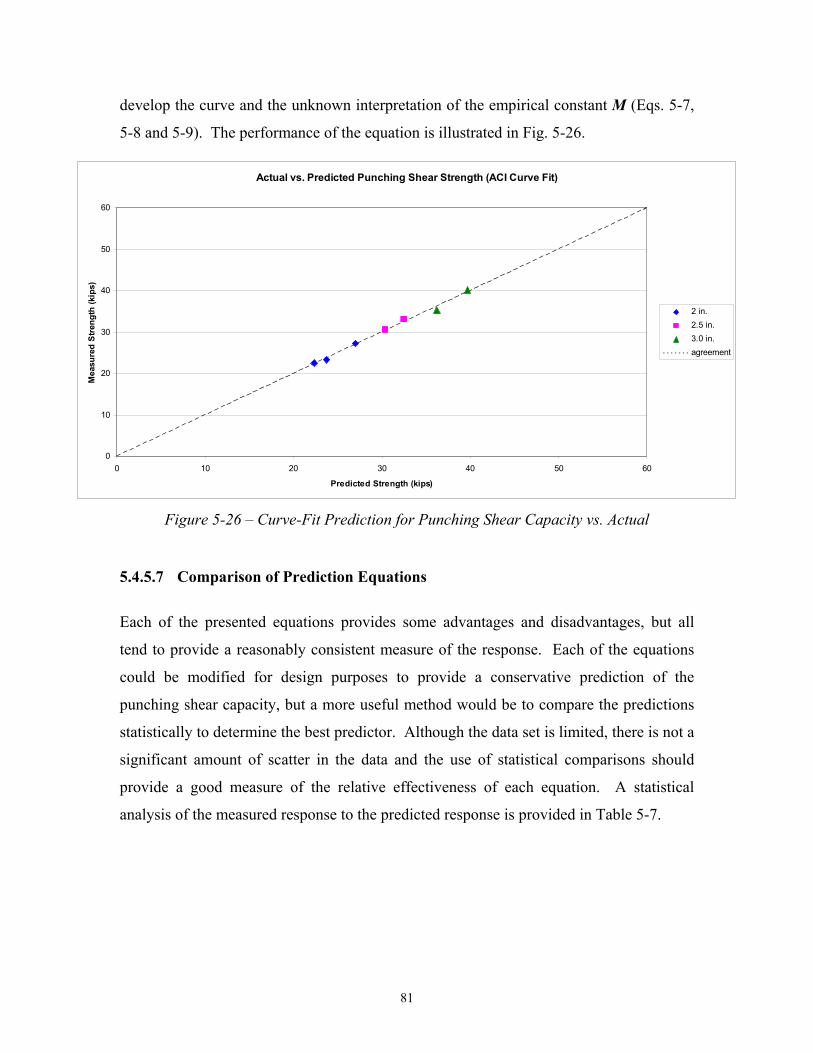
81
develop the curve and the unknown interpretation of the empirical constant M (Eqs. 5-7,
5-8 and 5-9). The performance of the equation is illustrated in Fig. 5-26.
Actual vs. Predicted Punching Shear Strength (ACI Curve Fit)
0
10
20
30
40
50
60
0 10 20 30 40 50 60
Predicted Strength (kips)
Mea
sure
d S
tren
gth
(kip
s)
2 in.2.5 in.3.0 in.agreement
Figure 5-26 – Curve-Fit Prediction for Punching Shear Capacity vs. Actual
5.4.5.7 Comparison of Prediction Equations
Each of the presented equations provides some advantages and disadvantages, but all
tend to provide a reasonably consistent measure of the response. Each of the equations
could be modified for design purposes to provide a conservative prediction of the
punching shear capacity, but a more useful method would be to compare the predictions
statistically to determine the best predictor. Although the data set is limited, there is not a
significant amount of scatter in the data and the use of statistical comparisons should
provide a good measure of the relative effectiveness of each equation. A statistical
analysis of the measured response to the predicted response is provided in Table 5-7.

82
Table 5-7 – Statistical Results
Prediction Equation
Preliminary Analysis ACI Narayanan/
Darwish Shaaban/Gesund
Modified Concrete Breakout
Curve Fit
Slab Thickness
Punch Size Actual Vact/Vcal Vact/Vcal Vact/Vcal Vact/Vcal Vact/Vcal Vact/Vcal
in. in. kips 2.12 1 22.6 0.78 1.21 1.11 0.71 1.03 1.01 2.17 1.5 23.3 0.66 1.04 1.21 0.61 0.92 0.98 2.32 2 27.2 0.62 0.96 1.24 0.57 0.90 1.01 2.54 1.5 30.5 0.68 1.06 1.21 0.62 1.00 1.00 2.61 2 33.0 0.62 0.97 1.25 0.57 0.95 1.01 3.03 1 40.1 0.75 1.16 1.18 0.68 1.15 1.01 2.83 1.5 35.2 0.65 1.02 1.26 0.60 1.01 0.97
Mean 0.68 1.06 1.21 0.62 0.99 1.00 Standard Deviation 0.06 0.09 0.05 0.06 0.08 0.02 Standard Error 0.02 0.04 0.02 0.02 0.03 0.01 Confidence Level (95.0%) 0.06 0.09 0.05 0.05 0.08 0.02 Coefficient of Variation 8.9% 8.9% 4.5% 8.9% 8.3% 1.7%
Definitions of statistical terms
Term Symbol Definition Equation
Mean (x) x Average of the results nx∑
Standard Deviation (s) σ The root mean square of the set of deviations between each point of the set and the mean of the set )1(
2
−∑n
d
Standard error (of the
mean) nσ Measure of how far a variable is likely to be from the
expected value nσ
Confidence Level - An interval constructed from data in such a way that the probability that the interval contains the true value is 95%
From student t-
table
Coefficient of Variation CV A statistical representation of the precision of the tests xσ

83
All of the models considered provided reasonable estimates for the prediction of
punching shear capacity of UHPC. The results illustrate that the range of the mean of the
measured load to the predicted load ranges from 0.62 – 1.21 while the coefficient of
variation only ranges from 1.7 – 8.9%, excellent agreement for a cementitious material.
This agreement is likely achieved due to the uniformity of UHPC resulting from the
controlled batching environment and the lack of coarse aggregate which could reduce the
uniformity. The results of the analysis indicate that the best model for predicting the
punching shear capacity is the Curve Fit Equation as should be expected, but as
previously stated there is some uncertainty in the defined critical perimeter and this
equation will not be recommended for design. The next model considered was the
Modified Concrete Breakout Equation due to its low mean and coefficient of variation.
The mean of the ratio of measured to the predicted strength (Vact/Vcal) is not the lowest (a
low ratio close to 1.0 would indicate good agreement), but it is in line with the other
models, and the coefficient of variation is significantly lower than that in the remaining
models. A low mean indicates that the model overall reasonably predicts the punching
shear strength of UHPC slabs, and the coefficient of variation indicates that there is little
fluctuation in the ratio of the measured to the actual strength when compared to the mean.
For these reasons, the Modified Concrete Breakout Equation will be considered the best
model for the prediction of the punching shear capacity of UHPC slabs. The current ACI
318-02 Code equation (Building Code Requirements 2002) could also have been used,
but the mean was similar and the coefficient of variation was higher, indicating more
scatter around the mean.
5.5 Proposed Slab Thickness
The results of the optimized section modeling performed by Park et al. (2003) suggested
that the minimum slab thickness to be used in bridge applications is 4.0 in. This
prediction was based on the no cracking SLS criterion proposed by the French
Association of Civil Engineering (AFGC) which did not allow for any cracking to occur.
Based on the results of the testing conducted, this criterion is unrealistic because the load
that caused cracking was significantly lower than the final failure load. The load to cause
first cracking ranged from ~ 5 – 15 kips (presented in Appendix B) depending on the

84
specimen thickness and the loading plate area, but these cracking loads were significantly
lower than the peak loads that ranged from 22.6 – 40.1 kips. This illustrates that the SLS
criterion may be excessively conservative for UHPC slab systems. Based on the results
obtained from the testing, a very small loading plate is required in order to produce a
punching shear failure, even on the 2.0 in. slab specimens, but in the absence of flexural
failures in Series 1 it is recommended that the slab thickness be limited to 2.5 in. For a
2.5 in. slab system, a plate size of 2.0 in. x 2.0 in. was required to cause a punching shear
failure, which occurred at a peak load of 30.1 kips. This failure load is greater than the
load that would be experienced with the AASHTO HL-93 truck (16 kips per tire) or the
Tandem truck (12.5 kips per tire) over a much smaller loading area, 2 in. x 2 in. vs. 8 in.
x 20 in. (Cousins 2003). Modification of the proposed concrete breakout equation to
account for variations in the loading plate aspect ratio results in the following equation
hbabhah
fkV tc⋅−+⋅⋅+⋅
⋅⋅=)3()3(
1
where a and b are the dimensions of the loading plate
Using this modified equation with the standard 8 in. x 20 in. loading area results in
punching shear capacities of 88, 102, and 117 kips for 2.0, 2.5 and 3.0 in. thick slabs,
respectively. These capacities far exceed the anticipated loads from the standard
AASHTO trucks even with the addition of impact factors and factors of safety.
5.6 Flexural Failures While the purpose of this research was to develop a prediction measure of the punching
shear capacity of UHPC, a number of flexural failures occurred during the testing that
cannot be ignored. The sole method used to predict the flexural capacity of UHPC was
yield line analysis, which serves as an upper bound analysis technique. The results of the
Ductal® flexural failures did not exhibit good agreement with the predictions from yield
line analysis as illustrated in Fig. 5-27. Yield line analysis overestimated the flexural

85
capacity of Ductal® slabs in all tests and all cases by a significant amount (~ 117%
maximum) as shown in Table 5-8. The disagreement with the prediction model can
likely be attributed to two main factors; the difference in flexural capacity between
orthogonal directions from fibers not being randomly oriented, and the material not being
ideal for use of yield line analysis based on moment-curvature relationships observed.
Further analysis of the flexural capacity is required to gain a better understanding of the
behavior, but that is beyond the scope of this research effort.
Actual vs. Predicted Flexural Strength (Yield Line Analysis)
0
10
20
30
40
50
60
70
80
90
0 10 20 30 40 50 60 70 80 90
Predicted Strength (kips)
Mea
sure
d S
tren
gth
(kip
s)
2.5 in.3.0 in.agreement
Figure 5-27 – Yield Line Analysis Prediction for Flexural Capacity vs. Actual
Table 5-8 – Summary of Flexural Failure Results
Slab Thickness
(in)
Punch
Dimension
(in.)
Actual
Failure Load
(kips)
Predicted
Failure Load
(kips)
%
Difference
2.58 3 35.9 55.9 55.6% 2.76 2.5 34.2 63.1 84.5% 3.10 2.5 39.0 78.8 102.1% 2.85 2 38.4 66.0 71.8% 3.27 1.75 39.4 85.4 116.7%

86
5.7 Summary of Results
The results obtained from the experimental testing illustrate some of the advantages of
using UHPC as a replacement for other construction materials, such as increased strength,
the ability to undergo significant deflections, the small punch size required to cause a
flexural failure, and the ability to support a reduced load beyond the peak load in flexural
failures and in some punching shear failures. These results were not in good agreement
with the prediction models proposed in the preliminary analysis, but appear to achieve
good agreement with other models, particularly the Modified Concrete Breakout
Equation derived from the ACI 318-02 Code (Building Code Requirements 2002)
equation for concrete breakout resulting from a bolt anchored in concrete. The limited
number of data points makes the statistical analysis questionable, but the minimal
variance leads to the assumption that the model is sufficiently accurate for design
purposes. It should also be noted that the results do not take into consideration the effects
of axial loads on the slab systems, which would be the case for a prestressed system as
proposed by Park et al. (2003). The addition of prestressing in the slab system could
result in an increase in the applied tensile load and produce a tensile failure prior to
service loads being applied, but could significantly improve the punching shear capacity
when service loads are applied. Further analysis would be required to verify the effects
of prestressing, but it is beyond the scope of this research project.

87
Chapter 6 - Summary, Conclusions, Recommendations
6.1 Summary
UHPC is considered to be a new material for use in structural applications, and as a result
very little research has been performed. The properties of UHPC make the material ideal
for uses in applications that require high strength, ductility, and corrosion resistance, but
the current cost limits the potential for use in many structural applications. With the
significantly improved properties of UHPC, compared to reinforced concrete and in some
cases steel, the ability to make smaller and thinner sections at lower cost is the most
viable option for making the material more competitive.
From the work of Park et al. (2003) an optimized section was developed that minimized
the material usage and resulted in a thin section for use as a bridge girder. The optimized
section utilized a thin top flange which would serve as the riding surface for vehicular
traffic, but utilized no shear reinforcement. Additionally, the optimized section,
specifically the top flange section developed by Park et al. (2003), was not verified with
experimental data and relied primarily on Finite Element Analysis to characterize the
local effects. Due to the poor historical performance of cementitious materials in tension,
the lack of tensile reinforcement in the slab/riding surface and unverified slab response
served as the foundation for this research effort.
The objectives of the research effort were primarily to characterize the punching shear
capacity of UHPC slabs and to determine the minimum slab thickness that could be used
to prevent a punching shear failure. The lack of tensile reinforcement in the top flange of
the optimized section allowed for the potential of a punching shear failure occurring from
a tire patch load. Additionally, due to the high cost of the material, an attempt was made
to minimize material usage in the testing. From these objectives, a preliminary analysis
was performed to attempt to predict the failure response and mechanisms for UHPC slabs
88
utilizing yield line analysis for the flexural response and the ACI 318-02 design equations
for punching shear modified to account for the tensile capacity of UHPC. With the
objective of the research effort being the characterization of UHPC, the philosophy was
to determine the boundary between flexural and punching shear failures. From this
preliminary analysis, specimens were sized sufficiently small to minimize material usage,
but large enough that a punching shear failure could be forced provided a sufficiently
small loading plate was used. Based on the yield line analysis, this required the use of
fully restrained supports in order to maximize the load to cause a flexural failure to allow
for an increased likelihood that a punching shear failure would occur.
From the preliminary analysis, a total of twelve specimens were cast with thicknesses of
2.0 in., 2.5 in., and 3.0 in. with four slabs per thickness. The only other variable
considered in the testing was the area of the square loading plate. One of the 2.0 in.
specimens cast was poured in excess of the desired thickness and was tested as a 3.0 in.
thick slab. All of the specimens were loaded to failure and measurements of the load,
displacement, and strain were recorded for interpretation. The loaded specimens failed in
either a flexural or punching shear failure, depending on the loading plate area and slab
thickness. The failure loads were then compared to the predicted capacity of the
preliminary analysis and it was determined that the prediction significantly overestimated
the capacity. As a result, this prediction equation was deemed inadequate for predicting
the failure load, and other models were evaluated for agreement. Due to the limited
research conducted on UHPC, models that produced a similar failure mechanism were
also considered. Based on the agreement with test data, a model was chosen to represent
the best method for prediction of punching shear capacity of UHPC slabs.

89
6.2 Conclusions
The following conclusions are made based on the test results and analysis:
• The tensile capacity inherent to UHPC can significantly improve the punching
shear capacity for a slab.
• A sufficiently small loading area is required to force a punching shear failure in a
UHPC slab system. Based on this assessment, a 2.5 in. slab thickness should
provide sufficient punching shear capacity for bridge applications. The actual
slab thickness selected for design should also consider factors such as web
spacing, flexural capacity, and deflection criteria.
• The modified ACI equation for concrete breakout strength provides the best
measure of the punching shear capacity of UHPC slabs:
hcchfkNV tbc
22
1)3( −+⋅
⋅⋅==
with variables defined in section 5.4.3.
• The limiting strain criterion proposed in the MIT Report (Park et al. 2003) should
be followed due to the lack of consistent data from the testing. The measured
strains were highly dependent on the location of crack formation.
• Fibers tend to align in the direction of the flow of the material and also with the
formwork; this may result in different flexural capacities in different directions.
• UHPC is more suited for precast operations due to the controlled environment and
special formwork required.
• The brittle punching shear failure mechanism exhibits limited warning prior to
failure, but is still significantly less abrupt than for a reinforced concrete punching
shear failure.
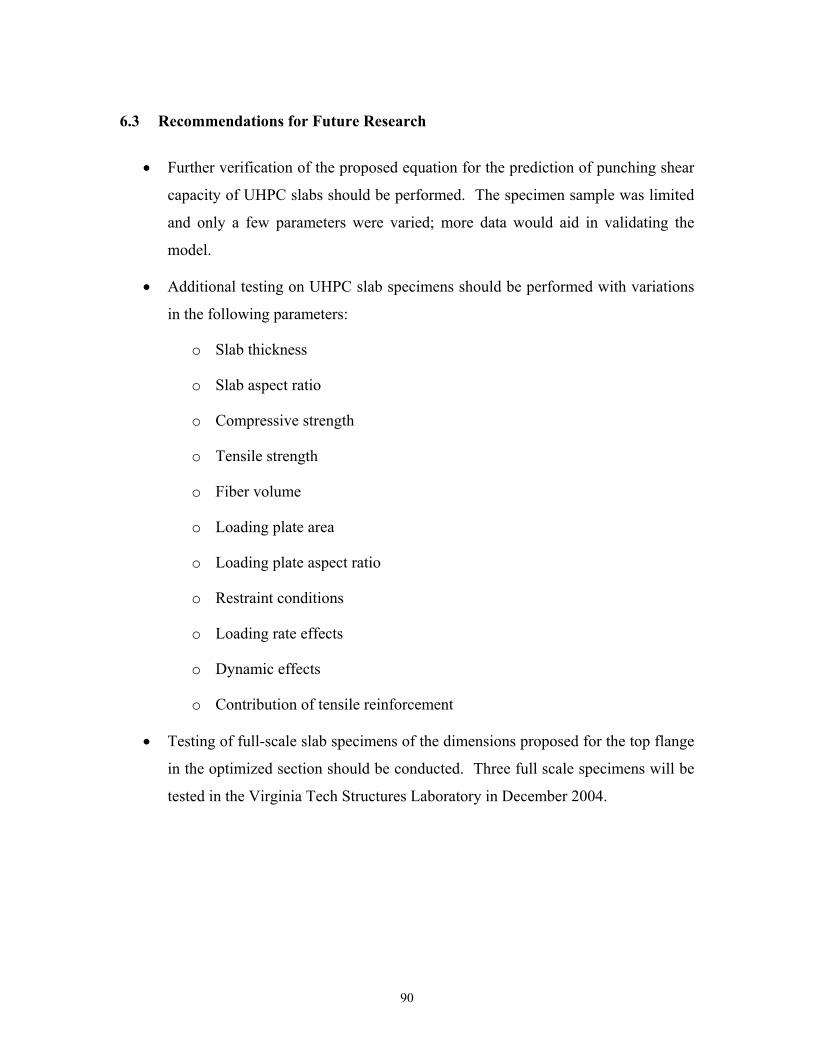
90
6.3 Recommendations for Future Research
• Further verification of the proposed equation for the prediction of punching shear
capacity of UHPC slabs should be performed. The specimen sample was limited
and only a few parameters were varied; more data would aid in validating the
model.
• Additional testing on UHPC slab specimens should be performed with variations
in the following parameters:
o Slab thickness
o Slab aspect ratio
o Compressive strength
o Tensile strength
o Fiber volume
o Loading plate area
o Loading plate aspect ratio
o Restraint conditions
o Loading rate effects
o Dynamic effects
o Contribution of tensile reinforcement
• Testing of full-scale slab specimens of the dimensions proposed for the top flange
in the optimized section should be conducted. Three full scale specimens will be
tested in the Virginia Tech Structures Laboratory in December 2004.

91
References
AFGC Scientific and Technical Documents (2002) – Ultra High Performance Fibre-Reinforced
Concretes – Interim Recommendations (Documents scientifiques et techniques – BJtons fibrJs B
ultra-hautes performances – Recommandations provisoires), French Association of Civil
Engineering (Association FranHaise de GJnie Civil).
ASCE-ACI Task Committee 426 (1973). “The Shear Strength of Reinforced Concrete Members”,
ASCE – Journal of the Structural Division, 99 (6), 1091-1187.
ASCE-ACI Task Committee 426 (1974). “The Shear Strength of Reinforced Concrete Members-
Slabs”, ASCE – Journal of the Structural Division, 100 (8), 1543-1591.
Building Code Requirements for Structural Concrete, ACI 318-02, and Commentary, ACI 318R-
02 (2002), American Concrete Institute, Farmington Hills, MI.
Cousins, T.E. (2003), “Load”, CEE 5484 – Advanced Bridge Design Course Presentation,
Virginia Polytechnic Institute and State University.
Fuchs, W., Eligenhausen, R., Breen, J.E. (1995). “Concrete Capacity Design (CCD) Approach for
Fastening to Concrete”, ACI Structural Journal, 92 (1), 73-94.
Graybeal, B.A., Hartmann, J.L. (2003). “Strength and Durability of Ultra-High Performance
Concrete”, 2003 PCI National Bridge Conference.
Graybeal, B.A. (2004), e-mail communication, August, 2004.
Keenan, W.A. (1969). “Strength and Behavior of Restrained Reinforced Concrete Slabs Under
Static and Dynamic Loadings”, Technical Report R 621 – Naval Civil Engineering Laboratory,
Port Huenueme, CA.
Latin Tech Inc., accessed October 10 (2004). “Position Transducers”, Latin Tech Inc., Miami, FL.
Internet Address: http://www.lt-automation.com/PositionTransducers.htm

92
Lafarge North America Inc., accessed September 7 (2004). “Ductal’s Durability Properties”,
Lafarge North America Inc., Herndon, VA. Internet Address:
http://www.imagineductal.com/imagineductal/home.asp
Narayanan, R., Darwish, I.Y.S. (1987). “Punching Shear Tests on Steel Fibre Reinforced Micro-
concrete Slabs”, Magazine of Concrete Research, 39 (138), 42-50.
Park, H., Ulm, F-J., Chuang, E. (2003). “Model-Based Optimization of Ultra High Performance
Concrete Highway Bridge Girders”, CEE Report R03-01 – Massachusetts Institute of Technology.
Park, R., Gamble, W.L. (2000). Reinforced Concrete Slabs – Second Edition, John Wiley & Sons,
Inc., NY, 551-620.
Perry, V.H. (2003). “A Revolutionary New Material for New Solutions”, Technical Forum
Presentation, Lafarge North America.
Perry, V.H., Zakariasen, D. (2003). “Overview of UHPC Technology, Materials, Properties,
Markets and Manufacturing”, 2003 Concrete Bridge Conference, Orlando, FL.
Semioli, W.J. (2001). “The New Concrete Technology”, Concrete International, 23 (11), 75-79.
Shaaban, A.M., Gesund, H. (1994). “Punching Shear Strength of Steel Fiber Reinforced Concrete
Flat Plates”, ACI Structural Journal, 91 (3), 406-414.
Tan, K.-W., Paramasivam, P. (1994). “Punching Shear Strength of Steel Fiber Reinforced
Concrete Slabs”, Journal of Civil Engineering Materials, 6 (2), 240-253.
TFRC – Turner Fairbanks Highway Research Center, accessed November 11 (2004). “High
Performance Concrete Bridge Project Fact Sheets – Virginia Avenue Over the Clinch River,
Richlands”, McLean, VA. Internet Address: http://www.tfhrc.gov/structur/hpc/flyers.htm
Ulm, F-J., Chuang, E. (2003). “UHPC Design Issues”, Technical Forum Presentation,
Massachusetts Institute of Technology, Cambridge, MA.

93
Yankelevsky, D.Z., Leibowitz, O. (1999). “Punching Shear in Concrete Slabs”, International
Journal of Mechanical Sciences, 41 (1), 1-15.

94
APPENDIX A
Edge Condition: Four Edges Pinned
Figure A-1 - Case A Figure A-2 - Case B
l
w a
b
l
w
y
y
a b

95
Figure A-3 - Case C
b
a
l
xxw

96
Edge Condition: Three Edges Pinned / One Edge Fixed
Figure A-4 - Case D
Figure A-5 - Case E
a
b
l
w
a
bw
l
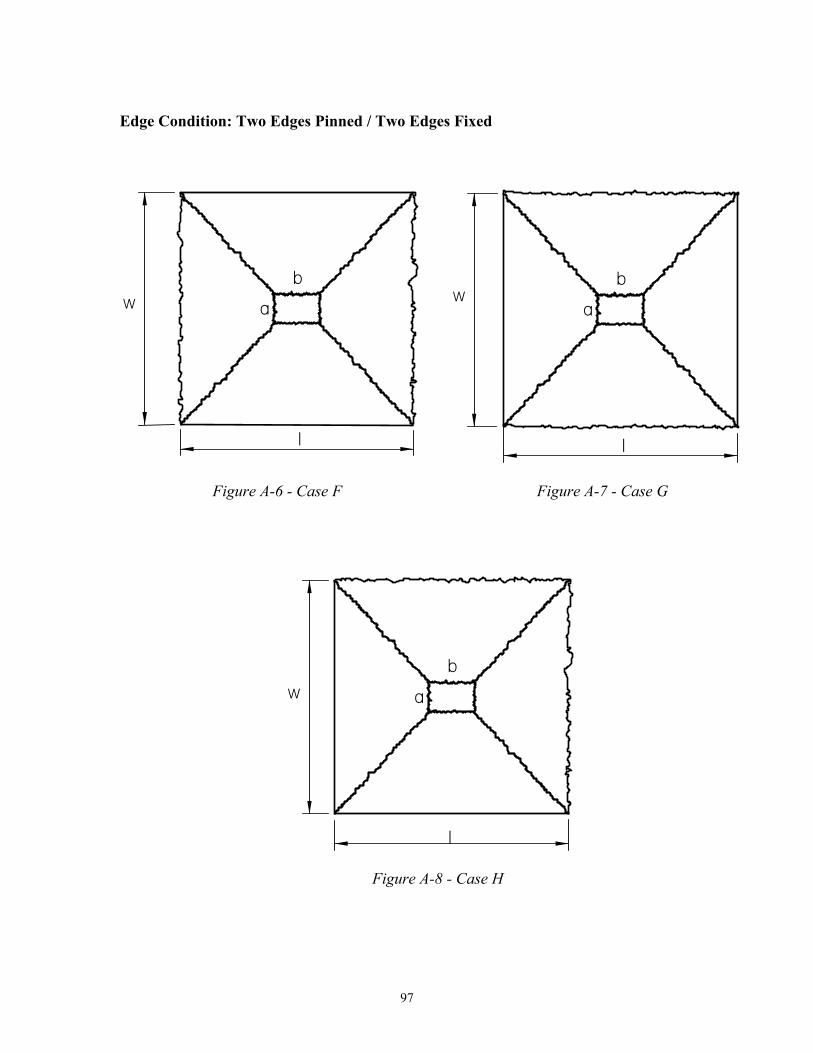
97
Edge Condition: Two Edges Pinned / Two Edges Fixed
Figure A-6 - Case F Figure A-7 - Case G
Figure A-8 - Case H
a
b
w
l
a
b
l
w
a
b
l
w

98
Edge Condition: One Edge Pinned / Three Edges Fixed
Figure A-9 - Case I
Figure A-10 - Case J
a
b
l
w
a
b
l
w

99
Edge Condition: Four Edges Fixed
Figure A-11 - Case K
Edge Condition: Radial Pattern
Figure A-12 - Case L
a
b
l
w
l
w

100
APPENDIX B
Summary of Results
Table B-1 -Summary of Results
Slab Thickness
Square Punch Size
Observed 1st Cracking Deflection
Observed 1st Cracking
Load
Actual Failure Load Mechanism of Failure
in. in. in. kips kips 2.17 1.5 .06 6.7 23.3 Punching Failure
2.32 2 .05 6.1 27.2 Punching Failure
2.12 1 no data 8.0 22.6 Punching Failure
2.61 2 .06 7.9 33.0 Punching Failure
2.58 3 .08 9.9* 35.9 Flexural Failure
2.54 1.5 .05 8.0 30.5 Punching Failure
2.76 2.5 .06 9.1 34.2 Flexural Failure
3.10 2.5 .05 14.9 39.0 Flexural Failure
2.83 1.5 .11 19.8 35.2 Punching Failure
3.03 1 .05 14.9 40.1 Punching Failure
2.85 2 .12 15.1 38.4 Flexural Failure
3.27 1.75 .06 13.4 39.4 Flexural Failure
* Slab was accidentally loaded prior to starting test, resulting in an initial crack (no measurements). Load indicated is when the first crack was observed after testing began.
Table B-2 – Summary of Material Properties (Graybeal communication)
Compressive Strength – No Modulus Test (ksi) 32.1 Compressive Strength – Modulus Test (ksi)* 31.6 Tensile Strength (ksi) 1.6 Elastic Modulus (ksi) 7857 *Compressive strength – modulus test was loaded in the elastic region to record the modulus and then loaded to failure. Compressive strength – no modulus test was directly loaded to failure.

101
Series 1
Figure B-13 – Failure Surface (2.0 in. slab - 1.5 in. plate)
Load vs. Displacement
0
5
10
15
20
25
0 0.1 0.2 0.3 0.4 0.5 0.6 0.7 0.8 0.9
Displacement (in)
Load
(kip
s)
Wire Pot 1 - West
Wire Pot 2 - East
Figure B-14 - Load vs. Displacement (2.0 in. slab - 1.5 in. plate)

102
Load vs. Strain (Diagonals)
0
5
10
15
20
25
0 1000 2000 3000 4000 5000 6000 7000 8000 9000 10000
Strain (µε)
Load
(kip
s)
North West Strain Gage (top)South West Strain Gage (top)South East Strain Gage (top)North East Strain Gage (top)Limiting Strain
Figure B-15 – Load vs. Diagonal Strain (2.0 in. slab - 1.5 in. plate)
Load vs. Strain (Orthogonal-Support Face)
0
5
10
15
20
25
-800 -600 -400 -200 0
Strain (µε)
Load
(kip
s)
North Edge Strain Gage (top)
Figure B-16 - Load vs. Orthogonal Strain (2.0 in. slab - 1.5 in. plate)

103
Load vs. Strain (Bottom)
0
2
4
6
8
10
12
14
16
18
20
-1000 -900 -800 -700 -600 -500 -400 -300 -200 -100 0
Strain (µε)
Load
(kip
s)
West Strain Gage (bottom)North Strain Gage (bottom)East Strain Gage (bottom)
Figure B-17 - Load vs. Bottom Strain (2.0 in. slab - 1.5 in. plate)
Figure B-18 – Failure Surface (2.0 in. slab – 2.0 in. plate)

104
Load vs. Displacement
0
5
10
15
20
25
30
0 0.1 0.2 0.3 0.4 0.5 0.6 0.7 0.8 0.9 1
Displacement (in)
Load
(kip
s)
Wire Pot 1 - WestWire Pot 2 - East
Figure B-19 - Load vs. Displacement (2.0 in. slab – 2.0 in. plate)
Load vs. Strain (Diagonals)
0
5
10
15
20
25
30
0 2000 4000 6000 8000 10000 12000 14000 16000 18000Strain (µε)
Load
(kip
s)
North West Strain Gage (top)South West Strain Gage (top)
South East Strain Gage (top)North East Strain Gage (top)
Limiting Strain
Figure B-20 - Load vs. Diagonal Strain (2.0 in. slab – 2.0 in. plate)

105
Load vs. Strain (Orthogonal)
0
5
10
15
20
25
30
0 1000 2000 3000 4000 5000 6000 7000 8000 9000 10000
Strain (µε)
Load
(kip
s)
North Strain Gage (top)East Strain Gage (top)South Strain Gage (top)Limiting Strain
Figure B-21 - Load vs. Orthogonal Strain (2.0 in. slab – 2.0 in. plate)
Load vs. Strain (Bottom)
0
5
10
15
20
25
30
-1200 -1000 -800 -600 -400 -200 0
Strain (µε)
Load
(kip
s)
West Strain Gage (bottom)
North Strain Gage (bottom)
Figure B-22 - Load vs. Bottom Strain (2.0 in. slab – 2.0 in. plate)

106
Figure B-23 – Failure Surface (2.0 in. slab – 1.0 in. plate)
Load vs. Displacement
0
5
10
15
20
25
0 1 2 3 4 5 6 7
Displacement (in)
Load
(kip
s)
Wire Pot 1 - WestWire Pot 2 - East
DATA NO GOOD
Figure B-24 - Load vs. Displacement (2.0 in. slab – 1.0 in. plate)

107
Load vs. Strain (Diagonals)
0
5
10
15
20
25
0 1000 2000 3000 4000 5000 6000 7000 8000 9000 10000
Strain (µε)
Load
(kip
s)
North West Strain Gage (top)South West Strain Gage (top)South East Strain Gage (top)North East Strain Gage (top)Limiting Strain
Figure B-25 - Load vs. Diagonal Strain (2.0 in. slab – 1.0 in. plate)
Load vs. Strain (Orthogonal)
0
2
4
6
8
10
12
14
0 2000 4000 6000 8000 10000 12000 14000 16000 18000
Strain (µε)
Load
(kip
s)
Center Strain Gage (top)
Figure B-26 - Load vs. Orthogonal Strain (2.0 in. slab – 1.0 in. plate)

108
Load vs. Strain (Bottom)
0
5
10
15
20
25
-1200 -1000 -800 -600 -400 -200 0
Strain (µε)
Load
(kip
s)
South Strain Gage (bottom)East Strain Gage (bottom)
Figure B-27 - Load vs. Bottom Strain (2.0 in. slab – 2.0 in. plate)

109
Series 2
Figure B-28 – Failure Surface (2.5 in. slab – 2.0 in. plate)
Load vs. Displacement
0
5
10
15
20
25
30
35
0 0.1 0.2 0.3 0.4 0.5 0.6 0.7 0.8 0.9 1
Displacement (in)
Load
(kip
s)
Wire Pot 1 - West
Wire Pot 2 - East
Figure B-29 - Load vs. Displacement (2.5 in. slab – 2.0 in. plate)

110
Load vs. Strain (Diagonals)
0
5
10
15
20
25
30
35
0 1000 2000 3000 4000 5000 6000 7000 8000
Strain (µε)
Load
(kip
s)
North West Strain Gage (top)South West Strain Gage (top)South East Strain Gage (top)North East Strain Gage (top)Limiting Strain
Figure B-30 - Load vs. Diagonal Strain (2.5 in. slab – 2.0 in. plate)
Load vs. Strain (Orthogonal)
0
5
10
15
20
25
30
35
0 1000 2000 3000 4000 5000 6000 7000 8000
Strain (µε)
Load
(kip
s)
North Strain Gage (top)East Strain Gage (top)South Strain Gage (top)Limiting Strain
Figure B-31 - Load vs. Orthogonal Strain (2.5 in. slab – 2.0 in. plate)

111
Load vs. Strain (Bottom)
0
5
10
15
20
25
30
35
-1500 -1300 -1100 -900 -700 -500 -300 -100
Strain (µε)
Load
(kip
s)
South Strain Gage (bottom)
East Strain Gage (bottom)
Figure B-32 - Load vs. Bottom Strain (2.5 in. slab – 2.0 in. plate)
Figure B-33 – Failure Surface (2.5 in. slab – 3.0 in. plate)

112
Load vs. Displacement
0
5
10
15
20
25
30
35
40
0 0.5 1 1.5 2 2.5
Displacement (in)
Load
(kip
s)
Wire Pot 1 - WestWire Pot 2 - East
Figure B-34 - Load vs. Displacement (2.5 in. slab – 3.0 in. plate)
Load vs. Strain (Diagonals)
0
5
10
15
20
25
30
35
40
0 2000 4000 6000 8000 10000 12000
Strain (µε)
Load
(kip
s)
North West Strain Gage (top)South West Strain Gage (top)South East Strain Gage (top)North East Strain Gage (top)Limiting Strain
Figure B-35- Load vs. Diagonal Strain (2.5 in. slab – 3.0 in. plate)

113
Load vs. Strain (Orthogonal)
0
5
10
15
20
25
30
35
40
0 2000 4000 6000 8000 10000 12000 14000 16000 18000
Strain (µε)
Load
(kip
s)
North Strain Gage (top)
West Strain Gage (top)
East Strain Gage (top)Limiting Strain
Figure B-36 - Load vs. Orthogonal Strain (2.5 in. slab – 3.0 in. plate)
Load vs. Strain (Bottom)
0
5
10
15
20
25
30
35
40
-1500 -1300 -1100 -900 -700 -500 -300 -100
Strain (µε)
Load
(kip
s)
South Strain Gage (bottom)West Strain Gage (bottom)
Figure B-37 - Load vs. Bottom Strain (2.5 in. slab – 3.0 in. plate)

114
Figure B-38 – Failure Surface (2.5 in. slab – 1.5 in. plate)
Load vs. Displacement
0
5
10
15
20
25
30
35
0 0.2 0.4 0.6 0.8 1 1.2 1.4 1.6
Displacement (in)
Load
(kip
s)
Wire Pot 1 - WestWire Pot 2 - East
Figure B-39 - Load vs. Displacement (2.5 in. slab – 1.5 in. plate)

115
Load vs. Strain (Diagonals)
0
5
10
15
20
25
30
35
0 2000 4000 6000 8000 10000 12000 14000
Strain (µε)
Load
(kip
s)
North West Strain Gage (top)South West Strain Gage (top)South East Strain Gage (top)North East Strain Gage (top)Limiting Strain
Figure B-40 - Load vs. Diagonal Strain (2.5 in. slab – 1.5 in. plate)
Load vs. Strain (Orthogonal)
0
5
10
15
20
25
30
35
0 1000 2000 3000 4000 5000 6000 7000 8000
Strain (µε)
Load
(kip
s)
North Strain Gage (top)South Strain Gage (top)East Strain Gage (top)Limiting Strain
Figure B-41 - Load vs. Orthogonal Strain (2.5 in. slab – 1.5 in. plate)

116
Load vs. Strain (Bottom)
0
5
10
15
20
25
30
35
-1500 -1300 -1100 -900 -700 -500 -300 -100
Strain (µε)
Load
(kip
s)
North Strain Gage (bottom)West Strain Gage (bottom)
Figure B-42 - Load vs. Bottom Strain (2.5 in. slab – 1.5 in. plate)
Figure B-43 – Failure Surface (2.5 in. slab – 2.5 in. plate)

117
Load vs Displacement
0
5
10
15
20
25
30
35
40
0 0.5 1 1.5 2 2.5
Displacement (in)
Load
(kip
s)
Wire Pot 1 - WestWire Pot 2 - East
Figure B-44 - Load vs. Displacement (2.5 in. slab – 2.5 in. plate)
Load vs. Strain (Diagonals)
0
5
10
15
20
25
30
35
40
0 1000 2000 3000 4000 5000 6000 7000 8000
Strain (µε)
Load
(kip
s)
North West Strain Gage (top)South West Strain Gage (top)South East Strain Gage (top)North East Strain Gage (top)Limiting Strain
Figure B-45 - Load vs. Diagonal Strain (2.5 in. slab – 2.5 in. plate)

118
Load vs. Strain (Orthogonal)
0
5
10
15
20
25
30
35
40
0 1000 2000 3000 4000 5000 6000 7000 8000
Strain (µε)
Load
(kip
s)
North Strain Gage (top)East Strain Gage (top)South Strain Gage (top)Limiting Strain
Figure B-46 - Load vs. Orthogonal Strain (2.5 in. slab – 2.5 in. plate)
Load vs. Strain (Bottom)
0
5
10
15
20
25
30
35
40
-1500 -1300 -1100 -900 -700 -500 -300 -100
Strain (µε)
Load
(kip
s)
West Strain Gage (bottom)North Strain Gage (bottom)
Figure B-47 - Load vs. Bottom Strain (2.5 in. slab – 2.5 in. plate)
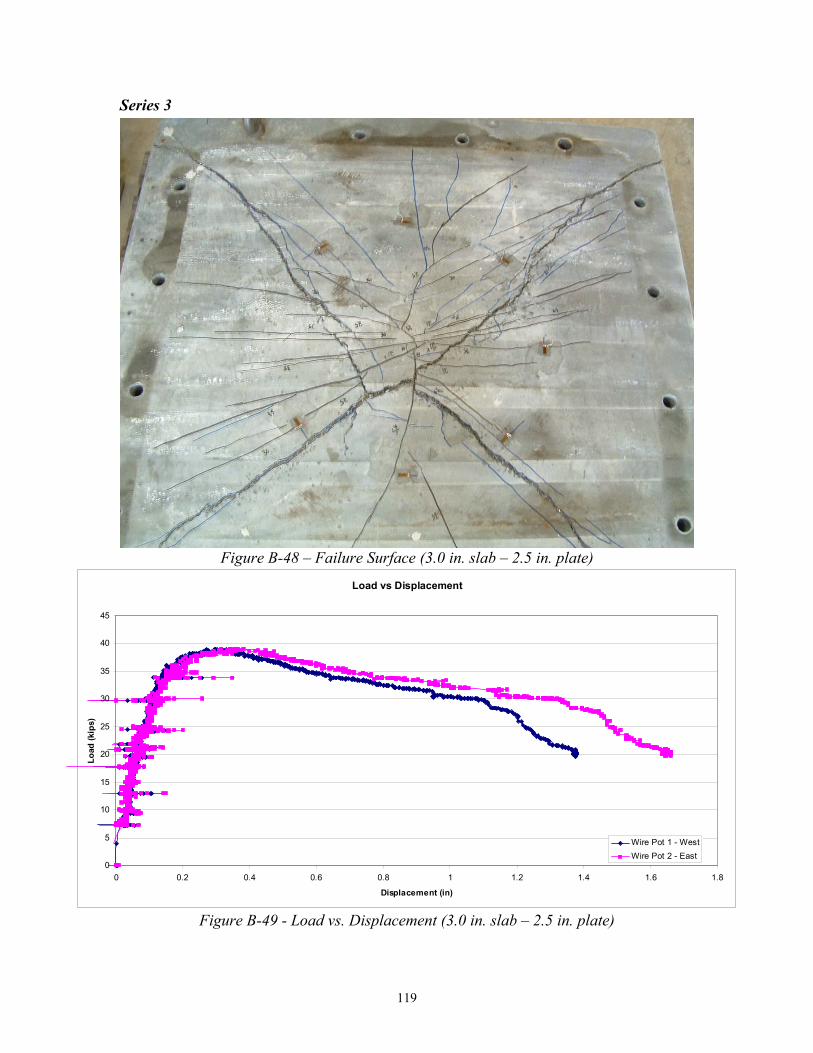
119
Series 3
Figure B-48 – Failure Surface (3.0 in. slab – 2.5 in. plate)
Load vs Displacement
0
5
10
15
20
25
30
35
40
45
0 0.2 0.4 0.6 0.8 1 1.2 1.4 1.6 1.8
Displacement (in)
Load
(kip
s)
Wire Pot 1 - WestWire Pot 2 - East
Figure B-49 - Load vs. Displacement (3.0 in. slab – 2.5 in. plate)
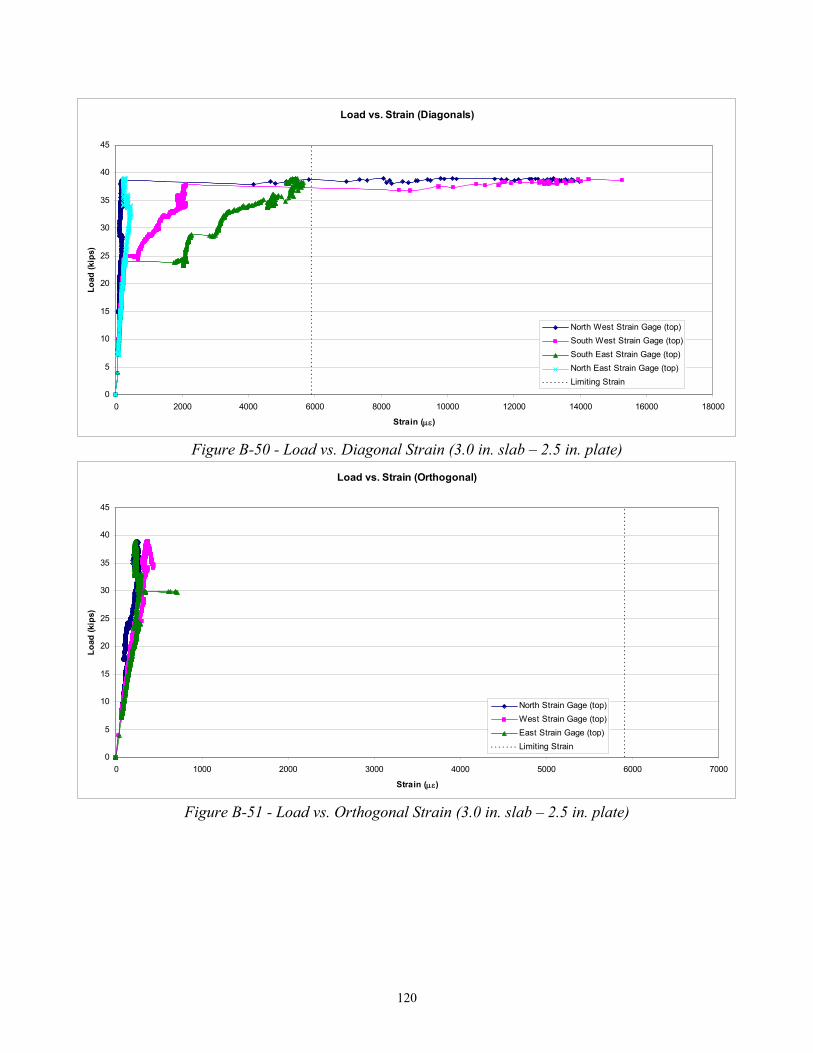
120
Load vs. Strain (Diagonals)
0
5
10
15
20
25
30
35
40
45
0 2000 4000 6000 8000 10000 12000 14000 16000 18000
Strain (µε)
Load
(kip
s)
North West Strain Gage (top)South West Strain Gage (top)South East Strain Gage (top)North East Strain Gage (top)Limiting Strain
Figure B-50 - Load vs. Diagonal Strain (3.0 in. slab – 2.5 in. plate)
Load vs. Strain (Orthogonal)
0
5
10
15
20
25
30
35
40
45
0 1000 2000 3000 4000 5000 6000 7000
Strain (µε)
Load
(kip
s)
North Strain Gage (top)West Strain Gage (top)East Strain Gage (top)Limiting Strain
Figure B-51 - Load vs. Orthogonal Strain (3.0 in. slab – 2.5 in. plate)

121
Load vs. Strain (Bottom)
0
5
10
15
20
25
30
35
40
45
-2000 -1800 -1600 -1400 -1200 -1000 -800 -600 -400 -200 0
Strain (µε)
Load
(kip
s)
South Strain Gage (bottom)West Strain Gage (bottom)
Figure B-52 - Load vs. Bottom Strain (3.0 in. slab – 2.5 in. plate)
Figure B-53 – Failure Surface (3.0 in. slab – 1.5 in. plate)

122
Load vs. Displacement
0
5
10
15
20
25
30
35
40
0 0.1 0.2 0.3 0.4 0.5 0.6 0.7
Displacement (in)
Load
(kip
s)
Wire Pot 2 - East
Figure B-54 - Load vs. Displacement (3.0 in. slab – 1.5 in. plate)
Load vs. Strain (Diagonals)
0
5
10
15
20
25
30
35
40
0 2000 4000 6000 8000 10000 12000 14000
Strain (µε)
Load
(kip
s)
North West Strain Gage (top)South West Strain Gage (top)South East Strain Gage (top)North East Strain Gage (top)Limiting Strain
Figure B-55 - Load vs. Diagonal Strain (3.0 in. slab – 1.5 in. plate)

123
Load vs. Strain (Orthogonal)
0
5
10
15
20
25
30
35
40
0 1000 2000 3000 4000 5000 6000 7000 8000
Strain (µε)
Load
(kip
s)
North Strain Gage (top)West Strain Gage (top)South Strain Gage (top)Limiting Strain
Figure B-56 - Load vs. Orthogonal Strain (3.0 in. slab – 1.5 in. plate)
Load vs. Strain (Bottom)
0
5
10
15
20
25
30
35
40
-2500 -2000 -1500 -1000 -500 0
Strain (µε)
Load
(kip
s)South Strain Gage (bottom)West Strain Gage (bottom)
Figure B-57 - Load vs. Bottom Strain (3.0 in. slab – 1.5 in. plate)

124
Figure B-58 – Failure Surface (3.0 in. slab – 1.0 in. plate)
Load vs. Displacement
0
5
10
15
20
25
30
35
40
45
0 0.2 0.4 0.6 0.8 1 1.2 1.4
Displacement (in)
Load
(kip
s)
Wire Pot 1 - WestWire Pot 2 - East
Figure B-59 - Load vs. Displacement (3.0 in. slab – 1.0 in. plate)
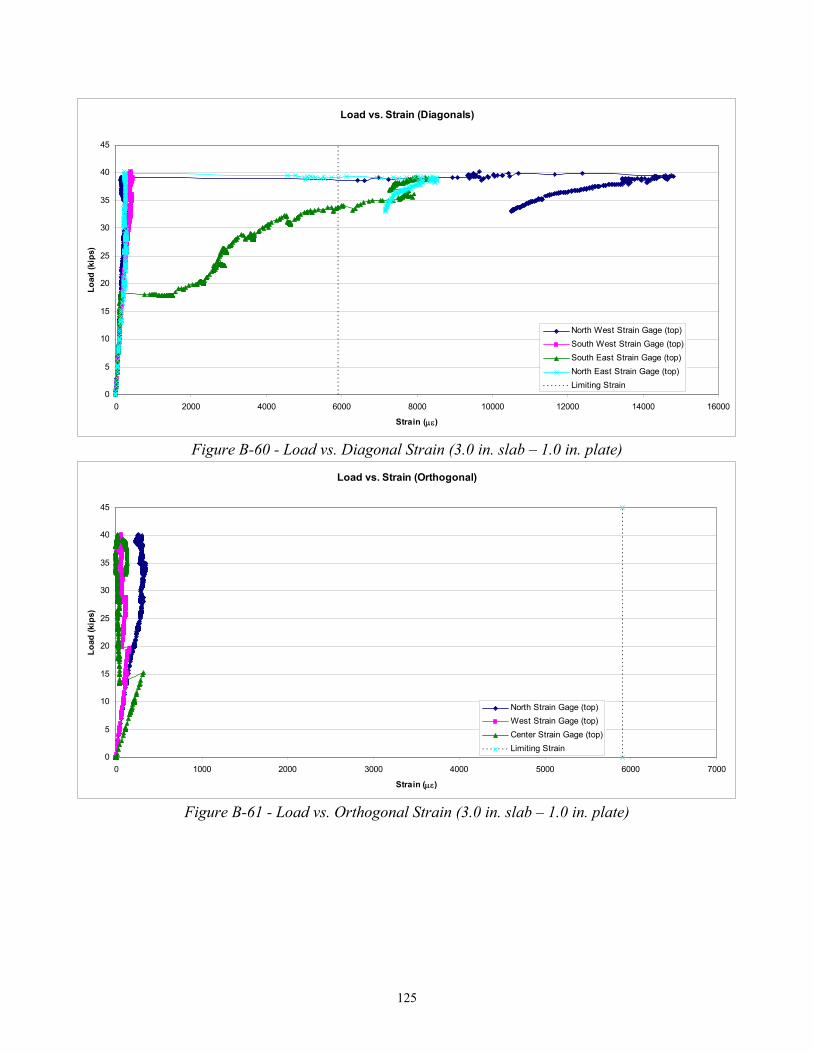
125
Load vs. Strain (Diagonals)
0
5
10
15
20
25
30
35
40
45
0 2000 4000 6000 8000 10000 12000 14000 16000
Strain (µε)
Load
(kip
s)
North West Strain Gage (top)South West Strain Gage (top)South East Strain Gage (top)North East Strain Gage (top)Limiting Strain
Figure B-60 - Load vs. Diagonal Strain (3.0 in. slab – 1.0 in. plate)
Load vs. Strain (Orthogonal)
0
5
10
15
20
25
30
35
40
45
0 1000 2000 3000 4000 5000 6000 7000
Strain (µε)
Load
(kip
s)
North Strain Gage (top)West Strain Gage (top)Center Strain Gage (top)Limiting Strain
Figure B-61 - Load vs. Orthogonal Strain (3.0 in. slab – 1.0 in. plate)
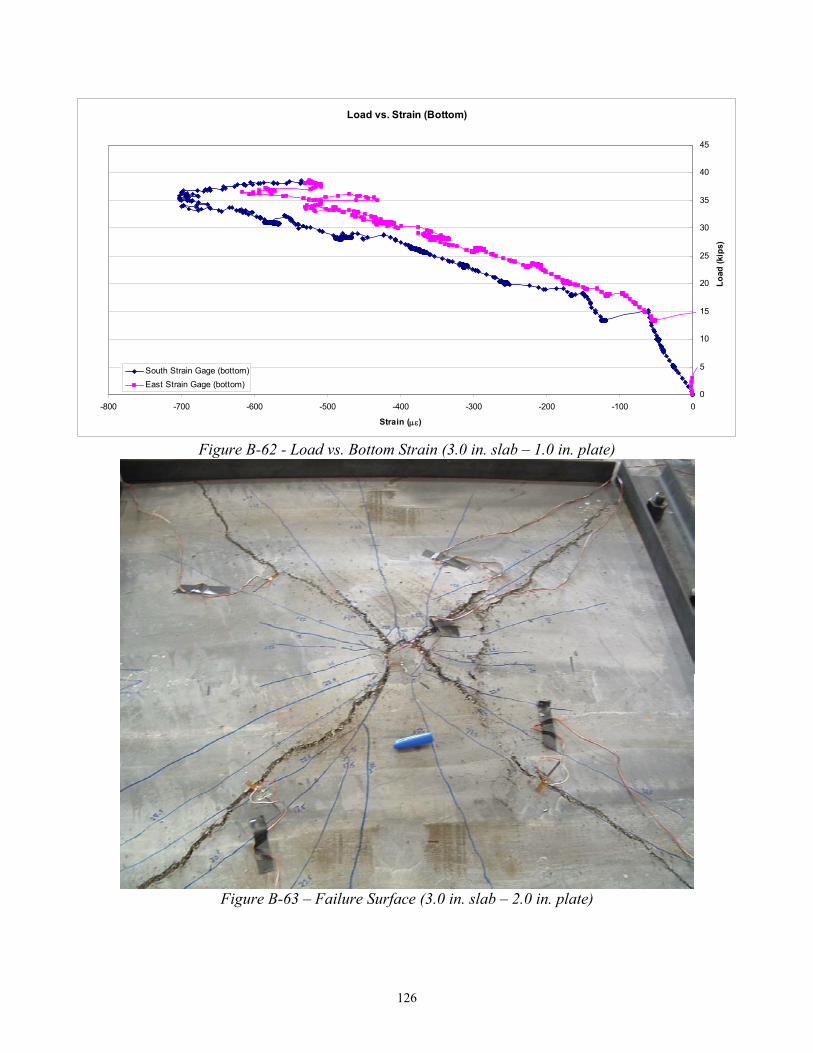
126
Load vs. Strain (Bottom)
0
5
10
15
20
25
30
35
40
45
-800 -700 -600 -500 -400 -300 -200 -100 0
Strain (µε)
Load
(kip
s)
South Strain Gage (bottom)East Strain Gage (bottom)
Figure B-62 - Load vs. Bottom Strain (3.0 in. slab – 1.0 in. plate)
Figure B-63 – Failure Surface (3.0 in. slab – 2.0 in. plate)

127
Load vs. Displacement
0
5
10
15
20
25
30
35
40
45
0 0.2 0.4 0.6 0.8 1 1.2 1.4 1.6 1.8 2
Displacement (in)
Load
(kip
s)
Wire Pot 1 - WestWire Pot 2 - East
Figure B-64 - Load vs. Displacement (3.0 in. slab – 2.0 in. plate)
Load vs. Strain (Diagonals)
0
5
10
15
20
25
30
35
40
45
0 2000 4000 6000 8000 10000 12000 14000 16000 18000
Strain (µε)
Load
(kip
s)
North West Strain Gage (top)South West Strain Gage (top)South East Strain Gage (top)North East Strain Gage (top)Limiting Strain
Figure B-65 - Load vs. Diagonal Strain (3.0 in. slab – 2.0 in. plate)

128
Load vs. Strain (Orthogonal)
0
5
10
15
20
25
30
35
40
45
0 1000 2000 3000 4000 5000 6000 7000
Strain (µε)
Load
(kip
s)
Center Strain Gage (top)Limiting Strain
Figure B-66 - Load vs. Orthogonal Strain (3.0 in. slab – 2.0 in. plate)
Load vs. Strain (Bottom)
0
5
10
15
20
25
30
35
40
45
-1500 -1300 -1100 -900 -700 -500 -300 -100
Strain (µε)
Load
(kip
s)North Strain Gage (bottom)West Strain Gage (bottom)
Figure B-67 - Load vs. Bottom Strain (3.0 in. slab – 2.0 in. plate)

129
Figure B-68 – Failure Surface (3.0 in. slab – 1.75 in. plate)
Load Displacement
0
5
10
15
20
25
30
35
40
45
0 0.5 1 1.5 2 2.5 3
Displacement (in)
Load
(kip
s)
Wire Pot 1 - WestWire Pot 2 - East
Figure B-69 - Load vs. Displacement (3.0 in. slab – 1.75 in. plate)

130
Load vs. Strain (Diagonals)
0
5
10
15
20
25
30
35
40
45
0 2000 4000 6000 8000 10000 12000 14000
Strain (µε)
Load
(kip
s)
North West Strain Gage (top)South West Strain Gage (top)South West Strain Gage (top)North East Strain Gage (top)Limiting Strain
Figure B-70 - Load vs. Diagonal Strain (3.0 in. slab – 1.75 in. plate)
Load vs. Strain (Orthogonal)
0
5
10
15
20
25
30
35
40
45
0 1000 2000 3000 4000 5000 6000 7000
Strain (µε)
Load
(kip
s)
Center Strain Gage (top)Limitin Strain
Figure B-71 - Load vs. Orthogonal Strain (3.0 in. slab – 1.75 in. plate)

131
Load vs. Strain (Bottom)
0
5
10
15
20
25
30
35
40
45
-1200 -1000 -800 -600 -400 -200 0
Strain (µε)
Load
(kip
s)
West Strain Gage (bottom)North Strain Gage (bottom)
Figure B-72 - Load vs. Bottom Strain (3.0 in. slab – 1.75 in. plate)

VITA Devin Harris was born on October 10, 1977 in Philadelphia, Pennsylvania to Jerome and
Petra Harris. He spent his childhood in a number of locations in the United States and the
Caribbean including: California, Puerto Rico, Jamaica, and Barbados. Devin attended
Pine Crest Preparatory School as a boarding student in Ft. Lauderdale, Florida and
graduated in 1995.
Devin enrolled as an undergraduate at the University of Florida in the fall of 1995. In
June of 1999 he graduated with a Bachelor of Science degree in Civil Engineering. Upon
graduation he began employment with ExxonMobil (formerly Exxon Company USA) in
New Orleans, Louisiana as a drilling engineer.
After three and a half years of working for ExxonMobil, Devin enrolled at Virginia
Polytechnic Institute and State University in the spring of 2003 to pursue graduate studies.
Upon completion of his M.S. studies, Devin will begin his studies as a Ph.D. student at
Virginia Polytechnic Institute and State University.