Characterization of National Web Domains · site, for example, typically an ensemble of pages in...
32
Characterization of National Web Domains RICARDO BAEZA-YATES Yahoo! Research CARLOS CASTILLO C´ atedra Telef´ onica Universitat Pompeu Fabra and EFTHIMIS N. EFTHIMIADIS University of Washington During the last few years, several studies on the characterization of the public Web space of various national domains have been published. The pages of a country are an interesting set for studying the characteristics of the Web because at the same time these are diverse (as they are written by several authors) and yet rather similar (as they share a common geographical, historical and cultural context). This article discusses the methodologies used for presenting the results of Web characterization studies, including the granularity at which different aspects are presented, and a separation of concerns between contents, links, and technologies. Based on this, we present a side-by-side com- parison of the results of 12 Web characterization studies, comprising over 120 million pages from 24 countries. The comparison unveils similarities and differences between the collections and sheds light on how certain results of a single Web characterization study on a sample may be valid in the context of the full Web. Categories and Subject Descriptors: H.3.5 [Information Storage and Retrieval]: Online Information Services—Web-based services; H.3.7 [Information Storage and Retrieval]: Digital Libraries—Collection General Terms: Measurement Additional Key Words and Phrases: Web characterization, Web measurement ACM Reference Format: Baeza-Yates, R., Castillo, C., and Efthimiadis, E. N. 2007. Characterization of national Web domains. ACM Trans. Intern. Tech. 7, 2, Article 9 (May 2007), 32 pages. DOI = 10.1145/ 1239971.1239973 http://doi.acm.org/10.1145/1239971.1239973 This work was partially funded by ICREA and Universitat Pompeu Fabra. C. Castillo is currently at Yahoo! Research. Authors’ addresses: R. Baeza-Yates, C. Castillo, Yahoo! Research; email: {rby,chato}@yahoo-inc.com; E. N. Efthimiadis, University of Washington; email: [email protected]. Permission to make digital or hard copies of part or all of this work for personal or classroom use is granted without fee provided that copies are not made or distributed for profit or direct commercial advantage and that copies show this notice on the first page or initial screen of a display along with the full citation. Copyrights for components of this work owned by others than ACM must be honored. Abstracting with credit is permitted. To copy otherwise, to republish, to post on servers, to redistribute to lists, or to use any component of this work in other works requires prior specific permission and/or a fee. Permissions may be requested from Publications Dept., ACM, Inc., 2 Penn Plaza, Suite 701, New York, NY 10121-0701 USA, fax +1 (212) 869-0481, or [email protected]. C 2007 ACM 1533-5399/2007/05-ART9 $5.00 DOI 10.1145/1239971.1239973 http://doi.acm.org/ 10.1145/1239971.1239973 ACM Transactions on Internet Technology, Vol. 7, No. 2, Article 9, Publication date: May 2007.
Transcript of Characterization of National Web Domains · site, for example, typically an ensemble of pages in...

Characterization of National Web Domains
RICARDO BAEZA-YATES
Yahoo! Research
CARLOS CASTILLO
Catedra TelefonicaUniversitat Pompeu Fabra
and
EFTHIMIS N. EFTHIMIADIS
University of Washington
During the last few years, several studies on the characterization of the public Web space of various
national domains have been published. The pages of a country are an interesting set for studying
the characteristics of the Web because at the same time these are diverse (as they are written
by several authors) and yet rather similar (as they share a common geographical, historical and
cultural context).
This article discusses the methodologies used for presenting the results of Web characterization
studies, including the granularity at which different aspects are presented, and a separation of
concerns between contents, links, and technologies. Based on this, we present a side-by-side com-
parison of the results of 12 Web characterization studies, comprising over 120 million pages from 24
countries. The comparison unveils similarities and differences between the collections and sheds
light on how certain results of a single Web characterization study on a sample may be valid in the
context of the full Web.
Categories and Subject Descriptors: H.3.5 [Information Storage and Retrieval]: Online
Information Services—Web-based services; H.3.7 [Information Storage and Retrieval]: Digital
Libraries—Collection
General Terms: Measurement
Additional Key Words and Phrases: Web characterization, Web measurement
ACM Reference Format:Baeza-Yates, R., Castillo, C., and Efthimiadis, E. N. 2007. Characterization of national Web
domains. ACM Trans. Intern. Tech. 7, 2, Article 9 (May 2007), 32 pages. DOI = 10.1145/
1239971.1239973 http://doi.acm.org/10.1145/1239971.1239973
This work was partially funded by ICREA and Universitat Pompeu Fabra.
C. Castillo is currently at Yahoo! Research.
Authors’ addresses: R. Baeza-Yates, C. Castillo, Yahoo! Research; email: {rby,chato}@yahoo-inc.com;
E. N. Efthimiadis, University of Washington; email: [email protected].
Permission to make digital or hard copies of part or all of this work for personal or classroom use is
granted without fee provided that copies are not made or distributed for profit or direct commercial
advantage and that copies show this notice on the first page or initial screen of a display along
with the full citation. Copyrights for components of this work owned by others than ACM must be
honored. Abstracting with credit is permitted. To copy otherwise, to republish, to post on servers,
to redistribute to lists, or to use any component of this work in other works requires prior specific
permission and/or a fee. Permissions may be requested from Publications Dept., ACM, Inc., 2 Penn
Plaza, Suite 701, New York, NY 10121-0701 USA, fax +1 (212) 869-0481, or [email protected]© 2007 ACM 1533-5399/2007/05-ART9 $5.00 DOI 10.1145/1239971.1239973 http://doi.acm.org/
10.1145/1239971.1239973
ACM Transactions on Internet Technology, Vol. 7, No. 2, Article 9, Publication date: May 2007.

2 • R. Baeza-Yates et al.
1. INTRODUCTION
The World Wide Web Consortium1 had a Web characterization activity from1994 to 1999. The last summary of Web characterization studies of that workinggroup was published by Pitkow [1999] and included both the characteristicsof the Web pages and sites as well as the characteristics of the Web trafficgenerated by users.
One of the main difficulties involved in any attempt of Web characterizationis how to obtain a representative sample. We have observed three types ofsampling in the literature: complete crawls of a single Web site, random samplesfrom the whole Web, and large samples from specific communities.
Complete crawls of a single Web site produce results that are biased by thechoice of the Web site of study, typically of an academic nature, because it iseasier to get access to the data. In this case, the whole set of pages alwaysbelongs to the same organization and therefore has not enough diversity to berepresentative. Random samples from the complete Web, on the other hand,include pages from different authors and organizations but, due to the largescale of the Web, are much less complete and usually they are not uniform.
Large samples from specific communities, such as national domains, havea good balance between diversity and completeness. They include pages thatshare a common geographical, historical, and cultural context but are written bydiverse authors in different organizations. Web domains also have a moderatesize that allows good accuracy in the results; because of this, they have attractedthe attention of several researchers.
Different methodologies have been applied to characterize several nationalWeb domains but, to the best of our knowledge, in the last five years, there isno study comparing their findings. In this article, we
—survey several reports on national Web domains;
—discuss a methodology to present these kinds of reports,
—present a side-by-side comparison of their results, and
—relate the results to socioeconomic factors.
Besides surveying published results, we also summarize the characteristicsof some collections that have not been reported in English (Brazil, Chile, andSpain), have limited circulation (South Korea), or that have only produced databut no analysis so far (Indochina, Italy, and United Kingdom).
The rest of this article is organized as follows: Section 2 introduces a method-ology for presenting the results and summarizes general characteristics of thecollections that are being studied. The next four sections compare the find-ings of the Web characterization studies according to contents and metadata(Section 3), links (Section 4), and technological aspects (Section 5). In Section 6we compare the results of Web characterization studies with socio-economicfactors. Finally, Section 7 presents our conclusions.
1Home page at <http://www.w3c.org/>.
ACM Transactions on Internet Technology, Vol. 7, No. 2, Article 9, Publication date: May 2007.

Characterization of National Web Domains • 3
Fig. 1. Levels of granularity when describing a collection from the Web.
2. METHODOLOGY
This section explains how the results are presented in Web characterizationstudies, introduces the datasets used in this article, and presents some generalstatistical properties of the Web.
2.1 Presentation of Characterization Results
The Web can be analyzed at several levels of granularity [Bjorneborn andIngwersen 2004]. From a single byte through multibyte sequences represent-ing characters to top-level domains and finally the entire corpus of digital in-formation available in the Global Web, there is a series of possible levels ofdescription. In Figure 1, we depict the ones that are most commonly found inWeb characterization studies.
Three of these levels receive more attention by researchers: pages, sites, anddomains. A Web page is the unit of content that is described by the HTTP proto-col, and is also the basic unit for showing results in Web search engines. A Website, for example, www.mat.unb.br is typically an ensemble of pages in the sametopic and is the basic unit used by most Web directories. A domain belongs toone organization and sometimes includes several Web sites, for example, na-tional domain such as .br or organizational domains, such as unb.br. Further,Web pages can be divided into first-level pages that are the homepages, andsecond-level pages that are directly reachable from the home page. Throughoutthe article, we use the terms Web sites and hosts interchangeably.
Granularity is not the only axis for classifying the information that can beobtained from the Web. We can also divide the characteristics of the Web ac-cording to their type.
Content. This includes the actual contents of the objects, and their metadataor properties.
Links. This includes the relationships between objects, typically in the formof hyperreferences.
Technologies. This includes the file formats, protocols, and programming lan-guages used for building the Web.
ACM Transactions on Internet Technology, Vol. 7, No. 2, Article 9, Publication date: May 2007.
4 • R. Baeza-Yates et al.
Table I. A List of Properties that Have Been included in Web Characterization Studies,
Classified by Granularity (Page, Site, Domain) and Type (Content, Links, Technology)
Granularity Type Contents Links Technologies
Pages Word frequencies;
Language; Text
size; Page size; Age;
Duplicates; HTML
metatags
Indegree; Outdegree;
PageRank; Hub
score; Authority
score
URLs; Response codes;
Media and document
formats; Dynamic pages;
Scripting languages;
HTML version
Sites Sum of text sizes;
Sum of page sizes
Indegree and
outdegree in the
hostgraph; Internal
links; Distribution
of
strongly-connected
components; Web
structure
Types of Web sites with one
indexable page;
Technologies for dynamic
pages
Domains Sites per second-and-
third level domain
Most referenced
domains; Coverage
of domain
references
Software used as Web
server; Prevalence of
DNS wildcarding;
Distribution of IP per
address
The two axes; granularity and type, can be combined to classify the propertiesappearing in the Web characterization studies presented in this article as shownin Table I. In our opinion, both axes should be used for presenting the results:in this article, we order the results first by type, then by granularity.
2.2 Collections Studied
We analyzed a total of 10 national domains plus the multinational Web spacesof African and Indochinese Web sites. Following, we list the sources used.
Africa. Boldi et al. [2002, 2004] studied the domains of several African coun-tries. The countries were: Egypt (EG), Libya (LY), Morocco (MA), Mozambique(MZ), Namibia (NA), Senegal (SN), South Africa (ZA), Tunisia (TN) and Zimbabwe(ZW).
Austria (AT domain). Rauber et al. [2002] presents an analysis of the AustrianWeb using a data warehousing approach.
Brazil (BR domain). Veloso et al. [2000] and Modesto et al. [2005] are twoanalysis of this large country’s Web using CobWeb [da Silva et al. 1999] andWIRE [Baeza-Yates and Castillo 2002], respectively.
Chile (CL domain). Baeza-Yates et al. [2000, 2003, 2005] have been carryingseveral analysis of the Chilean Web since the year 2000, using the WIRE crawlerand data from the TodoCL2 search engine that also uses CobWeb.
Greece (GR domain). Efthimiadis and Castillo [2004] did a preliminary studyusing WIRE.
2TodoCL search engine, <http://www.todocl.cl/>.
ACM Transactions on Internet Technology, Vol. 7, No. 2, Article 9, Publication date: May 2007.

Characterization of National Web Domains • 5
Indochina. is a collection obtained by the Laboratory of Web Algorithmics3
in 2004. The countries included are Cambodia (KH), Laos (LA), Myanmar(MM), Thailand (TH), and Vietnam (VN). These collections were crawled usingUbicrawler [Boldi et al. 2004].
Italy (IT domain). is a large collection obtained by the Laboratory of WebAlgorithmics in 2004 with Ubicrawler.
Portugal (PT domain). Gomes and Silva [2005] did a study using the ViuvaNegra crawler from the Tumba4 search engine.
South Korea (KR domain). Baeza-Yates and Lalanne [2004] did a study usingWIRE.
Spain (ES domain). Baeza-Yates et al. [2006] did a study using a modifiedversion of CobWeb. We also use data from Alonso et al. [2003], an in-depthstudy on 27 specific Web sites.
Thailand (TH domain). Sanguanpong et al. [2000] did a study us-ing NontriSpider from the NontriSearch search engine [Sanguanpong andWarangrit 1998]. This is a more in-depth study than the corresponding partof the collection in the Indochinese sample.
United Kingdom (UK domain). is a large collection obtained by the Laboratoryof Web Algorithmics in 2002 using Ubicrawler.
By observing the number of available hosts and the downloaded pages in eachcollection, we consider that most of them have a high coverage of at least thehome pages, that is, the first levels of the pages in their Web sites. The collectionsof Brazil and the United Kingdom are smaller samples in comparison with theothers, but as we will see in the rest of the study, their sizes are large enoughto show results that are consistent with the others.
For comparison, we also used information obtained from samples of the globalWeb [Broder et al. 2000; Dill et al. 2002], and from a study on Web graphcompression [Suel and Yuan 2001].
Most of the national domain studies used different crawling software andhardware, but many of them are either with WIRE or Ubicrawler. In mostcases, we observe that the similarities and differences are crawler indepen-dent. Besides that, the main factors that affect the obtained statistics are thefollowing.
National domain boundaries. In some cases, the assigned top-level domainname is the most used for pages in the country, for instance, most of the Brazil-ian Web sites use the BR domain. In other cases Web sites are scattered acrossseveral domains as in the Spanish Web (which had a more restrictive policy ofregistrations under the country-code ES until 2005).
A possible choice for defining the Web of a country is considering all Websites that are registered at a domain inside the assigned country code or thatare hosted at an IP that belongs to a segment assigned to that country. In mostof our own studies, we use the union of both cases.
3Laboratory of Web Algorithmics, Dipartimento di Scienze dell’Informazione, Universita degli studi
di Milano, <http://law.dsi.unimi.it/>.4Tumba search engine’s crawler, <http://www.tumba.pt/english/crawler.html>.
ACM Transactions on Internet Technology, Vol. 7, No. 2, Article 9, Publication date: May 2007.

6 • R. Baeza-Yates et al.
Table II. Characteristics of the Studied Collections (The host count is an estimation from
the Internet System Consortium [2005]. The collected pages is the number of pages that
were downloaded and included in the collection. The maximum depth is sometimes
different for static and dynamic pages.)
Available hosts Collected pages Limits
Collection Year [mill] (rank) [mill] Depth Pages per site
Africa 2002 0.4 (39th) 2.0 n/a n/a
Austria 2002 1.6 (23th) 11.0 n/a n/a
Brazil 2005 3.9 (11th) 4.7 5 10,000
Chile 2004 0.3 (42th) 3.3 5–15 5,000
Greece 2004 0.3 (40th) 3.7 5–15 25,000
Indochina 2004 0.5 (38th) 7.4 n/a 10,000
Italy 2004 9.3 (4th) 41.3 8 10,000
South Korea 2004 0.2 (47th) 8.9 5–15 5,000
Portugal 2003 0.6 (37th) 3.2 6 8,000
Spain 2004 1.3 (25th) 16.2 ∞ 400
Thailand 2000 0.5 (38th) 0.7 n/a n/a
United Kingdom 2002 4.4 (10th) 18.5 n/a n/a
Crawling depth, and coverage. Web sites are potentially infinite [Brin et al.1998; Heydon and Najork 1999; Baeza-Yates and Castillo 2004; Eiron et al.2004]. For example, dynamic pages can create groups of infinitely many pages,for instance, imagine a calendar on which you can click next year forever.So, it is common to enforce some type of limit in the depth at which thecrawl stops. Even this limit might not be enough for Web sites generatingmany links automatically so also a per-site page limit is used by severalcrawlers.
When Web sites outside the main country domain are explored, it is typicalto use some heuristic to avoid downloading too many unrelated pages suchas reducing the exploration depth or the number of pages downloaded, usingtrigger keywords, or enforcing a lower limit on the number of links received bya page outside the country domain before crawling it.
The results presented in the article are for the Web as collected by thecrawlers, that is, for the Web before removal of spam. It should be noted that thecrawlers in some cases included some obvious spam filters, but no postfilteringwas done.
Static and dynamic pages. The handling of dynamic pages varies amongcrawlers. Some crawlers ignore them completely, others follow them but discardall the characters of the URL that follow the question mark (removing all theparameters). Still others try to remove parameters related to user tracking orsession-ids (to reduce the presence of duplicates), and some simply follow linksto dynamic pages without changing them.
Table II summarizes the characteristics of the studied collections. The num-ber of unique host names was measured by the Internet Systems Consortium5
in July 2005.
5Internet systems consortium’s domain survey, <http://www.isc.org/ds/>.
ACM Transactions on Internet Technology, Vol. 7, No. 2, Article 9, Publication date: May 2007.

Characterization of National Web Domains • 7
2.3 Zipf’s Law and Scale-Free Networks
The graph representing the connections between Web pages has a scale-freetopology. Scale-free networks, as opposed to random networks, are character-ized by an uneven distribution of links, and the distribution of the number oflinks to a page p follows a power law:
Pr(p has k links) ∝ k−θ .
We find this distribution on the Web in almost every aspect. It is the samedistribution that was found by economist Vilfredo Pareto in 1896 for the dis-tribution of wealth in large populations, that is, 80% of the wealth is owned by20% of the population. It is also the same distribution found by George KingsleyZipf in 1932 for the frequency of words in texts and that later turned out to beapplicable to several domains [Zipf 1949], called by him the law of minimal orleast effort.
One phenomenon that has appeared before in our own studies and now iscompletely clear is the smaller power law exponent at the beginning of severalof the measures presented. In fact, this happens for file sizes up to 25Kb, pagesper-site up to (15–30), pages per-domain up to 10 (except South Korea), numberof outlinks in a page up to 10 to 40, and average number of internal links per-site up to 15 to 30, where a range is given to show the variability for differentcountries. We argue that this is due to another empirical power law that wecall maximal shame6 which forces people to work a bit more than the minimumuntil they feel good about their work. Notice that this maximal shame can befor an individual or for a group (e.g., in the case of a Web site).
3. CONTENTS
This section and the following two sections compare Web characterization re-sults. Since the way of reporting the data differs, for each observed character-istic, we only include comparable data from the subset of countries from whichit is available.
3.1 Languages
In the year 2000, it was estimated that around 70% [Grefenstette and Nioche2000] of the pages were written in English and that the numbers of wordsavailable in other languages was growing faster than the number of words inEnglish. On January 2003, Google Zeitgeist7 showed that around 50% of thequeries to Google were using English, down from around 60% in 2001.
For language detection on the Web, two main techniques are applied: listsof stopwords in several languages are used, such as in the studies of Chile andBrazil [Baeza-Yates and Castillo 2005; Modesto et al. 2005], and naive Bayesover n-grams in the studies of Africa, Portugal and Spain [Boldi et al. 2002;Gomes and Silva 2005; Baeza-Yates et al. 2006]. The method used for the Web ofThailand was not specified in their paper [Sanguanpong et al. 2000]. In general,
6Could also be called minimal pride but it counteracts to minimal effort so we prefer the former.7Online at <http://www.google.com/press/zeitgeist.html>, verified November 2005.
ACM Transactions on Internet Technology, Vol. 7, No. 2, Article 9, Publication date: May 2007.

8 • R. Baeza-Yates et al.
Fig. 2. Distribution of the number of pages in different languages.
dictionary-based language detection works better with large texts, and, in theWeb, there are many pages that are very short; in these studies, when usinglist of stopwords many pages are not classified in any language, while n-grams-based techniques [Cavnar and Trenkle 1994] are able to accurately classify alarger subset of the collection.
The distribution of pages in English versus the pages in the local lan-guages and other languages is shown in Figure 2. We also include Spanishand Portuguese as each of them is important in two of the studied samples.Note that English is a local language for some African countries as well asPortuguese and other languages. We believe that Thailand has many pages inEnglish (65%) as opposed to Thai (35%) because it is a major tourist destina-tion, and English is also the secondary official language of the elite class.8 Inall cases there are large differences in the fraction of non-English languagesacross countries.
For example, in Portugal, there are two official languages, Portuguese (offi-cial) and Mirandese (official, but used locally). In Spain, the distribution of locallanguages is Castilian Spanish 52%, Catalan 8%, Galician 1%, and Basque 1%.Castilian is the official language, and the other languages are coofficial andused regionally.
From Figure 2, we see that English ranges from about 8% in Chile to 65%in Thailand and 75% in Africa. Chile and Brazil have very similar ratios of En-glish to their national languages, that is, 8% and 11% of English to about 90%and 88%, respectively. Similar patterns are observed in Portugal and Spain,where English is 18% and 30%, while Portuguese and Spanish are about 70%and 55%, respectively. One possible explanation of the low percentage of En-glish language pages in Chile and Brazil might be that the English is spokenby a small percentage of the population and that tourism is relatively low in
8U.S. Central Intelligence Agency, The World Factbook. Online at <http://www.cia.gov/cia/
publications/factbook/>, verified November 2005.
ACM Transactions on Internet Technology, Vol. 7, No. 2, Article 9, Publication date: May 2007.

Characterization of National Web Domains • 9
Fig. 3. Histograms of file sizes. The x-axis is the file size in Kilobytes and the y-axis the relative
frequency. The average size of and two parameters for the power law are given: θ1 for smaller sizes
and θ2 for larger sizes.
both countries. For example, in 2002, Chile had 1.4 million tourists, Brazil had3.8 million, while, in contrast, Thailand had 11 million.9
3.2 Page Size
The average file size of HTML pages was 13KB for the African sample, 24KBfor Brazil, 21KB for Chile, 22KB for Greece, 14KB for South Korea, 21KBfor Portugal and 10KB for Thailand. The distribution of page sizes is veryskewed, as shown in Figure 3, and can be modeled by a double-pareto dis-tribution [Mitzenmacher 2003].
We observed two different exponents, one for smaller pages (less than 20KB)and another for larger pages. The observed power-law parameters (θ1 and θ2)vary among sample, and are roughly 0.4 for the smaller sizes and 3.5 for thelarger sizes. In a previous study [Arlitt et al. 1999], a power law was also ob-served, and the exponent for the larger sizes was 1.5. The difference may bedue to two reasons. First, there are differences in the usage of HTML codingfor writing Web pages; currently, pages tend to be more complex. Second, theirstudy used data from traces from Web page users who probably do not toleratelarge page sizes as a Web crawler does. For a discussion on models for Web pagesizes, see Downey [2001], Mitzenmacher [2003], and Baeza-Yates and Navarro[2004].
3.3 Page Age
Page age information was obtained by reading the last-modified header in theHTTP responses that contained this information. Though the header informa-tion is not fully reliable, it is the best available. Days or months are groupedtogether, so little variation does not matter. The crawler ignores dates that occurin the future as well as dates prior to 1990. The distribution of the age of pagesexhibits an exponential distribution, which can be explained by modeling pagechanges as a Poisson process [Brewington et al. 2000]. Figure 4 shows that thedata is consistent with an exponential distribution, except for the South Koreansample that shows more pages than expected having less than one year of age.
9World Bank, World Development Indicators database (WDI). Online: at <http://devdata.
worldbank.org/wdi2005/>, verified November 2005.
ACM Transactions on Internet Technology, Vol. 7, No. 2, Article 9, Publication date: May 2007.
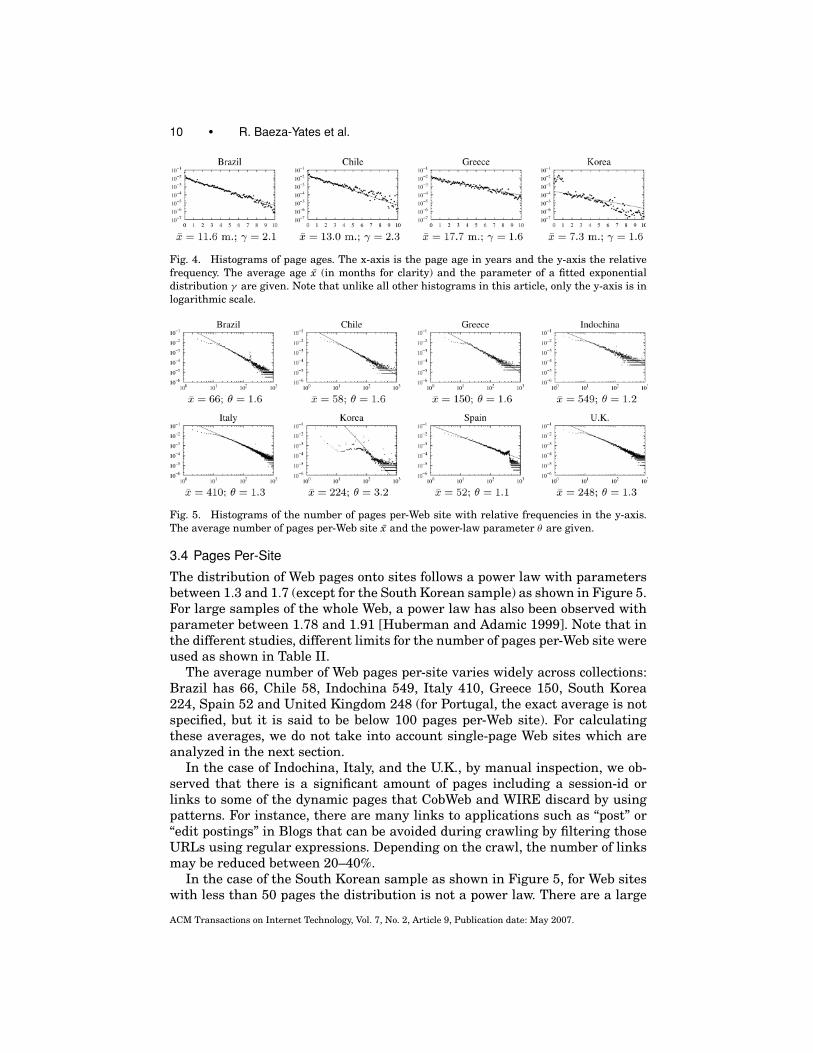
10 • R. Baeza-Yates et al.
Fig. 4. Histograms of page ages. The x-axis is the page age in years and the y-axis the relative
frequency. The average age x (in months for clarity) and the parameter of a fitted exponential
distribution γ are given. Note that unlike all other histograms in this article, only the y-axis is in
logarithmic scale.
Fig. 5. Histograms of the number of pages per-Web site with relative frequencies in the y-axis.
The average number of pages per-Web site x and the power-law parameter θ are given.
3.4 Pages Per-Site
The distribution of Web pages onto sites follows a power law with parametersbetween 1.3 and 1.7 (except for the South Korean sample) as shown in Figure 5.For large samples of the whole Web, a power law has also been observed withparameter between 1.78 and 1.91 [Huberman and Adamic 1999]. Note that inthe different studies, different limits for the number of pages per-Web site wereused as shown in Table II.
The average number of Web pages per-site varies widely across collections:Brazil has 66, Chile 58, Indochina 549, Italy 410, Greece 150, South Korea224, Spain 52 and United Kingdom 248 (for Portugal, the exact average is notspecified, but it is said to be below 100 pages per-Web site). For calculatingthese averages, we do not take into account single-page Web sites which areanalyzed in the next section.
In the case of Indochina, Italy, and the U.K., by manual inspection, we ob-served that there is a significant amount of pages including a session-id orlinks to some of the dynamic pages that CobWeb and WIRE discard by usingpatterns. For instance, there are many links to applications such as “post” or“edit postings” in Blogs that can be avoided during crawling by filtering thoseURLs using regular expressions. Depending on the crawl, the number of linksmay be reduced between 20–40%.
In the case of the South Korean sample as shown in Figure 5, for Web siteswith less than 50 pages the distribution is not a power law. There are a large
ACM Transactions on Internet Technology, Vol. 7, No. 2, Article 9, Publication date: May 2007.

Characterization of National Web Domains • 11
Fig. 6. Histograms of the total size of Web pages per-site. The x-axis is the sum of the sizes of the
pages in Megabytes, and the y-axis is the relative frequency. The average size x and the parameter
for the power law θ are given.
Fig. 7. Histograms of the number of sites per-domain with the relative frequency in the y-axis.
The average x and the power-law exponent θ are given.
number of Web sites with very few pages, mostly built for spamming searchengines. We observe that these are sites in the same domain, each hostnamewith a single or very few documents inside. (For a detailed account of spam,see work by Fetterly et al. [2004] and Gyongyi and Garcia-Molina [2005]). Thedifferences among the distributions disappear if the page sizes are considered,and the power-law exponents are closer to each other as shown in Figure 6 (asin the other graphs, we include only the collections from which we have dataabout page sizes).
3.5 Sites and Pages Per-Domain
In the domains of the studied collections, for example, xxx.gr, there are onaverage between 1.1 and 2.5 sites per-domain, and over 95% of the domainshave only a single Web site, for instance, yyy.xxx.gr. In the case of SouthKorea, the average is much larger (26.1) due to the presence of several spamWeb sites. In this collection, over 20% of the domains have more than 10 Websites which is quite different than other countries. The distribution of sites intodomains is shown in Figure 7.
Another anomaly can also be observed in the collection of pages from Spain,and it is also due to groups of spam Web sites. The differences between thecollections tend to be smaller when the number of pages per-domain is analyzedas is shown in Figure 8.
ACM Transactions on Internet Technology, Vol. 7, No. 2, Article 9, Publication date: May 2007.

12 • R. Baeza-Yates et al.
Fig. 8. Histograms of the number of pages per-domain with the relative frequency in the y-axis.
The average x and the power-law exponent θ are given.
Fig. 9. Distribution of the number of domains per second-level domain for the samples in which
it is not possible to register a second-level domain directly. (*) includes only Cambodia, Myanmar
and Vietnam.
3.6 Second-Level Domains
In the United Kingdom and several countries of Indochina, the country codecannot be used directly, and only third-level domains can be registered (e.g.,under .co.uk or .ac.th). In other countries such as Brazil, the policy is hybrid,and educational and governmental entities can apply for a domain directly un-der BR, for example, www.ufmg.br, while companies and individuals have to usea third-level domain, for example, sbc.org.br or petrobras.com.br. Finally,there are countries, such as Spain or Greece where there is no policy regu-lating the use of second-level domains. Consequently, domains are registereddirectly under the country domain, for instance, .es or .gr, which makes itdifficult to identify the subdomains. Figure 9 shows the distribution of second-level domains in those countries where we were able to differentiate betweensubdomains. To be able to compare data, we have grouped them into commer-cial (COM, CO, LTD and PLC), organizational (ORG, OR and ART), educational (EDU,AC and SCH), government (GOV, GO, NHS and POLICE), individual (PE, ME, ADV andIN) and Network (NET and NE) categories.
ACM Transactions on Internet Technology, Vol. 7, No. 2, Article 9, Publication date: May 2007.

Characterization of National Web Domains • 13
Fig. 10. Histograms of the indegree of Web pages. The number of different pages pointing to a
page is in the x-axis, and the relative frequency in the y-axis. The average indegree x (counting
only pages with inlinks) and the power-law exponent θ are given.
Domains for commercial usage comprise on average of 70% of the registra-tions, ranging from 50% in Thailand to 82% in the UK and 88% in Brazil. Thisis followed by educational and government institutions, with roughly 10% eachon average.
4. LINKS
In this section, we study the Web as a directed graph in which each page is anode, and each hyperlink is an edge.
4.1 Degree
The distribution of inlinks is shown in Figure 10, which is consistent with apower-law distribution.
Indegree links range from 8.3 pages for Chile to 26.2 pages for Indochina and27.9 for Italy, with a median of 14.9 inlinks. The exponent ranges from θ = 1.6for Indochina to θ = 2.1 for Spain, with a median of θ = 1.9 for the eight studiesreported.
In samples of the global Web, an average of 7.2 outlinks per-page has beenobserved [Kleinberg et al. 1999], and the distribution of outlinks is also veryskewed, as shown in Figure 11. The distribution of average outdegree linksranges from 3.6 pages for Spain to 31.8 pages for Indochina and 31.9 pages forItaly, with a median of 18.8 pages.
When examining the distribution of outdegree, we found two differentcurves: one for smaller outdegrees –less than 20 to 30 out-links– and anotherone for larger outdegrees. They both show a power-law distribution and weestimated the exponents for both parts separately. The corresponding exponentvalues for θ1 and θ2 range from θ1 = 0.3 for South Korea to θ1 = 0.9 for Spainwith a median of θ1 = 0.7, and θ2 = 1.9 for Greece to θ2 = 4.2 for South Koreawith a median of θ2 = 2.6.
The fact that for smaller outdegrees there is power-law distribution can beexplained by the same argument that Zipf used, that is, that Web page authors
ACM Transactions on Internet Technology, Vol. 7, No. 2, Article 9, Publication date: May 2007.

14 • R. Baeza-Yates et al.
Fig. 11. Histograms of the outdegree of Web pages. The number of different pages pointed by a
page is in the x-axis and the relative frequency in the y-axis. The average outdegree x (for pages
with at least one outlink) and two parameters for the power law are given: θ1 for pages with few
outlinks (≤ 20–30) and θ2 for pages with more outlinks.
make a minimal effort. However, pages with more outlinks are typically gen-erated by content management systems or Web page generators that are notbound by effort constraints since making a program that generates 100 links isas easy as making a program that generates 1000 links. Consistent with this,we observe that there are more deviations from the power law in the right partof the histograms.
Finally, when looking at the averages of both indegree and outdegree links,we observe an increased number of links from those reported by earlier studies.An explanation for the increase is twofold. Over the past seven years that coverthe AltaVista study of Broder et al. [2000] people have been authoring moreelaborate Web site that have more links. We assert that this is because Website authors have matured, and they also use more links in hopes of increasingtheir PageRank score.
4.2 Ranking
One of the main algorithms for link-based ranking of Web pages is Page-Rank [Page et al. 1998]. We calculated the PageRank distribution for sev-eral collections and found a power law in the distribution of the obtainedscores with exponents between 1.8 and 2.0. In theory, the PageRank exponentshould be similar to the indegree exponent [Pandurangan et al. 2002], andthis is indeed the case. The distribution of PageRank values can be seen inFigure 12.
Finally, in some collections, we also calculated a static version of the HITSscores [Kleinberg 1999], counting only external links and calculating the scoresin the whole graph instead of only on a set of pages. The tail of the distribu-tion of authority score also follows a power law. In the case of hub-score, it isdifficult to assert that the data follows a power law because the frequenciesseems to be much more disperse as can be seen in the top row of Figure 13. The
ACM Transactions on Internet Technology, Vol. 7, No. 2, Article 9, Publication date: May 2007.
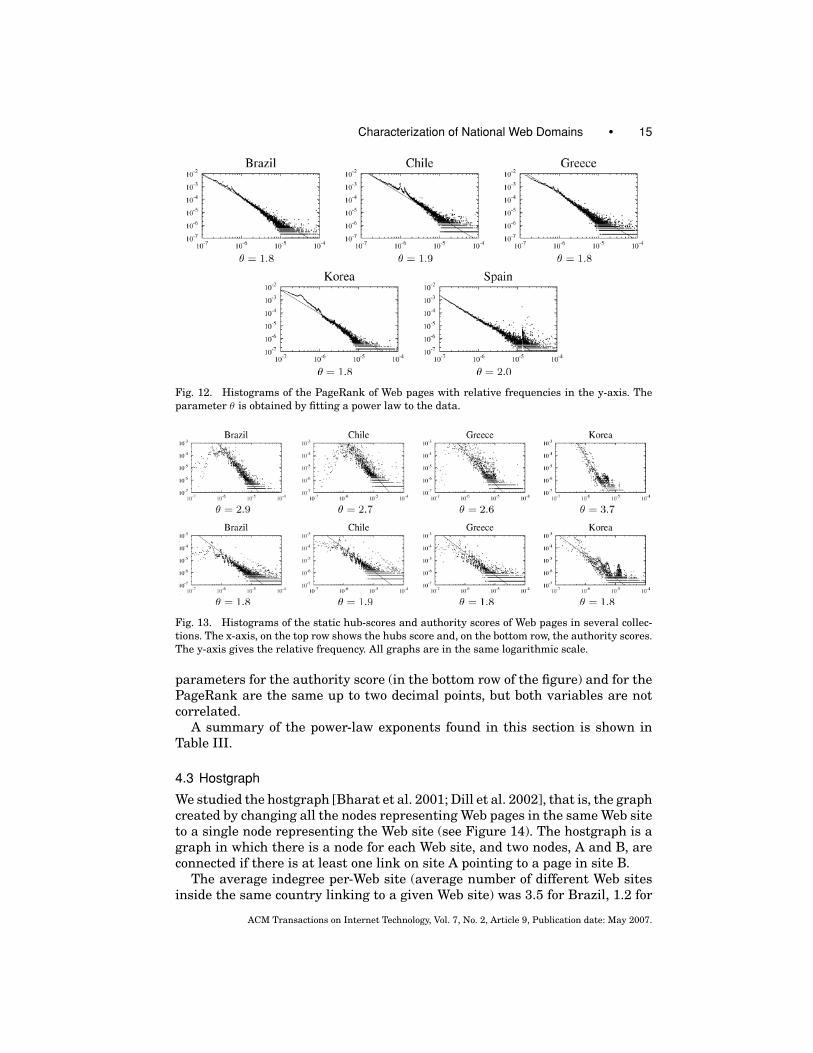
Characterization of National Web Domains • 15
Fig. 12. Histograms of the PageRank of Web pages with relative frequencies in the y-axis. The
parameter θ is obtained by fitting a power law to the data.
Fig. 13. Histograms of the static hub-scores and authority scores of Web pages in several collec-
tions. The x-axis, on the top row shows the hubs score and, on the bottom row, the authority scores.
The y-axis gives the relative frequency. All graphs are in the same logarithmic scale.
parameters for the authority score (in the bottom row of the figure) and for thePageRank are the same up to two decimal points, but both variables are notcorrelated.
A summary of the power-law exponents found in this section is shown inTable III.
4.3 Hostgraph
We studied the hostgraph [Bharat et al. 2001; Dill et al. 2002], that is, the graphcreated by changing all the nodes representing Web pages in the same Web siteto a single node representing the Web site (see Figure 14). The hostgraph is agraph in which there is a node for each Web site, and two nodes, A and B, areconnected if there is at least one link on site A pointing to a page in site B.
The average indegree per-Web site (average number of different Web sitesinside the same country linking to a given Web site) was 3.5 for Brazil, 1.2 for
ACM Transactions on Internet Technology, Vol. 7, No. 2, Article 9, Publication date: May 2007.

16 • R. Baeza-Yates et al.
Table III. Summary of Power Law Exponents in the Graph of Links Between Pages (For
the outdegree, there are two exponents, one for pages with roughly less than 20 outlinks
and one for pages with more outlinks.)
Outdegree HITS
Collection In-degree Small Large Page-Rank Hubs Auth.
Africa 1.92 n/a n/a n/a n/a n/a
Brazil 1.89 0.67 2.71 1.83 2.9 1.83
Chile 2.01 0.72 2.56 1.85 2.7 1.85
Greece 1.88 0.61 1.92 1.83 2.6 1.83
Indochina 1.63 0.66 2.62 n/a n/a n/a
Italy 1.76 0.68 2.52 n/a n/a n/a
South Korea 1.90 0.29 1.97 1.83 3.7 1.83
Spain 2.07 0.86 4.15 1.96 n/a n/a
United Kingdom 1.77 0.65 3.61 n/a n/a n/a
[Broder et al. 2000] 2.1 n/a 2.7 n/a n/a n/a
[Dill et al. 2002] 2.1 n/a 2.2 n/a n/a n/a
[Pandurangan et al. 2002] n/a n/a n/a 2.1 n/a n/a
[Kleinberg et al. 1999] ≈ 2 n/a n/a n/a n/a n/a
Fig. 14. The Web graph (left) can be transformed into a hostgraph (right). The hostgraph is a
representation of the links between different Web sites with multiple links merged.
Chile, 1.6 for Greece, 37.0 for South Korea, and 1.5 for Spain. The distributionof indegree is shown in Figure 15.
By manual inspection, we observed that in Brazil, and especially in SouthKorea, there is a significant use (and abuse) of DNS wildcarding. DNS wild-carding [Barr 1996] is a way of configuring DNS servers so they reply withthe same IP address no matter which host name is used in a DNS query. Forinstance, if example.com is using DNS wildcarding, then string.example.comalways points to the same IP address no matter which string is used. Thistechnique aims at increasing the ranking of a group of pages on-search en-gine’s results by including several keywords in the host part of the URLs. Wehave observed that almost all the domains that use DNS wildcarding use it forspamming with the exception of domains used for providing aliases for Webhosting.
ACM Transactions on Internet Technology, Vol. 7, No. 2, Article 9, Publication date: May 2007.

Characterization of National Web Domains • 17
Fig. 15. Histograms of the indegree of Web sites. The x-axis is the number of different Web sites
pointing to a site and the y-axis the relative frequency. The average indegree x for Web sites with
at least one inlink and the parameter θ of the power law are given.
Fig. 16. Histograms of the outdegree of Web sites. The x-axis is the number of different Web sites
pointed from a site and the y-axis the relative frequency. The average outdegree x for Web sites
with at least one outlink and the parameter θ of the power law are given.
The average outdegree per-Web site (average number of different Web sitesinside the same country linked by a given Web site) was 2.2 for Brazil, 2.4 forChile, 4.8 for Greece, 16.5 for South Korea, and 11.2 for Spain. The distributionof outdegree is shown in Figure 16.
We also measured the number of internal links, that is, links going to pagesinside the same Web site. We normalized this by the number of pages in eachWeb site, to be able to compare values. In the case of Brazil, Chile, and Greece,we observed a combination of two power-law distributions: one for Web siteswith up to 10 internal links per-Web page on average, and one for Web sites with
ACM Transactions on Internet Technology, Vol. 7, No. 2, Article 9, Publication date: May 2007.

18 • R. Baeza-Yates et al.
Fig. 17. Histograms of the average number of internal links. The x-axis is the number of internal
link, normalized by the number of pages in each Web site, and the y-axis is the relative frequency.
The average x and two parameters for the power-law fit θ1 and θ2 are given.
more internal links per-Web page. In the case of South Korea and Spain, moreclosely it resembles a power law with a single parameter, but we include anapproximation with two different parameters for all the collections for consis-tency. The distribution is shown in Figure 17. This is consistent with Figure 11that showed the outdegree of Web pages.
4.4 Web Structure
Broder et al. [2000] proposed a characterization of the structure of the Webgraph (known as the bow-tie model) based on the relationship of each pagewith the larger strongly-connected component (SCC) on the graph. This in-duces a partition of the Web pages: the pages in the larger strongly-connectedcomponent belong to the category MAIN. Starting in MAIN, if we follow linksforward we find OUT, and, if we follow links backward, we find IN. All of theWeb pages which are part of the graph reachable from MAIN, disregardingthe order of links, but that do not fit either in MAIN, IN, nor OUT are part ofthe components called TENDRILS and TUNNEL. A graphic depiction of thesecomponents is shown in Figure 18.
Baeza-Yates and Castillo [2001] showed that this macroscopic structure issimilar at the hostgraph level: the hostgraphs examined here are scale-freenetworks and have a giant strongly-connected component. The distribution ofthe sizes of their strongly-connected components is shown in Figure 19.
In Chile, Greece, and Spain, a sole giant strongly-connected component ap-pears with at least 2 orders of magnitude more Web sites than the followingcomponent. In the case of Brazil, there are two giant SCCs. The larger one is anatural one, containing Web sites from different domains. The second larger isan artificial one, containing only Web sites under a domain that uses DNS
ACM Transactions on Internet Technology, Vol. 7, No. 2, Article 9, Publication date: May 2007.

Characterization of National Web Domains • 19
Fig. 18. Graphic depiction of the bow-tie structure of the Web. The arrows represent the flow of
links.
Fig. 19. Histograms of the sizes of strongly-connected components (SCCs) in the hostgraph. For
readability, SCCs with more than 1,000 sites are marked with a cross. The exponent θ was calculated
by fitting a power law to the smaller SCCs.
wildcarding to create a link farm (a strongly-connected community of mu-tual links). In the case of South Korea, we detected at least 5 large linkfarms. Table IV summarizes the power-law exponents found for the links inthe hostgraph.
Regarding the Web structure, while at the level of pages, the sizes of MAIN,IN, OUT, and TENDRILS are very similar [Broder et al. 2000]. The distributionbetween sites in general gives the component called OUT a larger share asshown in Figure 20(a). OUT is composed of Web sites that can be reached fromthe giant SCC but that do not have many links to other Web sites. This isthe typical case for the Web sites of small- and medium-sized companies ororganizations, which have very few outlinks.
When looking at the size of the sites in each component, it is clear thatWeb sites in component MAIN are larger than the other, as can be seen inFigure 20(b). In the case of the South Korean Web, a possible explanation forwhy the MAIN component is so small is that the largest strongly-connected
ACM Transactions on Internet Technology, Vol. 7, No. 2, Article 9, Publication date: May 2007.

20 • R. Baeza-Yates et al.
Table IV. Power-Law Exponents in the Hostgraph (For the number of internal
links per-page, there are two exponents: one for Web sites with roughly less than
10 internal links per-page on average, and one for Web sites with more internal
links per-page. SCC is the exponent in the distribution of the sizes of
strongly-connected components, excluding the larger one.)
Hostgraph Degree Internal Links Per Page
Collection In Out Small Large SCC
Brazil 1.85 1.92 0.78 2.88 3.93
Chile 1.97 1.73 1.07 3.02 4.05
Greece 2.00 1.55 1.14 2.90 4.20
South Korea 1.21 1.36 1.23 3.38 2.37
Spain 1.80 1.30 1.47 2.50 3.84
[Broder et al. 2000] n/a n/a 2.5 n/a n/a
[Bharat et al. 2001] 1.62–1.73 1.67–1.80 n/a n/a n/a
[Dill et al. 2002] 2.34 n/a 2.1 n/a n/a
Fig. 20. Distribution of the sizes of components in the hostgraph (a) by number of sites in each
component, and (b) by the number of pages in those Web sites.
component in this case is not a natural one but one composed of spam Websites.
Finally, there are a large number of Web sites that are not reachable fromMAIN even if we disregard the direction of links. These isolated components,also called islands, comprise 12% of the sites in Brazil, 46% in Chile, 9% inGreece, 56% in South Korea, and 82% in Spain. This fraction is variable anddepends on the strategy used for finding the starting URLs for the crawler asthe isolated sites can only be found if the exact site name is known in advance,so these percentages are most of the time just lower bounds. When the full listof domains registered in a country is known, or when the starting URLs aretaken from the data from a large search engine, many isolated sites can befound as was the case for Chile and Spain.
It can be argued that an isolated Web site is not so valuable. This is becausethe Web sites that are not connected to the rest of the Web contribute little interms of content. In fact, their number of pages is much smaller: isolated Websites contribute 4% of the pages in Brazil, 1% in Chile, 1% in Greece, 7% inSouth Korea, and 28% in Spain. The percentage of isolated sites in Spain ishigh because: (a) the initial set of sites is very complete, and (b) the initial sitesinclude several .com sites that belong to Spanish companies but do not link to
ACM Transactions on Internet Technology, Vol. 7, No. 2, Article 9, Publication date: May 2007.

Characterization of National Web Domains • 21
Fig. 21. Histogram of URL lengths and fit of a log-normal distribution.
other Spanish sites. Most of the islands in the Spanish Web are outside the .esdomain. Notice that any national study does not take into account links comingfrom other countries so a site that is an island in a country is not necessarilyan island in the whole Web.
5. TECHNOLOGIES
This section includes statistics about the technologies used for building Websites, especially file formats and programming languages.
5.1 URL Length
The distribution of the length of the URLs is important because it can help inthe development of compression schemes. For instance, Suel and Yuan [2001]showed how to compress URLs of 50 bytes of length on average to around 13bytes by exploiting common prefixes.
Including the protocol part, the observed average length of URLs in thestudied samples was 69 for Brazil, 64 for Chile, 81 for Indochina, 79 for Italy,67 for Greece, 62 for Portugal, 67 for Spain, and 76 for the United Kingdom.The distribution of the URL lengths is shown in Figure 21.
We assumed a general log-normal distribution, with probability densityfunction:
f (x) = e−((log((x−θ )/m)2)/(2σ 2))
(x − θ )σ√
2π,
and fitted it to the data. The parameters obtained were: θ (location) = 14.1 ± 2.7,m (scale) = 49.2 ± 3.6, and σ (shape) = 0.43 ± 0.04.
5.2 HTTP Response Code
As most crawlers work by recursively downloading pages and extracting links,there is no guarantee that a request for a given URL will succeed. In fact,several broken links (pages with a “404 Not Found” message) are found duringthe process. The HTTP response code from the Web servers indicates that about80%–85% of the requests succeed, and that this fraction is similar across all
ACM Transactions on Internet Technology, Vol. 7, No. 2, Article 9, Publication date: May 2007.

22 • R. Baeza-Yates et al.
Fig. 22. Distribution of HTTP response codes.
domains as shown in Figure 22. In the figure, the last column comes from datathat was obtained in 1997 and published in Pitkow [1999].
Compared to the 1997 sample, the number of broken links (‘Not found’ inthe figure) appears to be smaller. This may be due to the fact that only thelinks inside the country are checked so we do not detect all the broken links.Also, there is a higher prevalence of soft-404 messages [Yossef et al. 2004]and at this time, other types of redirects to hide broken links probably be-cause the reorganization of the contents of a Web site occurs several timesduring a Web site’s lifetime. Furthermore, the general quality of Web sitesmay have changed, in part by the usage of tools for automating link creationand checking, and due in part to a stronger competition between Web siteowners.
5.3 Document Formats Other Than HTML
HTML is the preferred format for documents on the Web and more than 95%of them are in this format. Other formats such as Adobe PDF and plain textare the most important ones after HTML. Together they account for 70%–85%of the non-HTML files, followed by Microsoft formats such as Word Document(doc) and Power Point slides (ppt). The distribution of non-HTML file types asdetermined by file type extensions (.doc, .pdf, .ppt, .ps, .txt, etc.) is shownin Figure 23 and is rather similar across collections.
5.4 Image Formats
The GIF and JPEG formats comprise over 95% of the images, followed by thePNG format in distant third place. There is evidence suggesting that most ofthe images included in Web pages are not unique; for instance, in Jaimes et al.[2004], it was found that 64% of images appearing in home pages were unique,and only 10% of the images in inner pages were unique.
The distribution of image types is shown in Figure 24. In the case of Austria,the methodology used for obtaining the distribution is different as only thenumber of unique images are counted. In the case of Spain, data is taken froma sample of university Web sites [Alonso et al. 2003].
ACM Transactions on Internet Technology, Vol. 7, No. 2, Article 9, Publication date: May 2007.

Characterization of National Web Domains • 23
Fig. 23. File types of non-HTML documents.
Fig. 24. Image formats. In the case of Austria, only unique images were counted.
5.5 Web Sites that Cannot Be Crawled Correctly
Surprisingly, there is a large fraction of Web sites with only one page down-loaded by the crawlers in all collections: 37% in Brazil, 40% in Chile, 31% inGreece, 29% in Indochina, 29% in Italy, 40% in South Korea, 38% in Portugal,60% in Spain, and 24% in the United Kingdom.
The most common causes for these Web sites are the following:
(1) The navigation relies completely upon Javascript, Flash, or Java. This com-prises about 60% of the one-page Websites on average and is split evenlybetween Flash- and Javascript- based navigations. Most Web crawlers can-not follow links embedded in these programs, so pages that have no regularlinks pointing to them are invisible for search engines.
(2) The home page contains a redirection to another Web site or only linksto external Web sites. This is sometimes done for aliasing, for instance,www.bbcnews.com may be easier to remember than news.bbc.co.uk. Some-times this is also done for spamming, creating hundreds of Web sites withredirects. Web sites with redirects or only external links are about 30% ofthe cases on average.
(3) There is really only one page in the Web site, typically a page that is underconstruction. This is the remaining 10% of the cases on average.
ACM Transactions on Internet Technology, Vol. 7, No. 2, Article 9, Publication date: May 2007.

24 • R. Baeza-Yates et al.
Fig. 25. Distribution of one-page sites.
Fig. 26. Technologies used for Web servers.
Figure 25 depicts the distribution of the types of one-page sites. In the caseof the Brazilian and Spanish Web, there are several large domains that includemultiple redirects to the same page. In the case of the South Korean Web, theauthors removed thousands of spam sites using a more elaborate redirectioninvolving a Flash application.
5.6 Web Server Software
According to Netcraft10, the most used Web server software is Apache with 63%of the sites, and the second most used is Microsoft Internet Information Server(IIS) with 25% of the sites. Figure 26 shows the distribution of Web serversoftware in the studied domains.
In the African sample, the orders are reversed. This means that in particularmarkets there could be important differences when measuring the share ofthese technologies.
5.7 Programming Languages for Dynamic Pages
Some pages on the Web are stored in Web servers and then retrieved by users;these pages are called static pages. Other pages are created whenever they are
10Netcraft Web server survey, accessed May 2006, <http://news.netcraft.com/archives/web_
server_survey.html>.
ACM Transactions on Internet Technology, Vol. 7, No. 2, Article 9, Publication date: May 2007.

Characterization of National Web Domains • 25
Fig. 27. Fraction of dynamic pages written in different programming languages.
Fig. 28. Fraction of Web sites using different programming languages for dynamic pages.
requested, on demand, and they are called dynamic pages. Dynamic pages areused to build Web applications, typically to access data sources that cannot beconverted entirely into HTML pages due to space, privacy, or other constraints.
The first approach to measure the share of each programming language isto count the number of pages with the file extension that is associated witheach programming language. In many systems, extensions can be disguisedby configuring the server to hide them or replace them by another. While wecannot measure how frequent this is, we have no reason to believe that this isdone more frequently for some languages than for others so we do not thinkthat the fact that extensions can be hidden introduces a significant bias inthis measurement. When counting in this way, three different groups appear:Africa, South Korea, and the U.K. are predominately of ASP; Brazil, Chile, andGreece are predominantly of PHP; and Indochina, Italy, and Spain, are in themiddle. Other technologies are much less used as shown in Figure 27.
Another approach is to measure which programming languages are used byeach Web site. Most Web sites use only one programming language, but thereare cases in which several languages are used for different parts of the Website. In Figure 28, the part marked “MIXED” corresponds to Web sites that usetwo or more programming languages, comprising from 5% to 20% of the sites.
ACM Transactions on Internet Technology, Vol. 7, No. 2, Article 9, Publication date: May 2007.
26 • R. Baeza-Yates et al.
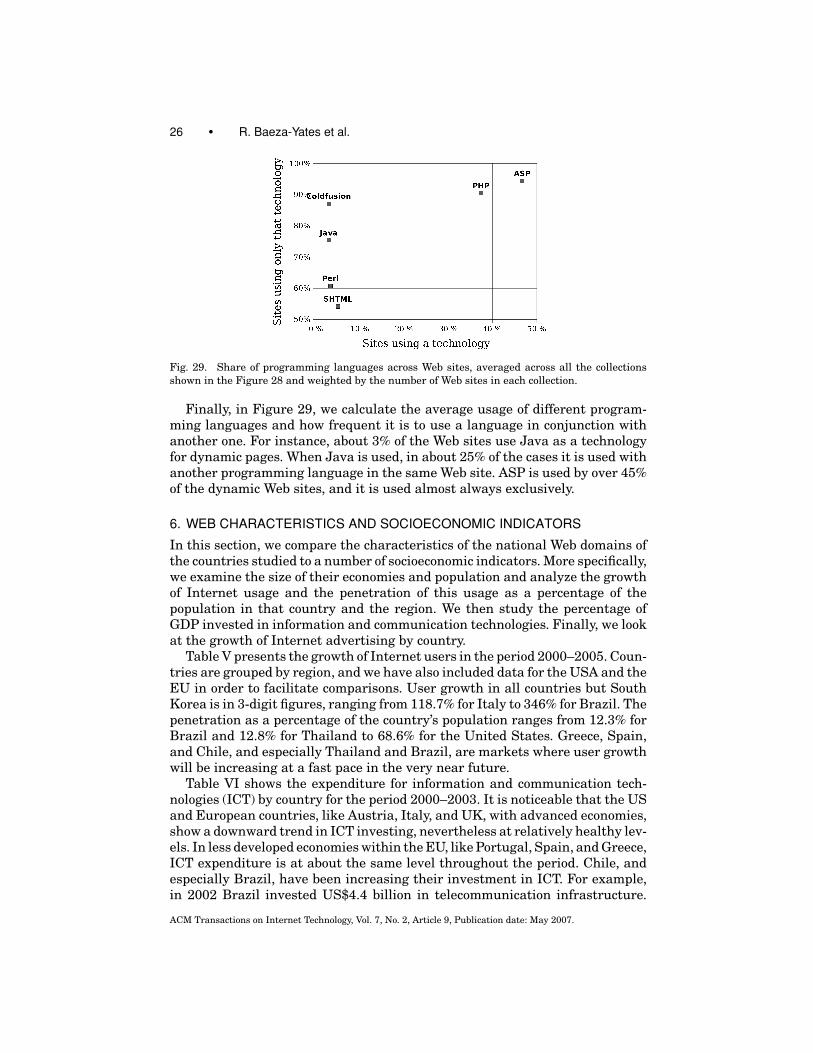
Fig. 29. Share of programming languages across Web sites, averaged across all the collections
shown in the Figure 28 and weighted by the number of Web sites in each collection.
Finally, in Figure 29, we calculate the average usage of different program-ming languages and how frequent it is to use a language in conjunction withanother one. For instance, about 3% of the Web sites use Java as a technologyfor dynamic pages. When Java is used, in about 25% of the cases it is used withanother programming language in the same Web site. ASP is used by over 45%of the dynamic Web sites, and it is used almost always exclusively.
6. WEB CHARACTERISTICS AND SOCIOECONOMIC INDICATORS
In this section, we compare the characteristics of the national Web domains ofthe countries studied to a number of socioeconomic indicators. More specifically,we examine the size of their economies and population and analyze the growthof Internet usage and the penetration of this usage as a percentage of thepopulation in that country and the region. We then study the percentage ofGDP invested in information and communication technologies. Finally, we lookat the growth of Internet advertising by country.
Table V presents the growth of Internet users in the period 2000–2005. Coun-tries are grouped by region, and we have also included data for the USA and theEU in order to facilitate comparisons. User growth in all countries but SouthKorea is in 3-digit figures, ranging from 118.7% for Italy to 346% for Brazil. Thepenetration as a percentage of the country’s population ranges from 12.3% forBrazil and 12.8% for Thailand to 68.6% for the United States. Greece, Spain,and Chile, and especially Thailand and Brazil, are markets where user growthwill be increasing at a fast pace in the very near future.
Table VI shows the expenditure for information and communication tech-nologies (ICT) by country for the period 2000–2003. It is noticeable that the USand European countries, like Austria, Italy, and UK, with advanced economies,show a downward trend in ICT investing, nevertheless at relatively healthy lev-els. In less developed economies within the EU, like Portugal, Spain, and Greece,ICT expenditure is at about the same level throughout the period. Chile, andespecially Brazil, have been increasing their investment in ICT. For example,in 2002 Brazil invested US$4.4 billion in telecommunication infrastructure.
ACM Transactions on Internet Technology, Vol. 7, No. 2, Article 9, Publication date: May 2007.

Characterization of National Web Domains • 27
Table V. Growth of Internet Users and Usage in the Countries Studied (Source: World
Internet Users and Population Statistics. Online: < http://www.internetworldstats.
com/stats.htm>. Retrieved October 2005.)
Growth
Internet (users) Penetration % Users
Region/Country Population Users ’00-’05 users/pop. in Region
European Union 460,270,935 225,006,820 141.5% 48.9% 100.0%
Austria 8,163,782 4,650,000 121.4% 57.0% 2.1%
Greece 11,212,468 3,800,000 280.0% 33.9% 1.7%
Italy 58,608,565 28,870,000 118.7% 49.3% 12.8%
Portugal 10,463,170 6,090,000 143.6% 58.2% 2.7%
Spain 43,435,136 16,129,731 199.4% 37.1% 7.2 %
United Kingdom 59,889,407 36,059,100 134.2% 60.2% 16.0%
North America
United States 296,208,476 203,274,683 113.2% 68.6% 90.8%
South America
Brazil 181,823,645 22,320,000 346.4% 12.3% 45.9%
Chile 15,514,014 5,600,000 218.7% 36.1% 11.5%
Asia
Thailand 65,699,545 8,420,000 266.1% 12.8% 2.6%
South Korea 49,929,293 32,570,000 71.1% 65.2% 10.0%
Table VI. Information and Communication
Technology Expenditure (% of GDP) (Source:
Worldbank WDI Online. Retrieved in October
2005 from Worldbank WDI Online:
<http://devdata.worldbank.org/wdi2005/>.)
Country 2000 2001 2002 2003
Austria 6.0 5.9 5.8 5.3
Brazil 5.6 6.0 6.9 6.7
Chile 6.0 6.2 6.7 6.7
Greece 4.5 4.4 4.4 4.3
Italy 4.8 4.6 4.5 4.1
South Korea 6.8 6.4 6.6 6.6
Portugal 4.4 4.3 4.3 4.2
Spain 4.1 4.1 4.1 3.8
Thailand 3.5 3.6 3.6 3.5
United Kingdom 8.1 7.8 7.6 7.3
United States 9.5 8.7 8.6 8.8
This is yet another signal for the expected growth of the Internet in SouthAmerica.
The growth of the Web is also reflected through the online advertising ex-penditures. Such data in general is difficult to get as the Internet AdvertisingBureau (IAB) is still refining data collection and reporting methodologies. Datafor the United States is relatively more readily available, whereas data for theother countries in the study is sparse and difficult to get. Nevertheless, it isvery informative. Table VII gives advertising revenues for the United Statesfor the period 1995–2004, and Table VIII provides forecasts for U.S. advertisingrevenues for the period 2005–2008. It is evident that the revenues have beenexponential, growing from $55 million in 1995 and increasing to $9.6 billion in
ACM Transactions on Internet Technology, Vol. 7, No. 2, Article 9, Publication date: May 2007.

28 • R. Baeza-Yates et al.
Table VII. Internet Advertising Revenue Report for the U.S. 1995–2005 (Millions of Dollars)
(Source: PriceWaterhouseCoopers LLP. Internet Advertising Bureau (IAB) Internet
advertising revenue report. Retrieved in May 2006 from
<http://www.iab.net/resources/adrevenue/pdf/IAB PwC 2005.pdf>.)
1995 1996 1997 1998 1999 2000 2001 2002 2003 2004 2005
55 267 907 1,920 4,621 8,087 7,134 6,010 7,267 9,626 12,542
Table VIII. Internet Advertising
Revenue Forecasts for the US
2005–2008 (in Billions) (Source: US
Online Advertising Spending,
eMarketer Report, July 2004
(Retrieved in October 2005 from
<http://www.emarketer.com/Report.
aspx?ad spend aug04>.)
2005 2006 2007 2008
US 11.2 13.5 16 18.5
Table IX. European Online Advertising Expenditures by Country
(Millions of Euros) (Source: Information taken from www.iabeurope.
ws: Multimarket European Online AdSpend Figures: Spring 2005
Interactive Advertising Bureau Europe. IAB Europe: multimarket
European online adspend figures. Retrieved in October 2005 from
<http://www.iab.it/fmknet/View.aspx?da id=1730>.)
Country 1998 1999 2000 2001 2002 2003 2004
Greece .. .. 3.14 2.97 4.6 9.5 11
Italy .. .. 125.2 122.4 115.4 113.6 117.1
Spain .. .. .. .. 71.5 72.5 94.5
UK 29 76 231 248 294 562 653
2004, with a forecast to double to $18.5 billion by 2008. Notice that the 2004forecast for 2005 was more than 10% less than the actual value.
The efforts of the Internet Advertising Bureau outside the United Stateshas been collected primarily in Europe. As shown in Table IX, threefold growthof advertising revenues has been observed in the UK and fourfold in Greecebetween 2000 and 2004. Greece’s revenues are at 0.008% of the GDP and Britishrevenues are at 0.042% of the GDP. These figures will continue to grow because,as shown in Table V, the number of Internet users is at 33.9% for Greece and60% for the U.K.
7. CONCLUSIONS
We observed that the results across different collections are always consistentwhen the observed characteristic exhibits a power law in one collection. In thisclass, we include the distribution of page sizes, degrees, link-based scores, etc.On the other hand, for the distribution of Web sites into the components of theWeb graph, our results are mixed and include countries with very similar andvery dissimilar distributions.
Some technological characteristics that are shared across countries are thedistribution of URL lengths, which follow a log-normal distribution, and the
ACM Transactions on Internet Technology, Vol. 7, No. 2, Article 9, Publication date: May 2007.

Characterization of National Web Domains • 29
HTTP response codes, which always show roughly the same ratio of success.The market shares of Web server software and image formats are also verystable across national domains, but other technologies vary more, such as non-HTML file types and programming languages.
Not surprisingly, natural language is the most varying characteristic acrossthe national domains studied. We also found significant differences in the distri-bution of registrations under second-level domains across countries. In severalaspects, the collection of pages from South Korea was significantly differentthan the others; mostly because of a massive presence of spam.
Another important remark is that statistics based in national domains areincomplete in many cases. This is due to three main reasons.
(1) Not all sites use the national domain; this is clear for the USA where the.us domain seldom used, but is also true for Spain and other countries.
(2) There are many unknown domains that are islands.
(3) There are many sites that are not crawlable, and hence their size and con-tents are also unknown.
Using our data, we can approximate the real value of a measure M usingthe value of M for a country domain using:
M(Total) = fd × fis × fnc × M(Known),
where fd , fis, and fnc are estimated factors larger than 1 that depend on thehidden size due to other domains, islands and not-crawlable sites, respectively.For example, for Spain, we can estimate the total number of pages using fd =fnc ≈ 5/3 and fis = 1 as a lower bound. These estimations come from thenumber of sites outside .es, the different number of pages per-site on them,and the percentage of noncrawlable sites that we found. We know that .es has9 million pages so the overall Web of Spain has more than 25 million pages,which means that our study of Spain has at most 64% coverage (we crawled16 million).
Web characterization studies of the Web using a Web crawler generate a viewof the Web that is not what users are accustomed to see. For instance, while aWeb crawler has no problem in downloading a page with 500KB of HTML data(there are some examples), very few users will have the patience to wait for it.Most users have a routine of visiting a few selected, high-quality Web sites on adaily basis and do not browse through obscure and mostly unknown Web pages.Web characterization studies focusing on what users actually see, instead ofwhat is available, would be complementary with crawler-based studies. In thatcase, trace logs should be used for obtaining the Web pages.
Furthermore, the use of socioeconomic indicators in Web characterizationstudies of national Webs supplements the information gathered from thecrawlers and provides additional methods for explaining the behavior andgrowth of the Web.
Finally, any Web comparison is approximate as the Web is not a static ob-ject. Not only is the content constantly growing and changing, but also theconnectivity and server performance changes. In addition, different crawlers
ACM Transactions on Internet Technology, Vol. 7, No. 2, Article 9, Publication date: May 2007.

30 • R. Baeza-Yates et al.
will gather different samples. Nevertheless, in spite of all these factors, webelieve that comparative studies give insight about Web characteristics andtrends.
ACKNOWLEDGMENTS
We worked with Vicente Lopez in the study of the Spanish Web, with FelipeOrtiz, Barbara Poblete and Felipe Saint-Jean in the studies of the Chilean Weband with Felipe Lalanne in the study of the South Korean Web. We also thankthe Laboratory of Web Algorithmics for making their Web collections availablefor research.
REFERENCES
ALONSO, J. L., FIGUEROLA, C. G., AND ZAZO, A. F. 2003. Cibermetria: Nuevas Tecnicas de EstudioAplicables al Web. Ediciones TREA, Spain.
ARLITT, M., FRIEDRICH, R., AND JIN, T. 1999. Workload characterization of a Web proxy in a cable
modem environment. SIGMETRICS Perfor. Evaluat. Rev. 27, 2, 25–36.
BAEZA-YATES, R. AND CASTILLO, C. 2000. Caracterizando la Web chilena. In Encuentro Chileno deCiencias de la Computacion. Sociedad Chilena de Ciencias de la Computacion, Punta Arenas,
Chile.
BAEZA-YATES, R. AND CASTILLO, C. 2001. Relating Web characteristics with link-based Web page
ranking. In Proceedings of String Processing and Information Retrieval (SPIRE). IEEE Computer
Society Press, 21–32.
BAEZA-YATES, R. AND CASTILLO, C. 2002. Balancing volume, quality and freshness in Web crawling.
In Soft Computing Systems—Design, Management and Applications. IOS Press Amsterdam, 565–
572.
BAEZA-YATES, R. AND CASTILLO, C. 2004. Crawling the infinite Web: Five levels are enough. In
Proceedings of the 3rd Workshop on Web Graphs (WAW). Lecture Notes in Computer Science, vol.
3243. Springer, 156–167.
BAEZA-YATES, R. AND CASTILLO, C. 2005. Caracteristicas de la Web chilena 2004. Tech. rep., Center
for Web Research, University of Chile.
BAEZA-YATES, R., CASTILLO, C., AND LOPEZ, V. 2006. Caracteristicas de la Web de Espaa. El Profe-sional de la Informacin 15, 1 (Jan.).
BAEZA-YATES, R. AND LALANNE, F. 2004. Characteristics of the Korean Web. Tech. rep., Korea–Chile
IT Cooperation Center (ITCC).
BAEZA-YATES, R. AND NAVARRO, G. 2004. Modeling text collections and its application to the Web.
In Applied Probability: Recent Advances, Kluwer Academic Publishing.
BAEZA-YATES, R. AND POBLETE, B. 2003. Evolution of the chilean Web structure composition. In
Proceedings of Latin American Web Conference. IEEE Computer Society Press, 11–13.
BAEZA-YATES, R., POBLETE, B., AND SAINT-JEAN, F. 2003. Evolucion de la Web Chilena 2001–2002.
Tech. rep., Center for Web Research, University of Chile.
BARR, D. 1996. RFC 1912: Common DNS operational and configuration errors.
http://www.ietf.org/rfc/rfc1912.txt.
BHARAT, K., CHANG, B. W., HENZINGER, M., AND RUHL, M. 2001. Who links to whom: Mining linkage
between Web sites. In International Conference on Data Mining (ICDM). IEEE Computer Society,
51–58.
BJORNEBORN, L. AND INGWERSEN, P. 2004. Toward a basic framework for webometrics. J. Amer. Soc.Inform. Sci. Techn. 55, 14 (Aug.), 1216–1227.
BOLDI, P., CODENOTTI, B., SANTINI, M., AND VIGNA, S. 2002. Structural properties of the African
Web. In Proceedings of the 11th International Conference on World Wide Web. ACM Press.
BOLDI, P., CODENOTTI, B., SANTINI, M., AND VIGNA, S. 2004. Ubicrawler: A scalable fully distributed
Web crawler. Softw. Practice Exper. 34, 8, 711–726.
BREWINGTON, B., CYBENKO, G., STATA, R., BHARAT, K., AND MAGHOUL, F. 2000. How dynamic is the
Web? In Proceedings of the 9th Conference on the World Wide Web. ACM Press.
ACM Transactions on Internet Technology, Vol. 7, No. 2, Article 9, Publication date: May 2007.

Characterization of National Web Domains • 31
BRIN, S., MOTWANI, R., PAGE, L., AND WINOGRAD, T. 1998. What can you do with a Web in your
pocket? IEEE Data Engin. Bull. 21, 2, 37–47.
BRODER, A., KUMAR, R., MAGHOUL, F., RAGHAVAN, P., RAJAGOPALAN, S., STATA, R., TOMKINS, A., AND WIENER,
J. 2000. Graph structure in the Web: Experiments and models. In Proceedings of the 9thConference on the World Wide Web. ACM Press, 309–320.
CAVNAR, W. B. AND TRENKLE, J. M. 1994. N-gram-based text categorization. In Proceedings of 3rdAnnual Symposium on Document Analysis and Information Retrieval (SDAIR’ 94). 161–175.
DA SILVA, A. S., VELOSO, E. A., GOLGHER, P. B., BERTHIER, LAENDER, A. H. F., AND ZIVIANI, N. 1999.
Cobweb—A crawler for the Brazilian Web. In Proceedings of String Processing and InformationRetrieval (SPIRE). IEEE Computer Society Press, 184–191.
DILL, S., KUMAR, R., MCCURLEY, K. S., RAJAGOPALAN, S., SIVAKUMAR, D., AND TOMKINS, A. 2002. Self-
similarity in the Web. ACM Trans. Intern. Techn. 2, 3, 205–223.
DOWNEY, A. B. 2001. The structural cause of file size distributions. In Proceedings of the 9th IEEEInternational Symposium on Modeling, Analysis, and Simulation of Computer and Telecommu-nications Systems (MASCOTS). IEEE Computer Society Press.
EFTHIMIADIS, E. AND CASTILLO, C. 2004. Charting the Greek Web. In Proceedings of the Conferenceof the American Society for Information Science and Technology (ASIST). American Society for
Information Science and Technology.
EIRON, N., CURLEY, K. S., AND TOMLIN, J. A. 2004. Ranking the Web frontier. In Proceedings of the13th International Conference on the World Wide Web. ACM Press, 309–318.
FETTERLY, D., MANASSE, M., AND NAJORK, M. 2004. Spam, damn spam, and statistics: Using sta-
tistical analysis to locate spam Web pages. In Proceedings of the 7th Workshop on the Web andDatabases (WebDB). 1–6.
GOMES, D. AND SILVA, M. J. 2005. Characterizing a national community Web. ACM Trans. Intern.Techn. 5, 3.
GREFENSTETTE, G. AND NIOCHE, J. 2000. Estimation of english and non-english language use
on the www. In Proceedings of Content-Based Multimedia Information Access (RIAO). 237–
246.
GYONGYI, Z. AND GARCIA-MOLINA, H. 2005. Web spam taxonomy. In 1st International Workshop onAdversarial Information Retrieval on the Web.
HEYDON, A. AND NAJORK, M. 1999. Mercator: A scalable, extensible Web crawler. World Wide WebConference 2, 4 (April), 219–229.
HUBERMAN, B. A. AND ADAMIC, L. A. 1999. Growth dynamics of the World-Wide Web. Nature 399.
JAIMES, A., RUIZ, VERSCHAE, R., BAEZA-YATES, R., CASTILLO, C., YAKSIC, D., AND DAVIS, E. 2004. On
the image content of a Web segment: Chile as a case study. J. Web Engin. 3, 2, 153–168.
KLEINBERG, J. M. 1999. Authoritative sources in a hyperlinked environment. J. ACM 46, 5, 604–
632.
KLEINBERG, J. M., KUMAR, R., RAGHAVAN, P., RAJAGOPALAN, S., AND TOMKINS, A. S. 1999. The Web as
a graph: Measurements, models and methods. In Proceedings of the 5th Annual InternationalComputing and Combinatorics Conference (COCOON). Lecture Notes in Computer Science, vol.
1627. Springer, 1–18.
MITZENMACHER, M. 2003. Dynamic models for file sizes and double Pareto distributions. Intern.Mathe. 1, 3, 305–333.
MODESTO, M., PEREIRA, A., ZIVIANI, N., CASTILLO, C., AND BAEZA-YATES, R. 2005. Um novo retrato da
Web Brasileira. In Proceedings of 32nd SEMISH. So Leopoldo, Brazil, 2005–2017.
PAGE, L., BRIN, S., MOTWANI, R., AND WINOGRAD, T. 1998. The PageRank citation ranking: Bringing
order to the Web. Tech. rep., Stanford Digital Library Technologies Project.
PANDURANGAN, G., RAGHAVAN, P., AND UPFAL, E. 2002. Using PageRank to characterize Web struc-
ture. In Proceedings of the 8th Annual International Computing and Combinatorics Conference(COCOON). Lecture Notes in Computer Science, vol. 2387. Springer, 330–390.
PITKOW, J. E. 1999. Summary of WWW characterizations. WWW 2, 1-2, 3–13.
RAUBER, A., ASCHENBRENNER, A., WITVOET, O., BRUCKNER, R. M., AND KAISER, M. 2002. Uncovering
information hidden in Web archives. D-Lib Magazine 8, 12.
SANGUANPONG, S., NGA, P. P., KERETHO, S., POOVARAWAN, Y., AND WARANGRIT, S. 2000. Measuring
and analysis of the Thai World Wide Web. In Proceeding of the Asia Pacific Advance NetworkConference. Beijing, China, 225–230.
ACM Transactions on Internet Technology, Vol. 7, No. 2, Article 9, Publication date: May 2007.

32 • R. Baeza-Yates et al.
SANGUANPONG, S. AND WARANGRIT, S. 1998. Nontrisearch: Search engine for campus network. In
National Computer Science and Engineering Conference. Bangkok, Thailand.
SUEL, T. AND YUAN, J. 2001. Compressing the graph structure of the Web. In Proceedings of theData Compression Conference DCC. IEEE Computer Society Press.
VELOSO, E. A., DE MOURA, E., GOLGHER, P., DA SILVA, A., ALMEIDA, R., LAENDER, A., NETO, R. B., AND
ZIVIANI, N. 2000. Um retrato da Web Brasileira. In Proceedings of Simposio Brasileiro de Com-putacao. Curitiba, Brasil.
YOSSEF, Z. B., BRODER, A. Z., KUMAR, R., AND TOMKINS, A. 2004. Sic transit gloria telae: Towards an
understanding of the web’s decay. In Proceedings of the 13th Conference on the World Wide Web.
ACM Press.
ZIPF, G. K. 1949. Human Behavior and the Principle of Least Effort: An Introduction to HumanEcology. Addison-Wesley, Cambridge, MA.
Received July 2005; revised February 2006; accepted July 2006
ACM Transactions on Internet Technology, Vol. 7, No. 2, Article 9, Publication date: May 2007.