Characterization of Maize Producing Households in Balaka ...
56
Drought Tolerant Maize for Africa (DTMA) Project Country Report – Household Survey Julius H. Mangisoni, Samson Katengeza, Augustine Langyintuo, Roberto La Rovere and Wilfred Mwangi Characterization of Maize Producing Households in Balaka and Mangochi Districts in Malawi
Transcript of Characterization of Maize Producing Households in Balaka ...

Drought Tolerant Maize for Africa (DTMA) Project
Country Report – Household Survey
Julius H. Mangisoni, Samson Katengeza, Augustine Langyintuo,
Roberto La Rovere and Wilfred Mwangi
Characterization of Maize Producing Households
in Balaka and Mangochi Districts in Malawi

The International Maize and Wheat Improvement Center, known by its Spanish acronym, CIMMYT® (www.cimmyt.org), is an international, not-for-profit research and training organization. With partners in over 100 countries, the center works to sustainably increase the productivity of maize and wheat systems to ensure global food security and reduce poverty. The center's outputs and services include improved maize and wheat varieties and cropping systems, the conservation of maize and wheat genetic resources, and capacity building. CIMMYT belongs to and is funded by the Consultative Group on International Agricultural Research (CGIAR) (www.cgiar.org) and also receives support from national governments, foundations, development banks, and other public and private agencies. CIMMYT is particularly grateful for the generous, unrestricted funding that has kept the center strong and effective over many years. © International Maize and Wheat Improvement Center (CIMMYT) 2010. All rights reserved. The designations employed in the presentation of materials in this publication do not imply the expression of any opinion whatsoever on the part of CIMMYT or its contributory organizations concerning the legal status of any country, territory, city, or area, or of its authorities, or concerning the delimitation of its frontiers or boundaries. The opinions expressed are those of the author(s), and are not necessarily those of CIMMYT or our partners. CIMMYT encourages fair use of this material. Proper citation is requested.
The Drought Tolerant Maize for Africa (DTMA) Project is jointly being implemented by the International Maize and Wheat Improvement Center (CIMMYT) and the International Institute of Tropical Agriculture (IITA). Its funded by the Bill & Melinda Gates Foundation and the Howard G. Buffett Foundation. The project is part of a broad partnership also involving national agricultural research and extension systems, seed companies, non-governmental organizations (NGOs), community-based organizations (CBOs), and advanced research institutes, together known as the DTMA Initiative. Its activities build on longer-term support by other donors, including the Swiss Agency for Development and Cooperation (SDC), the German Federal Ministry for Economic Cooperation and Development (BMZ), the International Fund for Agricultural Development (IFAD), and the Eiselen Foundation. The project aims to develop and disseminate drought tolerant, high-yielding, locally-adapted maize varieties and to reach 30–40 million people in sub-Saharan Africa with these varieties in 10 years.
Correct citation: Mangisoni, J.H., S. Katengeza, A. Langyintuo, R.L. Rovere and W. Mwangi. 2011. Characterization of Maize Producing Households in Balaka and Mangochi Districts in Malawi. Country Report – Malawi. Nairobi: CIMMYT. This report is presented without a thorough peer review with the main purpose of making data and information rapidly available to research teams and partners in the Drought Tolerant Maize for Africa (DTMA) project and for use in developing future, peer-reviewed publications. Readers are invited to send comments directly to the corresponding author(s). The views expressed in this report are those of the authors and do not necessarily reflect opinions of CSIR/SARI, IITA, other partners, and/or donors.

ii
Drought Tolerant Maize for Africa (DTMA) Project
Country Report – Household Survey
Julius H. Mangisoni1*, Samson Katengeza1, Augustine Langyintuo2, Roberto La Rovere3 and Wilfred Mwangi4
October 2011
1Dept of Agricultural & Applied Economics, Bunda College of Agriculture, University of Malawi 2International Maize and Wheat Improvement Center (CIMMYT), Harare Zimbabwe; present
affiliation: Alliance for a Green Revolution in Africa (AGRA), Nairobi, Kenya 3CIMMYT, Addis Ababa, Ethiopia
4CIMMYT, Nairobi, Kenya *Corresponding Author: Tel: +265-1 277 419 (off); e-mail: [email protected]
Characterization of Maize Producing Households in
Balaka and Mangochi Districts in Malawi

iii
Contents
Tables .......................................................................................................................................... iv Figures .......................................................................................................................................... v Acronyms .................................................................................................................................... vi Abstract ....................................................................................................................................... vii Foreword .................................................................................................................................... viii Acknowledgements ..................................................................................................................... ix 1.0 Introduction ......................................................................................................................... 1 2.0 Materials, methods and background information ............................................................... 3
2.1 Sampling and data collection ....................................................................................................... 3 2.2 Data Analysis ................................................................................................................................. 3 2.3 Study area ....................................................................................................................................... 6 2.3.1 Agro-climatic characterization of survey districts ........................................................................ 6 2.3.2I mpacts of climate change on African agricultural production ................................................... 10 2.3.3 Approaches to assess the impacts of climate change on African agriculture ................................ 12
3 Household characteristics ................................................................................................. 13
3.1 Categorizing household access to capital assets ..................................................................... 13 3.2 Human capital .............................................................................................................................. 14 3.3 Natural capital .............................................................................................................................. 17 3.4 Physical capital ............................................................................................................................. 19 3.5 Financial capital ........................................................................................................................... 20 3.6 Institutional and Social capital................................................................................................... 21
4 Household livelihood strategies ........................................................................................ 23
4.1 Crop production and marketing ............................................................................................... 23 4.2 Livestock production and marketing ....................................................................................... 24 4.3 Income and Expenditure Profiles of Households ................................................................. 25 4.4 Outlook of livelihoods ............................................................................................................... 26 4.4.1 Households perception about production risk and their coping mechanism ................................. 32 4.4.2 Households’ perception about price risk and their coping mechanism ......................................... 36
5 Technology use in crop production ................................................................................... 39
5.1 Input use by farm households ................................................................................................... 39 5.2 Determinants of adoption of improved maize seed .............................................................. 39
6 Conclusions and recommendations................................................................................... 42 References .................................................................................................................................. 44

iv
Tables
Table 1. Descriptive statistics of sample respondents. .............................................................................. 6
Table 2. Selected survey districts and agro-climatic characteristics. ..................................................... 7
Table 3. Total variance explained using PCA. ......................................................................................... 14
Table 4. Descriptive statistics of sample households. ............................................................................. 15
Table 5. Descriptive statistics of sample households. ............................................................................. 16
Table 6. Access to farm land by gender (acre). ........................................................................................ 17
Table 7. Determinants of cultivated farm size in study area. ................................................................ 18
Table 8. Types of dwelling used by households in study area. ............................................................. 20
Table 9. Asset ownership by households in study area. ......................................................................... 20
Table 10. Access to credit by households in study area. ........................................................................ 21
Table 11. Sources of institutional support to households in study area. ............................................. 22
Table 12. Access to field demonstrations in study area.......................................................................... 22
Table 13. Land use by households in study area. ..................................................................................... 23
Table 14. Average livestock holding in tropical livestock units by different wealth classes. ........ 25
Table 15. Sources of household income. ................................................................................................... 25
Table 16. Expenditure patterns of households (MK). ............................................................................. 26
Table 17. Strategies to enhance livelihood outcomes in study area. .................................................... 27
Table 18. Type of actions sought by households to enhance livelihood outcomes in study area. . 28
Table 19. Threats and constraints for improving livelihoods of households in study area. ............ 29
Table 20. Household food availability. ...................................................................................................... 30
Table 21. Household food availability by wealth groups ........................................................................... 30
Table
22. Important coping mechanisms against food shortages at the household level in the study area .......................................................................................................................................................... 31
Table 23. Perceived shocks to household livelihoods in study area. ................................................... 32
Table 24. Major crop production risks farmers face in study area. ...................................................... 33
Table 25. Adjustment in crop portfolio to mitigate selected production risks in study area. ......... 35
Table 26. Major crop and livestock price risks farmers face in study area. ....................................... 37
Table 27. Adjustment in crop portfolio to mitigate selected price risks. ............................................ 38
Table 28. Agro-chemical use by households in study area. ................................................................... 39
Table 29. Factors influencing the adoption of improved maize cultivars. .......................................... 41

v
Figures
Figure 1: Map of Malawi and the study districts ........................................................................................... 6
Figure 2: Distribution of wealth index ranking of households ................................................................. 13
Figure 3: Probability distribution of households within wealth categories by gender ........................... 14
Figure 4: Proportional distribution of farm land by wealth groups ......................................................... 18
Figure 5a,b: Dynamics of farm size over time in study area ...................................................................... 19
Figure 6: Distribution of land area among crops ........................................................................................ 24
Figure 7: Production risk coping risk strategies in study area ................................................................... 34

vi
Acronyms
ADMARC : Agricultural Development and Marketing Corporation
AEDO : Agricultural Extension and Development Office
AIDS : Acquired Immune-deficiency Syndrome
AOGCM : Atmospheric Ocean General Circulation Model
DTMA : Drought Tolerant Maize for Africa
EPA : Extension Planning Area
GIS : Geographic Information System
GNP : Gross National Product
GOM : Government of Malawi
GPS : Global Positioning System
HIV : Human Immune-deficiency Virus
IMF : International Monetary Fund
IPCC : Intergovernmental Panel on Climate Change
ITCZ : Inter-Tropical Convergence Zone
masl : Meters above sea level
NGOs : Non-governmental Organizations
NRCM : National Research Council of Malawi
NSO : National Statistics Office
OPV : Open Pollinated Variety
PCA : Principal Component Analysis
RATES : Regional Agricultural Trade Expansion Support Program
SFFRF : Smallholder Farmers Fertilizer Revolving Fund
SSA : Sub-Saharan Africa
WB : World Bank

vii
Abstract
Current global climatic changes have resulted in frequent occurrences of droughts and floods, a scenario that has affected agricultural production, particularly in sub-Saharan Africa. This study reports on the results from a household survey in the Balaka and Mangochi Districts of Malawi. The overall objective of the study was to characterize the maize producing households and to assess the adoption of improved maize varieties in Malawi, through an understanding of the households’ access to assets, household livelihood strategies, and the production and price risks that farmers face.
The study has shown that households’ access to livelihood capitals such as human, natural, physical, financial and institutional is limited in the two districts with increasing land scarcity. Maize is the most popular crop. The most common maize varieties are local open pollinated varieties (OPVs) and hybrids. The major input sources for crop production are the Agricultural Development and Marketing Corporation (ADMARC), Agora, Kulima Gold, and traders/vendors. Major shocks are droughts and floods while prominent production risks are price and yield fluctuations, and fertilizer availability and affordability. To mitigate such risks, farmers change cropping area of a given crop, and engage in crop diversification and off-farm activities.
The key issue emerging from this study is that climatic factors such as droughts and floods pose a challenge to agricultural production in Mangochi and Balaka, and Malawi as a whole. The continued changes in the global climate are a serious threat to Malawi’s food security and poverty reduction objectives. As such, there is need to support actions that facilitate the ability of the agricultural sector to cope with climate changes. The promotion of improved drought tolerant and early maturing maize varieties seems a good entry point.

viii
Foreword Maize is Africa’s most important cereal crop. It is particularly vital for more than 300 million people in sub-Saharan Africa (SSA) whose livelihoods are threatened by recurrent droughts responsible for crop failures. Considering the devastating impact of droughts on food security and economic development in SSA, effective solutions are of uttermost importance, especially as the situation is set to worsen as climate change progresses.
The Drought Tolerant Maize for Africa (DTMA) initiative aims to address this challenge. It joins the efforts of people, organizations and projects supporting the development and dissemination of drought tolerant maize in 13 countries in SSA. The initiative is supported by the Bill & Melinda Gates Foundation and the Howard G. Buffett Foundation. For further information about the initiative, refer to the project website (http://dtma.cimmyt.org).
Developing, distributing and cultivating drought tolerant maize varieties in SSA is a highly relevant intervention to reduce vulnerability, food insecurity and the damage to local markets caused by food aid. However, for this to succeed, it needs to be embedded in the local reality. For this purpose, each of the participating countries was assisted in conducting a community assessment and household survey in the target areas. The report presents the findings of the household survey, which serves as a baseline and characterizes the maize producing households in the Balaka and Mangochi Districts of Malawi.

ix
Acknowledgements
This country study was funded by the DTMA project. During the course of the study, the authors benefitted from constructive contributions from Girma Tesfahun Kassie, Olaf Erenstein and D. Sanogo, among others. The authors would also like to thank staff of the Ministry of Agriculture and Food Security and Bunda College for backstopping the study. They also recognize the Ministry of Local Government, and the Balaka and Mangochi District Assembly staff for supplying important statistics. Finally, the authors thank the data entry clerk and enumerators for their input in this report and all the farmers for sparing their time to respond to our numerous questions.

1
1.0 Introduction
Agriculture remains the key sector in most African countries for sustainable food security and poverty reduction (Tostăo et. al, 2007). However, the sector’s performance has been negatively affected in recent years due to adverse weather, biological, socio-economic, institutional and cultural constraints, and deficiencies in farmers’ management practices (Okello-Uma and Bohloa, 2008). The recurring natural calamities such as droughts and floods, accompanied by poor macro-economic performance, result in continued low productivity in the agricultural sector which eventually leads to chronic food insecurity among the smallholder farmers in the region (Mangisoni, 2007).
African agriculture is characterized by high levels of vulnerability to climate change (Hassan and Nhemachena, 2008) because the region endures high heat and low precipitation and farmers rely on basic technology (Kurukulasuriya and Mendelsohn, 2008a). As such, continued changes in the world’s climate - especially temperature and precipitation - at rates that are projected to be unprecedented in recent human history (Thornton et.al. 2008), threaten the success of African economies and the realization of sustainable food security.
In sub-Saharan Africa (SSA), maize is the main food crop. In Malawi, for example, availability of the commodity equates to food security, with a small proportion of the population depending on cassava and rice. It occupies 70% of the cultivated land and is grown by 97% of the farming households (NSO, 2006). Maize production is dominated by smallholder farmers and unlike estates, all smallholders grow maize for home consumption (Ng’ong’ola et al. 1997). Most of the smallholder acreage is under low-yielding local varieties as opposed to hybrid varieties (RATES, 2003). As such, climate change, and especially constant droughts, poses a challenge to maize production in Malawi and SSA as a whole. About 50% of the maize area in east and southern Africa is affected by drought compared to 35% in west and central Africa. Drought cripples the livelihoods of a large number of people; it is a major economic and social burden that slows economic growth and makes escape from poverty enormously difficult. As such, improved technologies such as drought-tolerant (DT) maize varieties are important for reducing the grinding economic burden of drought in Africa. Hence the promotion of Drought-Tolerant Maize for Africa (DTMA) project can be viewed as a welcome additional solution to the long standing problem of low productivity caused by frequent droughts.
DTMA project focuses on development and dissemination of DT maize varieties in Africa, thereby reducing poverty. The goals of the project are: to develop maize germplasm with 1Mt/ha yield increase under drought; increase maize productivity under smallholder conditions by 20-30%; reach 30-40 million farmers in SSA;, and add US$160-200 million of grain annually in drought-affected areas within the next 10 years. The project calls for broadening of the genetic basis for DT maize; developing tools which accelerate the breeding process; and overcoming bottlenecks to give a greater number of farmers in drought prone areas access to DT maize.
This report presents the findings of a household survey in the maize producing households in Balaka and Mangochi Districts in Malawi—part of the project's medium drought risk zone (20-40 % probability of failed season [PFS]) target area. It complements an earlier community assessment in the same area (Mangisoni et al, 2010).
The purpose of this study was to characterize the maize producing households and to assess the adoption of improved maize varieties. This study was also designed to collect baseline data on farm households to construct indicators that could be used to subsequently measure the impact of the adoption of improved maize varieties.

2
This report is organized as follows: the preceding section presents the sampling and data collection procedures, followed by a brief description of the agro-climatic characterization of the survey locations and some background information on climate change in SSA. Section three characterizes the households in the study districts, whilst section four profiles their livelihood strategies, income and expenditure, and the impact of shocks. Section five covers farmers’ use of technology in crop production, particularly selection of maize varieties. Section six provides the conclusions of the study.

3
2.0 Materials, methods and background information
2.1 Sampling and data collection Stratified random sampling procedures were used in this study to obtain unbiased, efficient, and consistent estimates of the target population. It is also cheaper and easier in terms of administration and transportation to deal with administrative districts, which are also used by the Ministry of Agriculture for its activities. Firstly, Balaka and Mangochi districts in the southern Malawi were purposively sampled (Figure 1). Secondly, all the names of the villages in the two districts were listed, and 12 randomly selected (six in each district: Dinala, Govati, James, Lemu, Malula, and Mulama in Balaka; Chimba-Mpasuka, Chiutula-Chinyenye, Kapyepye, Kausi, Kawejere and Lundu in Mangochi). Thirdly, the corresponding farm families for the 12 villages were also listed and 150 farm households randomly selected, with the majority of the respondents being female
. The sample size in each of the villages was proportional to village size:
NS
iin 150*=
(1)
where
ni is the sample size for village i Si is the number of farm families in village i N is the total number of farm families in all the 12 villages
Data collection was undertaken using a structured questionnaire using enumerators within a period of 120 days in 2008. The enumerators were trained on techniques of administering a questionnaire for collecting socio-economic data for a period of one week preceding the survey. The selected smallholder farmers were asked questions on their socio-economic characteristics, household resources, and composition of the household. Information on households’ access to capital assets, land, and credit institutional support was also requested. During interviews, households were asked about crop production in terms of sources of inputs, disposal of crops harvested, and marketing of crops. The questionnaire also explored some important shocks farmers face and how they cope with such disturbances, including crop and livestock production and marketing risks as well as how households adjust to mitigate such risks. The primary data collection was complemented with secondary information, including that from the districts’ Agricultural Extension and Development Office (AEDO).
2.2 Data Analysis The data generated was analyzed in different ways to explain the various aspects of the livelihoods of the farming communities in the study districts. Mainly, descriptive statistics were employed to characterize the socioeconomic and biophysical features of the households. Principal Component Analysis (PCA) was also used to generate the wealth indices for each household based on fixed asset and livestock endowments. This asset-based method was employed following the rich literature base that highlights the difficulty and irregularities of wealth indicators based on reported income and expenditure data. According to Montgomery et al (2000), the collection of accurate income data is quite demanding as it requires extensive resources for household surveys. In some cases, an

4
indicator of income is difficult to acquire. For example, income information does not capture the fact that people may have income in kind, such as trade-in crops (Cortinovis et al, 1993).
Therefore, asset based indicators have become quite common in characterizing welfare states of people (Filmer and Prichett, 2001; McKenzie, 2003).
PCA is a statistical procedure used to reduce the dimensions of a data set in terms of aggregating variables through orthogonal linear combinations of the variables. Mathematically, from an initial set of n correlated variables, PCA creates orthogonal components, where each component is a linear weighted combination of the initial variables. For n assets and livestock, for instance:
1 11 1 12 2 1n n
m m1 1 m2 2 mn n
PC a X a X ... a X
PC a X a X ... a X
= + + +
= + + + (2)
where amn represents the weight for the mth principal component and the nth variable.
As we used the original data, the weights for each principal component are given by the eigenvectors of the covariance matrix. The correlation matrix could be used if the data were standardized. Using the scores generated by the first principal component and the mean and standard deviation of the original data set, the wealth indices were computed using the formula:
∑ i
n
j i ij ii
W = [γ * (x - x )/δ ] (3)
where, Wj is the wealth index for each household; iγ represents the weights (scores) assigned to the n assets and livestock on the first principal component; ijx is the original observation of asset i in
household j, i
x is the mean holding of asset i in the sample, of each of the n variables; and iδ the standard deviation of holding of each of the assets in the sample. The wealth indices were used to categorize the households into three wealth classes. Wealth class one is the poor households; their indices ranged from the negative minimum to the mean of the negative indices. The rich wealth class comprised households with indices that are above the average of the positive wealth indices. Those households with indices between the mean values of the negative and positive wealth indices were classified as middle income. The data analysis also included econometric modeling of the factors that influence adoption decisions and then the intensity of adoption. The nature of adoption and intensity of adoption decisions, and hence the factors that influence the decisions, are very much related. In addition, the intensity of adoption is modeled only for those households who have already adopted, making the sample restricted. This obviously implies the selection bias the intensity of adoption modeling will suffer if modeled independently. Accordingly, we estimated Heckman two-stage model whereby our outcome (intensity of adoption) equation was modeled with the selection (improved maize

5
adoption) model. Adoption decision denotes whether the household has grown improved maize variety on its farm, and intensity implies proportion of land allocated to improved maize. Following Cameron and Trivedi (2005) the heckman two stage model is specified as follows: The adoption decision can be denoted by a latent variable ( *
1y ) and the latent variable for the
intensity of adoption ( *2y ) is observed if *
1y . Therefore, *1y determines whether a household has
adopted improved maize variety, and *2y determines the proportion of land allocated to improved
maize, and *1y ≠ *
2y . The two equation model with a selection model for adoption is specified as:
≤
*1
1 *1
1if y > 0y =
0 if y 0 (4)
and a resultant intensity of adoption equation for y2, where
≤
* *2 1
2 *1
y if y > 0y =
- if y 0 (5)
Therefore, the classical version of the model is linear with additive errors,
*1 1
*2 2
y = +ε
y = +ε
'1 1
'2 2
xβ
xβ (6)
with the two error terms possibly correlated. It is assumed, however, that the correlated errors are jointly normally distributed and homoskedastic, i.e.:
1 212
12 22
ε 1σ0N ,
σ σε 0 (7)
Where the normalization 1=2
1σ is used because only the sign of *1y is observed.
The likelihood function of this model is given as:
{ } { }≤∏1i1i
n y1-y* * *1i 2i 1i 1i
i=1
L = Pr(y 0) f(y y > 0)×Pr(y > 0) (8)
Where the first term is the contribution when ≤*
1iy 0 , because then 1iy = 0 , and the second term is
the contribution when *1iy > 0 .

6
2.3 Study area 2.3.1 Agro-climatic characterization of survey districts Balaka District
Balaka is one of the 13 districts in the Southern Region of Malawi (Figure 1; Table 1). It is 625 meters above sea level (masl). ,Balaka district is divided into six Extension Planning Areas (EPAs). Each EPA has approximately eight sections. There are 532 villages and 91 Group Village Headmen in the district. According to the key informant, the Agricultural Extension and Development Officer (AEDO), the total population of the district is 314,000 people. Yao, Ngoni, Sena, Lomwe, and Nyanja are the major ethnic groups in the district. The Yao ethnic group, accounting for 50% of the population, is by far the largest group in the district. The district is 60% Christian.
Table 1. Descriptive statistics of sample respondents.
Descriptive Statistic Mangochi Balaka Total Frequency % Frequency % Frequency % Respondents 89 61 150 Gender
Male 18 20.2 26 42.6 44 29.3 Female 71 79.8 35 57.4 106 70.7
Figure 1: Map of Malawi and the study districts.
Balaka District
Mangochi District

7
Balaka is predominantly in the rain shadow area of Malawi. The minimum level of rainfall registered is 700mm and the maximum is 1100 mm, with an average of 800 mm of rainfall for the district. Rainfall in Balaka is determined by prevailing winds from the South East. The minimum temperature is 140C and the maximum is 320C. On average, Balaka has 35 rainfall days per year, with frequent dry spells and droughts.
Balaka District has a total area of 211,716 hectares (ha), of which 96,557 ha is cultivable. Approximately 94% of the households own land, which is typically acquired through purchase or inheritance. It is estimated that a typical household in the district owns 0.8 ha. The amount of land under annual crops such as maize, rice, sorghum, millet, pigeon peas, cotton, cassava and sweet potatoes is estimated at 28, 204 ha. Land under perennial crops is 10, 300 ha, giving a total cultivated land area of 38, 504 ha. Grazing land – wetlands and floodplains - in the district accounts for 31, 757 ha. Approximately, 26, 654 ha are not suitable for cultivation due to rocks and poor access. Forests account for 23, 289 ha.
Table 2. Selected survey districts and agro-climatic characteristics.
Agro-climatic Characteristics Balaka Mangochi
North (Latitude) 140 59.295'' 140 28.849'' East (Longitude) 0340 57.448'' 0350 16.296''
Altitude (masl) 625 492 Minimum rainfall (mm) 700 658 Maximum rainfall (mm) 1100 1303 Average rainfall (mm) 800 983 Minimum temperature (0ºC) 14 14.5 Maximum Temperature (0ºC) 32 33.5
Mangochi District
Mangochi District is located at an altitude of 492 meters above sea level (Table 2). The district is bordered by Lake Malawi in the North, Ntcheu and Balaka districts in the south-west, Dedza in the north-west, Machinga in the south, and Mozambique in the east. Mangochi has 11 EPAs and 88 Sections. There are 725 villages in the district with a total population of 778,338 people or 220,020 farm families. The district is predominantly occupied by the Yao ethnic group and over 90% of the people are Muslims.
Mangochi has a minimum rainfall of 658 mm. The maximum amount of rainfall ever registered in the district is 1303 mm; the average level is 983 mm. Spatial and temporal differences in rainfall are due to the geographical position of the district in relation to the rain bearing winds. There are hills and valleys in the district, with few trees due to deforestation. This makes the district prone to high speed winds and sudden changes in temperature and rainfall. The minimum temperature is 14.50C and the maximum is 33.50C.
The total cultivable land is 407,745 ha within a total land area of 627,300 ha. The proportion of households that have right to land is 90%. A typical household owns 1.02 ha of land.
Land under annual crops is 197,427 ha while that under perennial crops is 27,960 ha. Arable land accounts for 329,379 ha, with 231,811 ha under smallholder farming and 97,568 under estate

8
farming. The grazing land area is 75,450 ha, and is predominantly wetlands. The total cultivated land is 225, 387 ha and land under forest is 155,644 ha.
Malawi Malawi is a land-locked country in southern Africa, lying between latitudes 9o-18o south and longitudes 33o-36o east. It borders Tanzania in the north and northeast, Mozambique in the south and east, and Zambia in the west. It has a total surface area of 11.8 million ha out of which the land area is 9.4 million ha (80%) and the remaining 2.4 million ha (20%) is water (principally dominated by Lake Malawi). Of the 9.4 million ha, 1.8 is public land, 1.2 is estate land, 0.3 is urban land, and 6.1 is customary land. Further, out of the 9.4 million ha, 2.9 million ha (31%) is suitable for rain-fed agriculture, 3.0 million ha (32%) is marginal land, and 3.5 million ha (37%) is unsuitable for arable farming under traditional management practices. As a result of rapid population growth, the total cultivated area, including short-term fallows, has almost doubled to 4.6 million ha in the last 25 years. Of the remaining 1.1 million ha of suitable land, 600,000 ha are under national parks, game and forest reserves. Of the total cultivated land area in Malawi, about 2 million ha (15%) can potentially be irrigated (GOM, 2003).
In broad terms, Malawi experiences a tropical continental type of climate that is characterized by a single rainy season lasting from November to April, and a distinct dry season extending from May to October. Generally, it is cool and dry from May to August, warm and dry from September to November, and warm and wet from November to April (GOM, 2003).
Rainfall. The mean annual rainfall in Malawi ranges between 500 mm in low-lying marginal areas, such as the Shire Valley, to well over 3000 mm in the high altitude plateaus, such as Mulanje and Nyika Plateaus. The mean annual rainfall distribution pattern for Malawi is highly influenced by topography and proximity to the Indian Ocean and Lake Malawi. Rain shadow areas, such as the Shire Valley, the western parts of the Shire Highlands, Lake Chilwa and the north-western parts of the Viphya and Nyika Plateaus, experience the lowest total annual rainfall. The highest total annual rainfall is recorded in high altitude Highlands such as Mulanje, Thyolo, Nyika, Misuku and Viphya Plateaus, and some areas along the Lakeshore Plain such as Nkhata Bay and north Karonga. On average, 70% of the country receives between 800 and 1,200 mm of rain per year, which is adequate for rain-fed agriculture. In spite of this, the rainfall distribution pattern is often uneven, unpredictable and quite erratic; especially for rain shadow areas.
Temperature. The mean annual minimum and maximum temperatures for Malawi range from 12 ºC to 32 oC. The highest temperatures occur at the end of October or early November, and the lowest in June and July. The highest mean temperatures are recorded in the Lower Shire Valley (25 ºC-26 oC) and along the Lakeshore Plain (23 ºC-25 oC). Lowest mean temperatures (13 ºC-15 oC) are recorded over the Nyika, Viphya, Dedza, Mulanje and Zomba plateaus, Misuku Hills, and the Kirk Range. From May to August, it is relatively cool in most high altitude areas, such as the Shire Highlands, so that rain-drizzles (locally known as Chiperoni) occur frequently. During the coldest months, which are June and July, frost may periodically occur in these high altitude areas, especially along dambos and river valleys (GOM, 2006a and GOM, 2003).
Production. In Malawi, crop production comprises smallholder and commercial (estate) sub-sectors. Smallholder crop production encompasses the production of both food and cash crops. Some crops such as cereals, legumes, vegetables, fruits and tubers are grown for both food and cash. On the other

9
hand, crops such as tobacco, tea, cotton, sugar and coffee are mainly grown as cash crops. More often, men are interested in cash crops whereas women put more emphasis on food crops.
Livestock production in Malawi is carried out in two sub-sectors: the smallholder sub-sector and the commercial sub-sector. The smallholder sub-sector constitutes more than 80% of the total livestock that are kept on customary land within family smallholdings in mixed crop-livestock management systems (GOM, 2003). Specialization does not occur at the smallholder level. GOM (2006a) described the smallholder livestock sub-sector in Malawi as "low input, low output". The livestock industry in Malawi contributes about 7% to the GNP (GOM, 2003), with the main livestock types comprising monogastrics (chickens and pigs) and ruminants (cattle, sheep and goats). Chickens are by far the most common and most widespread livestock type in the country, kept by more than 50% of all the smallholder family households. Other livestock types such as ducks, doves, turkeys, guinea fowls and rabbits, although found in fewer numbers, are equally important in meeting the family needs.
Livestock, because of their multiple uses, are an important and integral part of the food and social security system in smallholder farmers’ daily lives. They are a source of inexpensive animal protein in human diets, income for the rural poor and are used for socio-cultural purposes, including slaughters for guests, feasts, gifts, traditional medicines, paying lobola, and for settling disputes in traditional court cases. Some families are even able to exchange livestock with staple foods, such as maize, cassava or sorghum. Livestock also contribute a lot towards subsistence needs, generate occasional cash sales for over half of Malawi's smallholder households, and also provide regular cash earning for approximately 15% of these households that can be classified as commercial producers (GOM, 2003).
According to GOM (2003) the main challenges to smallholder production in Malawi include the following:
Small landholdings: The majority (about 72%) of all the smallholders in Malawi own less than 1 ha of land (GOM, 2003). As such, the growing pressures on a limited land resource base due to high population growth are forcing farmers to undertake continuous cropping, often in cereal monocultures, and to cultivate marginal and unsuitable land areas. This exhausts the soil resources and results in low yield of the major food crops.
Low usage of farm inputs: Smallholder farmers in Malawi are characterized by low usage of external inputs such as mineral fertilizers and pesticides. This is due to various reasons, including lack of cash and access to credit facilities. In an effort to improve the situation, the government has been running a fertilizer subsidy programme since 2005/06 growing season, using a voucher system. The initiative has resulted in smallholder average maize yield increasing from less than 1.0 t/ha in 2005/06 to 2.03 t/ha in 2006/07. During the period, the country achieved an increase in maize surplus from 0.5 million to 1.3 million metric tones. This is attributed to the increase in fertilizer application from 17% in 2005 to 30% of rural households in 2006. Removing the impact of good rains, it is estimated that the fertilizer subsidy led to an increase in maize production of about 25% (Mangisoni, 2007). From 2005 - 2006, the number of people below the poverty line in Malawi declined from 50% to 45%.
Dependence on rain-fed agriculture: In Malawi, agricultural production heavily depends on one rainy season that extends from November to April. Despite having an estimated 200,000 ha of land potentially irrigable, only about 26,000 ha (13%) are currently irrigated (GOM, 2003). Most of this is on estates growing sugarcane, tea, and coffee. However, smallholder irrigation is largely limited to rice schemes that also grow sugarcane and some vegetables.

10
Fragmentation of farming activities: In addition to small land holdings in Malawi, famers also face land fragmentation, implying that farmers have to grow their crops on several pieces of land. This in turn makes it difficult for farmers to organize themselves into a marketing force or form a collective bargaining group with input suppliers. Farmer groups enable farmers to access credit as dictated by the suppliers. The group acts as collateral to give input and credit suppliers a back up and assurance of credit repayments.
To significantly change and improve the smallholder agriculture sub-sector in Malawi, development programmes need to address these limitations. In addition, they should also consider the following factors: (a) increasing population pressures, poverty and unemployment, (b) declining soil fertility, (c) degradation of the natural resource base, and (d) increasing incidences of the recurrent droughts as a result of climate change. These factors can invariably impinge farmer's ability to increase productivity.
2.3.2 Impacts of climate change on African agricultural production Climate change has significant impacts on agricultural production on both crops and livestock (Molua, 2008). The most common impacts on livestock keepers and croppers include: change in productivity of rain fed crops and forage, reduced water availability and more widespread water storages, and changing severity and distribution of significant crop, livestock and human diseases (Thornton et.al. 2008). The effect on food and water resources is critical for livestock in Africa where much of the population, especially the poor, rely on local supply systems which are sensitive to climate variations (Hassan and Nhemachena, 2008). Climate also influences animal production by affecting quantity and quality of feed stuffs such as pasture, forage and grain, and the severity and distribution of livestock diseases and parasites.
Empirical studies have confirmed that, in Africa, agriculture is very susceptible to climate change. Kurukulasuriya and Mendelsohn (2008a) found out that farms are sensitive to climate, especially temperature. Farms net revenues were lower in places with higher temperature and vice versa. The sensitivity was greatest for dry land farms with irrigated farms being resilient to temperature changes. As such, Kurukulasuriya and Mendelsohn (2008a) predicted that irrigated farms would benefit slightly across climate change scenarios whereas the fate of dry land farms depend on the scenario. Mild climate scenarios would probably benefit dry land farmers while harsh scenarios would lead to large losses. The study also observed that climate impacts are not likely to be the same across Africa. The hotter and drier regions are likely to be most impacted.
A study by Thornton et.al (2008) revealed that climate change poses a serious threat to development. Sub-Saharan Africa, which is noted as a food crisis epicenter of the world, is likely to be impaired by the projected climate change in the 21st century, which will add to the burdens of those who are already poor and vulnerable. Worse still, many vulnerable regions are likely to be adversely affected in sub-Saharan Africa, including the mixed arid-semiarid systems in the Sahel, arid-semiarid rangeland system in parts of east Africa and the systems in the Great Lakes Region of east Africa, the coastal regions of east Africa, and many of the drier zones of southern Africa.
In Cameroon, Molua (2008) studied the potential economic impacts of changes in climate on agriculture and the options for adaptation. He observed that Cameroon’s agricultural sector depends largely on good rains and timely availability of adequate inputs. For example, years of improved rainfall were associated with improved agricultural output and vice versa. However, in Cameroon, farmers are not passively submitting to climate variation. It was revealed that farmers’ main strategies for reducing climate risks were to diversify production and livelihood systems. In addition, other farmers acquire more livestock to cushion income, while others engage in various non-farm

11
activities. Overall, Molua (2008) concluded that semi-extensive farming systems are more sensitive to climate change.
The sensitivity of African livestock to climate change was also estimated by Seo and Mendelsohn (2008), using cross-sectional methods. Their study indicated that livestock net revenues, the number of livestock per farm, and the earnings per livestock were all highly sensitive to climate. This sensitivity, however, varied according to farm size, where net revenues per farm for large farms decreased with higher temperatures but increased for small farms. The impacts also depended on how dry the scenario was whereby increased rainfall reduced livestock net income but increased crop and grassland productivity. This is because: (1) farmers shift to other crops as rainfall increases; (2) grassland shifts to forests as rain increases, therefore reducing the quantity and quality of natural grazing for most animals; and (3) an increase in precipitation increases the incidence of certain animal diseases.
A study by Hassan and Nhemachena (2008) revealed some farmers’ perceptions of climate change that included warming, declining precipitation, changes in timing of rains and more frequent droughts. Corresponding perceived adaptation strategies to these changes include: crop diversification; using different crop varieties; varying the planting and harvesting dates; increasing the use of irrigation; increasing the use of water and soil conservation technologies, shading and shelter; shortening the life of the growing season; and diversifying from farming to non-farming activities. As opposed to perceived adaptations, farmers’ actual adaptation measures consisted of different combinations, which included: diversification into multiple crops; mixed crop-livestock systems; switching from crops to livestock; and incorporating irrigation in areas with decreasing rainfall.
On determinants, Hassan and Nhemachena (2008) showed that warming in all seasons promoted adaptation of irrigation, multiple cropping and mixed crop-livestock systems. Farmers appeared to abandon mono-cropping as the temperatures increased. On the other hand, more rainfall reduced the probability of choosing irrigation. The influence of change in the summer-fall precipitation is stronger than that of changes in winter precipitation on the probability of sustaining away from mono-cropping. Alternatively, low rainfall in all seasons induces the need for irrigation to buffer the negative impacts on agricultural production during dry periods. Nevertheless, the results suggested that the influence of warming on the probability of switching to more adapted systems is more powerful than of changes on rainfall.
Farming experience generally facilitates adaptation to climate change. This suggests the importance of education in improving awareness on potential benefits of adaptation. Again, access to information, credit, electricity, and farm capital is crucial to farmers’ adaptation decisions. Market and technology accessibility also have a significant influence while large farm sizes encourage the use of multiple cropping and integration of a livestock component especially, under dry land conditions.
On climate change and crop adaptation, Kurukulasuriya and Mendelsohn (2008b) noted that crop choice is highly sensitive to both temperature and precipitation. Farmers adapt their crop choices to suit the local conditions. For example, farmers in cooler regions of Africa choose maize-beans and sorghum, whereas those in hot regions choose cowpea and sorghum. Farmers in dry regions choose millet and sorghum; whereas farmers in wet regions choose maize-beans, cowpea-sorghum and maize-ground nuts. Other crops such as maize are grown throughout Africa. The study also found out that farmers often choose crop combinations, such as maize-beans, cowpea-sorghum and millet-ground nuts, which can survive harsh conditions in Africa. These combinations provide farmers with more flexibility across climates than if they grew a single crop on its own. Kurukulasuriya and
12
Mendelsohn (2008b) further showed that African farmers have adapted crop choice to climate, implying that crop switching is an important adaptation for farmers. If they could not switch crops, the magnitude of the damages would be exceedingly high. Therefore, there is every reason to believe that farmers will alter future crop choices as the climate changes, provided there are no barriers to adoption of the appropriate selection.
2.3.3 Approaches to assess the impacts of climate change on African agriculture
Four different strands of research into economic impact of climate change on agriculture were observed by Kurukulasuriya and Mendelsohn (2008b): agronomic, panel data, agro-economic and Ricardian. The agronomic model predicts large and dire yield losses, especially in Africa. Panel data examines weather supplies and also suggests that climate change will be harmful, though their predications are not as dire as those of agronomic studies. Agro-economic models take farmers’ yield losses as given, but predict that farmers can reduce the impact by switching crops. The Ricardian model captures the actual adaptations that farmers make and measures the final net impact, based on the notion that the value of the land would reflect its net productivity. It is a cross-sectional approach to studying agricultural production, where cross-sectional observations across different climates reveal the climate sensitivity of farms. All four models however, neglect to include actual adaptation by farmers. As such, Kurukulasuriya and Mendelsohn (2008b) developed a new approach of a ‘structural Ricardian model’ that attempted to bridge the gap between the agro-economic and Ricardian models. In this model the researcher first measures farmers crop choices across different climates (measuring the role that climate plays in these choices) then estimates conditional net revenue functions for each crop. The resulting model predicts the effect of two global warming scenarios on expected net revenue, both with and without changing crops.
Hassan and Nhemachena (2008) employed a multinational logit approach in order to understand the determinants of farmers’ choices between alternative adaptation measures available to rural households in Africa. Adaptation to climate change was viewed as critical and of great concern in developing countries, particularly in Africa where vulnerability is high. Climate change affects food and water resources, and as such, adaptation helps farmers to achieve food, income and livelihood security objectives in the face of changing climate and socioeconomic conditions. The potential damage of climate change can be reduced by making a tactical response to change.
Thornton et.al (2008) outlined a broad-brush analysis at the continental level to identify areas or ‘hotspots’ that are already vulnerable and likely to suffer substantial impacts as a result of climate change. The study tried to understand the likely impacts of climate change on the vulnerability of resource-poor farmers by gauging resilience to current climate variability as well as to the risks associated with longer-term climate. Two interpretations of vulnerability in the climate change were summarized by O’Brien et al. (2004) and Thornton et al. (2008). These are ‘end point’ and ‘starting point’ approaches. The former views vulnerability as a residual of climate change impacts minus adaptation, while the later views it as a general characteristic generated by multiple factors and processes. An end point approach considers that adaptations and adaptive capacity determine vulnerability, whereas, a starting point holds that vulnerability determines adaptive capacity. Thornton et al. (2008) adopted the ‘starting point’ approach and viewed vulnerability to climate change as a state that is governed not just by climate change but by multiple processes and stressors.

13
3 Household characteristics
3.1 Categorizing household access to capital assets The household status is important in guiding project officers on how to deal with a particular household. Rich and poor households belong to different levels of needs hierarchy and therefore need to be treated accordingly. As such, an analysis was done to rank the households based on their wealth status. The computed wealth index as presented in Figure 2 categorized the households into two groups, poor class and rich class, depending on whether the household falls below or above the mean wealth index of zero. Thus, 58% of the households in the two districts of Balaka and Mangochi were relatively poor while 42% were relatively better off. The mean score for poor and rich class households were -0.688 and 0.955, respectively.
Figure 2: Distribution of wealth index ranking of households.
Further categorization of farming households based on access to capital assets identified three categories - poor farming class, middle farming class and rich farming class. As presented in Figure 3, 17% of the farming households were rich, 53% were middle class farmers, and 30% belonged to the poor farming class. An interesting observation, however, is the fact that households represented by women respondents dominate the middle and poor wealth categories; i.e., 50% of the middle farming class and about 42% of the poor class households were represented by women respondents. This result is attributed to the high migration of men from poor households, thereby leaving women behind to manage the family.

14
Figure 3: Probability distribution of households within wealth categories by gender. Table 3 presents total variations as explained by the PCA. An interesting observation is that bicycles, radios and mobile phones were the assets with the largest impact factors in Mangochi and Balaka.
Table 3. Total variance explained using PCA.
Capital asset Mean St. Dev Score Impact factor Bicycle 0.5714 0.7308 0.4094 0.5602 Radio 0.7468 0.7885 0.3824 0.4850 Mobile phone 0.2662 0.6267 0.1624 0.2591 Access to credit 1.8377 0.3872 0.0054 0.0140 Local goat 2.0584 2.6965 0.3751 0.1391 Pigs 0.1104 0.6913 0.0989 0.1431 Local chicken 7.3766 12.7971 0.2591 0.0203
3.2 Human capital The demography of the household plays an important role in household’s farm operations. This study compiled various demographic characteristics, including gender, age, marital status, and education level of the household head (Table 4). Most households are male headed, despite the prevalence of female respondents. This is linked to the common (temporary) migration of men to other regions in search of better incomes, a syndrome that leaves only women at home. The absence of the household head is more common in Mangochi, where many men leave to fish in Lake Malawi. As much as the trade involves both men and women, it is men who take a prominent and dominant role. Decision making in both districts is dominated by household heads (Table 5).

15
Table 4. Descriptive statistics of sample households.
Gender of respondent (%)
Balaka (n=67) Mangochi (n=87) Total (n=154)
Male 44.78 19.54 30.52
Female 55.22 80.46 69.48
Total 100 100 100
Gender of household head (%)
Balaka (n=47) Mangochi (n=38) Total (n=85)
Male 59.57 39.47 50.59
Female 40.43 60.53 49.41
Total 100 100 100
Age of respondent
Balaka (n=67) Mangochi (n=86)
Mean 46.72 43.17
St. Dev 16.81 16.71
Age of household head
Balaka (n=17) Mangochi (n=35)
Mean 45.12 44.37
St. Dev 17.26 13.75
Marital status of household head
Balaka (n=68) Mangochi (n=86) Total (n=154)
Single 2.94 1.16 1.95
Married 69.12 82.56 76.62
Divorced 11.76 3.49 7.14
Separated 1.47 4.65 3.25
Widowed 16.18 12.79 14.29
Total 100 100 100
Education level of household head
Balaka (n=67) Mangochi (n=86) Total (n=153)
Illiterate 16.42 32.56 25.49
Primary school 65.67 51.16 57.52
Secondary School 14.93 10.47 12.42
Adult education 2.99 5.81 4.58
Total 100 100 100 Source: Survey data, 2008.
Gender of household head is one of the important factors in agricultural production as it determines differentiation in participation in different household activities. Male-headed households tend to be better off than female headed households because the former participate in more productive activities. Therefore, better endowed male headed households can respond better to climate changes such as droughts and floods than female headed households. However, although males head the

16
majority of the households, it is women who play an important and vital role in Malawi's agricultural activities. Women comprise 70% of the total full-time farm workers (GOM, 2003) in Malawi. Some farm operations such as land preparation, planting, and harvesting (especially food crops) are solely done by women. Their importance increases even more among the poorer categories of rural households and the urban-poor.
Table 5. Descriptive statistics of sample households.
Descriptive statistic Mangochi (n=89) Balaka (n=61) Total Frequency % Frequency % Frequency % Residence of household head Resident 42 47.19 44 72.13 86 57.33 Temporary away from house 40 44.94 17 27.87 57 38 Absent from home at least 6 months in a year 7 7.87 0 0 7 4.67 Main decision maker Household head 76 85.40 57 93.40 133 88.70 Spouse 5 5.60 1 1.60 6 4 Household head & spouse 4 4.50 2 3.30 6 4 Household head & children 2 2.20 1 1.60 3 2 Missing 2 2.20 0 0 2 1.30 Participation to farmer's cooperatives Yes 13 14.60 15 24.60 28 18.70 No 76 85.40 46 75.40 122 81.30
Most households (77%) were married, with 14% widowed. The latter could be linked to the HIV/AIDs scourge, which has not spared the districts, as the national prevalence rate is 14% (GOM, 2006b). Education is one of key determinants of the lifestyle and status a household or an individual enjoys in society. In the targeted villages, 25.5% of the household heads had no formal education, 57.5% had at least attained primary education and only 12.4% had secondary education. Schooling indicators were somewhat more favorable in Balaka, perhaps because in Mangochi, a lot of children spend much of their time fishing (with their fathers), at the expense of schooling.
Education is very important in farm operations and on overall household livelihood, as higher educational levels increase labor skills (Larson, 1977). Farmers with high education are able to understand new cultural practices and extension advice more than uneducated farmers. Additionally, educated farmers can better understand shocks like droughts, floods, and illnesses that affect farm production. Perception is highly correlated with knowledge of a given technology. One way a farmer can increase their knowledge is through reading pamphlets, leaflets and other aids. As such, if farmers or at least a member of the household is able to read about a technology such as drought tolerant maize varieties, there may be a higher probability that the household will adopt such technologies.

17
3.3 Natural capital Land accessibility is very important for smooth operations of the farm (Table 6). In Balaka and Mangochi, a large proportion of the suitable land is under crop production, with a very small percentage under fallow, pasture and trees. An average of 2.97 acres of land is allocated to crop production by men. On average, only 0.45 acres of land was abandoned, 0.06 acres land was under trees, 0.15 acres under pasture and 0.07 acres of land was fallow (Table 6). This is in line with the report of the Malawian Government (GOM, 2003), which states that in Malawi, practically all land suitable for cultivation under traditional systems of management is under crop production. Thus, land scarcity is an issue of pressing importance in the districts and Malawi in general, as population continues to expand. There is therefore an increasing need to develop production-increasing technologies that maximize crop and livestock production per unit area on small landholdings, in order to attain food security and sustainable household livelihoods.
Land accessibility in the two districts seems to be gender balanced; men own an average of 3.57 acres of land while females have an access to an average of 2.81 acres of land. This is, however, contrary to most of Malawi, where men monopolize access to capital assets owned by the household. The case here can therefore be attributed to: (1) The migration of men in most households, leaving ownership of land to the women. (2) The chikamwini marriage system (matrilineal in nature) in some parts of the districts - especially Balaka - among the Mang’anja tribe where women are the principal owners of land and other capital assets of the household.
Table 6. Access to farm land by gender (acre). Land category Male Female
Mean Std. Dev Min Max Mean Std. Dev Min Max
Total land owned 3.573 2.685 0.120 12.475 2.812 2.244 0.349 120
Land under crop 2.966 2.043 0.120 12.475 2.585 2.076 0.349 120
Land under trees 0.064 0.438 0 30 0.020 0.194 0 20
Land abandoned 0.447 1.332 0 60 0.078 0.529 0 50
Land for fallow 0.074 0.442 0 30 0.024 0.174 0 1.500
Pasture land 0.146 0 10 0.106 0.265 0.515 0 40
Figure 4 reports land ownership based on wealth categories of the farming families. This indicates that rich farming families have more access to land than poor households.

18
Figure 4: Proportional distribution of farm land by wealth groups.
The cultivated farm size is a function of several factors (Table 7). Most frequently reported were cash availability to buy inputs and family labor availability. These were followed by cash availability to hire labor, expected food needs and seed availability. These reflect the importance of cash and labor availability for maize production in Malawi. Most of the soils have lost their nutritional capability hence they need to be nourished by fertilizer. Food security also played an important role, to the extent that all farmers try to cultivate enough maize to enhance their food security. Grain price seemed to have little influence on farmers’ decisions. This could be attributed to the fact that most of the farmers who grow maize are smallholders, growing mainly for home consumption with some little surplus for sale. Their main target is therefore not income generation but household food security.
Table 7. Determinants of cultivated farm size in study area.
Factor (% households reporting) Mangochi Balaka Whole sample
Expected family labor availability 21.24 20.45 20.92
Cash availability to hire labor 16.60 18.18 17.24
Cash availability to purchase input 23.94 23.30 23.68
Current grain price 1.16 2.27 1.61
Expected grain price after harvest 2.32 5.11 3.45
Expected food needs 17.76 14.77 16.55
Availability of seed 16.99 15.91 16.55 Total 100 100 100 Source: Survey data, 2008.
The recent farm size dynamics data had no clear pattern. In Mangochi, respondents were relatively evenly split between those that maintained, increased or decreased their farm size. In Balaka, nearly

19
half the respondents reported increasing their farm size (Figure 5a). Various reasons were given for these dynamics (Figure 5b). The main reasons why farm sizes remained the same is unchanged labor force and no space for expansion. This means that expansion of cultivated land is limited in the districts, reflecting longer-term land-use. Similarly, GOM (2003) observed that in southern Malawi, expansion of agricultural land became limited by the late 1960s. Larger farm sizes were mainly associated with better rainfall. Reduced farm sizes were linked to various factors, including reduced cash for inputs, poor rainfall, and reduced labor force.
Figure 5a & 5b: Dynamics of farm size over time in study area. Source: Survey data, 2008.
3.4 Physical capital The household dwelling serves as a useful indicator of households’ physical capital assets. The predominant dwellings were mud huts with grass thatched roofs (particularly in Mangochi) and brick

20
houses with iron roofs (particularly in Balaka, Table 8). This suggests households in Balaka are relatively richer than their counterparts in Mangochi.
Table 8. Types of dwelling used by households in study area.
Type of Dwelling Mangochi Balaka Total Frequency % Frequency % Frequency % Mud hut with grass thatched roof 27 30.3 13 14.6 40 26.7 Brick house with asbestos/iron roof 15 16.9 17 27.9 32 21.3 Block house with grass thatched roof 12 13.5 5 8.2 17 11.3 Block house with asbestos/iron roof 6 6.7 4 6.6 10 6.7 Source: Survey data, 2008. Table 9 summarizes the household’s other physical assets. The most important ones include radios, bicycles and furniture. Table 9. Asset ownership by households in study area.
Item Mangochi Balaka Total
Purchased/Owned Frequency % Frequency % Frequency % Radio 44 49.40 43 69.60 87 57.97
Bicycle 29 32.60 35 57.30 64 42.67 Furniture/sofa 33 37 18 29.50 51 34.01 Mobile phone 24 29.10 5 3.90 29 19.30
Sewing machine 5 5.60 1 1.60 6 3.94 Motor cycle 2 2.20 0 0 2 1.34 Television 0 0 2 2.30 2 1.30 Wheel barrow 0 0 1 1.60 1 0.67
Water tanks 0 0 1 1.60 1 0.67 Fixed phones 0 0 1 1.60 1 0.67 Private well 1 1.10 0 0 1 0.67
3.5 Financial capital Financial capital provides the farming families with the necessary means to finance inputs such as seeds and fertilizer for production. It was noted earlier that cash availability determines farmers’ allocation of land to cultivation. Unfortunately for Mangochi and Balaka, just 15.3% of farmers have access to credit finance inputs (Table 10). GOM (2006a) observed that in Malawi, access to cash and input credit by smallholder farmers is severely limited, as lending institutions often demand collateral and impose conditions that are beyond the reach of smallholder farmers. In addition, most credit facilities are for short-term inputs rather than for investments into infrastructure development and long-term farm developments. This therefore means that smallholder farmers in the districts and Malawi as a whole are disadvantaged as far as agricultural production is concerned. As such, there is a need for the government and stakeholders to intervene and provide farmers in the districts with necessary inputs in order to create a more food-secure Malawi.

21
Table 10. Access to credit by households in study area. Received cash/credit in 2007/08 Mangochi Balaka Total
Frequency % Frequency % Frequency %
Yes 17 19.1 6 9.8 23 15.3
No 72 80.9 55 90.2 127 84.7
Total 89 100 61 100 150 100
Source: Survey data, 2008.
3.6 Institutional and Social capital The participation in farmers’ associations/cooperatives amounted to less than a fifth (18.7%). This could be a reflection of the few active cooperatives in the districts. For example, only one known active cooperative – Tukamulane - was reported by Mangisoni et al (2010) in Mangochi District. Tukamulane was engaged mainly in the trading of agricultural inputs. In Balaka District the most active associations were schools and village development committees. Farmers are generally expected to inspire, encourage and motivate each other when they are in groups or associations, and as such help uplift their agricultural production.
In Balaka and Mangochi various institutions were reported to provide different forms of support to the households, including Sasakawa Global 2000, Government starter pack, World Food Programme, Save the Children, Government, and Total Land Care. Farmers reported that the support they get from these institutions is in the form of cash, treadle pumps, seed and fertilizer relief, food relief, and insecticides (Table 11). However, this support is low. This is of concern especially considering that most of the people in the districts are poor; such people need an external arm to help them fight poverty and food insecurity. As such, there is a need for the government and other supporting institutions to think of increasing their support to the districts.

22
Table 11. Sources of institutional support to households in study area.
Source and Type of Benefit Mangochi Balaka Total Frequency % Frequency % Frequency % World Vision Food relief 0 0 1 100 1 100 Fertilizer relief 0 0 2 100 2 100 Total 0 0 3 100 3 100 Government Starter Pack Food relief 0 0 1 100 1 100 Seed and fertilizer 1 50 1 50 2 100 Total 1 33 2 67 3 100 World Food Programme Food relief 0 0 5 100 5 100 Total 0 0 5 100 5 100 Save the Children (UK) Food relief 1 50 1 50 2 100 Seed relief 2 100 0 0 2 100 Seed and fertilizer 7 87.5 1 12.5 8 100 Total 10 83.3 2 16.7 12 100 Government safety net Food relief 0 0 1 100 1 100 Seed relief 1 100 0 0 1 100 Others (cash, treadle pump, insecticide) 0 0 1 100 1 100 Total 1 33.3 2 66.7 3 100
Field demonstrations and field days are key mechanisms for introducing new agricultural technologies. It gives farmers hands-on experience and assurance in the reality of what is being proposed. Only a fraction of the surveyed households reported attending demonstrations or field days, however, and these were primarily organized by agricultural extension officers, or to a lesser extent non-governmental organizations( NGOs). Participation appeared somewhat higher in Balaka (Table 12). Table 12. Access to field demonstrations in study area.
Access Mangochi Balaka Total Frequency % Frequency % Frequency % Agricultural extension services 6 85.7 11 78.6 17 81 NGO 1 14.3 3 21.4 4 19 Total 7 100 14 100 21 100 Households reporting attending
- Field days 2 3 5 - Field demonstrations 7 12 19 - Maize Production discussions 7 8 15

23
4 Household livelihood strategies
4.1 Crop production and marketing The most commonly grown crops in the districts are maize, followed by ground nuts and other minor crops (Table 13). As indicated in Table 13, maize accounts for 48% of the plots under crop production. This confirms the findings of RATES (2003) and GOM (2003) that in Malawi, maize is the major food crop with supplements from groundnuts, cassava, sorghum, rice, beans and various other pulses. Differences between the two districts can be attributed to variations in rainfall patterns, drought, and changes in commodity marketing (Ng’ong’ola et. al. 1997). Table 13. Land use by households in study area.
Crop Plot 1 (%) (n=150)
Plot 2 (%) (n=110)
Plot 3 (%) (n=62)
Plot 4 (%) (n=19)
Plot 5 (%) (n=6) Average (%)
Local maize 78.67 12.73 12.90 10.53 33.33 29.63 Improved maize (OPVs) 2 4.55 0 10.53 16.67 6.75 Hybrid maize 10.67 24.55 11.29 10.53 0 11.41 Rice 0.67 5.45 3.23 5.26 0 2.92 Groundnut 1.33 30.91 20.97 15.79 0 13.80 Cassava 2 0.91 6.45 5.26 0 2.92 Sweet potato 0.67 3.64 11.29 10.53 16.67 8.56 Cotton 0.67 3.64 1.61 0 0 1.18 Wheat 0.67 1.82 4.84 0 0 1.46 Sesame 2 0.91 8.06 10.53 16.67 7.63 Tobacco 0.67 0.91 1.61 0 0 0.64 Pearl millet 0 0.91 0 5.26 0 1.23 Beans 0 1.82 3.23 5.26 0 2.06 Soybean 0 0.91 3.23 5.26 0 1.88 Tea 0 0.91 6.45 0 16.67 4.81 Arrowroots 0 0.91 0 0 0 0.18 Vegetables 0 1.82 3.23 5.26 0 2.06 Pigeon pea 0 2.73 1.61 0 0 0.87 Total 100 100 100 100 100 100
The average farm size for local maize is 1.66 ha, hybrids and improved OPVs 1.33 ha each and cassava 2.83 ha (Figure 6).

24
Figure 6: Distribution of land area among crops.
The production of household staple foods is largely focused on providing food for the household; any residual may be marketed, given as gifts, reserved as seed for the next growing season, lost to pests and theft.. Consumption ranks high for maize, but sales are also substantial. Other crops such as millet, sorghum, and cowpeas are mostly consumed. Tobacco and cotton are major cash crops in Malawi.
4.2 Livestock production and marketing Livestock production is an important component of the smallholder livelihoods in the area, contributing cash incomes and food self-sufficiency. Livestock in the study area primarily comprised of local breeds of cattle, goats and poultry. The poultry are mostly kept for home consumption, entertaining visitors and for functions such as weddings, engagements, and funerals; not necessarily for income generation. In Mangochi, a largely Islamic district, no pigs were reported. That most of the livestock kept in the districts are local breeds suggests that (a) the households are still keeping the animals under subsistence nature not necessarily for commercial purposes; (b) households in the district are too poor to afford improved or exotic breeds; and/or (c) households are not exposed to new and improved breeds.
The average livestock holding in tropical livestock units (TLU) was found to be 0.46 units with large gaps between the different wealth classes. The mean holding of households in the rich wealth category was 1.58 TLU, whereas that of the poor class was only 0.06;the middle farming class owned an average of 0.31 TLU per household (Table 13). This is an important indication of the importance of livestock in defining the livelihood status of the rural communities in these two districts.

25
Table 14. Average livestock holding in tropical livestock units by different wealth classes. Wealth class Mean TLU N Std. Deviation
Rich 1.58 27 4.26 Middle 0.31 81 0.28
Poor 0.06 46 0.09 Total 0.46 154 1.85
4.3 Income and Expenditure Profiles of Households Mangochi and Balaka farmers pursue a diverse livelihood and reported a range of income sources. Crop sales and other business were most frequently reported (Table 14), with crop sales being more common in Balaka. Remittances were the third most reported income source, and only reported in Mangochi, due to the prevalence of migration in the district. Off-farm activities such as business, paid employment and petty trading act as a cushion against fluctuations in agricultural production. Table 15. Sources of household income.
Source Mangochi Balaka Total Frequency % Frequency % Frequency % Crop (grain, seed) sale 18 20.2 25 41 43 28.7 Fruits and vegetable sale 4 4.5 8 13.1 12 8 Livestock/fish sale 10 11.1 4 6.6 14 9.3 Petty trading 6 6.7 3 4.9 9 6 Paid employment 7 7.9 2 3.3 9 6 Self employment 10 11.1 2 3.3 12 8 Remittances 12 13.5 0 0 12 8 Other businesses 21 23.6 17 27.9 38 25.3 Source: Survey data, 2008.
Household expenditure patterns in Mangochi and Balaka districts show that a large proportion of household income goes to staple food (Table 15). This indicates that the relative poverty of the household in the study area is still large. Clothing is the second most important item on household expenditure list, while remittances remain very low in the area. Another important observation is that only 4% of total household income is allocated to education. This is a point of concern considering the importance of education in the country. In addition to the relative poverty of the households where most households don’t have enough income to reserve for their children’s education, it could also mean that the families are less interested in the education of their children. Thus, the government and other development agencies should focus not only on promoting income-generating activities, but also on promoting the importance of education. An emphasis can be put on Mangochi and other lake shore areas where fishing tends to be prioritized at the expense of other activities.

26
Table 16. Expenditure patterns of households (MK).
Item Mean Std. Deviation Total Sum % N Staple foods 26588 33803 4067918 48.28 153 Clothing 6672 14660 1007440 11.96 151 Miscellaneous (bicycle repairs, gifts etc) 6858 15650 964330 11.45 146 Fuelwood, paraffin 6066 14883 909828 10.80 150 Medical expenses 3029 6842 457305 5.43 151 Educational expenses 2273 6576 336360 3.99 148 Social contributions 2081 4867 293471 3.48 141 Tobacco/alcohol 1360 7240 198535 2.36 146 Remittances 1330 4873 190250 2.26 143
4.4 Outlook of livelihoods Farm households were questioned about their strategies to enhance their livelihoods. Primary focuses were increasing agricultural production and increasing food security (Table 16), demonstrating that agriculture remains a key factor to households’ livelihood agenda. Agriculture is set to remain an economic activity for the people of Mangochi and Balaka as most of them are not employed and have little prospects of getting formal employment due to their limited education. The third most important was increasing income and/or reducing income risks; followed by reducing agricultural production risks, and social strategies such as improving the health status of the household members and increasing the educational level of the household members. The members’ health status is critical in determining labor availability for farm operations. With the advent of HIV and AIDS pandemic, available labor for agriculture or other income-generating activities has been reduced. The United Nations (2003) reported a pronounced labor loss, as the epidemic mostly affects the productive members of the household (ages 15-49). The effects of HIV/AIDS consequently culminate in reduced agricultural production and loss of non-farm income.

27
Table 17. Strategies to enhance livelihood outcomes in study area. Mangochi Balaka Total
Frequency % Frequency % Frequency %
Increase agricultural production 70 78.8 52 85.2 122 81.3
Increase food security 67 75.3 44 72.1 111 74
Increase income/reduce income risks 48 53.9 30 49.2 78 52
Improve health status of members 26 29.2 23 37.7 49 32.7
Reduce agricultural production risks 23 25.8 24 39.3 47 31.3
Increase volume of household assets 24 27 18 29.5 42 28
Increase educational level of household 21 23.6 19 31.1 40 26.7
Increase land ownership 23 25.8 16 26.2 39 26
Improve social status 20 22.5 16 26.2 36 24
Reduce marketing risks 14 15.7 16 26.2 30 20
Increase job opportunities 6 6.7 5 8.2 11 7.3
Source: Survey data, 2008.
Farmers undertake different types of activities in a bid to improve their livelihoods (Table 17). Business/employment is the action most sought by the respondents (70%), particularly in Mangochi. This is followed by increased food production (60.7%, prominent in Balaka) and provision of enough input (54%). Building a better house, livestock keeping and going to clinics are among the actions least sought by the households.

28
Table 18. Type of actions sought by households to enhance livelihood outcomes in study area. Mangochi Balaka Total
Frequency % Frequency % Frequency %
Do business/get employed 74 83.1 31 50.8 105 70
Increased food production 48 53.9 43 70.5 91 60.7
Enough inputs 52 58.4 29 47.5 81 54
Increase land size 42 47.2 19 31.1 61 40.7
Grow different crops 16 18 30 49.2 46 30.7
Have balanced diet 24 27 13 21.3 37 24.7
Send them to school 19 21.3 17 27.9 36 24
Use hybrid seed 10 11.1 9 14.8 19 12.7
Buy assets 5 5.6 9 14.8 14 9.3
Storage chemicals 3 3.4 8 13.1 11 7.3
Irrigation farming 7 7.9 4 6.6 11 7.3
Good selling price 7 7.9 4 6.6 11 7.3
Provision of loan 5 5.6 5 8.1 10 6.7
Livestock keeping 5 5.6 3 4.9 8 5.3
Labor 3 3.4 4 6.6 7 4.7
Go to clinics 0 0 5 8.1 5 3.3
Build a better house 2 2.2 2 3.3 4 2.7
Early planting 2 2.2 0 0 2 1.3
Source: Survey data, 2008.
Household livelihood improvement is constrained by a number of factors. Table 18 presents some of the most serious threats and constraints of the households in their pursuit of realizing better livelihoods. Food insecurity (41%), erratic rains/weather fluctuations (18%), and illness (19%) are the major threats. This is in agreement with GOM (2006a), who reported climatic factors as major threats and constraints to agricultural production in Malawi. In addition, GOM (2003) observed other threats such as land degradation, pests, diseases and parasites, lack of improved planting materials and animal breeds, lack of feeds for livestock, and poor management practices.
Food insecure households are living in poverty. For these households it is almost impossible to get out of the poverty-food insecurity cycle, especially without external intervention. The household spends much of its labor and time seeking food and working on other people’s fields, sometimes neglecting their own limited farms, which leads to the same problems in subsequent years.
Climate is changing drastically at a global level; frequent droughts and erratic rainfall have affected agricultural productivity in Malawi and most other African countries in the last two decades (Thornton et. al., 2008). Local farmers, mainly using basic technology, are particularly susceptible to droughts and unfavorable rains which directly affect the households’ agricultural productivity.
Malawi relies on rain-fed agriculture, such that the current droughts have resulted in poor crop yields or total crop failure, leading to serious food shortages, hunger and malnutrition. For annual crops,

29
lack of moisture at specific sensitive physiological stages can result in total yield loss (GOM, 2003). Flooding has also severely disrupted food production in several districts of the country including Mangochi and Balaka. The most vulnerable groups are rural communities, especially women, children, female-headed households and the elderly.
Table 19. Threats and constraints for improving livelihoods of households in study area. Threat/Constraints Mangochi Balaka Total
Frequency % Frequency % Frequency %
Serious threats
Food insecurity 39 43.8 23 37.7 62 41.3
Illness 19 21.3 9 14.8 28 18.7
Erratic rains/weather fluctuations 15 16.9 17 27.9 27 18
Finance 6 6.7 8 13.1 14 9.3
Poverty 2 2.2 4 6.6 6 4
Theft 2 2.2 3 4.9 5 3.3
Family Problems 2 2.2 2 3.3 4 2.7
Constraints
Illness 27 30.3 21 34.4 48 32
Low food production 17 19.1 13 21.3 30 20
High price of inputs 17 19.1 7 11.5 24 16
Finances 13 14.6 7 11.5 20 13.3
Input markets 4 4.5 6 9.8 10 6.7
Family problems 3 3.4 3 4.9 6 4
Soil conditions 1 1.1 4 6.6 5 3.3
Fertilizer 3 3.4 0 0 3 2
Source: Survey data, 2008.
Other major concerns for the households include illness (32%), high input prices (16%), low food production (20%) and limited finances (13.3%; Table 18). As already discussed, timely availability of reliable inputs is vital to high productivity and hence improved household livelihood. As such, when prices of such inputs are too high, the inputs become unaffordable to most below-average smallholder farmers. This therefore places them on a low standard of living. In addition, limited finances present another challenge to household’s improved productivity, as it implies that households will not be able to acquire inputs or hire labor in peak periods. Low food production is typically associated with smallholder production and it characteristic limitations.
Food insecurity was widespread during the 2007/08 season (40%;Table 19), with many people reporting having inadequate food for a period of six months or longer. Only 14% reported having adequate food for a period of more than eight months. The most critical period appears to be December to February. The poor farming class were relatively more vulnerable to household food

30
insecurity (44.26% had not enough food) as opposed to rich farming households (only 9.84% were food insecure in the year 2007/08) (Table 20).
Table 20. Household food availability.
Food availability by district Mangochi Balaka Total Enough food last year Frequency % Frequency % Frequency % Yes 51 57.3 39 63.9 90 60 No 36 42.7 22 36.1 58 40 Number of months of adequate food <5 months 20 48.78 8 36.36 28 44.44 5-8 months 16 39.02 10 45.45 26 41.27 >8 months 5 12.20 4 18.18 9 14.29 Total 41 100 22 100 63 100 Table 21. Household food availability by wealth groups
Enough food last year Rich class (%)
(n=27) Middle class (%)
(n=79) Poor class (%)
(n=45) Total (%) (n=151)
Yes 23 57 20 100 No 10 46 44 100
Food shortage is a serious problem for any household; it can result in malnutrition and deaths of the most vulnerable members of the household, or even previously healthy adults in severe situations. Food insecurity can also lead to unhealthy and risky practices such as stealing and prostitution to alleviate the problem. Worse still, the household is trapped in a poverty cycle where one problem propagates another. In view of this, it is important that famers have coping strategies against food shortages. Table 21 gives details of the reported coping mechanisms by Mangochi and Balaka farm families. Households feel that reducing frequency of food intake (32%) can help them cope with food shortages; doing some piece work (21%) is viewed as another way, followed by working more on off-farm activities (16.7%).

31
Table 22. Important coping mechanisms against food shortages at the household level in the study area Mechanism Mangochi Balaka Total
Frequency % Frequency % Frequency %
Reduced frequency of food intake 29 35.6 29 32.2 48 32
Selling firewood/peace work 17 19.1 15 24.6 32 21.3
Working more off-farm 19 23.6 6 9.8 25 16.7
Working at food for work 5 5.6 4 6.6 9 6
Reducing other expenses 0 0 4 6.6 4 2.7
Eat less desirable food 2 2.2 2 3.3 4 2.7
Eat small portions 3 3.4 1 1.6 4 2.7
Selling other assets 2 2.2 1 1.6 3 2
Receive food aid 2 2.2 1 1.6 3 2
Source: Survey data, 2008.
A number of shocks to household livelihoods were reported by the respondents (Table 22), with drought being the most significant and prominent (82%), followed by floods (30%), and erratic rainfall (27%). Droughts and floods adversely impact on food, water, health, energy, and the sustainable livelihoods of rural communities. With about 45% of the population living below the poverty line (Mangisoni 2007), Malawi’s vulnerable communities do not have sufficient capacity to cope with, or adapt to, the adverse impacts of extreme weather events. Illness or death of the bread winner or spouse also pose another challenge to communities’ livelihood, affecting the household’s labor contribution to agriculture and other economic activities. Production in agricultural activities is undermined by the reduction of a productive workforce. Isaksen et al. (2002) noted that the inability to work and the eventual death of members of the household reduces the amount of labor it has for subsistence agriculture, cash income generating activities, and ordinary wage labor. Consequently, the initial response of farmers is to identify means of replacing the labor lost to mortality, morbidity, and caring for the sick (Haddad and Gillespie, 2001). Illness also implies expenditure needs, as cost of medical treatment are incurred (Greener et al., 2000). In the long term, Gillespie and Kandiyala (2005) noted that the composition of the household may change or the household may become dissolved and in some cases there may be a change in cropping system.

32
Table 23. Perceived shocks to household livelihoods in study area. Shock Mangochi Balaka Total
Frequency % Frequency % Frequency %
Drought 70 78.7 53 86.9 123 82
Too much rain/flood 25 28.1 20 33.4 45 30
Illness/disability of bread winner/spouse 28 31.5 12 19.7 40 25.6
Erratic rainfall 31 34.8 10 16.4 41 27.3
Plant pests & diseases 20 22.5 9 14.8 29 19.3
Livestock diseases 10 11.1 9 14.8 19 12.7
Deaths of bread winner/spouse 8 9 9 14.8 17 11.3
Large increase in input prices 8 9 9 14.8 17 11.3
Deaths/loss of livestock 13 14.7 2 3.3 15 10
Large drop in maize prices 4 4.5 9 14.8 13 8.7
Theft of property/other assets 6 6.7 6 9.8 12 8
Loss of farm land 9 10.1 0 0 9 6
Death of relative 4 4.5 5 8.2 9 6
Burning of properties 1 1.1 2 3.3 3 2.6
Household's breakdown 0 0 2 3.3 2 1.3
Risk/Shock of off Farm Income (RSA) 1 1.1 1 1.6 2 1.3
Source: Survey data, 2008.
4.4.1 Households’ perception about production risk and their coping
mechanism Farmers face a number of risks in agricultural production, including price and yield fluctuations. In terms of yield fluctuations, farmers were asked to rank their crops in terms of relative riskiness (Table 23). Yield fluctuations are a function of several factors such as timely availability of inputs such as seeds and fertilizer, drought, floods, and other climatic factors. This implies that crops like cassava which are drought tolerant and require low inputs are rated less risky in terms of yield fluctuations, whereas maize is perceived as relatively risky (Table 23).

33
Table 24. Major crop production risks farmers face in study area.
Riskiness Mangochi Balaka Total Frequency % Frequency % Frequency %
Riskiness of local land race maize in terms of yield fluctuations Most risky 21 25.3 28 42.4 49 32.9 More risky 7 8.4 8 12.1 15 10.1 Just risky 12 14.5 4 6.1 16 10.7 Risky 6 7.2 7 10.6 13 8.7 Less risky 11 13.3 9 13.6 20 13.4 Least risky 26 31.3 10 15.2 36 24.2 Total 83 100 66 100 149 100
Riskiness of improved OPV maize in terms of yield fluctuations Most risky 4 22.2 5 29.4 9 25.7 More risky 0 0 3 17.7 3 8.6 Just risky 3 16.7 2 11.8 5 14.3 Risky 5 27.8 4 23.5 9 25.7 Less risky 5 27.8 2 11.8 7 20 Least risky 1 5.6 1 5.9 2 5.7 Total 18 100 17 100 35 100
Riskiness of hybrid maize in terms of yield fluctuations Most risky 4 12.9 12 31.6 16 23.2 More risky 4 12.9 5 13.2 9 13.0 Just risky 3 9.7 6 15.8 9 13.0 Risky 6 19.4 1 2.6 7 10.1 Less risky 4 12.9 7 18.4 11 15.9 Least risky 10 32.3 7 18.4 17 24.6 Total 31 100 38 100 69 100
Riskiness of groundnuts in terms of yield fluctuations Most risky 6 20.7 6 26.1 12 23.1 More risky 4 13.8 3 13.0 7 13.5 Just risky 6 20.7 3 13.0 9 17.3 Risky 3 10.3 4 17.4 7 13.5 Less risky 3 10.3 3 13.0 6 11.5 Least risky 7 24.1 4 17.4 11 21.2 Total 29 100 23 100 52 100 Riskiness of cassava in terms of yield fluctuations Most risky 0 0 1 16.7 1 14.3 Less risky 0 0 2 33.3 2 28.6 Least risky 1 100 3 50 4 57.1 Total 1 100 6 100 7 100

34
Farmers were also questioned as to their most important strategy to reduce or eliminate production (yield) risk for each crop. For hybrid maize variety, diversification was most frequently reported as the best option to cope with production risks (Figure 7); as was the case for beans and pigeon peas. Participation in NGO/Government programmes as an alternative strategy to reduce production risks was uncommon among maize farmers. This shows low involvement of such institutions in the districts.
Figure 7. Production risk coping risk strategies in study area. Source: Survey data, 2008.
Farmers were questioned about their perceptions and their adjustment options in terms of their crop portfolio to mitigate selected production risks (Table 24). The local maize area was relatively inelastic; farmers maintained the same area as the preferred option for most risk scenarios. This is in line with the general risk aversion associated with smallholder farmers and their fear of making a change; farmers would rather maintain the status quo with a hope that it will still work out. Nevertheless, farmers take on a relatively positive attitude in situations where fertilizer is available and affordable. Thus, when farmers are motivated with more affordable fertilizer and other inputs, more farmers will grow more maize. This agrees with the findings of Mangisoni (2007) that less expensive fertilizer has the potential to defeat Malawi’s food insecurity problem. Malawi has registered increased maize surpluses since the introduction of the fertilizer subsidy programme in 2005/06 season. Credit availability was generally also positively associated with more maize area, whereas it appeared to have little impact on other crops such as millet, cassava, sorghum, cotton, and sweet potato; probably linked to the crops input requirements and market orientation.

35
Table 25. Adjustment in crop portfolio to mitigate selected production risks in study area. Scenario Response of farmers in allocation of land for maize varieties under different scenarios Local landrace maize Improved OPV Hybrid Decrease Same Area Increase Total n Decrease Same Area Increase Total n Decrease Same Area Increase Total n Price less than normal Mangochi 1.19 78.57 20.24 100 84 4.76 76.19 19.05 100 21 0 83.33 16.67 100 24 Balaka 12.50 60.94 26.56 100 64 22.73 40.91 36.36 100 22 17.65 47.06 35.29 100 34 Whole sample 6.08 70.95 22.97 100 148 13.95 58.14 27.91 100 43 10.34 62.07 27.59 100 58 Price higher than normal Mangochi 3.57 71.43 25 100 84 4.76 42.86 52.38 100 21 4.17 58.33 37.50 100 24 Balaka 7.81 39.06 53.13 100 64 4.55 40.91 54.55 100 22 8.82 23.53 67.65 100 34 Whole sample 5.41 57.43 37.16 100 148 4.65 41.86 53.49 100 43 6.90 37.93 55.17 100 58 Yield less than normal Mangochi 0 67.06 32.94 100 85 0 36.36 63.64 100 22 0 75 25 100 24 Balaka 3.13 45.31 50 98.44 64 0 27.27 72.73 100 22 14.71 35.29 50 100 34 Whole sample 1.34 57.72 40.27 99.33 149 0 31.82 68.18 100 44 8.62 51.72 39.66 100 58 Yield higher than normal Mangochi 1.18 74.12 24.71 100 85 0 68.18 31.82 100 22 0 83.33 16.67 100 24 Balaka 0 50 50 100 64 4.55 50 45.45 100 22 0 29.41 70.59 100 34 Whole sample 0.67 63.76 35.57 100 149 2.27 59.09 38.64 100 44 0 51.72 48.28 100 58 Fertilizer available & affordable Mangochi 0 38.82 61.18 100 85 0 18.18 81.82 100 22 4.17 25 70.83 100 24 Balaka 0 28.13 71.88 100 64 0 36.36 63.64 100 22 0 20.59 79.41 100 34 Whole sample 0 34.23 65.77 100 149 0 27.27 72.73 100 44 1.72 22.41 75.86 100 58 Fertilizer less available & unaffordable Mangochi 4.71 90.59 4.71 100 85 4.55 86.36 9.09 100 22 4.17 91.67 4.17 100 24 Balaka 21.88 65.63 12.50 100 64 27.27 54.55 18.18 100 22 38.24 50 11.76 100 34 Whole sample 12.08 79.87 8.05 100 149 15.91 70.45 13.64 100 44 24.14 67.24 8.62 100 58 Credit is available & affordable Mangochi 0 50.59 49.41 100 85 0 27.27 72.73 100 22 4.17 37.50 58.33 100 24 Balaka 0 31.25 68.75 100 64 0 27.27 72.73 100 22 0 20.59 79.41 100 34 Whole sample 0 42.28 57.72 100 149 0 27.27 72.73 100 44 1.72 27.59 70.69 100 58 Source: Survey data, 2008.

36
4.4.2 Households’ perception about price risk and their coping mechanism One would expect output selling price to be one of the most important factors in commercial crop and livestock production. However, the importance of producing maize for home consumption implies that prices have only limited influence on maize sales, particularly for landraces (Table 25). Thus for smallholders, getting a higher price is not their major objective when they want to sell the maize. They are not interested in profit maximization but in cash income Most of the farmers sell the commodity when they have a vital need such as sickness, school fees, and other basic needs of the household. Furthermore, local maize has good taste, is easy to pound and is most preferred for home consumption. Improved varieties are grown mainly for sale, and are thus more sensitive to price changes
Selling price also affects input use on the farm, particularly for hybrid maize (Table 25). Farmers who sell their commodity increase their purchasing power and are motivated to grow more of the commodity.
Farmers’ decisions on acquiring more credit are also affected by the selling price of the crops (Table 25). Farmers would need credit to purchase more inputs to produce more maize in response to the attractive price. In contrast, the effect of crop output prices on assets such as livestock is relatively limited. Nevertheless, the two are complementary income sources for the household; in times of crop failure, farmers can sell household assets (e.g. livestock) to raise income. In contrast, if farmers have more money from crop sales they would likely acquire more livestock and other household assets.

37
Table 26. Major crop and livestock price risks farmers face in study area.
Local landrace maize Improved OPV Hybrid maize Groundnuts Frequency % Frequency % Frequency % Frequency %
Does selling price of local land race maize determine how much to sell? Yes 54 41.86 18 64.29 41 64.06 40 81.63 No 75 58.14 10 35.71 23 35.94 9 18.37 Total 129 100 28 100 64 100 49 100 How would fertilizer usage on local land race maize change if the selling price was attractive? Increase 77 53.47 22 59.46 47 66.20 24 48.98 Same 55 38.19 9 24.32 17 23.94 24 48.98 Decrease 12 8.33 6 16.22 7 9.86 1 2.04 Total 144 100 37 100 71 100 49 100 Would you acquire more credit for local land race maize if selling price was attractive? Yes 87 60.42 25 67.57 54 76.06 25 49.02 No 57 39.58 12 32.43 17 23.94 26 50.98 Total 144 100 37 100 71 100 51 100 What happens to assets if the local land race maize price decreases? Sell some 24 17.14 8 22.22 13 18.84 16 31.37 Unaffected 113 80.71 27 75 54 78.26 34 66.67 Keep more 3 2.14 1 2.78 2 2.90 1 1.96 Total 140 100 36 100 69 100 51 100 What happens to assets if the local land race maize price increases? Sell some 8 5.76 24 33.33 4 5.80 4 8 Unaffected 111 79.86 12 16.67 50 72.46 30 60 Keep more 20 14.39 36 50 15 21.74 16 32 Total 139 100 72 100 69 100 50 100 Just as in crop production risks, households also face price risks and use coping strategies. Cash crops were deemed most price-risky, including tobacco and cotton crops in Balaka and soybeans in Mangochi (Table 26). Farmers were divided on the riskiness of maize types. Farmers were also questioned as to their most important strategy to reduce or eliminate price risk for each crop. Most commonly, farmers took no action, or alternatively participated in NGO/Government programmes, involved in asset accumulation, or other strategies such as informal insurance (Table 26). Farmers in the districts get information about price risks from organizations such as extension officers, radio, NGOs, newspapers and fellow famers (Table 26).
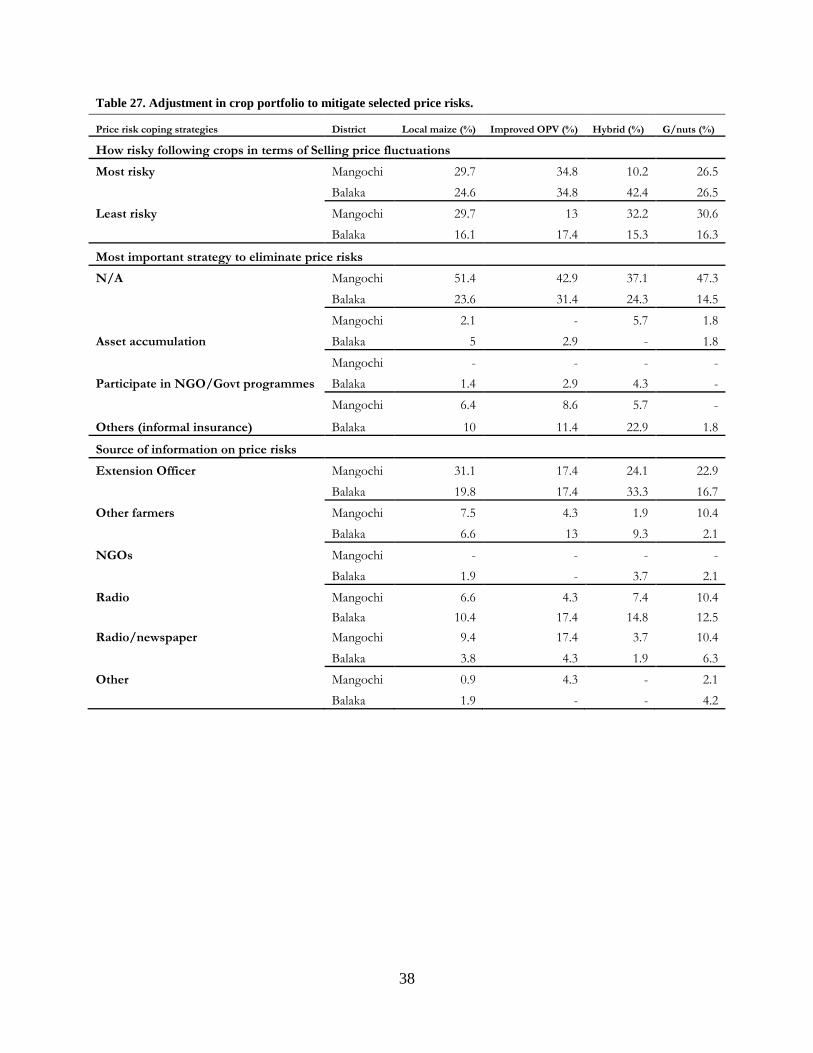
38
Table 27. Adjustment in crop portfolio to mitigate selected price risks.
Price risk coping strategies District Local maize (%) Improved OPV (%) Hybrid (%) G/nuts (%)
How risky following crops in terms of Selling price fluctuations
Most risky Mangochi 29.7 34.8 10.2 26.5
Balaka 24.6 34.8 42.4 26.5
Least risky Mangochi 29.7 13 32.2 30.6
Balaka 16.1 17.4 15.3 16.3
Most important strategy to eliminate price risks
N/A Mangochi 51.4 42.9 37.1 47.3
Balaka 23.6 31.4 24.3 14.5
Asset accumulation Mangochi 2.1 - 5.7 1.8
Balaka 5 2.9 - 1.8
Participate in NGO/Govt programmes Mangochi - - - -
Balaka 1.4 2.9 4.3 -
Others (informal insurance)
Mangochi 6.4 8.6 5.7 -
Balaka 10 11.4 22.9 1.8
Source of information on price risks
Extension Officer Mangochi 31.1 17.4 24.1 22.9
Balaka 19.8 17.4 33.3 16.7
Other farmers Mangochi 7.5 4.3 1.9 10.4
Balaka 6.6 13 9.3 2.1
NGOs Mangochi - - - -
Balaka 1.9 - 3.7 2.1
Radio Mangochi 6.6 4.3 7.4 10.4 Balaka 10.4 17.4 14.8 12.5 Radio/newspaper Mangochi 9.4 17.4 3.7 10.4
Balaka 3.8 4.3 1.9 6.3
Other Mangochi 0.9 4.3 - 2.1
Balaka 1.9 - - 4.2

39
5 Technology use in crop production
5.1 Input use by farm households Fertilizer and seed are the main inputs in crop production, although largely limited to maize production. Fertilizer includes both basal and top dressing. Biocide use is limited (Table 27).
Table 28. Agro-chemical use by households in study area. Input Mangochi Balaka Total
Frequency % Frequency % Frequency %
Base (NPK) fertilizer 76 85.4 55 90.2 131 87.3
Top dress fertilizer 73 82 41 67.2 114 76.0
Herbicides 0 0 1 1.6 1 0.7
Insecticides 0 0 7 11.5 7 4.7
Source: Survey data, 2008.
Crop inputs were acquired from different sources, with ADMARC and Agora the main fertilizer sources. Some organizations such as Kulima Gold and Smallholder Farmers Fertilizer Revolving Fund (SFFRF) were only available in Mangochi. Input source is important as it co-determines timely availability of the inputs. Agricultural production in Malawi is very seasonal because of the country’s major reliance on rainfall. Therefore, if inputs such as seeds and fertilizer are not available at the right time, such as during planting, low or poor yields may result. However, it is not certain as to whether these organizations are able to supply inputs on time.
5.2 Determinants of adoption of improved maize seed Use of improved maize varieties can be a function of several factors. Given the fact the majority of smallholder farmers in Malawi have been using local maize varieties in their subsistence agriculture (RATES, 2003), there are challenges in introducing new and improved maize breeds. The key factors affecting adoption and uptake intensity of improved maize varieties was analyzed using a Heckman two-stage model which accounts for selection issues as the intention was initially to determine the factors that influence adoption decisions and then factors that determine the intensity of adoption. The estimated results for this model are presented in Table 28.
Based on the model results, secondary school education, farming class, farmer association, and total off-farm household income significantly influence farmers’ decision to adopt improved maize seed in these two districts of Malawi. The poor farming class had a negative influence on adoption, which implies that poor households are less likely to adopt improved maize varieties. This could be attributed to the relative cost of purchase of the seed, of which most poor farmers cannot afford. However, total off-farm household income negatively affected farmers’ adoption. Thus, an increased off-farm income in the household implies that the household depends much on off-farm activities as opposed to farming, and therefore reduces its likelihood of adopting the improved maize technologies.

40
Secondary education positively influenced farmer adoption, thereby stressing the importance of education in farming. As noted by Larson (1977), farmers with high education are able to understand cultural practices and extension advices more than uneducated farmers, and are better able to understand the new agricultural technologies and practices, hence enhancing their probability of adopting it. Finally, participation in farmers’ associations such as farmer clubs or societies influences farmers’ decisions to adopt improved varieties positively. This signifies the influence of a group, as farmers tend to encourage each other within their associations. Again, when some farmers adopt and others observe the benefits of it, many within the group tend to follow suit.
The second stage of the model estimated the intensity of use of improved maize seed. This was captured by the proportion of the household farm size allocated to improved varieties. The results suggest that only the age of the respondent, farm size, and secondary education significantly influenced the intensity of adoption. Age had a positive impact, implying that older people tend to allocate more land to improved maize varieties than younger ones. This could be associated with one’s experience in using the improved variety. Farm size had a negative impact; thus, households with more land tend to allocate less land to improved maize varieties as compared to farmers in the middle wealth class. Again, a farmer with secondary education is likely to allocate more land to improved maize varieties due to his/her better knowledge and understanding of the new and improved technology. Other factors were not significant.

41
Table 29. Factors influencing the adoption of improved maize cultivars.
Factors Coefficient z-core P>z
Adoption Model Gender of respondent 0.036 0.100 0.919
Age of respondent 0.004 0.450 0.653
Farm size 0.164 1.350 0.179
Primary education -0.347 -0.820 0.415
Secondary education 0.695* 1.690 0.091
Poor farming class -0.666† -2.770 0.006
Rich farming class 0.951† 2.810 0.005
Access to credit 0.306 0.810 0.418
Farmer association participation 0.729* 1.660 0.096
Time improved variety grown 0.038 1.550 0.122
Total non-farm income 0.0001‡ -2.480 0.013
Constant -0.092 -0.210 0.836
Adoption Intensity Model
Gender of respondent -0.109 -1.230 0.218
Age of respondent 0.005* 1.930 0.054
Farm size -0.077‡ -2.490 0.013
Marital status 0.075 0.820 0.411
Primary education -0.095 -0.890 0.372
Secondary education 0.213‡ 2.070 0.038
Poor class 0.083 0.780 0.437
Rich class 0.001 0.010 0.991
Access to credit -0.045 -0.420 0.673
Time improved variety grown 0.000 -0.070 0.944
Household income -0.015 -0.830 0.409
Constant 0.137 0.610 0.542
Mills lambda 0.132 0.550 0.585
Rho 0.454
Sigma 0.290
Lambda 0.132 Note: †, ‡, and * denote statistical significance at α < 1%, 5% and 10%, respectively.
Source: survey data 2008
.

42
6 Conclusions and recommendations
This household survey aimed to characterize the maize-producing households in the Balaka and Mangochi districts of Malawi, and to assess their adoption of improved maize varieties. Land pressure implies that most of the arable land is under crop production. Maize is the most commonly grown crop in the districts, followed by groundnuts, vegetables, sorghum and millet. The allocation of land to farming was determined by several factors such as expected food needs of households, cash availability to buy inputs, availability of seeds, expected family labor, current and expected grain price, and cash availability to hire labor. Cash availability ranked high because grain production in Malawi depends heavily on the timely availability of reliable inputs such as seed and fertilizer. There was limited access to credit in both districts, confirming that in Malawi, access to cash and input credit is a serious constraint to farming and other rural businesses. Lending institutions in Malawi require collateral and impose conditions that further constrain farmers’ access to credit. A number of institutions were present in the two districts, including Sasakawa Global 2000, World Food Programme, Save the Children and Total Life Care. These institutions provided support in form of cash, treadle pumps, seed, fertilizer, relief food, and insecticides to farmers. Government and NGOs provided extension. Major sources of inputs for crop production were ADMARC, Agora, Kulima Gold and traders/vendors.
Maize seed includes local maize, hybrid maize and improved OPVs, with an increasing reliance on improved varieties because of their high yielding potential and early maturing attributes. The households consumed most of the harvested produce. Local maize was grown mostly for consumption while improved maize varieties were dual purpose. Other crops such as millet, sorghum, and cowpeas were mostly consumed within the household. Agriculture and business were the main sources of income, with business relatively more important in Mangochi.
Households aimed to improve their livelihoods through increasing agricultural production and food security, reducing agricultural production risks, improving the health status of household members, and increasing the education level of household members. For this, household members aimed to improve their businesses, increase food production, and increase their access to adequate inputs. However, the households’ livelihoods were also threatened by various factors. Major shocks in the two districts were drought, floods, illness, erratic rainfall, and large increases in input prices. Droughts and floods adversely affect food, water, health, energy and sustainable livelihoods of the households. Crop production risks manifested themselves in the form of price and yield fluctuations, and availability and affordability of fertilizer. Crops vary in their perceived riskyness and Farmers attempted to reduce production risks through varietal and crop diversification, going into activities outside agriculture, and participating in NGO and government programs.
Based on the results, the study makes the following recommendations:
− The government should promote actions that make the agricultural sector less prone to erratic weather and climatic change. Improved crops, such as drought-tolerant and early maturing maize could help to reduce the impact of drought and therefore improve food security in the districts.
− Farmers’ exposure to modern and improved farming technologies should be enhanced through frequent training and field demonstrations. This will help farmers to improve both the quantity and quality of agricultural products.

43
− Credit accessibility is very low in the areas and this poses a serious constraint to farmers operations. As such, there is need for the government and financial institutions (such as Malawi Rural Finance Company) and commercial banks to find practical ways of assisting farmers to access credit. Farmers should thereby be encouraged to form cooperatives and associations to increase their bargaining power and chances of credit access and enhance their livelihoods.

44
References
Cameron, A.C. and P.K. Trivedi. 2005. Microeconometrics: Methods and applications. Cambridge. Cambridge University Press.
Chirwa, E.W. 1999. Food marketing reforms and integration of maize and rice markets in Malawi.
Working Paper, University of Malawi, Zomba, Malawi. Cortinovis I., V. Vela and J. Ndiku. 1993. Construction of a socio-economic index to facilitate
analysis of health in data in developing countries. Social Science and Medicine 36: 1087–97.
Filmer, D., Pritchett, L.H., 2001. Estimating wealth effects without expenditure data--or tears: an application to educational enrollments in states of India. Demography, 38 (1) 115-132. Gillespie, S. and S. Kadiyala. 2005. HIV/AIDS and food and nutrition security: Interaction and
response. American Journal of Agricultural Economics 87(5), 1282-1288. GOM. 2006a. Malawi’s National Adaptation Programmes of Action - United Nations Framework
Convention on Climate Change. First Edition. Ministry of Mines, Natural Resources and Environment. Environmental Affairs Department. Lilongwe, Malawi.
GOM. 2006b. Social economic profile, Salima District. Lilongwe. GOM. 2003. Vulnerability and adaptation assessments to climate change impacts in Malawi.
Final draft. Ministry of Natural Resources and Environmental Affairs. Environmental Affairs Department. Lilongwe, Malawi.
Greener, R., K. Jeffiris, H. Simpambe. 2000. The impact of HIV/AIDS on poverty and inequality in
Botswana. Southern Africa Journal of Economics: 68(5). 889-915. Haddad, L. and S. Gillespie. 2001. Effective food and nutrition policy responses to HIV/AIDS:
What we know and what we need to know. Journal of International Development: 13, 487-511. Hassan, R, and C. Nhemachena. 2008. Determinants of climate adaptation strategies of African
farmers: Multinomial Choice Analysis. African Journal of Agricultural and Resource Economics 2 (1), 83-104.
Kurukulasuriya, P. and R. Mendelsohn. 2008a. A Richardian analysis of the impact of climate on
Africa cropland. African Journal of Agricultural and Resource Economics 2 (1), 1-23. Kurukulasuriya, P. and R. Mendelsohn 2008b. Crop switching as a strategy for adapting to climate
change. African Journal of Agricultural and Resource Economics 2 (1), 105-125. Larson, W.D. and H.Y. Hu. 1977. Factors Affecting the supply of off-farm labor among small
farmers in Taiwan. American Journal of Agricultural Economics 59(3), 549-553.

45
Mangisoni J.H. 2008. Baseline study of potato production in Malawi: A case study of Dedza and Ntcheu Districts. Final consultancy report. The International Potato Center.
Mangisoni J.H. 2007. Input voucher study in Malawi, Mozambique, and Zambia. Synthesis Report.
Food, Agriculture and Natural Resources Policy Analysis Network., September 2007. Mangisoni, J. H., L.R. Roberto, T. Girma and W. Mwangi .2010. Characterization of Maize
Producing Communities in Balaka and Mangochi Districts of Malawi. Unpublished mimeo, Lilongwe, Malawi.
Molua, E.L. 2008. Turning up the heat on African agriculture: The impact of climate change on
Cameroon’s agriculture. African Journal of Agricultural and Resource Economics 2 (1), 45-64. McKenzie, D.J. 2003. Measure inequality with asset indicators. BREAD Working Paper No. 042.
Cambridge, MA: Bureau for Research and Economic Analysis of Development, Center for International Development, Harvard University.
Montgomery, M.R., K. Gragnolati, A. Burke and E. Paredes. 2000. Measuring living standards with
proxy variables. Demography 37: 155–74. Ngo’ong’ola, H.D., R.N. Kachule and P.H. Kabambe. 1997. The maize market in Malawi. Lilongwe:
APRU. Nucifora, A. 2004. Lessons in managing policy dialogue in Malawi: Reforming the Agricultural
Development and Marketing Corporation. World Bank, Washington D.C. O’Brien, K., S. Eriksen, A. Schjolden and L. Nygaard. 2004. What’s in a word? Conflicting
interpretation of vulnerability in climate change research. CICERO Working Paper 2004:04, Centre for International Climate and Environmental Research, Oslo, Norway.
Okello-Uma, I and M. Bohloa. 2008. Assessment of experience, feasibility and interest in using
agricultural input vouchers to support smallholders to improve productivity in Lesotho. Draft Report, October 2008.
Phiri, M.A.R. 2006. Malawi agriculture commodity exchange baseline survey. Bunda College of
Agriculture, Lilongwe, Malawi. RATES. 2003. Maize Market Assessment and Baseline Study for Malawi. RATES Center, Nairobi,
Kenya. [email protected] Seo, S.N. and R. Mendelson. 2008. Animal husbandry in Africa: Climate change impacts and
adaptation. African Journal of Agricultural and Resource Economics 2 (1), 65-82. Shahidur, R. 2004. Spatial integration of maize markets in post-liberalized Uganda. International
Food Policy Research Institute (71). Available at http://www. ifpri.org.

46
Tostăoa, E., J. Mutonda , H. Zavale, B. Araujo and V. Xavier . 2007. Potential impact of voucher programmes on input market development in Mozambique. Discussion Paper. Rough draft Food, Agriculture and Natural Resources Policy Analysis Network.
Thornton, P.K., P.G. Jones, T. Owiyo, R.L. Kruska, M. Herrero, V. Orindi, S. Bhadwal, P.
Kristjanson, A. Notenbaert, N. Bekele and A. Omodo. 2008. Climate change and poverty in Africa: Mapping hotspots of vulnerability. African Journal of Agricultural and Resource Economics 2 (1), 24-44
United Nations. 2003. Community realities and responses to HIV/AIDS in Sub-Saharan Africa.
New York: United Nations.