Characterization of low molecular weight carbohydrates in ...
277
Characterization of low molecular weight carbohydrates in dietary foods by chromatographic techniques coupled to mass spectrometry by Roberto Megías Pérez a Thesis submitted in partial fulfillment of the requirements for the degree of Doctor of Philosophy in Chemistry Approved Dissertation Committee Prof. Dr. Nikolai Kuhnert Professor of Chemistry, Jacobs University Bremen Prof. Dr. Matthias Ullrich Professor of Microbiology, Jacobs University Bremen Prof. Dr. Dirk Carl Albach Professor of Biodiversity and Evaluation of Plant, Carl- von Ossietzky Universität Oldenburg Date of Defense: 20 th December 2018 Department of Life Sciences and Chemistry
Transcript of Characterization of low molecular weight carbohydrates in ...

Characterization of low molecular weight
carbohydrates in dietary foods by chromatographic
techniques coupled to mass spectrometry
by
Roberto Megías Pérez
a Thesis submitted in partial fulfillment
of the requirements for the degree of
Doctor of Philosophy
in Chemistry
Approved Dissertation Committee
Prof. Dr. Nikolai Kuhnert
Professor of Chemistry, Jacobs University Bremen
Prof. Dr. Matthias Ullrich
Professor of Microbiology, Jacobs University Bremen
Prof. Dr. Dirk Carl Albach
Professor of Biodiversity and Evaluation of Plant, Carl-
von Ossietzky Universität Oldenburg
Date of Defense: 20th December 2018
Department of Life Sciences and Chemistry


Statutory Declaration
Family Name, Given/First Name Megias Perez, Roberto
Matriculation number 20331333
What kind of tesis are you submitting: Bachelor-
, Master- or PhD-Thesis
PhD-thesis
English: Declaraction of Authorship
I hereby declare that the thesis submitted was created and written solely by myself without any
external support. Any sources, direct or indirect, are marked as such. I am aware of the fact that
the contents of the thesis in digital form may be revised with regard to usage of unauthorized
aid as well as whether the whole or parts of it may be identified as plagiarism. I do agree my
work to be entered into a database for it to be compared with existing sources, where it will
reimain in order to enable further comparisons with future theses. This does not gran any rights
of reproduction and usage, however.
The thesis has been written independently and has not been submitted at any other university
for the conferral of a PhD degree; neither has the thesis been previously published in full.
German: Erklärung der Autorenschaft (Urheberschaft)
Ich erkläare hiermit, dass die vorliegende Arbeit ohne fremde Hilfe ausschließlich von mir
erstellt und geschrieben worden ist. Jedwede verwendeten Quellen, direkter oder indirekter Art,
sin als solche kenntlich gemacht worden. Mir ist die Tatsache bewusst, das der Inhalt der Thesis
in digitaler Form geprüft werden kann im Hinblick darauf, ob es sich ganz oder in Teilen un
ein Plagiat handelt. Ich bin damit einverstanden, dass meine Arbeit in einer Datenbank
eingegeben werden kann, um mit bereits bestehenden. Quellen verglichen zu werden und dort
auch verbleiblt, um mit zukünftigen Arbeiten verglichen werden zu können. Dies berechtigt
jedoch nich zur Verwendung oder Vervielfältigung.
Diese Arbeit wurde in der vorliegenden Form weder einer anderen Prüfungsbehörde vorgelegt
noch wurde das Gesamtdokument bisher veröffentlicht.
…………………………………………………………………………………………………...
Date, signature


Diligence is the mother of good fortune, and idleness, its opposite, never
brought a man to the goal of any of his best wishes.
Miguel de Cervantes


To my mother for her encouragement, lifelong support and unconditional love.
To the person that recommend me not to make a PhD thesis. Despite
everything and not having considered your opinion, you have always been there
in these years.

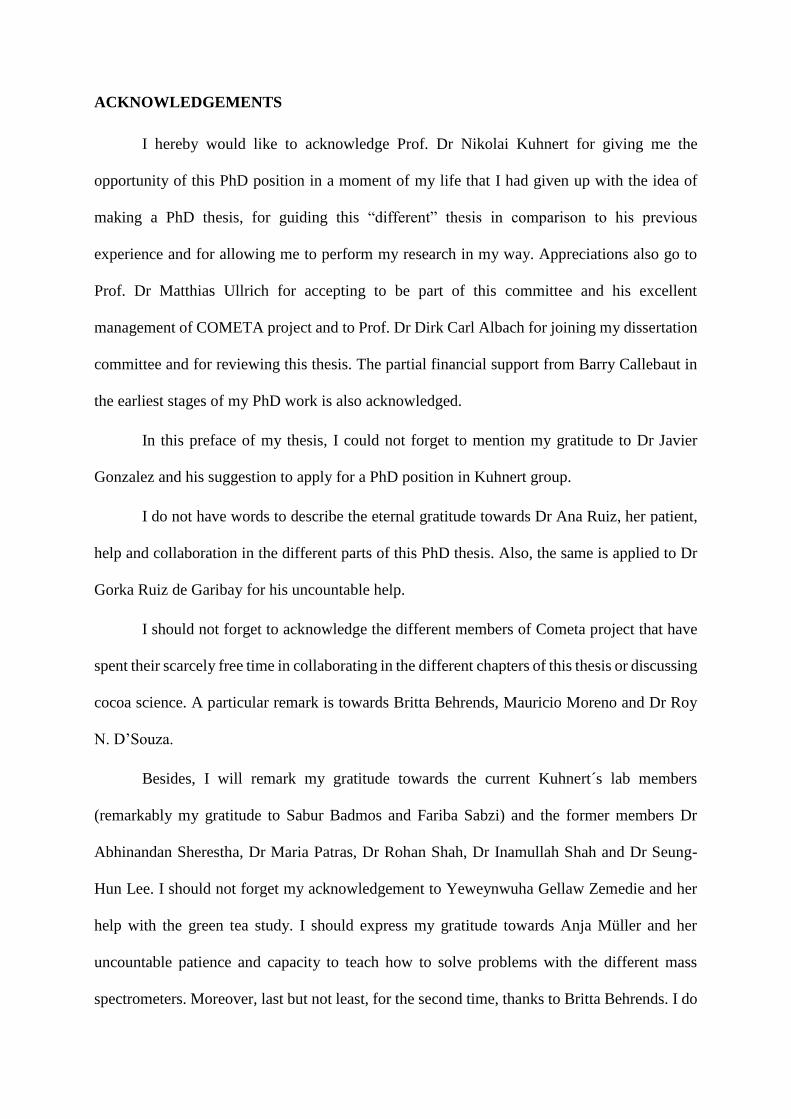
ACKNOWLEDGEMENTS
I hereby would like to acknowledge Prof. Dr Nikolai Kuhnert for giving me the
opportunity of this PhD position in a moment of my life that I had given up with the idea of
making a PhD thesis, for guiding this “different” thesis in comparison to his previous
experience and for allowing me to perform my research in my way. Appreciations also go to
Prof. Dr Matthias Ullrich for accepting to be part of this committee and his excellent
management of COMETA project and to Prof. Dr Dirk Carl Albach for joining my dissertation
committee and for reviewing this thesis. The partial financial support from Barry Callebaut in
the earliest stages of my PhD work is also acknowledged.
In this preface of my thesis, I could not forget to mention my gratitude to Dr Javier
Gonzalez and his suggestion to apply for a PhD position in Kuhnert group.
I do not have words to describe the eternal gratitude towards Dr Ana Ruiz, her patient,
help and collaboration in the different parts of this PhD thesis. Also, the same is applied to Dr
Gorka Ruiz de Garibay for his uncountable help.
I should not forget to acknowledge the different members of Cometa project that have
spent their scarcely free time in collaborating in the different chapters of this thesis or discussing
cocoa science. A particular remark is towards Britta Behrends, Mauricio Moreno and Dr Roy
N. D’Souza.
Besides, I will remark my gratitude towards the current Kuhnert´s lab members
(remarkably my gratitude to Sabur Badmos and Fariba Sabzi) and the former members Dr
Abhinandan Sherestha, Dr Maria Patras, Dr Rohan Shah, Dr Inamullah Shah and Dr Seung-
Hun Lee. I should not forget my acknowledgement to Yeweynwuha Gellaw Zemedie and her
help with the green tea study. I should express my gratitude towards Anja Müller and her
uncountable patience and capacity to teach how to solve problems with the different mass
spectrometers. Moreover, last but not least, for the second time, thanks to Britta Behrends. I do

not hesitate to affirm that the short coffee breaks in Friseur and our lunch conversations are and
will be linked to the best moment of this complex PhD.
Outside the science in Jacobs, I have to recognize Thilo Ziegenhagen, Dr Marvin
Madrigal, Ana Gaby Victorino and the rest of the friends I met in Block A of Nordmetall
Collegue for the unforgettable moments lived in Bremen.
Besides, from a personal point of view, I must remark in this thesis a special
acknowledgement to the members of the “Group of chemistry and functionality of
carbohydrates and derivatives” from CIAL in the period 2010-2012 (Dr Ana Ruiz, Ana Belen
Garcia-Bermejo, Paula Copovi, Dr Marta Corzo, Dr Juliana Gamboa, and my bosses Prof. Dr.
Mar Villamiel and Dr Antonia Montilla). Thanks to that job, I was introduced in the exciting
scientific field of carbohydrates analysis applied to food science.
From my personal point of view, I would like to thank my friends Rosa Muñoz and
Enrique F. Patiño (comrades in chemistry studies with whom the exile in Ciudad Real was much
more colorful), Almudena Zamorano, Diana Velázquez and Dr. Margot Roig (comrades in
biochemistry studies from whom I learned everything), Luis Quo (unforgettable moments with
your motorbike) and Dr. Gorka Ruiz de Garibay (until now, the experience in Madrid with you
could be considered once-in-a-lifetime), as well as the rest of my friends not expressly
mentioned.
This preface ends with a special acknowledgement to my brother Enrique Megias and
my mother Maria Jesus Perez.

TABLE OF CONTENTS
1
Table of Contents
LIST OF ABBREVIATIONS .......................................................................................................................... 3
ABSTRACT ................................................................................................................................................ 5
INTRODUCTION ....................................................................................................................................... 7
Chapter 1. Overview of carbohydrates ................................................................................................ 9
1. 1. Definition and classification of carbohydrates ........................................................................ 9
1.2. Physicochemical properties of carbohydrates ........................................................................ 13
1.3. LMWC: from plant biology to bioactive properties, and their applications ........................... 18
Chapter 2. Analytical techniques employed in the analysis of carbohydrates. ................................. 31
2.1. Determination of total carbohydrates by colorimetric analysis-sum parameters ................... 31
2.2. Gas chromatography applied to the analysis of carbohydrates. ............................................. 31
2.3. LC operation modes for the analysis of carbohydrates .......................................................... 33
Chapter 3. Dietary food ..................................................................................................................... 41
3.1. Cocoa ...................................................................................................................................... 41
3.2. Green tea. ................................................................................................................................ 45
3.3. Kale ........................................................................................................................................ 48
AIM OF THE STUDY ................................................................................................................................ 63
RESULTS ................................................................................................................................................. 67
Part-1 LMWC in cocoa beans (chapter 4-6) ...................................................................................... 69
Chapter 4. Profiling, quantification and classification of cocoa beans based on chemometric analysis
of carbohydrates using hydrophilic interaction liquid chromatography coupled to mass
spectrometry. ..................................................................................................................................... 71
TABLE OF CONTENTS
2
Chapter 5. Analysis of minor low molecular weight carbohydrates in cocoa beans by
chromatographic techniques coupled to mass spectrometry ........................................................... 103
Chapter 6. Monitoring the changes of low molecular weight carbohydrates in cocoa beans during
spontaneous fermentation: a chemometric and kinetic approach .................................................... 131
Part 2 – LMWC in commercial green tea and kale (chapter 7 and 8) ............................................. 153
Chapter 7. Characterization of commercial green tea leaves by the analysis of low molecular weight
carbohydrates and other quality indicators. ..................................................................................... 155
Chapter 8. Changes in low molecular weight carbohydrates in kale during development and
acclimation to cold temperatures determined by chromatographic techniques coupled to mass
spectrometry .................................................................................................................................... 185
GENERAL CONCLUSIONS ..................................................................................................................... 211
SUPPLEMENTARY INFORMATION ....................................................................................................... 217
Supplementary information of Chapter 4 ........................................................................................ 219
Supplementary information of Chapter 5 ........................................................................................ 245
Supplementary information of Chapter 6 ........................................................................................ 255
Supplementary information of Chapter 7 ........................................................................................ 259

3
LIST OF ABBREVIATIONS
GC Gas chromatography
MS Mass spectrometry
NMR Nuclear Magnetic Resonance
LMWC Low molecular weight carbohydrates
PCA Principal component analysis
ANOVA One-way analysis of variance
LOQ Limit of quantification
LOD Limit of detection
ESI Electrospray source ionization
TOF Time of flight
CGT Commercial green tea
SPE Solid Phase Extraction
LC Liquid chromatography
TLC Thin-Layer Chromatography
NPLC Normal Phase Liquid Chromatography
HILIC Hydrophylic interaction Liquid Chromatography
RPLC Reverse Phase Liquid Chromatography
ESI Electrospray source ionization
HPAEC High-performance anion-exchange chromatography
RDI Recommended daily uptake
RFO Raffinose familiy oligosaccharides
OF Other Fermentation


5
ABSTRACT
The present thesis reports the development and use of chromatographic techniques coupled to
mass spectrometry for the characterization of low molecular weight carbohydrates (LMWC) in
dietary foods of economic relevance or identified as “functional food”.
The interest for the analysis of LMWC in different dietary foods is based on the involvement
of these compounds in biological reactions in plants and the bioactive properties reported for
some LMWC. A general overview of the carbohydrates, the analytical methodologies to
perform their analysis and a brief description of the different dietary foods selected for this
study (cocoa beans, commercial green tea and kale) are reported in the different chapters
(chapter 1-3) of the introduction.
The study of LMWC in cocoa beans includes three chapters (chapter 4-6). The content of
chapters 4 and 5 is a comprehensive characterization of the LMWC profile in cocoa beans using
HILIC-ESI-TOF MS, HILIC-ESI-MSn and GC-MS, the quantification of the main and minor
LMWC from different origins and a proposal of different indicators of fermentation. Chapter 6
covers a detailed chemometric and kinetic approach to monitor the LMWC changes during the
spontaneous fermentation of cocoa beans. Different reaction mechanisms of the degradation
and formation of LMWC during cocoa fermentation have been discussed.
The study of commercial green tea (chapter 7) evaluates the LMWC together with other
physical and chemical established quality indicators (soluble solids, color and antioxidant
capacity) to characterize CGT. This approach has resulted to be useful for the characterization
of the samples according to the type of processing employed during the manufacturing.
Chapter 8 reports the identification for the first time of different LMWC in kale. This chapter
also includes the analysis of the LMWC content in three types of kale during the development
of the plant, as well as the monitoring of the changes produced as a consequence of cold
temperatures during farming.


INTRODUCTION

INTRODUCTION
9
Chapter 1. Overview of carbohydrates
1. 1. Definition and classification of carbohydrates
Carbohydrates are one of the most abundant constituents present in all living organisms. This
group of compounds, described first by Emil Fisher, has different essential roles as energy
source, structural function and forms the basis of cell-cell recognition. This group of
metabolites, produced by plants via photosynthesis, are considered as primary nutrients
involved in plant nutrition and metabolic processes. Carbohydrates are naturally present in food,
but they may also be added for the improvement of sensorial, functional and technological
properties.
Carbohydrates are a group of biomolecules consisting of carbon (C), hydrogen (H) and oxygen
(O) atoms, usually with a ratio hydrogen-oxygen of 2:1 (as H2O). Based on the empirical
formula Cn(H2O)n, these compounds were denominated carbohydrates because, in composition,
they are apparently hydrates of carbon. Carbohydrates are classified as monosaccharides,
oligosaccharides and polysaccharides according to their degree of polymerization. Recently,
the use of the acronym low molecular weight carbohydrates (LMWC) is increasing to include
monosaccharides, disaccharides and oligosaccharides and other class of compounds such as
inositols or alditols.
Monosaccharides are the simplest form of carbohydrates. Structurally, monosaccharides are
formed by a linear carbon skeleton with a length between three and eight carbon atoms. The
structure of a monosaccharide contains a carbonyl functional group, while each of the remaining
carbon atoms are bonded to one hydroxyl group. Monosaccharides are classified as aldoses or
ketoses in function of the position of the carbonyl group. In aldoses, the carbonyl group is
located in terminal positions, while in ketoses the carbonyl group is commonly located in the
position 2 of the carbon chain. The disposition of atoms in the structure of carbohydrates results

CHAPTER 1
10
in multiple stereogenic centres. A stereogenic centre is defined as one carbon atom carrying
four different substituents, without any element of symmetry present.
The presence of a stereogenic centre in a molecule results in the existence of several versions
of this molecule, called stereoisomers. Stereoisomers are isomeric molecules with the same
molecular formula and similar sequence of bonded atoms (constitution), differing in the
orientations of the atoms in space. The number of stereoisomers is calculated as 2n, with n
representing the number of stereogenic centres. Two stereoisomers are enantiomers when they
are mirror images of each other. Stereoisomers that are not mirror images are called
diastereoisomers.
In solution, carbohydrates form several chemical species in equilibrium, being the most
common species the cyclic conformations. The cyclization reaction can take places between
any hydroxyl group and the carbonyl group from the aldehyde or ketone group. The more stable
cyclic conformations in carbohydrates are furanoses, characterized by a ring structure of five
carbon atoms, and pyranoses, characterized by a ring structure of six carbon atoms. After the
cyclization, the carbonyl group (with the anomeric carbon) allows two spatial orientations of
the hydroxyl group bound to the anomeric carbon. These two orientations allow the
classification of the carbohydrates into two anomers: alpha and beta. When the anomeric carbon
is not taking part in any further chemical bond, it provides to the carbohydrates reducing
properties.
Oligosaccharides are defined by the number of their constituent monosaccharides (between 2
and 10), type of O-glycosidic linkage (example 14, 16), the composition of the monomeric
units and the stereochemistry of the anomeric centre. The linkage between monosaccharides is
established between the anomeric carbon of the first monosaccharide and the hydroxyl group
bound to a carbon (anomeric or not) of the second monosaccharide, with the subsequent loss of

INTRODUCTION
11
a water molecule. In a few cases, a linkage can be established between two anomeric carbons,
for example, the case of sucrose and trehalose.
Polysaccharides are defined as polymers constituted by linear and ramified chains of
monosaccharides. Inulin, cellulose, starch, chitin and glycogen are the more common
polysaccharides.
The generic denomination of “carbohydrate”, apart from the compounds above mentioned, also
includes their derivatives such as alditols, cyclitols, uronic acids and iminosugars. Alditols are
derived from the reduction of the carbonyl group of a monosaccharide. Alditols are named using
the prefix from the carbohydrate from which they are derived and the suffix –itol.
Cyclitols are cyclic polyalcohols in which at least three of the carbon atoms have a hydroxyl
group. This category includes the inositols, whose structure is a ring of six carbon atoms with
a hydroxyl group on each of them. There are nine isomers, which differ from each other by the
axial or equatorial disposition of their hydroxyl groups. The nomenclature for these compounds
employs the prefixes: cis-, epi-, allo-, neo-, myo-, muco-, D-chiro-, L-chiro- and scyllo-inositol.
Uronic acids are formed through the oxidation of a primary alcohol from a carbohydrate to a
carboxylic acid. Uronic acids are named using the prefix from the carbohydrate from which
they are derived and the suffix –uronic.
Iminosugars, also called azasugars or polyhydroxy alkaloids, derive from the substitution of the
endocyclic oxygen atom by a nitrogen atom. The structure is based on rings of five and six
carbon atoms, can be mono- or multicyclic and must include a minimum of two hydroxyl
groups. According to their chemical structure, iminosugars are classified as piperidines,
pyrrolidines, indolizidines, pyrrolidines and nortropanes. Selected structures of the different
LMWC that are the focus of this PhD thesis are shown in Figure 1.

CHAPTER 1
12
Figure 1 The structures of the different LMWC that are the focus of this PhD thesis. 1) Fructose, 2) Glucose, 3)
Galactose, 4) Mannitol, 5) Sorbitol, 6) myo-inositol, 7) scyllo-inositol, 8) Galactinol, 9) Sucrose, 10) Maltose, 11)
Melibiose, 12) Raffinose, 13) 1-kestose, 14) Stachyose.

INTRODUCTION
13
1.2. Physicochemical properties of carbohydrates
1.2.1. Energy content
One of the most important properties of the carbohydrates is their role as a source of energy.
The energy provided by the different type of carbohydrates is estimated as 4 kcal/g for
monosaccharides and disaccharides, as 1.6 kcal/g for alditols and as 2.4 kcal/g for cyclitols [1].
1.2.2. Solubility
The monosaccharides and oligosaccharides are generally soluble in aqueous solvents. Solvents
that allow hydrogen bonding interactions, such as formamide, dimethylformamide, dimethyl
sulfoxide and pyridine are most commonly used to solubilize unmodified carbohydrates.
Some polysaccharides such as pectins, are soluble in aqueous solvents while others like
cellulose and starch are often insoluble in aqueous solvents. The difference in solubility is
attributed to the three-dimensional structure of the polysaccharide [2]. Lineal polysaccharides
with a regular conformation can form cristaline structures and therefore tend to be insoluble in
aqueous solvents. Solubility increases in polysaccharides with a higher degree of branching,
since cristalization is prevented due to steric effects.
1.2.3. Hygroscopicity
The hydroxyl groups present in the carbohydrate structure can establish hydrogen bonds with
water, providing hygroscopic properties.
Carbohydrates often contain substantial amounts of water even after drying processes. For
example, alginic acid, a polysaccharide found in seaweed, acts as an anti-desiccant maintaining
the viability of seaweed washed ashore on hot beaches [3].
1.2.4. Crystallinity
Carbohydrates show a wide range of crystallinity. Sucrose and cellulose are the most
representive crystalline carbohydrates. Cellulose is probably the most widely distributed
organic molecule found in nature and is a mixture of crystalline an amorphous regions.

CHAPTER 1
14
Common sugar is produced in significant quantities as pure sucrose crystals. Apart from these
examples, most carbohydrates are not easily crystallized and are often isolated or synthesized
as amorphous solids or syrups [2].
1.2.5. Viscosity and Surface Activity
Polysaccharides are among the most viscous natural products, many of them are used in the
food industry as gelling agents, thickeners and high viscosity agents.
The length or molecular weight of a polysaccharide has a positive correlation with its viscosity.
The measurement of the molecular weight based on viscosity (MV) serves as a useful means
for polysaccharide characterization.
Polysaccharides lower the surface tension of aqueous solutions and their affinity for the oil-
water interface gives them great significance as emulsifiers [2].
1.2.6. Sweetness
The main characteristic of carbohydrates is the sweet taste. The sensation of sweet taste is a
consequence of the binding capacity of many carbohydrates, with different affinity, to the
human receptors TAS1R1, TAS1R2 and TAS1R3 [4]. These receptors are expressed in the
tongue and the soft palate [5]. Different studies in cell-based assays and knockout mice
demonstrated that the subunits T1R2 and T1R3 heteromerise to constitute the sweet taste
receptors, whereas the T1R1 and T1R3 subunits form a heterodimeric receptor for umami taste
[4]. The sweet taste receptors belong to the family of G protein-coupled receptors (GPCRs).
The binding of mono-, di-, oligosaccharides and their corresponding alditols produces the
activation of this receptor. The strength of the activation of the sweet taste receptor by a
sweetener correlates with their relative sweetness intensity [4], which is determined by dilution
assays using human sensory panels. A scheme of the human receptor is shown in Figure 2.
The intensity, quality and temporal profile (defined as the changes in intensity over time) of the
sweetness vary with each specific carbohydrate [6]. The intensity of the sweet flavour decreases

INTRODUCTION
15
as the length of the chain increases. The influence of the stereochemistry (α- or β-) on the
sweetness of carbohydrates has previously been reported. For instance, isomaltose (6-α-D-
glucopyranosyl-D-glucose) is sweet, but its anomer, gentiobiose (6-β-D-glucopyranosyl- D-
glucose) is bitter [7].
Sucrose is commonly used as a sweetener, noteworthy for its pleasant flavour, even at high
concentrations. Even, some authors have used this carbohydrate as a reference in a relative scale
of sweetness [8].
Figure 2 Structure of the human sweetness receptor
1.2.7. Color and flavour precursors
Carbohydrates are precursors of color and flavor compounds via caramelization and Maillard
reactions. Both reactions take place simultaneously at an elevated temperature.
1.2.7.1. Caramelization
The caramelization reaction occurs when temperatures above 110°C are applied to
carbohydrates. In this reaction, any carbohydrate can be a substrate, without the need of other
reactants.
During the reaction, different fragmentation reactions occur, producing volatile compounds
responsible for flavor. Also, different reactions of condensation or polymerization occur

CHAPTER 1
16
yielding large molecules responsible for color and texture [9, 10]. The products show dark
brown color, characteristic aromas and flavors. However, if the reaction is extended in time,
this can result in undesirable sensorial attributes due to the production of soluble and very dark
compounds [6, 11].
1.2.7.2. Maillard reaction
Louis Camille Maillard in 1912 described the formation of pigments as a result of the reaction
between glucose and glycine. This author named the pigments formed in this reaction as
melanoidins.
Maillard reaction start with the condensation of amino groups from protein, peptides and amino
acids with carbonyl groups on reducing carbohydrates. The first product is a Schiff base, which
results in an Amadori or Heyns rearrangement yielding Amadori or Heyns products. The
reactions will continue with the fragmentation of Amadori and Heyns compounds to reactive
α-dicarbonyl species. These compounds react with nucleophiles such as other amines,
guanidines, and thiols. The products react through Strecker degradation by condensation with
free amino acids, forming imines. Imines will fragment to form Strecker aldehydes, compounds
related to the organoleptic properties [12-14]. In food science, these reactions are known to
describe the non-enzymatic browning reactions of food as a consequence of the application of
a heat source. A simplified scheme of the different reactions involved in Maillard reaction
adapted from the review published by Lund et al. [15] is shown in Figure 3.

INTRODUCTION
17
Figure 3 Simplified scheme of the different reactions involved in Maillard reaction

CHAPTER 1
18
1.3. LMWC: from plant biology to bioactive properties, and their applications
1.3.1. LMWC in plant biology
1.3.1.1. Monosaccharides and disaccharides
Photosynthesis is the process by which green plants use the electromagnetic energy from
sunlight to catalyze the “de novo” biosynthesis of carbohydrates. Briefly, photosynthesis occurs
in an organelle called chloroplast that contains all the enzymes and structures needed to perform
the biosynthetic process. Photosynthesis is divided into two phases, the light dependent and the
light independent, also called the Calvin cycle.
In the light-dependent phase, the energy from sunlight is absorbed by chlorophylls and
converted into electron carrier molecules, nicotinamide adenine dinucleotide phosphate in
reduced form (NADPH) and energy carrier molecules, adenosine triphosphate (ATP). A
specialized membrane within the chloroplast, called thylakoid, contains multi-protein
complexes, called photosystems, which are responsible for this process.
The Calvin cycle starts with the fixation of CO2 into 3-phosphoglycerate, reaction catalyzed by
ribulose-1,5-bisphosphate carboxylase/oxidase (RuBisCo). The next step involves the
reduction of 3-phosphoglycerate into glyceraldehyde-3-phosphate. The net result of the Calvin
cycle is the conversion of three molecules of CO2 and a molecule of phosphate into a molecule
of glyceraldehyde-3-phosphate, using six NADPH and nine ATP molecules, which had been
obtained at the light-dependent phase. Glyceraldehyde-3-phosphate is a metabolite involved in
the biosynthesis of glucose, among other carbohydrates.
A recent review from Sami et al. [16] describes the role of carbohydrates in plant metabolism.
According to that review, the accumulation of elevated concentration of carbohydrates in plant
tissues is correlated with the inhibition of photosynthesis, inducing senescence, leading to
stunted growth and necrotic leaves. On the other hand, low carbohydrate accumulation
enhances photosynthesis and reserves mobilization. Also, carbohydrates are implicated in

INTRODUCTION
19
processes as seed germination (glucose alone or in combination with other carbohydrates delays
the germination process) or flowering (sucrose concentration plays an important role in
flowering induction).
1.3.1.2. Mannitol
Mannitol is the most abundant alditol in plants. The synthetic pathway for this molecule in
plants involves three enzyme-catalyzed reactions. The reactions consist of isomerization of D-
fructose-6-phosphate to O-mannose-6-phosphate, followed by the reduction to D-mannitol-1-
phosphate and, finally a dephosphorylation process to yield D-mannitol.
The metabolism of this carbohydrate may play key roles in biotic and abiotic plant responses.
Mannitol is proposed to have a function in protecting cells and cellular structures against cell
damage induced by reactive oxygen species. Plant species with mannitol metabolism are best
adapted by greater tolerance to saline and osmotic stress as a result of mannitol's function as
"compatible solute" [17].
1.3.1.3. myo-Inositol
The biosynthesis of this cyclitol consists of a two-step biochemical pathway highly conserved
in all living organisms. D-myo-inositol-3-phosphate synthase converts D-glucose-6-phosphate
into myo-inositol-3-phosphate. Then, inositol monophosphate phosphatase enzyme acts by
dephosphorylating myo-inositol-3-phosphate to form free myo-inositol.
myo-Inositol is a source of many important molecules, including phosphatidylinositol and its
derivatives, inositol polyphosphates, galactinol (a precursor of raffinose-family
oligosaccharides (RFOs)), pinitol and several cell wall polysaccharides. Molecules derived
from myo-inositol are involved in many cellular functions such as signal transduction,
membrane trafficking, mRNA export, stress tolerance, phosphorus storage and synthesis of
various cell wall components. Thus, myo-inositol could be considered as a critical regulator of
cell metabolism in plant [18].

CHAPTER 1
20
1.3.1.4. Raffinose family of oligosaccharides
The reaction between myo-inositol and UDP-galactose, catalysed by the enzyme galactinol
synthase, produces galactinol. This carbohydrate acts as the donor of galactosyl groups in the
biosynthesis of the different carbohydrates from the raffinose family of oligosaccharides (RFO)
[19].
Different galactosyltransferases are involved in the formation of the α-(1→6) glycosidic linkage
between galactose and sucrose to yield raffinose and consecutively to produce stachyose and
verbascose [19].
RFOs have multiple functions in plant metabolism, such as protection against the desiccation
in seeds [20], transport of carbohydrates in phloem sap and energy storage [19]. They also act
as signalling molecules following pathogen attack and are accumulated in vegetative tissues
under abiotic stresses, including freezing. Different plants accumulate different types of RFOs
and in different parts of the plant [21].
The physiological role of RFOs in response to stress is not clear but in vitro studies suggest a
mechanism where the insertion of the RFO among the bilipid layer stabilises the cellular
membranes [22].
1.3.2. Bioactivity of LMWC
1.3.2.1. Prebiotic effect of LMWC
The vast number of microbes present in the human body, referred to as human microbiota, play
an essential role in human health and disease. The human microbiota has even been considered
to be an “essential organ” [23]. The number of microbial cells exceeds at least by two orders of
magnitude the total number of human body cells [24].
In humans, the gut microbiota has the most significant number of bacteria and the highest
number of species compared to other areas of the body [25]. The gut microbiota is involved in
fundamental human biological processes, including regulation of metabolism, regulation of

INTRODUCTION
21
epithelial development and regulation of immunity. Different chronic diseases such as obesity,
inflammatory bowel disease, diabetes mellitus, metabolic syndrome, atherosclerosis, alcoholic
liver disease, non-alcoholic fatty liver disease, cirrhosis, neurodegenerative diseases and
hepatocellular carcinoma have been associated with changes in the human microbiota [26-31].
Different strategies aiming to restore the normal gut microbiota have been extensively studied
in human and animal models, as these methods represent a valuable tool to treat the associated
diseases. Some interventions have been proposed and applied to treat and prevent diseases
including administration of probiotics, prebiotics, synbiotics and faecal microbiota
transplantation [32, 33].
The probiotic concept is defined as “a viable mono- or mixed culture of microorganisms that
applied to animals or human, beneficially affects the host by improving the properties of the
indigenous microflora” [34].
The prebiotic concept is characterized as a “non-digestible food ingredient that beneficially
affects the host by selectively stimulating the growth and activity of one or a limited number of
bacteria already resident in the colon” [35]. Among them, the most extensively documented to
have health benefits in humans are the fructooligosaccharides (FOS), inulin and
galactooligosaccharides (GOS) [36].
The synbiotics concept is described by the appropriate combination of both components
(probiotic and prebiotic) in a single product to ensure a superior effect, compared to the activity
of the probiotic or prebiotic alone. This type of product was created in order to overcome some
possible difficulties in the survival of probiotics in the gastrointestinal tract [37]. In summary,
while probiotics are living microorganisms, prebiotics are non-viable substrates that serve as
nutrients for beneficial microorganisms already harboured by the host.
The prebiotic effect of these compounds is explained by their structure. The glycosidic bonds
in FOS and GOS are degraded by β-fructanosidase and β-galactosidase enzymes preferentially.
CHAPTER 1
22
This enzymes are absent in the upper digestive tract and are not expressed in human tissues.
Thus, the food oligosaccharides are not degraded in the digestive tract, reaching the colon with
an intact conformation. In the colon, FOS and GOS act as a substrate for the selective growth
of beneficial bacteria from the genus Bifidobacterium [38]. The specificity for bifidobacteria is
explained by the simultaneous expression of the necessary catabolic enzymes and appropriate
transport machinery by the bacteria of this genus. The principal metabolites from FOS and GOS
fermentation in the colon by bacteria are short-chain fatty acids, acetate (two carbon, C2),
propionate (C3)) and n‑butyrate (C4). These metabolites have a relevant role in the regulation
of intestinal health [39]. It is also known that the health-promoting effects can also occur in
sites distant to the intestinal tract. The effects associated with these short-chain fatty acids
include regulation of colonocyte function, gut homeostasis, energy gain, improvement of the
immune system, decrease of lipids in blood, promotion of appetite and regulation of renal
physiology [40].
One of the first oligosaccharides to be described as prebiotics are human milk oligosaccharides
(HMOs). HMOs are relevant for the development of the intestinal microbiota and
immunological system in infants [41]. Over 200 structurally different oligosaccharides have
been identified in human milk [42].
Other compounds considered prebiotics are the fibers [43]. The physicochemical properties of
the fibers affect the therapeutic effect after consumption. Soluble fibers, such as pectins are
selectively utilized by the host microbiota and promote health. Conversely, other insoluble
fibers such as cellulose, are generally poorly fermented, but the intake in the diet has a beneficial
effect, different from prebiotic, by promoting the gut transit [44].

INTRODUCTION
23
1.3.2.2. Overview of bioactive effects of individual LMWC
Raffinose
The prebiotic effect of raffinose in humans has been evaluated previously. In humans, four-
week-long diet supplementation with raffinose (15 g/day) produced a significant increase in
intestinal bifidobacteria [45].
Apart from a prebiotic effect, another effect proposed for raffinose is an inhibitory effect on
bacterial adhesion, detected using in vitro models of colonic epithelial cells (both for normal
microbiota [46] and for pathogenic enterotoxic E.coli [47]).
Another effect reported for this compound is the modulation of epidermal differentiation
through activation of liver X receptor (LXR) by the induction of gene expression of involucrin,
filaggrin, and AQP3 [48]. Therefore, raffinose may provide a new class of therapeutic agent for
the treatment of cutaneous disorders associated with abnormal epidermal barrier function. Thus,
raffinose could be used as an ingredient in functional cosmetics.
Stachyose
The prebiotic effect of stachyose has been reported through the evaluation of Deshipu stachyose
granules (DSG) in mice. This dietary supplement, approved by the China Food and Drug
Administration, is derived from the dietary roots of Lycopus lucidus. DSG consists mainly of
stachyose (55.3%), raffinose (25.8%), verbascose (9.7%) and sucrose (6.9%). The evaluation
consisted of a regular consumption of DSG by mice. As a result, the intestinal microbiota
composition varied, with an increase of bifidobacteria and lactobacilli and a decrease in enteric
bacilli. The regulation observed was associated with substantial effects on intestinal peristalsis
promotion and bowel function improvement [49].
A follow-up study in humans showed similar results. DSG at a dosage of 5 g/ day is associated
with a significant increase in bacteria type Bifidobacterium and Lactobacillus and a remarkable

CHAPTER 1
24
decrease in Clostridium perfringens, with an improvement of the bowel function of patients
suffering from constipation [50].
However, stachyose bioactivity may not only be related to its prebiotic effect. Other positive
effects such as an inhibitory effect over the growing of a colorectal cancer cell line (Caco-2)
has been determined in vitro. The mechanism elucidated seems to involve Caspase-associated
apoptosis initiated by the mitochondria-induced pathway [51].
Consistently, using virtual screening and 3D-Quantitative Structure-Activity Relationship
(QSAR) methods for compounds isolated from traditional Chinese medicines, Hsiao et al. [52],
identified stachyose (together with mannotriose and raffinose) as a potential compound with
high potential to inhibit enzymes involved in the “de novo” synthesis of nucleotides. The target
enzymes of this study were dihydrofolate reductase (DHFR), enyme involved in the synthesis
of tetrahydrofolate, and thymidylate synthase (TS), which is involved in purine synthesis. These
enzymes are targets in the treatment of cancer with chemotherapies. The inhibition of these
enzymes produces numerous side effects as a consequence of the narrow therapeutic range of
the chemotherapies. The authors suggested that a combination of stachyose with chemotherapy
may have synergistic effects, achieving similar effects with lower doses of chemotherapy and
,therefore, reducing side effects [52].
Melibiose
Melibiose promotes different bioactive properties such as calcium absorption in the intestines
[53] and the improvement of the symptoms of allergic disease. In the case of allergic disease,
one study performed in mice suggested the possibility that melibiose would be useful for
preventing or improving the allergic symptoms by suppression of the Th2 immune response
[54].

INTRODUCTION
25
1-Kestose
The prebiotic effect of this trisaccharide has been evaluated in mice. A diet supplemented with
0.5 to 5% of 1-kestose demonstrated strong induction of bacteria growth from the genus
Bifidobacterium. Consequently, different metabolites as butyrate were increased, producing a
decrease in insuline in serum [55].
Additional application have been evaluated, for example as treatment for skin diseases. The
daily administration in infants with atopic dermatitis of this carbohydrate during 12 weeks
produced a significant improvement of the atopic dermatitis symptoms [56].
myo-Inositol
This compound is a precursor of the biogenesis of phosphatidylinositol. This phospholipid is a
component of cellular membranes and forms several molecules that act as second messengers,
such as inositol 1,4,5-triphosphate (a regulator of intracellular calcium levels) and
phosphatidylinositol-3,4,5-triphosphate (activator of downstream signalling components).
Another function of phosphatidylinositol is the activation of intracelular pathways that lead to
the activation of serotonin receptors. The activation of serotonin receptors could explain the
therapeutic effects of myo-inositol in the treatment of depressions and obsessive-compulsive
disorder [57]. myo-Inositol has also proved to be useful in the treatment of Bulimia nervosa
[58].
On the other hand, alterations in myo-inositol metabolism have been associated with the
pathogenesis associated with Diabetes mellitus and chronic renal failure [59].
Other beneficial functions of myo-inositol related to human health have been reported. This
carbohydrate has shown its influence in different pathways at ovarian tissues. myo-Inositol is
an essential constituent of the follicular microenvironment, where it plays a crucial role in
oocyte maturation [60]. A capability of myo-inositol in restoring ovarian activity in most
patients with Polycystic ovary syndrome (PCOS) [61] has been reported. PCOS pathology is
CHAPTER 1
26
one of the most common causes of infertility, affecting 5 – 10% of females in reproductive age
[62].
This carbohydrate has been tested as a supplement in the elaboration of infant food formula and
clinical products for feeding premature infants, resulting in beneficial effects such as reducing
intraventricular haemorrhage, protection from retinopathy of prematurity and reducing neonatal
and infant deaths [63].
scyllo-Inositol
The effectiveness of this carbohydrate together with other inositols (chiro-, allo-, cis-, epi-,
muco-, neo-inositol) to treat dyslipidemia, hypercholesterolemia and cardiovascular diseases
has been evaluated and currently is under patent [64].
In vitro studies have revealed the capability of scyllo-inositol in reducing the aberrant
accumulation of amyloid-β protein (Aβ) in Alzheimer’s disease [65]. Initial clinical trials
evaluating scyllo-inositol as a therapeutical agent in Alzheimer disease (phase II clinical trial)
did not show any significant effect. However, the evaluation of this carbohydrate as a
therapeutical agent is still under study [66].
scyllo-Inositol has been found to have similar effects in reducing aberrant accumulation of other
proteins such as α–synuclein in Parkinson’s disease [67] and huntingtin in Huntington disease
[68].
Mannitol
The most significant benefit of this compound is its low glycaemic index and safety for healthy
teeth [69]. This carbohydrate is a low digestible compound. As a consequence, it reaches the
lower intestinal tract causing undesired effects as a consequence of an osmotic imbalance,
leading to osmotic diarrhoea and also fermentation by bacteria. Mannitol is one of the least
well-tolerated polyols, with a laxation threshold of only 20 g /day [70].

INTRODUCTION
27
The diuretic effect is another interesting property of this carbohydrate. Mannitol is filtered at
the glomerulus but not reabsorbed by the renal tubule. It exerts osmotic activity within the
proximal convoluted tubule and the descending limb of the loop of Henle, which limits passive
tubular reabsorption of water. Water loss produced by mannitol is accompanied by a variable
natriuresis [71].
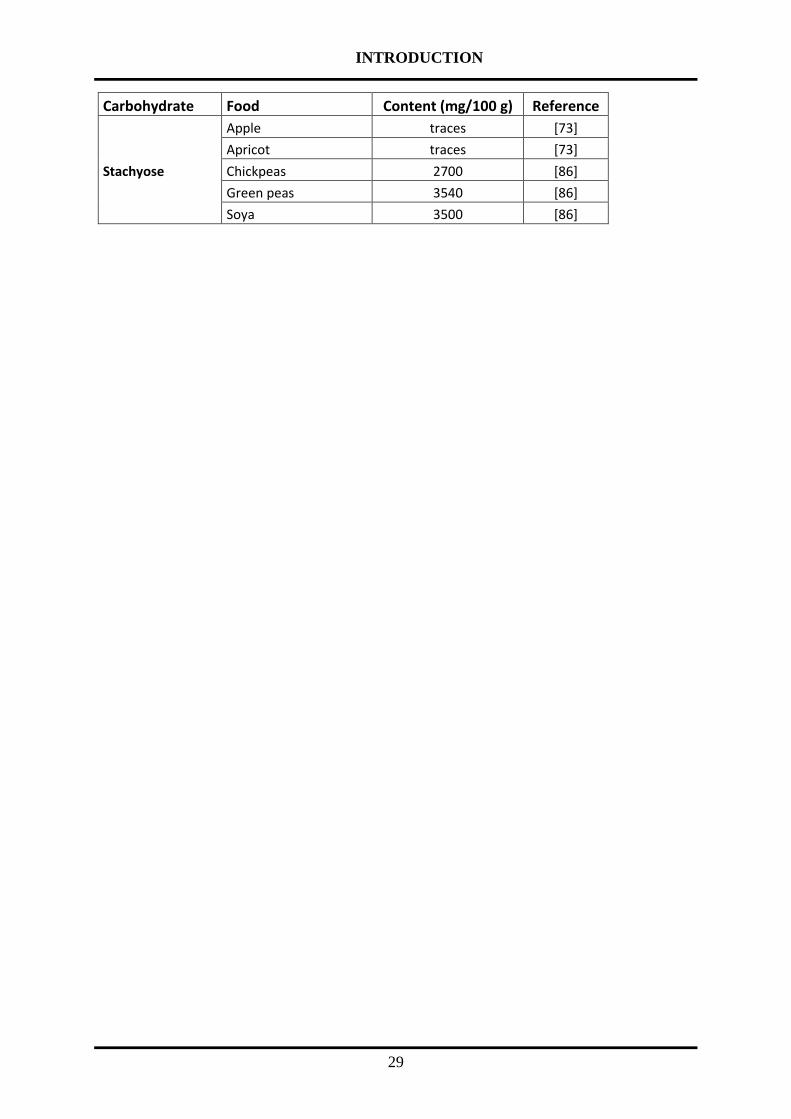
1.3.3. Presence of LMWC in dietary food
As previously mentioned, carbohydrates are major components of dietary foods and have a
decisive importance in the diet because they belong to the group of essential nutrients involved
in nutrition and metabolism. The following Table 1 describes the content of the different
LMWC in other dietary food. The units are given in mg/100 g representing a typical serving.
Table 1. Content of different LMWC in dietary food.
Carbohydrate Food Content (mg/100 g) Reference
Fructose
Endive 687.1 (3.9) [15]
Iceberg lettuce 485.6 (7.6) [15]
Spinach 47.5 (6.4) [15]
Onion 1760.1 (434.2) [15]
Eggplant 827.0 (96.8) [15]
Glucose
Escarole 239.3 (4.8) [15]
Chicory leaves 229.5 (25.8) [15]
Radish 799.9 (108.3) [15]
Cabbage 693.7 (19.9) [15]
Beet root 220.7 (75.5) [15]
Galactose
Cresta lettuce 2.0 (0.5) [15]
Purple yam 181.7 (3.5) [15]
Onion 12.7 (0.9) [15]
Spinach 2.2 (0.1) [15]
Cabbage 61.1 (0.5) [15]
Mannito
l
Pumpkin 400 [72]
Celery 100 [72]
Seaweed Trace [72]
Spinach 0.4 (0.5) [15]
Purple yam 141.1 (7.2) [15]

CHAPTER 1
28
Carbohydrate Food Content (mg/100 g) Reference
Sorbitol
Rucola 280 (26) [73]
Yellow beans 150 (13) [73]
Cabbage 180 (16) [73]
Fenel (bulb) 100 (9) [73]
myo-Inositol
Escarole 4.1 (0.2) [15]
Eggplant 21.5 (0.2) [15]
Egg 5-34 [74]
Coffee Trace-2200 [75]
Honey 10-220 [76]
scyllo-Inositol
Grape 80 [77]
Carrot 150-580 [78]
Coriander 160-240 [78]
Wine 10-70 [79]
Eggplant 1.6 (0.0) [15]
Sucrose
Spinach 54.4 (14.7) [15]
Beet root 10697.5 (1010.9) [15]
Eggplant 147 (11.93) [15]
Artichoke 3150 (184) [73]
Garlic 2050 (126) [73]
Maltose
Grape 60 [80]
Nectarine 90 [80]
Broccoli 420 [80]
Iceberg lettuce 20 [80]
Raisins 180 [80]
Melibiose Honey 2443 (74.5) [81]
Radix rehmanniae 272 (274) [82]
Galactinol
Lentils 50 [83]
Beans 60 [83]
Soya 10-40 [84]
Alfalfa 127-169 [85]
Chickpea 80 [83]
Raffinose
Onion 230 (11) [73]
Parsnip 240 (15) [73]
Scallion 780 (39) [73]
Beet root 37.7 (8.6) [15]
Cabbage 1.3 (0.1) [15]
1-kestose
Beet root 16.9 (2.6) [15]
Purple yam 19.0 (1) [15]
Raspberry 320 (0.9) [73]
Cherry 220 (11) [73]
Apricot 80 (0.4) [73]
INTRODUCTION
29
Carbohydrate Food Content (mg/100 g) Reference
Stachyose
Apple traces [73]
Apricot traces [73]
Chickpeas 2700 [86]
Green peas 3540 [86]
Soya 3500 [86]

INTRODUCTION
31
Chapter 2. Analytical techniques employed in the analysis of carbohydrates.
2.1. Determination of total carbohydrates by colorimetric analysis-sum parameters
The phenol-sulfuric acid method is a simple and rapid colorimetric method to determine total
carbohydrates. Percentage of carbohydrates on typical food labels are determined using this
sum parameter method.
The method employs concentrated sulfuric acid that breaks down the glycosidic bond of
polysaccharides, oligosaccharides, and disaccharides to produce monosaccharides. In this
conditions, pentoses and hexoses are dehydrated to furfural and 5-hydroxymethyl furfural
respectively [87]. Both compounds react with phenol to produce a yellow-gold color. It is
recommended to measure the absorption at 480 nm if the sample is considered to be high in
pentoses (such as wheat bran or corn bran). In the case of a product under analysis with high
hexose content, the absorption is measured at 490 nm. The color formed in the reaction is stable
for several hours [87]. Other phenolics compounds such as naphtol could be employed as well.
The use of sulfuric acid in this method makes this technique remarkably tedious. However, the
accuracy of the method is within ± 2% under proper conditions [87].
2.2. Gas chromatography applied to the analysis of carbohydrates.
2.2.1. Derivatization procedure.
Carbohydrates, due to their high polarity, hydrophilicity and low volatility, have to be converted
into volatile derivatives before analysis by gas chromatography (GC). This process confers
volatility and stability through different reactions based on the substitution of all active
hydrogen atoms by non-polar groups. Usually, the hydroxyl groups are silylated, acetylated or
trifluoroacetylated, although they can also be methylated or ethylated [88].
Ruiz-Matute et al. [88] reviewed the advantages and drawbacks of the main derivatization
methods for carbohydrates analysis. The methods evaluated were derivatization to methyl
CHAPTER 2
32
ethers, acetates, trifluoroacetates, alditol acetates, aldonitrile acetates, silylation and dialkyl
dithioacetals.
One of the most sought-after derivatization methods is silylation. This method, developed by
Sweeley et al. [89], consists in the introduction of dimethylsilyl, trimethylsilyl or tert-
butyldimethylsilyl groups in the molecule to form the corresponding silyl ethers. As a first step
of the derivatization process, it is necessary to dissolve the sample in non-accusative solvents
such as pyridine or dimethylsulfoxide. Silymethyldisilazane (HMDS), trimethylchlorosilane
(TMCS), trimethylsilylimidazole (TMSI) or bis (trimethylsilyl)-trifluoroacetamide (BSTFA) or
combinations of them are used as silylating reagents [90]. The silylation reaction occurs with a
temperature ranging from room temperature to 45°C. Some authors have proposed a reaction
time ranging between 5 to 30 minutes. However, the disadvantage of this type of derivatization
is the formation of up to 5 silylated forms for the reducing carbohydrates, which can hinder the
analysis of complex mixtures due to the complexity of the chromatogram [91].
The problem of the formation of 5 silylated forms is solved in the derivatization method to
trimethylsilyl oximes (TMSO). The derivatization consists in the use of NH2OH to decrease the
number of chromatographic peaks of reducing carbohydrates to anti (E) and syn (Z) isomers
and posterior conversion of the carbonyl group to an oxime before silylation. As a consequence,
the number of chromatographic peaks is reduced to 2 for reducing carbohydrates and 1 for non-
reducing carbohydrates. TMSO derivatives have high volatility and have been widely employed
for the determination of the carbohydrate composition in food [92, 93].
2.2.3. Analysis of carbohydrates by gas chromatography.
Carbohydrate analysis by gas chromatography can be carried out employing different detectors
such as flame ionization detector (FID), electron capture detector (GC-ECD) or mass
spectrometry (GC-MS).
INTRODUCTION
33
Morgan et al. [94] reported the construction of a gas chromatographer incorporating an FID
detector. In this gas chromatographer, the detector collects the ions formed during the
combustion of organic compounds in a hydrogen flame. The number of ions generated is
proportional to the concentration of organic species in the sample gas stream [94].
Lovelock et al. [95] reported the first gas chromatographer incorporating an ECD detector. ECD
detectors are recommended for the analysis of halogens, organometallic compounds, nitriles,
and nitro compounds. The ECD detector (electron capture detector) employs beta particles to
ionize the carrier gas and produce electrons consequently. In conditions of a constant electric
field applied between two electrodes, there will be a constant electron current. The different
compounds from the injected samples will capture part of the electrons, which will be detected
as a decrease in the current intensity.
GC coupled to mass spectrometry (GC-MS) applied to the carbohydrates analysis is quite
challenging due to the similarities of the fragmentation patterns. However, the use of silyl
derivatives has the advantage of different diastereoisomers showing changes in their mass
spectrum. These differences allow the assignment of different ions to different carbohydrates
in function of their structure [96].
The identification of the derivatives in GC-FID, GC-ECD and GC-MS is based on the use of
commercial standards. However, for GC-MS analysis, the identification of LMWC is typically
performed using linear retention indices (IT), relative intensities of characteristic m/z fragment
ions and bibliographic data.
2.3. LC operation modes for the analysis of carbohydrates
LC is a technique widely used for the analysis, separation and isolation of carbohydrates. The
chromatographic operation modes historically used for the analysis of carbohydrates include
normal phase liquid chromatography (NPLC), reverse phase liquid chromatography (RPLC)
and high-performance anion-exchange chromatography (HPAEC). However, in recent years,

CHAPTER 2
34
the most commonly used mode of operation for carbohydrate analysis using LC is hydrophilic
interaction chromatography (HILIC).
2.3.1. Normal phase liquid chromatography
Normal phase liquid chromatography (NPLC) employs a polar stationary phase and a non-
polar, non-aqueous mobile phase. This operation mode offers considerable variability in
selectivity with an appropriate selection of the mobile phase. Thus, this operation mode has the
advantages of separation of low-molecular moderately polar samples based on the differences
in the number and position of functional groups of the analyte.
Among the stationary phases used in NPLC, silica gel ([SiO2]x [H2O]y) has been extensively
employed. After column preparation, the surface of the silica gel consists mainly of hydroxyl
groups bound to silica atoms (silanol groups). These silanol groups predominantly bind analytes
by polar interactions (hydrogen bonding, π–π and dipole-dipole interactions). Stationary phases
such as aluminium oxide or chemically modified silica gel are also used (amino, diol, nitro or
cyano group-containing chemicals are used to modify the silanol groups) [97].
2.3.2. High-performance anion-exchange chromatography (HPAEC)
The HPAEC is used for LMWC analysis due to its high sensitivity and selectivity [98]. This
type of chromatography is based on the ionization of carbohydrates in alkaline conditions (pH
9-13). The chromatographic separation takes place in columns with ion exchange resins. As
eluent, sodium hydroxide with sodium acetate is commonly used. Under basic conditions, the
open chain form of LMWC dominates, reducing the complexity of the chromatograms.
Different applications of this chromatography in the LMWC in food or plants have been
proposed [99, 100].

INTRODUCTION
35
2.3.3. Reverse phase liquid chromatography (RPLC)
RPLC is one of the operation modes most commonly employed in analitical chemistry. This
operation mode employs a non-polar stationary phase consisting of alkyl or aryl groups bound
to a micro-silica particle surface (C8, C18). The polar mobile phase consists of water and an
organic solvent (methanol, and acetonitrile mainly). The retention mechanism is based on
hydrophobic interactions of the analytes with the stationary phase. Therefore, the retention
mechanism depends on the characteristics of the analyte and mobile phase.
Carbohydrates are poorly retained in RPLC as a result of their high polarity. The affinity of
carbohydrates to the hydrophobic stationary phase could be increased through derivatization
[101, 102]. Different methods of derivation have been discussed previously by Lamarini et al.
[101].
2.3.4. Hydrophilic interaction liquid chromatography (HILIC)
Historically, HILIC has been considered as a variant of normal phase liquid chromatography.
However, the separation mechanism of this operation mode is quite more complex than the
mechanism established in NPLC [103]. Alpert [104] was the first author, in 1990, to propose
the acronym HILIC for this type of chromatography.
HILIC is an LC operation mode suitable for the analysis of polar and hydrophilic compounds,
poorly separated in RPLC. This operation mode uses highly polar and hydrophilic stationary
phases such as silica or silica functionalized with amine, amide or zwitterionic groups, among
others. The most common mobile phase is composed of acetonitrile in a high proportion (50-
95%) and water (5-45%). Both solvents could contain different types of additives such as acids,
bases and salts.
The retention mechanism of HILIC is still unclear, although the most accepted theory explains
the retention as the distribution of the analyte between the organic phase and an aqueous film
partially immobilized in the stationary phase. Depending on the type of stationary phase (amide,

CHAPTER 2
36
silica, zwitterionic), other types of additional mechanisms may exist. As an example, in the
zwitterionic phases, some electrostatic interactions between the analytes and the stationary
phase itself may take place depending on the pH of the mobile phase [103, 105, 106].
This chromatographic operation mode has been extensively used for the analysis of
carbohydrates from different food matrices. A summary of the main applications of this
chromatography applied to the analysis of carbohydrates in different food matrices has recently
been published [107].
2.3.5. Detectors employed for the analysis of carbohydrates.
The lack of chromophore groups in the structure of carbohydrates complicates their detection
using LC. Different detectors ( electrochemical, ultraviolet, fluorescence, refraction index, mass
spectrometers ) widely used for the analysis of carbohydrates are discussed in this section.
The electrochemical detectors usually have limited stability. The detection by HPAEC is carried
out using pulse amperometry. In this case, the detection consists in the measurement of the
electric current generated by the oxidation of the carbohydrates on the surface of a platinum or
gold electrode and its subsequent reduction for cleaning the electrode. Also, this type of
chromatography requires specific pumps adapted to work at highly basic pH.
The refraction index (RI) is one of the most commonly used detectors for carbohydrate
analyisis. This detector measures the refractive index of carbohydrates relative to the solvent.
The sample preparation does not require a previous step of derivatization. However, it can only
be used when the elution is in isocratic mode, so its application for the analysis of complex
mixtures is limited [108].
The light scattering detector (ELSD) measures the amount of light scattered by analyte particles
created by evaporation of a solvent as it passes through a light beam. However, the main

INTRODUCTION
37
disadvantage of this detector is the problem of limited reproducibility of the response factor in
quantification [109, 110].
Regarding UV and fluorescence detectors, their employment for carbohydrate analysis requires
a previous step of derivatization. The different methods of derivatization introduce
chromophore groups before, during or after the chromatographic separation. The chromophore
groups allow the detection of carbohydrates using ultraviolet (UV) or fluorophores, for
fluorescent detection [101]. The reagents most commonly used for this purpose are 2-
aminopidine, 2-aminoacridone, p-aminobenzene, 2-aminonaphthalene trisulfone and 1-phenyl-
1-3-methyl-5-pyrazolone [102]. The derivatization process produces changes in carbohydrate
properties such as hydrophobicity, improving its resolution in reverse phase systems.
Finally, the MS detectors allow the analysis of carbohydrates without prior derivatization. The
absence of derivatization is an advantage in terms of sample processing time compared to other
detection methods.
2.3.6. Analysis of LMWC using liquid chromatography coupled to mass spectrometry.
The characterization of LMWC using mass spectrometry is considered quite challenging due to
the absence of specific fragmentation patterns.
The use of mass spectrometry for carbohydrate analysis has allowed the determination of their
molecular weight and also provided structural information of LMWC. Among all the possible
ionization sources employed for LMWC analysis, electrospray ionization (ESI) is widely used,
although the employment of atmospheric-pressure chemical ionization (APCI) is also possible.
ESI can be easily coupled to quadrupole (Q), ionic tramp (IT), time of flight (TOF) and
quadrupole coupled to time of flight (Q-TOF) mass spectrometers.
TOF mass spectrometers are used for the determination of high molecular weight and molecular
formulae. The ionization of carbohydrates is difficult due to the lack of acidic or basic
functional groups. Carbohydrates have a stronger affinity for alkali metal or alkali earth metal

CHAPTER 2
38
ions than to protons. In positive ion mode, the identification of carbohydrates is based on the
determination of the molecular weight of the sodium molecular ion, although the presence of
molecular ammonium ion can be detected. In negative ion mode, the determination of the
carbohydrates is based on the determination of the molecular weight of the deprotonated
molecular ion of the carbohydrate.
MS/MS or tandem MS can be used to identify the presence of a carbohydrate. Neutral loss
characteristics of carbohydrates are 18 Da (H2O), 30 Da (CH2O), 60 Da (C2H4O2), 90 Da
(C3H6O3), 120 Da (C4H8O4), 132 Da (C5H8O4), 162 Da (C6H10O5).
As mentioned previously, the application of mass spectrometry to the characterization of
disaccharides and oligosaccharides is quite challenging due to the absence of a clear
fragmentation pattern. Tedious approaches, such as permethylation of the hydroxyl groups, can
be used to elucidate the carbohydrate sequence through the identification of branching sites and
the linkage between monomers [111].
Zhang et al. [112] and Hermandez-Hernandez et al. [113] have proposed the characterization
of oligosaccharides based on the MS2 fragmentation behaviour of several standard
disaccharides containing galactose, glucose and fructose units. This characterization was based
on the observation that similar fragmentation profiles, but different relative ratios of the
fragment ions had been previously observed in disaccharides with the same linkage but different
monosaccharide units. Relative ratios of the fragment ions from disaccharides with different
linkage between the monosaccharides units were reported by Hernandez-Hernandez et al [113].
In line with this observation, Simoes et al.[114] identified the anomeric configuration (α or β)
of glucopyranosyl-glucose disaccharides by tandem mass spectrometry. These authors
observed differences in the relative abundances of specific product ions obtained from
collisionally induced dissociation (CID) of the lithium adduct. Overall, this approach is less

INTRODUCTION
39
tedious and time-consuming than the combination with complex isolation techniques by
fractionation methods and the subsequent analysis by NMR and methylation procedures.


INTRODUCTION
41
Chapter 3. Dietary food
3.1. Cocoa
3.1.1. Economical impact.
Cocoa powder is the crucial ingredient in the production of chocolates and related products.
The global market for chocolate, with more than 4.5 million tons of cocoa beans consumed
annually, reached in 2016 an economic value of USD 98.3 billion [115].
Cocoa prices have increased by approximately 50% since the first data available in
MarketsandMarkets database in 2005, reaching the price of € 2,211.55 ton on October 2018
[116].
In the present, more than half of the top 20 chocolate consuming countries are European. World
Cocoa Foundation estimates that 50 million people around the world have their income based
on cocoa farming or industry.
3.1.2. Farming
The tree Theobroma cacao L. grows within 20° latitude of the equator. It requires a warm and
humid climate for growth Therefore, major producer countries are Ivory Coast, Ghana,
Indonesia, Brazil, Nigeria, Cameroon, Malaysia and Ecuador.
The tree has an average productive life of 25 years, with two flowering cycles a year. The fruit
of the tree is called cocoa pod. Cocoa pods have an ovoid shape, average size of 15-30 cm long
and 8-10 cm wide, different shades of color (from yellow to red-orange) and an average ripe
weight of 500 g.
On average, each cocoa pod contains between 20 to 60 cocoa beans (seed). Morphologically,
each seed consists of two cotyledons (nibs) and an embryo (radicle) surrounded by a seed coat
(testa). The beans are enveloped in a white and viscous pulp rich in carbohydrates.
The four predominant varieties of cocoa tree are Criollo, Forastero, Trinitario and Nacional.
Criollo, characterized for producing a unique aroma, is the most commonly farmed variety in
CHAPTER 3
42
south-central America. Forastero, characteristic for its strong aroma, is the variety typical from
the Amazon region. Trinitario is a hybrid cultivar between Criollo and Forastero characteristic
for its high productivity and resistance to diseases. Nacional, mainly farmed in Ecuador, is
characteristic for its full cocoa flavor with additional floral and spicy notes [117].
3.1.3. Processing of cocoa beans to chocolate bar.
The processing of cocoa beans into chocolate involves a microbiological fermentation step
followed by a drying step, both performed at the location of the farms. The microbiological
fermentation is the essential step for the production of precursors of the flavour and aroma of
chocolate. The fermentation usually lasts 5 to 6 days. Beans fermented shorter than 5 days can
be considered under-fermented. Conversely, beans fermented longer than 6 days can be
considered over-fermented, which are characterized by “hammy” off-flavours [118].
The spontaneous fermentation process starts with piling up the beans together with the pulp.
The fermentation of the beans takes place in two phases: anaerobic and aerobic. Therefore, the
microorganism composition changes during the fermentation. The different microorganisms
involved use the carbohydrates from the pulp as the main source of nutrients. During the first
two days, several species of yeast proliferate, leading to peak production of ethanol. In the
following phase lactic acid bacteria (day 1 to 3) and acetic acid bacteria (day 1 to 4), proliferate,
with the following peak production of lactic and acetic acid respectively. Finally, some
filamentous fungi may appear on the surface. Diversity in the microorganisms according to the
country of origin has been reported. This diversity has been mainly attributed as the cause of
the diversity in cocoa flavour and taste from different origins [119-121].
The fermentation index (FI) is a measurement of the extension of the fermentation. Different
methods to assess this parameter have been reported. Among the different methods reported,
cut-test and UV-visible are the most common. Cut-test method consists in the evaluation of the
internal color of cocoa beans during the fermentation, using a score based on purple and brown
INTRODUCTION
43
beans. With respect to UV-visible methods, the ratio of total free amino acids between
fermented and unfermented cocoa beans has been proposed to assess FI. Furthermore, the ratio
A460 nm/A530 nm of methanolic extracts is another parameter employed to assess the
fermentation index [122].
After the fermentation, the process continues in the factory. Inside the factory, the beans are
sorted according to their size. Then, the beans are cleaned to remove the remaining pulp. During
this process, the cracked husks are air-separated (winnowing) from the nibs, which are
processed into chocolate.
For this purpose, beans are ground several times and roasted under alkali conditions to make a
fluid paste called cocoa liquor. The process of roasting varies depending on the bean variety
and the properties of the product desired. The main variables are duration (from 15 min to 90
min) and temperature applied (110° C to 130°C) During roasting, the cocoa beans lose their
moisture, taking place the characteristic formation of color pigments, flavours and chocolate
aromas [123].
The cocoa powder is obtained by pressing the cocoa liquor to separate cocoa butter from the
cocoa cake. The cocoa cake is grounded to cocoa powder, with several applications in cooking
and baking [124].
The production of chocolates consists in the mixture of cocoa butter with cocoa liquor, sugars,
sweeteners, milk powder (for milk chocolate) and emulsifiers according to the requirements of
the final product. Once the chocolate mixture is prepared, “conching” is performed to increase
the homogeneity of the samples followed by tempering to get fine crystallization [124].
3.1.4. Health benefits of cocoa and chemical composition
Cocoa and chocolate consumption for medicinal purposes has been reported since the aztec
period [125]. The evidence of this health-promoting benefits has raised scientific interest in the

CHAPTER 3
44
chemical composition of cocoa, with the corresponding identification of flavonoids as the
compounds responsible for its health benefits [126-131].
The complexity of cocoa beans has been previously addressed by the use of Fourier transform
ion cyclotron resonance mass spectrometer (FTICR-MS) [132]. The estimated average
composition of unfermented cocoa beans is 32–39% water, 30–32% lipids, 10–15% proteins, 5
– 6% polyphenols, 12-15% polysaccharides, 3 - 5% of low molecular weight carbohydrates, 1–
2% theobromine, 1% organic acids and 1% caffeine [133]. During fermentation and subsequent
drying of the cocoa beans, several reactions take place, resulting in a reduction of water content,
a decrease in pH level and significant changes in lipid, carbohydrate, polyphenol and protein
composition [117].
3.1.5. LMWC in cocoa beans.
The analysis of LMWC in cocoa beans has been neglected in comparison to other metabolites.
This tendency might have been attributed to the low abundance of LMWC in unfermented beans
(5% DM) and fermented beans (between 0-1%) and the absence of methodologies for their
analysis. In fact, in many cases, the carbohydrate composition was assesed as the difference
with other major components in the cocoa bean.
In 1954, Cerbulis [134] studied for the first time LMWC in cocoa beans. This author employed
thin-layer chromatography (TLC) as the analytical method. The study performed reported the
presence of monosaccharides (fructose, glucose, galactose), disaccharides (sucrose and
melibiose), trisaccharides (raffinose and mannotriose) and tetrasaccharides (stachyose).
Moreover, the presence of other unknown carbohydrates was also reported. One year later, in
1955, Cerbulis reported the presence of myo-inositol, planteose, verbascose, and the presence
of unknown oligosaccharides [135].
In 1972, Reineccius et al. [136] described the presence of pentitol, fructose, sorbose, glucose,
mannitol, inositol and sucrose in unroasted cocoa beans using gas-chromatography-mass

INTRODUCTION
45
spectrometry. However, this author did not describe the presence of trisaccharides and
oligosaccharides, probably due to the limitations of the methodology used.
In 2003, Redgwell et al. [137] reported the presence of glucose, fructose, sucrose, raffinose,
stachyose and verbascose in cocoa bean samples from Ghana, Ivory Coast and Ecuador using
HPLC-Dionex. The authors studied the effect of roasting on the LMWC content. The study
detected a loss of up to 80% in the quantities of monosaccharides during roasting.
Apart from the studies mentioned above, the monosaccharide and sucrose composition has been
reported in studies focused on fermentation. The observed trend has been a sequential
degradation for sucrose across the different fermentation days and a slight increase of the
monosaccharide and mannitol content [138, 139]. No data on the oligosaccharide content during
the spontaneous fermentation is so far available.
3.2. Green tea.
3.2.1. Processing of green tea.
There are six main types of teas on the market: green, yellow, white, black, oolong and Pu-erh.
The differences between them are the consequence of differences in the processing steps,
especially in the steps involving oxidation and fermentation.
Tea has been traditionally grown in southwestern Asia and northeastern India Nowadays, the
cultivation has been spread to Japan, Korea, Thailand, Taiwan, Sri Lanka, Indonesia, central
Africa, Turkey, Argentina and Russia [140].
Tea cultivation requires 120-150 cm3 of rain, temperatures from 12 to 30 ºC and altitude ranging
from 0 to 3000 m from sea level. Two main plant varieties are used for the commercial
production of tea, Camellia sinensis var. assamica and Camellia sinensis var. sinensis. These
varieties are found in geographically distinct regions. Camellia sinensis leaves collected at high
altitude have been associated with higher tea quality. Camellia sinensis var. assamica grows as
CHAPTER 3
46
a tree making it more suitable for the tropical and subtropical climates. Camellia sinensis var.
sinensis grows as a bush, better adapted to colder climates [141].
Leaves can be harvested manually or mechanically. High-quality green tea has been associated
with manually harvested tea. After harvesting, the processing of green tea involves spreading,
fixing, rolling, shaping and drying. The spreading reduces tea leaves moisture by approximately
30%. Spreading produces the hydrolysis of non-water soluble carbohydrates and the formation
of catechins. It also promotes the release of the grass-like flavour [140].
The fixing step is performed to inhibit the polyphenol oxidase (PPO) and peroxidase (POD)
enzymatic activities to prevent the oxidation and fermentation of the leaf. This process consists
in the exposition of the leaves to an elevated temperature for 10-15 minutes. The process of
pan-firing and steaming are the most common process employed in the industry. The pan-firing
process consists in the introduction of the leaves in a pan previously heated at high temperature
(around 180°C). Steaming process consists in the exposition of the leaves to water steam [140].
The processing of green tea continues with the rolling step. In this step, the cell walls are broken
and this helps to release further leaf moisture. Finally, the leaves are shaped into various forms
and dried. The drying process can be performed under the sunlight or by baking, employing a
pan or basket [142].
3.2.2. The economic relevance of green tea
In the past decades, the global tea industry has experienced fast growth in response to an
increase in the number of consumers, driven by population growth, urbanization and rising
incomes.
According to data from FAO, in 2016, the production reached a level of 5.73 million ton and
the consumption a level of 5.53 million ton. It has been estimated that 80% of the production
corresponds to black tea and 20% corresponds to green tea. Two countries were the principal
producers, China (43%) and India (22 %). The European Union was the largest importer in

INTRODUCTION
47
2016, responsible for 18 % of the tea imports. The organism “Persistence Market Research”
projects an expansion of 5% of the tea market between 2016 and 2024, reaching a total value
of USD 21.33 billion.
World green tea production is expected to grow at 8.2% until 2024. The production increase is
predicted as a consequence of the expansion in green tea consumption outside Asia, partially
attributed to the perception that this beverage has health-promoting effects.
3.2.3. Health benefits and chemical composition.
Green tea is the first herbal plant infusion consumed by humans in history. According to legend,
the first brew of this infusion was performed in 2737 BC by Chinese emperor Shennong [143].
Its beneficial health effects were first suggested by Chinese culture during the Tang Dynasty
around 600 AD. More details about these beneficial health effects were described in 1191 in
the “Kissa Yoki”, suggesting the effect of this beverage in five vital organs [143]. Since then,
a vast number of epidemiological studies and clinical intervention studies have demonstrated
and verified these beneficial effects. Green tea improves cardiovascular health, reduces the
incidence of cancer, increases mental performance and improves osteoporosis, among other
functions [144].
These findings have stimulated intense research about the chemical composition of green tea,
focusing on the identification of the key tea secondary metabolites mediating these beneficial
health effects. The beneficial health effects have been mainly attributed to the composition of
catechins and caffeine. On average, the composition of green tea in terms of dry weight (DW)
is 30 % phenolic compounds, 26 % fibre, 15 % proteins, 7% carbohydrates, 7% lipids, 5%
minerals, 4% amino acids, 2% pigments and 4% other compounds such as organic acids or
caffeine [144].

CHAPTER 3
48
3.2.4. LMWC of green tea
The LMWC in green tea have been scarcely studied in comparison to the extensive information
provided in the literature on polyphenols and volatile compounds. Two studies have reported
the monosaccharide (fructose and glucose), disaccharide (sucrose and maltose) and inositol
(myo-inositol) composition of commercial green tea, employing high-performance liquid
chromatography (HPLC) in a limited number of samples [145, 146].
Zhou et al. (GC) [147], with the use of gas chromatography (GC), evaluated the enzymatic
activity of galactinol synthase. The study evaluated the activity of this enzyme under biotic and
abiotic conditions in clone cuttings of Camellia sinensis L grown under controlled conditions.
One of the parameters employed for this evaluation was the monitoring of raffinose and
verbascose quantities. This manuscript showed the presence of stachyose and galactinol.
However, the authors did not inform about quantities of these compounds.
Le Gall et al.[148], with the employment of Nuclear Magnetic Resonance (NMR), in a study
analyzing 191 tea samples reported the presence of 2-O-(β-L-arabinopyranosyl)-myo-inositol
as a quality indicator of green tea. The author found an elevated content of this carbohydrate in
high-quality teas produced with young shoots. Also, this author proposed the involvement of
this carbohydrate in earlier stages of tea leaf development.
3.3. Kale
3.3.1. Introduction to Cruciferous vegetables
Kale, Brassica oleracea var. Sabellica, is a plant from the Brassicaceae family. The
Brassicaceae family contains 341 genera and more than 3,700 species that are commonly
known as cruciferous vegetables [149]. Plants from the Brassicaceae family have been
described to have a protective effect on chronic diseases, both in vitro and in vivo [150-152].
Several bioactive compounds present in the edible parts of the cruciferous vegetables, such as
INTRODUCTION
49
phenolic compounds, ascorbic acid, carotenoids, glucosinolates and tocopherols have been
linked to health-promoting effects. Most of these compounds are mainly characterised by their
antioxidant capacities [153, 154], useful to neutralize the oxidative stress caused by the
accumulation of reactive oxygen species (ROS), a by-product of oxidative respiration. High
levels of ROS are associated with various pathologies, including carcinogenesis,
neurodegeneration, atherosclerosis, diabetes, and ageing [155].
3.3.2. The economic relevance of kale
Many of the cruciferous vegetables have high economic importance, such as mustard, cabbage,
rutabaga, turnip, brussel sprouts, broccoli, cauliflower, radish and kale. Among the different
cruciferous vegetable, broccoli was considered as “superfood” due to the extensive studies on
its chemical composition and biological properties [156].
In recent years, kale has experienced an increase in popularity. Consumers perceive kale to be
highly nutritious and it is claimed to have a beneficial effect on human health, being named as
a “superfood” [157]. The concept of “functional food”, popularly mentioned also as
“superfood”, refers to those foods with scientific evidence that support effects of their
components in improving the general conditions of the body, protecting against diseases or/and
curing diseases.
3.3.3. Farming
Kale is grown for its edible shoots and young leaves. It is well adapted for growing in winter,
resisting temperatures even as low as −15 °C, as well as in the summer, resisting high
temperatures. In North Germany, kale is harvested typically after the first frost in November
arguing that low temperatures induce better palatability and increase sweetness.
3.3.4. The chemical composition of kale and health effects of the main components.
According to the USDA Food Composition Databases, kale contains an average of 89% of
moisture, followed by fiber (4 %), proteins (3 %), lipids (1.5 %) and LMWC (1%),
CHAPTER 3
50
Kale is an excellent source of mineral nutrients, especially calcium, that is also of higher
bioavailability than in other plants [158]. A recommended serving of 100 g of kale provides 25
% and 10% of the recommended daily uptake (RDI) for calcium and other minerals respectively
[159].
Kale contains a high concentration of vitamin A and C, providing every serving 100% and 40%
of the RDI respectively [78]. Apart from these vitamins, other antioxidant compounds are
abundant in kale, such as glucosinolates, sulforaphanes and polyphenols [160].
Vitamin C
Different beneficial effects for vitamin C have been reported. First, vitamin C prevents the
inflammatory responses that lead to atherosclerotic plaque formation after oxidation of LDL
particles by ROS [161]. Second, vitamin C combined with ferulic acid, prevents the
abnormalities in lipid metabolism after myocardial infarction [162].
Vitamin A
The precursors of vitamin A in kale are lutein, β-carotene, violaxanthin and neoxanthin [163].
Vitamin A plays a role in the normal functioning of ocular, skin, bone, gastrointestinal, and
respiratory systems. Higher β-carotene serum levels have been linked to lower rates of cancer
[164], cardiovascular diseases [165] and myocardial infarction [166].
Polyphenols
Kale contains a selection of glycosylated flavonoids, mainly quercetin, kaempferol and luteolin
[84]. Apart from their antioxidant properties [167], phenolic compounds have been described
to regulate metabolism, inhibiting the growth of adipose tissue [168] and to normalize blood
glucose levels in diabetic rats [169].
Glucosinolates
Glucosinolates are a type of secondary metabolites found mainly in cruciferous vegetables.
Kale contains a concentration of glucosinolates of 2.25-93.90 μmol/g DW [170, 171] These

INTRODUCTION
51
compounds are activated after cell damage by the action of the enzyme myrosinase. The
activation consists in the production of isothiocyanates, nitriles, thiocyanates, epithionitriles,
and oxazolidinethiones, compounds biologically active with direct health-promoting effects
[172, 173].
The most abundant glucosinolate present in kale is sinigrin [174]. For allyl isothiocyanate, a
product of the sinigrin hydrolysis, anti-cancer, antibacterial, antifungal, antioxidant, anti-
inflammatory and wound healing properties have been reported [175].
3.3.5. LMWC in kale
The study of the LMWC in kale has been overlooked in comparison to other metabolites. To
the best of the author’s knowledge, there are few studies focused on the LMWC profile in kale.
In 2016, Tharavajan et al. [159] reported the LMWC composition in 25 kale genotypes
commonly farmed in USA. The analytical methodology employed was HPLC with pulsed
amperometric detection. The study reported the presence of fructose and glucose as main
LMWC followed by sucrose and lower contents of sorbitol, mannitol, arabinose, mannose and
xylose.
In 2017 Pathirana et al. [176] reported the variation of the LMWC content in kale and the
changes related to growth in a greenhouse under normal growing conditions for 4 weeks,
followed by 2 weeks of moisture stress (drought: 40% moisture; control: 80% moisture) and 2
weeks of recovery. The study reports for the first time the presence of oligosaccharides as
raffinose, 1-kestose, stachyose or verbascose.

CHAPTER 3
52
BIBLIOGRAPHY CHAPTERS 1-3.
[1] R.A. Samra, G.H. Anderson, 15 - Intense sweeteners and sugar replacers in the regulation
of food intake and body weight, in: D.J. Mela (Ed.) Food, Diet and Obesity, Woodhead
Publishing, 2005, pp. 292-310.
[2] R.J. Linhardt, H.G. Bazin, Properties of carbohydrates, in: B. Fraser-Reid, K. Tatsuta, J.
Thiem (Eds.) Glycoscience: Chemistry and Chemical Biology I-III, Springer.
[3] A. Hirai, H. Odani, Sorption and transport of water vapor in alginic acid, sodium alginate,
and alginate‐cobalt complex films, Journal of Polymer Science Part B: Polymer Physics, 32
(1994) 2329-2337.
[4] G. Servant, C. Tachdjian, X. Li, D.S. Karanewsky, The sweet taste of true synergy: Positive
allosteric modulation of the human sweet taste receptor, Trends in Pharmacological Sciences,
32 (2011) 631-636.
[5] M.A. Hoon, E. Adler, J. Lindemeier, J.F. Battey, N.J. Ryba, C.S. Zuker, Putative
mammalian taste receptors: a class of taste-specific GPCRs with distinct topographic
selectivity, Cell, 96 (1999) 541-551.
[6] R.A. Clemens, J.M. Jones, M. Kern, S.Y. Lee, E.J. Mayhew, J.L. Slavin, S. Zivanovic,
Functionality of Sugars in Foods and Health, Comprehensive Reviews in Food Science and
Food Safety, 15 (2016) 433-470.
[7] R.M. Pangborn, S.C. Gee, Relative sweetness of α- and β-forms of selected sugars, Nature,
191 (1961) 810-811.
[8] L.S. Magwaza, U.L. Opara, Analytical methods for determination of sugars and sweetness
of horticultural products-A review, Scientia Horticulturae, 184 (2015) 179-192.
[9] A. Golon, N. Kuhnert, Unraveling the chemical composition of caramel, J. Agric. Food
Chem., 60 (2012) 3266-3274.
[10] A. Golon, N. Kuhnert, Characterisation of "caramel-type" thermal decomposition products
of selected monosaccharides including fructose, mannose, galactose, arabinose and ribose by
advanced electrospray ionization mass spectrometry methods, Food and Function, 4 (2013)
1040-1050.
[11] W.C. Monte, J.A. Maga, FLAVOR CHEMISTRY OF SUCROSE, Sugar technology
reviews, 8 (1982) 181-204.
[12] S.I.F.S. Martins, W.M.F. Jongen, M.A.J.S. van Boekel, A review of Maillard reaction in
food and implications to kinetic modelling, Trends in Food Science & Technology, 11 (2000)
364-373.
[13] J.E. Hodge, Dehydrated foods, Chemistry of Browning Reactions in Model Systems, J.
Agric. Food Chem., 1 (1953) 928-943.
[14] M. Hellwig, T. Henle, Baking, Ageing, Diabetes: A Short History of the Maillard Reaction,
Angewandte Chemie - International Edition, 53 (2014) 10316-10329.
[15] M.N. Lund, C.A. Ray, Control of Maillard Reactions in Foods: Strategies and Chemical
Mechanisms, J. Agric. Food Chem., 65 (2017) 4537-4552.
[16] F. Sami, M. Yusuf, M. Faizan, A. Faraz, S. Hayat, Role of sugars under abiotic stress,
Plant Physiology and Biochemistry, 109 (2016) 54-61.
[17] J.M.H. Stoop, J.D. Williamson, D. Mason Pharr, Mannitol metabolism in plants: a method
for coping with stress, Trends in Plant Science, 1 (1996) 139-144.
[18] R. Valluru, W. Van den Ende, Myo-inositol and beyond - Emerging networks under stress,
Plant Sci., 181 (2011) 387-400.
[19] S. Sengupta, S. Mukherjee, P. Basak, A.L. Majumder, Significance of galactinol and
raffinose family oligosaccharide synthesis in plants, Front. Plant Sci:, 6 (2015).

INTRODUCTION
53
[20] B. Downie, S. Gurusinghe, P. Dahal, R.R. Thacker, J.C. Snyder, H. Nonogaki, K. Yim, K.
Fukanaga, V. Alvarado, K.J. Bradford, Expression of a galactinol synthase gene in tomato seeds
is up-regulated before maturation desiccation and again after imbibition whenever radicle
protrusion is prevented, Plant Physiology, 131 (2003) 1347-1359.
[21] E. Zuther, K. Büchel, M. Hundertmark, M. Stitt, D.K. Hincha, A.G. Heyer, The role of
raffinose in the cold acclimation response of Arabidopsis thaliana, FEBS Letters, 576 (2004)
169-173.
[22] I.J. Vereyken, V. Chupin, A. Islamov, A. Kuklin, D.K. Hincha, B.d. Kruijff, The Effect of
Fructan on the Phospholipid Organization in the Dry State, Biophysical Journal, 85 (2003)
3058-3065.
[23] A.M. O'Hara, F. Shanahan, The gut flora as a forgotten organ, EMBO Reports, 7 (2006)
688-693.
[24] E.G. Zoetendal, E.E. Vaughan, W.M. De Vos, A microbial world within us, Molecular
Microbiology, 59 (2006) 1639-1650.
[25] E.M.M. Quigley, Gut Bacteria in Health and Disease, Gastroenterology & Hepatology, 9
(2013) 560-569.
[26] R.E. Ley, P.J. Turnbaugh, S. Klein, J.I. Gordon, Microbial ecology: Human gut microbes
associated with obesity, Nature, 444 (2006) 1022-1023.
[27] D.C. Savage, Microbial ecology of the gastrointestinal tract, Annual review of
microbiology, 31 (1977) 107-133.
[28] A.Y. Wang, J. Popov, N. Pai, Fecal microbial transplant for the treatment of pediatric
inflammatory bowel disease, World Journal of Gastroenterology, 22 (2016) 10304-10315.
[29] L.J. Spielman, D.L. Gibson, A. Klegeris, Unhealthy gut, unhealthy brain: The role of the
intestinal microbiota in neurodegenerative diseases, Neurochemistry International, 120 (2018)
149-163.
[30] A. Altamirano-Barrera, M. Uribe, N.C. Chávez-Tapia, N. Nuño-Lámbarri, The role of the
gut microbiota in the pathology and prevention of liver disease, Journal of Nutritional
Biochemistry, 60 (2018) 1-8.
[31] A. Pascale, N. Marchesi, C. Marelli, A. Coppola, L. Luzi, S. Govoni, A. Giustina, C.
Gazzaruso, Microbiota and metabolic diseases, Endocrine, 61 (2018) 357-371.
[32] P. Markowiak, K. Śliżewska, Effects of Probiotics, Prebiotics, and Synbiotics on Human
Health, Nutrients, 9 (2017) 1021.
[33] S. Gupta, E. Allen-Vercoe, E.O. Petrof, Fecal microbiota transplantation: in perspective,
Therapeutic Advances in Gastroenterology, 9 (2016) 229-239.
[34] J. Schrezenmeir, M. De Vrese, Probiotics, prebiotics, and synbiotics - Approaching a
definition, American Journal of Clinical Nutrition, 73 (2001) 361S-364S.
[35] G.R. Gibson, M.B. Roberfroid, Dietary modulation of the human colonic microbiota:
Introducing the concept of prebiotics, Journal of Nutrition, 125 (1995) 1401-1412.
[36] P. Markowiak, K. Ślizewska, Effects of probiotics, prebiotics, and synbiotics on human
health, Nutrients, 9 (2017).
[37] R.A. Rastall, Functional oligosaccharides: Application and manufacture, Annual Review
of Food Science and Technology, 1 (2010) 305-339.
[38] M. Roberfroid, G.R. Gibson, L. Hoyles, A.L. McCartney, R. Rastall, I. Rowland, D.
Wolvers, B. Watzl, H. Szajewska, B. Stahl, F. Guarner, F. Respondek, K. Whelan, V. Coxam,
M.J. Davicco, L. Léotoing, Y. Wittrant, N.M. Delzenne, P.D. Cani, A.M. Neyrinck, A.
Meheust, Prebiotic effects: Metabolic and health benefits, British Journal of Nutrition, 104
(2010) S1-S63.
CHAPTER 3
54
[39] D. Ríos-Covián, P. Ruas-Madiedo, A. Margolles, M. Gueimonde, C.G. de los Reyes-
Gavilán, N. Salazar, Intestinal Short Chain Fatty Acids and their Link with Diet and Human
Health, Frontiers in Microbiology, 7 (2016) 185.
[40] A. Rivière, M. Selak, D. Lantin, F. Leroy, L. De Vuyst, Bifidobacteria and Butyrate-
Producing Colon Bacteria: Importance and Strategies for Their Stimulation in the Human Gut,
Frontiers in Microbiology, 7 (2016) 979.
[41] R. Oozeer, K. Van Limpt, T. Ludwig, K.B. Amor, R. Martin, R.D. Wind, G. Boehm, J.
Knol, Intestinal microbiology in early life: Specific prebiotics can have similar functionalities
as human-milk oligosaccharides, American Journal of Clinical Nutrition, 98 (2013) 561S-571S.
[42] A.M. Zivkovic, J.B. German, C.B. Lebrilla, D.A. Mills, Human milk glycobiome and its
impact on the infant gastrointestinal microbiota, Proceedings of the National Academy of
Sciences of the United States of America, 108 (2011) 4653-4658.
[43] J.A. Delcour, P. Aman, C.M. Courtin, B.R. Hamaker, K. Verbeke, Prebiotics, Fermentable
Dietary Fiber, and Health Claims, Advances in Nutrition, 7 (2016) 1-4.
[44] H.D. Holscher, Dietary fiber and prebiotics and the gastrointestinal microbiota, Gut
Microbes, 8 (2017) 172-184.
[45] Y. Benno, K. Endo, N. Shiragami, K. Sayama, T. Mitsuokai, Effects of Raffinose Intake
on Human Fecal Microflora, Bifidobacteria and Microflora, 6 (1987) 59-63.
[46] M. Altamimi, O. Abdelhay, R.A. Rastall, Effect of oligosaccharides on the adhesion of gut
bacteria to human HT-29 cells, Anaerobe, 39 (2016) 136-142.
[47] K. Shoaf, G.L. Mulvey, G.D. Armstrong, R.W. Hutkins, Prebiotic galactooligosaccharides
reduce adherence of enteropathogenic Escherichia coli to tissue culture cells, Infection and
Immunity, 74 (2006) 6920-6928.
[48] T.-Y. Na, G.-H. Kim, H.-J. Oh, M.-H. Lee, Y.-H. Han, K.T. Kim, J.-S. Kim, D.-D. Kim,
M.-O. Lee, The trisaccharide raffinose modulates epidermal differentiation through activation
of liver X receptor, Scientific Reports, 7 (2017) 43823.
[49] T. Li, X. Lu, X. Yang, Stachyose-enriched α-galacto-oligosaccharides regulate gut
microbiota and relieve constipation in mice, J. Agric. Food Chem., 61 (2013) 11825-11831.
[50] T. Li, X. Lu, X. Yang, Evaluation of clinical safety and beneficial effects of stachyose-
enriched α-galacto-oligosaccharides on gut microbiota and bowel function in humans, Food
and Function, 8 (2017) 262-269.
[51] G. Huang, J. Mao, Z. Ji, A. Ailati, Stachyose-induced apoptosis of Caco-2 cells via the
caspase-dependent mitochondrial pathway, Food and Function, 6 (2015) 765-771.
[52] Y.L. Hsiao, P.C. Chang, H.J. Huang, C.C. Kuo, C.Y.C. Chen, Treatment of acute
lymphoblastic leukemia from traditional chinese medicine, Evidence-based Complementary
and Alternative Medicine, 2014 (2014).
[53] H. Mineo, H. Hara, N. Shigematsu, Y. Okuhara, F. Tomita, Melibiose, difructose
anhydride III and difructose anhydride IV enhance net calcium absorption in rat small and large
intestinal epithelium by increasing the passage of tight junctions in vitro, Journal of Nutrition,
132 (2002) 3394-3399.
[54] K. Tomita, T. Nagura, Y. Okuhara, H. Nakajima-Adachi, N. Shigematsu, T. Aritsuka, S.
Kaminogawa, S. Hachimura, Dietary melibiose regulates Th cell response and enhances the
induction of oral tolerance, Bioscience, Biotechnology and Biochemistry, 71 (2007) 2774-
2780.
[55] T. Tochio, Y. Kitaura, S. Nakamura, C. Sugawa, M. Takahashi, A. Endo, Y. Shimomura,
An Alteration in the Cecal Microbiota Composition by Feeding of 1-Kestose Results in a
Marked Increase in the Cecal Butyrate Content in Rats, PLoS ONE, 11 (2016) e0166850.
INTRODUCTION
55
[56] R. Shibata, M. Kimura, H. Takahashi, K. Mikami, Y. Aiba, H. Takeda, Y. Koga, Clinical
effects of kestose, a prebiotic oligosaccharide, on the treatment of atopic dermatitis in infants,
Clinical and Experimental Allergy, 39 (2009) 1397-1403.
[57] B. Nemets, M. Fux, J. Levine, R.H. Belmaker, Combination of antidepressant drugs: the
case of inositol, Human psychopharmacology, 16 (2001) 37-43.
[58] D. Gelber, J. Levine, R.H. Belmaker, Effect of inositol on bulimia nervosa and binge
eating, The International journal of eating disorders, 29 (2001) 345-348.
[59] R.S. Clements, Jr., B. Darnell, Myo-inositol content of common foods: development of a
high-myo-inositol diet, The American journal of clinical nutrition, 33 (1980) 1954-1967.
[60] B.J. Holub, Metabolism and function of myo-inositol and inositol phospholipids, Annual
review of nutrition, 6 (1986) 563-597.
[61] A. Howlett, A. Ohlsson, N. Plakkal, Inositol in preterm infants at risk for or having
respiratory distress syndrome, The Cochrane database of systematic reviews, (2015) Cd000366.
[62] S.D. Smith, A.-L. Mikkelsen, S. Lindenberg, Development of human oocytes matured in
vitro for 28 or 36 hours, Fertility and Sterility, 73 (2000) 541-544.
[63] V. Unfer, G. Carlomagno, G. Dante, F. Facchinetti, Effects of myo-inositol in women with
PCOS: a systematic review of randomized controlled trials, Gynecol Endocrinol, 28 (2012)
509-515.
[64] H. C, Isomers of inositol niacinate and uses thereof. Patent reference WO 2008/106227,
in, 2008.
[65] J. McLaurin, R. Golomb, A. Jurewicz, J.P. Antel, P.E. Fraser, Inositol stereoisomers
stabilize an oligomeric aggregate of Alzheimer amyloid beta peptide and inhibit abeta -induced
toxicity, J Biol Chem, 275 (2000) 18495-18502.
[66] A.P. Porsteinsson, I.M. Antonsdottir, An update on the advancements in the treatment of
agitation in Alzheimer’s disease, Expert Opinion on Pharmacotherapy, 18 (2017) 611-620.
[67] T. Ibrahim, J. McLaurin, α-Synuclein aggregation, seeding and inhibition by scyllo-
inositol, Biochemical and Biophysical Research Communications, 469 (2016) 529-534.
[68] A.Y. Lai, C.P. Lan, S. Hasan, M.E. Brown, J. McLaurin, Scyllo-Inositol promotes Robust
Mutant Huntingtin Protein degradation, Journal of Biological Chemistry, 289 (2014) 3666-
3676.
[69] G. Livesey, Health potential of polyols as sugar replacers, with emphasis on low glycaemic
properties, Nutrition Research Reviews, 16 (2003) 163-191.
[70] K.K. Mäkinen, Gastrointestinal Disturbances Associated with the Consumption of Sugar
Alcohols with Special Consideration of Xylitol: Scientific Review and Instructions for Dentists
and Other Health-Care Professionals, International Journal of Dentistry, 2016 (2016) 5967907.
[71] B.M. Koeppen, B.A. Stanton, 10 - Physiology of diuretic action, in: Renal Physiology
(Fifth Edition), Mosby, Philadelphia, 2013, pp. 167-178.
[72] S. Rodríguez-Sánchez, O. Hernández-Hernández, A.I. Ruiz-Matute, M.L. Sanz, A
derivatization procedure for the simultaneous analysis of iminosugars and other low molecular
weight carbohydrates by GC-MS in mulberry (Morus sp.), Food Chem., 126 (2011) 353-359.
[73] C. Hahn, A. Müller, N. Kuhnert, D. Albach, Diversity of Kale (Brassica oleracea var.
sabellica): Glucosinolate Content and Phylogenetic Relationships, J. Agric. Food Chem., 64
(2016) 3215-3225.
[74] R.S. Clements Jr, B. Darnell, Myo-inositol content of common foods: development of a
high-myo-inositol diet, American Journal of Clinical Nutrition, 33 (1980) 1954-1967.
[75] A.I. Ruiz-Matute, A. Montilla, M.D. Del Castillo, I. Martínez-Castro, M.L. Sanz, A GC
method for simultaneous analysis of bornesitol, other polyalcohols and sugars in coffee and its
substitutes, J. Sep. Sci., 30 (2007) 557-562.

CHAPTER 3
56
[76] A.L. Eveland, D.P. Jackson, Sugars, signalling, and plant development, Journal of
Experimental Botany, 63 (2012) 3367-3377.
[77] USDA, https://ndb.nal.usda.gov/ndb/foods/show/11233, in, Accessed 10/11/2018.
[78] A. Becerra-Moreno, P.A. Alanís-Garza, J.L. Mora-Nieves, J.P. Mora-Mora, D.A. Jacobo-
Velázquez, Kale: An excellent source of vitamin C, pro-vitamin A, lutein and glucosinolates,
CYTA - Journal of Food, 12 (2014) 298-303.
[79] B. Han, X. Li, T. Yu, Cruciferous vegetables consumption and the risk of ovarian cancer:
A meta-analysis of observational studies, Diagnostic Pathology, 9 (2014).
[80] A.T. Dinkova-Kostova, R.V. Kostov, Glucosinolates and isothiocyanates in health and
disease, Trends in Molecular Medicine, 18 (2012) 337-347.
[81] Á.L.M. Gonçalves, M. Lemos, R. Niero, S.F. De Andrade, E.L. Maistro, Evaluation of the
genotoxic and antigenotoxic potential of Brassica oleracea L. var. acephala D.C. in different
cells of mice, Journal of Ethnopharmacology, 143 (2012) 740-745.
[82] M. Lemos, J.R. Santin, L.C.K. Júnior, R. Niero, S.F.D. Andrade, Gastroprotective activity
of hydroalcoholic extract obtained from the leaves of Brassica oleracea var. acephala DC in
different animal models, Journal of Ethnopharmacology, 138 (2011) 503-507.
[83] S.Y. Kim, S. Yoon, S.M. Kwon, K.S. Park, Y.C. Lee-Kim, Kale Juice improves coronary
artery disease risk factors in hypercholesterolemic men, Biomedical and Environmental
Sciences, 21 (2008) 91-97.
[84] J. Zhang, M.B. Satterfield, J.S. Brodbelt, S.J. Britz, B. Clevidence, J.A. Novotny,
Structural Characterization and Detection of Kale Flavonoids by Electrospray Ionization Mass
Spectrometry, Analytical Chemistry, 75 (2003) 6401-6407.
[85] M. Horbowicz, R.L. Obendorf, B.D. McKersie, D.R. Viands, Soluble saccharides and
cyclitols in alfalfa (Medicago sativa L.) somatic embryos, leaflets, and mature seeds, Plant
Science, 109 (1995) 191-198.
[86] I.H. Han, B.-K. Baik, Oligosaccharide Content and Composition of Legumes and Their
Reduction by Soaking, Cooking, Ultrasound, and High Hydrostatic Pressure, Cereal Chemistry,
83 (2006) 428-433.
[87] S.S. Nielsen, Phenol-Sulfuric Acid Method for Total Carbohydrates, in: S.S. Nielsen (Ed.)
Food Analysis Laboratory Manual, Springer US, Boston, MA, 2010, pp. 47-53.
[88] A.I. Ruiz-Matute, O. Hernández-Hernández, S. Rodríguez-Sánchez, M.L. Sanz, I.
Martínez-Castro, Derivatization of carbohydrates for GC and GC-MS analyses, J. Chromatogr.
B: Anal. Technol. in the Biomed. and Life Sci., 879 (2011) 1226-1240.
[89] C.C. Sweeley, R. Bentley, M. Makita, W.W. Wells, Gas-Liquid Chromatography of
Trimethylsilyl Derivatives of Sugars and Related Substances, Journal of the American
Chemical Society, 85 (1963) 2497-2507.
[90] M.L. Sanz, I. Martínez-Castro, Recent developments in sample preparation for
chromatographic analysis of carbohydrates, J. Chromatogr. A, 1153 (2007) 74-89.
[91] W.R. Sherman, N.C. Eilers, S.L. Goodwin, Combined gas chromatography‐mass
spectrometry of the inositol trimethylsilyl ethers and acetate esters, Organic Mass
Spectrometry, 3 (1970) 829-840.
[92] A.I. Ruiz-Matute, M. Brokl, A.C. Soria, M.L. Sanz, I. Martínez-Castro, Gas
chromatographic-mass spectrometric characterisation of tri- and tetrasaccharides in honey,
Food Chem., 120 (2010) 637-642.
[93] A.C. Soria, M.L. Sanz, M. Villamiel, Determination of minor carbohydrates in carrot
(Daucus carota L.) by GC-MS, Food Chem., 114 (2009) 758-762.
[94] D.J. Morgan, Construction and operation of a simple flame-ionization detector for gas
chromatography, Journal of Scientific Instruments, 38 (1961) 501-503.

INTRODUCTION
57
[95] J.E. Lovelock, A sensitive detector for gas chromatography, J. Chromatogr. A, 1 (1958)
35-46.
[96] A. Fox, Chapter 23 A current perspective on analysis of sugar monomers using GC-MS
and GC-MS/MS, in: Journal of Chromatography Library, 2002, pp. 829-843.
[97] P. Jandera, LIQUID CHROMATOGRAPHY | Normal Phase☆, in: Reference Module in
Chemistry, Molecular Sciences and Chemical Engineering, Elsevier, 2013.
[98] D.A. Martens, W.T. Frankenberger Jr, Determintion of saccharides in biological materials
by high-performance anion-exchange chromtography with pulsed amperometric detection, J.
Chromatogr. A, 546 (1991) 297-309.
[99] C. Guignard, L. Jouve, M.B. Bogéat-Triboulot, E. Dreyer, J.F. Hausman, L. Hoffmann,
Analysis of carbohydrates in plants by high-performance anion-exchange chromatography
coupled with electrospray mass spectrometry, J. Chromatogr. A, 1085 (2005) 137-142.
[100] H. Lin, S. Li, C. Xu, M. Pang, S. Wang, Simultaneous determination of galactose,
glucose, lactose and galactooligosaccharides in galactooligosaccharides raw materials by high-
performance anion-exchange chromatography with pulsed amperometric detection, Food
Chem., 263 (2018) 29-36.
[101] F.N. Lamari, R. Kuhn, N.K. Karamanos, Derivatization of carbohydrates for
chromatographic, electrophoretic and mass spectrometric structure analysis, Journal of
Chromatography B: Analytical Technologies in the Biomedical and Life Sciences, 793 (2003)
15-36.
[102] J.A. Saba, X. Shen, J.C. Jamieson, H. Perreault, Investigation of different combinations
of derivatization, separation methods and electrospray ionization mass spectrometry for
standard oligosaccharides and glycans from ovalbumin, Journal of Mass Spectrometry, 36
(2001) 563-574.
[103] B. Buszewski, S. Noga, Hydrophilic interaction liquid chromatography (HILIC)—a
powerful separation technique, Analytical and Bioanalytical Chemistry, 402 (2012) 231-247.
[104] A.J. Alpert, Hydrophilic-interaction chromatography for the separation of peptides,
nucleic acids and other polar compounds, J. Chromatogr. A, 499 (1990) 177-196.
[105] P. Jandera, Stationary and mobile phases in hydrophilic interaction chromatography: a
review, Anal. Chim. Acta, 692 (2011) 1-25.
[106] T. Ikegami, K. Tomomatsu, H. Takubo, K. Horie, N. Tanaka, Separation efficiencies in
hydrophilic interaction chromatography, J. Chromatogr. A, 1184 (2008) 474-503.
[107] G. Marrubini, P. Appelblad, M. Maietta, A. Papetti, Hydrophilic interaction
chromatography in food matrices analysis: An updated review, Food Chem., 257 (2018) 53-66.
[108] X. Yan, High-performance liquid chromatography for carbohydrate analysis, in: High-
Performance Liquid Chromatography (HPLC): Principles, Practices and Procedures, 2014, pp.
45-65.
[109] N. Vervoort, D. Daemen, G. Török, Performance evaluation of evaporative light
scattering detection and charged aerosol detection in reversed phase liquid chromatography, J.
Chromatogr. A, 1189 (2008) 92-100.
[110] B. Natalini, R. Sardella, A. Gioiello, G. Carbone, M. Dawgul, R. Pellicciari, Side-chain
modified bile acids: Chromatographic separation of 23-methyl epimers, J. Sep. Sci., 32 (2009)
2022-2033.
[111] D.M. Sheeley, V.N. Reinhold, Structural Characterization of Carbohydrate Sequence,
Linkage, and Branching in a Quadrupole Ion Trap Mass Spectrometer: Neutral
Oligosaccharides and N-Linked Glycans, Analytical Chemistry, 70 (1998) 3053-3059.
CHAPTER 3
58
[112] H. Zhang, S.M. Brokman, N. Fang, N.L. Pohl, E.S. Yeung, Linkage position and residue
identification of disaccharides by tandem mass spectrometry and linear discriminant analysis,
Rapid Communications in Mass Spectrometry, 22 (2008) 1579-1586.
[113] O. Hernández-Hernández, I. Calvillo, R. Lebrón-Aguilar, F.J. Moreno, M.L. Sanz,
Hydrophilic interaction liquid chromatography coupled to mass spectrometry for the
characterization of prebiotic galactooligosaccharides, J. Chromatogr. A, 1220 (2012) 57-67.
[114] J. Simões, P. Domingues, A. Reis, F.M. Nunes, M.A. Coimbra, M.R.M. Domingues,
Identification of anomeric configuration of underivatized reducing glucopyranosyl-glucose
disaccharides by tandem mass spectrometry and multivariate analysis, Analytical Chemistry,
79 (2007) 5896-5905.
[115] MarketsandMarkets, https://www.marketsandmarkets.com/PressReleases/global-
chocolate-market.asp. Accesed 14.01.2018, in, 2016.
[116] I.C. Organization, https://www.icco.org/statistics/cocoa-prices/daily-prices.html, in,
2018.
[117] R. Saltini, R. Akkerman, S. Frosch, Optimizing chocolate production through traceability:
A review of the influence of farming practices on cocoa bean quality, Food Control, 29 (2013)
167-187.
[118] R.F. Schwan, A.E. Wheals, The microbiology of cocoa fermentation and its role in
chocolate quality, Crit. Rev. Food Sci. Nutr., 44 (2004) 205-221.
[119] S.G. Ilangantileke, T. Wahyudi, M.G. Bailon, ASSESSMENT METHODOLOGY TO
PREDICT QUALITY OF COCOA BEANS FOR EXPORT, Journal of Food Quality, 14 (1991)
481-496.
[120] R.F. Schwan, A.H. Rose, R.G. Board, Microbial fermentation of cocoa beans, with
emphasis on enzymatic degradation of the pulp, Journal of Applied Bacteriology Symposium
Supplement, (1995) 96S-107S.
[122] R.F. Schwan, M.C.D. Vanetti, D.O. Silva, A. Lopez, C.A. De Moraes, Characterization
and Distribution of Aerobic, Spore‐Forming Bacteria from Cacao Fermentations in Bahia,
Journal of Food Science, 51 (1986) 1583-1584
[122] K. Ostovar, P.G. Keeney, ISOLATION AND CHARACTERIZATION OF
MICROORGANISMS INVOLVED IN THE FERMENTATION OF TRINIDAD'S CACAO
BEANS, Journal of Food Science, 38 (1973) 611-617.
[123] E.O. Afoakwa, A. Paterson, M. Fowler, A. Ryan, Flavor formation and character in cocoa
and chocolate: A critical review, Crit. Rev. Food Sci. Nutr., 48 (2008) 840-857.
[124] T.J. Gutiérrez, State-of-the-Art Chocolate Manufacture: A Review, Comprehensive
Reviews in Food Science and Food Safety, 16 (2017) 1313-1344.
[125] S.D. Coe, M.D. Coe, The True History of Chocolate, Thames & Hudson Ltd, 2013.
[126] C.D. Di Mattia, G. Sacchetti, D. Mastrocola, M. Serafini, From cocoa to chocolate: The
impact of processing on in vitro antioxidant activity and the effects of chocolate on antioxidant
markers in vivo, Frontiers in Immunology, 8 (2017).
[127] A. Leyva-Soto, R.A. Chavez-Santoscoy, L.R. Lara-Jacobo, A.V. Chavez-Santoscoy, L.N.
Gonzalez-Cobian, Daily consumption of chocolate rich in flavonoids decreases cellular
genotoxicity and improves biochemical parameters of lipid and glucose metabolism,
Molecules, 23 (2018).
[128] M. Camps-Bossacoma, M. Abril-Gil, S. Saldaña-Ruiz, À. Franch, F.J. Pérez-Cano, M.
Castell, Cocoa diet prevents antibody synthesis and modifies lymph node composition and
functionality in a rat oral sensitization model, Nutrients, 8 (2016).
[129] D. Grassi, V. Socci, D. Tempesta, C. Ferri, L. De Gennaro, G. Desideri, M. Ferrara,
Flavanol-rich chocolate acutely improves arterial function and working memory performance

INTRODUCTION
59
counteracting the effects of sleep deprivation in healthy individuals, Journal of Hypertension,
34 (2016) 1298-1308.
[130] T. Magrone, M.A. Russo, E. Jirillo, Cocoa and dark chocolate polyphenols: From biology
to clinical applications, Frontiers in Immunology, 8 (2017).
[131] M.A. Patras, B.P. Miley, G. Vraricken, N. Kuhnert, Identification of novel cocoa
flavonoids from raw fermented cocoa beans by HPLC-MSn, Food Res. Int., 63 (2014) 353-359.
[133] B.P. Milev, M.A. Patras, T. Dittmar, G. Vrancken, N. Kuhnert, Fourier transform ion
cyclotron resonance mass spectrometrical analysis of raw fermented cocoa beans of Cameroon
and Ivory Coast origin, Food Res. Int., 64 (2014) 958-961.
[133] J.E. Kongor, M. Hinneh, D.V. de Walle, E.O. Afoakwa, P. Boeckx, K. Dewettinck,
Factors influencing quality variation in cocoa (Theobroma cacao) bean flavour profile - a
review, Food Res. Int., 82 (2016) 44-52.
[134] J. Cerbulis, SUGARS IN CARACAS CACAO BEANS, Arch. Biochem. Biophys., 49
(1954) 442-450.
[135] J. Cerbulis, Carbohydrates in cacao beans .2. Sugars in Caracas cacao beans, Arch.
Biochem. Biophys., 58 (1955) 406-413.
[136] G.A. Reineccius, P.G. Kenney, T.E. Kavanagh, D.A. Andersen, Identification and
quantification of free sugars in cocoa beans J. Agric. Food Chem., 20 (1972) 199-202.
[137] R.J. Redgwell, V. Trovato, D. Curti, Cocoa bean carbohydrates: roasting-induced
changes and polymer interactions, Food Chem., 80 (2003) 511-516.
[138] M.M. Ardhana, G.H. Fleet, The microbial ecology of cocoa bean fermentations in
Indonesia, Int. J. Food Microbiol., 86 (2003) 87-99.
[139] V.T.T. Ho, J. Zhao, G. Fleet, The effect of lactic acid bacteria on cocoa bean fermentation,
Int. J. Food Microbiol., 205 (2015) 54-67.
[140] S. Ahmed, J.R. Stepp, Chapter 2 - Green Tea: The Plants, Processing, Manufacturing and
Production, in: V.R. Preedy (Ed.) Tea in Health and Disease Prevention, Academic Press, 2013,
pp. 19-31.
[141] M. Mukhopadhyay, T.K. Mondal, Cultivation, Improvement, and Environmental Impacts
of Tea, in, Oxford University Press, 2017.
[142] Y. Lu, L. Yü, D. Hitz, The classic of tea, Little, Brown and Company; 1st edition 1974.
[143] Y. Lu, L. Yü, D. Hitz, The classic of tea, 2st edition 1984.
[144] C. Cabrera, R. Artacho, R. Giménez, Beneficial Effects of Green Tea—A Review, Journal
of the American College of Nutrition, 25 (2006) 79-99.
[144] S. Moldoveanu, W. Scott, J. Zhu, Analysis of small carbohydrates in several bioactive
botanicals by gas chromatography with mass spectrometry and liquid chromatography with
tandem mass spectrometry, J. Sep. Sci., 38 (2015) 3677-3686.
[145] P. Shanmugavelan, S.Y. Kim, J.B. Kim, H.W. Kim, S.M. Cho, S.N. Kim, S.Y. Kim, Y.S.
Cho, H.R. Kim, Evaluation of sugar content and composition in commonly consumed Korean
vegetables, fruits, cereals, seed plants, and leaves by HPLC-ELSD, Carbohydrate Research,
380 (2013) 112-117.
[146] Y. Zhou, Y. Liu, S. Wang, C. Shi, R. Zhang, J. Rao, X. Wang, X. Gu, Y. Wang, D. Li,
C. Wei, Molecular cloning and characterization of galactinol synthases in Camellia sinensis
with different responses to biotic and abiotic stressors, J. Agric. Food Chem., 65 (2017) 2751-
2759.
[147] G. Le Gall, I.J. Colquhoun, M. Defernez, Metabolite profiling using 1H NMR
spectroscopy for quality assessment of green gea, Camellia sinensis (L.), J. Agric. Food Chem.,
52 (2004) 692-700.

CHAPTER 3
60
[149] A. Franzke, M.A. Lysak, I.A. Al-Shehbaz, M.A. Koch, K. Mummenhoff, Cabbage family
affairs: the evolutionary history of Brassicaceae, Trends in Plant Science, 16 (2011) 108-116.
[150] S.M. Jeon, J.E. Kim, S.K. Shin, E.Y. Kwon, U.J. Jung, N.I. Baek, K.T. Lee, T.S. Jeong,
H.G. Chung, M.S. Choi, Randomized double-blind placebo-controlled trial of powdered
Brassica rapa ethanol extract on alteration of body composition and plasma lipid and
adipocytokine profiles in overweight subjects, Journal of medicinal food, 16 (2013) 133-138.
[151] J.S. Shin, Y.S. Noh, Y.S. Lee, Y.W. Cho, N.I. Baek, M.S. Choi, T.S. Jeong, E. Kang,
H.G. Chung, K.T. Lee, Arvelexin from Brassica rapa suppresses NF-kappaB-regulated pro-
inflammatory gene expression by inhibiting activation of IkappaB kinase, British journal of
pharmacology, 164 (2011) 145-158.
[152] Y.H. Kim, Y.W. Kim, Y.J. Oh, N.I. Back, S.A. Chung, H.G. Chung, T.S. Jeong, M.S.
Choi, K.T. Lee, Protective effect of the ethanol extract of the roots of Brassica rapa on cisplatin-
induced nephrotoxicity in LLC-PK1 cells and rats, Biological & pharmaceutical bulletin, 29
(2006) 2436-2441.
[153] Z. Li, H.W. Lee, X. Liang, D. Liang, Q. Wang, D. Huang, C.N. Ong, Profiling of Phenolic
Compounds and Antioxidant Activity of 12 Cruciferous Vegetables, Molecules (Basel,
Switzerland), 23 (2018).
[154] J. Kapusta-Duch, A. Kopec, E. Piatkowska, B. Borczak, T. Leszczynska, The beneficial
effects of Brassica vegetables on human health, Roczniki Panstwowego Zakladu Higieny, 63
(2012) 389-395.
[155] S. Di Meo, T.T. Reed, P. Venditti, V.M. Victor, Harmful and Beneficial Role of ROS,
Oxidative Medicine and Cellular Longevity, 2016 (2016) 7909186.
[156] K.P. Latté, K.-E. Appel, A. Lampen, Health benefits and possible risks of broccoli – An
overview, Food and Chemical Toxicology, 49 (2011) 3287-3309.
[157] D. Samec, B. Urlic, B. Salopek-Sondi, Kale (Brassica oleracea var. acephala) as a
superfood: Review of the scientific evidence behind the statement, Critical reviews in food
science and nutrition, (2018) 1-12.
[158] A. Kamchan, P. Puwastien, P.P. Sirichakwal, R. Kongkachuichai, In vitro calcium
bioavailability of vegetables, legumes and seeds, Journal of Food Composition and Analysis,
17 (2004) 311-320.
[159] D. Thavarajah, P. Thavarajah, A. Abare, S. Basnagala, C. Lacher, P. Smith, G.F. Combs,
Mineral micronutrient and prebiotic carbohydrate profiles of USA-grown kale (Brassica
oleracea L. var. acephala), Journal of Food Composition and Analysis, 52 (2016) 9-15.
[160] E. Sikora, I. Bodziarczyk, Composition and antioxidant activity of kale (Brassica oleracea
L. var. acephala) raw and cooked, Acta scientiarum polonorum. Technologia alimentaria, 11
(2012) 239-248.
[161] J.A. Rodriguez, B. Nespereira, M. Perez-Ilzarbe, E. Eguinoa, J.A. Paramo, Vitamins C
and E prevent endothelial VEGF and VEGFR-2 overexpression induced by porcine
hypercholesterolemic LDL, Cardiovascular research, 65 (2005) 665-673.
[162] S.K. Yogeeta, R.B. Hanumantra, A. Gnanapragasam, S. Senthilkumar, R. Subhashini, T.
Devaki, Attenuation of abnormalities in the lipid metabolism during experimental myocardial
infarction induced by isoproterenol in rats: beneficial effect of ferulic acid and ascorbic acid,
Basic & clinical pharmacology & toxicology, 98 (2006) 467-472.
[163] C.H. de Azevedo, D.B. Rodriguez-Amaya, Carotenoid composition of kale as influenced
by maturity, season and minimal processing, 85 (2005) 591-597.
[164] J. Huang, M.S. Lu, Y.J. Fang, M. Xu, W.Q. Huang, Z.Z. Pan, Y.M. Chen, C.X. Zhang,
Serum carotenoids and colorectal cancer risk: A case-control study in Guangdong, China,
Molecular nutrition & food research, 61 (2017).

INTRODUCTION
61
[165] L. Jonasson, A. Wikby, A.G. Olsson, Low serum β-carotene reflects immune activation
in patients with coronary artery disease, Nutrition, Metabolism and Cardiovascular Diseases,
13 (2003) 120-125.
[166] J. Karppi, J.A. Laukkanen, T.H. Makikallio, S. Kurl, Low serum lycopene and beta-
carotene increase risk of acute myocardial infarction in men, European journal of public health,
22 (2012) 835-840.
[167] M. Gallo, G. Esposito, R. Ferracane, F. Vinale, D.J.E.F.R. Naviglio, Technology,
Beneficial effects of Trichoderma genus microbes on qualitative parameters of Brassica rapa L.
subsp. sylvestris L. Janch. var. esculenta Hort, 236 (2013) 1063-1071.
[168] M. Herranz-Lopez, S. Fernandez-Arroyo, A. Perez-Sanchez, E. Barrajon-Catalan, R.
Beltran-Debon, J.A. Menendez, C. Alonso-Villaverde, A. Segura-Carretero, J. Joven, V. Micol,
Synergism of plant-derived polyphenols in adipogenesis: perspectives and implications,
Phytomedicine : international journal of phytotherapy and phytopharmacology, 19 (2012) 253-
261.
[169] M. Vessal, M. Hemmati, M. Vasei, Antidiabetic effects of quercetin in streptozocin-
induced diabetic rats, Comparative Biochemistry and Physiology Part C: Toxicology &
Pharmacology, 135 (2003) 357-364.
[170] P. Velasco, M.E. Cartea, C. Gonzalez, M. Vilar, A. Ordas, Factors affecting the
glucosinolate content of kale (Brassica oleracea acephala group), Journal of agricultural and
food chemistry, 55 (2007) 955-962.
[171] J. Kapusta-Duch, B. Kusznierewicz, T. Leszczyńska, B. Borczak, Effect of Culinary
Treatment on Changes in the Contents of Selected Nutrients and Non-Nutrients in Curly Kale
(Brassica oleracea Var. acephala), 40 (2016) 1280-1288.
[172] A.T. Dinkova-Kostova, R.V. Kostov, Glucosinolates and isothiocyanates in health and
disease, Trends in molecular medicine, 18 (2012) 337-347.
[173] M.E. Cartea, P.J.P.R. Velasco, Glucosinolates in Brassica foods: bioavailability in food
and significance for human health, 7 (2008) 213-229.
[174] J. Jeon, J.K. Kim, H. Kim, Y.J. Kim, Y.J. Park, S.J. Kim, C. Kim, S.U. Park,
Transcriptome analysis and metabolic profiling of green and red kale (Brassica oleracea var.
acephala) seedlings, Food chemistry, 241 (2018) 7-13.
[175] A. Mazumder, A. Dwivedi, J. du Plessis, Sinigrin and Its Therapeutic Benefits, Molecules
(Basel, Switzerland), 21 (2016) 416.
[176] I. Pathirana, P. Thavarajah, N. Siva, A.N.K. Wickramasinghe, P. Smith, D. Thavarajah,
Moisture deficit effects on kale (Brassica oleracea L. var. acephala) biomass, mineral, and low
molecular weight carbohydrate concentrations, Scientia Horticulturae, 226 (2017) 216-222.


AIM OF THE STUDY


AIM OF STUDY
65
This thesis has as the starting point the increasing interest from consumers and food companies
on the chemical composition of healthy foods. Considering that LMWC, apart from their
essential role as an energetic source, has a proven beneficial effect on human health, this thesis
has aimed to generate an in depth-knowledge of the LMWC composition of different dietary
foods and beverages.
The starting point of this thesis is the framework of COMETA project. This project has aimed
to characterize the metabolome of cocoa beans and the changes related to the processing. Within
the general objectives of this project, the first objective of this thesis was to characterize the
LMWC profile in cocoa beans, as well as the monitorization of the main changes during the
spontaneous fermentation. In the direction of achieving this objective, the following partial
objectives have been proposed:
1. Development and validation of chromatographic methods suitable for the qualitative
and quantitative analysis of the LMWC in cocoa beans.
2. Comprehensive characterization of the LMWC in cocoa beans.
3. Quantification of the main LMWC identified in cocoa beans.
4. Evaluation of the LMWC as suitable indicators of origin and fermentation status.
5. Monitoring of the changes associated with the LMWC during the spontaneous
fermentation.
6. Establishment of the kinetic parameters of the changes related to the LMWC content
during spontaneous fermentation.
The second part of this PhD has been devoted to achieving a better understanding of the LMWC
in one of the most consumed beverages (commercial green tea) and in functional foods as as
kale (Brassica oleracea).. In order to achieve this objective, the following partial objectives
have been proposed:

AIM OF STUDY
66
1. Establishment and validation of chromatographic methods suitable for the quantitative
analysis of the LMWC content in green tea or kale.
2. Characterization and quantification of the main LMWC in commercial green teas from
different origins.
3. Evaluation of the LMWC content in CGT as suitable indicators, together with other
established physical and chemical quality indicators, to characterize commercial green
tea.
4. Characterization and quantification of the main LMWC in three types of kale grown
during development of kale and in the procces of cold acclimation.

RESULTS


Part-1 LMWC in cocoa beans (chapters 4-6)


RESULTS
71
Chapter 4. Profiling, quantification and classification of cocoa beans based on
chemometric analysis of carbohydrates using hydrophilic interaction liquid
chromatography coupled to mass spectrometry.
Roberto Megías-Pérez , Sergio Grimbs, Roy N. D’Souza, Herwig Bernaert, Nikolai Kuhnert
Manuscript published in Food Chemistry Volume 258, 30 August 2018, Pages 284-294
https://doi.org/10.1016/j.foodchem.2018.03.026

CHAPTER 4
72
ABSTRACT
Fifty-six cocoa bean samples from different origins and status of fermentation were analyzed
by a validated hydrophilic interaction liquid chromatography-electrospray ionization-time of
flight-mass spectrometry (HILIC-ESI-TOF-MS) method. The profile of the low molecular
weight carbohydrate (LMWC) was analyzed by high resolution and tandem mass spectrometry,
which allowed the identification of mono-, di-, tri- and tetrasaccharides, sugar alcohols and
iminosugars.
This study provides for the first time in a large sample set of samples, a comprehensive absolute
quantitative data set for the carbohydrates identified in cocoa beans (fructose, glucose,
mannitol, myo-inositol, sucrose, melibiose, raffinose and stachyose). Differences in the content
of carbohydrates were observed between unfermented (range of 0.9 - 4.9 g/g DM) and
fermented (range 0.1-0.5 g/g DM) cocoa beans.
The use of multivariate statistical tools allowed the identification of biomarkers suitable for
cocoa bean classification according to the status of fermentation, procedure of fermentation
employed and number of days of fermentation.
Keywords: carbohydrates, cocoa beans, Theobroma cacao, HILIC-ESI-TOF-MS, multivariate
statistical analysis.

RESULTS
73
1. INTRODUCTION
Cocoa beans from the tree Theobroma cacao are a sought-after commodity used by the
chocolate industry for the production of cocoa powder, a key ingredient in the production of
chocolates and related products. In 2016, the global market for chocolate reached an economic
value of USD 98.3 billion [1].
The production of cocoa powder starts with the harvesting of the cocoa pods by the farmers.
Once the cocoa pods are opened, unfermented cocoa beans are piled up with the pulp in
platforms, heaps or boxes. In these containers, spontaneous fermentation is induced by
microorganisms, including yeasts, acetobacters and lactobacilli. This crucial step results in the
formation of cocoa flavor and aroma precursors [2]. The standard duration of the fermentation
is five to six days on the average. Longer fermentation time frequently produces undesirable
mold. After fermentation, the cocoa beans are dried under the sun to avoid microbial
contamination during transportation to the industry. The process continues in the factory with
the steps of roasting and alkalization, which also contribute to the formation of the characteristic
color, flavor and aroma of cocoa powder. Once the roasted and alkalized beans are separated
from the shells, the beans are ground at elevated temperatures to yield cocoa liquor. By
hydraulic pressing, cocoa butter is separated from the cocoa cake that is ground into cocoa
powder [3].
The estimated chemical composition of unfermented cocoa beans is 32–39% water, 30–32%
lipids, 10–15% proteins, 5–6% polyphenols, 4–6% starch, 4–6% pentosans, 2–3% cellulose, 2-
3% of sucrose, 1–2% theobromine, 1% organic acids and 1% caffeine [4]. During fermentation
and subsequent drying of the cocoa beans, several reactions take place, resulting in a reduction
of water content, decrease in pH level and significant changes in lipid, carbohydrate, polyphenol
and protein composition [5]. The analysis of fermented cocoa beans by Fourier transform ion
cyclotron resonance mass spectrometry (FTICR-MS) has shown the chemical complexity of

CHAPTER 4
74
cocoa beans, concluding that the number of different compounds in cocoa is around or even
more than 40000 [6].
The study of carbohydrate composition in cocoa beans has been neglected in comparison to
other primary metabolites present in cocoa beans, such as lipids [7], proteins and peptides [8,9].
Secondary metabolites in cocoa beans, such as flavonoids, have been exhaustively studied due
to their health promoting properties [10-13].
The literature on carbohydrate analysis in cocoa beans to date is limited to few contributions.
In unfermented cocoa beans, the presence of fructose, glucose and sucrose has been reported
previously by gas chromatography-mass spectrometry (GC-MS) and HPLC. In fermented
beans, in addition to the carbohydrates previously mentioned, pentitol, sorbose, mannitol, myo-
inositol and oligosaccharides such as raffinose, stachyose and verbascose have been reported
[14-16]. The presence of myo-inositol and oligosaccharides such as raffinose in cacao beans is
noteworthy due to the bioactive properties attributed to these compounds [17,18].
HILIC, used in this work for the analysis of carbohydrates, has the advantages of ample
chromatographic resolution of polar compounds and easy coupling to MS due to the use of a
hydroorganic mixture as mobile phase over reversed-phase HPLC.
Three objectives were aimed at in this work. The first objective was to perform a comprehensive
characterization of the profile of low molecular weight carbohydrates (LMWC) in cocoa beans.
The second objective was to assess the content of the carbohydrates in unfermented and
fermented beans subjected to different fermentation processes and collected from different
locations. The third objective consisted in the evaluation of the LMWC as indicators of
fermentation status, beans origin, procedure of fermentation employed or the number of days
of fermentation.

RESULTS
75
2. MATERIALS AND METHODS
2.1. Chemicals
Dichloromethane and LC-MS grade acetonitrile were supplied by Aplichem Panreac
(Darmstadt, Germany). Ammonium hydroxide solution was provided by Sigma Aldrich
(Steinheim, Germany). Deionized water was obtained using a Milli-Q water filtration system.
NH2-SPE cartridges of 500 mg were purchased from Macherey Nagel (Düren, Germany). Asp-
Phe methyl ester, fructose, glucose, myo-inositol, sucrose, raffinose, melibiose and stachyose
were acquired from Sigma Aldrich (Steinheim, Germany) and mannitol was donated by
Bermpohl Apotheke (Bremen, Germany).
2.2. Cocoa bean samples
All samples were provided and certified by Barry Callebaut Belgium in regards to their location,
type of fermentation, duration of fermentation and hybrid name. The samples were collected
between 2014 and 2015.
24 unfermented cocoa beans were collected in Tanzania (n = 1), Ecuador (n = 7), Malaysia (n
= 3), Brazil (n = 1), Indonesia (n = 4) and Ivory Coast (n = 8). Unfermented samples were kept
at -80°C from the collection time until their corresponding processing for analysis.
Fermented cocoa bean samples were classified according to the different fermentation
processes: spontaneous fermentation and other fermentation (OF). The spontaneous
fermentation was induced by piling up the unfermented cocoa beans with the pulp. The beans
were rotated during the first 4 days of fermentation to ensure homogenization. 25 cocoa samples
corresponding to spontaneously fermented beans were analyzed. These samples were collected
in Tanzania (n = 1), Ecuador (n = 7), Malaysia (n = 3), Brazil (n = 1), Indonesia (n = 7) and
Ivory Coast (n = 6). The duration of the fermentation process for spontaneously fermented
beans was variable: 4 days (n=1), 5 days (n=6), 6 days (n=11) and 7 days (n=4). No data on
the duration of the fermentation process was provided for 3 samples.

CHAPTER 4
76
The term OF groups samples that were fermented by two different procedures: pre-drying and
controlled fermentation. The procedure of pre-drying consisted in drying the unfermented beans
(n=4) under the sun for six to eight hours before the usual spontaneous fermentation. Controlled
fermentation procedure consisted in the spraying of dedicated yeast cultures over the
unfermented beans (n=3) to boost fermentation process. Both procedures of fermentation had a
length of four days.
After fermentation, all cocoa beans, independently of the procedure of fermentation employed,
were dried under the sun for a period of time from 7 to 10 days. After that, the fermented
samples were stored in falcon tubes and kept at 4°C until their corresponding processing for
analysis.
The cocoa beans were de-shelled manually and ground using a mechanical grinder Retsch
(Haan, Germany).
2.3. Estimation of the dry matter content and the content of lipids
Dry matter content was calculated as the difference in weight of 2 g of cocoa powder before
and after heating at 105 °C for 20 hours.
5 g of cocoa powder was defatted for 18 hours by an automated Büchi Soxhlet instrument
(Flawil, Switzerland) using 150 mL of dichloromethane as solvent. The defatted powder was
vacuum dried for one hour with a pressure of 20 mbar and kept in a desiccator for 24 hours.
The lipid content was calculated as the difference in weight of cocoa before and after the process
of defatting.
2.4. Extraction of carbohydrates
150 mg of cocoa powder, previously defatted as described in section 2.3., were weighed and
the carbohydrates were extracted following a protocol available in the literature [19]. First, the
sample was extracted with 2 mL of Milli-Q water under constant stirring for 20 min at room
temperature. Then 8 mL of absolute ethanol was added and stirred continuously for 10 min.

RESULTS
77
Samples were centrifuged at 4400g for 6 min and the supernatant was collected. Precipitates
were subjected to a second extraction with 10 mL of 80% ethanol under the same conditions.
The two supernatants were pooled together.
2.5. Sample preparation: Solid Phase Extraction (SPE).
2 mL of the ethanolic extract was purified by SPE using an NH2-cartridge. The cartridges were
preconditioned with 10 mL of methanol followed by 10 mL of Milli-Q water. The polar fraction
that contains the carbohydrates was eluted using 6 mL of methanol, dried under N2 flow and
then suspended in 2 mL of acetonitrile: water (50:50). 10 µL of a solution of 1 mg/mL of Asp-
Phe methyl ester was added to 1 mL of the above solution as internal standard.
The efficiency of SPE purification for each carbohydrate was evaluated in triplicates using the
apparent recovery (A.R.) formula:
A.R = ((A-B) x 100)/C
A is the amount of carbohydrate quantified after the addition of 0.5 mL of the concentration C
to 1.5 mL of the ethanolic fraction of carbohydrates. B is the amount of carbohydrate detected
in 1.5 mL of the ethanolic fraction and 0.5 mL of 80% ethanol.
2.6. HILIC-ESI-TOF-MS and HILILC-ESI-MSn analysis.
The analyses were performed on an Agilent Technologies 1100 Series HPLC (Karlsruhe,
Germany). Chromatographic separation was achieved on a BEH X-Bridge amide column from
Waters (Hertfordshire, UK) with the following characteristics: 150 × 4.6 mm, 3.5 μm particle
size and 135 Å pore size. The solvents were water with 0.1% of ammonium hydroxide (solvent
A) and acetonitrile with 0.1% of ammonium hydroxide (solvent B). The final pH of the solvents
was adjusted to pH = 10. Gradient elution was performed as follows: 0-5 min 74% B; 37 min
60% B; 37.5 min 74% B. Injection volume was set to 10 µL. The flow rate used was 0.4
mL/min.

CHAPTER 4
78
A microTOF mass spectrometer fitted with an ESI source (HCT Ultra, Bruker Daltonics,
Bremen, Germany) (HILIC-ESI-TOF MS) operating in positive and negative ion mode in the
range of 50-1200 m/z was used to perform the identification of the molecular formula of the
compounds. For the quantitative and chemometrics analysis only data obtained in positive ion
mode were considered. Internal calibration was achieved using a solution of 0.1 M sodium
formate, solution injected through a six-port valve prior to each chromatographic run. The
electrospray source parameters were adjusted as follows: spray voltage, 4.5 kV; drying gas (N2,
99.5% purity); temperature = 220 °C; drying gas flow, 12 L/min; nebulizer (N2, 99.5% purity)
pressure, 1.6 bar. Data acquisition was performed using HyStar 3.2 software.
Ion trap mass spectrometer fitted with an ESI source (HCT Ultra, Bruker Daltonics, Bremen,
Germany) (HILIC-ESI-MSn) operating in positive Auto MSn mode in the range of 50-1200 m/z
was used to obtain fragment ions. In some cases, the positive and negative targeted mode were
used to achieve fragmentation of specific m/z values. The electrospray source parameters were
adjusted as follows: spray voltage, 4.5 kV; drying gas (N2, 99.5% purity); temperature = 360
°C; drying gas flow, 12 L/min; nebulizer (N2, 99.5% purity) pressure, 1.6 bar. Data acquisition
was performed using Agilent ChemStation software.
Calibration curves were calculated using the normalized area of the Extract Ion Chromatogram
(EIC) of the different standards with respect to the area of the internal standard. The normalized
area of the EIC of the sodium adduct [M+Na]+ was used for the calibration curves of fructose,
glucose, myo-inositol, mannitol, melibiose and raffinose. The calibration curves of sucrose and
stachyose were determined with the normalized area of the EIC of the ammonium adduct
[M+NH4]+. The range of concentrations is described in table 1.

RESULTS
79
Table 1. Analytical parameters of HPLC-ESI-TOF MS. Carbohydrates detected by HILIC-ESI-TOF MS in cacao
beans.
Carbohydrate Calibration curve Pearson coefficient
Linear working range (µg mL-1)
LOQ (ng mL-1)
LOD (ng mL-1)
Fructose y = 0.0587x + 0.0125 0.9920 0.4 – 8 50 16
Glucose y = 0.0344x + 0.0238 0.9926 0.4 – 10 200 66
myo-Inositol y = 0.0483x + 0.0261 0.9921 0.4 – 10 50 16
Mannitol y = 0.0441x - 0.0202 0.9904 0.6 – 8 200 66
Sucrose y = 0.0084x + 0.0092 0.9844 0.75 – 20 300 100
Melibiose y = 0.008x + 0.0052 0.9876 0.5 – 15 50 16
Raffinose y = 0.0256x - 0.007 0.9921 0.4 -10 150 50
Stachyose y = 0.0222x - 0.001 0.9738 1.0 – 20.0 200 66
Matrix effect for each carbohydrate was calculated per duplicate by the recovery obtained after
the addition of a specific amount of the standard of each carbohydrate (10 µg in the case of
fructose, glucose, myo-inositol and mannitol and 15 µg in the case of sucrose, melibiose,
raffinose and stachyose) to the analytical sample of cocoa bean obtained after SPE.
Chromatographic precision was calculated by means of the chromatographic repeatability or
intra-day precision. The chromatographic repeatability was determined as the average of the
RSD of the concentrations of main carbohydrates in cocoa beans obtained by multiple injections
(n=4) of two different cocoa samples performed the same day.
Limits of detection (LOD) and quantitation (LOQ) for the quantified carbohydrates were
calculated as three and ten times the standard deviation of the noise (σ), respectively.
The reproducibility of the entire method (extraction of the carbohydrates, preparation of the
sample by SPE and chromatographic separation) was evaluated by analyzing eighteen cocoa
samples performed per duplicate and three cocoa samples per triplicate.
2.7. Data processing and chemometric analysis
56 cocoa bean samples were used to perform the chemometric analysis. From these, 3 samples
were performed per triplicates, 18 samples performed per duplicates while the remaining 35
samples were performed by single extraction. The values of the peak areas for the different

CHAPTER 4
80
carbohydrates were extracted using MZmine2 [20] and double checked with the Data Analysis
4.0 (Bruker) software. The extracted areas for each of the different carbohydrates were first
normalized to the internal standard and subsequently to the measured sample weight.
PCA is frequently used in order to detect patterns in data, based on chemical variations observed
in large data sets. This unsupervised technique allows the visualization of underlying patterns,
by reduction of the data dimensionality, retaining as much as possible the information present
in the original data [21].
Partial least squares (PLS) analysis is a supervised regression method which attempts to extract
latent (or hidden) variables by maximizing the covariance between observed variables X and
response variables Y [22]. PLS discriminant analysis (PLS-DA) is an extension of PLS for
solving classification problems.
PLS-DAs and PCAs were performed using the R-package ropls [23]. In both cases, the data
were mean-centered and scaled to unit variance. The number of latent variables (LVs) to be
used in the PLS-DA models was chosen by 7-fold cross-validation of the respective data set.
The prediction error measure Q2 was used to validate PLS-DA models [24]. Furthermore, the
labels (i.e. classes) were permuted 100 times and Q2 was calculated for each of the
permutations. Subsequently, a one-sample t-test was performed to assess significant differences
between Q2 of the original data set and its permutations. The discriminant power of each
variable was evaluated by variable influence on projection (VIP) scores [25]. Variables with a
high VIP score (greater than one) are considered to be relevant for classification.
MANOVA is a procedure for testing the significant differences between mean values of two or
more response variables (the LMWC) within the evaluated groups (or factors) by comparing
their variances [26]. ANOVA is a statistical method for testing the significant differences
among group means by comparing their variances. The Student’s t-test is a statistical method
for comparing the means of two groups. Countries with a single sample (Brazil and Tanzania)

RESULTS
81
were excluded from the ANOVA analysis. MANOVA, ANOVA and t-test were calculated
using the corresponding functions from R version 3.3.2.
3. RESULTS AND DISCUSSION
3.1. Qualitative analysis
The method developed constitutes a suitable combination of extraction, enrichment, and
chromatographic separation that allows full characterization of the carbohydrate composition
of cocoa beans. Structure assignment of the different carbohydrates was achieved using high
resolution MS data obtained by HILIC-ESI-TOF-MS and fragmentation spectra obtained by
HILIC-ESI-MSn. Tentative identification of the type of glycosidic linkage between the units of
monosaccharides of unknown disaccharides and trisaccharides has been proposed. This
identification was based on the observation that, similar fragmentation profiles, but different
relative ratios of the fragment ions had been previously reported for disaccharides with the same
linkage but different monosaccharide residues [27-30]. Table S1.1 shows MS2 and MS3 data
from the different fragments ions observed from the different carbohydrates detected in cocoa
beans.
Figure 1 shows a representative chromatogram of the carbohydrate profile of unfermented
cocoa beans in positive ion mode. Main carbohydrates in cocoa beans (unfermented and
fermented) as fructose (peak 1), glucose (peak 3), sucrose (peak 6), myo-inositol (peak 10),
raffinose (peak 17) and stachyose (peak 23) and minor carbohydrates as mannitol (peak 2) and
melibiose (peak 13) were identified by comparing the retention time and MS data with those of
commercial standards.

CHAPTER 4
82
Figure 1. HILIC-ESI-TOF MS chromatogram of unfermented sample from Brazil in positive ion mode. 1.
Fructose, 3. Glucose, 4. Pentosyl-iminosugar (13.4), 5. Pentosyl-iminosugar (14.3), 6. Sucrose, 7, Alcohol of
tri-pentose, 8. Iminosugar, 9. Disaccharide (19.4), 10. myo-inositol, 11. Alcohol of disaccharide, 12.
Trisaccharide (22), 13. Melibiose, 14. Trisaccharide (23.2), 15. Dihexosyl glicerol, 16. Trisaccharide (24.8),
17. Raffinose, 18. Disaccharide (26.7), 19. Trisaccharide (26.8), 20. Trisaccharide (27.4), 21. Disaccharide
(28.5), 22. Trisaccharide (32.1), 23. Stachyose.
The compounds characterized are summarized in Table S1.2, including retention time,
molecular formulae, label name used for chemometric analysis in the case of isomers,
experimental m/z and error ppm value (calculated as the average value of three samples). No
further peaks corresponding to the sodium adduct of the above mentioned monosaccharides
([M+Na]+, C6H12O6Na) were detected. The presence of galactose could not be confirmed due
to the coelution of the analytical standard with glucose. No further peaks corresponding to the
sodium adduct of monosaccharides ([M+Na]+, C6H12O6Na) were detected.

RESULTS
83
Peaks 9, 18 and 21 were assigned as disaccharides according to the molecular formula of the
sodium adduct, ([M+Na]+, C12H22O11Na) and their pattern of fragmentation. A glycosidic
linkage 1→1 between the monosaccharide units of the disaccharides structures could be
tentatively attributed due to their base peak of m/z 203 at MS2 [27]. The others fragment ions
detected at MS2 could be attributed to a different monosaccharide composition from the
composition studied by Zhang, Brokman, Fang, Pohl and Yeung [27].
Six peaks (peaks 12, 16, 14, 19, 20 and 22) were identified as trisaccharides according to the
molecular formula of the sodium adduct ([M + Na]+, C18H32O16Na) and their fragment spectra.
Manninotriose, described in roasted cocoa beans by Thin-Layer Chromatography [31], could
not be evaluated due to the lack of the standard. The pattern of fragmentation of the peaks 12
and 16 displayed two consecutive neutral losses of 162 Da in MS2 and MS3, suggesting a
tentative 1→1 glycosidic linkage between the units of the monosaccharides of the trisaccharide
structure [27]. Different minor fragments in MS3 were observed between peak 12 (m/z ions 275,
305 and 347) and peak 16 (m/z ion 245,275,305), suggesting different composition in at least
one of the monosaccharides of each trisaccharide.
Peaks 14 and 19 showed a base peak of m/z 347 (100%) in MS2, compatible with the
consecutive neutral loss of 162 Da and 18 Da, and a base peak of m/z 365 (80%) compatible
with the loss of m/z 162. MS3 showed a base peak of 185, compatible with the loss of a hexosyl
group (162 Da). This fragmentation pattern does not follow the fragmentation pattern of a
glycosidic linkage type 1→X (X=1,2,3,4,6 position) showed by Zhang, Brokman, Fang, Pohl
and Yeung [27] and Hernández-Hernández, Calvillo, Lebrón-Aguilar, Moreno and Sanz [28].
Peak 20 showed a base peak m/z 365 at MS2 (loss of 162 Da), suggesting a tentative glycosidic
linkage type 1→1 in the structure of the trisaccharide. However, the base peak m/z 275 (neutral
loss of 90 Da) at MS3 and the presence of minor fragments (table S1.1) do not allow to
tentatively assign the remaining glycosidic linkage of the trisaccharide structure according to

CHAPTER 4
84
the data showed by Hernández-Hernández, Calvillo, Lebrón-Aguilar, Moreno and Sanz [28]
and Zhang, Brokman, Fang, Pohl and Yeung [27]. In the case of the peak 22, the fragmentation
pattern of neutral loss of 162 Da at MS2 and a base peak of m/z 305 at MS3 (neutral loss of 60
Da) with the presence of the fragments ions m/z 275, 203 and 245 suggests a tentative glycosidic
linkage between the units of monosaccharide (M) of the type M-(1→1)-M-(1→6)-M [112,
113].
In contrast to the previous publication [31], tetrasaccharides other than stachyose or
oligosaccharides of higher molecular formula were not detected.
Peaks 7, 11 and 15 were identified as alcohol of carbohydrates. Peak 7 was identified as an
alcohol of tripentose. The molecular formulae of peak 7 were C15H28NaO13 and C15H27O13 in
positive and negative ion mode respectively. MS2 in positive and negative ion mode showed a
neutral loss of 132 Da corresponding to the loss of a pentosyl group. Also, MS2 in negative ion
mode showed a neutral loss of 18 Da corresponding to a loss of water and 266 Da which might
correspond to a loss of an alcohol of di-pentose. MS3 in negative ion mode displayed the neutral
loss of 18 Da corresponding to water and 60 Da corresponding to C2H4O2.
Peak 11 was identified as alcohol of a disaccharide. The molecular formula of the peak 11 was
C12H24NaO11 in positive ion mode. MS2 in positive ion mode showed a neutral loss of m/z 60
(C2H4O2) and m/z 90 (C3H6O3). Peak 15 was identified as dihexosyl glycerol considering the
molecular formula C15H28NaO13 and the two consecutive neutral loss of 162 Da (hexosyl group)
in MS2 and MS3. Other alcohols of pentose previously reported in cocoa beans, such as pentitol,
were not detected [14].
Compounds with masses compatible with the quasi-molecular ion of iminosugars [M+H]+ were
detected (peaks 4, 5 and 8). Peaks 4 and 5, with a molecular formula of C11H14NO6 in positive
ion mode, showed in MS2 a neutral loss of 132 Da, which might correspond to the loss of a
pentosyl group. These compounds were not detected in negative ion mode. According to
RESULTS
85
available literature [32] these two compounds could be tentatively identified as pentosyl-
iminosugars.
The molecular formula of the peak 8 in positive ion mode was C12H16NO7. MS2 in positive ion
mode showed a base peak of m/z 252.1, the neutral loss of 18 Da, which corresponds to a loss
of a water molecule and the neutral loss of 162 Da, which might correspond to a glycosil group.
This compound was not detected in negative ion mode. Taking into account all data, this
compound could be tentatively identified as glycosyl-iminosugar [32]. This is the first
manuscript reporting iminosugars in cocoa beans.
3.2. Quantitative analysis
3.2.1. Lipids and dry matter in cocoa beans
The composition of lipids in unfermented cocoa beans was in the range of 26.6 to 41.5%. In
spontaneously fermented cocoa beans, the range of lipids was 45.7 to 58.0 % and in cocoa beans
fermented by OF procedure showed a lipid content in the range of 49.5 to 57%.
The dry matter content in unfermented cocoa beans was in the range of 54.1 to 71.3%. All
fermented beans, independently of the procedure employed, were dried for a period of seven to
ten days. For this reason, no differences were observed for spontaneously fermented beans
(range 84.8-94.8%) and samples fermented by OF procedure of pre-drying (range 93.9-94.6%)
or controlled fermentation (range 94.4-94.8%).
3.2.2. HPLC analysis.
3.2.2.1. Analytical parameters/Validation
Once the carbohydrate profile was characterized, the HILIC-ESI-TOF-MS proposed method
was assessed for its suitability in carbohydrate quantification of cocoa beans. To perform the
assessment, first the matrix effect was evaluated. Using reference standards of fructose, glucose,
mannitol, myo-inositol, sucrose, melibiose, raffinose and stachyose, the corresponding
calibration curves were obtained with satisfactory Pearson R2 values and a suitable linear
CHAPTER 4
86
working range. The recovery values (94-106%) obtained for each carbohydrate suggest that
matrix effects had little to no influence on the quantitative analysis. Recovery values obtained
for each compound are available in Table S2.1 (supplementary information).
LOD and LOQ values determined for fructose, myo-inositol and melibiose (16 and 50 ng mL−1,
respectively) were low, whereas higher values were observed for sucrose (100 and 300 ng mL−1,
respectively). Suitable values of intra-day precision were observed for all carbohydrates under
study (values of RSD lower than 7.0%). Table1 shows the analytical parameters of the method
of analysis (calibration curve, Pearson coefficient, linear working range, LOD and LOQ). .
According to the values of the A.R. for each carbohydrate, excellent efficiencies of SPE
purification were observed for fructose (92%), myo-inositol (84%), mannitol (83%), sucrose
(91%), melibiose (89%), raffinose (94%) and stachyose (97%). Acceptable values of
purification efficiency were determined for glucose (73%). The values of purification efficiency
for fructose and myo-inositol were in agreement with the values reported by other authors for
monosaccharides [33,34], while the value of purification efficiency for glucose was slightly
lower.
The reproducibility of the method (extraction of carbohydrates, sample preparation by SPE and
chromatographic separation) was also evaluated as the average of RSD of the main
carbohydrates in cocoa beans of the different samples analyzed per duplicate (n=18) and
triplicate (n=3). Average values of RSD of the main carbohydrates were in the range of 5.2-
7.9% and 3.8-14.6% for the cocoa samples analyzed per duplicate and triplicate of sample
preparation. RSD values obtained for each compound are available in the supplementary
information (Table S2.2a and S2.2b).
These data, together with the absence of matrix effect, indicated the suitability of the method
for the determination of carbohydrates in cocoa beans.

RESULTS
87
3.2.2.2. Carbohydrate composition in cocoa beans.
No differences in the global content of fructose were observed between unfermented and
fermented beans. However, differences among the mean content of glucose in unfermented
(74.5 mg/100 g DM, range 4.3-175.0), spontaneously (28.3 mg/100 g DM, range 0-104.8) and
OF fermented beans (48.1 mg/100 g DM, range 23.7-59.8) were observed.
The average content of myo-inositol in unfermented beans (53.1 mg/100 g DM, range 7.7-
121.2) was higher than the values observed in spontaneously fermented (31.9 mg/100 g DM,
range 0-84.7) and OF fermented beans (35.3 mg/100 g DM, range 0-80.0).
Table 2 shows values of fructose, glucose and myo-inositol, which were in the same order of
magnitud if compared to other authors [16,33] ).
In unfermented beans, sucrose (average value of 1165.7 mg/100 g DM, range 230-4086.8), was
the main carbohydrate in all cases, followed by raffinose and stachyose, which showed an
average value of 399.7 mg/100 g DM (range 66-1392.6) and 211.4 mg/100 g DM (range 41.3-
377.4) respectively. Values of sucrose were in accordance with values described elsewhere
[35]. The wide variability in the content of sucrose, raffinose, and stachyose could be explained
by the diversity of the samples under study, including different hybrids and collection places.
In fermented beans, lower average content was determined for sucrose, raffinose and stachyose
with respect to the value of unfermented beans, which showed values of 57.1 mg/100 g DM
(range 0-212.3), 17.1 mg/100 g DM (0-36.1) and 34.8 mg/100 g DM (range 4.6-80.4)
respectively. These data agree with the values reported previously [35]. The content of these
carbohydrates in OF fermented cocoa (n=7) was superior to the values determined
inspontaneously fermented beans, suggesting that this procedure produces less degradation of
sucrose and oligosaccharides (table 2).
Melibiose and mannitol are minor carbohydrates present in cocoa. Melibiose was not detected
in all samples. The average content of melibiose in unfermented beans (44.5 mg/100 g DM,

CHAPTER 4
88
range 0-308.3) was higher than the content determined in spontaneously (7.4 mg/100 g DM,
range 0-43.7) and OF fermented beans (27.5 mg/ 100 g DM, range 0-75.6).
Mannitol was detected only in fermented beans. Differences in the average content of mannitol
were observed between spontaneously (30.9 mg /100 g DM, range 5.8-105) and OF fermented
(8.5 mg/100 g DM, range 5.8-13.6) cocoa beans.Values of mannitol in spontaneously fermented
beans were in the same order of reported values, 40 mg/100g [136]. The reason for the presence
of mannitol only in fermented beans has not been elucidated. In cocoa pulp, the formation of
mannitol has been attributed to the reduction of fructose to mannitol by Lactobacillus
fermentum [36]. The differences in the content of mannitol observed in fermented beans
obtained by different procedures could be attributed to the differences in the microbiota
involved in the fermentation procedure or to the different conditions (pH and temperature) of
each fermentation procedure that could produce the reduction of fructose to mannitol.
In unfermented beans, the average total carbohydrate content determined ( 2g/100 g DM, range
0.9-4.9) was in the same order than the content described elsewhere [37]. The mean total
carbohydrate content in spontaneously (0.3 g/100g DM, range 0.1-0.5) and OF fermented beans
(0.4g/100g DM, range 0.2-0.5) were 6.6 and 5 time less the value determined in unfermented
beans.
According to the average total carbohydrate content, Malaysia and Ivory Coast were the
countries with the highest content determined in unfermented and fermented beans respectively.
The countries with the lowest content determined in unfermented beans were Ecuador and
Brazil and for fermented beans were Indonesia, Brazil and Tanzania.

RESULTS
89
Table 2. Mean and range values of each carbohydrate per country, status of fermentation (U: unfermented and F: fermented spontaneously) and procedure of fermentation
(CF: Controlled fermentation, PD: pre-drying beans before fermentation). n.d.: not detected
Carbohydrate
mg/100 g DM g/ 100 g DM
Fructose Glucose Myo-inositol Mannitol Sucrose Melibiose Raffinose Stachyose Total
Mean Range Mean Range Mean Range Mean Range Mean Range Mean Range Mean Range Mean Range Mean Range
Ivory Coast U ( n = 8) 38.5 14.8 - 86.3 33.8 4.3 - 75.2 59.4 7.7 - 121.2 n.d. - 1180.6 230 - 2634.6 4.9 0 - 22.7 339.5 114.9 - 531.5 116.5 79.9 - 172.3 1.8 0.9 - 3.1
F (n = 6) 172.3 34.5 - 296.4 57.0 16.2 - 104.8 53.4 20.7 - 84.7 54.6 28.1 - 105 58.2 26.8 - 151.7 0 - 20.2 15.1 - 24.1 26.6 17.8 - 45.4 0.4 0.2 - 0.5
Malaysia U (n = 3) 12.3 10.0 - 15.6 29.0 24.2 - 37.5 30.8 24.0 - 38.7 n.d. - 2887.0 1433.2 - 4086.8 11.8 0 - 35.5 622.5 541.2 - 782.6 244.5 158.7 - 325.9 3.8 2.4 - 4.9
F (n = 3) 24.8 21.3 - 27.6 7.7 4.1 - 11.1 12.7 8.2 - 15.7 21.7 17.8 - 23.9 137.9 59.3 - 212.3 0 - 11.7 8.5 - 14.3 37.7 25.2 - 47.0 0.3 0.2 - 0.3
Indonesia U (n = 4) 41.3 32 - 66.6 127.3 81.5 - 173.7 47.6 24.4 - 61.9 n.d. - 1203.1 464.4 - 1851.3 197.6 102.7 - 308.4 571.6 66.0 - 1392.6 266.6 41.3 - 366.3 2.5 1.4 - 3.6
F (n = 7) 25.6 10.3 - 36.9 6.1 0 - 34.5 14.2 0.0 - 29.2 30.6 15.7 - 55.9 36.6 0.8 - 119.3 4.4 0 - 18.3 14.5 0 - 29.8 36.2 4.6 - 80.4 0.2 0.1 - 0.3
Brazil U (n = 1) 69.1 - 94.1 - 85.4 - n.d. - 265.0 - 28.4 - 149.7 - 161.4 - 0.9 -
F (n = 1) 45.5 - 36.7 - 46.7 - 8.5 - 0.0 - 27 - 21.5 - 27.7 - 0.2 -
Tanzania U (n =1) 49.2 - 103.6 - 55.1 - n.d. - 1044.6 - 114.3 - 396.8 - 351.0 - 2.1 -
F (n = 1) 18.7 - 1.4 - 10.4 - 32.2 - 39.8 - 0.1 - 9.7 - 40.0 - 0.2 -
CF (n = 3) 36.3 22.9 - 53.4 44.7 23.7 - 57.7 24.9 13.4 - 37.0 6.7 5.8 - 8.3 144.0 104.3 - 184.5 11.6 0 - 31.3 43.5 27.3 - 62.1 66.1 40.6 - 82.5 0.4 0.3 - 0.4
Ecuador U (n =7) 65.7 21.6 - 103.4 103.3 38.5 - 175 53.8 32.9 - 74.0 n.d. - 535.4 266.3 - 1037.1 8.6 0 - 44.1 310.9 117.2 - 762.5 261.4 179.3 - 377.4 1.3 0.9 - 1.8
F (n = 7) 41.3 24.0 - 55.5 37.4 15.6 - 76.7 40.4 13.2 - 78.4 18.0 5.8 - 44.3 52.7 39.0 - 106.0 18.3 0 - 43.7 19.7 11.4 - 36.2 39.5 13.5 - 60.9 0.3 0.2 - 0.4
PD (n = 4) 49.9 27.3 - 64.5 50.7 34.0 - 59.8 43.2 0 - 80.0 9.9 6.9 - 13.6 87.2 37.5 - 164.1 39.3 14.9 - 75.6 35.8 2.0 - 48.8 79.0 41.4 - 160.0 0.4 0.2 - 0.5
Global
Content
U ( n = 24) 45.3 10.0 - 103.4 74.5 4.3 - 175.0 53.1 7.7 - 121.2 n.d. - 1165.7 230.0 - 4086.8 44.5 0 - 308.3 399.7 66.6 - 1392.6 211.4 41.3 - 377.4 2.0 0.9 - 4.9
F (n = 25) 65.7 10.3 - 296.4 28.3 0 - 104.8 31.9 0 - 84.7 30.9 5.8 - 105.0 57.1 0 - 212.3 7.4 0 - 43.7 17.1 0 - 36.1 34.8 4.6 - 80.4 0.3 0.1 - 0.5
OF (n = 7) 44.1 22.9 - 64.5 48.1 23.7 - 59.8 35.3 0 - 80.0 8.5 5.8 - 13.6 111.5 37.5 - 184.5 27.5 0 - 75.6 39.1 2.0 - 62.1 73.5 40.6 - 160.0 0.4 0.2 - 0.5

CHAPTER 4
90
3.3. Chemometric analysis
3.3.1. Classification of beans according to the status of fermentation
PCA was employed to evaluate sample clustering according to their fermentation status. A clear
separation between fermented and unfermented samples was observed in the PCA score plot
(Figure 2). The variance explained by the first component of PCA was 33.84%, while the
second component explained 21.84%. The first component could be considered as mainly
demarcating unfermented and fermented samples.
The carbohydrates stachyose, raffinose, sucrose, disaccharide (28.5), disaccharide (19.4),
dihexosyl glycerol, disaccharide (26.7) and melibiose have negative loadings values with
respect to the first principal component on the loading plot, indicating that these carbohydrates
are putative markers of unfermented cocoa beans. On the other hand, mannitol, which is entirely
absent in unfermented samples, and glycosyl-iminosugar, which shows relatively high
intensities in fermented samples, have positive loading values with respect to the first principal
component. Therefore, these compounds could be assigned as candidate markers of fermented
cocoa beans.
The differences observed with PCA analysis of all dataset were corroborated with the extremely
low p-value (<2.10-16) obtained from a one-way MANOVA using the bean type
(unfermented/fermented) as a factor.

RESULTS
91
Figure 2. PCA score (left) and loading plot (right) from LC-MS data of carbohydrate extracts of all cocoa bean
samples. Fermented (red) and unfermented beans (green) are clearly separated. Carbohydrates located on the far
left or right in the loading plot are indicative for unfermented or fermented beans, respectively.
PLS-DA was used to establish a statistical model for the classification of cocoa beans according
to the status of fermentation. The results of PLS-DA on the entire dataset can be seen in Figure
S3.1 (supplementary information). The number of latent variables in the model was set to 4
using cross-validation (prediction error measure Q2=0.87). Fermented beans can be clearly
distinguished from unfermented beans with a sensitivity and specificity of 100% (no
misclassified sample). A permutation test confirmed the high significance of the PLS-DA
model (p-value < 10-16). According to the VIP scores, mannitol and glycosyl-iminosugar are
suitable biomarkers for fermented beans. Sucrose, raffinose, and, to a lesser extent,
disaccharides (19.4 and 28.5) and dihexosyl glycerol are indicators for unfermented beans.
3.3.2. Classification of unfermented/spontaneously fermented cocoa beans with respect to
their origin
Further PCA analyses were carried out on HILIC-ESI-TOF-MS data from spontaneously
fermented and unfermented cocoa beans separately to identify carbohydrates as indicators of
the country of origin.

CHAPTER 4
92
PCA of unfermented beans (figure S3.2, supplementary information) showed that cocoa beans
from Malaysia were clearly separated from the rest of the cocoa samples. The samples from
Ecuador fell into two subgroups. The loading plot indicates that one of the Ecuadorian
subgroups was characterized by high intensities of fructose and glucose. Certain trend of
separation of Ivory Coast samples from the group of Ecuador was observed. The variance
explained by the first and second principal component was 32.96 % and 17.23%, respectively.
PCA of spontaneously fermented beans shows a perceptible trend of separation of the samples
from Ivory Coast and Indonesia/Malaysia from the rest of the groups (Figure S3.3,
supplementary information). The variance explained by the first and second principal
component was 41.33 % and 14.31%, respectively.
MANOVA test using the countries as factor revealed differences in the sample means for
unfermented beans (p-value 0.043) and fermented beans (p-value 0.0002). Table S3.5 and S3.6
show which carbohydrates had significant differences among countries using an ANOVA test.
According to this data, the LMWC profile (unfermented and spontaneously fermented) suggest
differences between countries, however, indicators to discern cocoa beans depending on a
specific origin could not be proposed.
3.3.3. Classification of fermented samples according to the fermentation procedure.
A visible separation according to the different process of fermentation performed was observed
from the corresponding PCA score plot restricted to fermented samples (Figure S3.4,
supplementary information). The variance explained by the first and second principal
component was 41.33% and 14.31%, respectively. Samples tend to separate between
spontaneous and OF procedure (controlled fermentation and pre-drying the beans before
fermentation).
The carbohydrates with significant differences between fermentation procedures, using a t-test,
are shown in the Table S3.7 (supplementary information). Mannitol and glycosyl-iminosugar

RESULTS
93
could be considered as markers of spontaneous fermentation procedure due to the elevated
normalized area showed in spontaneously fermented cocoa beans. These carbohydrates
coincide with the information obtained from the loadings plots. The rest of carbohydrates from
the Table S3.7 could be considered as markers of OF procedure due to the higher normalized
area detected in the loading plots of fermented cocoa beans obtained by this method of
fermentation (Figure S3.4).
The fact that the LMWC profile of cocoa beans fermented by OF procedure is similar to the
profile of unfermented cocoa beans suggests that the OF procedure might lead to incomplete
fermentation of cocoa beans. The incomplete fermentation in samples from Ecuador could be
due to the drying effect on the pulp, which could produce a decreased yeast population in
comparison to spontaneous fermentation. In the case of controlled fermentation, the
introduction of an exogenous yeast booster into the pulp and beans could alter the biochemistry
of fermentation.
PLS-DA was used to classify fermented cocoa beans according to the procedure of
fermentation. Figure 3 shows the PLS-DA model on the subset of fermented beans. Using cross-
validation (Q2=0.68) the number of latent variables was set to 2. The sensitivity and specificity
of predicting the fermentation type was 100% and 94.5%, respectively. A permutation test
confirmed the high significance of the PLS-DA model (p-value < 10-16).
As in the case of classifying the fermentation status, sucrose, and raffinose have the highest
VIP scores and are therefore considered to be also indicative of the fermentation procedure. In
other words, high intensities of these two carbohydrates can be found in either unfermented
beans or in beans that were not spontaneously fermented. Glycosyl-iminosugar and mannitol
also showed a high VIP score, what is in good accordance with their role as putative
fermentation status markers mentioned previously.

CHAPTER 4
94
Figure 3 (LEFT) Scores plot of PLS-DA based on the subset of fermented beans. Spontaneously fermented beans
are colored in red, while beans from other types of fermentation are shown in blue. (RIGHT) Corresponding
weight plot. Colors denote VIP scores of each variable, which indicate their discrimination power.
3.3.4. Evaluation of the profile of LMWC according to the duration of fermentation.
The duration of fermentation has consequences on the enzymatic processes involved in the
fermentation. In function of the number of days of fermentation, cocoa beans can be classified
as under-fermented, fully-fermented and over-fermented. Cocoa beans fermented for a period
shorter than 5 days have been classified as under-fermented, characterized by the incomplete
degradation of the proteins [9]. A fermentation period of five-to-six days is considered as
optimal for the production of flavor precursors (fully fermented cocoa beans). Cocoa beans
fermented for more than six days are considered as over-fermented beans, characterized by a
hammy off-flavor [2], darker appearence [37], the absence or low content of protein and high
peptide content.
All fermented samples under study were obtained through different fermentation procedures
with a variable duration, from four to seven days. This information was not available for three
samples.

RESULTS
95
In order to determine if the profile of the LMWC in fermented beans (spontaneously and OF
fermented beans), is different depending on the length of fermentation of cocoa, a MANOVA
test was performed using the number of days of fermentation as a factor. The result, p-value of
0.0007, suggests that there are differences in the profile of LMWC among the different days.
Performing ANOVA, using as a factor the duration of fermentation, revealed that the
carbohydrates fructose, mannitol, sucrose, disaccharide (26.7), disaccharide (19.4), melibiose,
raffinose, trisaccharide (32.1) and stachyose showed significant differences depending on the
number of days of fermentation (Table S3.8 shows the p-values of these carbohydrates). Figure
4 shows the normalized area of the carbohydrates with significant differences depending on the
number of days of fermentation.
Cocoa beans fermented for four days are characterized by an intermediate normalized area of
sucrose, raffinose and stachyose as well as by the presence of melibiose, disaccharide (26.7)
and disaccharide (19.4). This profile has similarity with the profile observed in unfermented
beans, suggesting that the beans are under-fermented. However, mannitol, described as an
indicator of fermentation in this work, was detected in these samples, suggesting that the
fermentation procedure has already started.
The LMWC profile of cocoa beans fermented for five and six days has differences with the
profile determined for unfermented beans. This profile, characterized by low normalized areas
of sucrose, raffinose, stachyose and the practical absence of disaccharide (19.4) and
disaccharide (26.7), suggests that the cocoa beans are fully fermented.
Cocoa beans fermented for seven days are characterized by a higher normalized area of
mannitol and fructose and the absence of melibiose, disaccharide (19.4) and disaccharide (26.7).
This profile suggests that the longer fermentation procedure, with its acidic pH value and
elevated temperature, produces degradation of disaccharides and oligosaccharides.

CHAPTER 4
96
The constant presence of the trisaccharide (32.1) in the fermented samples suggests that this
carbohydrate could be a product of the degradation of polysaccharides of cocoa beans or a
product of the enzymatic reactions during the fermentation.
4. CONCLUSION
An analytical method was validated for the analysis of carbohydrates in cocoa beans. The
method involves a solid-liquid extraction followed by a step of purification of carbohydrates
by SPE using an amino cartridge phase, with high efficiency in the purification of disaccharides
and oligosaccharides.
A comprehensive characterization of the carbohydrate composition in cocoa beans was
performed using HILIC-ESI-TOF-MS and HILIC-ESI-MSn .
The composition of the main carbohydrates of cocoa beans from different status of
fermentation, subjected to different fermentation processes and collected from different
locations is now reported for the first time in an elevated number of samples.
Unfermented cocoa beans were characterized by higher concentrations of sucrose, raffinose,
and stachyose. Spontaneously fermented cocoa beans were defined by the presence of mannitol
and lower concentrations of disaccharides and oligosaccharides. The LMWC profile of cocoa
beans fermented by OF procedure differs from the profile of spontaneously fermented beans in
their elevated content of disaccharides and oligosaccharides and lower levels of mannitol.
Interestingly, this profile has similarities with the profile of unfermented cocoa beans,
indicating that the OF procedure leads to an incomplete fermentation of the cocoa beans.

RESULTS
97
Figure 4. Boxplot of the several sugars fructose, mannitol, sucrose, disaccharide (26.7), disaccharide (19.4),
melibiose, raffinose, trisaccharide (32.1) and stachyose. Unfermented beans (n=24), Fermented beans 4 days
(n=8), 5 days (n=6), 6 days (n= 11) and 7 days (n=4). Three fermented samples were not consider for the absence
of data of the length of fermentation. The group of fermented beans of 4 days group samples spontaneously
fermented (n=1) and OF fermented (n=7).
The chemometric analysis reveals that the carbohydrate profile captures information about the
fermentation status, fermentation procedure performed and the number of days of fermentation
of the cocoa bean. Disaccharides (sucrose, melibiose, disaccharide (19.4), and disaccharide
(26.7)), raffinose and stachyose can be considered as indicators of the unfermented status of
cocoa beans. In fermented samples, elevated MS signal of disaccharides, raffinose and
stachyose suggests incomplety fermentation of cocoa beans either due to the fermentation
procedure (OF procedure) or the shorter period of fermentation procedure. Additionally,
mannitol is a clear indicator of the fermentation status of cocoa beans. It is clearly observable

CHAPTER 4
98
how the MS signal of this carbohydrate is elevated in samples fermented for longer periods of
time.
A useful classification of the cocoa beans according to the fermentation status and type of
procedure of fermentation was successfully achieved by PLS-DA.
The results of this study demonstrate remarkable diversity in the profile of the carbohydrates of
unfermented and fermented cocoa beans. In conjunction with other factors, this could be one of
the factors involved in the diversity of cocoa flavor from different origins.

RESULTS
99
6. REFERENCES
[1] MarketsandMarkets, https://www.marketsandmarkets.com/PressReleases/global-
chocolate-market.asp. Accesed 14.01.2018, in, 2016.
[2] R.F. Schwan, A.E. Wheals, The microbiology of cocoa fermentation and its role in chocolate
quality, Crit. Rev. Food Sci. Nutr., 44 (2004) 205-221.
[3] J. Wollgast, E. Anklam, Review on polyphenols in Theobroma cacao: changes in
composition during the manufacture of chocolate and methodology for identification and
quantification, Food Res. Int., 33 (2000) 423-447.
[4] J.E. Kongor, M. Hinneh, D.V. de Walle, E.O. Afoakwa, P. Boeckx, K. Dewettinck, Factors
influencing quality variation in cocoa (Theobroma cacao) bean flavour profile - a review, Food
Res. Int., 82 (2016) 44-52.
[5] R. Saltini, R. Akkerman, S. Frosch, Optimizing chocolate production through traceability:
A review of the influence of farming practices on cocoa bean quality, Food Control, 29 (2013)
167-187.
[6] B.P. Milev, M.A. Patras, T. Dittmar, G. Vrancken, N. Kuhnert, Fourier transform ion
cyclotron resonance mass spectrometrical analysis of raw fermented cocoa beans of Cameroon
and Ivory Coast origin, Food Res. Int., 64 (2014) 958-961.
[7] L.R. Vieira, P. Efraim, D. Van de Walle, N. De Clercq, K. Dewettinck, Influence of brazilian
geographic region and organic agriculture on the composition and crystallization properties of
cocoa butter, J. Am. Oil Chem. Soc., 92 (2015) 1579-1592.
[8] W.A. John, N. Kumari, N.L. Bottcher, K.J. Koffi, S. Grimbs, G. Vrancken, R.N. D'Souza,
N. Kuhnert, M.S. Ullrich, Aseptic artificial fermentation of cocoa beans can be fashioned to
replicate the peptide profile of commercial cocoa bean fermentations, Food Res. Int., 89 (2016)
764-772.
[9] N. Kumari, K.J. Kofi, S. Grimbs, R.N. D'Souza, N. Kuhnert, G. Vrancken, M.S. Ullrich,
Biochemical fate of vicilin storage protein during fermentation and drying of cocoa beans, Food
Res. Int., 90 (2016) 53-65.
[10] T. Stark, T. Hofmann, Structures, sensory activity, and dose/response functions of 2,5-
diketopiperazines in roasted cocoa nibs (Theobroma cacao), J. Agric. Food Chem., 53 (2005)
7222-7231.
[11] C. Ferri, G. Desideri, L. Ferri, I. Proietti, S. Di Agostino, L. Martella, F. Mai, P. Di Giosia,
D. Grassi, Cocoa, blood pressure, and cardiovascular health, J. Agric. Food Chem., 63 (2015)
9901-9909.
[12] F. Visioli, H. Bernaert, R. Corti, C. Ferri, S. Heptinstall, E. Molinari, A. Poli, M. Serafini,
H. Smit, J. Vinson, F. Violi, R. Paoletti, Chocolate, lifestyle, and health, Crit. Rev. Food Sci.
Nutr., 49 (2009) 299-312.
[13] M.A. Patras, B.P. Miley, G. Vraricken, N. Kuhnert, Identification of novel cocoa
flavonoids from raw fermented cocoa beans by HPLC-MSn, Food Res. Int., 63 (2014) 353-359.
[14] G.A. Reineccius, P.G. Kenney, T.E. Kavanagh, D.A. Andersen, Identification and
quantification of free sugars in cocoa beans J. Agric. Food Chem., 20 (1972) 199-202.
[15] R.J. Redgwell, V. Trovato, D. Curti, Cocoa bean carbohydrates: roasting-induced changes
and polymer interactions, Food Chem., 80 (2003) 511-516.
[16] M.M. Ardhana, G.H. Fleet, The microbial ecology of cocoa bean fermentations in
Indonesia, Int. J. Food Microbiol., 86 (2003) 87-99.
[17] M. Hayes, B.K. Tiwari, Bioactive carbohydrates and peptides in foods: An overview of
sources, downstream processing steps and associated bioactivities, International Journal of
Molecular Sciences, 16 (2015) 22485-22508.

CHAPTER 4
100
[18] R.S. Clements Jr, B. Darnell, Myo-inositol content of common foods: development of a
high-myo-inositol diet, American Journal of Clinical Nutrition, 33 (1980) 1954-1967.
[19] R. Megias-Perez, J. Gamboa-Santos, A.C. Soria, M. Villamiel, A. Montilla, Survey of
quality indicators in commercial dehydrated fruits, Food Chem., 150 (2014) 41-48.
[20] T. Pluskal, S. Castillo, A. Villar-Briones, M. Oresic, MZmine 2: modular framework for
processing, visualizing, and analyzing mass spectrometry-based molecular profile data, BMC
Bioinformatics, 11 (2010).
[21] L.A. Berrueta, R.M. Alonso-Salces, K. Heberger, Supervised pattern recognition in food
analysis, J. Chromatogr. A, 1158 (2007) 196-214.
[22] S. Wold, M. Sjostrom, L. Eriksson, PLS-regression: a basic tool of chemometrics,
Chemometrics Intell. Lab. Syst., 58 (2001) 109-130.
[23] E.A. Thevenot, A. Roux, Y. Xu, E. Ezan, C. Junot, Analysis of the human adult urinary
metabolome variations with age, body mass index, and gender by implementing a
comprehensive workflow for univariate and OPLS statistical analyses, J. Proteome Res., 14
(2015) 3322-3335.
[24] E. Szymanska, E. Saccenti, A.K. Smilde, J.A. Westerhuis, Double-check: validation of
diagnostic statistics for PLS-DA models in metabolomics studies, Metabolomics, 8 (2012) S3-
S16.
[25] B. Galindo-Prieto, L. Eriksson, J. Trygg, Variable influence on projection (VIP) for
orthogonal projections to latent structures (OPLS), J. Chemometr., 28 (2014) 623-632.
[26] L.C. Matos, S.C. Cunha, J.S. Amaral, J.A. Pereira, P.B. Andrade, R.M. Seabra, B.P.P.
Oliveira, Chemometric characterization of three varietal olive oils (Cvs. Cobrancosa, Madural
and Verdeal Transmontana) extracted from olives with different maturation indices, Food
Chem., 102 (2007) 406-414.
[27] H. Zhang, S.M. Brokman, N. Fang, N.L. Pohl, E.S. Yeung, Linkage position and residue
identification of disaccharides by tandem mass spectrometry and linear discriminant analysis,
Rapid Communications in Mass Spectrometry, 22 (2008) 1579-1586.
[28] O. Hernández-Hernández, I. Calvillo, R. Lebrón-Aguilar, F.J. Moreno, M.L. Sanz,
Hydrophilic interaction liquid chromatography coupled to mass spectrometry for the
characterization of prebiotic galactooligosaccharides, J. Chromatogr. A, 1220 (2012) 57-67.
[29] S. König, J.A. Leary, Evidence for linkage position determination in cobalt coordinated
pentasaccharides using ion trap mass spectrometry, Journal of the American Society for Mass
Spectrometry, 9 (1998) 1125-1134.
[30] L. Ruiz-Aceituno, L. Ramos, I. Martinez-Castro, M.L. Sanz, Low molecular weight
carbohydrates in pine nuts from Pinus pinea L, J. Agric. Food Chem., 60 (2012) 4957-4959.
[31] J. Cerbulis, Carbohydrates in cacao beans .2. Sugars in Caracas cacao beans, Arch.
Biochem. Biophys., 58 (1955) 406-413.
[32] S. Rodriguez-Sanchez, M.J. Garcia-Sarrio, J.E. Quintanilla-Lopez, A.C. Soria, M.L. Sanz,
Analysis of iminosugars and other low molecular weight carbohydrates in Aglaonema sp
extracts by hydrophilic interaction liquid chromatography coupled to mass spectrometry, J.
Chromatogr. A, 1423 (2015) 104-110.
[33] Y. Zhang, H.F. Li, Y. Ma, Y. Jin, G.H. Kong, J.M. Lin, Microwave assisted extraction-
solid phase extraction for high-efficient and rapid analysis of monosaccharides in plants,
Talanta, 129 (2014) 404-410.
[34] M. Tian, W. Bi, K.H. Row, Separation of monosaccharides by solid-phase extraction with
ionic liquid-modified microporous polymers, J. Sep. Sci., 34 (2011) 3151-3157.

RESULTS
101
[35] A. Caligiani, L. Palla, D. Acquotti, A. Marseglia, G. Palla, Application of 1H NMR for the
characterisation of cocoa beans of different geographical origins and fermentation levels, Food
Chem., 157 (2014) 94-99.
[36] T. Lefeber, M. Janssens, F. Moens, W. Gobert, L. De Vuyst, Interesting starter culture
strains for controlled cocoa bean fermentation revealed by simulated cocoa pulp fermentations
of cocoa-specific lactic acid bacteria, Applied and Environmental Microbiology, 77 (2011)
6694-6698.
[37] A.C. Aprotosoaie, S.V. Luca, A. Miron, Flavor chemistry of cocoa and cocoa products-an
overview, Com


RESULTS
103
Chapter 5. Analysis of minor low molecular weight carbohydrates in cocoa beans
by chromatographic techniques coupled to mass spectrometry
Roberto Megías-Pérez, Ana Isabel Ruiz-Matute, Marcello Corno, Nikolai Kuhnert
Manuscript published in Journal of Chromatography A,Volume 1584, 11 January 2019, Pages
135-143 https://doi.org/10.1016/j.chroma.2018.11.033

CHAPTER 5
104
ABSTRACT
The low molecular weight carbohydrate (LMWC) profile of cocoa beans has recently been
studied using hydrophilic interaction liquid chromatography coupled to electrospray ionization-
time of flight mass spectrometry (HILIC-ESI-TOF MS) and HILIC-ESI-tandem mass
spectrometry (HILIC-ESI-MSn). However, different LMWC could not be unambiguously
identified. Thus, as a first approach in this paper, gas chromatography coupled to mass
spectrometry (GC-MS) was used as a complementary analytical technique to characterize
LMWC of cocoa beans. Different mono-, di-, tri- and tetrasaccharides, as well as myo-inositol,
galactinol and a diglycosil glycerol were detected. scyllo-Inositol, 1-kestose and 6-kestose were
identified in unfermented cocoa beans for the first time. Moreover, other minor LMWC were
tentatively assigned as fructosyl-fructose, fructosyl-glucose and glucosyl-sucrose. As a second
step, in order to evaluate new possible indicators of cocoa bean origin or fermentation status,
scyllo-inositol, 1-kestose and galactinol were selected as target compounds and a HILIC-ESI-
TOF MS method was optimized for their analysis. The optimized conditions, using an
acetonitrile:water gradient with 0.05% ammonium hydroxide at 40°C showed narrow peaks
(wh: 0.3-0.5 min) with good resolution values (Rs: 0.83–2.83). The validated HILIC-ESI-TOF
MS method was applied to the analysis of 35 cocoa bean samples from different origins and
fermentation status. The content of scyllo-inositol, 1-kestose and galactinol in unfermented
beans (n=21) was in the range of traces-504.9, 36.1- 133.5 and traces-1970.4 µg g-1 cocoa DM
respectively. In fermented beans (n=14), the content of scyllo-inositol and 1-kestose was in the
range of 15.5-491.9 and traces-115.5 µg g-1 cocoa DM respectively. Galactinol was absent in
fermented beans, indicating that it could be a potential indicator of fermentation status. The
methodology proposed could be used for quality control of natural products and other food
ingredients containing inositols and oligosaccharides.
Keywords: scyllo-inositol, 1-kestose, galactinol, cocoa bean, HILIC-ESI-TOF MS, GC-MS.
RESULTS
105
1. INTRODUCTION
Cocoa beans, the seeds of the cocoa tree Theobroma cacao L., are used as raw material in the
manufacturing of chocolate and other derived products. They constitute the principal
agricultural export commodity for the producing countries and they are also the main source of
income for about 6 million smallholders around the world. [1, 2].
In recent years, the study of cocoa beans has received much attention from the scientific
community. Different research lines have been focused on the characterization of unknown
compounds[3], the search for indicators of bean origin or status of fermentation [4], the
evaluation of quality parameters to distinguish among hybrid cultivars [5] and the development
of a sustainable production of high-quality beans and cocoa products [6], among others. Most
of these researches are based on the study of polyphenols [7,8], volatile compounds [9], lipids
[10] or proteins/peptides [11] in cocoa beans and their evolution during fermentation processes
and roasting. However, despite the significant role of carbohydrates in the Maillard reaction,
which takes place during cocoa bean roasting [12], few studies have been reported regarding
low molecular weight carbohydrates (LMWC) in cocoa beans.
Among the different analytical techniques that can be used for carbohydrate analysis, gas
chromatography (GC) and liquid chromatography (LC) coupled to mass spectrometry (MS) are
the most extensively employed [13].
GC-MS has been widely used for the analysis of LWMC due to its high-resolution power,
sensitivity and potential for structural identification. In GC-MS, the combination of GC
retention times (or retention indices) and specific electron impact ionization (EI) mass spectra
of derivatives provide valuable information about the chemical structure of a molecule. This
information is specifically useful for complex mixtures of carbohydrate isomers, where
compounds with the same molecular weight differ only in the configuration of their hydroxyl
groups and the position of their glycosidic linkages [14]. GC-MS has been applied for the

CHAPTER 5
106
structural characterization of different types of bioactive carbohydrates such as inositols [15],
cyclitol glycosides [16], iminosugars [17] or trisaccharides [18]. However, the main
disadvantage of the analysis of LMWC using GC-MS is that a previous derivatization step is
required [19], which can be a tedious and expensive task for routine analysis.
Conversely, in LC-MS the sample preparation for carbohydrate analysis is usually much
simpler and does not require a lengthy time, which is an advantage over GC. Among the
different operation modes, hydrophilic interaction liquid chromatography (HILIC) is
considered an efficient alternative to reverse-phase liquid chromatography for the analysis of
complex oligosaccharide mixtures. This technique provides appropriate resolution between
isomers and good peak shapes [20]. Furthermore, HILIC is easily coupled to MS due to the
mobile phases used, which consist of water mixtures with a high percentage of organic solvents,
enhancing the ionization and increasing sensitivity [20]. Successful application of HILIC-MS
to the analysis of carbohydrates from different matrices can be found in the literature, such as
the analysis of iminosugars in plants [21] or oligosaccharides in milk [20], among others.
However, applications of this technique in the analysis of cocoa bean LMWC are very scarce.
We have recently developed a methodology based on HILIC-electrospray ionization-time of
flight MS (HILIC-ESI-TOF MS) and HILIC-ESI-tandem mass spectrometry (HILIC-ESI-MSn)
to monitor changes in cocoa bean LMWC according to their origin and fermentation status [22].
That study has demonstrated the suitability of the carbohydrate profile as an indicator of
fermentation status, fermentation procedure and duration of fermentation. Monosaccharides
(fructose, glucose), polyols (myo-inositol and mannitol), disaccharides (sucrose and melibiose),
trisaccharides (raffinose) and tetrasaccharides (stachyose) were detected. Furthermore, the
presence of other minor LMWC, which could not be unambiguously identified, was reported.
This lack of assignment of identities is mainly a consequence of the inability to identify co-
eluting peaks due to the non-specific fragmentation spectra of the carbohydrates.

RESULTS
107
Consequently, the present paper aims to develop a new methodology which allows to
investigate the content of unknown minor LMWC detected in cocoa beans. GC-MS has been
used to complement the structural information previously reported using HILIC-ESI-MSn. An
appropriate methodology using HILIC-ESI-TOF MS has been developed and validated to
analyze the selected target LMWC in different types of cocoa bean samples and therefore, to
evaluate these LMWC as putative potential indicators of origin or fermentation status.
2. MATERIALS AND METHODS
2.1. Chemicals and standards
Dichloromethane and LC-MS grade acetonitrile (ACN) were supplied by Aplichem Panreac
(Darmstadt, Germany). Ammonium hydroxide solutions, Asp-Phe methyl ester (used as
internal standard in HILIC-ESI-TOF MS analysis), fructose, glucose, galactose, maltose,
melibiose, myo-inositol, phenyl-β-D-glucoside (used as internal standard in GC-MS analysis),
sucrose, raffinose and stachyose were obtained from Sigma Chemical Co. (St. Louis, USA).
Scyllo-inositol, 1-kestose and galactinol were purchased at Carbosynth (Compton, UK).
2.2. Cocoa bean samples
Cocoa bean samples (n = 35) were provided and certified with regard to their location and status
of fermentation by Barry Callebaut Belgium (Table S1, supplementary information).
Unfermented cocoa beans (n = 21) were collected from different geographical origins: Ecuador
(n = 5), Malaysia (n = 3), Brazil (n = 3), Indonesia (n = 4) and Ivory Coast (n = 6). Unfermented
samples were kept at -80°C from the collection time until the beans were processed for analysis.
Fourteen spontaneously fermented cocoa beans collected in Ecuador (n = 3), Malaysia (n = 3),
Brazil (n = 2), Indonesia (n = 3) and Ivory Coast (n = 3) were as well analyzed. The spontaneous
fermentation was induced by piling up the unfermented beans with the pulp in platforms. The
beans were rotated during the first 4 days of fermentation to ensure homogenization. Ivory
CHAPTER 5
108
Coast samples (n=2) were fermented for 7 days. There was no data regarding the fermentation
duration from one sample from Ivory Coast. Samples from Indonesia, Malaysia and Brazil were
fermented for 6 days and samples from Ecuador for a period ranging from 4 to 5 days. After
fermentation, cocoa beans were dried under the sun for a period of 7 to 10 days. The samples
were stored in falcon tubes at 4°C until the beans were processed for analysis.
Cocoa beans were de-shelled manually and ground using a mechanical grinder Retsch (Haan,
Germany). Dry matter (DM) content was calculated as the difference in weight of 2 g of cocoa
powder before and after heating at 105 °C for 20 hours.
2.3. Extraction of carbohydrates
For the extraction of LMWC from cocoa, defatted cocoa powder (150 mg) was subjected to
two cycles of solid-liquid extraction (SLE) using ethanol 80% as extracting solvent, following
the procedure described by Megias-Perez et al. [23].
All samples were prepared in duplicate.
2.4. GC-MS analysis
A two-step derivatization procedure (oximation + silylation) of carbohydrates was carried out
prior to GC–MS analysis according to the method described elsewhere [16]. Briefly, 0.1 mL of
70% methanolic solution of phenyl--D-glucoside (1 mg mL-1; internal standard) was added to
2 mL of cocoa sample extracts and to 0.5 mL of solutions of carbohydrate standards (1 mg mL-
1 in methanol: water 70:30, v/v). Thereafter, samples were evaporated under vacuum and treated
with 350 µL of 2.5% hydroxylamine chloride in pyridine at 75 °C for 30 min. Then, 350 µL of
hexamethyldisilazane (HMDS) and 35 µL of trifluoroacetic acid (TFA) (both from Sigma
Aldrich) were added and the solution was kept at 45 °C for 30 min. Samples were centrifuged
at 7000 g at 5 °C for 5 min. The derivatization procedure employed converts carbohydrates to
oximes prior to trimethylsilylation, thereby reducing the number of chromatographic peaks for
each reducing carbohydrate to two (corresponding to E- and Z- oxime isomers), and one peak

RESULTS
109
for the non-reducing carbohydrates. Thus, simpler chromatographic profiles are obtained to
facilitate the identification of target compounds in complex mixtures [18].
Qualitative analysis of carbohydrates was carried out using a 7890A gas chromatograph
coupled to a 5975C quadrupole mass detector (Agilent Technologies, Palo Alto, CA, USA)
operating in EI mode at 70 eV. A high-temperature polycarborane–siloxane HT-5 capillary
column (25 m × 0.22 mm i.d. × 0.1 µm film thickness; SGE, Ringwood, Australia) was used
for the qualitative analysis. Helium at 1 mL min−1 was used as carrier gas. The oven temperature
was programmed as follows: 180 °C for 10 min, followed by 200 °C at a heating rate of 5°C
min-1, afterwards 270 °C at a heating rate of 15 °C min-1, then 290 °C at 1 °C min-1, 360 °C at
5 °C min-1 and held for 30 min. The transfer line was set at 280 ºC and the ionization source at
230 ºC. Subsequently, 1 µL of sample was injected in the split mode (split ratio of 1:10) at 300
°C. Data acquisition was performed using a HPChem Station software (Agilent Technologies).
Samples were analyzed in duplicate.
Linear retention indices (IT) were calculated from the retention times of LMWC trimethylsilyl
oxime (TMSO) derivatives and those of suitable n-alkanes (from C17 to C40) as described by
Messadi et al. (1990) [24].
Carbohydrates were identified by comparison of experimental linear retention indices (IT) and
mass spectra with the available standards. Compounds for which commercial standards were
not available were tentatively identified on the basis of their mass spectral information and data
from the literature [14,15,25].
2.5. HILIC-ESI-TOF MS analysis.
For HILIC-ESI-TOF MS analysis, 1 mL of the sample was filtered through a CHROMAFIL
Xtra PTFE-45/25 filter (Macherey-Nagel, (Macherey Nagel, Düren, Germany ) and 10 µL of
an internal standard solution of 1 mg mL-1 of Asp-Phe methyl ester were added.

CHAPTER 5
110
An Agilent 1100 Series HPLC (Agilent Technologies, Karlsruhe, Germany) was used to
perform the chromatographic analysis. A BEH X-Bridge column, with a trifunctionally-bonded
amide phase (Waters Company, USA) and the following characteristics: 150 mm × 3.0 mm;
3.5 μm particle size and 135 Å pore size was chosen to perform the chromatographic analysis.
Water (solvent A) and acetonitrile (solvent B) with 0.05% ammonium hydroxide were used as
mobile phase. Injection volume was set to 3 µL. A flow rate of 0.4 mL min-1 was used.
A microTOF mass spectrometer fitted with an ESI ion source (Bruker Daltonics HCT Ultra,
Bremen, Germany) operating in positive ion mode in the range of 50-1200 m/z was used to
perform the identification of the molecular formula of the compounds and the quantitative
analysis. Internal calibration of the instrument was carried out by the injection of 0.1 M sodium
formate solution before starting the sequence run. Additionally, sodium formate solution was
injected automatically through a six-port valve prior to each chromatographic run to perform a
posterior calibration. The ESI source parameters were adjusted as follows: spray voltage, 4.5
kV; drying gas (N2, 99.5% purity); temperature = 220 °C; drying gas flow, 12 L min-1; nebulizer
(N2, 99.5% purity) pressure, 1.6 bar. Data acquisition was performed using HyStar 3.2 software
(Bruker, Bremen, Germany).
Optimization of the chromatographic method was carried out considering different parameters
such as chromatographic resolution (Rs), retention time (tR) and peak width at half height (wh)
for the target compounds. The chromatographic resolution was calculated as 2(tR2 − tR1)/(wb1 +
wb2), where tR1 and tR2 refer to retention times of two consecutive eluting carbohydrates with
the same m/z value and wb is the peak width at base of each of them. Different binary gradients
were evaluated (Table 1). The optimal conditions were achieved using the following gradient:
0–5 min, 17.5 % A; 5–37 min, 17.5–40% A; 37–50 min 17.5% A. The effect of column
temperature was also studied (25–55°C).

RESULTS
111
The identification of carbohydrates in cocoa beans was performed by comparing the retention
time and exact mass data obtained for each carbohydrate operating in positive ion mode with
those of commercial standards. The mass error detected was below 5 ppm.
For the quantitative analysis, the areas of the Extracted Ion Chromatogram (EIC) of the sodium
adduct [M+Na]+ of scyllo-inositol, 1-kestose and galactinol (m/z 203.05, 527.15, 365.10
respectively) of standards and samples were normalized with respect to the area of the internal
standard. Calibration curves were calculated using the normalized areas of each standard. The
calibration curves and linear range of concentration of each standard are shown in Table 2.
Results were expressed as µg g-1 DM cocoa bean. Matrix effect for each carbohydrate was
evaluated as the average of the recovery obtained after the addition of two different amounts of
the standard to the carbohydrate extract of cocoa bean. The recovery for each amount of
standard was performed in triplicate.
The chromatographic precision of the method was measured on the basis of intra-day precision
and inter-day precision. Three different samples were selected for the determination of intra-
day precision, calculated as the average of the relative standard deviations (RSD, %) in 5
independent measurements from each sample for the concentrations of scyllo-inositol, 1-
kestose and galactinol. Inter-day precision was determined as the average of RSD of the
concentrations of scyllo-inositol, 1-kestose and galactinol of three different samples, measured
on three different days each.
The evaluation of the reproducibility of the entire method (extraction of LMWC and
chromatographic separation) was based on the average RSD values of each compound
measured on the 35 samples performed in duplicate of sample preparation.
Signal to noise ratio (S/N) of three and ten was used as criteria to determine the limit of
detection (LOD) and quantification (LOQ).

CHAPTER 5
112
Table 1. HILIC parameters: retention times (tR), peak widths (wh) and resolution (Rs) obtained under different chromatographic conditions. UT: unknown trisaccharide; UD:
unknown disaccharide. Rs calculated: myo-Inositol scyllo-Inositol; UT 1 1-Kestose; 1-Kestose UT 2; UD 2 Galactinol.
Method conditions (A % water) T
(°C)
myo-Inositol scyllo-Inositol UT 1 1-kestose UT 2 UD 2 Galactinol
0-5 min, 26%; 5-37 min 26-40%;
40
tR (min) 8.9 9.0 10.5 11.5 12.6 13.7 15.2
37-50 min 26% wh (min) 0.2 0.2 0.3 0.3 0.5 0.3 0.3
Rs 0.3 1.3 1.3 2.1
0-5 min, 24%; 5-37 min 24-40%;
40
tR (min) 10.5 10.8 12.9 14.1 15.6 16.4 18.1
37-50 min 24% wh (min) 0.3 0.2 0.3 0.3 0.5 0.4 0.3
Rs 0.6 2.0 2.1 2.3
0-5 min, 20%; 5-37 min 20-40%;
40
tR (min) 14.6 15.0 18.3 19.6 21.1 21.7 23.6
37-50 min 20% wh (min) 0.3 0.4 0.3 0.3 0.4 0.3 0.3
Rs 0.6 2.2 2.1 2.9
0-5 min, 17.5%; 5-37 min 17.5-40%,
40
tR (min) 17.1 17.6 21.3 22.6 24.0 24.6 26.3
37-50 min 17.5% wh (min) 0.3 0.3 0.3 0.3 0.5 0.3 0.3
Rs 0.8 2.4 2.3 2.8
0-5 min, 17.5%; 5-37 min 17.5-40%,
25
tR (min) 19.4 19.8 22.8 23.9 25.4 26.3 27.7
37-50 min 17.5% wh (min) 0.3 0.3 0.3 0.3 0.3 0.3 0.3
Rs 0.7 1.7 2.1 2.0
0-5 min, 17.5%; 5-37 min 17.5-40%,
55
tR (min) 15.6 16.1 20.3 21.7 22.9 23.2 25.0
37-50 min 17.5% wh (min) 0.3 0.3 0.4 0.3 0.5 0.3 0.3
Rs 0.8 2.3 2.0 3.0

RESULTS
113
Table 2. Analytical parameters of HPLC-ESI-TOF MS.
n* = number of samples analyzed. For intra-day precision, each sample was injected five times on the same day. For inter-day
precision samples were injected in three different days.
Calibration curve R2 Linear
working
range
(µg mL-1)
L.O.Q
(µg mL-1)
L.O.D
(µg mL-1)
Intra-day
Precision
(% RSD)
(n*=3)
Inter-day
Precision
(% RSD)
(n=3)
scyllo-Inositol y = 0.0157x + 0.0222 0.9859 0.50 - 40 0.50 0.17 6.61 4.83
1-Kestose y = 0.013x + 0.0125 0.9955 0.25 -25 0.25 0.08 7.53 5.43
Galactinol y = 0.0101x + 0.0086 0.9942 0.75 - 40 0.75 0.25 4.98 5.81

CHAPTER 5
114
2.6. Statistical analysis.
GraphPad Prism 7.0 software (San Diego, California, USA) was used for statistical analysis. A
one-way analysis of variance (ANOVA) followed by a Fisher test as a post hoc comparison of
means was used to determine significant differences (P < 0.05) in scyllo-inositol, 1-kestose and
galactinol content among cocoa beans collected from different countries. A t-test was applied
to evaluate the possible differences in the content of each carbohydrate per fermentation status
(unfermented versus fermented).
3. RESULTS AND DISCUSSION
3.1. Qualitative analysis of cocoa bean LMWC
As mentioned above, GC-MS was selected as a powerful tool for the characterization of LMWC
of cocoa bean extracts and therefore, complement the structural information previously reported
using HILIC-ESI-TOF MS and HILIC-ESI-MSn [22].
Different LMWC were detected, including mono-, di-, tri-, tetrasaccharides and cyclitols.
Figure 1 shows the GC-MS profile of TMSO derivatives of carbohydrates obtained from an
unfermented cocoa bean extract (see Table 3 for peak identification, experimental and literature
reported IT values for the different compounds).
The monosaccharide profile previously reported in the literature [22,26,27,28], including
fructose, glucose and galactose, was corroborated (peaks 1 to 5 in Figure 1) by the comparison
of the experimental retention times and mass spectra with the corresponding standards.
Peaks 6 and 7 (IT of 1957 and 2042, respectively) showed typical spectra of free inositols, with
a pair of characteristic ion fragments at m/z 305 and 318, which were similar to the intensity of
the pair of m/z 191 and 217 [29]. These compounds were identified as scyllo-inositol (peak 6)
and myo-inositol (peak 7). It must be pointed out that this is the first time that scyllo-inositol is
reported in cocoa beans.

RESULTS
115
Figure 1. GC–MS profile of TMSO derivatives of carbohydrates of unfermented cocoa bean extract. For peak
identifications see Table 3.
Figure 1A shows different peaks eluting in the disaccharide zone. Sucrose and melibiose, which
have been previously reported in cocoa beans [22,26] were identified (peaks 8, 18 and 20
respectively). Different peaks with mass spectra compatible with disaccharides were also
detected (see Figure 2).
Peaks 12 and 13 (IT 2691 and 2711 respectively) were identified as maltose isomers E and Z.
Peaks 9 (IT 2566) and 11 (IT 2675) showed a mass spectrum similar to sucrose, with m/z
fragments at 437 and 451. The high intensity of the m/z 217 fragment indicated the presence of
fructose as the non-reducing unit of the disaccharide [14]. Moreover, m/z fragments at 361
(characteristic of glycosidic linkages) and at 538 (characteristic of the whole oxime chain) were
also observed. Thus, these compounds were tentatively assigned as fructosyl-glucoses. Peak 10
mass spectrum showed ions at m/z 307, (characteristic of disaccharides with a reducing ketose
substituted in C1 or C3) and m/z 437 (characteristic of ketohexoses in both pyranose and
furanose forms, free and monosubstituted) which is compatible with a fructosyl-fructose [30].
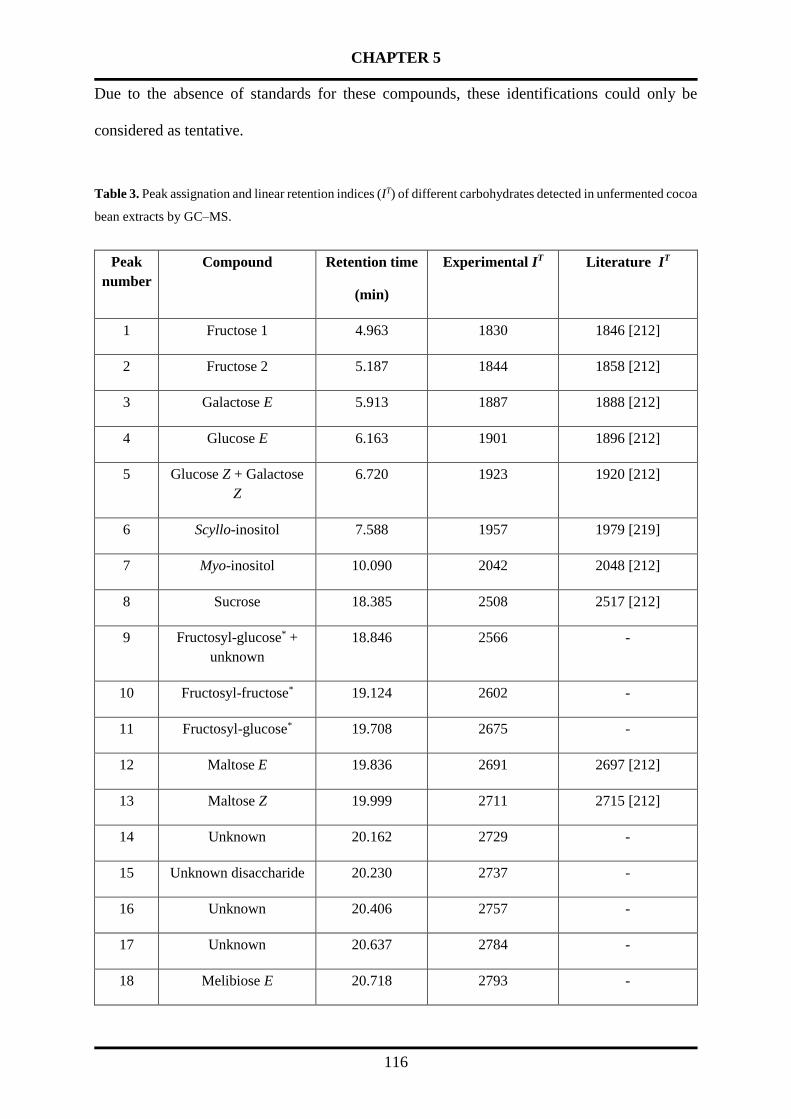
CHAPTER 5
116
Due to the absence of standards for these compounds, these identifications could only be
considered as tentative.
Table 3. Peak assignation and linear retention indices (IT) of different carbohydrates detected in unfermented cocoa
bean extracts by GC–MS.
Peak
number
Compound Retention time
(min)
Experimental IT Literature IT
1 Fructose 1 4.963 1830 1846 [212]
2 Fructose 2 5.187 1844 1858 [212]
3 Galactose E 5.913 1887 1888 [212]
4 Glucose E 6.163 1901 1896 [212]
5 Glucose Z + Galactose
Z
6.720 1923 1920 [212]
6 Scyllo-inositol 7.588 1957 1979 [219]
7 Myo-inositol 10.090 2042 2048 [212]
8 Sucrose 18.385 2508 2517 [212]
9 Fructosyl-glucose* +
unknown
18.846 2566 -
10 Fructosyl-fructose* 19.124 2602 -
11 Fructosyl-glucose* 19.708 2675 -
12 Maltose E 19.836 2691 2697 [212]
13 Maltose Z 19.999 2711 2715 [212]
14 Unknown 20.162 2729 -
15 Unknown disaccharide 20.230 2737 -
16 Unknown 20.406 2757 -
17 Unknown 20.637 2784 -
18 Melibiose E 20.718 2793 -

RESULTS
117
Peak
number
Compound Retention time
(min)
Experimental IT Literature IT
19 Galactinol 21.274 2849 2874 [212]
20 Unknown + Melibiose
Z
21.539 2875 -
21 Unknown 22.468 2958 -
22 Diglycosyl glicerol 22.766 2983 -
23 Raffinose 25.405 3166 3158[212]
24 6-Kestose 25.622 3179 3170 [92]
25 1-Kestose 25.818 3191 3198 [92]
26 Planteose 27.188 3265 3278 [92]
27 Unknown trisaccharide
(Glc-(X→X)-Glc-
(1→2)-β-Fru)
28.016 3307 -
28 Stachyose 44.843 3976 3976 [212]
* Peaks tentatively identified
Mass spectrum of peak 19 was characterized by the triplet m/z ions 191/204/217, (characteristic
of silylated pyranose rings), 305 and 318 (typical of cyclitols) and a low abundance of m/z ion
361 (related to glycosidic linkages). This fragmentation pattern has been described to be typical
of cyclitol glycosides [16]. Considering that myo-inositol was the most abundant free inositol
detected in cocoa beans, this compound could be a glycosyl-myo-inositol and it was identified
as galactinol (O- -D-galactopyranosyl-(1→3)-D-myo-inositol) by comparing its retention
time and mass spectrum with that of its standard. The presence of galactinol has been
previously described in cocoa beans by Wang et al. [31], however, this compound has been
scarcely studied in this matrix.

CHAPTER 5
118
Figure 2. Electron impact ionization mass spectra of TMSO derivatives of different unknown carbohydrates.
Peak 22 could be tentatively assigned as diglycosyl-glycerol due to the presence of specific m/z
ion at 337 [32].
The presence of raffinose family oligosaccharides (RFOs) such as raffinose (peak 23) and
stachyose (peak 28), previously reported in the literature [22,26,27], was confirmed in cocoa
bean extracts by comparison with the corresponding standards. Unknown peaks were also
detected in the trisaccharide eluting zone (Figure 1, B). Peak 25 could be identified as 1-kestose,
while peak 24 and 26 were identified as 6-kestose and planteose respectively by comparing
their IT values and spectra with data reported in the bibliography [92]. Peak 27 (IT 3307) showed
a mass spectrum similar to theanderose (-Glc-(1→6)--Glc-(1→2)-β-Fru) but with lower

RESULTS
119
retention time, thus this peak was tentatively identified as glucosyl-sucrose (Glc-(X→X)-Glc-
(1→2)-β-Fru).
Overall, although the metabolic functions of the LMWC have extensively been studied in higher
plants [33, 34], few studies can be found regarding the role of the LMWC in T. cacao.
From a nutritional point of view, the presence of inositols (scyllo-inositol and galactinol) and
fructooligosaccharides (FOS), as 1-kestose or 6-kestose in cocoa beans, is noteworthy due to
their nutraceutical properties. For example, scyllo-inositol has been reported as an inhibitor of
the amyloid plaque formation in Alzheimer disease [35], while FOS have been described as
prebiotics [36].
3.2. Quantitative analysis of cocoa bean LMWC
Once LMWC composition of unfermented cocoa beans was identified employing GC-MS, to
evaluate their potential utility as indicators of cocoa bean origin or fermentation status,
quantitative analysis of those carbohydrates scarcely studied (galactinol) or reported for the first
time in cocoa bean (scyllo-inositol and 1-kestose) were carried out using HILIC-ESI-TOF MS.
This technique does not require previous derivatization of the sample and it could be
advantageous for routine analysis. However, a previous optimization of the method was
required to avoid overlapping of the peaks.
3.2.1. Optimization of HILIC method
An unfermented cocoa bean extract and carbohydrate standards were used to optimize the
HILIC-ESI-TOF MS method. The selection of the optimal chromatographic conditions was
based on the Rs, tR and wh values determined for the sodiated molecular ion adducts of the target
compounds (see Table 1).
Different gradient conditions and column temperatures were used to evaluate the
chromatographic separation of scyllo-inositol, 1-kestose and galactinol from other interferent

CHAPTER 5
120
carbohydrates. In all the conditions, 50 min was considered as an appropriate time for the
chromatographic analysis.
The acetonitrile mobile phase content was first evaluated at a constant temperature of 40°C.
Table 1 shows the different Rs values calculated for the different chromatographic conditions
tested. As it can be observed in Table 1, the chromatographic conditions using high water
content with 0.05% ammonium hydroxide (26% in 0-5 min, 26–40% in 5-37 min and 26% in
37-50 min) resulted in the lowest resolution between myo- and scyllo-inositol, with an Rs value
of 0.25. A higher resolution between both inositols was achieved as the initial acetonitrile
content increased. The same tendency was observed for the Rs values considered for the other
compounds. Among the different chromatographic conditions tested, the best baseline
separation of the target carbohydrates was achieved under the following water gradient: 17.5%
in 0-5 min, 17.5–40% in 5-37 min and 17.5% in 37-50 min. In general, narrow peaks were
obtained for all the conditions tested (0.2-0.5 min).
The effect of the temperature (25, 40 and 55°C) was also evaluated using the gradient mentioned
above. According to Table 1, the use of higher temperatures (55°C) did not enhance the Rs and
wh values obtained at 40°C for inositols. However, decreased Rs values were observed at room
temperature (25°C). In general, no pronounced differences in the resolution values and peak
widths of the other target compounds were observed with the different temperatures. Thus,
40°C was selected as the optimum temperature to perform the chromatographic separation.
Figure 3 shows the profile of EIC corresponding to cocoa bean monosaccharides ([M+Na]+,
m/z 203.05), disaccharides ([M+Na]+, m/z 365.10) and trisaccharides ([M+Na]+, m/z 527.15) of
an unfermented cocoa bean under optimized chromatographic conditions. Under these
conditions, tR of the target carbohydrates was 17.6 min for scyllo-inositol, 22.6 min for 1-
kestose and 26.3 min for galactinol.
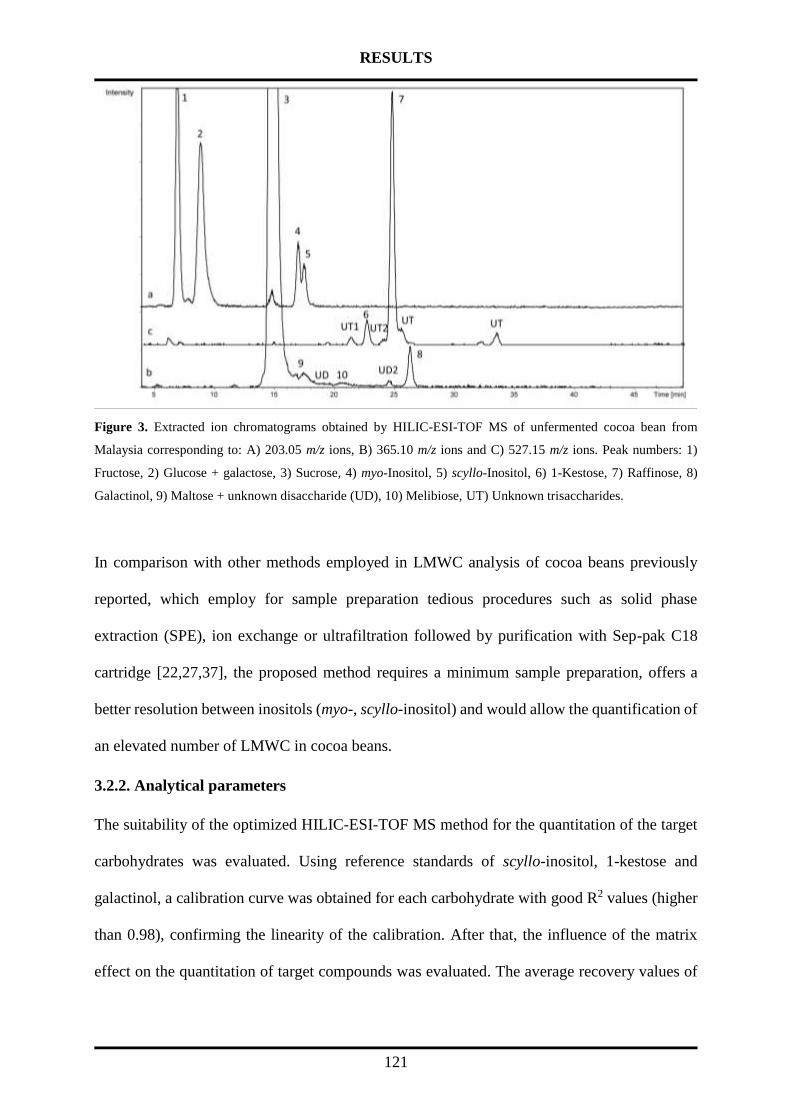
RESULTS
121
Figure 3. Extracted ion chromatograms obtained by HILIC-ESI-TOF MS of unfermented cocoa bean from
Malaysia corresponding to: A) 203.05 m/z ions, B) 365.10 m/z ions and C) 527.15 m/z ions. Peak numbers: 1)
Fructose, 2) Glucose + galactose, 3) Sucrose, 4) myo-Inositol, 5) scyllo-Inositol, 6) 1-Kestose, 7) Raffinose, 8)
Galactinol, 9) Maltose + unknown disaccharide (UD), 10) Melibiose, UT) Unknown trisaccharides.
In comparison with other methods employed in LMWC analysis of cocoa beans previously
reported, which employ for sample preparation tedious procedures such as solid phase
extraction (SPE), ion exchange or ultrafiltration followed by purification with Sep-pak C18
cartridge [22,27,37], the proposed method requires a minimum sample preparation, offers a
better resolution between inositols (myo-, scyllo-inositol) and would allow the quantification of
an elevated number of LMWC in cocoa beans.
3.2.2. Analytical parameters
The suitability of the optimized HILIC-ESI-TOF MS method for the quantitation of the target
carbohydrates was evaluated. Using reference standards of scyllo-inositol, 1-kestose and
galactinol, a calibration curve was obtained for each carbohydrate with good R2 values (higher
than 0.98), confirming the linearity of the calibration. After that, the influence of the matrix
effect on the quantitation of target compounds was evaluated. The average recovery values of

CHAPTER 5
122
105.1 %, 102.0%, 104.6 % for scyllo-inositol, 1-kestose and galactinol respectively confirmed
the absence of matrix effect.
Table 2 shows the analytical parameters of the chromatographic analytical method. The lowest
LOQ and LOD values were determined for 1-kestose (0.25 and 0.08 µg mL−1, respectively) and
the highest values were observed for galactinol (0.75 and 0.25 µg mL−1, respectively).
Regarding repeatability of the method, good values of intraday precision (range 4.98 - 7.53%)
and interday precision (range 4.83 - 5.81%) were obtained for the target carbohydrates under
study.
The reproducibility of the whole method (extraction of carbohydrates from the cocoa bean and
chromatographic separation) was evaluated based on the average RSD values of each analyte
measured on the 35 samples performed in duplicate of sample preparation. The average RSD
values for scyllo-inositol, 1-kestose and galactinol were 5.41%, 6.07%, 6.37% respectively.
These data suggested lower variability related to the extraction method and good reproducibility
of the measurements.
Overall, all parameters indicated the suitability of the proposed HILIC-ESI-TOF MS method
for the quantification of scyllo-inositol, 1-kestose and galactinol in cocoa beans.
3.3. Analysis of the content of scyllo-inositol, 1-kestose and galactinol in cocoa beans.
Table 4 shows the different values of scyllo-inositol, 1-kestose and galactinol content from 21
unfermented beans and 14 spontaneously fermented cocoa beans from five different origins.
Supplementary information (tables S2, S3 and S4) shows the individual scyllo-inositol, 1-
kestose and galactinol values of the samples analyzed.
3.3.1. scyllo-Inositol
The content of scyllo-inositol was in the range of traces - 504.9 µg g-1 cocoa DM in unfermented
and 15.5 - 491.9 µg g-1 cocoa DM in spontaneously fermented beans. The values of scyllo-

RESULTS
123
inositol determined in cocoa beans were lower in comparison to the content reported in other
food matrices, such as Apiaceae family (values close to 2 mg g-1 dry weight) [38].
In unfermented beans, one-way ANOVA test showed significant differences among bean origin
(p-value = 0.0450). Fisher test revealed significant differences in the content of scyllo-inositol
(p < 0.05) between the following pair of countries: Ecuador-Ivory Coast, Ecuador-Brazil and
Ecuador-Indonesia (individual p-values of these comparisons are shown in Figure 1S,
supplementary information). Inositols are a family of compounds crucial for development and
signalling in plants. They function mainly as either metabolic mediators or participating in
various signalling pathways in response to environmental conditions (stress, hormones, and
nutrients) through transcriptional regulation of the stimuli-responsive genes [39]. Thus, the
variability observed in unfermented beans could be attributed to the different environmental
conditions, such as soil pH in the different farming locations of the samples under study [40].
Regarding fermented cocoa beans, one-way ANOVA test identified significant differences
among countries (p = 0.0058). Fisher test revealed significant differences in the content (p <
0.05) between the following pair of countries: Ecuador-Ivory Coast, Ecuador-Brazil, Ecuador-
Indonesia, Malaysia-Ivory Coast, Malaysia-Brazil, Malaysia-Indonesia (individual p values of
these comparisons are shown in Figure 3S, supplementary information).
Figure 2S (supplementary information) shows the comparison within each country of the
scyllo-inositol concentration in the fermented and unfermented samples. Differences in the
content from Brazil samples were detected using t-test.
Further studies need to be carried out to understand the variability observed in scyllo-inositol
content according to the origin and to identify the role of scyllo-inositol during fermentation.

CHAPTER 5
124
Table 4. Mean ± standard deviation (Min-Max) values of each carbohydrate under study (scyllo-inositol, 1-kestose and galactinol) per country and status of fermentation ( U:
unfermented beans, F: fermented beans).
Country
group size
Mean ± SD (Min-Max) µg /g DM
scyllo-Inositol 1-kestose Galactinol
Unfermented Fermented Unfermented Fermented Unfermented Fermented
Ivory Coast
U*: n=6
F: n=3
54.9 ± 85.3 (tr** – 219.0) 96.4 ± 80.5 (15.5 – 176.5) 101.2 ± 19.2 (73.2 – 127.9) 54.2 ± 33.1 (16.1 – 75.7) 1014.4 ± 658.0 (361.5 – 1970.4) 0.0 ± 0.0 (0.0 – 0.0)
Indonesia
U: n=4
F: n=3
77.3 ± 56 (17.7 – 145.3) 140.6 ± 31.8 (108.2 – 171.7) 74.4 ± 41.7 (36.1 – 133.5) 48.7 ± 59.8 (tr – 115.5) 11.8 ± 3.1 (8.6 – 16.0) 0.0 ± 0.0 (0.0 – 0.0)
Malaysia
U: n=3
F: n=3
190.1 ± 57.1 (131.5 – 245.6) 381.2 ± 83.4 (303.6 – 469.4) 88.3 ± 37.9 (48.2 – 123.6) 35.0 ± 36.6 (tr – 73.1) 383.1 ± 351.9 (163.6– 789.1) 0.0 ± 0.0 (0.0 – 0.0)
Brazil
U: n=3
F: n=2
32.4 ± 16.3 (13.5 – 42.5) 77.1 ± 19.0 (63.6 – 90.5) 92.9 ± 18.3 (76.1 – 112.4) 14.9 ± 21.1 (tr – 29.9) 56.6 ± 75.1 (tr– 141.8) 0.0 ± 0.0 (0.0 – 0.0)
Ecuador
U: n=5
F: n=3
235.2 ± 175.2 (57.1 – 504.9) 338.4 ± 136.4 (231.0 – 491.9) 85.0 ± 18.9 (57.0 – 108.4) 11.0 ± 19.0 (tr– 32.9) 597.2 ± 676.5 (128.7 – 1770.1) 0.0 ± 0.0 (0.0 – 0.0)
*U: unfermented; F: fermented; **tr: traces
RESULTS
125
3.3.2. 1-Kestose
The content of 1-kestose determined in unfermented and fermented beans was in the range of
36.1 - 133.5 and traces - 115.5 µg g-1 cocoa DM respectively. These values were lower in
comparison to the content determined in other food matrices such as green and ripe fruits of
ackee, carambola and jun plum (range of 0.1 - 0.5 g/100 g dry weight) [41] or bananas from
different cultivars (values range from 297 - 1630 µg g-1 DM) [42].
One-way ANOVA analysis was not able to detect significant differences in 1-kestose content
among the different countries of origin, neither for the unfermented nor the fermented samples.
The comparison within each country of 1-kestose concentration in the pair fermented and
unfermented samples is shown in the Figure 4S (supplementary information). The t-test analysis
showed significant differences in Ivory Coast, Ecuador and Indonesia samples.
To date, the mechanism of LMWC degradation during the fermentation of cocoa beans is
unknown. The LMWC degradation could be attributed to the elevated temperatures during the
fermentation and the diminution of pH in the bean as a consequence of the production of organic
acids by the microorganisms.
3.3.3. Galactinol
The content of galactinol in unfermented beans was in the range of traces -1970.4 µg g-1 cocoa
DM. These values were in the same order of magnitude to the values described in other seeds,
e.g., lentils (0.12 % DM) [43]. No galactinol content was determined in spontaneously
fermented beans. Thus, this compound might be considered as a potential marker for the
fermentation status.
To the best of our knowledge, there are not previous studies focusing on the evaluation of
galactinol during the spontaneous fermentation of cocoa beans. As commented before, during
the fermentation process, a diminution of the pH in the beans consequence of the organic acid
production by microbial activities and the relative high temperatures (up to 50°C) could produce

CHAPTER 5
126
the degradation of some compounds present in unfermented beans, which could explain the
absence of galactinol in the fermented bean samples.
One-way ANOVA analysis did not show any significant differences per country in unfermented
beans. The wide variability observed in the content of galactinol might be attributed to the
different ripening degree of the unfermented beans collected in different origins [31].
4. CONCLUSIONS
In this study, the information reported about LMWC using GC-MS has been shown to be
complementary to the data previously reported employing HILIC-ESI-TOF MS and HILIC-
ESI-MSn. Different carbohydrates such as scyllo-inositol, 1-kestose and 6-kestose have been
reported for the first time in unfermented cocoa beans. Moreover, tentative identifications of
other minor LMWC have been proposed.
Furthermore, the optimized and validated HILIC-ESI-TOF MS method allowed the separation
and quantitation in different cocoa bean samples of scyllo-inositol, 1-kestose and galactinol,
compounds interesting for their remarkable biological functions. The content of these LMWC
in cocoa beans from different locations and different fermentation status has been reported for
the first time in this manuscript. The results showed significant differences in scyllo-inositol
content among the different origins, independently of the fermentation status of the beans. Also,
the results indicated that galactinol content seems to be related with the different fermentation
status of the bean. However, further studies with a higher number of samples or a detailed study
of the changes during the fermentation would be necessary to confirm this affirmation.
The proposed methodology has demonstrated to be highly sensitive, with minimum sample
preparation, which may be used for the quality control analysis of cocoa beans or other matrixes
containing inositols and oligosaccharides.

RESULTS
127
5. ACKNOWLEDGEMENTS
Authors would like to mention their gratitude to Sabur Badmos for proofreading of the
manuscript and Dr Gorka Ruiz de Garibay for the fruitful and valuable discussions on the
statistical analysis. Also, the authors would like to acknowledge to Anja Müller for her
assistance during the measurements of the samples as well as to Diana Sirbu and Britta
Behrends for performing the defatting process of all samples of the study.
This work was supported by Barry Callebaut (Belgium), by Ministerio de Economía, Industria
y Competitividad of Spain (project AGL2016-80475-R, AEI/FEDER, UE), by Comunidad de
Madrid (Spain) and European funding from FEDER program (S2013/ABI-3028
AVANSECAL-CM).

CHAPTER 5
128
6. BIBLIOGRAPHY
[1] J.E. Kongor, M. Hinneh, D.V. de Walle, E.O. Afoakwa, P. Boeckx, K. Dewettinck, Factors
influencing quality variation in cocoa (Theobroma cacao) bean flavour profile - a review, Food
Res. Int., 82 (2016) 44-52.
[2] A.M. Wickramasuriya, J.M. Dunwell, Cacao biotechnology: current status and future
prospects, Plant Biotechnol. J., 16 (2018) 4-17.
[3] M.A. Patras, B.P. Miley, G. Vraricken, N. Kuhnert, Identification of novel cocoa flavonoids
from raw fermented cocoa beans by HPLC-MSn, Food Res. Int., 63 (2014) 353-359.
[4] R.N. D'Souza, S. Grimbs, B. Behrends, H. Bernaert, M.S. Ullrich, N. Kuhnert, Origin-based
polyphenolic fingerprinting of Theobroma cacao in unfermented and fermented beans, Food
Res. Int., 99 (2017) 550-559.
[5] I.M.D.V. Moreira, L.D.F. Vilela, C. Santos, N. Lima, R.F. Schwan, Volatile compounds
and protein profiles analyses of fermented cocoa beans and chocolates from different hybrids
cultivated in Brazil, Food Res. Int., 109 (2018) 196-203.
[6] C.N. Quiroz-Reyes, V. Fogliano, Design cocoa processing towards healthy cocoa products:
The role of phenolics and melanoidins, J. Funct. Foods, 45 (2018) 480-490.
[7] C. Barnaba, T. Nardin, A. Pierotti, M. Malacarne, R. Larcher, Targeted and untargeted
characterisation of free and glycosylated simple phenols in cocoa beans using high resolution-
tandem mass spectrometry (Q-Orbitrap), J. Chromatogr. A, 1480 (2017) 41-49.
[8] D. Żyżelewicz, W. Krysiak, J. Oracz, D. Sosnowska, G. Budryn, E. Nebesny, The influence
of the roasting process conditions on the polyphenol content in cocoa beans, nibs and
chocolates, Food Res. Int., 89 (2016) 918-929.
[9] F. Magagna, E. Liberto, S.E. Reichenbach, Q. Tao, A. Carretta, L. Cobelli, M. Giardina, C.
Bicchi, C. Cordero, Advanced fingerprinting of high-quality cocoa: Challenges in transferring
methods from thermal to differential-flow modulated comprehensive two dimensional gas
chromatography, J. Chromatogr. A, 1536 (2017) 122-136.
[10] A. Servent, R. Boulanger, F. Davrieux, M.N. Pinot, E. Tardan, N. Forestier-Chiron, C.
Hue, Assessment of cocoa (Theobroma cacao L.) butter content and composition throughout
fermentations, Food Res. Int., 107 (2018) 675-682.
[11] R.N. D'Souza, A. Grimbs, S. Grimbs, B. Behrends, M. Corno, M.S. Ullrich, N. Kuhnert,
Degradation of cocoa proteins into oligopeptides during spontaneous fermentation of cocoa
beans, Food Res. Int., 109 (2018) 506-516.
[12] E.S. De Brito, N.H.P. García, M.I. Gallão, A.L. Cortelazzo, P.S. Fevereiro, M.R. Braga,
Structural and chemical changes in cocoa (Theobroma cacao L) during fermentation, drying
and roasting, J. Sci. Food Agric., 81 (2001) 281-288.
[13] A.I.R.-M. M.L. Sanz, N. Corzo, I. Martínez-Castro Analysis of prebiotic oligosaccharides,
in: D.C.a.R.A. Rastall (Ed.) Prebiotics and Probiotics Science and Technology, Springer, 2009,
pp. 465-534.
[14] A.I. Ruiz-Matute, M. Brokl, A.C. Soria, M.L. Sanz, I. Martínez-Castro, Gas
chromatographic-mass spectrometric characterisation of tri- and tetrasaccharides in honey,
Food Chem., 120 (2010) 637-642.
[15] L. Ruiz-Aceituno, S. Rodríguez-Sánchez, A.I. Ruiz-Matute, L. Ramos, A.C. Soria, M.L.
Sanz, Optimisation of a biotechnological procedure for selective fractionation of bioactive
inositols in edible legume extracts, J. Sci. Food Agric., 93 (2013) 2797-2803.
[16] L. Ruiz-Aceituno, C. Carrero-Carralero, A.I. Ruiz-Matute, L. Ramos, M.L. Sanz, I.
Martínez-Castro, Characterization of cyclitol glycosides by gas chromatography coupled to
mass spectrometry, J. Chromatogr. A, 1484 (2017) 58-64.

RESULTS
129
[17] S. Rodríguez-Sánchez, A.I. Ruiz-Matute, M.L. Sanz, A.C. Soria, Characterization of
trimethylsilyl ethers of iminosugars by gas chromatography-mass spectrometry, J. Chromatogr.
A, 1372 (2014) 221-227.
[18] M. Brokl, A.C. Soria, I. Martínez-Castro, M.L. Sanz, A.I. Ruiz-Matute, Characterization
of O-trimethylsilyl oximes of trisaccharides by gas chromatography-mass spectrometry, J.
Chromatogr. A, 1216 (2009) 4689-4692.
[19] A.I. Ruiz-Matute, O. Hernández-Hernández, S. Rodríguez-Sánchez, M.L. Sanz, I.
Martínez-Castro, Derivatization of carbohydrates for GC and GC-MS analyses, J. Chromatogr.
B: Anal. Technol. in the Biomed. and Life Sci., 879 (2011) 1226-1240.
[20] A. Martín-Ortiz, J. Salcedo, D. Barile, A. Bunyatratchata, F.J. Moreno, I. Martin-García,
A. Clemente, M.L. Sanz, A.I. Ruiz-Matute, Characterization of goat colostrum
oligosaccharides by nano-liquid chromatography on chip quadrupole time-of-flight mass
spectrometry and hydrophilic interaction liquid chromatography-quadrupole mass
spectrometry, J. Chromatogr. A, 1428 (2016) 143-153.
[21] S. Rodriguez-Sanchez, M.J. Garcia-Sarrio, J.E. Quintanilla-Lopez, A.C. Soria, M.L. Sanz,
Analysis of iminosugars and other low molecular weight carbohydrates in Aglaonema sp
extracts by hydrophilic interaction liquid chromatography coupled to mass spectrometry, J.
Chromatogr. A, 1423 (2015) 104-110.
[22] R. Megías-Pérez, S. Grimbs, R.N. D'Souza, H. Bernaert, N. Kuhnert, Profiling,
quantification and classification of cocoa beans based on chemometric analysis of
carbohydrates using hydrophilic interaction liquid chromatography coupled to mass
spectrometry, Food Chem., 258 (2018) 284-294.
[23] R. Megias-Perez, J. Gamboa-Santos, A.C. Soria, M. Villamiel, A. Montilla, Survey of
quality indicators in commercial dehydrated fruits, Food Chem., 150 (2014) 41-48.
[24] D. Messadi, F. Helaimia, S. Ali-Mokhnache, M. Boumahraz, Accurate determination of
retention indices in programmed temperature gas chromatography, Chromatogr., 29 (1990)
429-434.
[25] C. Carrero-Carralero, D. Mansukhani, A.I. Ruiz-Matute, I. Martínez-Castro, L. Ramos,
M.L. Sanz, Extraction and characterization of low molecular weight bioactive carbohydrates
from mung bean (Vigna radiata), Food Chem., 266 (2018) 146-154.
[26] J. Cerbulis, Carbohydrates in cacao beans .2. Sugars in Caracas cacao beans, Arch.
Biochem. Biophys., 58 (1955) 406-413.
[27] R.J. Redgwell, V. Trovato, D. Curti, Cocoa bean carbohydrates: roasting-induced changes
and polymer interactions, Food Chem., 80 (2003) 511-516.
[28] G.A. Reineccius, P.G. Kenney, T.E. Kavanagh, D.A. Andersen, Identification and
quantification of free sugars in cocoa beans J. Agric. Food Chem., 20 (1972) 199-202.
[29] S. Rodríguez-Sánchez, A.I. Ruiz-Matute, M.E. Alañón, M.S. Pérez-Coello, L.F. de Julio-
Torres, R. Morales, I. Martínez-Castro, Analysis of cyclitols in different Quercus species by
gas chromatography-mass spectrometry, J. Sci. Food Agric., 90 (2010) 1735-1738.
[30] A.I. Ruiz-Matute, M. Weiss, D. Sammataro, J. Finely, M.L. Sanz, Carbohydrate
composition of high-fructose corn syrups (HFCS) used for bee feeding: Effect on honey
composition, J. Agric. Food Chem., 58 (2010) 7317-7322.
[31] L. Wang, T. Nägele, H. Doerfler, L. Fragner, P. Chaturvedi, E. Nukarinen, A. Bellaire, W.
Huber, J. Weiszmann, D. Engelmeier, Z. Ramsak, K. Gruden, W. Weckwerth, System level
analysis of cacao seed ripening reveals a sequential interplay of primary and secondary
metabolism leading to polyphenol accumulation and preparation of stress resistance, The Plant
J.: for cell and mol. Biol., 87 (2016) 318-332.
CHAPTER 5
130
[32] A. Cardelle-Cobas, C. Martínez-Villaluenga, M.L. Sanz, A. Montilla, Gas
chromatographic-mass spectrometric analysis of galactosyl derivatives obtained by the action
of two different β-galactosidases, Food Chem., 114 (2009) 1099-1105.
[33] S. Sengupta, S. Mukherjee, P. Basak, A.L. Majumder, Significance of galactinol and
raffinose family oligosaccharide synthesis in plants, Front. Plant Sci:, 6 (2015).
[34] W. Van den Ende, Multifunctional fructans and raffinose family oligosaccharides, Front.
Plant Sci., 4 (2013).
[35] J. McLaurin, R. Golomb, A. Jurewicz, J.P. Antel, P.E. Fraser, Inositol stereoisomers
stabilize an oligomeric aggregate of alzheimer amyloid β peptide and inhibit Aβ-induced
toxicity, J. Biol. Chem. , 275 (2000) 18495-18502.
[36] D.A. Flores-Maltos, S.I. Mussatto, J.C. Contreras-Esquivel, R. Rodríguez-Herrera, J.A.
Teixeira, C.N. Aguilar, Biotechnological production and application of fructooligosaccharides,
Cri. Rev. Biotechnol., 36 (2016) 259-267.
[37] M.M. Ardhana, G.H. Fleet, The microbial ecology of cocoa bean fermentations in
Indonesia, Int. J. Food Microbiol., 86 (2003) 87-99.
[38] A.C. Soria, M.L. Sanz, M. Villamiel, Determination of minor carbohydrates in carrot
(Daucus carota L.) by GC-MS, Food Chem., 114 (2009) 758-762.
[39] R. Valluru, W. Van den Ende, Myo-inositol and beyond - Emerging networks under stress,
Plant Sci., 181 (2011) 387-400.
[40] N. Kumari, A. Grimbs, R.N. D'Souza, S.K. Verma, M. Corno, N. Kuhnert, M.S. Ullrich,
Origin and varietal based proteomic and peptidomic fingerprinting of Theobroma cacao in non-
fermented and fermented cocoa beans, Food Res. Int., 111 (2018) 137-147.
[41] N. Benkeblia, M.G. Lopez, Saccharides and fructooligosaccharides composition of green
and ripe Averrhoa carambola, Blighia sapida and Spondias dulcis fruits, Food Chem., 176
(2015) 314-318.
[42] R.G. Der Agopian, C.A. Soares, E. Purgatto, B.R. Cordenunsi, F.M. Lajolo, Identification
of fructooligosaccharides in different banana cultivars, J. Agric. Food Chem., 56 (2008) 3305-
3310.
[43] B. Quemener, J.M. Brillouet, Ciceritol, a pinitol digalactoside form seeds of chickpea,
lentil and white lupin, Phytochem., 22 (1983) 1745-1751.
RESULTS
131
Chapter 6. Monitoring the changes of low molecular weight carbohydrates in
cocoa beans during spontaneous fermentation: a chemometric and kinetic
approach
Roberto Megias-Perez, Mauricio Moreno-Zambrano, Britta Behrends, Marcello Corno,
Nikolai Kuhnert
Manuscript under revision in Food Chemistry (retrieved 08/05/2019)

CHAPTER 6
132
ABSTRACT
The spontaneous fermentation process of cocoa beans is considered the crucial step in the
formation of typical coca aroma precursors. In this manuscript, we have utilized a
chromatographic method, HILIC-ESI-TOF MS, to monitor the low molecular weight
carbohydrates (LMWC) changes and acquire absolute quantitative data of the main LMWC
from five different types of cocoa beans from different origins during spontaneous
fermentation. A sequential degradation of tetra-, tri- and disaccharides and an increase of the
monosaccharide concentration was determined during spontaneous fermentation.
The chemometric evaluation considering the LMWC data (quantities and areas), pH values, dry
matter content and total lipid values indicated that no significant changes had accurred during
the first 48 hours.
The results from the kinetic evaluation of the main LMWC offered useful information (reaction
order, the different rates (kobs) and half-life values (t1/2)) that enable an ample and better
understanding of the mechanism behind spontaneous fermentation of cocoa beans.
Keywords: cocoa beans, spontaneous fermentation, carbohydrates, chemometrics, kinetics

RESULTS
133
1. INTRODUCTION.
The production of chocolate constitutes a multi-step process involving different processing
steps including fermentation, drying, roasting, conching and tempering. The sensorial
properties of cocoa beans are in part related to the genotype of the cocoa tree (Theobroma cacao
L.) yielding cocoa beans [1]. However, the spontaneous fermentation is the crucial step yielding
aroma precursors, subsequently transformed to active aroma volatiles during roasting [2].
Spontaneous fermentation is induced by the microbiota naturally present in the environment of
the producing cocoa country. This procedure represents the most common type of fermentation
used globally despite recent advances in cocoa fermentation induced by controlled starter
cultures. The diversity of the microbiota according to the location has been previously
addressed [3]. During the spontaneous fermentation, a series of microorganisms, such as yeast,
lactic and acetic acid bacteria proliferate in the carbohydrate-rich pulp surrounding the
unfermented cocoa bean [4]. Primary fermentation metabolites produced by the microbial
activity (mainly ethanol, lactic and acetic acid) diffuse into the bean, causing a decrease in the
pH value, structural changes inside the cotyledon and different reactions both enzymatic and
chemical. As a consequence of these conditions, the death of the cocoa bean embryo occurs [5].
The duration of the spontaneous fermentation ranges between five to six days, longer
fermentation time has been suggested to facilitate the proliferation of spore-forming bacteria
and filamentous fungi producing metabolites with negative influence in the flavour of the beans,
and therefore, in their quality [3].
Among the different metabolic reactions occurring in this complex matrix [6] during the
fermentation, it is worth mentioning the gradual degradation of proteins to oligopeptides [7],
the degradation of anthocyanins [8] and procyanidins [9, 10] and the increase in bioactive amine
content, as spermidine [11]. However, the changes in the low molecular weight carbohydrates
(LMWC) during fermentation have been scarcely studied, monitoring mainly the changes in

CHAPTER 6
134
fructose, glucose and sucrose concentrations during fermentation [12]. Recently our group has
developed analytical approaches based on hydrophilic interaction liquid chromatography and
gas chromatography coupled to mass spectrometry (HILIC-MS and GC-MS) aiming to identify
the LMWC profile and quantify monosaccharides (fructose, glucose), disaccharides (sucrose,
melibiose, maltose), polyols (mannitol, myo-inositol, scyllo-inositol, galactinol) and
oligosaccharides ( raffinose, 1-kestose, stachyose). Those studies have revealed differences in
the LMWC profile comparing unfermented and fermented cocoa beans [13].
The study of the LMWC during the spontaneous fermentation of cocoa beans is considered
scientifically relevant due to the significant reactions of LMWC with amino acids and peptides
in Maillard reactions yielding Amadori compounds [7], compounds precursor of volatile
compounds via Strecker reaction.
Also, the study of the LMWC changes might contribute to a better understanding of the
biochemical reactions occurring during the fermentation of cocoa beans. To the best of the
author's knowledge, no studies focusing on a comprehensive characterization of the changes in
each LMWC during the spontaneous fermentation has been reported.
Based on the points above mentioned, this study has been aimed to investigate the LMWC
changes during the spontaneous fermentation of cocoa beans. To achieve this goal, five
spontaneous fermentations collected in different geographical origins have been evaluated
using a chemometric and kinetic approach.
2. MATERIALS AND METHODS
2.1. Chemicals and standards.
Dichloromethane and LC-MS grade acetonitrile (ACN) were provided by Aplichem Panreac
(Darmstadt, Germany). Ammonium hydroxide solutions, fructose, glucose, melibiose, myo-
inositol, sucrose, raffinose, stachyose, Asp-Phe methyl ester (internal standard), were supplied

RESULTS
135
by Sigma Chemical Co. (St. Louis, USA). scyllo-Inositol, 1-kestose and galactinol were
obtained from Carbosynth (Compton, UK).
2.2. Cocoa bean samples
Cocoa beans at different fermentation points from five different cocoa hybrid trees and origins
(G11UTA402XT413 from Ivory Coast, Comum from Brazil, German from Cameroon, EET
103 from Ecuador and PBC 159 from Malaysia) were analyzed. The samples were collected at
24-hour intervals during fermentation. The duration of the spontaneous fermentation ranged
between 120 h and 168 h, according to the techniques used at each origin. After sample
collection, these were frozen at − 20 °C and shipped to Jacobs University Bremen (Germany)
on dry ice. Further storage was done at − 20 °C. Table 1S shows the characteristics (time points
and hybrid) of the different samples under study.
2.3. Determination of DM and pH
Cocoa beans were de-shelled manually using a mechanical grinder Retsch (Haan, Germany).
Dry matter (DM) content was calculated as the difference in weight before and after heating 2
g of cocoa powder at 105 °C for 20 hours. The LMWC analysis was performed using cocoa
beans defatted according to the method described by D’Souza et al. [9].
The pH measurement of the bean was performed on the supernatant obtained after vortexing 1
g of cocoa with 9 mL of Milli-Q for 2 min and posterior centrifugation at 4400 rpm for 5 min.
2.4. LMWC extraction
LMWC were extracted from 150 mg of defatted cocoa powder following the protocol described
by Megías-Pérez, Grimbs, D'Souza, Bernaert and Kuhnert [13]. Briefly, the extraction method
comprised two steps. In a first step, the LMWC were extracted at room temperature with 2 mL
of Milli-Q water under constant stirring for 20 min followed by the addition of absolute ethanol
(8 mL) with continuous stirring for 10 min. After that, the samples were centrifuged at 4400
rpm for 5 min. The second step consisted of extraction for 10 min of the precipitates with 10

CHAPTER 6
136
mL of 80% ethanol under the same conditions. The supernatants from the two extraction steps
were mixed. All samples were prepared in duplicate.
1 mL of the sample was filtered through a CHROMAFIL Xtra PTFE-45/25 filter (Macherey-
Nagel, (Macherey Nagel, Düren, Germany ) and 10 µL of an internal standard solution of 1 mg
mL-1 of Asp-Phe methyl ester were added.
2.5. HILIC-ESI-TOF MS analysis.
An Agilent 1100 Series HPLC (Agilent Technologies, Karlsruhe, Germany) was used to
perform the chromatographic analysis. A BEH X-Bridge column, with a trifunctionally-bonded
amide phase (Waters Company, USA) was chosen to perform the chromatographic analysis.
Column characteristics were as follows: 150 mm × 3.0 mm; 3.5 μm particle size and 135 Å
pore size. Water (solvent A) and acetonitrile (solvent B) with 0.05% ammonium hydroxide
were used as mobile phase. Injection volume was set to 3 µL and a flow rate of 0.4 mL min-1
was used.
The identification of the molecular formula of the compounds and the quantitative analysis was
performed using a microTOF mass spectrometer fitted with an ESI ion source (Bruker Daltonics
HCT Ultra, Bremen, Germany) operating in positive ion mode in the range of 50-1200 m/z.
Sodium formate 0.1 M was injected before starting the sequence run to perform internal
calibration of the instrument. A posterior calibration was also performed by injecting sodium
formate solution automatically through a six-port valve prior to each chromatographic run. The
ESI source parameters were adjusted as follows: spray voltage, 4.5 kV; drying gas (N2, 99.5%
purity); temperature = 220 °C; drying gas flow, 12 L min-1; nebulizer (N2, 99.5% purity)
pressure, 1.6 bar. HyStar 3.2 software was used for data acquisition (Bruker, Bremen,
Germany).
Regarding quantitation of the different target LMWC, the area of the Extract Ion Chromatogram
(EIC) of the sodium adduct [M + Na]+ from the different standards and target compounds was

RESULTS
137
normalized with respect to the area of the internal standard. The normalized area was used to
calculate the different calibration curves. The total carbohydrate content was determined as the
sum of the quantities of the different LMWC under study. The percentual variation in the
content of each LMWC was determined between the value of the last point of the fermentation
and the value determined for unfermented cocoa beans.
All measurements were performed in duplicate of sample preparation. The average RSD
determined for each analyte in all samples was considered to evaluate the reproducibility of the
entire method (extraction of the carbohydrates and chromatographic separation).
Chromatographic parameters (calibration curves, the Pearson coefficient, the range of linearity,
precision) and matrix effect evaluation for scyllo-inositol, 1-kestose and galactinol were
previously reported (chapter 5). Calibration curve, Pearson coefficient and range of linearity
are shown in Table S1.
2.6. Data analysis, chemometric evaluation and determination of kinetic parameters.
Quant Analysis software (Bruker, Bremen, Germany) was used to extract the area values of the
different LMWC.
LMWC quantities, average area values normalized with respect to the area of internal standard
of the unknown LMWC, pH value and dry matter content from the different cocoa bean samples
under study were subjected to chemometric evaluation. As these variables have different units,
a previous step of auto-escalation (transformation into z-scores, calculated as z = x – median /
SD) was performed to standardize the statistical relevance of all variables [14].
Data of the transformed variables (n = 28) from each sample (n = 35) were arranged in a matrix
with the samples in the columns and variables in the rows. This matrix was used to perform
principal component analysis ( PCA) analysis using the tool Metaboanalyst 4.0 [15].
The process of cocoa bean fermentation is a spontaneous process where the lack of controlled
conditions might influence the LMWC composition. For instance, the effect of mass and turning

CHAPTER 6
138
time has been reported previouslz to affect the concentration of several compounds during
fermentation [16]. In this manuscript, to reduce errors associated with both different physical
and microbial factor that depend on the origin of the samples, the determination of kinetic orders
and their corresponding parameters was performed using linear mixed modellin. This model
asssumes that the slopes of the lineariyed forms of the reaction zero-, first- and second-order
equations (Eq 1 to 3 respectively) are common for each LMWC regardless of its origin.
Eq (1) C = C0 – kobst
Eq (2) C = C0 exp(-kobst)
Eq (3) 1/C - 1/C0= kobst
In this equations, t is the fermentation time (h); C0 and C are the LMWC content of each
carbohydrate (mg/g dry matter) at time zero and at time t, respectively; kobs is the rate constant.
Linear mix model is a method based on the assumption that random errors occur additively at
two levels; in each experiment and for each substance independently [17]. Also, the Akaike
information criterion (AIC) values were determined. AIC is a tool used for model selection
which is based on the relative quality of a set of statistical models [18].
Linear mixed model and correlation analyses were performed using R software version 3.4.2.
For the linear mixed model, package “nlme” version 3.7-137 was used.
The half-life values (t1/2) of each the LMWC were determined according to the following
equations:
Eq (4) t1/2 = C0/ 2kobs Zero order
Eq (5) t1/2 = ln2/ kobs First order
Eq (6) t1/2 = 1/ C0kobs Second order
The value of C0 used for equations 4 and 6 was the average concentration of the compound in
unfermented cocoa beans. In the case of mannitol, compound which was absent in unfermented
beans, the value of C0 was considered as the average of the values at 24 hours.

RESULTS
139
3. RESULTS AND DISCUSSION
3.1. Monitoring the changes in the LMWC content during spontaneous fermentation.
A total of five spontaneous fermentation were investigated. The different fermentations were
conducted in five different origin countries over a period ranging from five to seven days. These
origin countries cover the different world areas of cocoa production and thus, capturing possible
differences in microbiota among locations.
Carbohydrates included for quantitative analysis were selected based on their previously
reported identification in cocoa beans [13]. The suitability of the chromatographic method
employed for quantitation purpose has been previously addressed for scyllo-inositol, 1-kestose
and galactinol. Table 1S shows the different chromatographic parameters (calibration curves,
Pearson coefficient and linearity range) for the rest of compounds. The data suggest the
suitability of the method employed to quantify the concentration of each LMWC during the
spontaneous fermentation.
A gradually decreasing trend was determined for sucrose and oligosaccharide concentration in
all fermentations, with a percentual average decrease percentage related to unfermented cocoa
bean content of 95% for sucrose, 94 % for raffinose, 90% for 1-kestose and 81% for stachyose
(see Figure 1). The trend observed for sucrose was in line with the data reported previously by
Hashim, Selamat, Muhammad and Ali [16]. The degradation observed for sucrose has been
putatively attributed mainly to the presence of endogenous invertase in the cotyledon of the
cocoa bean [20]. However, data reported by Hansen, Del Olmo and Burri [21] showed null
enzymatic activity of this invertase after 48 hours of fermentation. Thus, another additional
mechanism for this degradation, such as the influence of other glycosidases or conditions of
low pH and elevated temperatures [22] should not be discarded.
The data shown for melibiose do not allow establishing any reproducible trend due to the low
content of this LMWC. For example, the fermentation processes from Brazil and Ivory Coast

CHAPTER 6
140
showed an oscillating decreasing trend while for the rest of the fermentation process this trend
was increasing.
Regarding monosaccharides, an increasing trend was observed for fructose and coeluting
glucose/galactose content in all fermentations, with a percentual average increase of 69% and
97% respectively (see Figure 1).
The data did not show a clear trend in the behaviour of polyols during fermentation. Mannitol,
previously described as an indicator of fermentated beans [13] showed, in general, an increasing
trend from 24 hours until the end of the fermentation, except for the spontaneous fermentation
process from Ivory Coast, which showed an oscillating behaviour. The cause of the increasing
trend observed for mannitol remains still unclear. The trend might be attributed to the diffusion
of this metabolite, produced by the microorganisms [23], from the pulp to the bean or the
reduction of fructose in acid conditions and elevated temperatures.
A different trend was observable for galactinol, myo-inositol and scyllo-inositol. Galactinol
concentration decreased until it disappeared between the range of 48-96 hours after
fermentation start. Also, a decrease in concentration was observed for myo-inositol and scyllo-
inositol (average diminution of 4% and 22% respectively).
Additionally, a sum parameter adding up all experimental LMWC concentrations was
determined, revealing an average decrease of 54% at the end of fermentation. This trend is in
line with the data reported elsewhere [24].

RESULTS
141
Figure 1. Graphical representation of the LMWC content in cocoa beans with respect to the time (hours) of the different fermentation process under study.

CHAPTER 6
142
3.2. Contextual data changes in lipid content, pH and dry matter
The values of lipid content, pH and dry matter of all samples are shown in Table 2S
(supplementary information). The composition of lipids in unfermented cocoa beans were in
the range of 33.5-40.8%. At the end of the fermentation, the lipid content was in the range of
33.2 - 37.4%.
The pH determined in unfermented cocoa beans was in the range of 6.5 - 6.8. In all cases, during
the fermentation, the pH dropped to values in the range of 4.3-5.2.
The dry matter content during the spontaneous fermentation decreased slightly from
unfermented cocoa beans (range 65.7-68.4%) to the end of fermentation (range 56.9-60.2%).
3.3. Chemometric approach
The data collected from carbohydrates (average quantities and areas of unknown
carbohydrates), lipids, dry matter and pH were subjected to PCA to unravel key chemical
differences during the time-resolved points in the spontaneous fermentation process of cocoa
beans.
Figure 2. PCA score (left) and loading plot (right) from LMWC profile data, dry matter content, pH values and
lipid content.

RESULTS
143
Figure 2 shows the score and loading plots obtained. In PC1, according to the score plots, a
resolution of samples is observed according to the fermentation time, being located the
fermentation starting point on the left and ending point on the right. The individual time series
from each fermentation are connected by different coloured lines. Mainly, the distribution on
PC1 could be considered to demark a separation among cocoa samples fermented up to 48 hours
(located in positive PC1 values) and samples fermented longer than 96 hours (located in
negative PC1 values). Cocoa samples fermented for 72 hours were distributed around the 0
value in PC1. The information obtained from this distribution can be interpreted as the absence
of significant changes in the LMWC profile and pH during the first 48 hours of the spontaneous
fermentation. The time interval ranging from 48 hours to 96 hours could be considered as the
period in which the fermentation process produces significant changes in the LMWC profile.
In all cases, after 96 hours, the changes produced in the LMWC and pH were notably
significant. This interpretation was in line with the information previously reported for proteins,
where the proteolysis process became evident after 72 hours and concerned peptides
particularly with higher molecular weight ( >15 kDa) [25].
On the other hand, the distribution observed on PC2 reflects the country of origin (score plot of
19%) indicating, for example, a clear separation of the Ecuador and Ivory Coast cocoa samples
from the rest of the samples under study.
The loading plots evidence the influence of different variables to characterize samples
fermented during a period lowest of 48 hours and highest of 96 hours. According to the figure
2, different variables such as carbohydrates (di-, tri-, tetrasaccharides and pentosyl-
iminosugars), DM content, pH value and lipid content could be used to characterize samples
fermented during a period shorter than 48 hours. Also, other variables such as monosaccharides,
mannitol and glycosyliminosugars could be used to describe cocoa beans fermented during a
period longer than 96 hours.

CHAPTER 6
144
3.4. Kinetic approach
Different mechanisms responsible for the LMWC changes during fermentation were tentatively
investigated in this study. Three pathways could describe the LMWC changes reported. The
first pathway could be an enzymatic mechanism, as an example, the enzymatic hydrolysis of
oligosaccharides by glycosidases. A second pathway of the changes described could be purely
chemical hydrolysis catalyzed by the acidic primary fermentation products such as lactic and
acetic acid. The last pathway that requires consideration is the reaction of reducing
carbohydrates with free amino groups from amino acids and oligopeptides to yield Amadori
compounds via Maillard reaction.
In this context zero order kinetic reactions might correspond to reactions catalyzed by a low
concentration of Michaelis-Menten enzymes. Reactions of acid hydrolysis might follow a first-
order kinetic model, although an enzymatic mechanism catalyzed by enzymes following a first-
order kinetic model should not be discarded. Maillard reactions might follow a second-order
kinetic model.
The determination of the relation between pH and LMWC content, as well as the reaction order,
rate constant and half-time value of the LMWC changes will allow distinguishing the diverse
possible mechanisms.
3.4.1. Pearson correlation between pH and LMWC content.
Previous studies have shown the influence of pH in the hydrolysis of model oligosaccharides
[26]. According to this information, a Pearson correlation analysis between the values of pH
and the LMWC content in each stage of the five spontaneous fermentation processes under
study was performed. The values of the Pearson Coefficient Correlation and the p-values are
shown in Table 1.

RESULTS
145
Table 1. Pearson coefficient values determined between the LMWC determined and the pH values
Compound Pearson’s Coefficient p-value
Fructose -0.4 0.01131329
Glucose -0.6 0.00012526
Mannitol -0.4 0.02450085
myo-Inositol -0.2 0.36140542
scyllo-Inositol -0.1 0.50267047
Sucrose 0.6 0.00008333
Melibiose -0.5 0.00571380
Galactinol 0.6 0.00003903
1-kestose 0.6 0.00002951
Raffinose 0.8 0.00000000
Stachyose 0.7 0.00000047
Total 0.4 0.01414849
The degradation of myo-inositol and scyllo-inositol and the formation of mannitol were not
correlated with the values of pH (Table 1). The degradation of galactinol during the spontaneous
fermentation showed a correlation with the pH values (PCC = 0.62, p-value< 0.005).
Except for melibiose, the rest of di-, tri-, tetrasaccharides showed a correlation with the pH
values. It is worth mentioning the strong correlation determined between the content of
raffinose and stachyose with the pH values (PCC = 0.83 and 0.74, p-value < 0.005 respectively).
Regarding the monosaccharide content, fructose showed a weak negative correlation with the
pH values. However, a considerable negative correlation was observed between the increment
of the glucose+galactose content and the drop in pH values during the spontaneous fermentation
(PCC = -0.61, p-val< 0.005). This negative correlation might be tentatively attributed to the
increased monosaccharide content, consequence of putative hydrolysis of disaccharides and
oligosaccharides observed during the fermentation.
During the spontaneous fermentation, the total carbohydrate content, calculated as the sum of
all LMWC, showed a weak correlation with respect to the drop in pH values (PCC= 0.41, p-
value = 0.01). This weak correlation might be attributed to the fact that this parameter is the
sum of the different LMWC considered, showing each compound different reaction patterns.

CHAPTER 6
146
3.4.2. Reaction order.
The different r2 and AIC values of the fitted data to the zero, first and second kinetic models
are shown in Table 2. According to Akaike [18], minimum AIC values allow the best choice of
the fit in a set of data.
The reactivity of polyols during fermentation followed different kinetic orders. Mannitol, a
compound tentatively formed during the fermentation, showed similar values of r2 for the tested
orders. However, the AIC indicated that the formation of mannitol might follow a zero order
kinetic. The data showed for scyllo-inositol degradation an evident zero order kinetic. In the
case of myo-inositol, the values of r2 for zero and first kinetic order were similar (0.74 and 0.76
for zero and first order kinetic respectively). However, the negative AIC values indicated a
better fitting of the data to an equation of zero-order kinetic. Regarding galactinol, the data
indicated a first-order kinetic to describe the degradation of this compound.
Table 2. Different r2 and AIC values determined for the fitting of the different LMWC data to the corresponding
equations of the different reaction order.
Compound
Order 0 Order 1 Order 2
R2 AIC R2 AIC R2 AIC
Fructose 0.38 127.23 0.30 77.88 0.13 59.79
Glucose 0.40 146.08 0.44 79.12 0.36 44.23
Mannitol 0.66 73.77 0.71 112.57 0.47 298.03
myo-Inositol 0.74 -12.07 0.76 29.34 0.76 81.80
scyllo-Inositol 0.73 -76.78 0.70 53.73 0.55 210.57
Sucrose 0.65 164.29 0.68 104.55 0.19 217.30
Melibiose 0.40 -93.28 0.28 128.89 0.06 528.03
Galactinol 0.38 3.61 0.75 78.31 0.46 414.00
1-kestose 0.63 -61.08 0.55 80.98 0.42 270.26
Raffinose 0.72 81.03 0.80 78.27 0.29 223.14
Stachyose 0.82 66.52 0.78 44.07 0.52 76.82
Total 0.75 202.32 0.73 40.88 0.54 -82.85
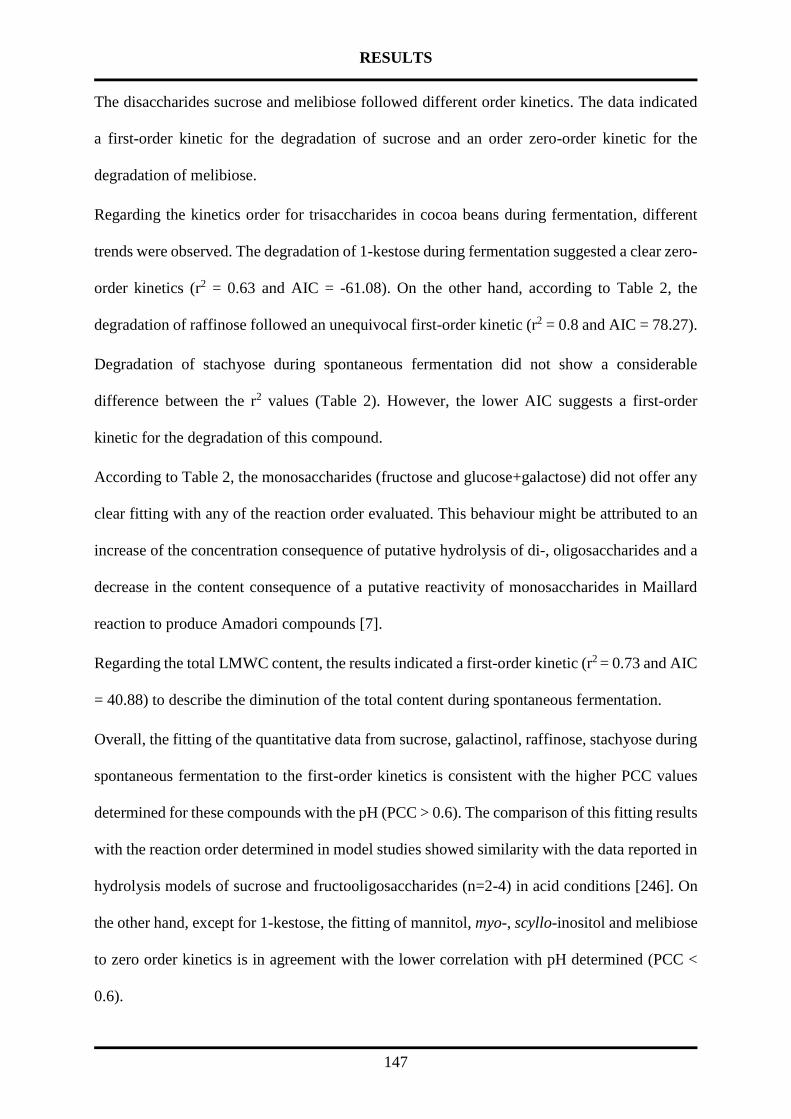
RESULTS
147
The disaccharides sucrose and melibiose followed different order kinetics. The data indicated
a first-order kinetic for the degradation of sucrose and an order zero-order kinetic for the
degradation of melibiose.
Regarding the kinetics order for trisaccharides in cocoa beans during fermentation, different
trends were observed. The degradation of 1-kestose during fermentation suggested a clear zero-
order kinetics (r2 = 0.63 and AIC = -61.08). On the other hand, according to Table 2, the
degradation of raffinose followed an unequivocal first-order kinetic (r2 = 0.8 and AIC = 78.27).
Degradation of stachyose during spontaneous fermentation did not show a considerable
difference between the r2 values (Table 2). However, the lower AIC suggests a first-order
kinetic for the degradation of this compound.
According to Table 2, the monosaccharides (fructose and glucose+galactose) did not offer any
clear fitting with any of the reaction order evaluated. This behaviour might be attributed to an
increase of the concentration consequence of putative hydrolysis of di-, oligosaccharides and a
decrease in the content consequence of a putative reactivity of monosaccharides in Maillard
reaction to produce Amadori compounds [7].
Regarding the total LMWC content, the results indicated a first-order kinetic (r2 = 0.73 and AIC
= 40.88) to describe the diminution of the total content during spontaneous fermentation.
Overall, the fitting of the quantitative data from sucrose, galactinol, raffinose, stachyose during
spontaneous fermentation to the first-order kinetics is consistent with the higher PCC values
determined for these compounds with the pH (PCC > 0.6). The comparison of this fitting results
with the reaction order determined in model studies showed similarity with the data reported in
hydrolysis models of sucrose and fructooligosaccharides (n=2-4) in acid conditions [246]. On
the other hand, except for 1-kestose, the fitting of mannitol, myo-, scyllo-inositol and melibiose
to zero order kinetics is in agreement with the lower correlation with pH determined (PCC <
0.6).

CHAPTER 6
148
3.4.3. Rate constant and half-time value.
Table 3 lists the rate constant (kobs) and half-life values (t1/2) determined for each of the
compounds. The t1/2 were calculated according to the best fitting order reaction determined
previously. As the compounds fructose and glucose+galactose did not follow any of the reaction
order evaluated, the parameters kobs and t1/2 were not determined for these compounds.
Regarding kobs and t1/2 of polyols in cocoa beans during fermentation, myo- and scyllo-Inositol
showed the lowest kobs (2.2 ± 4.1 and 1.2 ± 1.6 mg/ h respectively) and highest t1/2 values
(1260.1 and 688 h respectively ) of all the compounds. These results suggest a low reactivity of
these carbohydrates during the spontaneous fermentation. Conversely, galactinol showed the
highest kobs value (565.6 h-1) and the lowest t1/2 (12.2 h) of all compounds under study. In the
case of mannitol, this compound showed the highest kobs and lowest t1/2 of all compounds
assigned as zero order reaction.
The values of kobs and t1/2 determined for sucrose and raffinose were similar. In the case of
stachyose, the kobs and t1/2 values were lower and higher respect to the above compounds. Values
of raffinose and stachyose were similar to the values reported in a model system of sucrose
hydrolysis at pH 4 and temperature of 80 °C [22].
In the case of melibiose, lower kobs and high t1/2 values were determined in comparison to the
degradation of sucrose, raffinose and stachyose or the values determined for disaccharides in
hydrolysis models determined by L'Homme, Arbelot, Puigserver and Biagini [22].
Regarding 1-kestose, the lower values of kobs and higher t1/2 determined might indicate a
different degradation pathway to the mechanism of sucrose, raffinose and stachyose.
Regarding total LMWC content, the results from Table 3 showed a kobs of 59.9 ± 9.5 h-1 and a
t1/2 of 115 h, indicating that the content of LMWC decreases to a half-content after 4.8 days of
fermentation. Except for myo-and scyllo-inositol, all experimental t1/2 values are in the range of
the total fermentation time.
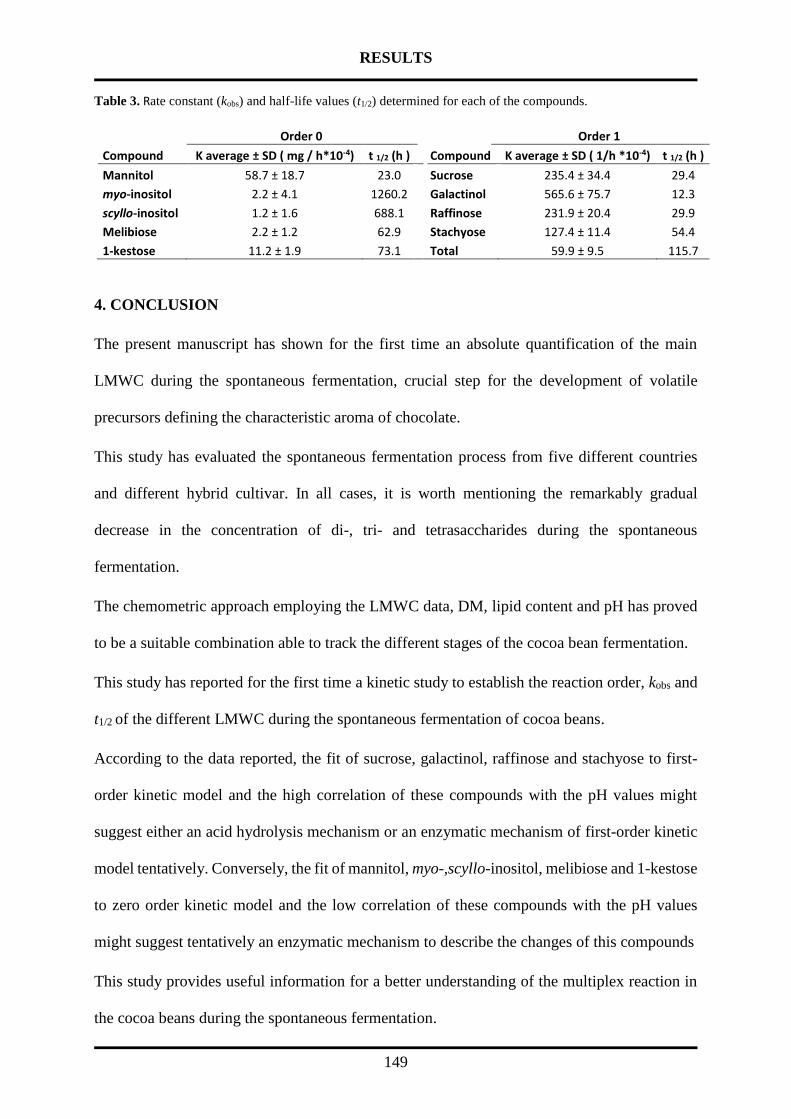
RESULTS
149
Table 3. Rate constant (kobs) and half-life values (t1/2) determined for each of the compounds.
Compound
Order 0 Order 1
K average ± SD ( mg / h*10-4) t 1/2 (h ) Compound K average ± SD ( 1/h *10-4) t 1/2 (h )
Mannitol 58.7 ± 18.7 23.0 Sucrose 235.4 ± 34.4 29.4
myo-inositol 2.2 ± 4.1 1260.2 Galactinol 565.6 ± 75.7 12.3
scyllo-inositol 1.2 ± 1.6 688.1 Raffinose 231.9 ± 20.4 29.9
Melibiose 2.2 ± 1.2 62.9 Stachyose 127.4 ± 11.4 54.4
1-kestose 11.2 ± 1.9 73.1 Total 59.9 ± 9.5 115.7
4. CONCLUSION
The present manuscript has shown for the first time an absolute quantification of the main
LMWC during the spontaneous fermentation, crucial step for the development of volatile
precursors defining the characteristic aroma of chocolate.
This study has evaluated the spontaneous fermentation process from five different countries
and different hybrid cultivar. In all cases, it is worth mentioning the remarkably gradual
decrease in the concentration of di-, tri- and tetrasaccharides during the spontaneous
fermentation.
The chemometric approach employing the LMWC data, DM, lipid content and pH has proved
to be a suitable combination able to track the different stages of the cocoa bean fermentation.
This study has reported for the first time a kinetic study to establish the reaction order, kobs and
t1/2 of the different LMWC during the spontaneous fermentation of cocoa beans.
According to the data reported, the fit of sucrose, galactinol, raffinose and stachyose to first-
order kinetic model and the high correlation of these compounds with the pH values might
suggest either an acid hydrolysis mechanism or an enzymatic mechanism of first-order kinetic
model tentatively. Conversely, the fit of mannitol, myo-,scyllo-inositol, melibiose and 1-kestose
to zero order kinetic model and the low correlation of these compounds with the pH values
might suggest tentatively an enzymatic mechanism to describe the changes of this compounds
This study provides useful information for a better understanding of the multiplex reaction in
the cocoa beans during the spontaneous fermentation.

CHAPTER 6
150
5. ACKNOWLEDGEMENTS
The authors would like to mention their gratitude towards Mrs Anja Müller for her assistance
during the measurements of the samples.
This work was conducted in the framework of the COMETA Project, which is financially
supported by Barry Callebaut AG.

RESULTS
151
6. BIBLIOGRAPHY
[1] J.E. Kongor, M. Hinneh, D.V. de Walle, E.O. Afoakwa, P. Boeckx, K. Dewettinck, Factors
influencing quality variation in cocoa (Theobroma cacao) bean flavour profile - a review, Food
Res. Int., 82 (2016) 44-52.
[2] F. Frauendorfer, P. Schieberle, Identification of the key aroma compounds in cocoa powder
based on molecular sensory correlations, J. Agric. Food Chem., 54 (2006) 5521-5529.
[3] R.F. Schwan, A.E. Wheals, The microbiology of cocoa fermentation and its role in chocolate
quality, Crit. Rev. Food Sci. Nutr., 44 (2004) 205-221.
[4] G.V.M. Pereira, M.G.C.P. Miguel, C.L. Ramos, R.F. Schwan, Microbiological and
physicochemical characterization of small-scale cocoa fermentations and screening of yeast and
bacterial strains to develop a defined starter culture, Applied and Environmental Microbiology,
78 (2012) 5395-5405.
[5] G.A. Leal Jr, L.H. Gomes, P. Efraim, F.C. De Almeida Tavares, A. Figueira, Fermentation
of cacao (Theobroma cacao L.) seeds with a hybrid Kluyveromyces marxianus strain improved
product quality attributes, FEMS Yeast Research, 8 (2008) 788-798.
[6] B.P. Milev, M.A. Patras, T. Dittmar, G. Vrancken, N. Kuhnert, Fourier transform ion
cyclotron resonance mass spectrometrical analysis of raw fermented cocoa beans of Cameroon
and Ivory Coast origin, Food Res. Int., 64 (2014) 958-961.
[7] R.N. D'Souza, A. Grimbs, S. Grimbs, B. Behrends, M. Corno, M.S. Ullrich, N. Kuhnert,
Degradation of cocoa proteins into oligopeptides during spontaneous fermentation of cocoa
beans, Food Res. Int., 109 (2018) 506-516.
[8] C. De Taeye, V.J. Eyamo Evina, G. Caullet, N. Niemenak, S. Collin, Fate of Anthocyanins
through Cocoa Fermentation. Emergence of New Polyphenolic Dimers, J. Agric. Food Chem.,
64 (2016) 8876-8885.
[9] R.N. D'Souza, S. Grimbs, B. Behrends, H. Bernaert, M.S. Ullrich, N. Kuhnert, Origin-based
polyphenolic fingerprinting of Theobroma cacao in unfermented and fermented beans, Food
Res. Int., 99 (2017) 550-559.
[10] C. De Taeye, G. Caullet, V.J. Eyamo Evina, S. Collin, Procyanidin A2 and Its Degradation
Products in Raw, Fermented, and Roasted Cocoa, J. Agric. Food Chem., 65 (2017) 1715-1723.
[11] B.d.N. do Carmo Brito, R. Campos Chisté, R. da Silva Pena, M.B. Abreu Gloria, A. Santos
Lopes, Bioactive amines and phenolic compounds in cocoa beans are affected by fermentation,
Food Chem., 228 (2017) 484-490.
[12] T. Lefeber, W. Gobert, G. Vrancken, N. Camu, L. De Vuyst, Dynamics and species
diversity of communities of lactic acid bacteria and acetic acid bacteria during spontaneous
cocoa bean fermentation in vessels, Food Microbiology, 28 (2011) 457-464.
[13] R. Megías-Pérez, S. Grimbs, R.N. D'Souza, H. Bernaert, N. Kuhnert, Profiling,
quantification and classification of cocoa beans based on chemometric analysis of
carbohydrates using hydrophilic interaction liquid chromatography coupled to mass
spectrometry, Food Chem., 258 (2018) 284-294.
[14] G. Fan, T. Beta, Discrimination of geographical origin of Napirira bean (Phaseolus vulgaris
L.) based on phenolic profiles and antioxidant activity, Journal of Food Composition and
Analysis, 62 (2017) 217-222.
[15] J. Chong, O. Soufan, C. Li, I. Caraus, S. Li, G. Bourque, D.S. Wishart, J. Xia,
MetaboAnalyst 4.0: Towards more transparent and integrative metabolomics analysis, Nucleic
Acids Research, 46 (2018) W486-W494.

CHAPTER 6
152
[16] P. Hashim, J. Selamat, S.K.S. Muhammad, A. Ali, Effect of mass and turning time on free
amino acid, peptide-N, sugar and pyrazine concentration during cocoa fermentation, J. Sci.
Food Agric., 78 (1998) 543-550.
[17] A. Safron, M. Strandell, A. Kierkegaard, M. Macleod, Rate constants and activation
energies for gas-phase reactions of three cyclic volatile methyl siloxanes with the hydroxyl
radical, International Journal of Chemical Kinetics, 47 (2015) 420-428.
[18] H. Akaike, A New Look at the Statistical Model Identification, IEEE Transactions on
Automatic Control, 19 (1974) 716-723.
[19] P. Hashim, J. Selamat, S.K.S. Muhammad, A. Ali, Changes in free amino acid, peptide-N,
sugar and pyrazine concentration during cocoa fermentation, J. Sci. Food Agric., 78 (1998)
535-542.
[20] M. Hinneh, E. Semanhyia, D. Van de Walle, A. De Winne, D.A. Tzompa-Sosa, G.L.L.
Scalone, B. De Meulenaer, K. Messens, J. Van Durme, E.O. Afoakwa, L. De Cooman, K.
Dewettinck, Assessing the influence of pod storage on sugar and free amino acid profiles and
the implications on some Maillard reaction related flavor volatiles in Forastero cocoa beans,
Food Res. Int., 111 (2018) 607-620.
[21] C.E. Hansen, M. Del Olmo, C. Burri, Enzyme activities in cocoa beans during
fermentation, J. Sci. Food Agric., 77 (1998) 273-281.
[22] C. L'Homme, M. Arbelot, A. Puigserver, A. Biagini, Kinetics of hydrolysis of
fructooligosaccharides in mineral-buffered aqueous solutions: Influence of pH and temperature,
J. Agric. Food Chem., 51 (2003) 224-228.
[23] T. Lefeber, M. Janssens, F. Moens, W. Gobert, L. De Vuyst, Interesting starter culture
strains for controlled cocoa bean fermentation revealed by simulated cocoa pulp fermentations
of cocoa-specific lactic acid bacteria, Applied and Environmental Microbiology, 77 (2011)
6694-6698.
[24] E.O. Afoakwa, J. Quao, A.S. Budu, J. Takrama, F.K. Saalia, Effect of pulp preconditioning
on acidification, proteolysis, sugars and free fatty acids concentration during fermentation of
cocoa (Theobroma cacao) beans, International Journal of Food Sciences and Nutrition, 62
(2011) 755-764.
[25] N. Kumari, K.J. Kofi, S. Grimbs, R.N. D'Souza, N. Kuhnert, G. Vrancken, M.S. Ullrich,
Biochemical fate of vicilin storage protein during fermentation and drying of cocoa beans, Food
Res. Int., 90 (2016) 53-65.
[26] A. Matusek, P. Merész, T.K.D. Le, F. Örsi, Effect of temperature and pH on the
degradation of fructo-oligosaccharides, European Food Research and Technology, 228 (2009)
355-365.

153
Part 2 – LMWC in commercial green tea and kale
(chapters 7 and 8)

RESULTS
155
Chapter 7. Characterization of commercial green tea leaves by the analysis of low
molecular weight carbohydrates and other quality indicators.
Roberto Megías-Pérez , Anastasiia Shevchuk, Yeweynwuha Zemedie, Nikolai Kuhnert
Manuscript published in Food Chemistry Volume 290, 30 August 2019, Pages 159-167
https://doi.org/10.1016/j.foodchem.2019.03.069

CHAPTER 7
156
ABSTRACT
A comprehensive characterization of commercial green tea (CGT) with the employment of
independent variables such as low molecular weight carbohydrates (LMWC), soluble solids,
color and antioxidant capacity has been performed in this manuscript.
Within the manuscript, a convenient HILIC-MS method, suitable to perform a simultaneous
identification and quantification of all mono-, di-, oligosaccharides and cyclitols observed in
green tea was introduced. The method covers all key analytes in a single chromatographic
analysis.
Fifty-six samples from different origins (n = 10) were evaluated to explore differences based on
origin. In addition, commercial samples processed by pan-firing and steaming were used for
comparative purposes, allowing the identification of putative processing markers.
The results obtained contribute to gain a better knowledge of the variations, according to origin
and processing, in composition and quality of CGT, commodity widely appreciated by the
consumers.
keywords: green tea, HILIC-ESI-TOF MS, carbohydrates, quality parameters, multivariate
statistical analysis.

RESULTS
157
1. INTRODUCTION
Commercial green tea (CGT), the processed leaves of Camellia sinensis (L.) O. Kuntze, is a
commodity with growth prospects of 7.1 per cent annually, expected to reach 750,981 tons by
the year 2023. This projection highlights the economic relevance of this product for tea-
producing countries [1].
The interest of consumers for this commodity might be attributed to the several health beneficial
effects associated with a regular consumption, such as protection against cancer, cardiovascular
diseases, oral health, regulation of body weight and improvement of cognitive performance
[2,3]. Different plant secondary metabolites as caffeine, theanine and catechins, have been
identified to be involved in the diverse health-promoting effects reported [3].
The production of commercial green tea (CGT) starts with the step of plucking green tea leaves
from the plant, followed by withering. Withering involves spreading the tea leaves over bamboo
mats or other surfaces for a short period of time (between 1 and 3 h), with a consequent average
moisture loss of 30% [4]. Thereafter, the fixing step is carried out to inhibit the polyphenol
oxidase (PPO) and peroxidase (POD) enzymes, involved in the formation of black tea [5].
Although there is no universal specific procedure in the tea industry, pan-firing and steaming
are the most standard fixing processes employed. Both processes produce on average a 40%
moisture loss in a short period of time (10–15 min), but, differ in the temperature applied [5].
In the pan-firing process, commonly employed in the Chinese and South Korean tea industry,
heat is applied through a warm and dry pan exposed to a high-temperature source of about
180 °C. In the steaming process, commonly employed in the Japanese tea industry, heat is
applied through water steam (Ahmed and Stepp, 2013, Xu and Chen, 2002). The manufacturing
of CGT is completed with the rolling and drying steps to inhibit the microbial growth and thus
increase the shelf life of the product [4,5].

CHAPTER 7
158
The quality of CGT is determined through different sensory properties such as color, taste and
aroma. However, other parameters, such as leaf size, soluble solids, antioxidant capacity and
caffeine content, have been proposed to evaluate the green tea quality [6,7]. Mainly, the
parameters proposed to evaluate green tea quality are related to its chemical composition. Green
tea chemical composition is affected by the tea leaf processing and by other factors such as
botanical variety (Sinensis, Assamica), climate, season and development degree of the leaf [5].
On average, the estimated chemical composition of green tea in terms of dry weight (DW) is
30% phenolic compounds, 26% fibre, 15% proteins, 7% carbohydrates, 7% lipids, 5% minerals,
4% free amino acids, 2% pigments and 4% of other compounds such as organic acids or caffeine
[2].
Regarding the low molecular weight carbohydrates (LMWC), scarce information has been
reported. Data on LMWC can contribute to a better understanding of the chemical composition,
reinforcing the perception that consumers have about green tea as a health-promoting beverage.
In addition, for the industry, LMWC knowledge could mainly contribute to the identification
of tea quality markers and the elucidation of the chemical reactions taking place during the
processing of green tea leaves into commercial black tea [8].
In terms of composition, few studies using a limited number of samples have reported the
identification and quantification of common LMWC such as fructose, glucose, sucrose and
maltose [9-11]. Moreover, the presence of α-galactooligosaccharides (α-GOS) such as
raffinose and stachyose has been reported. These compounds are well-known for their prebiotic
properties [12,13]. Also, different cyclitols such as 2-O-(β-l-arabinopyranosyl)-myo-inositol,
galactinol and myo-inositol have been reported in green tea. Some of these compounds have
medical uses, for example, myo-inositol is known for its use in infertility and mental disorder
treatments [14,15].

RESULTS
159
In terms of tea quality, the compound 2-O-(β-l-arabinopyranosyl)-myo-inositol has been
described as an indicator of high-quality in Chinese teas elaborated from young tea shoots, a
part of the plant considered to produce teas with high quality [16]. On the other hand, the
LMWC content has a role in the sensory perception, contributing to the green tea sweetness
[17].
Based on the relevance of the information provided by LMWC, the determination of LMWC is
scientifically justified. The analytical methodologies most commonly employed to analyze
LMWC in CGT are liquid chromatography (LC), gas chromatography (GC) and Nuclear
Magnetic Resonance (1H NMR) [16].
Previous studies on CGT dealing with the characterization of commercial samples or the
evaluation of the processing conditions have employed highly dependent parameters, such as
the combination of chemical parameters (polyphenol profile) and quality indicators (antioxidant
capacity) [18,19]. These approaches provide limited information in terms of characterization,
since the changes produced in one parameter directly affect the dependent parameters.
Consequently, this manuscript reports an approach to characterize commercial green tea
through the analysis of different parameters including LMWC, color, soluble solids and
antioxidant capacity. With respect to previous studies on characterization of CGT, this approach
has the novelty of the employment of independent parameters. In addition, this approach
provides in-depth knowledge of LMWC from CGT, information not previously addressed
exhaustively in scientific literature.
While the methods for the analysis of soluble solids, color and antioxidant capacity are
techniques routinely employed, the different methods previously reported for LMWC analysis
present as limitation not to offer a simultaneous identification and quantification within the
same chromatographic analysis for all mono-, di-, oligosaccharides and cyclitols described in
tea. This manuscript introduces a convenient chromatographic method employing hydrophilic

CHAPTER 7
160
interaction liquid chromatography coupled to mass spectrometry (HILIC-MS) to solve this
limitation. The selection of HILIC is based on the absence of tedious sample preparation,
appropriate resolution, good peak shapes and easy coupling to MS detectors.
This approach has been applied to an extensive set of samples (n = 56) from different origins
corresponding to the main tea producing countries (n = 10). This selection of samples aims to
explore possible differences in function of the origin. For comparative purposes, commercial
samples processed by pan-firing and steaming were used, allowing the identification of putative
markers of processing.
2. MATERIAL AND METHODS
2.1. Chemicals
LC–MS grade acetonitrile (ACN) was purchased at AppliChem Panreac (Darmstadt,
Germany). Ammonium hydroxide solutions, Asp-Phe methyl ester (used as internal standard in
HILIC-ESI-TOF MS analysis), fructose, glucose, sucrose, maltose, myo-inositol, sucrose,
raffinose, stachyose, gallic acid (GA), iron oxide hexahydrate, 2,4,6-Tris(2-pyridyl)-s-triazine
(TPTZ), 6-Hydroxy-2,5,7,8-tetramethylchroman-2-carboxylic acid (Trolox) were acquired
from Sigma Chemical Co. (St. Louis, USA). Galactinol was provided by Carbosynth (Compton,
UK). Mannitol was kindly donated by Bermpohl Apotheke (Bremen, Germany).
2.2. Tea samples
The different CGT samples (n = 56) were certified according to the origin using the information
provided in the label of the product purchased from different tea distribution companies, local
supermarket chains from Germany (Bremen and Cologne), Sri Lanka, Iran, Portugal and
factories in the countries of origin (South Korea). In all cases, the selection of the samples was
performed avoiding CGT blended with aromas.

RESULTS
161
The origin of the CGT samples was as follows: Japan (n = 8), South Korea (n = 7), Iran (n = 6),
Nepal (n = 5), Sri Lanka (n = 6), China (n = 8) and Portugal (n = 3) and India (n = 13), covering
the different origins of the main tea-producing countries. Samples from India were further
classified into the three producing regions: Assam (n = 4), Darjeeling (n = 3) and South India
(n = 6). Samples from Portugal (n = 3) were fixed by steaming and most samples from South
Korea (n = 6) by pan-firing, according to the information provided by the manufacturers.
The particle size of the samples was determined manually with a standard metric ruler.
2.3. Extraction of LMWC and sample preparation
One gram of CGT was subjected to extraction with 100 mL of deionized water at a temperature
of 95 °C under constant stirring for 10 min [20]. Afterwards, 1.5 mL of the water extract was
collected and the rest was used for the analysis of quality indicators.
For LMWC analysis, the sample was subjected to two additional extractions with deionized
water. The water extract collected in each extraction were pooled.
For quality indicators, the collected water extract was filtered through a Whatman 45 paper
filter (Omnilab, Bremen, Germany). Unless otherwise specified, all the determinations of the
different quality indicators were performed in less than 6 h after the extraction.
2.4. Analysis of LMWC using HILIC-ESI-TOF MS and HILIC-ESI-MSn
Two mL of the pooled water extract was filtered through a nylon filter (pore size of 0.45 μm)
(Macherey-Nagel, Düren, Germany). For chromatographic analyses, 10 µL of internal standard
(solution of 1 mg mL−1 of Asp-Phe methyl ester) was added to one mL of the filtered sample.
The chromatographic analyses were performed using an Agilent 1100 Series HPLC (Agilent
Technologies, Karlsruhe, Germany). The column employed was a BEH X-Bridge amide
column (Waters Company, USA), with a trifunctionally-bonded amide phase
(150 mm × 3.0 mm; 3.5 μm particle size and 135 Å pore size). The composition of the mobile
phase was water (solvent A) and acetonitrile (solvent B), both solvents with ammonium

CHAPTER 7
162
hydroxide (0.1% v/v). The elution gradient was: 22% A in 0–5 min. 22–40% A in 5–30 min
followed by a re-equilibration of 13 min using the initial solvent composition. The analyses
were carried out at a constant temperature of 30 °C using a flow rate of 0.4 mL min−1. Injection
volume was set to 3 µL.
A microTOF mass spectrometer fitted with an ESI ion source (Bruker Daltonics HCT Ultra,
Bremen, Germany) operating in positive ion mode (range of 50–1200 m/z) was used to perform
the identification of the molecular formula and the quantitative analysis of target analytes.
Internal calibration of the mass spectrometer was carried out before starting the sequence run
by injection of 0.1 M sodium formate solution. Additionally, sodium formate solution was
injected automatically through a six-port valve prior to each chromatographic run to perform a
posterior calibration. The ESI source parameters were adjusted according to the conditions
published elsewhere [21]. Data acquisition was performed using HyStar 3.2 software (Bruker,
Bremen, Germany).
The presence of LMWC was corroborated using an Ion trap mass spectrometer fitted with an
ESI source (HCT Ultra, Bruker Daltonics, Bremen, Germany) (HILIC-ESI-MSn) operating in
positive targeted ion mode (range of 50–1200 m/z). The ESI parameters were adjusted
according to the conditions published previously [22]. Data acquisition was performed using
Agilent ChemStation software (Agilent, Karlsruhe, Germany).
Calibration curves were determined using the normalized area of the Extracted Ion
Chromatogram (EIC) from the different standards with respect to the area of the internal
standard. Signal to noise ratio (S/N) values of three and ten were used as criteria to establish
the limit of detection (LOD) and quantification (LOQ). Quantities of 2-O-(β-l-
arabinopyranosyl)-myo-inositol were determined using the calibration curve from galactinol.
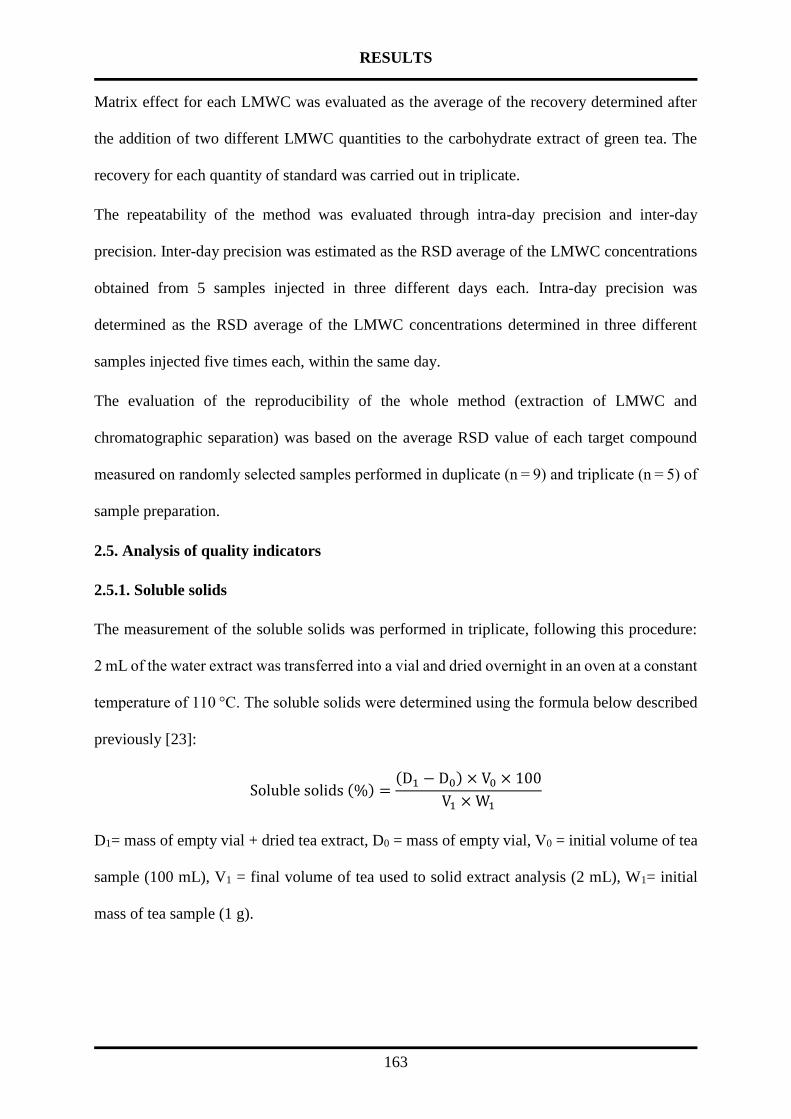
RESULTS
163
Matrix effect for each LMWC was evaluated as the average of the recovery determined after
the addition of two different LMWC quantities to the carbohydrate extract of green tea. The
recovery for each quantity of standard was carried out in triplicate.
The repeatability of the method was evaluated through intra-day precision and inter-day
precision. Inter-day precision was estimated as the RSD average of the LMWC concentrations
obtained from 5 samples injected in three different days each. Intra-day precision was
determined as the RSD average of the LMWC concentrations determined in three different
samples injected five times each, within the same day.
The evaluation of the reproducibility of the whole method (extraction of LMWC and
chromatographic separation) was based on the average RSD value of each target compound
measured on randomly selected samples performed in duplicate (n = 9) and triplicate (n = 5) of
sample preparation.
2.5. Analysis of quality indicators
2.5.1. Soluble solids
The measurement of the soluble solids was performed in triplicate, following this procedure:
2 mL of the water extract was transferred into a vial and dried overnight in an oven at a constant
temperature of 110 °C. The soluble solids were determined using the formula below described
previously [23]:
Soluble solids (%) =(D1 − D0) × V0 × 100
V1 × W1
D1= mass of empty vial + dried tea extract, D0 = mass of empty vial, V0 = initial volume of tea
sample (100 mL), V1 = final volume of tea used to solid extract analysis (2 mL), W1= initial
mass of tea sample (1 g).

CHAPTER 7
164
2.5.2. Analysis of color
The measurements of the color parameters L*, a* and b* were performed in duplicate. The
colorimeter employed was a Konica Minolta CM-3500d colorimeter (Liechtenstein, Germany)
calibrated with specific black and white color reference. These measurements were carried out
using Illuminant D65 and 10° observer angle. A volume of 10 mL of the water extract was used
for the measurements.
The L*, a* and b* parameters represent the lightness (0 = black, 100 = white), the redness ((−)
green to (+) red) and the yellowness ((−) blue to (+) yellow) respectively. The color parameters
chromaticity (C*), saturation (S*) and hue angle (H°) were determined as follows:
C* = (a*2 + b*2)0.5, S* (S* = C*/L*) [24] and (H° = arc tan (b*/a*) + 180°) [25].
2.5.3. Analysis of antioxidant capacity
The method employed is an adaptation of the method reported by Benzie and Strain [26]. FRAP
reagent was prepared by mixing 5 mL of TPTZ solution (10 mM in 40 mM HCl), 5 mL of
aqueous FeCl3·6H2O solution (20 mM) and 40 mL of 0.5 N acetate buffer (pH = 3.6).
Stock standards of Trolox (1.25 mg/ mL) and GA (0.5 mg/ mL) were prepared in 70% methanol.
Different dilutions of the stock standards with H2O were carried out to obtain standards in a
range of 0 – 0.25 mg/mL. The water extract was diluted with H2O in a ratio 1:5 for the
measurement.
FRAP reagent (200 µL) was added to 10 μL of the diluted water extracts and standards into a
96-well plate. Reactions were incubated in the dark for 10 min and absorbance was measured
at 593 nm on a 96-well Biochrom EZ Read 2000 microplate reader (Cambridge, UK). Each
measurement was performed at least in duplicate. Antioxidant capacity was expressed in terms
of gallic acid equivalent (GAE) (g GAE/g tea) and Trolox equivalent (TE) (g TE/g tea).

RESULTS
165
2.6. Data analysis and statistics
Peak area values of the different LMWC were extracted using Quant Analysis software (Bruker,
Bremen, Germany).
Kruskal Wallis test followed by Benjamin Hochberg post hoc test was performed using
GraphPad Prism 7.0 software (San Diego, California, USA).
Values of the LMWC content, color parameters, antioxidant capacity and soluble solids from
the 56 commercial samples under study were subjected to chemometric evaluation. The
variables were auto-scaled (transformation into z-scores, z = x − median/SD) to standardize the
statistical importance of all variables [27].
Hierarchical cluster analysis (HCA) (linkage: Ward’s method, distance measure: Pearson) and
principal component analysis (PCA) were performed using Metaboanalyst 4.0 [28].
3. RESULTS AND DISCUSSION
3.1. Analysis of LMWC using HILIC-ESI-TOF MS and HILIC-ESI-MSn
A standard chromatographic method previously reported [21] was used to identify the main
LMWC described previously in tea (fructose, glucose, myo-inositol, sucrose, maltose,
galactinol, raffinose and stachyose). The identification of the target LMWC was performed
using the high-resolution mass data of the sodium adduct, the retention time (tR) and tandem
MS fragmentation data of the different peaks compared to their corresponding commercial
standards. The mass error detected was below 5 ppm.
Other uncommon LMWC were also identified. The first compound identified was 2-O-(β-l-
arabinopyranosyl)-myo-inositol (tR = 16.5 min, m/z 335.0958) a compound previously reported
by Sakata, Yamauchi, Yagi, and Ina (1987) [29], identified as a quality indicator of tea [16] and
related to early stages of tea leaf development [30]. The fragmentation of this compound, with

CHAPTER 7
166
a molecular formula of C11H20O10Na, showed a base peak of m/z 203, corresponding to the
neutral loss of 132 Da (pentosyl group). Fig. 1S (supplementary information) shows the HILIC-
ESI-MS2 spectra of this compound in positive ion mode.
The second compound identified (tR = 18.4 min, m/z 335.0951) showed a molecular formula of
C11H20O10Na. The fragmentation of this compound was not achieved due to the low peak
intensity. Based on the similarity in tR and molecular formula with respect to the aforementioned
compound, this peak was tentatively identified as unknown inositol with a structure similar to
2-O-(β-l-arabinopyranosyl)-myo-inositol.
The last compound (tR = 7.3 min, m/z 205.068, molecular formula C6H14O6Na) was positively
identified as mannitol considering the retention time and the fragmentation pattern of the
corresponding standard.
After the identification, different gradient conditions were evaluated to reduce the time for each
chromatographic analysis. Among the different conditions evaluated, the chromatographic
conditions mentioned in section 2.5 (22% A in 0 – 5 min; 22 – 40% A in 5 – 30 min and 22%
A in 30–43 min) were considered suitable based on an adequate chromatographic separation of
the different LMWC within the first 30 min and the narrow peaks observed (peak width at half
height (wh) of the different peaks was in the range of 0.2–0.5 min). Fig. 1 shows the EICs of
the different LMWC identified under the optimized conditions of HILIC-ESI-TOF MS.
3.1.2. Analytical parameters of HILIC-ESI-TOF MS
Analytical parameters of the chromatographic method are shown in Table 1. The different
calibration curves obtained using reference standards showed satisfactory R2 values (higher
than 0.99), confirming the linearity of the calibration curves.
The recovery data obtained from the evaluation of the matrix effect for each LMWC under
study were in the range of 92.7–103.7%, suggesting the absence of matrix effect on the
quantitation of LMWC in CGT.

RESULTS
167
Figure 1. Extracted ion chromatograms (m/z 203, 205, 335, 365, 527 and 689) obtained using HILIC-ESI-TOF MS of commercial green tea. Peak
numbers: 1) Fructose, 2), Glucose, 3) Sucrose, 4) Maltose 5) myo-Inositol, 6) 2-O-(β-L-arabinopyranosyl)-myo-inositol, 7) Unknown inositol, 8)
Raffinose, 9) Galactinol, 10) Stachyose
5.0 7.5 10.0 12.5 15.0 17.5 20.0 22.5 25.0 27.5 Time [min]
Intens.
11
10
9
1
3
2
4
5
6
7
8
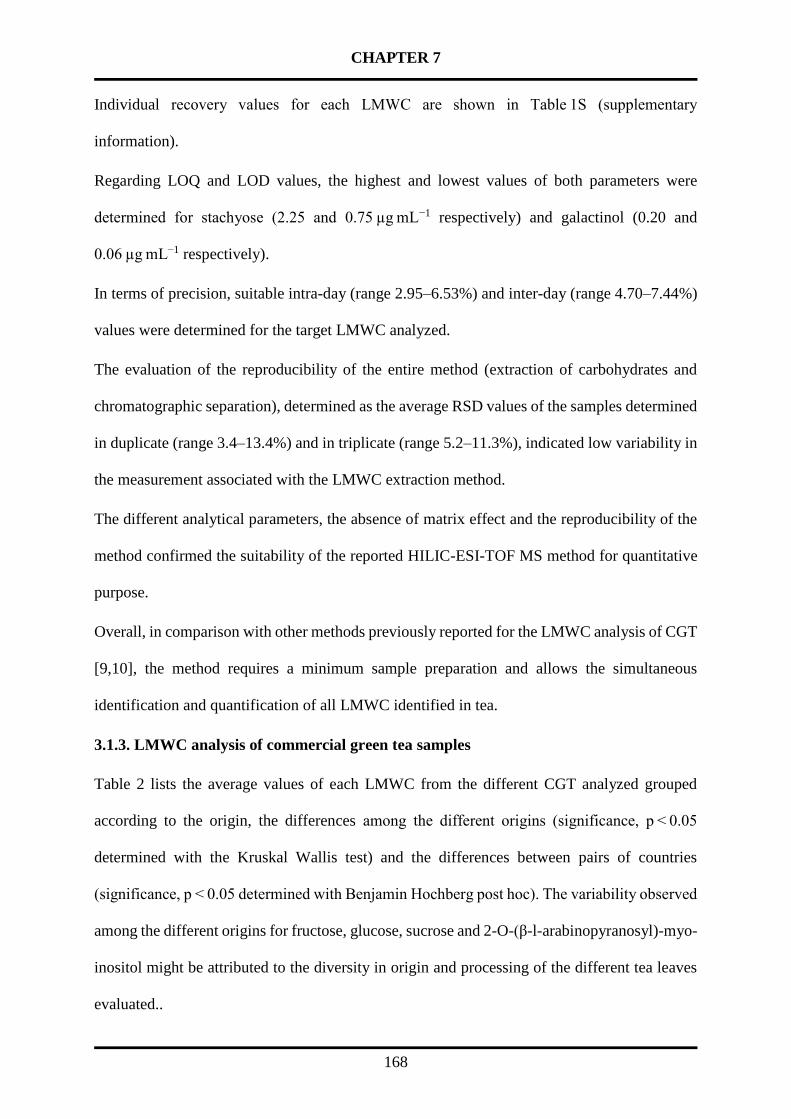
CHAPTER 7
168
Individual recovery values for each LMWC are shown in Table 1S (supplementary
information).
Regarding LOQ and LOD values, the highest and lowest values of both parameters were
determined for stachyose (2.25 and 0.75 µg mL−1 respectively) and galactinol (0.20 and
0.06 µg mL−1 respectively).
In terms of precision, suitable intra-day (range 2.95–6.53%) and inter-day (range 4.70–7.44%)
values were determined for the target LMWC analyzed.
The evaluation of the reproducibility of the entire method (extraction of carbohydrates and
chromatographic separation), determined as the average RSD values of the samples determined
in duplicate (range 3.4–13.4%) and in triplicate (range 5.2–11.3%), indicated low variability in
the measurement associated with the LMWC extraction method.
The different analytical parameters, the absence of matrix effect and the reproducibility of the
method confirmed the suitability of the reported HILIC-ESI-TOF MS method for quantitative
purpose.
Overall, in comparison with other methods previously reported for the LMWC analysis of CGT
[9,10], the method requires a minimum sample preparation and allows the simultaneous
identification and quantification of all LMWC identified in tea.
3.1.3. LMWC analysis of commercial green tea samples
Table 2 lists the average values of each LMWC from the different CGT analyzed grouped
according to the origin, the differences among the different origins (significance, p < 0.05
determined with the Kruskal Wallis test) and the differences between pairs of countries
(significance, p < 0.05 determined with Benjamin Hochberg post hoc). The variability observed
among the different origins for fructose, glucose, sucrose and 2-O-(β-l-arabinopyranosyl)-myo-
inositol might be attributed to the diversity in origin and processing of the different tea leaves
evaluated..
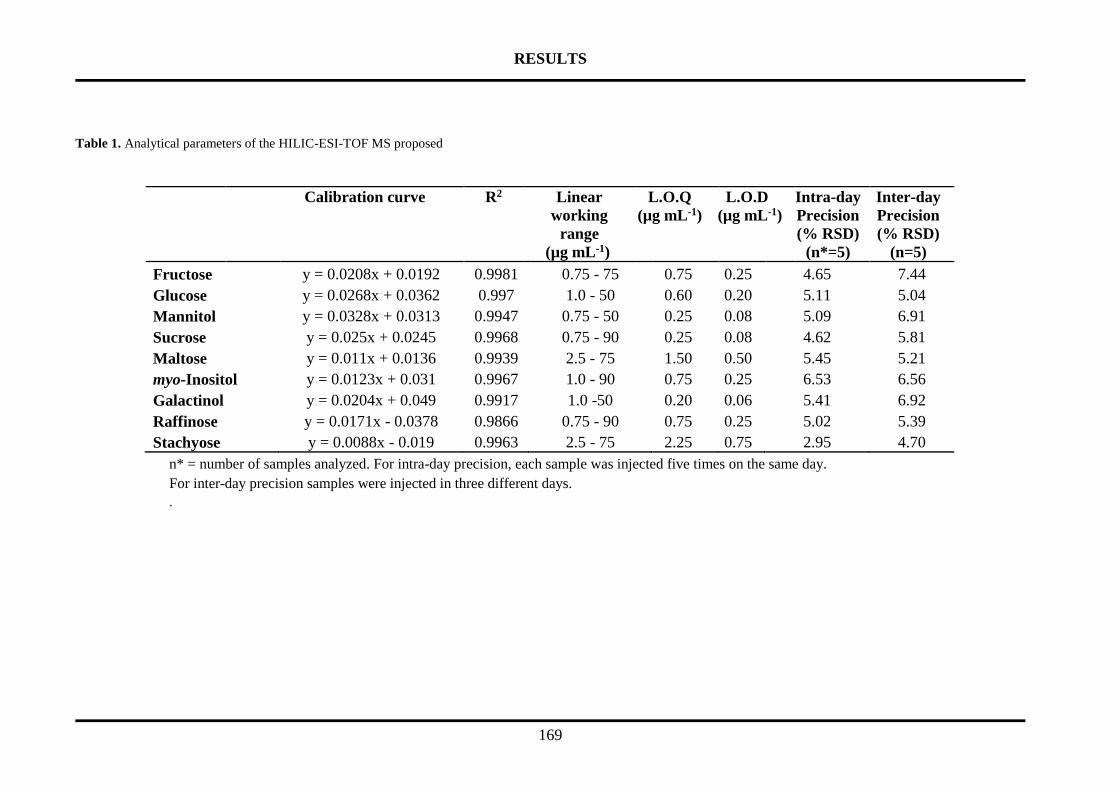
RESULTS
169
Table 1. Analytical parameters of the HILIC-ESI-TOF MS proposed
n* = number of samples analyzed. For intra-day precision, each sample was injected five times on the same day.
For inter-day precision samples were injected in three different days.
.
Calibration curve
R2 Linear
working
range
(µg mL-1)
L.O.Q
(µg mL-1)
L.O.D
(µg mL-1)
Intra-day
Precision
(% RSD)
(n*=5)
Inter-day
Precision
(% RSD)
(n=5)
Fructose
Glucose
Mannitol
Sucrose
Maltose
myo-Inositol
Galactinol
Raffinose
Stachyose
y = 0.0208x + 0.0192
y = 0.0268x + 0.0362
y = 0.0328x + 0.0313
y = 0.025x + 0.0245
y = 0.011x + 0.0136
y = 0.0123x + 0.031
y = 0.0204x + 0.049
y = 0.0171x - 0.0378
y = 0.0088x - 0.019
0.9981
0.997
0.9947
0.9968
0.9939
0.9967
0.9917
0.9866
0.9963
0.75 - 75
1.0 - 50
0.75 - 50
0.75 - 90
2.5 - 75
1.0 - 90
1.0 -50
0.75 - 90
2.5 - 75
0.75
0.60
0.25
0.25
1.50
0.75
0.20
0.75
2.25
0.25
0.20
0.08
0.08
0.50
0.25
0.06
0.25
0.75
4.65
5.11
5.09
4.62
5.45
6.53
5.41
5.02
2.95
7.44
5.04
6.91
5.81
5.21
6.56
6.92
5.39
4.70

CHAPTER 7
170
To the best of the author's knowledge, our manuscript reports for the first time quantitative data
on mannitol, stachyose, galactinol and 2-O-(β-l-arabinopyranosyl)-myo-inositol in CGT
Regarding monosaccharide composition, fructose (average content of 4.55 ± 3.55 mg/g tea) was
higher than glucose (average content of 3.61 ± 3.6 mg/g tea). The highest and lowest fructose
and glucose content were determined in samples from Portugal and South Korea. The
monosaccharide quantities were in the same range of magnitude as the fructose and glucose
values reported previously (4.1–6.7 and 3.7–14.4 mg/g tea respectively) by Moldoveanu et al.,
2015, Shanmugavelan et al., 2013 [9,10].
The average mannitol content was in the range of trace – 4.2 mg/g tea. These values of mannitol
were in the same order of values reported in coffee [31].
Regarding disaccharides, sucrose was the most abundant LMWC in CGT, with an average
content of 29.16 ± 19.61 mg/g tea. Maltose showed a lower content (range: trace – 2.54 mg/g
tea), detecting differences in the mean values between samples from Portugal and Sri Lanka.
These values were in the range of data previously reported in studies using a limited number of
samples, where sucrose and maltose showed values in the range of 7.1–20.5 and not detected-
0.26 mg/g tea respectively [9,10].
Regarding cyclitols, 2-O-(β-l-arabinopyranosyl)-myo-inositol showed the highest average
content (11.89 ± 8.97 mg/g tea) followed by myo-inositol (average content 4.28 ± 2.72 mg/g
tea) and galactinol (average content 1.87 ± 2.18). The content of myo-inositol was in the same
order of values reported for two CGT samples (values of 2.2 – 3 mg/g tea) by Moldoveanu et
al. (2015) [9].
Regarding α-GOS, raffinose content was higher (average 2.64 ± 1.30 mg/g tea) than stachyose
(average 1.00 ± 0.79 mg/g tea). Literature values of raffinose, 0.25 mg/g leave [11], were lower
in comparison with the values obtained in this study. The differences in content could be
attributed to the variety of tea leave studied, the controlled farming conditions and the analytical

RESULTS
171
method employed (different extraction solvent with tedious sample preparation, including
incubation of the leaves in a buffer at 37 °C followed by washing with water).
3.1.4. Estimation of the caloric input in a green tea cup
The factors of 4 kcal/g for monosaccharides and disaccharides, 1,6 kcal/g for mannitol and
2.4 kcal/g for the cyclitols [32] were used to estimate the caloric input. The average recovery in
each sequential step of the extraction for six different samples was 91.9%, 7.7% and 0.4% for
the first, second and third extraction respectively. The recovery value of the first extraction was
used to perform the estimation of the caloric intake of a cup of green tea, resulting in 0.18 kcal.
This value demonstrates the low caloric input of green tea, supporting the recommendation of
the green tea consumption in weight-loss regimes [3].
3.2. Quality parameters of green tea: soluble solids, color parameters and antioxidant
capacity
Table 3 shows the average values of each quality parameters (soluble solids, color parameters
and antioxidant capacity) grouped according to the origin, the comparison among the different
origins (significant difference with p < 0.05 determined with the Kruskal Wallis test) and the
comparison between pairs of countries (significant difference with p < 0.05 determined with
Benjamin Hochberg post hoc). Individual sample values for each quality parameter are shown
in Tables 4S, 5S and 6S (supplementary information).Table 3 lists the average values of each
quality parameters (soluble solids, color parameters and antioxidant capacity) from the different
CGT analyzed grouped according to the origin.
3.2.1. Soluble solids
This quality indicator, employed in the tea industry (ISO-9768, 1994) [33], showed for the
samples under study an average value of 38.42 ± 6.94%. As shown in Table 3, Japan and Nepal
were the countries with the lowest and highest average soluble solids values (33.07 ± 6.01 and
50.44 ± 5.32 respectively).

CHAPTER 7
172
Table 2. Mean (standard deviation) values of each carbohydrate under study per country. Asterisk super index accompanying the carbohydrate name indicate significant differences
among countries according to Kruskal Wallis test. Similar letters between countries for the same LMWC indicate significant differences between two countries according to Kruskal
Wallis test followed by Benjamin Hochberg post hoc (p< 0.05 for both statistical test).
Mean (SD) mg /g tea
Japan
(n=8)
South Korea
(n=7)
Portugal
(n=3)
China
(n=8)
Iran
(n=6)
Nepal
(n=5)
South India
(n=6)
Darjeeling
(n=3)
Assam
(n=4)
Sri Lanka
(n=6)
Fructose* 6.28 (2.53)a,b 2.36 (2.62)a,c 11.99 (2.59)c,d 4.29 (2.99) 5.04 (1.64) 2.94 (0.68) 6.05 (5.17) 5.00 (3.41) 3.01 (0.68) 1.55 (0.59)b,d
Galactinol* 3.89 (3.67)a 0.18 (0.47)a,b,c 2.25 (1.39) 0.94 (1.10) 2.49 (1.37)c 0.53 (0.73) 3.06 (3.00)b 2.36 (2.08) 1.46 (0.67) 1.51 (0.91)
Glucose* 4.97 (2.60) 1.57 (2.30)a 9.59 (3.42)a 2.55 (1.85) 4.93 (2.98) 1.86 (0.85) 5.16 (4.38) 3.34 (0.78) 2.61 (0.50) 2.00 (1.51)
Inositol*,+ 10.57 (7.73) 12.56 (2.49) 10.43 (2.17) 19.02 (21.10) 8.00 (3.50) 12.64 (3.83) 9.96 (2.78) 14.53 (3.72) 10.96 (0.92) 8.59 (1.66)
Maltose* 0.46 (0.38) 0.36 (0.37) 1.80 (0.66)a,b 0.20 (0.16) 0.47 (0.24) 0.65 (0.51) 0.72 (0.42)c 0.46 (0.53) 0.12 (0.11)a 0.11 (0.17)b,c
Mannitol* 0.05 (0.07) 0.00 (0.00) 0.27 (0.08) 0.01 (0.03) 0.09 (0.21) 0.48 (0.45) 0.11 (0.27) 1.52 (2.39) 0.06 (0.05) 0.23 (0.39)
myo-Inositol* 3.66 (2.24)a 2.23(0.39)b,c,d 12.94(2.54)a,b,e 4.47 (1.60)c 3.91 (1.30) 4.52 (0.95)d 4.14 (1.37) 5.74 (4.12) 3.58 (0.64) 2.95 (1.01)e
Raffinose* 3.45 (1.43)a,b 1.34 (0.52)a,c,d 4.19 (1.32)c,e 2.84 (1.34) 3.25 (1.12)d,f 1.26(0.28)b,e,f 2.85 (1.19) 3.39 (1.57) 2.55 (0.48) 2.02 (0.50)
Stachyose* 1.55 (0.98)a 0.14 (0.36)a,b 1.47 (0.43) 0.69 (0.78) 1.25 (0.34) 0.40 (0.56) 1.68 (0.73)b 1.44 (0.76) 1.19 (0.09) 0.68 (0.53)
Sucrose* 35.24 (17.45) 19.01(4.54) 67.63 (37.45) 33.32 (18.88) 34.09 (31.77) 18.98 (3.03) 31.10(13.61) 23.42 (9.48) 19.72 (1.63) 18.96 (2.99)
Inositol+ = 2-O-(β-L-arabinopyranosyl)-myo-inositol

RESULTS
173
Values in the range of 31.66–41.96 and 39.0–51.7% of soluble solids were reported for
commercial teas from Australia [23] and China from the Fujian province [24] respectively.
Under the conditions described in this manuscript, no significant differences were observed
among the differents CGT samples grouped according to the particle size (big > 0.5 cm,
medium: 0.3–0.5 cm, small < 0.3 cm). The absence of differences for this parameter was
previously observed in commercial Australian teas [23].
3.2.2. Color parameters
Color is used as a sensorial quality indicator in the tea industry. The parameters a* (average
value of −2.00 ± 0.65) and b* (average values of 4.05 ± 3.9) were in the same order as the data
previously reported [34]. The low values determined for L* (average value of 15.03 ± 2.26)
could be attributed to the use in this work of authentic white and black color reference standard,
when other authors used distilled water [24] or a standard white plate [34].
The H° values were in the range of 178.5–180.8°, values in concordance with the theoretical
H° value for the green color (H° = 180°) [25].
Despite the wide variability observed for the chromaticity C* and S* values (average of
5.13 ± 3.08 and 0.34 ± 0.18 respectively), the values were similar to the data previously reported
for CGT from China [24,35]. The variability observed could be attributed to different content
of chlorophylls in the infusion, consequence either of the processing or the origin of tea leaf
[36].
3.2.3. Antioxidant capacity
The antioxidant capacity is an indicator of the relative number of antioxidant compounds in
green tea. The variability observed for GAE (average value of 0.10 ± 0.05 g GAE/g tea) and TE
(0.25 ± 0.12 g TE/g tea) might be attributed to the compositional variability of the CGT from
different origins and the processing. These values showed good concordance with data
previously reported [37,35].

CHAPTER 7
174
Table 3. Mean (standard deviation) values of each quality parameter under study per country. Plus super index accompanying the quality parameter name indicate significant
differences among countries according to Kruskal Wallis test. Similar letters between countries for the same quality parameter indicate significant differences between two countries
according to Kruskal Wallis test followed by Benjamin Hochberg post hoc (p< 0.05 for both statistical test).
Country Soluble
solids+ (%)
Color Parameters Antioxidant capacity
L* a*,+ b*,+ C* Saturation Hue angle+ GA-E (g / g tea) Trolox-E (g / g tea)
Japan (n=8) 33.07 (6.01)a 15.81 (1.55) -2.67(0.45)a,b 1.16(2.00) 3.34(1.07) 0.21(0.06) 179.71(0.50) 0.09(0.04) 0.24(0.06)
S*.korea (n=7) 37.50 (3.76) 15.81(1.55) -1.6(0.83)a 2.35(3.52) 3.61(2.70) 0.23(0.17) 179.40(0.75) 0.10(0.04) 0.23(0.09)
Portugal (n=3) 36.88 (1.06) 13.19(1.64) -2.08(0.44) 7.03(0.57) 7.35(0.50) 0.56(0.07) 178.72(0.07) 0.05(0.02) 0.16(0.09)
China (n=8) 38.96 (6.28) 14.30(1.61) -1.86(0.46) 4.14(3.70) 5.23(2.50) 0.37(0.18) 179.22(0.81) 0.08(0.05) 0.27(0.15)
Iran (n=6) 33.83 (7.09)b 14.27 (3.15) -1.88(0.83) 5.96(4.30) 6.54(3.83) 0.45(0.20) 178.91(0.38) 0.09(0.04) 0.18(0.07)
Nepal (n=5) 50.44 (5.32)a,b 16.67(4.04) -2.03(0.70) 4.94(3.68) 5.77(2.83) 0.34(0.13) 179.03(0.62) 0.12(0.07) 0.27(0.08)
S*.India (n=6) 37.13 (5.14) 14.17(1.24) -2.35(0.56) 1.23(2.99) 3.34(2.07) 0.23(0.13) 179.82(0.68) 0.09(0.07) 0.31(0.21)
Darjeeling (n=3) 36.79 (9.86) 15.55(3.54) -1.74(0.58) 5.62(5.29) 5.96(5.20) 0.35(0.23) 178.86(0.24) 0.09(0.03) 0.20(0.04)
Assam (n=4) 40.95 (5.16) 14.74(2.67) -1.52(0.28)b 6.09(3.85) 6.31(3.78) 0.41(0.17) 178.73(0.16) 0.16(0.02) 0.42(0.24)
Sri Lanka (n=6) 41.70 (3.57) 15.14(1.47) -1.90(0.39) 6.25(4.56) 6.70(4.26) 0.43(0.23) 178.86(0.28) 0.08(0.05) 0.25(0.06)
*S. South

RESULTS
175
No significant differences between countries were determined using a Kruskal Wallis test. From
the different countries under study, CGT samples from Assam showed the highest GAE and TE
values (0.16 ± 0.02 g GAE/g tea and 0.42 ± 0.24 g TE/ g tea respectively) and samples from
Portugal showed the lowest GAE and TE values (0.05 ± 0.02 g GAE/g tea and 0.16 ± 0.09 TE/g
tea respectively).
3.3. Multivariate analysis
3.3.1. Chemometric evaluation
Hierarchical cluster analysis (HCA) was applied with exploratory purposes, expecting a pattern
dependent of origin from the 56 samples under study. However, the analysis did not reveal any
trend according to the origin. Instead, HCA showed the presence of two main clusters (Fig. 2).
Cluster 1 contains 16 samples, including all the samples known to be processed by steaming
(n = 3, origin from Portugal). Cluster 2 includes 40 samples, including all the samples know to
be processed by pan-firing (n = 6, origin from South Korea).
The employment of t-test to evaluate the differences between cluster 1 and 2 revealed that
cluster 1 had a significantly higher content of fructose, glucose, sucrose, maltose, myo-inositol,
galactinol, raffinose and stachyose. In contrast, cluster 2 had significantly higher GAE, TE,
soluble solids content and high L* and a* values.
Based on the HCA results, the samples were divided into four groups: cluster 1-S, cluster 1-U,
cluster 2-PF and cluster 2-U. Cluster 1-S and cluster 2-PF included the samples with
information regarding the type of processing (1S: steaming and 2-PF: pan-firing). Cluster 1-U
and 2-U contained the samples with unknown manufacturing procedure distributed in cluster 1
and 2 respectively.
Kruskal Wallis test followed by Benjamin Hochberg post hoc test was employed to evaluate
similarities and differences among groups. Cluster 2-U and 2-PF were similar in 14 of the 19
variables under study, while cluster 1-U and 1-S were similar in 17 of the 19 variables (results
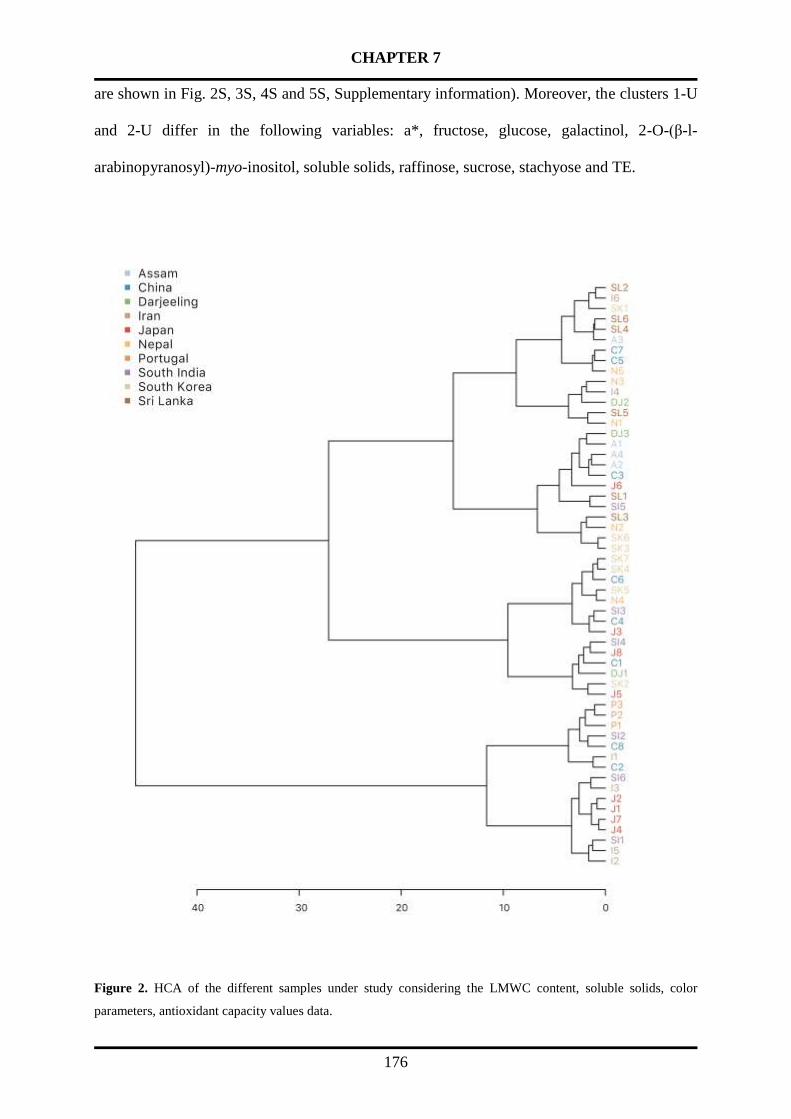
CHAPTER 7
176
are shown in Fig. 2S, 3S, 4S and 5S, Supplementary information). Moreover, the clusters 1-U
and 2-U differ in the following variables: a*, fructose, glucose, galactinol, 2-O-(β-l-
arabinopyranosyl)-myo-inositol, soluble solids, raffinose, sucrose, stachyose and TE.
Figure 2. HCA of the different samples under study considering the LMWC content, soluble solids, color
parameters, antioxidant capacity values data.

RESULTS
177
Figure 3. PCA score (left) and loading plot (right) from LMWC content, soluble solids, color parameters,
antioxidant capacity values of the samples under study.
PCA was employed to evaluate the sample clustering. No separation was observed between
cluster 2-U and cluster 2-PF (Fig. 3). However, the cluster 1-U in the score plot overlaps with
the cluster 2-U and cluster 1-S. The variance explained by the first component of PCA was
30.1% while for the second component was 22.2%. The first component could be considered
as mainly demarcating the cluster classification according to the processing method.
Some of the variables observed in the loading plots (Fig. 3) defining the different clusters under
study could be tentatively explained based on differences in the tea processing. In the case of
fructose and glucose, samples from cluster 1-S and cluster 1-U showed higher content compared
to the values of the samples from cluster 2-U and cluster 2-PF. These differences might be
attributed to a significant decrease in the monosaccharide content in processes employing high
temperatures such as pan-firing. This hypothesis is based on the data reported for fructose and
glucose loss in processes employing steaming and roasting in other foods [37,39], which can
be considered comparable to the processes performed in the tea industry. However, further
studies should be carried out to confirm this hypothesis.
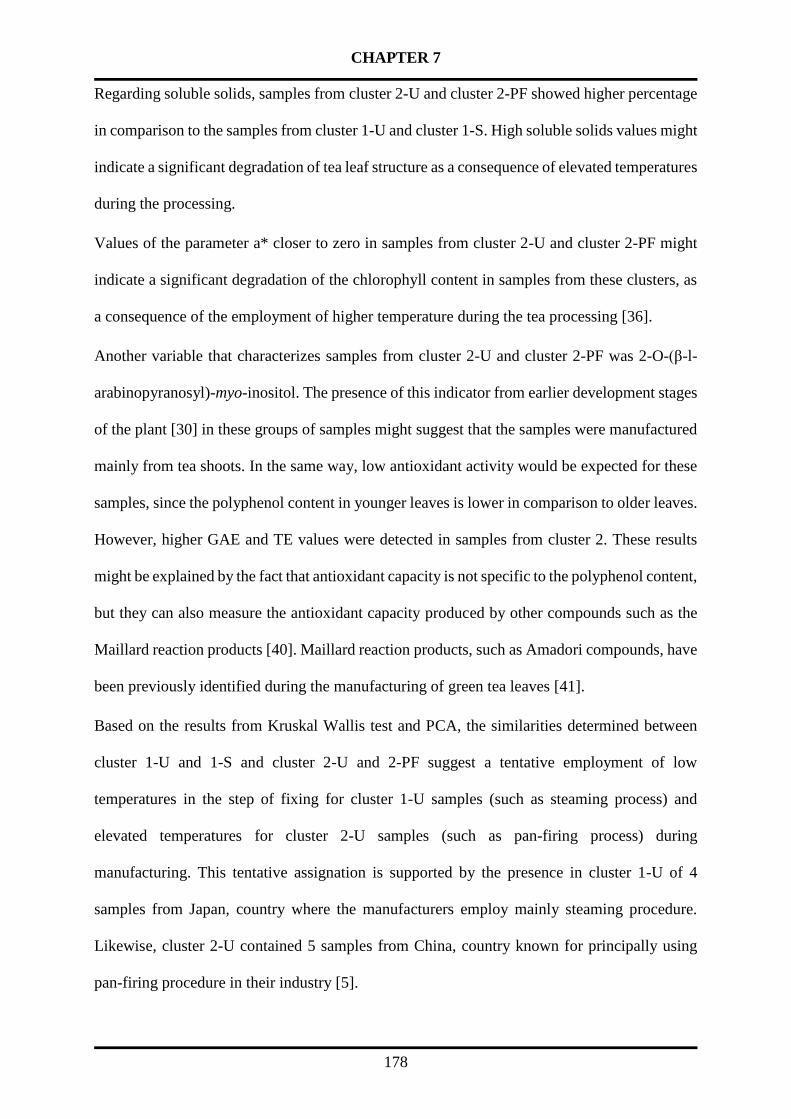
CHAPTER 7
178
Regarding soluble solids, samples from cluster 2-U and cluster 2-PF showed higher percentage
in comparison to the samples from cluster 1-U and cluster 1-S. High soluble solids values might
indicate a significant degradation of tea leaf structure as a consequence of elevated temperatures
during the processing.
Values of the parameter a* closer to zero in samples from cluster 2-U and cluster 2-PF might
indicate a significant degradation of the chlorophyll content in samples from these clusters, as
a consequence of the employment of higher temperature during the tea processing [36].
Another variable that characterizes samples from cluster 2-U and cluster 2-PF was 2-O-(β-l-
arabinopyranosyl)-myo-inositol. The presence of this indicator from earlier development stages
of the plant [30] in these groups of samples might suggest that the samples were manufactured
mainly from tea shoots. In the same way, low antioxidant activity would be expected for these
samples, since the polyphenol content in younger leaves is lower in comparison to older leaves.
However, higher GAE and TE values were detected in samples from cluster 2. These results
might be explained by the fact that antioxidant capacity is not specific to the polyphenol content,
but they can also measure the antioxidant capacity produced by other compounds such as the
Maillard reaction products [40]. Maillard reaction products, such as Amadori compounds, have
been previously identified during the manufacturing of green tea leaves [41].
Based on the results from Kruskal Wallis test and PCA, the similarities determined between
cluster 1-U and 1-S and cluster 2-U and 2-PF suggest a tentative employment of low
temperatures in the step of fixing for cluster 1-U samples (such as steaming process) and
elevated temperatures for cluster 2-U samples (such as pan-firing process) during
manufacturing. This tentative assignation is supported by the presence in cluster 1-U of 4
samples from Japan, country where the manufacturers employ mainly steaming procedure.
Likewise, cluster 2-U contained 5 samples from China, country known for principally using
pan-firing procedure in their industry [5].

RESULTS
179
Although the chemical composition of green tea is affected mainly by the processing, other
factors such as variety (Assamica, Sinensis), environmental conditions (climate, growth
altitude) and farming conditions (the use of fertilizers or shading) could also affect the chemical
composition [5] and therefore, have influence in the distribution observed of the samples.
4. CONCLUSION
In this study, the combination of LMWC content, soluble solids, antioxidant capacity and color
parameters allowed a comprehensive characterization of an extensive and diverse sample set of
CGT from different origins. This comprehensive approach has not been previously reported in
tea science.
The method proposed for LMWC analysis solves the main limitation of other previous methods
that did not offer a simultaneous identification and quantification of the different LMWC in tea
within the same chromatographic analysis. In contrast to previous studies evaluating the
composition of LMWC in CGT with a limited number of samples (generally 1 or 2 samples),
this study, based on the diversity in origin and with an extensive number of samples analyzed,
contributes to gain an in-depth knowledge of LMWC composition in CGT from the main tea
producing countries.
The data on the LMWC composition, specifically on bioactive carbohydrates such as cyclitols
and α-GOS content, provides relevant information for consumers and professionals from the
tea industry. According to the data reported, the Portugal and Japan CGT could be considered
as a complementary source of bioactive carbohydrates for their high content determined in
cyclitols and α-GOS. In addition, based on the LMWC quantities determined, our study
estimated the caloric input theoretically in a homemade cup of green tea, confirming this
beverage as a drink recommended in weight-loss regimes.

CHAPTER 7
180
The variation of three quality indicators, widely used for the characterization of CGT (soluble
solids, color and antioxidant capacity), according to the different origin has been determined
for the first time in an extensive set of samples.
The employment of multivariate statistical analysis to the measured variables (LMWC, soluble
solids, color and antioxidant capacity) lead to the identification of different markers such as
fructose, glucose, soluble solids, GAE and TE to characterize the different CGT groups. The
differences observed among groups were tentatively attributed to the fixing procedure
employed (steaming or pan-firing) during the tea manufacturing.
5. ACKNOWLEDGMENTS
All authors would like to mention their gratitude to Mrs Anja Muller for her assessment during
the measurements of the samples. All authors would like to acknowledge Dr Gorka Ruiz de
Garibay the valuable suggestions for this manuscript. The authors would like to thank Fariba
Sabzi, Prof. Dr Lalith Jayasinghe and Seung-Hun Lee for providing samples from Iran, Sri
Lanka and South Korea.
This research did not receive any specific grant from funding agencies in the public,
commercial, or not-for-profit sectors.

RESULTS
181
6.BIBLIOGRAPHY
[1] K. Chang, http://www.fao.org/3/a-i4480e.pdf Accessed 04/11/2018, (2015).
[2] C. Cabrera, R. Artacho, R. Giménez, Beneficial Effects of Green Tea—A Review, Journal
of the American College of Nutrition, 25 (2006) 79-99.
[3] N. Sanlier, B.B. Gokcen, M. Altuğ, Tea consumption and disease correlations, Trends in
Food Science and Technology, 78 (2018) 95-106.
[4] S. Ahmed, J.R. Stepp, Chapter 2 - Green Tea: The plants, processing, manufacturing and
production, in: V.R. Preedy (Ed.) Tea in Health and Disease Prevention, Academic Press, 2013,
pp. 19-31.
[5] N. Xu., Z.-m. Chen, Green Tea, Black Tea and Semi-fermented Tea, in: Y.-s. Zhen (Ed.)
TEA: Bioactivity and Therapeutic potential, Taylor & Francis, New York, 2002, pp. 35-56.
[6] E. Sharpe, F. Hua, S. Schuckers, S. Andreescu, R. Bradley, Effects of brewing conditions
on the antioxidant capacity of twenty-four commercial green tea varieties, Food Chem., 192
(2016) 380-387.
[7] L. Yao, X. Liu, Y. Jiang, N. Caffin, B. D'Arcy, R. Singanusong, N. Datta, Y. Xu,
Compositional analysis of teas from Australian supermarkets, Food Chem., 94 (2006) 115-122.
[8] J.W. Drynan, M.N. Clifford, J. Obuchowicz, N. Kuhnert, The chemistry of low molecular
weight black tea polyphenols, Natural Product Reports, 27 (2010) 417-462.
[9] S. Moldoveanu, W. Scott, J. Zhu, Analysis of small carbohydrates in several bioactive
botanicals by gas chromatography with mass spectrometry and liquid chromatography with
tandem mass spectrometry, J. Sep. Sci., 38 (2015) 3677-3686.
[10] P. Shanmugavelan, S.Y. Kim, J.B. Kim, H.W. Kim, S.M. Cho, S.N. Kim, S.Y. Kim, Y.S.
Cho, H.R. Kim, Evaluation of sugar content and composition in commonly consumed Korean
vegetables, fruits, cereals, seed plants, and leaves by HPLC-ELSD, Carbohydrate Research,
380 (2013) 112-117.
[11] Y. Zhou, Y. Liu, S. Wang, C. Shi, R. Zhang, J. Rao, X. Wang, X. Gu, Y. Wang, D. Li, C.
Wei, Molecular cloning and characterization of galactinol synthases in Camellia sinensis with
different responses to biotic and abiotic stressors, J. Agric. Food Chem., 65 (2017) 2751-2759.
[12] G.R. Gibson, R. Hutkins, M.E. Sanders, S.L. Prescott, R.A. Reimer, S.J. Salminen, K.
Scott, C. Stanton, K.S. Swanson, P.D. Cani, K. Verbeke, G. Reid, Expert consensus document:
The International Scientific Association for Probiotics and Prebiotics (ISAPP) consensus
statement on the definition and scope of prebiotics, Nature Reviews Gastroenterology and
Hepatology, 14 (2017) 491-502.
[13] J. Nilsson, K. Olsson, G. Engqvist, J. Ekvall, M. Olsson, M. Nyman, B. Åkesson, Variation
in the content of glucosinolates, hydroxycinnamic acids, carotenoids, total antioxidant capacity
and low-molecular-weight carbohydrates in Brassica vegetables, J. Sci. Food Agric., 86 (2006)
528-538.
[14] E. Papaleo, V. Unfer, J.P. Baillargeon, L. De Santis, F. Fusi, C. Brigante, G. Marelli, I.
Cino, A. Redaelli, A. Ferrari, Myo-inositol in patients with polycystic ovary syndrome: A novel
method for ovulation induction, Gynecological Endocrinology, 23 (2007) 700-703.
[15] J. Benjamin, J. Levine, M. Fux, A. Aviv, D. Levy, R.H. Belmaker. Double-blind, placebo-
controlled, crossover trial of inositol treatment for panic disorder. American Journal of
Psychiatry, 152 (7) (1995), pp. 1084-1086.
[16] G. Le Gall, I.J. Colquhoun, M. Defernez, Metabolite profiling using 1H NMR spectroscopy
for quality assessment of green gea, Camellia sinensis (L.), J. Agric. Food Chem., 52 (2004)
692-700.

CHAPTER 7
182
[17] Y.Q. Xu, P.P. Liu, J. Shi, Y. Gao, Q.S. Wang, J.F. Yin. Quality development and main
chemical components of Tieguanyin oolong teas processed from different parts of fresh shoots.
Food Chemistry, 249 (2018), pp. 176-183
[18] A. Arnous, D.P. Makris, P. Kefalas. Correlation of pigment and flavanol content with
antioxidant properties in selected aged regional wines from Greece. Journal of Food
Composition and Analysis, 15 (6) (2002), pp. 655-665
[19] G. Roda, C. Marinello, A. Grassi, C. Picozzi, G. Aldini, M. Carini, L. Regazzoni. Ripe and
raw pu-erh tea: LC-MS profiling, antioxidant capacity and enzyme inhibition activities of
aqueous and hydro-alcoholic extracts. Molecules, 24 (3) (2019).
[20] A. Shevchuk, L. Jayasinghe, N. Kuhnert, Differentiation of black tea infusions according
to origin, processing and botanical varieties using multivariate statistical analysis of LC-MS
data, Food Res. Int., 109 (2018) 387-402.
[21] R. Megías-Pérez, A.I. Ruiz-Matute, M. Corno, N. Kuhnert. Analysis of minor low
molecular weight carbohydrates in cocoa beans by chromatographic techniques coupled to mass
spectrometry. Journal of Chromatography A, 1584 (2019), pp. 135-143
[22] R. Megías-Pérez, S. Grimbs, R.N. D'Souza, H. Bernaert, N. Kuhnert, Profiling,
quantification and classification of cocoa beans based on chemometric analysis of
carbohydrates using hydrophilic interaction liquid chromatography coupled to mass
spectrometry, Food Chem., 258 (2018) 284-294.
[23] L. Yao, X. Liu, Y. Jiang, N. Caffin, B. D'Arcy, R. Singanusong, et al. Compositional
analysis of teas from Australian supermarkets Food Chemistry, 94 (1) (2006), pp. 115-122
[24] Y. Guo, L. Lai, Analysis on quality indicators of taste and infusion color and discrimination
of famous and superior green tea with different appearances in Fujian province, PR China,
Journal of Food Processing and Preservation, 40 (2016) 1084-1092.
[25] M.R. McLellan, L.R. Lind, R.W. Kime, Hue angle determinations and statistical analysis
for multiquadrant Hunter L, a, b data, Journal of Food Quality, 18 (1995) 235-240.
[26] I.F.F. Benzie, J.J. Strain, The ferric reducing ability of plasma (FRAP) as a measure of
'antioxidant power': The FRAP assay, Analytical Biochemistry, 239 (1996) 70-76.
[27] G. Fan, T. Beta, Discrimination of geographical origin of Napirira bean (Phaseolus vulgaris
L.) based on phenolic profiles and antioxidant activity, Journal of Food Composition and
Analysis, 62 (2017) 217-222.
[28] J. Chong, O. Soufan, C. Li, I. Caraus, S. Li, G. Bourque, D.S. Wishart, J. Xia,
MetaboAnalyst 4.0: Towards more transparent and integrative metabolomics analysis, Nucleic
Acids Research, 46 (2018) W486-W494.
[29] K. Sakata, H. Yamauchi, A. Yagi, K. Ina, A New Inositol Glycoside, 2-O-Γ-L-
Arabinopyranosyl-myo-Inositol, as a Major Tea Component, Agricultural and Biological
Chemistry, 51 (1987) 1737-1739.
[30] M. Maeda-Yamamoto, N. Tahara, Y. Yamaguchi, K. Tsuji, Changes in dietary fiber
contents in tea leaves, Nippon Shokuhin Kagaku Kogaku Kaishi, 43 (1996) 1309-1313.
[31] A.I. Ruiz-Matute, A. Montilla, M.D. Del Castillo, I. Martínez-Castro, M.L. Sanz. A GC
method for simultaneous analysis of bornesitol, other polyalcohols and sugars in coffee and its
substitutes. Journal of Separation Science, 30 (4) (2007), pp. 557-562.
[32]R.A. Samra, G.H. Anderson. Intense sweeteners and sugar replacers in the regulation of
food intake and body weight D.J. Mela (Ed.), Food, diet and obesity, Woodhead Publishing
(2005), pp. 292-310.
[33] ISO-9768:1994. Tea – Determination of water extract. In I. O. f. Standardization (Ed.)).
Switzerland.
RESULTS
183
[34] S.D. Lin, J.H. Yang, Y.J. Hsieh, E.H. Liu, J.L. Mau. Effect of different brewing methods
on quality of green tea. Journal of Food Processing and Preservation, 38 (3) (2014), pp. 1234-
1243
[35] Y.-Q. Xu, C. Zou, Y. Gao, J.-X. Chen, F. Wang, G.-S. Chen, J.-F. Yin, Effect of the type
of brewing water on the chemical composition, sensory quality and antioxidant capacity of
Chinese teas, Food Chem., 236 (2017) 142-151.
[36] S. Roshanak, M. Rahimmalek, S.A.H. Goli, Evaluation of seven different drying
treatments in respect to total flavonoid, phenolic, vitamin C content, chlorophyll, antioxidant
activity and color of green tea (Camellia sinensis or C. assamica) leaves, Journal of Food
Science and Technology, 53 (2016) 721-729.
[37] G. Rusak, D. Komes, S. Likić, D. Horžić, M. Kovač, Phenolic content and antioxidative
capacity of green and white tea extracts depending on extraction conditions and the solvent
used, Food Chem., 110 (2008) 852-858.
[38] J. Gamboa-Santos, A.C. Soria, M. Villamiel, A. Montilla, Quality parameters in convective
dehydrated carrots blanched by ultrasound and conventional treatment, Food Chem., 141
(2013) 616-624.
[39] R.J. Redgwell, V. Trovato, D. Curti, Cocoa bean carbohydrates: roasting-induced changes
and polymer interactions, Food Chem., 80 (2003) 511-516.
[40] L.N. Vhangani, J. Van Wyk, Antioxidant activity of Maillard reaction products (MRPs)
derived from fructose-lysine and ribose-lysine model systems, Food Chem., 137 (2013) 92-98.
[41] T. Anan. Isolation and identification of a new amadori compound from green tea. Journal
of the Science of Food and Agriculture, 30 (9) (1979), pp. 906-910


RESULTS
185
Chapter 8. Changes in low molecular weight carbohydrates in kale during
development and acclimation to cold temperatures determined by
chromatographic techniques coupled to mass spectrometry
Roberto Megías-Pérez, Christoph Hahn, Ana Isabel Ruiz-Matute, Britta Behrends, Dirk C.
Albach, Nikolai Kuhnert
Manuscript will be submit to Food Research International in the near future (retrieved
09/05/2019)

CHAPTER 8
186
ABSTRACT
Kale has gained an increasing attention for the diverse health benefits reported for its
consumption. Despite being a fundamental element in the German cuisine and being employed
in the elaboration of diverse products such as tea or smoothies, the composition of the low
molecular weight carbohydrates (LMWC) has been scarcely studied. Gas chromatography
coupled to mass spectrometry has allowed the identification of new LMWC for the first time in
kale, such as myo-inositol, galactinol, maltose or melibiose. Eight major LMWC have been
quantified using hydrophilic interaction liquid chromatography coupled to mass spectrometry
(HILIC-MS) to evaluate possible differences in LMWC content of three different commercial
kale types, with respect to plant development and changes associated with low temperature.
Overall, for all types of kale plants under study, the content of maltose decreases during the
development while the content of fructose, melibiose, maltose, raffinose and galactinol is
increased in all types of kale plants as a consequence of the acclimation to cold temperatures.
These results underline the importance of controlling the temperature during cultivation in order
to obtain a higher content of bioactive carbohydrates in this vegetable.
Keywords: Brassica oleracea, HILIC-MS, GC-MS, carbohydrate, freezing tolerance, plant
development

RESULTS
187
1. INTRODUCTION
Brassica oleracea, a member of the cruciferous vegetable family, is one of the most widely
cultivated vegetables in the world [1] Despite looking very different, cabbage, kale, kohlrabi,
cauliflower, broccoli and Brussels sprouts are all varieties of Brassica oleracea. The variety best
adapted to northwestern European climate is kale (Brassica oleracea var. sabellica), a tough
and hardy plant, able to withstand freezing temperatures and water shortages. On the market, a
large variation of kale types can be found. These varieties differ in terms of habit, growth height,
color and leaf morphology [2].
A recent study corroborates the classification of kale (in the broader sense) in at least three
different types of kale cultivars: curly kales, Italian kales and Collards [3]. Curly kales (Scotch
type, Brassica oleracea var. sabellica) are mostly grown in Northern Europe and considered as
kale in the narrow sense. In contrast, the Italian kales of the Lacinato type (Brassica oleracea
var. palmifolia) have dark green savoyed blade shape leaves and are grown mostly in Tuscany
with a long tradition in Italian cuisine. The third group, Collards (Brassica oleracea acaphala),
constitute the varieties mainly found in the United States, especially in the Southern part. They
are characterized by large and flat roundish leaves. They most resemble wild and feral cabbages,
big-leaved, bitter tasting shrub [3].
The farming conditions of this vegetable have an influence on the organoleptic properties. Local
(non-commercial) farming practice in Northwestern Germany claim that low temperature plays
a role in terms of the palatability of the vegetable, often suggesting to harvest kale after the first
frost. As a consequence of its characteristic organoleptical properties, kale is a traditional
vegetable widely consumed in winter times, especially in Northwestern Germany and adjacent
regions. Looking beyond Northern Germany, there are other countries that in recent time
discovered kale as a valuable and healthy vegetable. One example are the United States, where

CHAPTER 8
188
this vegetable is widely employed in the preparation of salads and smoothies, among others,
making kale an everyday food item [4].
The interest on kale consumption for the consumers, corrobotated by the elevated production
of this vegetable [5], is based on the different health-promoting benefits reported, such as
antigenotoxic activity [6], anticancerogenic activity [7] and protection of the cardiovascular
system and gastrointestinal tract [8, 9]. The different beneficial effects of kale are consequence
of its chemical composition. On average, the main composition is 89% moisture, fiber (4 %),
proteins (3 %), lipids (1.5 %) and LMWC (1 %) [10]. Interestingly. an average serving of this
vegetable provides 25 %, 100 % and 40 % respectively of the calcium, vitamin A and C
recommended daily uptake (RDI) [11]. Another significant group of bioactive kale metabolites
are glucosinolates. On average, the concentration of glucosinolates in kale is in the range of
2.25-93.90 μmol/g DW [4]. Glucosinolates are activated by the enzyme myrosinase after cell
damage, leading to the production of isothiocyanates, nitriles, thiocyanates, epithionitriles, and
oxazolidinethiones, compounds biologically active with direct health-promoting effects [12].
Diversity in the glucosinolate content between different genotypes of kale from different origins
has recently been reported [3].
Regarding low molecular weight carbohydrates (LMWC) in kale, their study has been
overlooked in comparison to other metabolites. Some recent studies have reported the LMWC
content in kale from 25 different genotypes grown in the USA [13] and evaluated their changes
under moisture stress [14]. In terms of LMWC composition, the presence of pentoses (xylose,
arabinose), hexoses (fructose, glucose, mannose), sugar alcohols (sorbitol, mannitol),
disaccharides (sucrose), and oligosaccharides (α-galactooligosaccharides (α-GOS) such as
raffinose, stachyose, verbascose and fructooligosaccharides such as 1-kestose) have been
reported [13-15]. However, oligosaccharides have only been reported for kale cultivated under

RESULTS
189
stress conditions. The interest in this type of LMWC is based on the bioactive effects, such as
the prebiotic effect reported for α-GOS [16, 17].
In view of the so far limited information available on kale LMWC, new studies aimed at
performing a comprehensive characterization might provide the identification of new LMWC
in kale, information on plant metabolism and elucidation of the sensory properties of the
vegetable.
Regarding plant metabolism, LMWC play a role in molecular signalling during plant
development [18] and as indicators in response to abiotic conditions [19]. In terms of sensorial
perception, carbohydrates contribute significantly to flavour and sweetness of kale. Therefore,
understanding the LMWC composition of the different kale genotypes and the impact of
farming conditions into the LMWC profile might contribute to the identification of optimal
farming conditions of kale that provide an adequate palatability to this vegetable.
Based on the above points, the LMWC analysis in kale is quite essential for a better knowledge
of this vegetable. The methodological approach employing different techniques such as GC-
MS and HILIC-ESI-TOF MS has resulted suitable for the identification and quantification of
LMWC in other food matrices [20]. In terms of structural identification, gas chromatography
coupled to mass spectrometry (GC-MS) is a suitable technique for the identification of
unknown LMWC based on its high-resolution power and sensitivity. GC-MS uses the
combination of GC retention times (or retention indices) and fragmentation specific spectra of
the derivatives obtained with electron impact ionization (EI) to elucidate the chemical structure
of carbohydrate isomers [21]. Several applications of this technique such as the analysis of
inositol in edible legumes [22], cyclitol glycosides in chickpeas and adzuki beans [23] and
LMWC in cocoa beans [20], among other applications have been reported. However, the
application of this technique is limited by the tedious sample preparation [24].
CHAPTER 8
190
In contrast, the increasing employment of hydrophilic interaction liquid chromatography
(HILIC) for quantification purpose is based on the minimum requirement of sample
preparation, the appropriate resolution between isomers, good peak shapes and easy coupling
to mass spectrometers [25]. HILIC-MS for the analysis of LMWC has been applied in many
fields of food science, for example the analysis of commercial green tea [26], goat colostra
[27] and medicinal plants [28].
The present paper aims at investigating the LMWC profile and content of three main different
kale types and at evaluating the changes in LMWC during plant development and the effect
associated with cold temperature. As a first approach, GC-MS has been used to identify
different LMWC in kale. Thereafter, HILIC-ESI-TOF MS has been employed to analyze the
main LMWC content in the different samples under study to monitor the changes during kale
development and those associated with low temperatures. To the best of the author’s
knowledge, no studies have so far investigated the quantitative distribution of LMWC in kale
under controlled environmental conditions in response to cold stress.
2. MATERIALS AND METHODS.
2.1. Chemicals and standards
Fructose, glucose, galactose, maltose, melibiose, myo-inositol, sucrose, raffinose, phenyl-β-D-
glucoside ammonium hydroxide solutions, ammonium formate, hexamethyldisilazane (HMDS)
and trifluoroacetic acid (TFA) were provided by Sigma Chemical Co. (St. Louis, USA).
Dichloromethane and LC-MS grade acetonitrile (ACN) were purchased from Aplichem
Panreac (Darmstadt, Germany). Galactinol was obtained from Carbosynth (Compton, UK).
Mannitol was donated by Bermpohl Apotheke (Bremen, Germany).

RESULTS
191
2.2. Kale samples
Based on the diversity in kale varieties described above, representative samples of three kale
types (Scotch type, Lacinato type and Feral type) were chosen for this study. Specifically, the
kale cultivars “Frostara” (German kale, Scotch type), “Black Tuscany” (Italian kale, Lacinato
type) and “Helgoländer Wildkohl” (Wild Cabbage, Feral type) were selected [3].
Qualitative and quantitative changes in LMWC asociated with plant development were studied
in plants grown in a temperature chamber at a constant temperature of 25°C with 12 h/12 h
cycle of light/dark at the Botanical Garden Oldenburg (Oldenburg, Germany) The period of
plant development considered as the optimal time when the first leaves are ready to harvest
with characteristics in terms of size similar to the plants grown in the field was stated at 8 weeks.
To evaluate the reproducibility of the plant’s development process under the conditions
mentioned above, the experiments were carried out in two different time intervals. In the first
time interval, leaves from one plant of each kale cultivar were collected weekly from week 4 to
week 8, using each time a different individual plant. Likewise, in the second interval, leaves
from two plants per kale cultivar were collected at the same time points under the same
conditions described above.
The effect of cold temperatures on the LMWC profile of the kale plants was evaluated in
samples that initially had been cultivated under the same conditions (temperature chamber at
25°C for 8 weeks). After 8 weeks, the temperature was changed to 2°C, maintaining the other
conditions the same (irrigation and light parameters). Different leaf samples from two
individual plants were collected at 0, 3, 7 and 11 days after initiating cold temperature (2°C).
As a control, different leaf samples from two individual plants grown at a constant and
controlled temperature of 25°C during the same time period were analyzed.

CHAPTER 8
192
The leaves of each time point for each kale cultivar were freeze-dried and pooled before
chromatographic analysis.
2.3. LMWC extraction
100 mg of kale leaves were extracted in 10 mL of water for 1 h under constant stirring at 25 °C.
In all cases, extracts were immediately centrifuged at 4400g for 10 min at 4 °C. After that, 1
mL of the sample was filtered for chromatographic analysis.
2.4. GC-MS analysis
The derivatisation method described by Ruiz-Aceituno, Carrero-Carralero, Ruiz-Matute,
Ramos, Sanz and Martínez-Castro [23] was employed as sample preparation for GC-MS
analysis. Briefly, 1 mL of the aqueous kale extract and 0.1 mL of 70% methanolic solution of
phenyl-β-D-glucoside (1 mg mL-1; internal standard) were evaporated under vacuum. After
that, 350 µL of 2.5% hydroxylamine chloride in pyridine were added and the solution was kept
at 75 °C for 30 min. Then, 350 µL of hexamethyldisilazane (HMDS) and 35 µL of
trifluoroacetic acid (TFA) were added and the solution was maintained at 45 °C for 30 min.
This derivatization method employing a two-step derivatization procedure (oximation +
silylation) has the advantage to reduce the number of chromatographic peaks to two peaks in
reducing LMWC (corresponding to E- and Z- oxime isomers) and to one peak in the case of
non-reducing LMWC.
A 7890A gas chromatograph coupled to a 5975C quadrupole mass detector (Agilent
Technologies, Palo Alto, CA, USA) operating in EI mode at 70 eV was used to perform the
identification of the different carbohydrates. Analyses were performed on a ZB-5 (5%
phenylmethylsiloxane) capillary column (25 m × 0.25 mm i.d., 0.25 µm film thickness;
Phenomenex, Madrid, Spain). Helium at 1 mL min−1 was employed as a carrier gas. The
analyses were performed under the following gradient temperature: 120 °C to 300 °C at a

RESULTS
193
heating rate of 5°C min-1 and held for 10 min. The temperature in the transfer line and ionization
source was set to 280 ºC and 230 ºC respectively. The injection volume was set to 1 µL of
sample and the injection was performed in split mode (split ratio of 1:20) at 300 °C. HPChem
Station software (Agilent Technologies) was employed for data acquisition.
Linear retention indices (IT) were determined considering the retention times of LMWC
trimethylsilyl oxime (TMSO) derivatives and those of suitable n-alkanes (from C17 to C36) [29].
The LMWC were identified by comparison of experimental linear retention indices (IT) and
mass spectra with the available standards. In the cases in which commercial standards were not
available, compounds were tentatively identified by their mass spectral information and data
from the literature.
2.5. HILIC-ESI-TOF MS analysis
Prior to analyses, the carbohydrate extracts (1 mL) were filtered through a CHROMAFIL Xtra
PTFE-45/25 filter (Macherey-Nagel, Düren, Germany ).
Chromatographic analyses were performed using an Agilent 1260 Series HPLC (Agilent
Technologies, Karlsruhe, Germany). A BEH X-Bridge column was employed with a
trifunctionally-bonded amide phase (Waters Company, USA) and the following characteristics:
150 mm × 3.0 mm; 3.5 μm particle size and 135 Å pore size. Water (solvent A) and acetonitrile
(solvent B) supplemented both with 0.1 % ammonium hydroxide and ammonium formate (5
mM) were used as a mobile phase. The injection volume and flow rate was set up to 3 µL and
0.4 mL min-1 respectively.
A QTOF mass spectrometer fitted with an ESI ion source (Bruker Daltonics HCT Ultra,
Bremen, Germany), operating in positive ion mode in the range of 50 - 1200 m/z was employed.
The ESI source parameters were adjusted as follows: spray voltage, 4.5 kV; drying gas (N2,
99.5% purity); temperature = 200 °C; drying gas flow, 9 L min-1; nebulizer (N2, 99.5% purity)
CHAPTER 8
194
pressure, 1.8 bar. Data was acquired using HyStar 3.2 software (Bruker, Bremen, Germany). A
solution of 0.1 M sodium formate solution was used to calibrate the mass spectrometer prior to
the sequence run. A posterior calibration of the LC-MS spectra was performed using sodium
formate solution injected automatically through a six-port valve prior to each chromatographic
run. The mass spectrometer was employed to identify the molecular formula and for
quantitative analysis. Identification of the compounds was based on the comparison of the
retention time with those of commercial standards. The mass error detected was below 5 ppm.
The Extracted Ion Chromatogram (EIC) areas of the sodium adduct [M+Na]+ of LMWC (m/z
203.05, 527.15, 365.10 respectively) of the standards and samples were used to determine the
different calibration curves and the quantities of each LMWC. Results were expressed as mg/
g DM kale.
Signal to noise ratio (S/N) values of ten and three were the criteria to detemine the limit of
detection (LOD) and quantification (LOQ) of the different LMWC under study.
Matrix effect was evaluated as the average recovery determined after the adition of two different
LMWC standard quantities to the carbohydrate kale extract. The addition of each quantity was
performed in triplicate.
Intra-day precision and inter-day precision were used to asses chromatographic reproducibility.
Inter-day precision was calculated as the relative standard deviation (RSD) of the LMWC
concentrations obtained from 1 sample injected in three different days. Intra-day precision was
calculated as the RSD average of the LMWC concentrations determined in 1 sample injected
five times, within the same day.
Reproducibility of the whole method (extraction of LMWC and chromatographic separation)
was assesed based on the average RSD value of each target compound measured on randomly
selected samples performed in duplicate (n = 11) and triplicate (n = 2) of sample preparation.

RESULTS
195
2.6. Statistical analysis
Peak area values of the different LMWC were extracted using Quant Analysis 2.2 software
(Bruker, Bremen, Germany). Kruskal Wallis test followed by Dunn’s test and t-test were
performed using GraphPad Prism 7.0 software (San Diego, California, USA).
3. RESULTS AND DISCUSSION
3.1. Qualitative analysis of Kale LMWC
As a first approach, considering the high resolving power and high sensitivity provided by GC-
MS, this technique was employed for the characterization of LMWC in kale extracts. Figure 1
shows the GC-MS profile of trimethylsilyl oxime (TMSO) derivatives of LMWC obtained for
samples cultivated under different conditions of temperature (25 ºC and 2 ºC).
Table 1 contains the peak assignation and linear retention indices (IT) of different LMWC
detected in kale extracts by GC–MS. Different monosaccharides and sugar-alcohols previously
reported in the literature such as arabinose, ribose, fructose, glucose, galactose and sorbitol were
detected. Other monosaccharides of 5 and 6 C atom were not detected [13]. Peak 7 (IT 2128),
identified as myo-inositol, showed typical spectra of free inositols due to the presence of the
pair of characteristic ion fragments at m/z 305 and 318 with intensity similar to the pair of m/z
191 and 217 [30].
Regarding disaccharides, the presence of sucrose was corroborated [13]. In addition, further
peaks were detected in the disaccharide zone. Peaks 9 and 10 were identified maltose E and Z
(IT 2929 and 2947, respectively) and melibiose E and Z isomers (IT 3031 and 3068,
respectively).

CHAPTER 8
196
Table 1. Peak assignation and linear retention indices (IT) of different carbohydrates detected in Kale extracts by
GC–MS.
Peak number Compound Assignation IT
1 Arabinose E and Z 1786 /1793
2 Ribose 1 and 2 1815/1818
3 Sorbitol 1976
4 Fructose 1 and 2 1983/1991
5 Galactose E and Z 2029/2058
6 Glucose E and Z 2040/2058
7 myo-Inositol 2128
8 Sucrose 2685
9 Maltose E and Z 2929/2947
10 Melibiose E and Z 3031/3076
11 Galactinol 3068
12 Diglycolsyl glycerol 3213
13 Raffinose 3499
Peak 11 showed a typical fragmentation pattern of cyclitol glycosides [23], based on the triplet
m/z ions 191/204/217 (characteristic of silylated pyranose rings), the m/z ions 305 and 318
(typical of cyclitols) and a low abundance of m/z ion 361 (related to glycosidic linkages).The
presence of myo-inositol as a free inositol suggests the assignment of this peak as glycosyl-
myo-inositol, which was confirmed positively as galactinol by comparing retention time and
mass spectrum with a standard.
Peak 12 was tentatively asssigned as diglycosyl-glycerol based on the presence of the specific
m/z ion at 337 [31]. Also, peak 13 was corroborated as raffinose.
This comprensive characterization has allowed the identification of ribose, galactose, maltose,
melibiose, myo-inositol and galactinol for the first time in this vegetable. For some of these
compounds such as melibiose and myo-inositol, bioactive effects have been describied. For
example, melibiose has been described to promote the calcium absorption in the intestines and
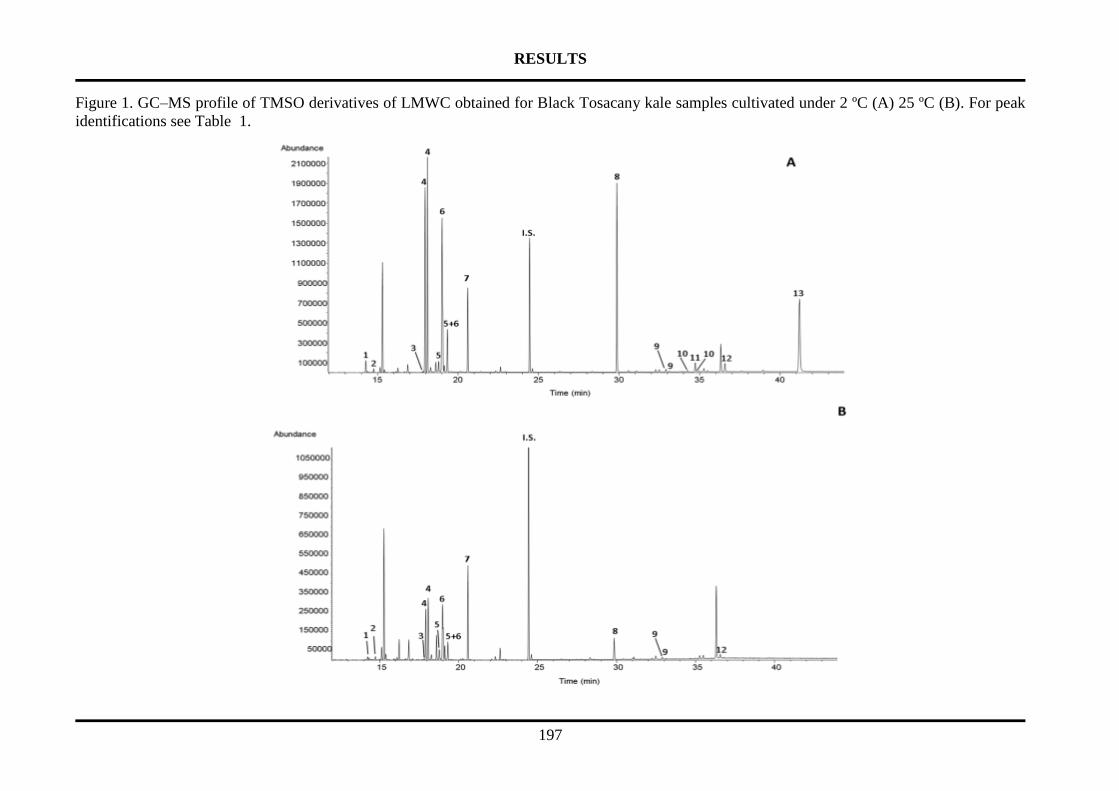
RESULTS
197
Figure 1. GC–MS profile of TMSO derivatives of LMWC obtained for Black Tosacany kale samples cultivated under 2 ºC (A) 25 ºC (B). For peak
identifications see Table 1.

CHAPTER 8
198
the improvement of the allergic disease symptoms [32, 33]. In the case of myo-inositol, this
compound has been used in the treatment of mental disorders [34].3.2. Quantitative analysis of
kale LMWC.
3.2.1. Set-up of LMWC determination of kale extract by HILIC-ESI-TOF MS
Figure 2 shows the extracted ion chromatogram profile (HILIC-ESI-TOF MS) of two different
kale carbohydrate extracts from plants grown at different temperatures (25°C and 2°C). Based
on the previous identification by GC-MS, the peak eluting at a retention time (tR) of 4.7 min,
with a molecular formula of the sodium adduct C5H10O5Na, could be assigned tentatively as a
mixture of arabinose and ribose.
Peaks at tR of 7.4 min and 9.6 min were assigned as fructose and glucose by comparison of the
tR and molecular formula with those of commercial standards. Under this condition, galactose
coelutes with glucose and the quantitative data shown for glucose in this manuscript correspond
to the glucose and galactose content. A peak eluting at 9.4 min, with a molecular formula of
C6H14O6Na, was tentatively assigned as sorbitol.
Regarding disaccharides, peaks eluting at 15.8 min, 18.4 min and 21.5 min were also identified
as sucrose, maltose and melibiose by comparison of the tR with those of commercial standards
and molecular formula. Two peaks eluting at tR of 19.7 min and 23.7 min were assigned as
unknown disaccharides according to the molecular formula.
Dihexosyl glycerol was tentatively identified as a peak eluting at 23 min based on molecular
formula C15H28O13Na and by comparison of the tR with the same compound determined
previously in a carbohydrate cocoa bean extract [35]. As regards trisaccharides, raffinose was
assigned to a peak eluting at 25.3 min based on the molecular formula and comparison of the
tR with the commercial standard. Other oligosaccharides such as 1-kestose previously reported
were not identified in the different extracts analyzed.

RESULTS
199
Figure 2. Extracted ion chromatograms obtained by HILIC-ESI-TOF MS of a kale carbohydrate extract from kale Black Tuscany grown under cold
temperatures during a period of 3 days corresponding to: A) 203.05 m/z ions, B) 365.10 m/z ions and C) 527.15 m/z ions. Peak numbers: 1) Fructose,
2) Glucose + galactose, 3) myo-Inositol, 4) sucrose, 5) maltose, 6) Melibiose, 7) Galactinol 8) Raffinose.
5 10 15 20 25 30 Time [min]
0.0
0.5
1.0
1.5
2.0
6x10
Intens.
1
2
3
4 5
6
7
8
b
3
ca

CHAPTER 8
200
In order to ensure the reproducibility of the method reported (extraction and chromatographic
separation) in the quantitation of the main LMWC in kale (fructose, glucose, sucrose, maltose,
melibiose, myo-inositol, raffionse and galactinol) different analytical parameters were
determined.
The different calibration curves employed showed suitable R2 values (ranging 0.97-0.99).
Regarding LOD and LOQ, values ranging from 0.26−1.5 μg mL−1 and 0.08−0.5 μg mL−1
respectively. In terms of chromatographic reproducibility, suitable RSD values were
determined for intra-day precision (ranging 3.1-6.6) and inter-day precision (ranging 4.5-10.1).
In terms of matrix effect, average recovery values close to 100% were determined, confirming
the absence of such effect in the LMWC quantitation.
Adequate RSD values of the samples randomly performed in duplicate (average RSD values in
the range of 6.8-13.4) and triplicate (average RSD values in the range of 4.3-14.9) were
determined in the assesment of the reproducibility of the method proposed (extraction
carbohydrates and chromatographic separation).
Overall, the different analytical parameters determined confirm the suitability of the method
reported for quantitation of LMWC in kale extract. In comparison to other chromatographic
methods employed for kale analyses, the HILIC-ESI-TOF MS method reported allows a better
chromatographic separation of the disaccharides, allowing the separation and quantification of
sucrose, maltose and melibiose, among other LMWC.
3.2.2. Quantitation of the main LMWC at different kale plant development stages
Table 2 lists the content (mg/g DM) of the main LMWC found in the different types of kale
cultivars and, respectively, at the different development stages (4, 5, 6, 7 and 8 weeks). The
wide variability observed for some of the LMWC measured could be explained by the intrinsic

RESULTS
201
variability of the individual plants. In view of the data determined in leaves of week 8, no
significant differences were observed between the three kale cultivars under study (Table 2).
Regarding the LMWC content in kale, glucose and fructose were the most abundant
carbohidrates in leaves collected at week 8 for all kale cultivars. The values determined for
these LMWC at week 8 were in the same order to the values determined previously in different
Brassica oleracea vegetables such as cauliflower, white cabbage and curly kale [15]. According
to Table 2, myo-inositol was the third most abundant compound. In comparison to the inositol
quantities reported previously in Brassica oleracea [15], the content determined for the three
cultivars was higher. The high content of myo-inositol in comparison to the low concentrations
determined for melibiose, maltose, raffinose and galactinol during the development of the plant
might be attributed to the role of this LMWC in the regulation of cell development and growth
[36].
With respect to the sucrose content, low levels were determined in the different stages of
development of the different kale cultivars. The absence of sucrose content in kale leaves was
previously reported in the extensive study of different kales reported by Thavarajah,
Thavarajah, Abare, Basnagala, Lacher, Smith and Combs [13].
In terms of the changes during plant development, fructose showed an increasing tendency in
Frostara kales, a bimodal tendency with a minimum value at week 7 in Black Tuscany kale and
stable values for Wild cabbage. A similar bimodal tendency was observed in the content of
fructose in leaves of Camellia sinensis [37].
Glucose showed a bimodal tendency with a minimum value at week 7 in Black Tuscany kale
and stable values for Wild cabbage and Frostara kale. myo-Inositol showed a bimodal tendency
with a minimum value at week 7 in Frostara and Black Tuscany kale and stable values for Wild
cabbage.

CHAPTER 8
202
Table 2. Concentration (mg/g DM) of the main LMWC analyzed by HILIC-ESI-TOF MS in three different kale cultivars during the development of
the plant (weeks 4-8). Data shown as mean and standard deviation (in brackets). F = Frostara kale, B = Black Tuscany kale, W = Wild cabbage.
Cultivar
LMWC (mg / g DM)
Time Fructose Glucose myo-Inositol Sucrose Melibiose Maltose Galactinol Raffinose
4 weeks
W 63.1 (22.7) 146.6 (84.8) 24.4 (6) 5.6 (4.9) 1.6 (1.1) 9.9 (8) 0.1 (0.1) 1.5 (1.4)
F 23.9 (4.8) 271.8 (167.7) 84.1 (43.6) 12.1 (11.1) 3 (1.9) 15.1 (8.7) 0.2 (0.2) 1.4 (1.2)
B 77.8 (4.2) 162.5 (7) 35.9 (5.7) 25.3 (59.3) 1.5 (0.8) 9 (5) 0 (0) 1.1 (1)
5 weeks
W 37.8 (11.1) 74.7 (36) 19.6 (6.5) 4.6 (4.1) 1.5 (1.3) 8.4 (7.7) 0.4 (0.4) 1.9 (2.1)
F 32.2 (15.6) 254.3 (248.6) 32.3 (3.6) 3.4 (3.1) 3.2 (2.9) 12.1 (8.7) 0.6 (0.7) 1.5 (1.7)
B 39.3 (21) 89.8 (30.6) 34.6 (5.8) 33.3 (87.9) 1.5 (0.9) 6 (2.8) 0 (0.1) 0.8 (0.7)
6 weeks
W 24.5 (6.5) 100.6 (25.8) 18.9 (1.9) 6.6 (5.9) 1.6 (0.7) 5.5 (1.5) 0.5 (0.4) 1.4 (1.3)
F 54.4 (17.3) 123.7 (37.6) 27.4 (10.6) 4.2 (3.7) 2.1 (0.4) 7.3 (3.9) 0.3 (0.3) 0.8 (0.7)
B 31.4 (20.3) 84.5 (17.7) 16.5 (2.5) 34.9 (94.5) 3.9 (4.3) 6.5 (1.3) 0.2 (0.3) 2 (1.7)
7 weeks
W 48.2 (7.3) 54.3 (26.3) 26.6 (1.8) 7.5 (9.8) 0.9 (1.3) 3.9 (5.9) 0.4 (0.6) 2.2 (3.8)
F 55 (15.1) 179.7 (114.9) 19.4 (7.5) 2.8 (3.6) 2.4 (1.6) 6 (5.3) 0.4 (0.4) 1.4 (1.4)
B 27.5 (12.7) 60.9 (9.8) 17.3 (5.6) 24.2 (95.7) 0.7 (0.5) 4.3 (3.2) 0.2 (0.1) 1.7 (1.4)
8 weeks
W 49.1 (29.3) 148.3 (81.1) 40.3 (23.4) 0 (0) 1.8 (0.9) 0.7 (1.1) 0 (0) 0 (0)
F 64.2 (25) 113.3 (38.9) 66.9 (35.3) 0 (0) 2.2 (0.8) 0.3 (0.5) 0 (0) 0 (0)
B 76.6 (36.2) 145.1 (27.1) 38.7 (19.2) 2 (125.8) 1.1 (0.5) 0.1 (0.2) 0 (0) 0 (0)

RESULTS
203
Overall, for the rest of LMWC under study (maltose, sucrose, melibiose, raffinose and
galactinol), these compunds showed stable values or a slight tendency to decrease in content
for all analyzed kale cultivars during the period of development studied. In the case of maltose,
the decreasing tendency during development was statistically significant for Black Tuscany
kale.
3.2.3. Quantitation of the main LMWC as consequence of cold acclimation
The LMWC content of the different kale leave samples collected at 0, 3, 7 and 11 days of
acclimation to cold temperature (2°C) and the respective controls at warm temperature (25°C)
is shown in Table 3. Overall, for the kale Frostara and Wild Cabbage cultivars, the content of
fructose, glucose, sucrose, melibiose, maltose, galactinol and raffinose was increased in
response to cold temperature acclimation. Under low temperature conditions, myo-inositol
content decreased in the different kale cultivars. With the exception of Black Tuscany kale, the
behaviour determined for some of the LMWC were in line with the data reported in studies of
cold temperature acclimation for Arabidopsis thaliana and sunflower seedlings, in which the
content of fructose, glucose, sucrose and raffinose were induced as a consequence of the
acclimation of the plant to cold temperatures [38, 39]. With respect to the increased content of
maltose in kale as a consequence to the response to cold acclimation, it might be attributed to
its protective role for proteins, membranes and the photosynthetic electron transport chain,
which has been demonstrated in Arabidopsis thaliana, another member of the Brassicaceae
family [40].

CHAPTER 8
204
Table 3. Concentration (mg/g DM) of the main LMWC analyzed by HILIC-ESI-TOF MS in three differents kale cultivars acclimated to cold and
warm temperatures. Data shown as mean and standard deviation (in brackets). F = Frostara kale, B = Black Tuscany kale, W = Wild cabbage.
Day Genotype Treatment LMWC (mg / g DM)
Fructose Glucose myo-Inositol Sucrose Melibiose Maltose Galactinol Raffinose
0
W 64.9 (27.9) 157.9 (47.5) 59.3 (22) 0 (0) 1.6 (0.4) 0.5 (0.8) 0 (0) 0 (0)
F 77 (17) 129.4 (36.2) 66.2 (35.6) 0 (0) 3.6 (0.1) 0.4 (0.8) 0.3 (0.6) 0 (0)
B 85.3 (22.8) 119.8 (64.1) 56.8 (28.6) 0.9 (1.5) 1.2 (0.3) 1.8 (0.9) 0 (0) 0 (0)
3
W Cold 264.4 (0.7) 342.9 (81.8) 18.3 (1.9) 0 (0) 7.8 (0.6) 13 (8) 1.2 (0.2) 5.5 (5.7)
Warm 79.4 (20.1) 216.3 (48.9) 83.8 (0.6) 0 (0) 2.4 (0.3) 0.2 (0.3) 0 (0) 0 (0)
F Cold 284.8 (137.9) 191.8 (57.8) 15.3 (5) 0.6 (0.9) 9.4 (1) 9.4 (2.7) 1.1 (0.1) 6.5 (1.2)
Warm 104.1 (17.4) 168.4 (4.5) 39.4 (42.6) 0 (0) 1.2 (0.7) 0 (0) 0 (0) 0 (0)
B Cold 65 (3.9) 101.6 (25) 18.3 (0.9) 0 (0) 4.9 (0.3) 2.7 (0.8) 1.6 (0.6) 9.2 (2.9)
Warm 80.3 (1.1) 178.3 (51.7) 11.9 (10) 3.1 (1.3) 0.5 (0.3) 0 (0) 0 (0) 0 (0)
7
W Cold 323.5 (25.5) 248.8 (6.4) 192.7 (22.7) 26.9 (18.5) 11.8 (0.4) 9.6 (2.1) 2.6 (1) 31.3 (21.7)
Warm 45.5 (20.5) 186.1 (70) 103 (37.3) 6.5 (4.7) 1.8 (0.2) 0 (0) 0 (0) 0 (0)
F Cold 300.4 (42) 349.9 (48) 24.6 (0.3) 8.2 (7.1) 13 (4.7) 8.1 (3.6) 4.4 (0.7) 39.7 (30.2)
Warm 55.7 (9.8) 119.9 (31.8) 45.2 (17.2) 0 (0) 0.5 (0.1) 0 (0) 0 (0) 0 (0)
B Cold 142.7 (8.5) 164.9 (17.1) 14.4 (4.3) 0.2 (0.3) 8.4 (1.5) 5.3 (0.5) 3.2 (0.3) 30.8 (5)
Warm 46.4 (22) 96.4 (40.7) 13.9 (6.2) 3 (0.8) 0 (0) 0 (0) 0 (0) 0 (0)
11
W Cold 451.8 (1.1) 369.3 (81.5) 23.8 (9.2) 3.8 (4.3) 11.6 (1) 8.2 (1.4) 4.1 (0.8) 66.9 (9.1)
Warm 33.2 (5.7) 141.2 (73.8) 68.2 (11.5) 0 (0) 1.4 (0.3) 0 (0) 0 (0) 0 (0)
F Cold 198.8 (8.7) 207.8 (46.4) 17.7 (0.7) 12.5 (8.9) 11.9 (0.4) 6.8 (3.6) 7 (1.2) 50 (26.3)
Warm 66.8 (4) 132.9 (2.1) 34.3 (6.4) 0 (0) 0.8 (0.1) 0 (0) 0 (0) 0 (0)
B Cold 71.5 (15) 100.2 (16) 17.5 (2.7) 5 (0.6) 6.6 (0.2) 4.4 (0.1) 5.5 (1.3) 48.4 (18.4)
Warm 76 (6.9) 145.6 (58.9) 34.6 (25.3) 2.6 (1.8) 0.6 (0.4) 0.4 (0.5) 0 (0) 0 (0)

RESULTS
205
The decrease in myo-inositol concentration can be explained either by its use as a precursor of
galactinol, compound that increased during cold temperature [41] or in the light of its role in
oxygen radical-scavening functions, since myo-inositol is a precursor in the synthesis of
ascorbate (vitamin C), one of the most effective plant antioxidants [42]. Ascorbate has been
shown previously to increase in cabbage in winter [43].
In addition to the radical-scavenging role of carbohydrates[44], Ito, Shimizu, Nakashima,
Miyasaka, and Ohdoi (2014) [45], reported the suppression of water absorption by roots in
plants exposed to low temperatures and the subsequent induction of soluble LMWC to protect
the plant from dehydration through their osmotic function. This freezing tolerance is a result of
the increment in carbohydrate content, hence increasing the overall molarity of dissolved
sugars, leading to an increase of freezing point depression as a colligative property.
The LMWC profile observed in kale leaves exposed to cold temperatures conforms to the
adaption mechanism to cold temperatures inferred in other plants, especially the related
Arabidopsis thaliana. Consequently, information on the genetic regulation of carbohydrate
synthesis and cold acclimation in this model species should be transferable to Brassica oleracea
to study the genetic basis of cultivar-dependent differences in carbohydrate synthesis in
response to low temperatures.
4. CONCLUSIONS
This study corroborates kale as a potentially good source of bioactive carbohydrates such as
inositols and α-GOS, boosting the high nutritional level of this vegetable. Considering the
potential positive effect on health, this vegetable could be recommended as a material for the
elaboration of other food items such as commercial tea.

CHAPTER 8
206
The information reported in LMWC using GC-MS has been shown to be complementary to the
data previously reported in literature. Additionally, different LMWC such as galactose, maltose,
melibiose have been reported for the first time in this vegetable.
The quantitative data reported for the main LMWC during development of kale plants
contribute to a better understanding of the metabolism of this vegetable. In addition, the changes
associated with LMWC content, consequence to the cold acclimation of the plant, might have
an impact on the sweetness of the vegetable. Consequently, we provide a scientific rationale for
the Northern German practice of harvesting kale following first frost. The results might open
new methodologies of crop production practice to obtain kales with better nutritional quality
and palatability. It also opens the path towards understanding the genetic variation in cold
acclimation in kales and related vegetables.
ACKNOWLEDGEMENTS
Authors would like to mention their gratitude to Dr Gorka Ruiz de Garibay for the valuable
discussions on the statistical analysis. Also, the authors would like to acknowledge to Anja
Müller for her assistance during the measurements.
The identification performed by GC-MS was supported by Ministerio de Economía, Industria
y Competitividad of Spain (project AGL2016-80475-R), by Comunidad de Madrid (Spain) and
European funding from FEDER program (S2013/ABI-3028 AVANSECAL-CM).

RESULTS
207
6. BIBLIOGRAPHY
[1] FAO, http://www.fao.org/faostat/en/#data/QC in, Rome, Italy, 2019.
[2] Albach D., Mageney V., Hahn C., Grünkohl – Ein zu wenig beachtetes Gemüse, FOOD-
LAB, 2/2017: 6-10 (2017).
[3] C. Hahn, A. Müller, N. Kuhnert, D. Albach, Diversity of Kale (Brassica oleracea var.
sabellica): Glucosinolate Content and Phylogenetic Relationships, J. Agric. Food Chem., 64
(2016) 3215-3225.
[4] D. Šamec, B. Urlić, B. Salopek-Sondi, Kale (Brassica oleracea var. acephala) as a
superfood: Review of the scientific evidence behind the statement, Crit. Rev. Food Sci. Nutr.,
(2018) 1-12.
[5] DESTATIS, Statistisches Bundesamt (ed.) : Erntemenge (Gemüse und Erdbeeren):
Bundesländer, Jahre, Gemüsearten auf dem Freiland. , in, 2019.
[6] Á.L.M. Gonçalves, M. Lemos, R. Niero, S.F. De Andrade, E.L. Maistro, Evaluation of the
genotoxic and antigenotoxic potential of Brassica oleracea L. var. acephala D.C. in different
cells of mice, Journal of Ethnopharmacology, 143 (2012) 740-745.
[7] B. Han, X. Li, T. Yu, Cruciferous vegetables consumption and the risk of ovarian cancer:
A meta-analysis of observational studies, Diagnostic Pathology, 9 (2014).
[8] S.Y. Kim, S. Yoon, S.M. Kwon, K.S. Park, Y.C. Lee-Kim, Kale Juice improves coronary
artery disease risk factors in hypercholesterolemic men, Biomedical and Environmental
Sciences, 21 (2008) 91-97.
[9] M. Lemos, J.R. Santin, L.C.K. Júnior, R. Niero, S.F.D. Andrade, Gastroprotective activity
of hydroalcoholic extract obtained from the leaves of Brassica oleracea var. acephala DC in
different animal models, Journal of Ethnopharmacology, 138 (2011) 503-507.
[10] USDA, https://ndb.nal.usda.gov/ndb/foods/show/11233, in, 2019.
[11] A. Becerra-Moreno, P.A. Alanís-Garza, J.L. Mora-Nieves, J.P. Mora-Mora, D.A. Jacobo-
Velázquez, Kale: An excellent source of vitamin C, pro-vitamin A, lutein and glucosinolates,
CYTA - Journal of Food, 12 (2014) 298-303.
[12] A.T. Dinkova-Kostova, R.V. Kostov, Glucosinolates and isothiocyanates in health and
disease, Trends in Molecular Medicine, 18 (2012) 337-347.
[13] D. Thavarajah, P. Thavarajah, A. Abare, S. Basnagala, C. Lacher, P. Smith, G.F. Combs,
Mineral micronutrient and prebiotic carbohydrate profiles of USA-grown kale (Brassica
oleracea L. var. acephala), Journal of Food Composition and Analysis, 52 (2016) 9-15.
[14] I. Pathirana, P. Thavarajah, N. Siva, A.N.K. Wickramasinghe, P. Smith, D. Thavarajah,
Moisture deficit effects on kale (Brassica oleracea L. var. acephala) biomass, mineral, and low
molecular weight carbohydrate concentrations, Scientia Horticulturae, 226 (2017) 216-222.
[15] J. Nilsson, K. Olsson, G. Engqvist, J. Ekvall, M. Olsson, M. Nyman, B. Åkesson, Variation
in the content of glucosinolates, hydroxycinnamic acids, carotenoids, total antioxidant capacity
and low-molecular-weight carbohydrates in Brassica vegetables, J. Sci. Food Agric., 86 (2006)
528-538.
[16] M. Roberfroid, G.R. Gibson, L. Hoyles, A.L. McCartney, R. Rastall, I. Rowland, D.
Wolvers, B. Watzl, H. Szajewska, B. Stahl, F. Guarner, F. Respondek, K. Whelan, V. Coxam,
M.J. Davicco, L. Léotoing, Y. Wittrant, N.M. Delzenne, P.D. Cani, A.M. Neyrinck, A.
Meheust, Prebiotic effects: Metabolic and health benefits, British Journal of Nutrition, 104
(2010) S1-S63.
[17] D. Ríos-Covián, P. Ruas-Madiedo, A. Margolles, M. Gueimonde, C.G. de los Reyes-
Gavilán, N. Salazar, Intestinal short chain fatty acids and their link with diet and human health,
Frontiers in Microbiology, 7 (2016) 185.
[18] A.L. Eveland, D.P. Jackson, Sugars, signalling, and plant development, Journal of
Experimental Botany, 63 (2012) 3367-3377.
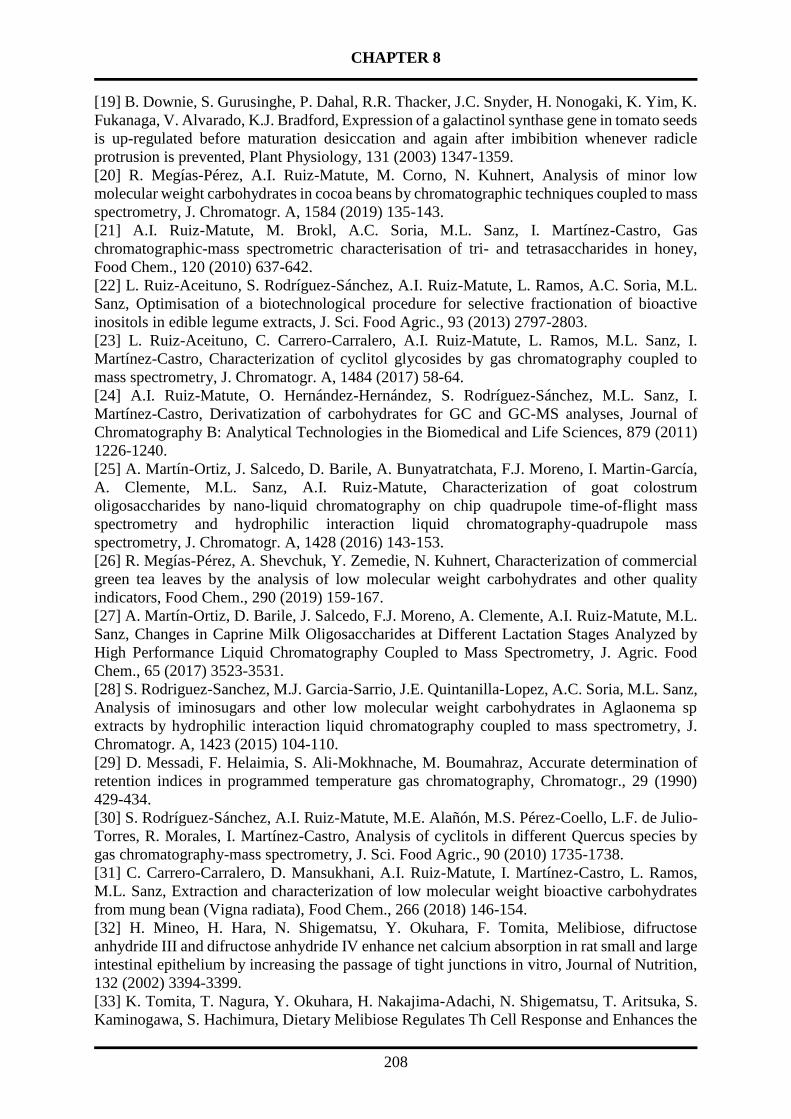
CHAPTER 8
208
[19] B. Downie, S. Gurusinghe, P. Dahal, R.R. Thacker, J.C. Snyder, H. Nonogaki, K. Yim, K.
Fukanaga, V. Alvarado, K.J. Bradford, Expression of a galactinol synthase gene in tomato seeds
is up-regulated before maturation desiccation and again after imbibition whenever radicle
protrusion is prevented, Plant Physiology, 131 (2003) 1347-1359.
[20] R. Megías-Pérez, A.I. Ruiz-Matute, M. Corno, N. Kuhnert, Analysis of minor low
molecular weight carbohydrates in cocoa beans by chromatographic techniques coupled to mass
spectrometry, J. Chromatogr. A, 1584 (2019) 135-143.
[21] A.I. Ruiz-Matute, M. Brokl, A.C. Soria, M.L. Sanz, I. Martínez-Castro, Gas
chromatographic-mass spectrometric characterisation of tri- and tetrasaccharides in honey,
Food Chem., 120 (2010) 637-642.
[22] L. Ruiz-Aceituno, S. Rodríguez-Sánchez, A.I. Ruiz-Matute, L. Ramos, A.C. Soria, M.L.
Sanz, Optimisation of a biotechnological procedure for selective fractionation of bioactive
inositols in edible legume extracts, J. Sci. Food Agric., 93 (2013) 2797-2803.
[23] L. Ruiz-Aceituno, C. Carrero-Carralero, A.I. Ruiz-Matute, L. Ramos, M.L. Sanz, I.
Martínez-Castro, Characterization of cyclitol glycosides by gas chromatography coupled to
mass spectrometry, J. Chromatogr. A, 1484 (2017) 58-64.
[24] A.I. Ruiz-Matute, O. Hernández-Hernández, S. Rodríguez-Sánchez, M.L. Sanz, I.
Martínez-Castro, Derivatization of carbohydrates for GC and GC-MS analyses, Journal of
Chromatography B: Analytical Technologies in the Biomedical and Life Sciences, 879 (2011)
1226-1240.
[25] A. Martín-Ortiz, J. Salcedo, D. Barile, A. Bunyatratchata, F.J. Moreno, I. Martin-García,
A. Clemente, M.L. Sanz, A.I. Ruiz-Matute, Characterization of goat colostrum
oligosaccharides by nano-liquid chromatography on chip quadrupole time-of-flight mass
spectrometry and hydrophilic interaction liquid chromatography-quadrupole mass
spectrometry, J. Chromatogr. A, 1428 (2016) 143-153.
[26] R. Megías-Pérez, A. Shevchuk, Y. Zemedie, N. Kuhnert, Characterization of commercial
green tea leaves by the analysis of low molecular weight carbohydrates and other quality
indicators, Food Chem., 290 (2019) 159-167.
[27] A. Martín-Ortiz, D. Barile, J. Salcedo, F.J. Moreno, A. Clemente, A.I. Ruiz-Matute, M.L.
Sanz, Changes in Caprine Milk Oligosaccharides at Different Lactation Stages Analyzed by
High Performance Liquid Chromatography Coupled to Mass Spectrometry, J. Agric. Food
Chem., 65 (2017) 3523-3531.
[28] S. Rodriguez-Sanchez, M.J. Garcia-Sarrio, J.E. Quintanilla-Lopez, A.C. Soria, M.L. Sanz,
Analysis of iminosugars and other low molecular weight carbohydrates in Aglaonema sp
extracts by hydrophilic interaction liquid chromatography coupled to mass spectrometry, J.
Chromatogr. A, 1423 (2015) 104-110.
[29] D. Messadi, F. Helaimia, S. Ali-Mokhnache, M. Boumahraz, Accurate determination of
retention indices in programmed temperature gas chromatography, Chromatogr., 29 (1990)
429-434.
[30] S. Rodríguez-Sánchez, A.I. Ruiz-Matute, M.E. Alañón, M.S. Pérez-Coello, L.F. de Julio-
Torres, R. Morales, I. Martínez-Castro, Analysis of cyclitols in different Quercus species by
gas chromatography-mass spectrometry, J. Sci. Food Agric., 90 (2010) 1735-1738.
[31] C. Carrero-Carralero, D. Mansukhani, A.I. Ruiz-Matute, I. Martínez-Castro, L. Ramos,
M.L. Sanz, Extraction and characterization of low molecular weight bioactive carbohydrates
from mung bean (Vigna radiata), Food Chem., 266 (2018) 146-154.
[32] H. Mineo, H. Hara, N. Shigematsu, Y. Okuhara, F. Tomita, Melibiose, difructose
anhydride III and difructose anhydride IV enhance net calcium absorption in rat small and large
intestinal epithelium by increasing the passage of tight junctions in vitro, Journal of Nutrition,
132 (2002) 3394-3399.
[33] K. Tomita, T. Nagura, Y. Okuhara, H. Nakajima-Adachi, N. Shigematsu, T. Aritsuka, S.
Kaminogawa, S. Hachimura, Dietary Melibiose Regulates Th Cell Response and Enhances the

RESULTS
209
Induction of Oral Tolerance, Bioscience, Biotechnology, and Biochemistry, 71 (2007) 2774-
2780.
[34] J. Benjamin, J. Levine, M. Fux, A. Aviv, D. Levy, R.H. Belmaker, Double-blind, placebo-
controlled, crossover trial of inositol treatment for panic disorder, American Journal of
Psychiatry, 152 (1995) 1084-1086.
[35] R. Megías-Pérez, S. Grimbs, R.N. D'Souza, H. Bernaert, N. Kuhnert, Profiling,
quantification and classification of cocoa beans based on chemometric analysis of
carbohydrates using hydrophilic interaction liquid chromatography coupled to mass
spectrometry, Food Chem., 258 (2018) 284-294.
[36] F.A. Loewus, M.W. Loewus, myo-Inositol: Its Biosynthesis and Metabolism, Annual
Review of Plant Physiology, 34 (1983) 137-161.
[37] S.K. Lin, J. Lin, Q.L. Liu, Y.F. Ai, Y.Q. Ke, C. Chen, Z.Y. Zhang, H. He, Time-course of
photosynthesis and non-structural carbon compounds in the leaves of tea plants (Camellia
sinensis L.) in response to deficit irrigation, Agricultural Water Management, 144 (2014) 98-
106.
[38] E.J. Landry, S.J. Fuchs, V.L. Bradley, R.C. Johnson, The effect of cold acclimation on the
low molecular weight carbohydrate composition of safflower, Heliyon, 3 (2017).
[39] J. Klotke, J. Kopka, N. Gatzke, A.G. Heyer, Impact of soluble sugar concentrations on the
acquisition of freezing tolerance in accessions of Arabidopsis thaliana with contrasting cold
adaptation - Evidence for a role of raffinose in cold acclimation, Plant, Cell and Environment,
27 (2004) 1395-1404.
[40] F. Kaplan, C.L. Guy, β-amylase induction and the protective role of maltose during
temperature shock, Plant Physiology, 135 (2004) 1674-1684.
[41] S. Sengupta, S. Mukherjee, P. Basak, A.L. Majumder, Significance of galactinol and
raffinose family oligosaccharide synthesis in plants, Front. Plant Sci:, 6 (2015).
[42] K.A. Lisko, R. Torres, R.S. Harris, M. Belisle, M.M. Vaughan, B. Jullian, B.I. Chevone,
P. Mendes, C.L. Nessler, A. Lorence, Elevating vitamin C content via overexpression of myo-
inositol oxygenase and l-gulono-1,4-lactone oxidase in Arabidopsis leads to enhanced biomass
and tolerance to abiotic stresses, In Vitro Cellular and Developmental Biology - Plant, 49 (2013)
643-655.
[43] C. Martinez-Villaluenga, E. Peñas, J. Frias, E. Ciska, J. Honke, M.K. Piskula, H.
Kozlowska, C. Vidal-Valverde, Influence of fermentation conditions on glucosinolates,
ascorbigen, and ascorbic acid content in white cabbage (Brassica oleracea var. capitata cv.
Taler) cultivated in different seasons, Journal of Food Science, 74 (2009) C62-C67.
[44] W. Van Den Ende, R. Valluru, Sucrose, sucrosyl oligosaccharides, and oxidative stress:
Scavenging and salvaging?, Journal of Experimental Botany, 60 (2009) 9-18.
[45] A. Ito, H. Shimizu, H. Nakashima, J. Miyasaka, K. Ohdoi, Effect of different durations of
root area chilling on the nutritional quality of Spinach, in: IFAC Proceedings Volumes (IFAC-
PapersOnline), 2014, pp. 4406-4410.


GENERAL CONCLUSIONS


GENERAL CONCLUSIONS
213
The different studies included in this thesis have led to the acquisition of new knowledge related
to qualitative and quantitative information about the LMWC profile in cocoa beans,
commercial green tea and kale, dietary foods of considerable economic interest and with health-
promoting properties.
The different health benefit aspects promoted by the different bioactive carbohydrates such as
cyclitols and α-galactooligosaccharides have been discussed in chapter 1. The different
analytical methodologies employed for LMWC analysis were also discussed in chapter 2. Each
of the chromatographic methods employed in the different chapters have been validated in
terms of precision, matrix effect, range of linearity, LOD and LOQ and reproducibility for
selected LMWC. The different studies included in this manuscript have led to the acquisition
of new knowledge related to qualitative and quantitative LMWC content ( mono-, di-,
oligosaccharides and cyclitols) of cocoa beans, commercial green tea and kale, enhancing the
perception of these dietary foods as functional food.
The employment of HILIC, using an amide column with binary mixtures of acetonitrile: water
and ammonium hydroxide or ammonium acetate as additives, has allowed the separation and
sensitive detection of different LMWC in the different dietary food analyzed in this thesis.
These characteristics make the different HILIC methods reported as suitable methods able to
be applied for quality control of natural products and other food ingredients containing inositols
and oligosaccharides.
The combination of GC ( technique suitable for the identification of LMWC due to its high-
resolution power and sensitivity) and HILIC ( technique adequate for quantification due to the
absence of tedious sample preparation, appropriate resolution, good peak shapes and easy
coupling to MS detectors) is a suitable approach for the detection and quantification of minor
LMWC.

GENERAL CONCLUSIONS
214
Chapters 4 and 5 contribute to cocoa science with the following points:
1. Identification of main LMWC groups in cocoa beans :
-monosaccharides: fructose, glucose, galactose.
-disaccharides: sucrose, melibiose,maltose, unknown disaccharides.
-oligosaccharides: 1-kestose, 6-kestose, raffinose, unknown trisaccharides.
-polyols: mannitol, alcohol of tri-pentose and alcohol of disaccharide.
-cyclitols: myo-inositol, scyllo-inositol and galactinol.
-iminosugars.
-dihexosyl glycerol.
2. The different chapters of the results have reported quantitative data not available in the
scientific literature regarding the LMWC composition (mono-, di- tri-, tetrasaccharides
and cyclitol) in a significant number of samples from different origins and fermentation
status.
3. The LMWC profile of cocoa beans captures information about the fermentation status.
The employment of chemometric tools has allowed the identification of different
indicators such as sucrose, melibiose, unknown disaccharides, raffinose and stachyose
to characterize unfermented cocoa beans. Conversely, mannitol has been proposed as a
clear indicator of fermentation in cocoa beans.
4. The LMWC profile of fermented cocoa beans reports information regarding the
fermentation procedure employed. The chemometric tools have reported the
identification of fermented samples characterized by a high content of disaccharides,
raffinose and stachyose, suggesting for this samples an incomplete fermentation either
due to the fermentation procedure (OF procedure) or the shorter period of fermentation
procedure.

GENERAL CONCLUSIONS
215
The results from chapter 6, focused on the LMWC changes during spontaneous fermentation,
indicated:
1. With respect to unfermented beans, the period of fermentation between 48h to 96h has
been identified to be critical to produce differences in the LMWC profile.
2. Except for fructose and glucose, the changes for each LMWC follow either a zero-order
or first-order kinetics.
3. A strong correlation has been determined between the pH of the bean and the content
of sucrose, raffinose and stachyose, among other LWMC.
The study of the LMWC changes during spontaneous fermentation can only be considered as
the starting point to further studies aiming to unravel multiple reactions, such as Maillard
reaction, occurring during the spontaneous cocoa bean fermentation.
Overall, the different studies developed in cocoa beans demonstrate remarkable diversity in the
LMWC profile of unfermented and fermented cocoa beans. In conjunction with other factors,
the diversity observed in the LMWC profile could be one of the factors involved in the diversity
of cocoa flavor from different origins.
The study of CGT (chapter 7) has provided novel data regarding the LMWC composition
(mono-, di- tri-, tetrasaccharides and cyclitols) in a significant number of CGT samples from
different origins and with different processing methods, which suppose a considerable
contribution to the tea science and the general interest for the consumers.
Also, the study on green tea has reported an innovative approach, combining four different
indicators such as LMWC, color parameters, soluble solids and antioxidant capacity, to
characterize CGT samples. The results showed the presence of two groups of samples. The
differences identified have been discussed based on the diversity of processing between the
different tea producing countries.

GENERAL CONCLUSIONS
216
The knowledge generated from the LMWC in CGT opens a window to further investigations
related to the influence of LMWC in thearubigin formation during the production of black tea
or the influence of controlled conditions during the green tea leaves processing to avoid loss of
valuable nutrients, like prebiotic carbohydrates.
The study of LMWC in kale (chapter 8) has lead to the identification of LMWC in kale for the
first time in literature, some of them with bioactivity properties. Also, the study reveals the
dependency of LMWC profile with the farming conditions. This dependency might be
considered as a starting point to control farming conditions with the objective of enhancing
bioactive LMWC content in this functional food.

SUPPLEMENTARY INFORMATION


SUPPLEMENTARY INFORMATION
219
Supplementary information of Chapter 4 “Profiling, quantification and classification of cocoa
beans based on chemometric analysis of carbohydrates using hydrophilic interaction liquid
chromatography coupled to mass spectrometry”.

SUPPLEMENTARY INFORMATION
220
1. Qualitative analysis.
Figure S1.1. HILIC-ESI-MS2 spectra of disaccharide (19.4) (peak 9) in positive ion mode.
Figure S1.2. HILIC-ESI-MS2 spectra of disaccharide (26.7) (peak 18) in positive ion mode.

SUPPLEMENTARY INFORMATION
221
Figure S1.3. HILIC-ESI-MS2 spectra of disaccharide (28.5) (peak 21) in positive ion mode.
Figure S1.4. HILIC-ESI-MS3 spectra of trisaccharide (22) (peak 12) in positive ion mode.

SUPPLEMENTARY INFORMATION
222
Figure S1.5. HILIC-ESI-MS3 spectra of trisaccharide (23.2) (peak 14) in positive ion mode.
Figure S1.6. HILIC-ESI-MS3 spectra of trisaccharide (24.8) (peak 16) in positive ion mode.

SUPPLEMENTARY INFORMATION
223
Figure S1.7. HILIC-ESI-MS3 spectra of trisaccharide (26.8) (peak 19) in positive ion mode.
Figure S1.8. HILIC-ESI-MS3 spectra of trisaccharide (27.4) (peak 20) in positive ion mode.
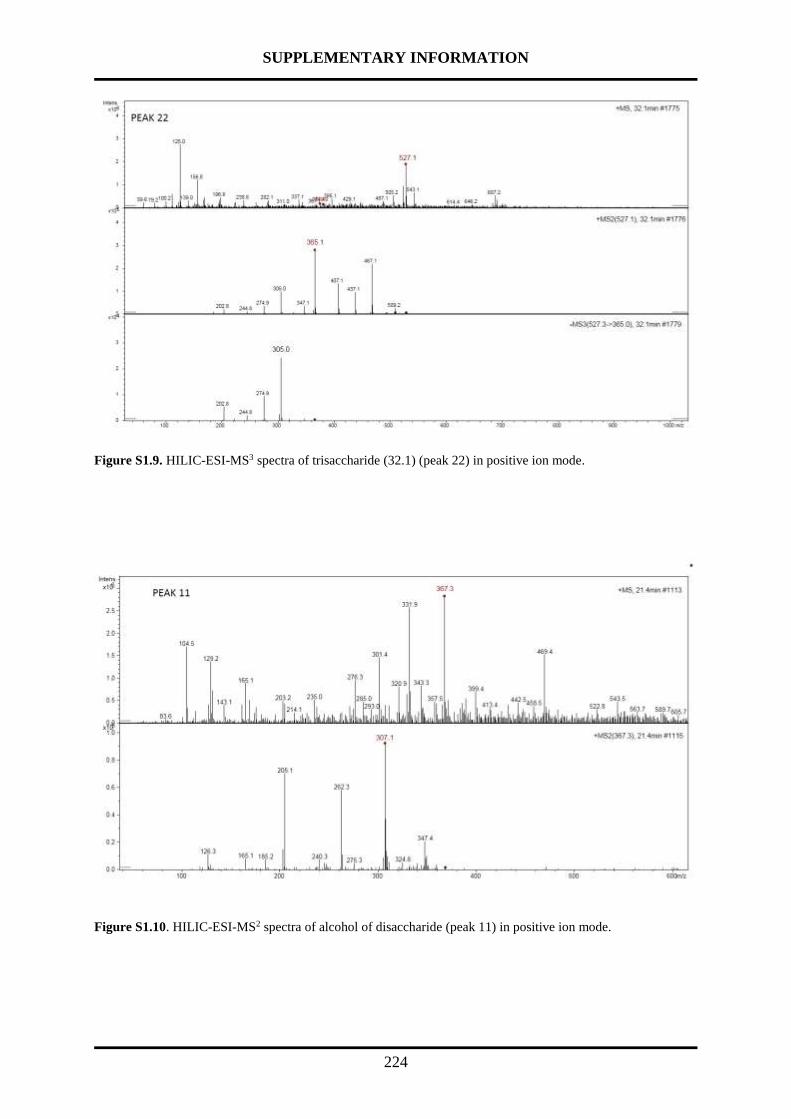
SUPPLEMENTARY INFORMATION
224
Figure S1.9. HILIC-ESI-MS3 spectra of trisaccharide (32.1) (peak 22) in positive ion mode.
Figure S1.10. HILIC-ESI-MS2 spectra of alcohol of disaccharide (peak 11) in positive ion mode.
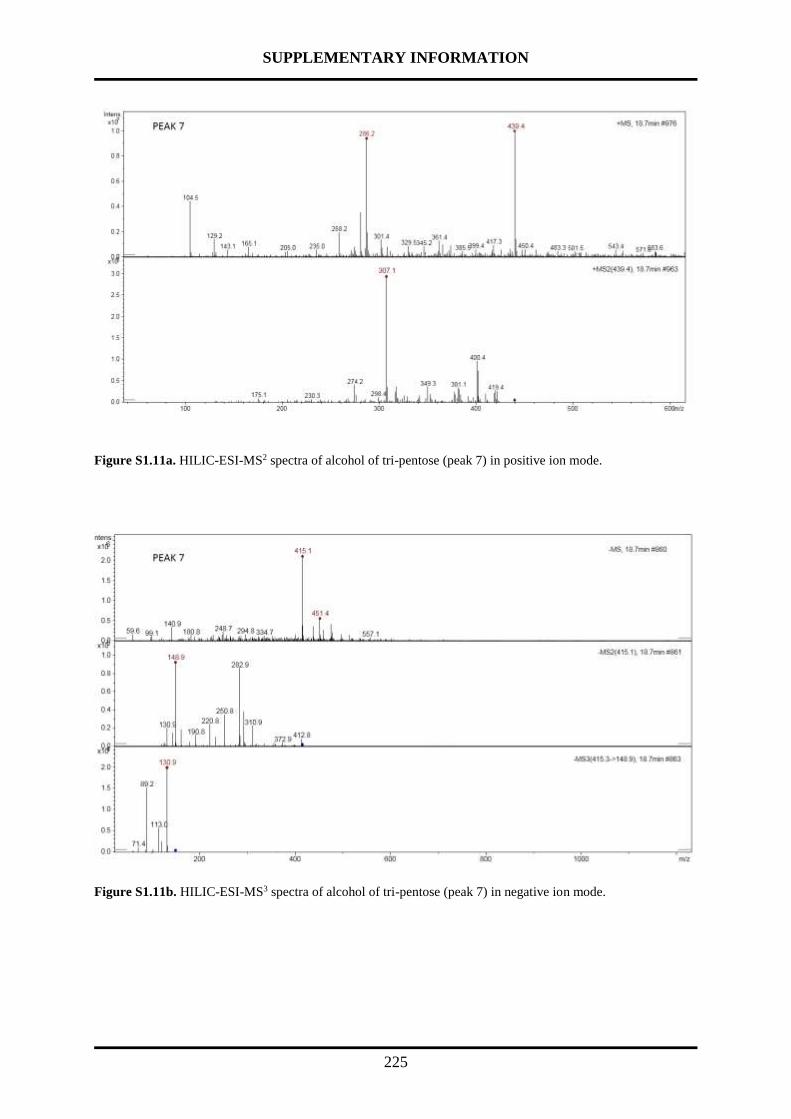
SUPPLEMENTARY INFORMATION
225
Figure S1.11a. HILIC-ESI-MS2 spectra of alcohol of tri-pentose (peak 7) in positive ion mode.
Figure S1.11b. HILIC-ESI-MS3 spectra of alcohol of tri-pentose (peak 7) in negative ion mode.

SUPPLEMENTARY INFORMATION
226
Figure S1.12. HILIC-ESI-MS3 spectra of dihexosyl glycerol (peak 15) in positive ion mode.
Figure S1.13. HILIC-ESI-MS2 spectra of pentosyl-iminosugar (peak 4) in positive ion mode.

SUPPLEMENTARY INFORMATION
227
Figure S1.14. HILIC-ESI-MS2 spectra of pentosyl-iminosugar (peak 5) in positive ion mode.
Figure S1.15. HILIC-ESI-MS3 spectra of glycosyl-iminosugar (peak 8) in positive ion mode.
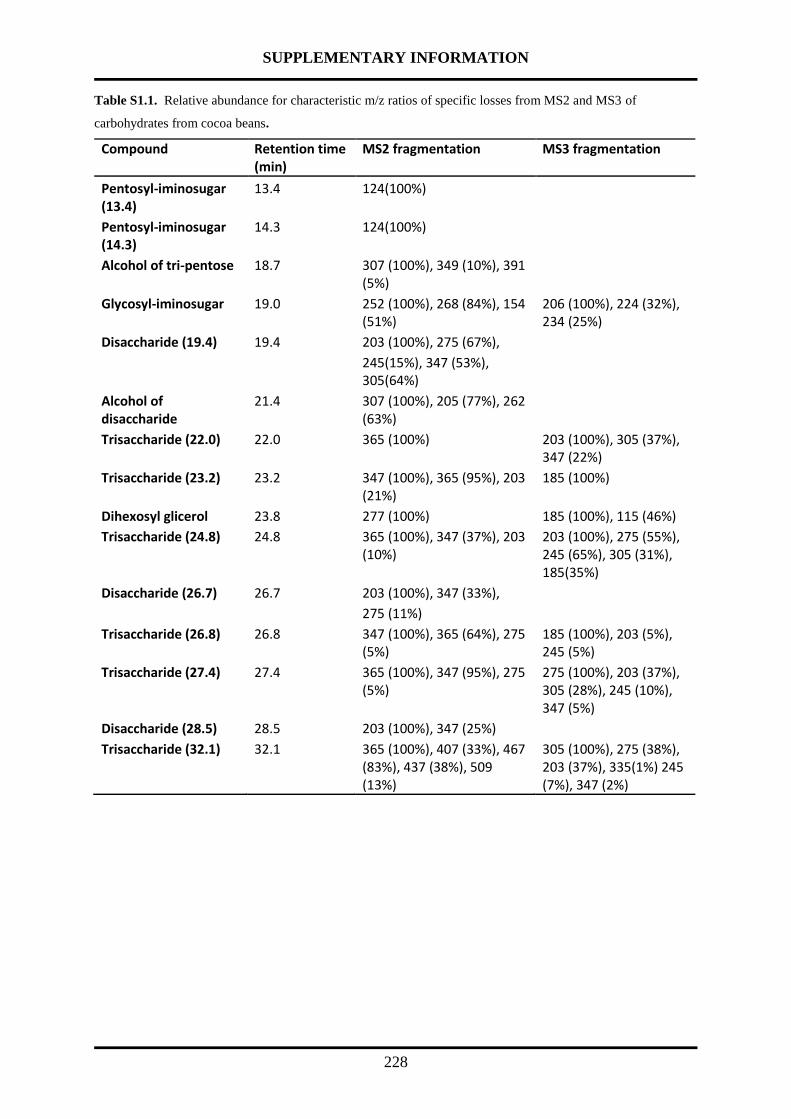
SUPPLEMENTARY INFORMATION
228
Table S1.1. Relative abundance for characteristic m/z ratios of specific losses from MS2 and MS3 of
carbohydrates from cocoa beans.
Compound Retention time (min)
MS2 fragmentation MS3 fragmentation
Pentosyl-iminosugar (13.4)
13.4 124(100%)
Pentosyl-iminosugar (14.3)
14.3 124(100%)
Alcohol of tri-pentose 18.7 307 (100%), 349 (10%), 391 (5%)
Glycosyl-iminosugar 19.0 252 (100%), 268 (84%), 154 (51%)
206 (100%), 224 (32%), 234 (25%)
Disaccharide (19.4) 19.4 203 (100%), 275 (67%),
245(15%), 347 (53%), 305(64%)
Alcohol of disaccharide
21.4 307 (100%), 205 (77%), 262 (63%)
Trisaccharide (22.0) 22.0 365 (100%) 203 (100%), 305 (37%), 347 (22%)
Trisaccharide (23.2) 23.2 347 (100%), 365 (95%), 203 (21%)
185 (100%)
Dihexosyl glicerol 23.8 277 (100%) 185 (100%), 115 (46%)
Trisaccharide (24.8) 24.8 365 (100%), 347 (37%), 203 (10%)
203 (100%), 275 (55%), 245 (65%), 305 (31%), 185(35%)
Disaccharide (26.7) 26.7 203 (100%), 347 (33%),
275 (11%)
Trisaccharide (26.8) 26.8 347 (100%), 365 (64%), 275 (5%)
185 (100%), 203 (5%), 245 (5%)
Trisaccharide (27.4) 27.4 365 (100%), 347 (95%), 275 (5%)
275 (100%), 203 (37%), 305 (28%), 245 (10%), 347 (5%)
Disaccharide (28.5) 28.5 203 (100%), 347 (25%)
Trisaccharide (32.1) 32.1 365 (100%), 407 (33%), 467 (83%), 437 (38%), 509 (13%)
305 (100%), 275 (38%), 203 (37%), 335(1%) 245 (7%), 347 (2%)

SUPPLEMENTARY INFORMATION
229
Table S1.2. Carbohydrates detected by HILIC-ESI-TOF MS in cacao beans.
Peak Number
Retention Time (min)
Formula Experimental mass
Theoretical mass
Error ppm
Compound Identified
Label
1 11.3 [C6H12O6Na]+ 203.0525 203.0526 0.8 Fructose
2 12.7 [C6H14O6Na]+ 205.0686 205.0683 3.3 Mannitol
3 13.0 [C6H12O6Na]+ 203.0534 203.0526 3.7 Glucose
4 13.4 [C11H14NO6]+ 256.0821 256.0816 2.1 Iminosugar Pentosyl-
iminosugar (13.4)
5 14.3 [C11H14NO6]+ 256.0822 256.0816 2.6 Iminosugar Pentosyl-
iminosugar (14.3)
6 16.9 [C12H26NO11]+ 360.1495 360.1500 2.2 Sucrose
7 18.7 [C15H28O13Na]+ 439.1421 439.1422 2.0 Alcohol of tri-
pentose
8 19.0 [C12H16NO7]+ 286.0924 286.0921 1.2 Iminosugar Glycosyl-
iminosugar
9 19.4 [C12H22O11Na]+ 365.1051 365.1054 1.8 Disaccharide Disaccharide (19.4)
10 20.1 [C6H12O6Na]+ 203.0535 203.0526 4.4 myo-inositol
11 21.4 [C12H24O11Na]+ 367.1207 367.1211 2.4 Alcohol of
disaccharide
12 22.0 [C18H32O16Na]+ 527.1582 527.1583 2.3 Trisaccharide Trisaccharide (22)
13 22.3 [C12H22O11Na]+ 365.1047 365.1054 2.1 Melibiose
14 23.2 [C18H32O16Na]+ 527.1587 527.1583 1.7 Trisaccharide Trisaccharide
(23.2)
15 23.8 [C15H28O13Na]+ 439.1417 439.1422 1.8 Dihexosyl glycerol
16 24.8 [C18H32O16Na]+ 527.1583 527.1583 0.5 Trisaccharide Trisaccharide
(24.8)
17 26.1 [C18H32O16Na]+ 527.1590 527.1583 1.4 Raffinose
18 26.7 [C12H22O11Na]+ 365.1048 365.1054 2.5 Disaccharide Disaccharide (26.7)
19 26.8 [C18H32O16Na]+ 527.1586 527.1583 1.0 Trisaccharide Trisaccharide
(26.8)
20 27.4 [C18H32O16Na]+ 527.1583 527.1583 0.6 Trisaccharide Trisaccharide
(27.4)
21 28.5 [C12H22O11Na]+ 365.1045 365.1054 2.5 Disaccharide Disaccharide (28.5)
22 32.1 [C18H32O16Na]+ 527.1576 527.1583 2.3 Trisaccharide Trisaccharide
(32.1)
23 35.0 [C24H46NO21]+ 684.2540 684.2557 2.5 Stachyose

SUPPLEMENTARY INFORMATION
230
2. Quantitative analysis
Table S2.1. Individual values of the recovery obtained after the addition of standard.
Compound % Recovery 1 % Recovery 2 Average
Fructose 93.5 94.6 94.0
Glucose 97.4 106.8 102.1
myo-Inositol 100.2 96.1 98.1
Mannitol 98.4 105.8 102.1
Sucrose 95.8 100.0 97.9
Melibiose 109.7 101.4 105.5
Raffinose 106.9 100.2 103.5
Stachyose 99.1 114.3 106.7

SUPPLEMENTARY INFORMATION
231
Table S2.2a. Values of RSD for each compound of samples performed per duplicate of sample preparation.
Sample Fructose Glucose Myo-inositol
Sucrose Raffinose Stachyose Mannitol Melibiose
V-U-3 0.3 7.5 7.5 5.9 7.8 14.0 0.0 0.0
V-F-5 5.6 15.1 22.1 8.7 15.9 12.6 12.6 0.0
I-F-5 7.7 0.0 0.1 7.9 6.8 9.6 4.6 0.0
I-F-8 16.0 0.0 0.0 12.5 7.7 10.0 11.6 0.0
B-F-1 8.4 9.0 2.1 0.0 0.1 7.9 10.6 8.5
B-U-1 9.7 13.3 8.3 0.4 0.5 0.3 0.0 0.1
M-U-1 7.0 5.1 6.2 6.5 0.1 5.0 0.0 0.0
M-F-3 5.6 2.4 9.8 9.6 0.0 11.7 5.6 0.0
E-PD-OF-3 7.3 4.8 2.8 4.8 7.5 1.4 9.0 12.0
E-F-3 6.0 3.8 5.8 0.0 6.1 3.0 1.7 14.3
E-PD-OF-2 3.5 0.5 3.7 20.0 10.2 0.5 14.7 15.5
E-U-2 14.6 18.6 0.3 6.9 5.2 10.7 0.0 0.0
E-U-3 6.2 3.1 3.4 0.3 7.0 3.7 0.0 0.0
E-U-4 4.5 1.5 5.3 18.1 3.0 9.2 0.0 12.2
E-U-5 12.0 2.1 5.8 9.8 0.5 13.9 0.0 13.6
E-U-6 2.4 6.3 5.9 5.3 5.9 5.0 0.0 0.0
E-U-7 5.6 2.2 4.4 3.9 16.6 21.9 0.0 0.0
E-PD-OF-4 6.1 4.1 0.0 12.3 0.1 3.4 2.9 14.8
Average 7.1 5.5 5.2 7.4 5.6 8.0 4.1 5.1
Sample code: L1-S1-N. (L1 = Country, S1: status of fermentation; N: number of sample). PD indicate samples obtained by pre-drying beans
L1 = V (Ivory Coast), B (Brazil), M (Malaysia), E (Ecuador)
S1= U (unfermented), F (Fermented)
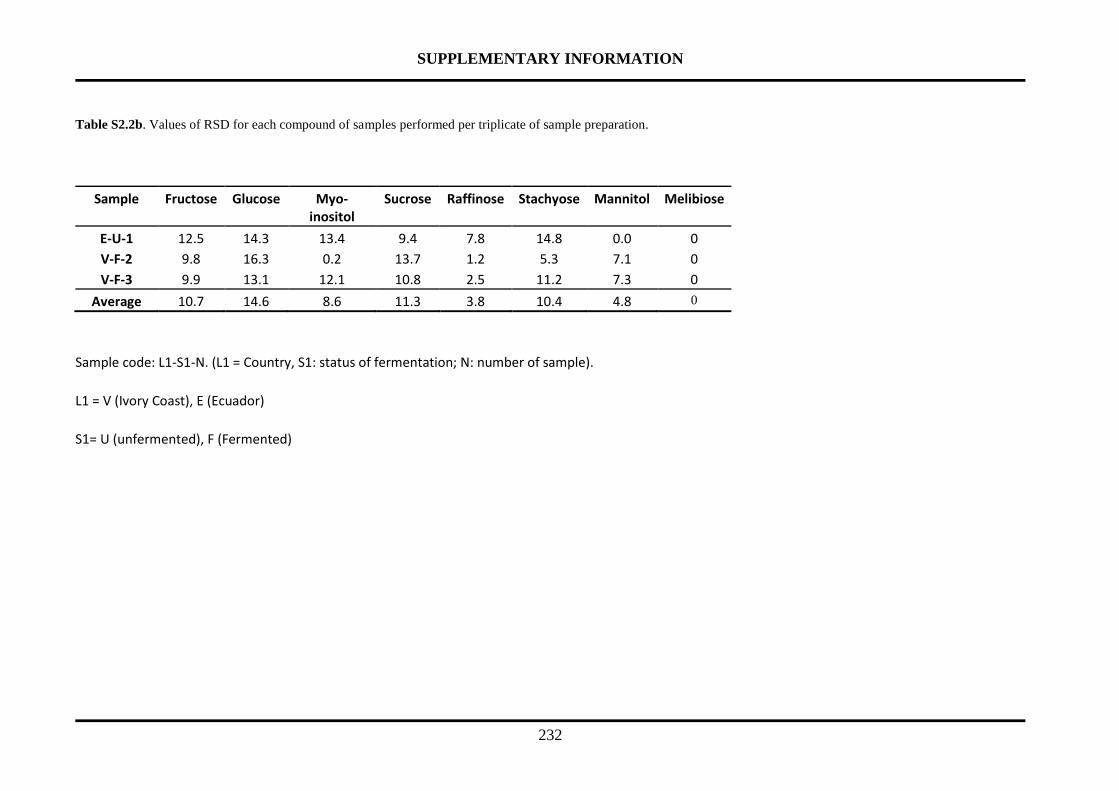
SUPPLEMENTARY INFORMATION
232
Table S2.2b. Values of RSD for each compound of samples performed per triplicate of sample preparation.
Sample Fructose Glucose Myo-inositol
Sucrose Raffinose Stachyose Mannitol Melibiose
E-U-1 12.5 14.3 13.4 9.4 7.8 14.8 0.0 0
V-F-2 9.8 16.3 0.2 13.7 1.2 5.3 7.1 0
V-F-3 9.9 13.1 12.1 10.8 2.5 11.2 7.3 0
Average 10.7 14.6 8.6 11.3 3.8 10.4 4.8 0
Sample code: L1-S1-N. (L1 = Country, S1: status of fermentation; N: number of sample).
L1 = V (Ivory Coast), E (Ecuador)
S1= U (unfermented), F (Fermented)

SUPPLEMENTARY INFORMATION
233
Table S2.3. Values of individual carbohydrates in unfermented samples (mg/100 g DM).
Sample Fructose Glucose Myo-inositol Sucrose Melibiose Raffinose Stachyose
V-1 32.6 75.2 112.6 328.3 16.4 366.4 130.7
V-2 27.1 43.9 96.6 230 0 408.5 100
V-3 36.3 ± 0.1 53.1 ± 4.0 121.2 ± 9.1 2317.7 ± 136.0 0 293.6 ± 22.8 103.6 ± 14.5
V-4 14.8 14.2 7.7 1345.8 0 114.9 79.9
V-5 22.1 13.1 17.3 1241.4 0 486 89.1
V-6 30.5 4.3 14.9 2634.6 0 313.7 150.6
V-7 58.4 16 19.3 611.7 0 531.5 106
V-8 86.3 50.8 85.5 735.5 22.7 201.1 172.3
T-5 49.2 103.6 55.1 1044.6 114.3 396.8 351
M-1 10.0 ± 0.7 25.4 ± 1.3 38.7 ± 2.4 3140.9 ± 204.5 0 782.6 ± 1.0 248.9 ± 12.4
M-2 15.6 37.5 29.7 4086.8 n.d. 543.7 158.7
M-3 11.3 24.2 24 1433.2 35.5 541.2 325.9
I-1 32.5 97.7 24.4 963.7 102.7 66.6 366.3
I-2 34.1 173.7 48.4 464.4 308.4 66.8 305.1
I-3 66.6 156.2 55.5 1851.3 201.2 760.2 41.3
I-4 32 81.5 61.9 1533 178.1 1392.6 353.7
E-1 21.6 ± 2.7 38.5 ± 5.5 43.6 ± 5.8 544.6 ± 51.2 0 762.5 ± 59.8 377.4 ± 55.5
E-2 40.3 ± 5.9 61.7 ± 11.5 51.6 ± 0.3 704.3 ± 48.5 0 577.6 ± 30.3 304.4 ± 32.5
E-3 70.6 ± 4.4 175.0 ± 5.4 74.0 ± 2.5 349.4 ± 1.1 0 270.2 ± 18.9 305.7 ± 11.2
E-4 73.3 ± 3.3 170.4 ± 2.5 47.3 ± 2.5 266.3 ± 48.3 16.4 ± 2.0 155.2 ± 4.7 232.1 ± 21.4
E-5 48.2 ± 5.8 56.9 ± 1.2 32.9 ± 1.9 310.3 ± 30.5 44.1 ± 6.0 131.8 ± 0.7 229.7 ± 32.0
E-6 103.4 ± 2.5 49.4 ± 3.1 65.6 ± 3.9 1037.1 ± 54.7 0 161.6 ± 9.6 201.0 ± 10.0
E-7 102.1 ± 5.7 171.3 ± 4.8 61.6 ± 2.7 536.1 ± 21.1 0 117.2 ± 19.5 179.3 ± 39.3
B-1 69.1 ± 6.7 94.1 ± 12.5 85.4 ± 7.1 265.0 ± 1.1 28.4 ± 0.0 149.7 ± 1.4 161.4 ± 0.3
Sample code: L1-N. (L1 = Country, N: number of sample). L1 = V (Ivory Coast), E (Ecuador), T (Tanzania), M (Malaysia), B (Brazil), Indonesia (I)

SUPPLEMENTARY INFORMATION
234
Table S2.4. Values of individual carbohydrates in fermented samples (mg/100 g DM).
Sample Fructose Glucose Myo-Inositol
Mannitol Sucrose Melibiose Raffinose Stachyose
V-2-S 191.7 ± 18.8 51.0 ± 8.3 84.7 ± 0.2 28.1 ± 2.0 48.2 ± 6.6 0 24.1 ± 0.3 22.8 ± 1.2
V-3-S 250.5 ± 24.8 104.8 ± 13.7 53.6 ± 6.5 43.6 ± 3.2 26.8 ± 2.9 0 20.2 ± 0.5 26.8 ± 3.0
V-5-S 296.4 ± 16.7 58.9 ± 8.9 58.5 ± 12.9 47.6 ± 6.0 50.6 ± 4.4 0 15.1 ± 2.4 17.8 ± 2.2
V-6-S 166.9 92.7 63.2 52.1 30 0 19.7 45.4
V-7-S 94.1 18.3 20.7 105 151.7 0 20.6 25.3
V-8-S 34.5 16.2 39.7 51.3 41.7 0 21.6 21.6
M-1-S 25.6 11.1 15.7 23.9 212.3 0 14.3 47
M-2-S 27.6 7.9 14.1 23.4 142.1 0 8.5 25.1
M-3-S 21.3 ± 1.2 4.1 ± 0.1 8.2 ± 0.8 17.8 ± 1.0 59.3 ± 5.7 0 12.4 ± 0.0 41.1 ± 4.8
I-1-S 23.7 3.6 12.5 28 67.2 18.3 22.9 80.4
I-2-S 21 0.8 25 15.7 6.9 12.4 18.2 57.3
I-5-S 33.6 ± 2.6 0 20.8 ± 0.0 28.2 ± 1.3 119.3 ± 9.4 0 25.0 ± 1.7 38.4 ± 3.7
I-6-S 36.9 1.7 0 39.7 43.3 0 0 20
I-7-S 10.3 2.4 12 15.9 1.1 0 12.5 36.7
I-8-S 24.4 ± 3.9 0 0 31.1 ± 3.6 0.8 ± 0.1 0 5.8 16 ± 1.6
I-9-S 29.5 34.5 29.2 55.9 17.8 0 29.8 4.6
E-1-S 24 31.4 13.2 18.5 39 4.1 14.8 52.6
E-2-S 37.8 41.5 24.6 7.5 53.7 16 16.3 29.1
E-3-S 46.5 ± 2.8 15.6 ± 0.6 75.7 ± 4.4 18.1 ± 0.3 0 9.1 ± 1.3 11.4 ± 0.7 13.5 ± 0.4
E-4-S 24.7 39.5 78.4 12.1 0 43.7 13.5 16.9
E-5-S 48.3 20.4 26.6 44.3 102.8 0 24.6 59.5
E-6-S 52.4 37.1 30.6 19.4 67.4 24.7 36.2 60.9
E-7-S 55.5 76.7 33.6 5.8 106 30.7 21.4 44
B-1-S 45.5 ± 3.8 36.7 ± 3.3 46.7 ± 1.0 8.5 ± 0.9 0 27.0 ± 2.3 21.5 ± 0.1 27.7 ± 2.2
T-1-S 18.7 1.4 10.4 32.2 39.8 0.1 9.7 40

SUPPLEMENTARY INFORMATION
235
Sample Fructose Glucose Myo-Inositol
Mannitol Sucrose Melibiose Raffinose Stachyose
T-2-CF 53.4 57.7 24.2 6 104.3 n.d. 41.2 40.6
T-3-CF 32.7 52.8 37 5.8 143.3 31.3 62.1 75.3
T-4-CF 22.9 23.7 13.4 8.3 184.5 3.6 27.3 82.5
E-1.PD 27.3 34 17.4 10 164.1 37.9 48.3 160
E-2-PD 64.5 ± 2.2 57.5 ± 0.3 75.2 ± 2.8 13.6 ± 2.0 42.5 ± 8.5 29.1 ± 4.5 48.8 ± 5.0 41.4 ± 0.2
E-3-PD 46.6 ± 3.4 59.8 ± 2.9 80.0 ± 2.2 8.9 ± 0.8 104.7 ± 5.0 75.6 ± 9.1 44.1 ± 3.3 71.5 ± 1.0
E-4-PD 61.1± 3.7 51.5 ± 2.1 n.d. 6.9 ± 0.2 37.5 ± 4.6 14.9 ± 2.2 2.0 ± 0.0 43.3 ± 1.5
Sample code: L1-N-P. (L1 = Country, N: number of sample, P: procedure of fermentation).
L1 = V (Ivory Coast), E (Ecuador), T (Tanzania), M (Malaysia), B (Brazil), Indonesia (I)
P = S (spontaneous fermentation), CF (controlled fermentation), PD (pre-drying beans).
n.d Not detected

SUPPLEMENTARY INFORMATION
236
3. Chemometric analysis.
Table S3.1. Values of PC loading from PCA unfermented/fermented.
p1 p2
Fructose 0.209201 -0.27659
Glucose 0.065397 -0.26476
Myo-Inositol 0.104152 -0.32901
Mannitol 0.216204 -0.09869
Pentosyl-Iminosugar (13.4) -0.08355 -0.24638
Pentosyl-Iminosugar (14.1) 0.079773 -0.24068
Sucrose -0.28744 -0.00855
Disaccharide (28.5) -0.33373 -0.00558
Disaccharide (26.7) -0.16042 -0.08887
Disaccharide (19.4) -0.30638 -0.01966
Melibiose -0.06266 -0.13047
Alcohol of disaccharide 0.07171 -0.35455
Alcohol of tri-pentose (18.7) -0.08148 -0.33099
Dihexosyl glycerol -0.33141 -0.0695
Raffinose -0.33949 -0.02683
Trisaccharide (23.2) -0.28115 -0.18294
Trisaccharide (24.9) -0.07093 -0.28825
Trisaccharide (22.0) -0.12158 -0.26569
Trisaccharide (26.8) -0.2084 -0.17864
Trisaccharide (27.5) 0.111468 -0.25558
Trisaccharide (32.1) 0.148909 -0.23949
Stachyose -0.29875 -0.0263
Glycosyl-Iminosugar 0.24595 -0.09019

SUPPLEMENTARY INFORMATION
237
Table S3.2. Values of PC loading from PCA of unfermented cocoa beans from different origins.
p1 p2
Fructose -0.24427 0.118709
Glucose -0.23615 0.191199
Myo-Inositol -0.06861 -0.17381
Pentosyl-Iminosugar (13.4) -0.02879 0.486568
Pentosyl-Iminosugar (14.1) -0.02471 0.427353
Sucrose 0.052454 0.467389
Disaccharide (28.5) 0.309259 0.050857
Disaccharide (26.7) 0.198153 0.016984
Disaccharide (19.4) 0.229401 0.054141
Melibiose 0.092381 -0.04547
Alcohol of disaccharide 0.219866 -0.00553
Alcohol of tri-pentose (18.7) 0.217001 0.1408
Dihexosyl glycerol 0.327431 0.030319
Raffinose 0.288638 0.088833
Trisaccharide (23.2) 0.324858 -0.04999
Trisaccharide (24.9) 0.266088 -0.23061
Trisaccharide (22.0) 0.238134 -0.14621
Trisaccharide (26.8) 0.267677 -0.11413
Trisaccharide (27.5) -0.03335 -0.02032
Trisaccharide (32.1) 0.003014 -0.0787
Stachyose 0.220048 0.323238
Glycosyl-Iminosugar 0.198523 0.208809

SUPPLEMENTARY INFORMATION
238
Table S3.3. Values of PC loading from PCA of fermented beans obtained by different fermentation procedure.
p1 p2
Fructose 0.259596 -0.06995
Glucose 0.239041 -0.19842
Myo-Inositol 0.215625 -0.32334
Mannitol 0.127401 0.071675
Pentosyl-Iminosugar (13.4) 0.284206 -0.05183
Pentosyl-Iminosugar (14.1) 0.196892 -0.0534
Sucrose 0.01308 0.34584
Disaccharide (28.5) 0.052493 -0.06129
Disaccharide (26.7) 0.002952 -0.46543
Disaccharide (19.4) 0.06009 -0.02438
Melibiose 0.024894 -0.3731
Alcohol of disaccharide 0.272252 -0.08556
Alcohol of tri-pentose (18.7) 0.255135 0.00553
Dihexosyl glycerol 0.255328 0.112325
Raffinose 0.196179 0.117537
Trisaccharide (23.2) 0.267125 0.196284
Trisaccharide (24.9) 0.278002 0.098071
Trisaccharide (22.0) 0.276293 0.145639
Trisaccharide (26.8) 0.284948 0.08442
Trisaccharide (27.5) 0.282278 0.096305
Trisaccharide (32.1) 0.177148 -0.3703
Stachyose -0.00638 0.269445
Glycosyl-Iminosugar 0.160835 0.177385
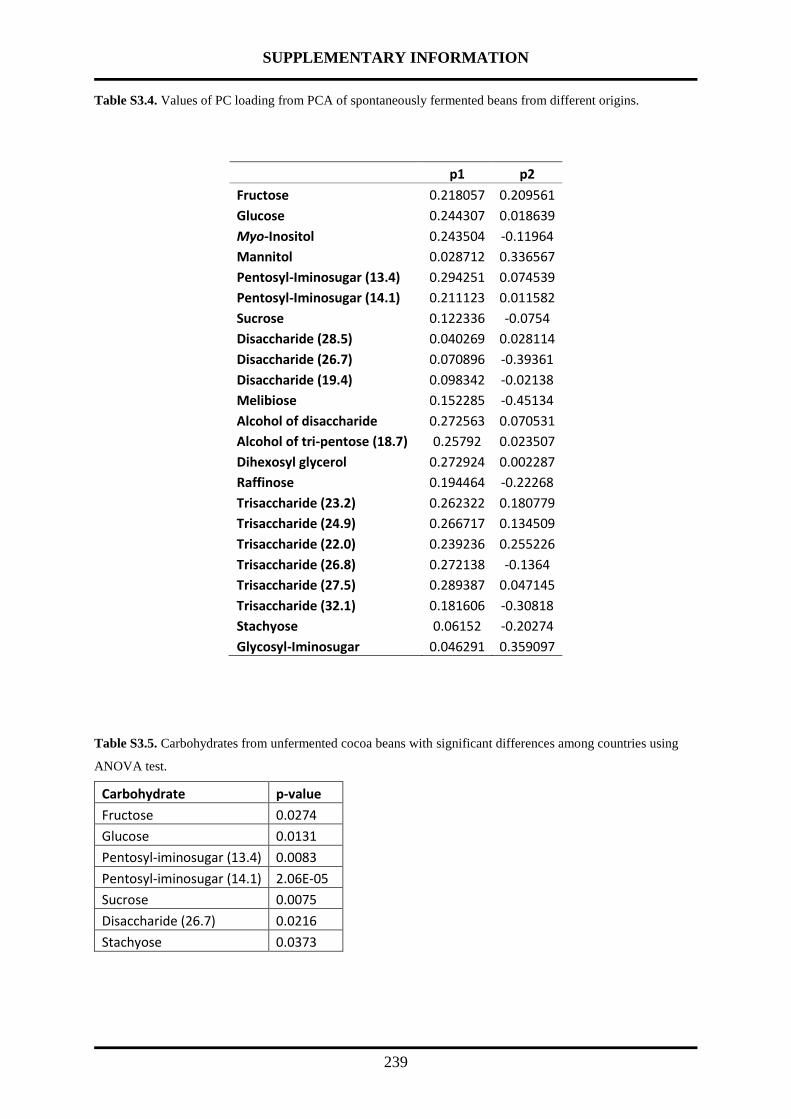
SUPPLEMENTARY INFORMATION
239
Table S3.4. Values of PC loading from PCA of spontaneously fermented beans from different origins.
p1 p2
Fructose 0.218057 0.209561
Glucose 0.244307 0.018639
Myo-Inositol 0.243504 -0.11964
Mannitol 0.028712 0.336567
Pentosyl-Iminosugar (13.4) 0.294251 0.074539
Pentosyl-Iminosugar (14.1) 0.211123 0.011582
Sucrose 0.122336 -0.0754
Disaccharide (28.5) 0.040269 0.028114
Disaccharide (26.7) 0.070896 -0.39361
Disaccharide (19.4) 0.098342 -0.02138
Melibiose 0.152285 -0.45134
Alcohol of disaccharide 0.272563 0.070531
Alcohol of tri-pentose (18.7) 0.25792 0.023507
Dihexosyl glycerol 0.272924 0.002287
Raffinose 0.194464 -0.22268
Trisaccharide (23.2) 0.262322 0.180779
Trisaccharide (24.9) 0.266717 0.134509
Trisaccharide (22.0) 0.239236 0.255226
Trisaccharide (26.8) 0.272138 -0.1364
Trisaccharide (27.5) 0.289387 0.047145
Trisaccharide (32.1) 0.181606 -0.30818
Stachyose 0.06152 -0.20274
Glycosyl-Iminosugar 0.046291 0.359097
Table S3.5. Carbohydrates from unfermented cocoa beans with significant differences among countries using
ANOVA test.
Carbohydrate p-value
Fructose 0.0274
Glucose 0.0131
Pentosyl-iminosugar (13.4) 0.0083
Pentosyl-iminosugar (14.1) 2.06E-05
Sucrose 0.0075
Disaccharide (26.7) 0.0216
Stachyose 0.0373

SUPPLEMENTARY INFORMATION
240
Table S3.6. Carbohydrates from spontaneously fermented cocoa beans with significant differences among
countries using ANOVA test.
Carbohydrate p-value
Mannitol 0.0024
Pentosyl-iminosugar (13.4) 0.0006
Alcohol of disaccharide 0.0446
Melibiose 0.0005
Alcohol of tri-pentose 0.0013
Dihexosyl glycerol 0.0018
Trisaccharide (22.0) 0.0032
Trisaccharide (23.2) 8.11E-06
Trisaccharide (24.8) 0.0003
Disaccharide (26.7) 0.0167
Trisaccharide (26.8) 0.0008
Trisaccharide (27.4) 0.0007
Table S3.7. Values of t-test and p-values of the different carbohydrates considered markers of the fermentation
process performed.
Carbohydrate t-statistic p-value
Myo-inositol 2.596 0.013
Mannitol -3.017 0.004
Sucrose 6.031 3.3E-007
Disaccharide (26.7) 2.148 0.037
Melibiose 4.590 3.8E-005
Alcohol of tripentoside (18.7) 3.265 0.002
Dihexosyl glycerol 2.364 0.023
Trisaccharide (23.2) 1.971 0.055
Trisaccharide (26.8) 4.479 5.4E-005
Trisaccharide (27.5) 3.086 0.004
Trisaccharide (32.1) 2.728 0.009
Stachyose 3.531 0.001
Glucosyl-iminosugar -2.836 0.007

SUPPLEMENTARY INFORMATION
241
Table S3.8. Carbohydrates from fermented beans with significant differences among the number of days passes
of fermentation.
Carbohydrate p-value
Fructose 0.0902
Mannitol 0.0012
sucrose 0.0804
Disaccharide 26.7 0.0035
Disaccharide 19.4 0.0441
Melibiose 8.96E-06
Raffinose 0.0022
trisaccharide 32.1 0.0174
stachyose 0.0117
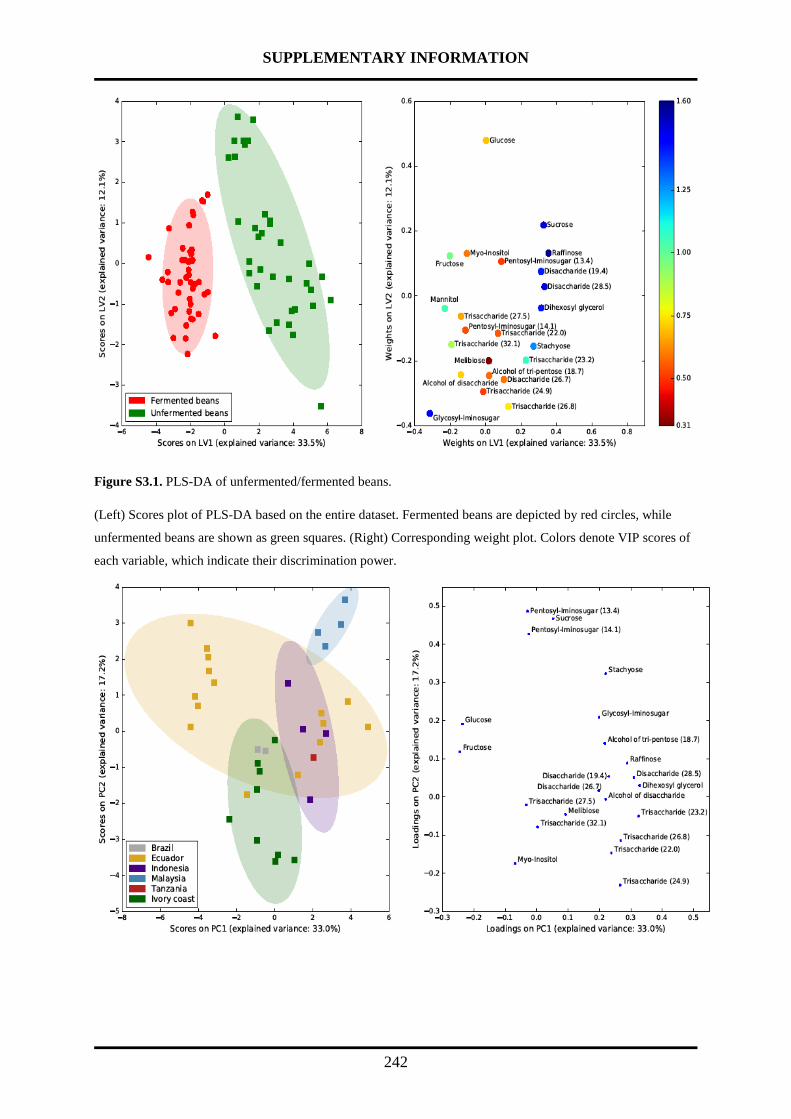
SUPPLEMENTARY INFORMATION
242
Figure S3.1. PLS-DA of unfermented/fermented beans.
(Left) Scores plot of PLS-DA based on the entire dataset. Fermented beans are depicted by red circles, while
unfermented beans are shown as green squares. (Right) Corresponding weight plot. Colors denote VIP scores of
each variable, which indicate their discrimination power.

SUPPLEMENTARY INFORMATION
243
Figure S3.2. PCA score (left) and loading plot (right) of unfermented beans. Beans are color coded according to
their origin.
Figure S3.3. PCA score (left) and loading plot (right) of fermented beans. Beans are color coded according to
their origin.
Figure S3.4. PCA of fermented beans obtained by different procedure. Triangle: fermented samples performed
by controlled fermentation. Square: fermented samples carry out by pre-drying the beans.

SUPPLEMENTARY INFORMATION
245
Supplementary information of Chapter 5 “Analysis of minor low molecular weight
carbohydrates in cocoa beans by chromatographic techniques coupled to mass spectrometry”
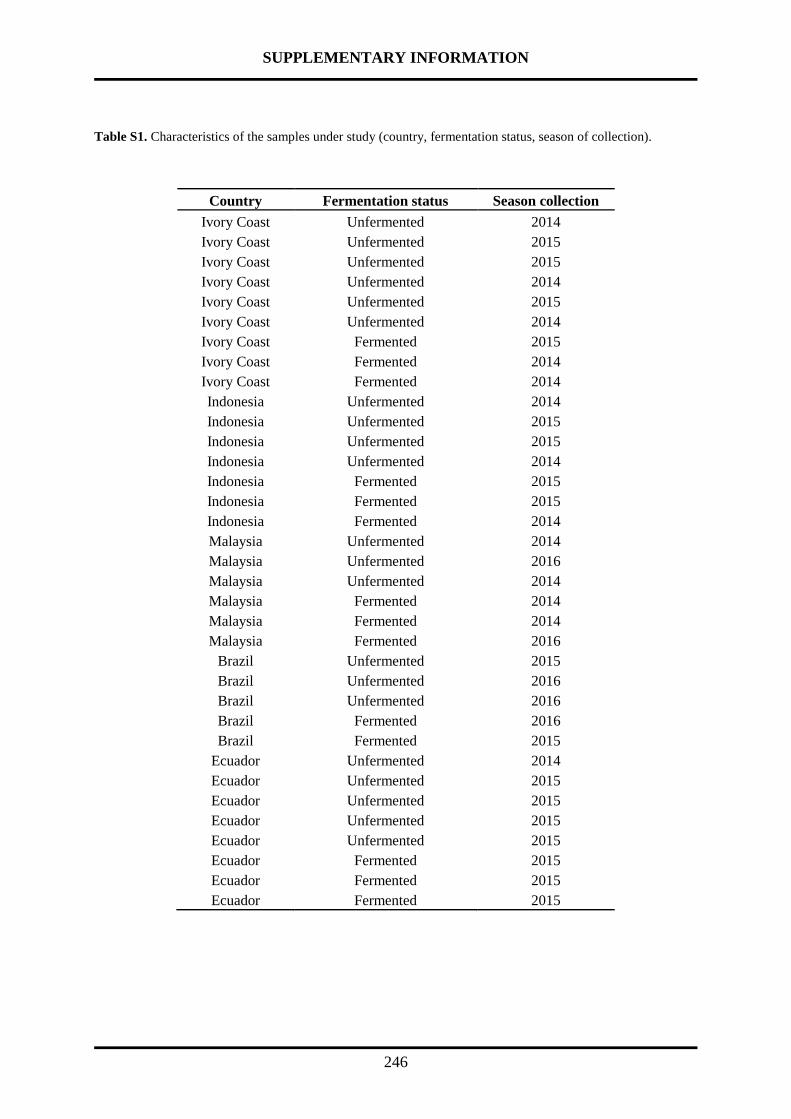
SUPPLEMENTARY INFORMATION
246
Table S1. Characteristics of the samples under study (country, fermentation status, season of collection).
Country Fermentation status Season collection
Ivory Coast Unfermented 2014
Ivory Coast Unfermented 2015
Ivory Coast Unfermented 2015
Ivory Coast Unfermented 2014
Ivory Coast Unfermented 2015
Ivory Coast Unfermented 2014
Ivory Coast Fermented 2015
Ivory Coast Fermented 2014
Ivory Coast Fermented 2014
Indonesia Unfermented 2014
Indonesia Unfermented 2015
Indonesia Unfermented 2015
Indonesia Unfermented 2014
Indonesia Fermented 2015
Indonesia Fermented 2015
Indonesia Fermented 2014
Malaysia Unfermented 2014
Malaysia Unfermented 2016
Malaysia Unfermented 2014
Malaysia Fermented 2014
Malaysia Fermented 2014
Malaysia Fermented 2016
Brazil Unfermented 2015
Brazil Unfermented 2016
Brazil Unfermented 2016
Brazil Fermented 2016
Brazil Fermented 2015
Ecuador Unfermented 2014
Ecuador Unfermented 2015
Ecuador Unfermented 2015
Ecuador Unfermented 2015
Ecuador Unfermented 2015
Ecuador Fermented 2015
Ecuador Fermented 2015
Ecuador Fermented 2015
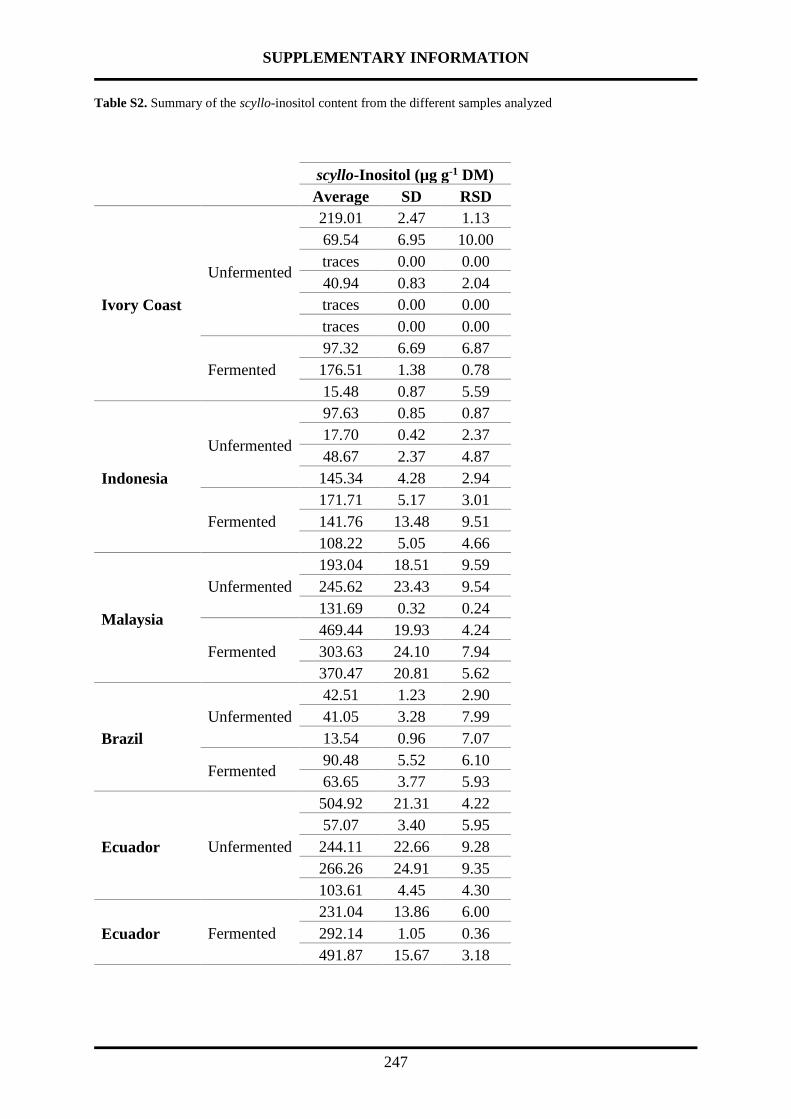
SUPPLEMENTARY INFORMATION
247
Table S2. Summary of the scyllo-inositol content from the different samples analyzed
scyllo-Inositol (µg g-1 DM)
Average SD RSD
Ivory Coast
Unfermented
219.01 2.47 1.13
69.54 6.95 10.00
traces 0.00 0.00
40.94 0.83 2.04
traces 0.00 0.00
traces 0.00 0.00
Fermented
97.32 6.69 6.87
176.51 1.38 0.78
15.48 0.87 5.59
Indonesia
Unfermented
97.63 0.85 0.87
17.70 0.42 2.37
48.67 2.37 4.87
145.34 4.28 2.94
Fermented
171.71 5.17 3.01
141.76 13.48 9.51
108.22 5.05 4.66
Malaysia
Unfermented
193.04 18.51 9.59
245.62 23.43 9.54
131.69 0.32 0.24
Fermented
469.44 19.93 4.24
303.63 24.10 7.94
370.47 20.81 5.62
Brazil
Unfermented
42.51 1.23 2.90
41.05 3.28 7.99
13.54 0.96 7.07
Fermented 90.48 5.52 6.10
63.65 3.77 5.93
Ecuador Unfermented
504.92 21.31 4.22
57.07 3.40 5.95
244.11 22.66 9.28
266.26 24.91 9.35
103.61 4.45 4.30
Ecuador Fermented
231.04 13.86 6.00
292.14 1.05 0.36
491.87 15.67 3.18

SUPPLEMENTARY INFORMATION
248
Table S3. Summary of the galactinol content from the different samples analyzed
Galactinol (µg g-1 DM)
Average SD RSD
Ivory
Coast
Unfermented
361.52 14.15 3.91
525.08 47.95 9.13
1083.57 91.94 8.48
537.58 38.25 7.12
1970.40 160.52 8.15
1608.51 61.03 3.79
Fermented
0.00 0.00 0.00
0.00 0.00 0.00
0.00 0.00 0.00
Indonesia
Unfermented
11.85 0.48 4.01
8.59 0.69 7.99
16.00 2.32 14.53
10.88 0.85 7.78
Fermented
0.00 0.00 0.00
0.00 0.00 0.00
0.00 0.00 0.00
Malaysia
Unfermented
789.05 29.22 3.70
196.70 17.99 9.14
163.65 8.38 5.12
Fermented
0.00 0.00 0.00
0.00 0.00 0.00
0.00 0.00 0.00
Brazil
Unfermented
27.98 2.06 7.36
141.81 7.39 5.21
traces 0.00 0.00
Fermented 0.00 0.00 0.00
0.00 0.00 0.00
Ecuador
Unfermented
150.57 11.61 7.71
430.15 15.92 3.70
506.56 9.46 1.87
128.74 8.81 6.84
1770.11 31.92 1.80
Fermented
0.00 0.00 0.00
0.00 0.00 0.00
0.00 0.00 0.00

SUPPLEMENTARY INFORMATION
249
Table S4. Summary of the 1-kestose content from the different samples analyzed
1-kestose (µg g-1 DM)
Average SD RSD
Ivory Coast
Unfermented
88.49 1.37 1.55
127.91 5.80 4.53
103.11 9.07 8.80
114.82 6.88 5.99
73.17 5.72 7.82
99.56 3.98 4.00
Fermented
70.76 6.04 8.53
75.75 7.00 9.24
16.05 1.55 9.64
Indonesia
Unfermented
133.49 10.88 8.15
68.49 0.24 0.35
59.60 5.36 9.00
36.13 3.59 9.94
Fermented
115.47 4.55 3.94
30.61 1.66 5.41
traces 0.00 0.00
Malaysia
Unfermented
123.60 5.06 4.09
93.01 7.93 8.52
48.22 4.45 9.23
Fermented
32.06 2.89 9.03
traces 0.00 0.00
73.07 8.18 11.19
Brazil
Unfermented
112.35 2.92 2.60
76.06 5.29 6.96
90.27 1.24 1.37
Fermented 29.86 0.79 2.63
traces 0.00 0.00
Ecuador Unfermented
79.60 1.01 1.27
56.97 1.63 2.87
87.42 4.78 5.47
92.56 1.84 1.99
108.36 9.81 9.06
Ecuador Fermented
traces 0.00 0.00
32.95 2.96 8.99
traces 0.00 0.00
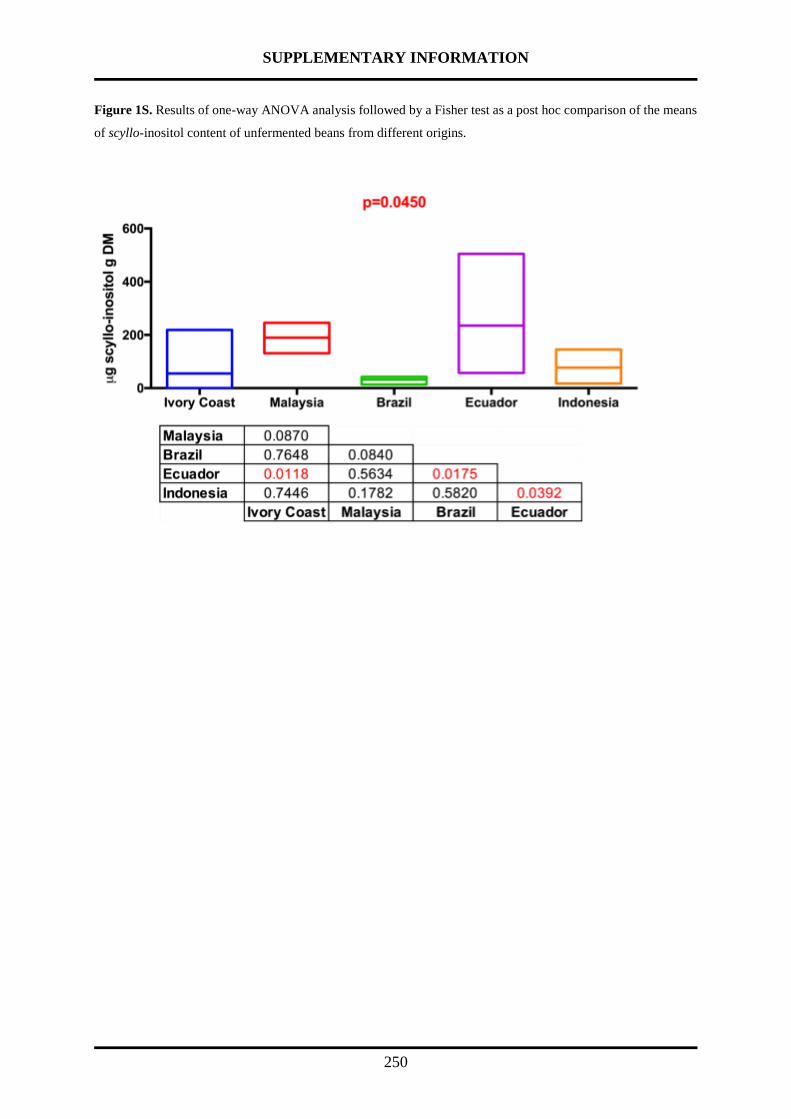
SUPPLEMENTARY INFORMATION
250
Figure 1S. Results of one-way ANOVA analysis followed by a Fisher test as a post hoc comparison of the means
of scyllo-inositol content of unfermented beans from different origins.

SUPPLEMENTARY INFORMATION
251
Figure 2S. Results of t-test and graphic representation of the quantities of scyllo-inositol between
unfermented/fermented for each country.

SUPPLEMENTARY INFORMATION
252
Figure 3S. Results of one-way ANOVA analysis followed by a Fisher test as a post hoc comparison of the
means of scyllo-inositol content of fermented beans from different origins.

SUPPLEMENTARY INFORMATION
253
Figure 4S. Results of t-test and graphic representation of the quantities of 1-kestose between
unfermented/fermented for each country.


SUPPLEMENTARY INFORMATION
255
Supplementary information of Chapter 6 “Monitoring the changes of low molecular weight
carbohydrates in cocoa beans during spontaneous fermentation: a chemometric and kinetic
approach”
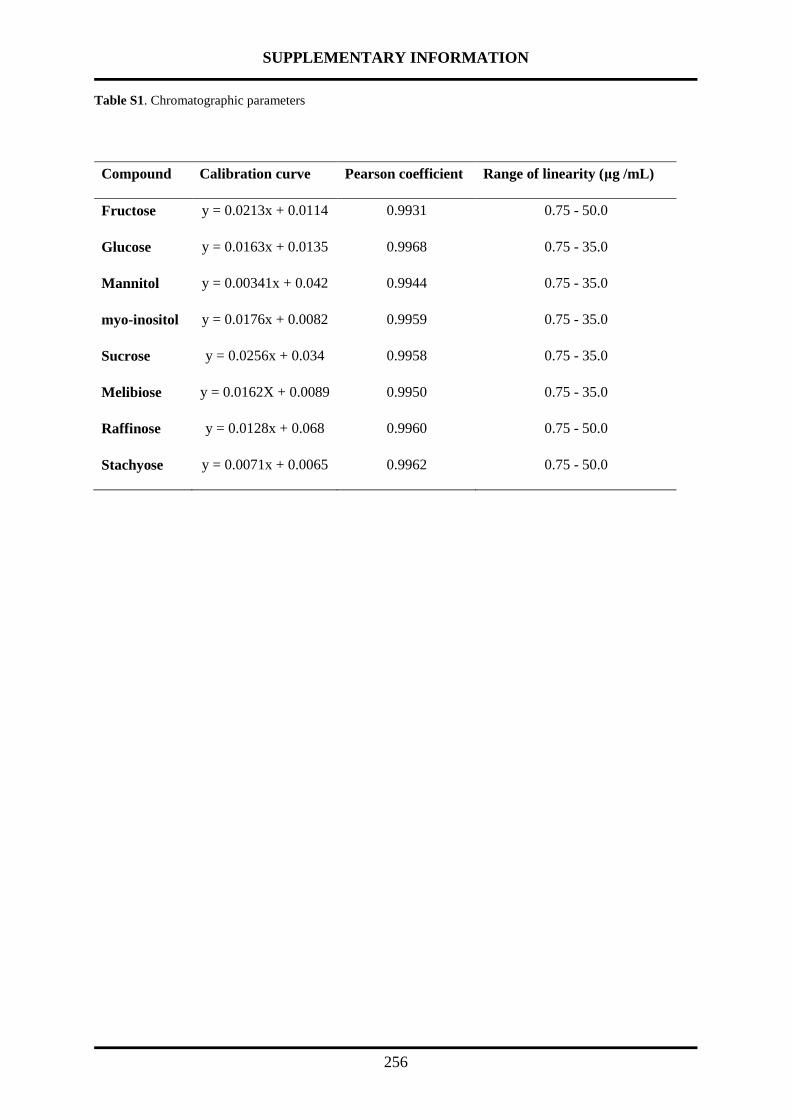
SUPPLEMENTARY INFORMATION
256
Table S1. Chromatographic parameters
Compound Calibration curve Pearson coefficient Range of linearity (μg /mL)
Fructose y = 0.0213x + 0.0114 0.9931 0.75 - 50.0
Glucose y = 0.0163x + 0.0135 0.9968 0.75 - 35.0
Mannitol y = 0.00341x + 0.042 0.9944 0.75 - 35.0
myo-inositol y = 0.0176x + 0.0082 0.9959 0.75 - 35.0
Sucrose y = 0.0256x + 0.034 0.9958 0.75 - 35.0
Melibiose y = 0.0162X + 0.0089 0.9950 0.75 - 35.0
Raffinose y = 0.0128x + 0.068 0.9960 0.75 - 50.0
Stachyose y = 0.0071x + 0.0065 0.9962 0.75 - 50.0

SUPPLEMENTARY INFORMATION
257
Table S2. Summary of the lipid content, % DM and pH from the different samples analyzed
Country Fermentation point (h) Lipid content %DM pH
Brazil 0 33.6 65.7 6.55
Brazil 24 32.7 64.8 6.56
Brazil 48 35.0 64.2 6.18
Brazil 72 31.6 59.9 5.03
Brazil 96 31.1 58.2 4.77
Brazil 120 29.1 56.6 4.63
Brazil 144 33.2 58.5 4.7
Cameroon 0 37.4 68.4 6.75
Cameroon 24 41.6 69.0 6.7
Cameroon 48 39.4 66.2 6.54
Cameroon 72 34.8 60.2 4.92
Cameroon 96 35.4 57.7 4.7
Cameroon 120 37.2 58.9 4.78
Cameroon 144 37.4 60.2 5.16
Ivory Coast 0 40.8 67.3 6.51
Ivory Coast 24 39.5 64.9 4.72
Ivory Coast 48 37.6 61.7 4.81
Ivory Coast 72 37.2 59.0 4.83
Ivory Coast 96 34.4 56.9 4.96
Ivory Coast 120 33.7 58.6 4.73
Ivory Coast 144 36.3 58.4 5.04
Ivory Coast 168 35.2 57.7 5.15

SUPPLEMENTARY INFORMATION
258
Country Fermentation point (h) Lipid content %DM pH
Malaysia 0 33.5 68.3 6.61
Malaysia 24 33.0 63.6 6.68
Malaysia 48 31.9 61.4 6.02
Malaysia 72 33.3 59.5 5.27
Malaysia 96 31.7 57.6 4.62
Malaysia 120 36.1 56.5 4.38
Malaysia 144 33.6 56.9 4.33
Ecuador 0 35.5 67.1 6.67
Ecuador 24 38.4 63.6 6.12
Ecuador 48 37.1 62.3 5.5
Ecuador 72 33.6 58.8 5.1
Ecuador 96 33.9 57.9 4.75
Ecuador 120 34.5 58.9 4.46

SUPPLEMENTARY INFORMATION
259
Supplementary information of Chapter 7 “Characterization of commercial green tea leaves by
the analysis of low molecular weight carbohydrates and other quality indicators”.

SUPPLEMENTARY INFORMATION
260
Figure 1S. HILIC-ESI-MS2 spectra in positive ion mode of compound tentative identified as 2-O-(β-L-
arabinopyranosyl)-myo-inositol.

SUPPLEMENTARY INFORMATION
261
Table 1S. Recovery values determined for each carbohydrate.
LMWC Recovery Exp 1 Recovery Exp 2 Average
Fructose 96.9 106.5 101.7
Glucose 92.1 93.2 92.7
Mannitol 89.1 109.7 99.4
Sucrose 101.8 85.4 93.6
myo-inositol 96.5 110.6 103.5
Maltose 97.1 98.6 97.8
Galactinol 103.2 104.2 103.7
Raffinose 101.8 97.3 99.6
Stachyose 107.1 97.1 102.1

SUPPLEMENTARY INFORMATION
262
Note for the table 2S, 3S, 4S, 5S. *Sample code: J: Japan, SK: South Korea, P: Portugal, C: China, I: Iran, N:
Nepal, SI: South India, DJ: Darjeeling, A: Assam, SL: Sri Lanka. **tr = traces .
Table 2S. Individual LMWC content of each sample within the different groups of countries.
mg carbohydrate /g tea
Sample Fructose Glucose Mannitol Sucrose Maltose Galactinol
2-O-(β-L-
arabinopyranosyl)-
myo-inositol
myo-
inositol raffinose stachyose
J1 6.94 4.23 tr** 27.58 0.17 3.70 6.99 4.07 3.66 1.96
J2 6.17 7.97 tr 25.86 tr 4.83 4.31 3.70 4.39 1.65
J3 2.07 0.68 0.21 23.94 0.74 0.70 28.63 8.77 1.93 0.00
J4 5.83 5.92 0.04 64.46 0.65 6.30 4.52 2.09 5.26 2.79
J5 6.00 3.21 tr 42.63 0.20 1.82 9.36 2.01 2.61 1.03
J6 9.71 7.38 0.06 23.98 0.64 1.72 11.10 3.06 2.75 1.18
J7 9.36 7.36 tr 56.93 1.10 11.49 9.17 3.67 5.31 2.88
J8 4.12 2.98 0.09 16.51 0.18 0.60 10.48 1.88 1.70 0.89
SK1 4.32 2.74 tr 11.19 tr tr 15.01 2.18 0.95 tr
SK2 7.50 6.38 tr 26.76 1.09 1.25 13.00 2.15 2.40 0.95
SK3 1.05 0.40 tr 18.78 0.15 tr 13.32 1.45 1.14 0.00
SK4 0.81 0.51 tr 19.16 0.28 tr 13.45 2.55 0.99 0.00
SK5 0.93 0.40 tr 17.90 0.19 tr 12.57 2.25 1.08 0.00
SK6 1.63 0.45 tr 20.20 0.60 tr 7.17 2.46 1.64 tr
SK7 0.30 0.11 tr 19.09 0.22 tr 13.38 2.57 1.15 0.00
P1 11.37 7.51 0.20 34.21 1.32 0.64 8.37 11.65 2.67 0.98
P2 9.77 7.72 0.24 108.10 1.52 2.96 12.69 11.32 5.03 1.77
P3 14.85 13.54 0.35 60.58 2.54 3.14 10.24 15.87 4.88 1.65
C1 6.24 5.07 tr 69.73 0.31 0.60 70.92 3.47 2.64 0.91
C2 6.92 4.38 tr 25.20 0.10 3.17 7.73 3.73 4.10 1.62
C3 5.14 3.27 tr 52.33 0.44 1.88 10.09 4.77 3.39 1.27
C4 2.67 0.72 tr 21.38 tr 0.32 12.31 7.29 1.92 tr
C5 1.00 0.62 tr 18.18 0.25 0.40 11.72 5.66 2.27 tr
C6 0.63 0.33 tr 20.01 tr tr 15.94 2.05 1.40 tr
C7 2.72 2.21 tr 20.68 0.17 tr 13.07 3.64 1.72 tr
C8 8.98 3.78 0.08 39.00 0.36 1.16 10.42 5.18 5.30 1.73
I1 4.95 1.94 tr 20.91 0.13 2.45 5.17 2.87 3.99 1.49
I2 4.03 3.77 tr 17.95 0.25 3.61 3.77 2.20 3.43 1.25
I3 5.72 8.04 tr 16.62 0.49 4.26 8.41 3.71 4.02 1.34
I4 4.56 3.72 tr 98.31 0.78 0.91 8.12 3.97 2.09 0.87
I5 7.87 9.24 tr 29.46 0.61 2.79 8.66 5.67 4.35 1.70
I6 3.12 2.85 0.52 21.30 0.58 0.93 13.89 5.04 1.64 0.83
N1 2.71 3.15 0.85 23.23 1.12 1.32 6.27 5.25 1.49 1.13
N2 2.98 1.33 1.07 15.55 0.21 tr 12.46 4.47 0.89 tr
N3 2.98 2.28 0.20 20.31 1.19 1.32 14.09 5.67 1.55 0.87
N4 2.07 1.17 0.31 19.10 0.66 tr 14.01 3.69 1.08 tr
N5 3.97 1.34 tr 16.70 0.07 tr 16.38 3.51 1.32 tr
SI1 15.42 12.67 0.67 54.13 1.54 7.70 13.91 6.53 4.03 2.69
SI2 7.75 5.68 tr 40.06 0.75 4.10 8.58 3.16 3.42 2.16
SI3 2.08 0.73 tr 26.38 0.55 tr 9.30 3.35 1.26 0.87
SI4 2.55 4.87 tr 17.59 0.43 1.16 11.82 2.81 2.65 1.13
SI5 2.22 0.88 tr 21.40 0.45 0.56 5.83 4.32 1.69 1.14
SI6 6.27 6.15 tr 27.04 0.62 4.85 10.31 4.66 4.04 2.11
DJ1 2.73 3.82 tr 25.32 0.35 2.17 14.45 4.31 3.56 1.17
DJ2 8.93 3.75 4.28 31.81 1.04 4.53 18.28 10.39 4.87 2.29
DJ3 3.35 2.43 0.28 13.14 tr 0.37 10.85 2.53 1.74 0.85
A1 2.19 1.87 0.07 17.43 0.05 0.98 12.26 2.98 2.13 1.10
A2 2.82 2.88 tr 20.04 0.24 2.39 10.44 4.21 3.23 1.31
A3 3.79 2.91 0.12 20.11 0.02 1.48 10.19 4.06 2.53 1.22
A4 3.24 2.79 0.06 21.29 0.19 0.97 10.94 3.07 2.31 1.14
SL1 1.32 1.51 tr 18.34 0.04 2.09 8.35 2.31 2.45 1.09
SL2 1.82 1.70 0.33 17.50 tr 0.47 7.57 3.22 1.46 tr
SL3 1.34 1.74 0.10 16.54 tr 1.37 6.81 2.39 1.70 0.91
SL4 1.24 0.62 tr 18.46 0.01 2.28 7.88 3.68 2.37 1.00
SL5 2.63 4.98 0.98 24.89 0.43 0.39 11.46 4.42 1.56 tr
SL6 0.97 1.46 tr 18.02 0.14 2.46 9.44 1.68 2.58 1.08
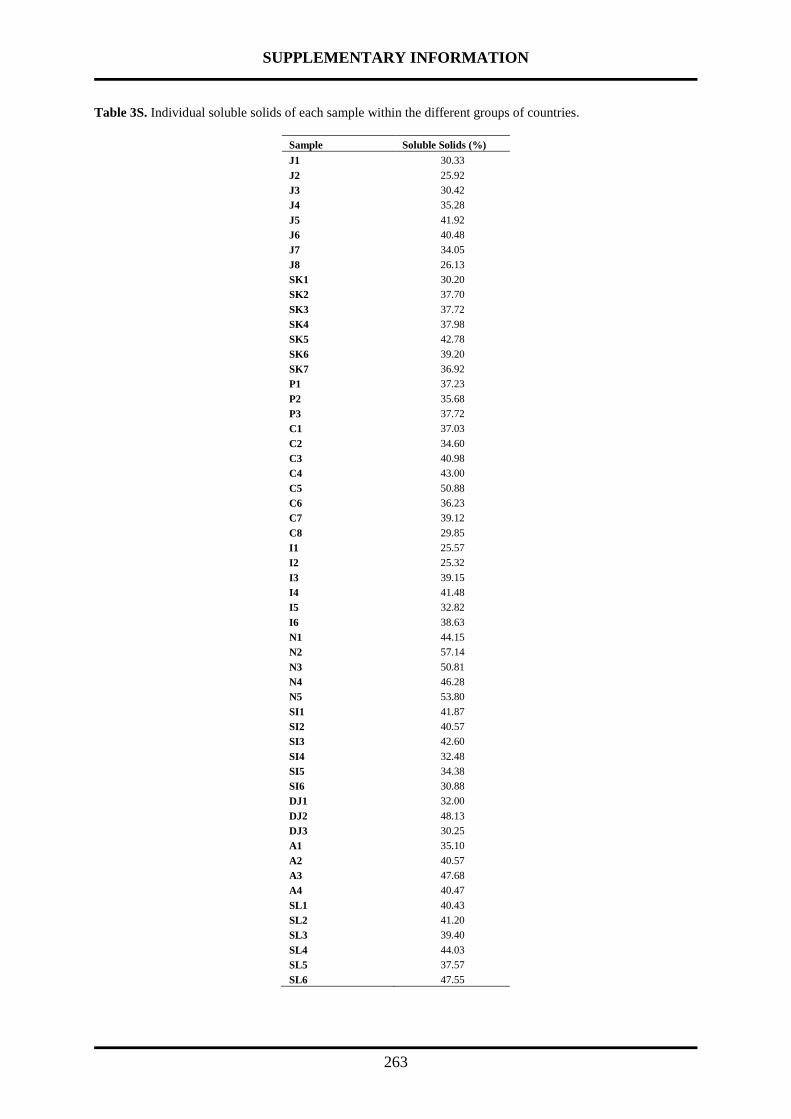
SUPPLEMENTARY INFORMATION
263
Table 3S. Individual soluble solids of each sample within the different groups of countries.
Sample Soluble Solids (%)
J1 30.33
J2 25.92
J3 30.42
J4 35.28
J5 41.92
J6 40.48
J7 34.05
J8 26.13
SK1 30.20
SK2 37.70
SK3 37.72
SK4 37.98
SK5 42.78
SK6 39.20
SK7 36.92
P1 37.23
P2 35.68
P3 37.72
C1 37.03
C2 34.60
C3 40.98
C4 43.00
C5 50.88
C6 36.23
C7 39.12
C8 29.85
I1 25.57
I2 25.32
I3 39.15
I4 41.48
I5 32.82
I6 38.63
N1 44.15
N2 57.14
N3 50.81
N4 46.28
N5 53.80
SI1 41.87
SI2 40.57
SI3 42.60
SI4 32.48
SI5 34.38
SI6 30.88
DJ1 32.00
DJ2 48.13
DJ3 30.25
A1 35.10
A2 40.57
A3 47.68
A4 40.47
SL1 40.43
SL2 41.20
SL3 39.40
SL4 44.03
SL5 37.57
SL6 47.55

SUPPLEMENTARY INFORMATION
264
Table 4S. Individual color parameters of each sample within the different groups of countries.
Sample L* a* b* C* Saturation Hue angle
J1 14.61 -3.08 1.71 3.52 0.24 179.49
J2 12.89 -2.66 0.57 2.72 0.21 179.79
J3 15.94 -2.33 -0.82 2.47 0.15 180.34
J4 15.16 -3.20 1.30 3.45 0.23 179.61
J5 17.70 -2.56 0.47 2.60 0.15 179.82
J6 16.64 -1.85 5.48 5.78 0.35 178.75
J7 17.20 -3.07 1.46 3.40 0.20 179.56
J8 16.33 -2.60 -0.87 2.74 0.17 180.32
SK1 15.67 -0.38 9.54 9.55 0.61 178.47
SK2 15.48 -2.88 1.67 3.33 0.21 179.48
SK3 17.61 -1.33 3.20 3.47 0.20 178.82
SK4 13.93 -1.49 0.19 1.50 0.11 179.87
SK5 16.25 -2.27 0.40 2.31 0.14 179.83
SK6 17.79 -0.96 2.71 2.88 0.16 178.77
SK7 13.95 -1.88 -1.25 2.26 0.16 180.59
P1 11.84 -1.58 7.49 7.66 0.65 178.64
P2 12.71 -2.24 6.39 6.78 0.53 178.77
P3 15.02 -2.41 7.22 7.61 0.51 178.75
C1 12.01 -2.10 0.32 2.12 0.18 179.85
C2 13.09 -2.32 7.38 7.74 0.59 178.73
C3 13.79 -1.64 6.11 6.33 0.46 178.69
C4 15.92 -2.39 0.67 2.48 0.16 179.73
C5 15.67 -1.34 7.73 7.85 0.50 178.60
C6 14.35 -1.58 -1.60 2.25 0.16 180.79
C7 16.56 -1.24 6.39 6.51 0.39 178.62
C8 13.00 -2.23 6.15 6.54 0.50 178.78
I1 10.49 -1.56 6.03 6.22 0.59 178.68
I2 11.69 -2.63 2.37 3.54 0.30 179.27
I3 13.79 -2.26 1.49 2.71 0.20 179.42
I4 18.82 -2.11 9.79 10.02 0.53 178.64
I5 13.83 -2.37 3.80 4.47 0.32 178.99
I6 16.99 -0.36 12.30 12.30 0.72 178.46
N1 12.19 -1.46 4.12 4.37 0.36 178.77
N2 16.35 -2.58 3.81 4.60 0.28 179.02
N3 23.26 -2.56 8.90 9.26 0.40 178.71
N4 15.40 -2.45 -0.24 2.46 0.16 180.10
N5 16.16 -1.09 8.08 8.15 0.50 178.56
SI1 13.16 -2.75 1.81 3.29 0.25 179.42
SI2 15.55 -3.07 6.77 7.43 0.48 178.85
SI3 14.98 -2.20 0.37 2.23 0.15 179.83
SI4 12.67 -1.69 -0.47 1.75 0.14 180.27
SI5 13.38 -1.77 -1.91 2.61 0.19 180.82
SI6 15.29 -2.62 0.81 2.74 0.18 179.70
DJ1 13.16 -1.25 1.52 1.97 0.15 179.12
DJ2 19.62 -2.38 11.60 11.84 0.60 178.63
DJ3 13.87 -1.59 3.74 4.06 0.29 178.83
A1 12.68 -1.41 2.45 2.83 0.22 178.95
A2 14.18 -1.42 4.64 4.86 0.34 178.73
A3 18.64 -1.93 11.48 11.64 0.62 178.60
A4 13.47 -1.33 5.77 5.92 0.44 178.66
SL1 14.77 -2.17 2.03 2.97 0.20 179.25
SL2 13.47 -1.67 6.84 7.04 0.52 178.67
SL3 15.20 -2.03 3.72 4.23 0.28 178.93
SL4 17.71 -1.21 14.27 14.32 0.81 178.51
SL5 14.11 -2.11 2.74 3.46 0.25 179.09
SL6 15.60 -2.19 7.89 8.19 0.52 178.70

SUPPLEMENTARY INFORMATION
265
Table 5S. Individual Trolox-E and GA-E values of each sample within the different groups of countries.
mg /g tea
Sample GA-E TROLOX-E
J1 0.09 0.19
J2 0.07 0.15
J3 0.09 0.19
J4 0.06 0.28
J5 0.07 0.29
J6 0.16 0.31
J7 0.14 0.27
J8 0.06 0.25
SK1 0.02 0.06
SK2 0.09 0.34
SK3 0.13 0.26
SK4 0.10 0.20
SK5 0.11 0.22
SK6 0.15 0.30
SK7 0.12 0.23
P1 0.04 0.12
P2 0.07 0.27
P3 0.03 0.10
C1 0.04 0.19
C2 0.10 0.19
C3 0.14 0.56
C4 0.05 0.23
C5 0.17 0.33
C6 0.05 0.14
C7 0.09 0.38
C8 0.02 0.10
I1 0.03 0.13
I2 0.05 0.11
I3 0.11 0.22
I4 0.09 0.19
I5 0.08 0.15
I6 0.15 0.30
N1 0.08 0.21
N2 0.21 0.39
N3 0.05 0.19
N4 0.18 0.30
N5 0.08 0.25
SI1 0.04 0.18
SI2 0.04 0.18
SI3 0.05 0.21
SI4 0.04 0.17
SI5 0.18 0.70
SI6 0.20 0.40
DJ1 0.12 0.24
DJ2 0.06 0.16
DJ3 0.11 0.21
A1 0.16 0.30
A2 0.16 0.31
A3 0.14 0.28
A4 0.20 0.79
SL1 0.17 0.33
SL2 0.07 0.23
SL3 0.07 0.32
SL4 0.05 0.20
SL5 0.05 0.21
SL6 0.05 0.21

SUPPLEMENTARY INFORMATION
266
Table 6S. Values of PC loading from the figure 3, PCA from LMWC content, soluble solids, color paramenters,
antioxidant activity values of the samples under study.
Name Loadings 1 Loadings 2
Fructose -0.38 0.05
Glucose -0.36 0.11
Mannitol -0.12 -0.15
Sucrose -0.27 0.05
Maltose -0.30 0.01
Galactinol -0.31 0.14
2-O--L-arabinopyranosyl-myo-inositol 0.03 0.04
myo-inositol -0.26 -0.10
Raffinose -0.35 0.10
Stachyose -0.34 0.11
Soluble solids 0.06 -0.27
C* -0.12 -0.44
Saturation -0.15 -0.41
Hue angle 0.12 0.39
GA-E 0.15 tr
Trolox-E 0.13 0.01
L* 0.03 -0.22
a* 0.20 -0.26
b* -0.12 -0.45