
Characterization of Low Molecular Weight Alkoxylated ...02)00436-1.pdf · Characterization of Low...
14
Characterization of Low Molecular Weight Alkoxylated Polymers Using Long Column SFC/MS and an Image Analysis Based Quantitation Approach J. David Pinkston, Suresh B. Marapane, Glenn T. Jordan, and B. David Clair Miami Valley Laboratories, The Procter and Gamble Company, Cincinnati, Ohio, USA The utility of low viscosity mobile phases and long chromatographic columns for complex polymer analysis is demonstrated. We use long column supercritical fluid chromatography/ mass spectrometry (SFC/MS) with electrospray ionization (ESI) to characterize a variety of complex, low molecular weight polymers. When quantitative analysis is desired, the resulting three-dimensional (time, intensity, and mass-to-charge ratio [m/z]) data are converted to images. Custom image analysis software is used to detect and integrate peaks in arbitrarily defined regions of the time-m/z map. These integrated peak volumes can be used to quantitate distinct component classes of the polymer mixtures. (J Am Soc Mass Spectrom 2002, 13, 1195–1208) © 2002 American Society for Mass Spectrometry L ow molecular weight (MW) commercial poly- mers are found in many consumer and industrial products. They are often quite complex. In addi- tion to an oligomeric or polymeric distribution, they may contain various blocks, capping agents, initiators, additives, and preservatives. Each of these components may itself consist of a distribution of species and chain lengths. Relatively small differences in composition or structure can at times greatly impact performance [1]. Numerous analytical methods can be used to help understand these differences, including nuclear mag- netic resonance spectroscopy, infrared spectroscopy, and chromatographic methods such as gel-permeation chromatography. Advances in ionization methods, such as matrix-assisted laser desorption/ionization, electro- spray ionization, and potassium ion desorption/ioniza- tion, and in mass analyzers such as time-of-flight mass spectrometers, have brought mass spectrometry firmly into the fold of methods used to study polymeric and oligomeric mixtures [2– 4]. As in the analysis of any complex mixture, the combination of a high efficiency separation method with an informative spectroscopic method is a powerful tool. Packed column supercritical fluid, subcritical fluid, and enhanced fluidity liquid chromatographies have been used to separate low-MW polymeric and oligo- meric mixtures in the past [5– 8]. While these three techniques are different, they are closely related and require the same instrumentation. All three will be referred to as SFC in this report. The addition of a significant amount, typically 20 to 95%, of a viscosity- lowering agent, such as carbon dioxide, to the mobile phase provides a number of advantages for low-MW polymer separations [9]. Lower viscosity allows the use of higher mobile phase flow rates (i.e., faster analyses [10]) and/or longer columns (i.e., higher efficiencies [11]) than when using traditional liquid mobile phases. Compared to liquid chromatography, these higher mo- bile phase flow rates can often be attained without a concomitant loss in chromatographic efficiency since diffusion coefficients and optimum velocities are typi- cally higher with SFC. While CO 2 itself is relatively nonpolar, mixtures of CO 2 and polar organic solvents retain the polarity and solvating power of the polar organic until significant levels (50 – 60%) of CO 2 are added [12]. These mixtures can often be used to sepa- rate all but the most polar, poly-ionic polymers. Mass spectrometry (MS) is arguably the most widely used informative detector in chromatography. Interfac- ing SFC to mass spectrometry using an atmospheric- pressure-ionization source is relatively straightforward and has been described previously [13–15]. The self- nebulizing nature of a mobile phase consisting of CO 2 and an organic “modifier” results in improved response compared to conventional LC/MS [16]. Pneumatically assisted electrospray ionization provides simple spectra usually consisting of a protonated molecule and a sodium or ammonium (when volatile ammonium salts are added) adduct ion, or both, in the positive mode. Published online September 6, 2002 Address reprint requests to Dr. J. D. Pinkston, Miami Valley Laboratories, The Procter and Gamble Company, P.O. Box 538707, Cincinnati, OH 45253-8707, USA. E-mail: [email protected] © 2002 American Society for Mass Spectrometry. Published by Elsevier Science Inc. Received January 7, 2002 1044-0305/02/$20.00 Revised May 21, 2002 PII S1044-0305(02)00436-1 Accepted June 1, 2002
-
Upload
truongkhanh -
Category
Documents
-
view
217 -
download
0
Transcript of Characterization of Low Molecular Weight Alkoxylated ...02)00436-1.pdf · Characterization of Low...

Characterization of Low Molecular WeightAlkoxylated Polymers Using Long ColumnSFC/MS and an Image Analysis BasedQuantitation Approach
J. David Pinkston, Suresh B. Marapane, Glenn T. Jordan, andB. David ClairMiami Valley Laboratories, The Procter and Gamble Company, Cincinnati, Ohio, USA
The utility of low viscosity mobile phases and long chromatographic columns for complexpolymer analysis is demonstrated. We use long column supercritical fluid chromatography/mass spectrometry (SFC/MS) with electrospray ionization (ESI) to characterize a variety ofcomplex, low molecular weight polymers. When quantitative analysis is desired, the resultingthree-dimensional (time, intensity, and mass-to-charge ratio [m/z]) data are converted toimages. Custom image analysis software is used to detect and integrate peaks in arbitrarilydefined regions of the time-m/z map. These integrated peak volumes can be used to quantitatedistinct component classes of the polymer mixtures. (J Am Soc Mass Spectrom 2002, 13,1195–1208) © 2002 American Society for Mass Spectrometry
Low molecular weight (MW) commercial poly-mers are found in many consumer and industrialproducts. They are often quite complex. In addi-
tion to an oligomeric or polymeric distribution, theymay contain various blocks, capping agents, initiators,additives, and preservatives. Each of these componentsmay itself consist of a distribution of species and chainlengths. Relatively small differences in composition orstructure can at times greatly impact performance [1].Numerous analytical methods can be used to helpunderstand these differences, including nuclear mag-netic resonance spectroscopy, infrared spectroscopy,and chromatographic methods such as gel-permeationchromatography. Advances in ionization methods, suchas matrix-assisted laser desorption/ionization, electro-spray ionization, and potassium ion desorption/ioniza-tion, and in mass analyzers such as time-of-flight massspectrometers, have brought mass spectrometry firmlyinto the fold of methods used to study polymeric andoligomeric mixtures [2–4].As in the analysis of any complex mixture, the
combination of a high efficiency separation methodwith an informative spectroscopic method is a powerfultool. Packed column supercritical fluid, subcritical fluid,and enhanced fluidity liquid chromatographies havebeen used to separate low-MW polymeric and oligo-meric mixtures in the past [5–8]. While these three
techniques are different, they are closely related andrequire the same instrumentation. All three will bereferred to as SFC in this report. The addition of asignificant amount, typically 20 to 95%, of a viscosity-lowering agent, such as carbon dioxide, to the mobilephase provides a number of advantages for low-MWpolymer separations [9]. Lower viscosity allows the useof higher mobile phase flow rates (i.e., faster analyses[10]) and/or longer columns (i.e., higher efficiencies[11]) than when using traditional liquid mobile phases.Compared to liquid chromatography, these higher mo-bile phase flow rates can often be attained without aconcomitant loss in chromatographic efficiency sincediffusion coefficients and optimum velocities are typi-cally higher with SFC. While CO2 itself is relativelynonpolar, mixtures of CO2 and polar organic solventsretain the polarity and solvating power of the polarorganic until significant levels (50–60%) of CO2 areadded [12]. These mixtures can often be used to sepa-rate all but the most polar, poly-ionic polymers.Mass spectrometry (MS) is arguably the most widely
used informative detector in chromatography. Interfac-ing SFC to mass spectrometry using an atmospheric-pressure-ionization source is relatively straightforwardand has been described previously [13–15]. The self-nebulizing nature of a mobile phase consisting of CO2and an organic “modifier” results in improved responsecompared to conventional LC/MS [16]. Pneumaticallyassisted electrospray ionization provides simple spectrausually consisting of a protonated molecule and asodium or ammonium (when volatile ammonium saltsare added) adduct ion, or both, in the positive mode.
Published online September 6, 2002Address reprint requests to Dr. J. D. Pinkston, Miami Valley Laboratories,The Procter and Gamble Company, P.O. Box 538707, Cincinnati, OH45253-8707, USA. E-mail: [email protected]
© 2002 American Society for Mass Spectrometry. Published by Elsevier Science Inc. Received January 7, 20021044-0305/02/$20.00 Revised May 21, 2002PII S1044-0305(02)00436-1 Accepted June 1, 2002

The predictable nature of these spectra simplifies datainterpretation when simple mixtures are present in theion source, as occurs when analytes coelute in a chro-matographic separation.The data resulting from a chromatography/MS sep-
aration is three dimensional in nature (m/z, retentiontime, and intensity). The third dimension provided bythe mass spectrometer, m/z, has the practical effect ofenhancing the resolving power (in the sense of infor-mation per unit time) of the chromatographic system.Many commercial chromatography/MS data systemsprovide the ability to generate 2-D representations ofthese 3-D data, called contour plots, or maps. However,the ability to manipulate and analyze these 2-D repre-sentations is often limited. The contour plots resultingfrom long column SFC/MS of complex polymers oftencontained many hundred, sometimes thousands, ofpeaks. We found the contour plot a very efficient meansof viewing the resulting data, but sought more exten-sive data analysis possibilities tied to the contour plots.We therefore developed software that converts the
SFC/MS data to an image, which can be viewed,manipulated, and analyzed with commercially avail-able image analysis software. Furthermore, the softwarewe developed allows the analyst to define arbitraryregions within the image, integrate peaks within thisregion, and export the results to a widely used commer-cial spreadsheet program.In this report we demonstrate the use of long packed
columns, high mobile phase flow rates, and MS detec-tion with pneumatically-assisted electrospray ioniza-tion for efficient SFC separations and qualitative anal-ysis of complex low-MW polymers. We also describethe development of image analysis tools for the quan-titative analysis of chromatography/MS data.
Experimental
Safety Considerations
The instrumentation used in this work operated atrelatively high pressures and high temperatures. Pres-sures were similar to those used in traditional highperformance liquid chromatography. However, tem-peratures were often significantly higher than thoseused in HPLC. Correspondingly, researchers must beaware of both the pressure and temperature limits ofcolumns and other instrumental components beforeattempting to reproduce this work.
Chemicals and Mobile Phase Components
Ammonium acetate and methanol (HPLC Grade) forpreparation of the mobile phase, the pressure regulat-ing fluid, and of the sheath-flow liquid were purchasedfrom J. T. Baker (Phillipsburg, NJ). Carbon dioxide wasSFC/SFE grade obtained from Air Products and Chem-icals, Inc. (Allentown, PA). Distilled-deionized waterwas provided by a Milli-Q Water Purification System
(Millipore Corp., Bedford, MA). Toluene (ACS ReagentGrade) for sample dissolution was obtained from J. T.Baker.
Sample Preparation
Purified (single component) deca(oxyethylene)octanol(C8E10) was used as an internal standard. The C8E10 andmost of the low-MW polymer samples were preparedwithin the laboratories of The Procter and GambleCompany. Most of these polymers were of themultiblock “A-B-C” variety, where A, B, and C con-sisted of either fatty alkyl, poly(ethylene glycol), orpoly(propylene glycol) chains of various lengths. Otherlow-MW polymer samples were obtained from a vari-ety of commercial sources. Neodol 25-12 (C12, C13, C14,and C15 alcohols ethoxylated to an average ethoxylatechain length of 12) was obtained from Shell Chemical(Houston, TX). Solutions of low-MW polymer sampleswere prepared at approximately 0.05 mg/mL in tolu-ene. A stock solution of the C8E10 internal standard wasprepared in toluene at a concentration of 1.01 mg/mL.An aliquot of the C8E10 internal standard stock solutionwas added to each sample such that the final concen-tration of internal standard was 5.05 �g/mL. Thesesolutions were injected into the SFC system withoutfurther processing.
SFC/MS Instrumentation
The SFC system was a Model G1205A (Hewlett-Pack-ard, now Agilent, Wilmington, DE). This instrumentwas upgraded with a Model FCM-1200 fluid controlmodule, a Model 719 autosampler, and Berger Instru-ments SFC ChemStation control software, version 3.3.9(all from Berger Instruments, Newark, DE). The chro-matographic column consisted of one, three, four, oreight 4.6 mm i.d., 250 mm long, 4.6 mm i.d. DeltaBondCyano columns (Thermo Hypersil, Bellefonte, PA) cou-pled in series for a total length of 0.25, 0.75, 1, or 2 m,respectively. Unless otherwise indicated, the “stan-dard” conditions consisted of a 1 m column, a flow rateof 2 mL/min (measured at the pumps), a post-columnpressure of 200 bar, and a column oven temperature of100 °C. The mobile phase composition was held at 3%methanol in CO2 for 3 min upon injection, then wasraised to 30% methanol at a rate of 0.5%/min, where itwas held until the end of the separation. The injectionvolume was 10 �L.Post-column pressure control is provided by the
pressure regulating fluid interface, as described previ-ously [15, 17]. Briefly, a low dead volume chromato-graphic tee is located between the UV absorbancedetector and the electrospray interface. A fluid, heremethanol, is pumped into the one arm of the tee underpressure control using a Model D Series 260 syringepump (Isco, Lincoln, NE). The chromatographic efflu-ent enters a second arm, and the resulting mixture exitsthe tee and flows to the mass spectrometer. The tee was
1196 PINKSTON ET AL. J Am Soc Mass Spectrom 2002, 13, 1195–1208
located near the TurboIonspray source. A 75 �m i.d.,195 �m o.d., 30 cm length of deactivated fused silicatubing (Dionex, Sunnyvale, CA) carried the effluentfrom the tee, through the TurboIonspray interfaceprobe, to the union within the probe, located just beforethe sprayer tip. The original PEEK tubing within theprobe was replaced with 1/16 inch o.d., 0.020 inch i.d.PEEK tubing to accommodate the fused silica transferline. The interface provides pressure regulation withgood chromatographic fidelity, as well as additionalmethanol for efficient electrospray ionization when themodifier (i.e., methanol) content of the mobile phase islow. The pressure regulating fluid flow typically rangedfrom 0.3 to 0.8 mL/min.As described previously [15, 17], a sheath-flow liquid
of 80:20 methanol/water containing 1 mM ammoniumacetate flowed within the PEEK tubing in the TurboIon-spray probe, concentric to the fused silica transfer line,to the union located just before the sprayer tip. Theeffluent and the sheath-flow liquid mixed within theunion and flowed through the sprayer tip. The sheath-flow liquid was delivered by a second Model D Series260 syringe pump and provided enhanced ionization[15, 17].The mass spectrometer was a PE Sciex API-365 (PE
Sciex, Thornhill, Ontario, Canada). The TurboIonspraysource was used with a Turbo gas flow of 8 L/min at anominal temperature of 450 °C. The nebulizer gas pres-sure was 60 psi (nitrogen).The ESI, orifice, and multiplier potentials were held
at 5000, 50, and �2000 V, respectively. Q1 was scanned
from m/z 200 to m/z 2000 in “peak hopping” mode witha step value of 1.0 u, a 1.0 ms dwell time, a 5 msinterscan pause, and a 55 millimass units (mmu)/100 ucorrection factor (discussed below). Q2 and Q3 wereoperated in rf-only mode. The mass spectrometer wasoperated in peak hopping mode to allow scanning overthe 1800 m/z range in approximately 2 s. Nevertheless,the scan cycle time of 2 s only allowed the acquisition ofbetween 5 and 11 scans per peak because of the narrowwidths of the SFC peaks throughout the chromatogram.This scan cycle time limitation prevented the use ofhigher flow rates (3–4 mL/min), which were entirelyreasonable from a chromatographic point of view, andwhich would have reduced the total analysis time.Higher flow rates would have resulted in peak widthstoo narrow to adequately sample with the mass spec-trometer used in this work. While peak hopping pro-vides a sufficiently rapid scan speed, it forces theanalyst to choose an expected atomic composition forthe analytes. We knew that the polymers we studiedwere primarily composed of carbon, hydrogen, oxygen,and nitrogen, which dictated a correction factor of 55mmu/100 u. Molecules containing other atoms, such ashalogens, might not be detected because of the peakhopping mode of acquisition. Also, other importantinformation that can usually be derived from massspectra, such as isotope ratios, is not acquired in peakhopping mode. One obvious alternative in this situationis to use a mass spectrometer with a faster acquisitionrate, such as one of the newer vintage quadrupole massspectrometers, where hardware and software changes
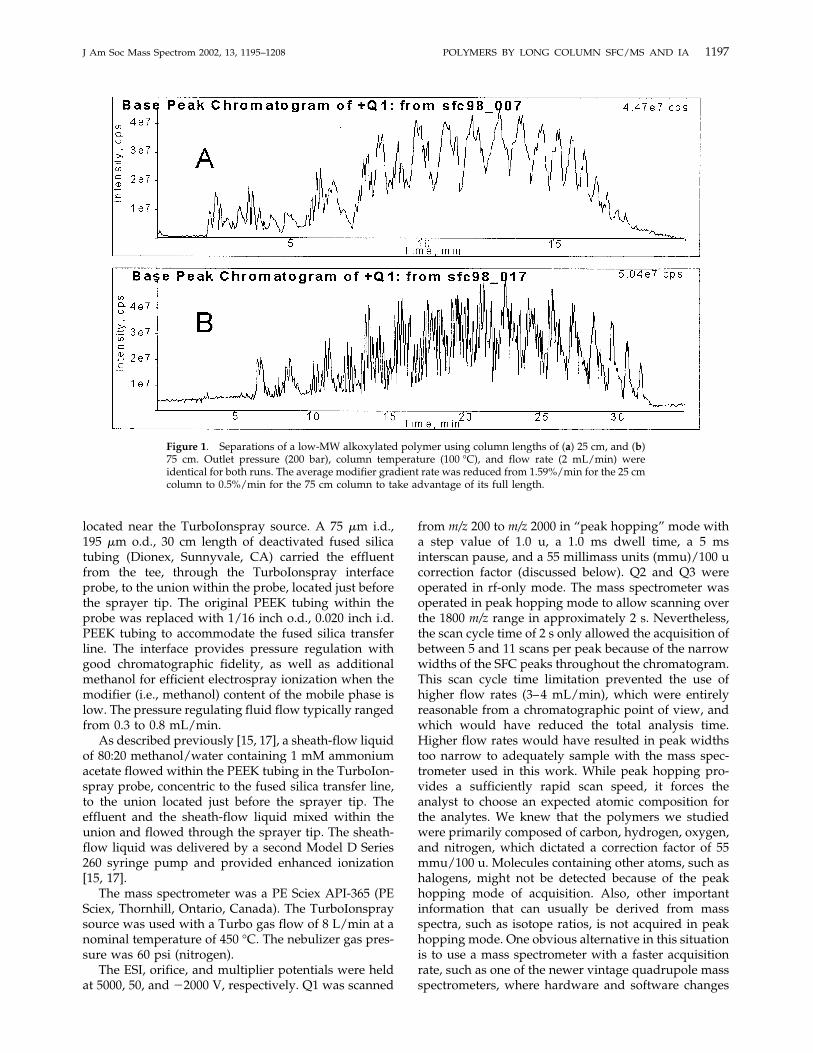
Figure 1. Separations of a low-MW alkoxylated polymer using column lengths of (a) 25 cm, and (b)75 cm. Outlet pressure (200 bar), column temperature (100 °C), and flow rate (2 mL/min) wereidentical for both runs. The average modifier gradient rate was reduced from 1.59%/min for the 25 cmcolumn to 0.5%/min for the 75 cm column to take advantage of its full length.
1197J Am Soc Mass Spectrom 2002, 13, 1195–1208 POLYMERS BY LONG COLUMN SFC/MS AND IA
allow faster scan rates without resorting to peak hop-ing, or, even better, a time-of-flight mass spectrometer.Unfortunately, none of these was available to us for thework described herein.
Image Analysis
We developed a novel image analysis based techniqueto provide the ability to visualize the SFC/MS data setas an image with columns being time, rows being m/z,and brightness (color) being mass spectral intensity.The SFC/MS data file is first converted to Matlab (TheMathworks, Inc., Natick, MA) format using a scriptprogram provided by PE-Sciex. Our custom softwareallows the analyst to (1) import the Matlab-format datafile and convert this file to an image data format; (2)remove the majority of mass spectrometric backgroundfrom the data in an automated fashion; (3) definearbitrary regions of interest within the image using agraphical user interface pointing device (a mouse); (4)define integration threshold levels and other integrationparameters; (5) detect and integrate peaks within theregion; and (6) export the results to a Microsoft Excelspreadsheet. This procedure is implemented in the
Optimas image analysis package (version 6.5.171,Media Cybernetics, L.P., Silver Spring, MD) using cus-tom macros. Readers may contact the correspondingauthor to obtain copies of the macros. The backgroundremoval process is simple, but merits description. First,the image is divided into the minimum number of timeslices that will provide adequate background removal.This minimum number will vary depending on the rateof change of the background and on the peak widths ofthe analytes. If the background level varies in such away that three or four distinct regions are observed bythe analyst, which is typical for a 50 min separation, thenumber of time slices is three or four, respectively. Thesignal at each m/z is then averaged over the time slice.Finally, this average is subtracted from the signal toproduce a background subtracted signal. As long as thebackground is relatively constant over the time slice, thepeak width of each analyte peak is narrow with respectto the time slice, and the intensity contribution ofanalyte peaks to the average signal is small (5% or less)(i.e., the peaks at each m/z are sparse); this simpleapproach provides adequate background removal.These conditions have been satisfied in all the SFC/MSdata sets examined to date.
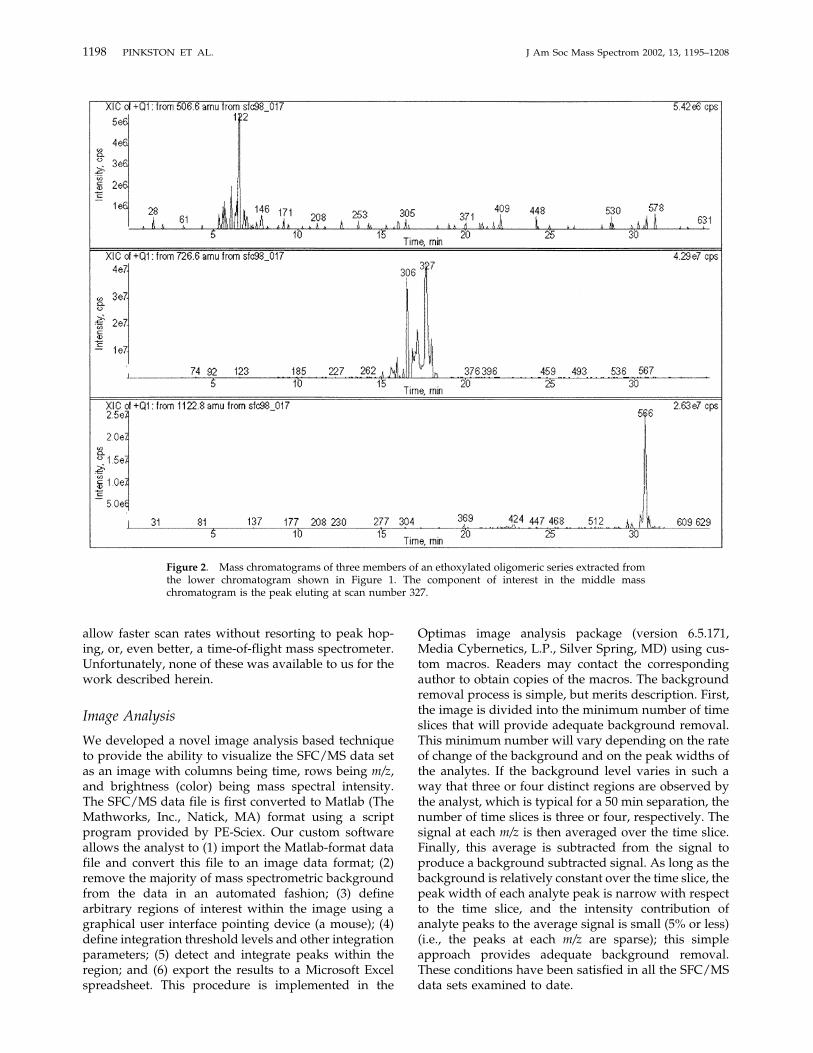
Figure 2. Mass chromatograms of three members of an ethoxylated oligomeric series extracted fromthe lower chromatogram shown in Figure 1. The component of interest in the middle masschromatogram is the peak eluting at scan number 327.
1198 PINKSTON ET AL. J Am Soc Mass Spectrom 2002, 13, 1195–1208

Results and Discussion
Effect of Column Length
The benefits of using long packed columns in the SFCanalysis of pharmaceuticals and compounds of environ-mental interest have been previously demonstrated[11]. Figure 1 illustrates the impact of column length onthe SFC characterization of low-MW polymers. Theupper portion of the figure shows the base peak chro-matogram of a low-MW polymer mixture of the A-B-Cvariety (see Experimental section) using a column witha length of 25 cm, while the lower portion of the figureshows the corresponding separation using a 75 cmcolumn. The column i.d. (4.6 mm), the outlet pressure(200 bar), the flow rate (2 mL/min), and the columntemperature (100 °C) were identical for both separa-tions. The mobile phase gradient began at 3% methanolin CO2 and ended at 30%, but the gradient rate wasaltered from an average rate of 1.59%/min for the 25 cmcolumn to 0.5%/min for the 75 cm column to makeeffective use of the longer column. (Maintaining agradient rate of 1.59%/min with the longer columnwould have resulted in the analytes achieving an effec-tive k' of zero [i.e., no retention] long before theirelution. The remainder of the long column would havesimply operated as an empty transfer tube, in whichonly peak broadening and no chromatographic separa-
tion was taking place, from that point forward. Theslower gradient makes full use of the entire column.) Abase peak chromatogram is obtained by plotting theintensity of the base peak in each spectrum versusretention time. The base peak chromatogram is useful incomparing separations such as those in Figure 1 be-cause it eliminates background and highlights majorpeaks. While the lower chromatogram may simplyappear “noisier” than the upper at first glance, closerinspection of the data reveals that the merged multip-lets in the upper chromatogram are resolved into manyindividual peaks in the lower chromatogram.Figure 1 illustrates the improved chromatographic
resolution provided by a longer column. Beyond asimple visual comparison, the peak capacity, nc, is auseful tool for comparing the separating power ofchromatographic systems, even in gradient mode oper-ation (where parameters such as chromatographic effi-ciency cannot be calculated) [18]. The peak capacity is ameasure of the number of peaks that may be resolved,at a specified resolution, by a chromatographic systemwithin a given period of time or distance. In order tocompare two systems, the unit of time or distance usedmust be comparable. It has often been used in recentyears to compare the separating power of chromato-graphic systems during the period of time of a mobilephase gradient. A resolution of 1.0 has often been used,
Figure 3. Separations of the same low-MW alkoxylated polymer as shown in Figure 1 using acolumn length of 2 m. The numbers above the peaks are scan numbers. See the Results and Discussionsection for details.
1199J Am Soc Mass Spectrom 2002, 13, 1195–1208 POLYMERS BY LONG COLUMN SFC/MS AND IA

though this may not be appropriate for some applica-tions [18]. By inspecting mass chromatograms of indi-vidual components to obtain an average peak width,one may estimate nc for the chromatograms in Figure 1from the beginning to the end of the gradient. At aresolution of 1.0, nc for the 25 cm system is 36, while ncfor the 75 cm system is 216. Of course, the improvedseparation comes at the expense of time. The separationusing the longer columns requires approximately 35min, roughly 75% longer than the separation using the25 cm column. Figure 1 also illustrates another aspect ofgradient SFC separations—with respect to the totalanalysis time, the peak widths are relatively narrowthroughout a separation. The chromatographic peaksfor the ammonium adduct ions of three members of ahomologous, oligomeric series eluting over the courseof the separation conducted with the 0.75 cm columnhave peak widths at half height of 0.20 min (at anelution time of 6.6 min, with an ethoxylate chain lengthof 2), 0.20 min (at 17.7 min, with an ethoxylate chainlength of 7), and 0.12 min (at 30.6 min, with an ethoxy-late chain length of 16). Mass chromatograms for theammonium adduct ions of these three oligomers are
shown in Figure 2. Further experiments showed thatseparations with mobile phase flow rates of 3 and 4mL/min provided ncs nearly as high as those measuredwith 2 mL/min flow rates, but with shorter analysistimes and narrower peaks. As described in the Experi-mental section, we are not able to use such flow ratesbecause of the scan time limitations of the quadrupolemass spectrometer used in this work.As one might expect, a longer column provides even
better resolution for low-MW polymers. As the columnlength is increased, the inlet pressure and the totalanalysis time also increase. Eventually, the inlet (i.e.,pumping system) pressure limit is reached, and theanalysis time becomes impractically long. Figure 3illustrates a separation of the same polymeric mixturefeatured in Figure 1 near the practical limit of columnlength for this system, 2 m. This separation cannot becompared directly to those in Figure 1 because a num-ber of conditions were altered to improve peak resolu-tion and to reduce the total analysis time. While Figures1 and 3 cannot be directly compared, Figure 3 illustrateswhat is possible in the extreme. The column tempera-ture was increased to 140 °C, the initial methanol con-
Figure 4. Contour plot of a low-MW alkoxylated polymer. (A) C8E10 (single component) internalstandard; (B) unreacted starting material with an alkyl capping group on only one end of themolecule; (C) reaction product with alkyl capping groups on both ends of the molecule; (D) reactionproduct with a dimerized alkyl capping group on one end of the molecule; (E) reaction product witha trimerized alkyl capping group on one end of the molecule; (F) doubly-charged species.
1200 PINKSTON ET AL. J Am Soc Mass Spectrom 2002, 13, 1195–1208
tent in the mobile phase was 15%, the final methanolcontent in the mobile phase was 40%, and the mobilephase composition gradient rate was reduced to 0.3%/min. The mass spectrometric scan range was from m/z200–1100 rather than from m/z 200–1500. The estimatednc for this separation is 237. However, the total analysistime is approximately 80 min.We chose a column length of 1 m, a column temper-
ature of 100 °C, a mobile phase gradient of 3 to 30%methanol in CO2 at 0.5%/min, a flow rate of 2 mL/min,and a post-column pressure of 200 bar as a practicalcompromise between peak resolution, analysis time,peak width, and method durability. Most of the sepa-rations of low-MW polymers performed with theseconditions were completed in less than 1 h. Except asnoted, these were the conditions used for the separa-tions described in the following sections.
Examples of Low-MW Polymer Separations
As mentioned in the introduction, we found contourplot chromatograms (2-D representations of 3-D
SFC/MS data) very useful in examining and comparingthe separations of low-MW polymers. The contour plotis a compilation of hundreds of mass spectra. A verticalslice taken from the contour plot would represent asingle traditional mass spectrum, as illustrated later inthis work. Figure 4 shows the contour plot of thelow-MW polymer very similar in nature to the polymerfeatured in the base peak chromatograms of Figures 1and 3. This polymer essentially consists of a poly(oxy-ethylene) (a.k.a. polyethyleneglycol, or ethoxylate)chain capped by an alkyl chain on each end. Additionalcomplexity is introduced by the fact that a variety ofalkyl chain lengths are present, that the alkyl chains arepresent in a variety of isomers (that are chromatograph-ically resolved, with branched isomers eluting beforestraight chain isomers [19]), that the capping alkylchains are sometimes present as dimers, trimers, etc.,and that unreacted starting material and other minorreaction byproducts are also present. Each species isrepresented by an ammonium adduct ion and a minorsodium adduct ion, with a very small protonated mol-ecule. The ammonium and sodium adduct ions are
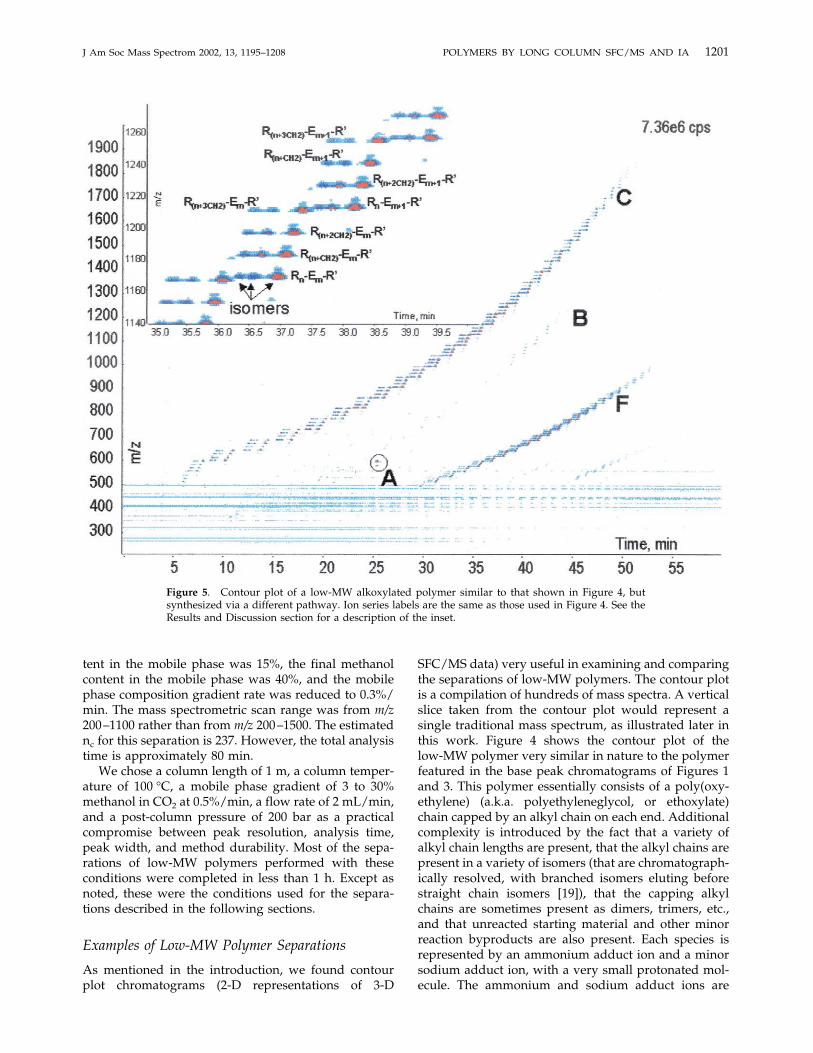
Figure 5. Contour plot of a low-MW alkoxylated polymer similar to that shown in Figure 4, butsynthesized via a different pathway. Ion series labels are the same as those used in Figure 4. See theResults and Discussion section for a description of the inset.
1201J Am Soc Mass Spectrom 2002, 13, 1195–1208 POLYMERS BY LONG COLUMN SFC/MS AND IA
separated by only 5 m/z units, and appear essentially asone spot on the scale of the contour plot in Figure 4.Thus, each component is essentially represented by asingle spot. Note that ionization efficiencies of alkoxy-lated polymers in ESI are known to vary with structure,and are especially poor for alkoxylate chain lengthsshorter than two [20]. Thus, as in any mass spectromet-ric technique, one cannot make a direct inference aboutthe relative amounts of two components with verydifferent structures based solely upon their relativepeak areas (or peak volumes in a 3-D representation).While estimates of relative levels of species with similarstructures can be performed based on relative peakvolumes, calibration with known standards is essentialfor accurate quantitation.The main features and series of Figure 4 are the C8E10
internal standard (Figure 4A), uncapped starting mate-rial (essentially a series of ethoxylated alcohols) (Figure4B), the desired product (Figure 4C), and reactionproducts capped with dimeric (Figure 4D), trimeric
(Figure 4E), etc. capping agents. The clusters of singly-charged ions in each series are separated by m/z 44,which one would expect for an ethoxylated series.Within each cluster, the species are separated by m/z 14,corresponding to one methylene group. The higher MWmembers of the polymeric series tend to be present asboth singly and doubly charged species. The doublycharged ions are present in the lower right quadrant of
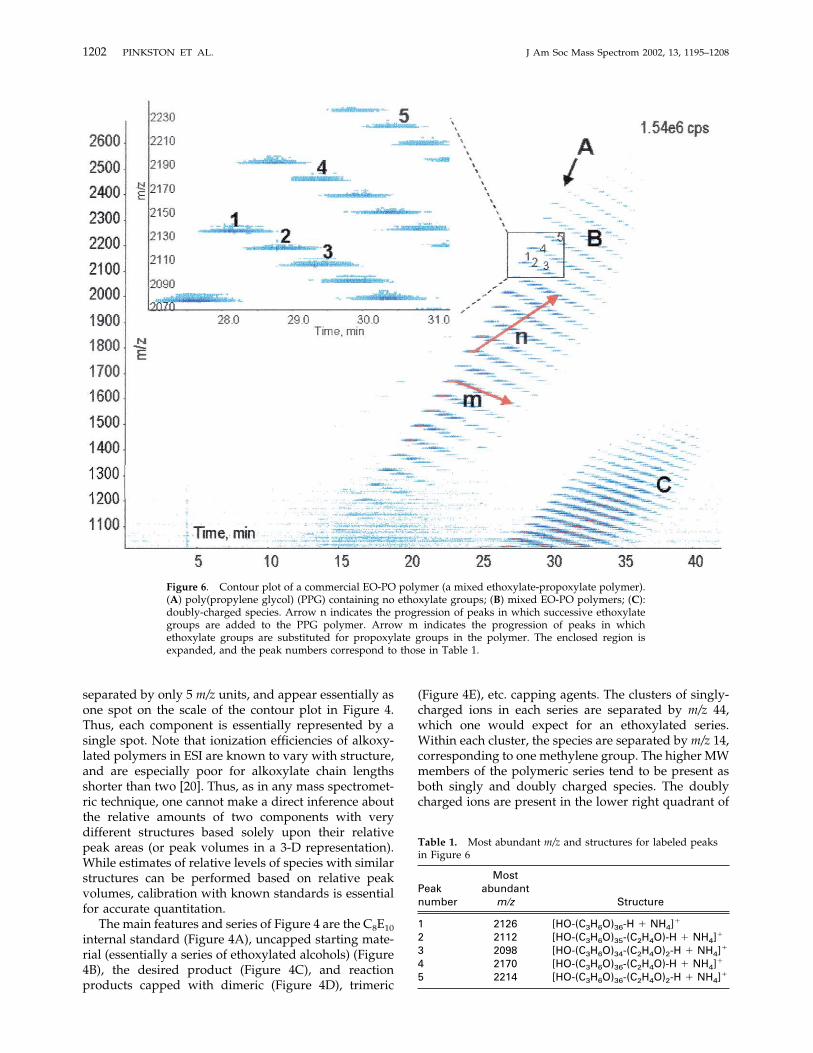
Figure 6. Contour plot of a commercial EO-PO polymer (a mixed ethoxylate-propoxylate polymer).(A) poly(propylene glycol) (PPG) containing no ethoxylate groups; (B) mixed EO-PO polymers; (C):doubly-charged species. Arrow n indicates the progression of peaks in which successive ethoxylategroups are added to the PPG polymer. Arrow m indicates the progression of peaks in whichethoxylate groups are substituted for propoxylate groups in the polymer. The enclosed region isexpanded, and the peak numbers correspond to those in Table 1.
Table 1. Most abundant m/z and structures for labeled peaksin Figure 6
Peaknumber
Mostabundant
m/z Structure
1 2126 [HO-(C3H6O)36-H � NH4]�
2 2112 [HO-(C3H6O)35-(C2H4O)-H � NH4]�
3 2098 [HO-(C3H6O)34-(C2H4O)2-H � NH4]�
4 2170 [HO-(C3H6O)36-(C2H4O)-H � NH4]�
5 2214 [HO-(C3H6O)36-(C2H4O)2-H � NH4]�
1202 PINKSTON ET AL. J Am Soc Mass Spectrom 2002, 13, 1195–1208

the plot (Figure 4F). Finally, horizontal lines present atlow m/z are due to background ions derived fromsolvent clusters, column bleed, etc. which are typical inESI.A similar low-MW polymer was synthesized using
an alternative synthetic method designed to avoid theformation of dimeric, trimeric, etc. capping groups. Themonomeric capping agent did not carry a reactivehydroxyl group that could react with other cappinggroups during the reaction to form dimeric, trimeric,etc. caps. The contour plot of this mixture is shown inFigure 5. This plot shows a small amount of theresidual, unreacted ethoxylated alcohol, the desiredmono-capped product, doubly and triply charged ionsfor the higher MWmembers of the series, and the C8E10internal standard. There are no signs of dimeric- andtrimeric-capped reaction products as shown in Figure 4,thus demonstrating that the alternative synthesis wassuccessful. The inset enlargement in Figure 5 shows aportion of the desired product region corresponding totwo ethoxylate chain lengths (m and m� 1). From otherwork, we know that the capping alkyl chain on one end
of the ethoxylate chain (R') is of a single chain lengthand isomer. However, the capping alkyl chain on theother end of the ethoxylate chain (Rn�xCH2) has adistribution of chain lengths and isomers. There arefour primary chain lengths, each differing by a singlemethylene group (14 Da), providing a distribution ofpeaks along the m/z (y) axis. The longer chain lengthspecies are retained slightly more than the shorter chainlengths. The isomers, due to branching of the alkylchain, elute at slightly different times along the reten-tion time (x) axis, but, of course, at the same m/z value.In previous work, we have shown that branched chainisomers elute slightly before straight chain isomers [19].At least two minor isomeric structures are chromato-graphically resolved from the main isomer.Figure 6 shows the contour plot of a commercial
EO-PO block copolymer. In other words, the polymerconsists of blocks of poly(oxyethylene), also known aspolyethylene glycol, ethoxylate or EO, and ofpoly(oxypropylene), also known as polypropylene gly-col, propoxylate or PO. These polymers are used in awide variety of industrial and consumer product appli-
Figure 7. Contour plot of a di-capped EO-PO polymer. (A): C8E10 (single component) internalstandard; (B): singly capped EO-PO chain, lacking the C12-OH chain; (C): di-capped EO-PO chain, asshown in the structure; (D): di-capped EO-PO chain, but the C12-OH cap is a dimer (C12-O–C12-OH);(E): doubly charged species. x has values of 5, 7, and 9, y ranges from 0 to 3, and z from �3 to at least34. The enclosed region is enlarged in Figure 9.
1203J Am Soc Mass Spectrom 2002, 13, 1195–1208 POLYMERS BY LONG COLUMN SFC/MS AND IA

cations, as, for example, emulsifiers, dispersing agents,and wetting agents. The particular polymer featured inFigure 6 is a commercially available suds suppressor.The most prominent series of peaks in the contour plotin Figure 6 is the pure poly(oxypropylene) backbone(a.k.a. poly[propyleneglycol] or PPG) (Figure 6A), indi-cating that the synthesis of this block co-polymer mayhave been conducted by ethoxylation of the PO block.Figure 6 illustrates how the patterns produced by thecontour plots of the SFC/MS separations can assist inassigning the composition of the polymer. Figure 6 alsoillustrates how the mass spectrometer and the chro-matograph are at least partially orthogonal in theirmodes of separation. As structures containing only POgroups increase in MW, their m/z and their retentiontime both increase, as indicated in Figure 6A. (Retentionof the PO-only structures is primarily driven by non-specific dispersion forces on the Deltabond Cyanophase.) As EO groups are added to the PO-only struc-ture in the reaction, as shown by arrow “n” in Figure 6,the polarity of the molecule increases, and interactionswith the Deltabond Cyano phase increase, contributing
to stronger retention and longer retention times. Struc-tures having the same number of oligomeric units, butin which PO groups are replaced by EO groups, liealong arrow “m” in Figure 6. As the EO content of themolecule increases relative to the PO content, the MWof the molecule decreases, but its polarity increases.Thus its position drops on them/z scale, but its retentiontime increases as it is retained more strongly by therelatively polar Deltabond Cyano column. To betterillustrate this effect, the region within Figure 6 enclosedwith a rectangle has been expanded and some of thepeaks have been numbered. These numbers correspondto the peak numbers in Table 1. The patterns fordifferent types of polymers can be quite distinctive andcan not only provide clues on polymer composition, butalso on the method used to synthesize the polymer, ashas been demonstrated using other mass spectrometrictechniques [2–4].Figure 7 is the contour plot of a slightly more
complex EO-PO polymer. The structure of the polymercontaining a single capping group on each end of theEO-PO chain, which was deduced from the chromato-
Figure 8. Base peak chromatogram (top) of the di-capped EO-PO polymer shown in Figure 7, andmass spectra of two components of this mixture: The x� 9, y� 1, and z� 24 component elutes at 46.3min (middle), while the x � 7, y � 1, and z � 10 component elutes at 28.8 min (bottom). Figures 7 and8 illustrate the relationship between the contour plot, the base peak chromatogram, and individualmass spectra.
1204 PINKSTON ET AL. J Am Soc Mass Spectrom 2002, 13, 1195–1208

graphic pattern, from the m/z values of the ions, andfrom information about the product, is shown in Figure7. One end of the alkoxy chain is capped by C6, C8, andC10 alcohols. The other end of the EO-PO chain iscapped with a 12 carbon capping group incorporating asingle secondary alcohol functional group. This hy-droxyl group can itself react with another identicalcapping group, yielding dimers, trimers, etc. The sin-gly-capped (no C12 cap, Figure 7B), di-capped (with analcohol and a monomeric C12, Figure 7C), and di-capped (with an alcohol and a dimeric C12, Figure 7D)species correspond to the three major bands of ionsranging in m/z from approximately 500 to nearly 2000.To better illustrate the relationship between contourplots, base peak chromatograms and mass spectra ofindividual components, Figure 8 shows the base peakchromatogram for this separation as well as the massspectra of two components of this complex mixture. Thecontour plot is a powerful tool in helping the scientistobtain a “top-level” view of the entire mixture. Chro-matographic retention patterns, which help in deter-mining structures, are clearly obvious from the contourplot. Figure 9 shows an enlargement of the region of thecontour plot containing peaks with a single cappinggroup on each end and with an alkoxylate chain length
of 12 and 13 alkoxylate groups. This area clearly revealsthe C6, C8, and C10 capping alcohol pattern and the lengthof the propoxylate block, ranging from 0 to approximately3. The pattern and m/z values shown in Figure 7 indicatethat the ethoxylate block ranges in length from approxi-mately 3 through at least 34 ethoxylate units.
Use of Image Analysis for Quantitative Analysis ofPolymer Contour Plots
A typical image derived from an SFC/MS data set, as inFigure 4, has intensities that range over several millionunits and spatial resolutions that range up to a fewthousand by a few thousand pixels! Despite the fact thatthese images are huge compared to the size of imageswith which the Optimas image analysis software nor-mally deals, the software, as modified according to thedescription in the Experimental section, workedsmoothly. Once the image is processed to removebackground, the analyst can define an arbitrary regionin which the peaks are to be detected and integrated(peak intensity multiplied by the base area). Figure 10shows a data set with background removed and thearbitrary region to be processed outlined. In the next
Figure 9. Enlarged portion of Figure 7 showing the di-capped EO-PO polymer region about theelution zone of the polymers containing 12 and 13 ethoxylate groups. The C6, C8, and C10 alkylcapping groups and the 0-3 propoxylate groups form a distinctive pattern.
1205J Am Soc Mass Spectrom 2002, 13, 1195–1208 POLYMERS BY LONG COLUMN SFC/MS AND IA
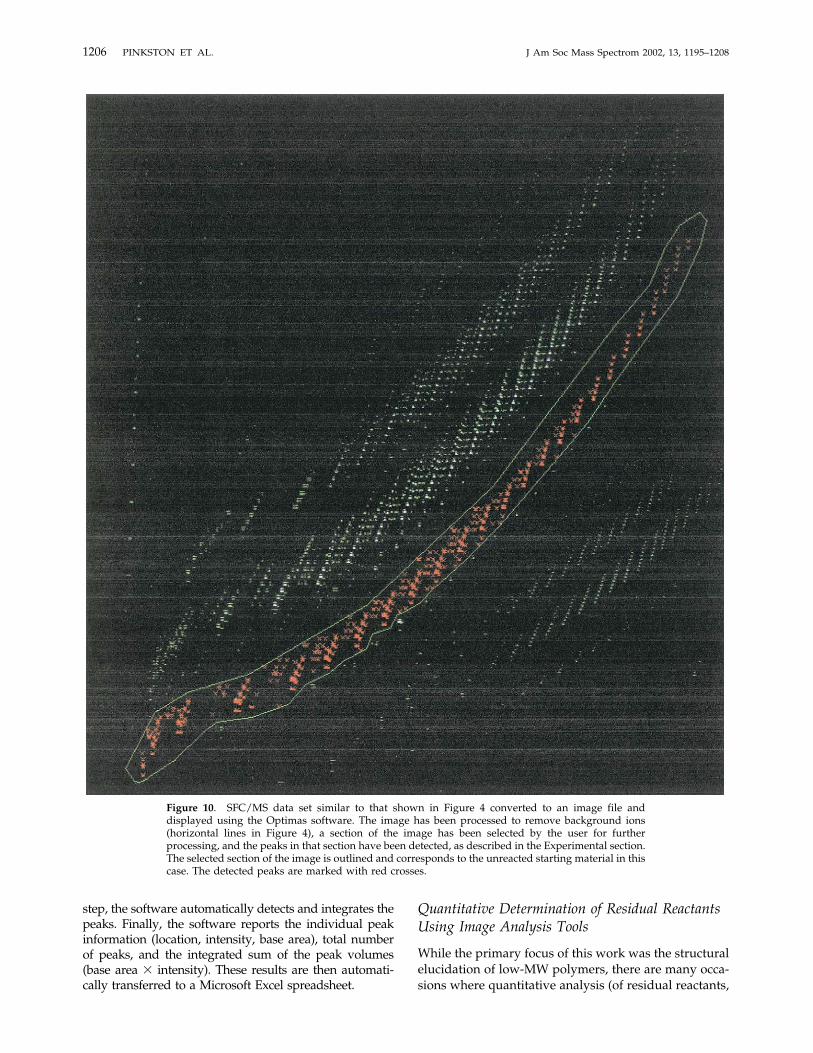
step, the software automatically detects and integrates thepeaks. Finally, the software reports the individual peakinformation (location, intensity, base area), total numberof peaks, and the integrated sum of the peak volumes(base area � intensity). These results are then automati-cally transferred to a Microsoft Excel spreadsheet.
Quantitative Determination of Residual ReactantsUsing Image Analysis Tools
While the primary focus of this work was the structuralelucidation of low-MW polymers, there are many occa-sions where quantitative analysis (of residual reactants,
Figure 10. SFC/MS data set similar to that shown in Figure 4 converted to an image file anddisplayed using the Optimas software. The image has been processed to remove background ions(horizontal lines in Figure 4), a section of the image has been selected by the user for furtherprocessing, and the peaks in that section have been detected, as described in the Experimental section.The selected section of the image is outlined and corresponds to the unreacted starting material in thiscase. The detected peaks are marked with red crosses.
1206 PINKSTON ET AL. J Am Soc Mass Spectrom 2002, 13, 1195–1208
byproducts, polydispersity measurements, etc.) wouldbe useful. The image analysis tools described in thepreceding section have been used to quantify a varietyof components in low-MW alkoxylated polymers. Forexample, they have been used to determine the distri-bution and quantity of residual reactants. In one exper-iment, three standard solutions of a commercial C12–15E12 ethoxylated alcohol (C12, C13, C14, and C15 alcoholsethoxylated to an average ethoxylate chain length of 12)were prepared at concentrations designed to encom-pass the expected level of residual ethoxylated alcohol.The standards also contained the C8E10 single compo-nent standard described earlier. Once the standards andunknown were characterized by SFC/MS, the totalpeak volume of the ethoxylated alcohol region of thecontour plot was determined using the image analysistools described above. A calibration curve was con-structed from the standards by plotting the ratio of thetotal AE peak volume to the internal standard peakvolume versus the concentration of AE. The correlationcoefficient of the curve was 0.9957. The relative stan-dard deviation of the middle standard (N � 3) was0.64% with a total number of peaks above the integra-tion threshold ranging from 440 to 449. From triplicateanalysis of the reaction mixture, the level of residualreactant was determined to be 9.15%.
Conclusions
Low viscosity mobile phases such as those used inSFC allow the use of long columns for efficientseparations of low-MW alkoxylated polymers. Whencoupled to mass spectrometry, the resulting chro-matograms are quite complex, with hundreds ofpeaks displayed on contour plots of m/z versus reten-tion time versus intensity. These contour plots arepowerful tools in structure elucidation. Also, thecontour plots can be converted to images, which canbe processed using commercial image analysis soft-ware with a custom-made user interface. Backgroundis removed from the chromatogram, the user isallowed to define an arbitrary region of interest,chromatographic peaks within this region are de-tected and integrated, and the results are exported tocommercial spreadsheet software. This combinationof long column SFC/MS separations with imageanalysis based data analysis has proven to be apowerful tool in the solution of many problemsinvolving low-MW alkoxylated polymers. Not onlyhas it been useful in quantitating distinct forms ofpolymers in a complex mixture, but it can also beused in the calculation of parameters such as theaverage MWs and the polydispersity for these poly-mer groups.
AcknowledgmentsThe authors thank Mark Sivik, Bernie Kleusener, Kevin Garber,and Thomas Mertens for providing many of the samples used in
this work, and for useful discussions. They thank Eva Duchoslavand Lyle Burton (PE-Sciex) for the PE-Sciex-to-Matlab data-formatconversion script, and for very helpful discussions.
References1. Havelka, K. O. Specialty Polymers: Diverse Properties andApplications. ACS Symp. Ser. 2000, 755, 2–10.
2. Shi, S. D. H.; Hendrickson, C. L.; Marshall, A. G.; Simonsick,W. J.; Aaserud, D. J. Identification, Composition, and Asym-metric Formation Mechanism of Glycidyl Methacrylate ButylMethacrylate Copolymers up to 7000 Da from ElectrosprayIonization Ultrahigh-Resolution Fourier Transform Ion Cyclo-tron Resonance Mass Spectrometry. Anal. Chem. 1998, 70,3220–3226.
3. Jackson, C. A.; Simonsick, W. J. Application of Mass Spectro-metry to the Characterization of Polymers. Cur. Opin. SolidState Mat. Sci. 1997, 2, 661–667.
4. Scrivens, J. H.; Anthony, A. T. Characterization of SyntheticPolymer Systems. Int. J. Mass Spectrom. 2000, 200, 261–276.
5. Pinkston, J. D.; Delaney, T. E.; Bowling, D. J. Characterizationof Low Molecular Weight Poly(acrylic acid) Samples by Cap-illary Supercritical Fluid Chromatography and Capillary Su-percritical Fluid Chromatography-Mass Spectrom. J. Microcol.Sep. 1990, 2, 181–187.
6. Carrott, M. J.; Davidson, G. Separation and Characterization ofPhenol-Formaldehyde (resol) Prepolymers Using Packed Col-umn Supercritical Fluid Chromatography with APCI MassSpectrometric Detection. Analyst (Cambridge) 1999, 124, 993–997.
7. Yee, R.; Wu, N.; Lee, M. L. Chromatographia (Abstract) 2001, 53,197–200.
8. Yun, H.; Olesik, S. V.; Marti, E. H. Improvements in PolymerCharacterization by Size Exclusion Chromatography and Liq-uid Chromatography at the Critical Condition by Using En-hanced Fluidity Liquid Mobile Phases with Packed CapillaryColumns. Anal. Chem. 1998, 70, 3298–3303.
9. Ute, K. Fractionation of Polymer Homologs with PackedColumn Supercritical Fluid Chromatography. In SupercriticalFluid Chromatography with Packed Columns; Anton, K.; Berger,C., Eds.; Marcel Dekker: New York, 1998; pp 349–368.
10. Hoke, S. H. I.; Tomlinson, J. A.; Bolden, R. D.; Morand, K. L.;Pinkston, J. D.; Wehmeyer, K. R. Increasing BioanalyticalThroughput Using pcSFC-MS/MS: 10 Minutes per 96-WellPlate. Anal. Chem. 2001, 73, 3083–3088.
11. Berger, T. A.; Wilson, W. H. Packed Column Supercritical-Fluid Chromatography with 220,000 plates. Anal. Chem. 1993,65, 1451–1455.
12. Yuan, H.; Olesik, S. V. Comparison of Reversed-Phase HPLCSeparation Using Carbon Dioxide and Fluoroform for En-hanced Fluidity Liquid Mobile Phases. Anal. Chem. 1998, 70,1595–1603.
13. Huang, E.; Henion, J.; Covey, T. R. Packed Column Supercriti-cal Fluid Chromatography-Mass Spectrometry and Supercriti-cal Fluid Chromatography-Tandem Mass Spectrometry withIonization at Atmospheric Pressure. J. Chromatogr. 1990, 511,367–370.
14. Pinkston, J. D.; Baker, T. R. Modified Ionspray Interface forSupercritical Fluid Chromatography/Mass Spectrometry: In-terface Design and Initial Results. Rapid Commun. Mass Spec-trom. 1995, 9, 1087–1094.
15. Baker, T. R.; Pinkston, J. D. Development and Application ofPacked Column Supercritical Fluid Chromatography/Pneu-matically Assisted Electrospray Mass Spectrometry. J. Am. Soc.Mass Spectrom. 1998, 9, 498–509.
1207J Am Soc Mass Spectrom 2002, 13, 1195–1208 POLYMERS BY LONG COLUMN SFC/MS AND IA

16. Baker, T. R.; Pinkston, J. D. Preliminary Investigation of Super-critical Fluid Assisted Nebulization for Enhanced Response inElectrospray Mass Spectrometry. Analysis 1999, 27, 701–705.
17. Chester, T. L.; Pinkston, J. D. Pressure Regulating FluidInterface and Phase Behavior Considerations in the Cou-pling of Packed Column Supercritical Fluid Chromatogra-phy with Low Pressure Detectors. J. Chromatogr. 1998, 807,265–273.
18. Giddings, J. C. Unified Separation Science. John Wiley and Sons:New York, 1991, 105.
19. Smith, C. A.; Pinkston, J. D. unpublished.20. Dunphy, J. D.; Pessler, D. G.; Morrall, S. W.; Evans, K. A.;
Robaugh, D. A.; Fujimoto, G.; Negahban, A. DerivatizationLC/MS for the Simultaneous Determination of Fatty Alcoholand Alcohol Ethoxylate Surfactants in Water and WastewaterSamples. Environ. Sci. Technol. 2001, 35, 1223–1230.
1208 PINKSTON ET AL. J Am Soc Mass Spectrom 2002, 13, 1195–1208