Characterization of LoRa Devices Application Note...What is LoRa? 1MA295 2e Rohde & Schwarz...
56
Characterization of LoRa Devices Application Note Products: ı R&S ® FPL1000 ı R&S ® SMBV100B ı R&S ® SGS100A ı R&S ® RTO2000 ı R&S ® RTZVC04 ı R&S ® CMW100 ı R&S ® CMW100CRT ı R&S ® WinIQSIM2 Before devices can be used in a LoRaWAN TM network, they must among other things meet country-specific wireless communications regulations. This application note shows developers and manufacturers of devices with LoRa wireless technology how transmitter measurements are conducted in line with FCC Part 15.247. It also describes how important receiver characteristics can be verified by metrological means. For Production, use of the R&S ® CMW100A Communications Manufacturing Test Set and R&S ® CMW100CTR control PC are shown for the LoRa TX Test. In this context, battery life in particular plays a key role in IoT applications. A further chapter describes how current consumption of LoRa wireless modules can be measured reliably. Note: The latest version of this document is available on our homepage: http://www.rohde-schwarz.com/appnote/1MA295 This document is complemented by software. The software may be updated even if the version of the document remains unchanged R. Wagner, Nassef Mahmud 10.2019 – 1MA295 2e Application Note
Transcript of Characterization of LoRa Devices Application Note...What is LoRa? 1MA295 2e Rohde & Schwarz...

Characterization of LoRa Devices Application Note
Products:
ı R&S®FPL1000
ı R&S®SMBV100B
ı R&S®SGS100A
ı R&S®RTO2000
ı R&S® RTZVC04
ı R&S®CMW100
ı R&S®CMW100CRT
ı R&S®WinIQSIM2
Before devices can be used in a LoRaWANTM network, they must among other things meet
country-specific wireless communications regulations. This application note shows developers and
manufacturers of devices with LoRa wireless technology how transmitter measurements are conducted in
line with FCC Part 15.247. It also describes how important receiver characteristics can be verified by
metrological means.
For Production, use of the R&S®CMW100A Communications Manufacturing Test Set and
R&S®CMW100CTR control PC are shown for the LoRa TX Test.
In this context, battery life in particular plays a key role in IoT applications. A further chapter describes how
current consumption of LoRa wireless modules can be measured reliably.
Note:
The latest version of this document is available on our homepage:
http://www.rohde-schwarz.com/appnote/1MA295
This document is complemented by software. The software may be updated even if the version of the
document remains unchanged
R. W
agne
r, N
asse
f Mah
mud
10.2
019 –
1MA
295
2e
App
licat
ion
Not
e

Table of Contents
1MA295 2e Rohde & Schwarz Characterization of LoRa Devices
2
Table of Contents
1 What is LoRa? ..................................................................................... 4
1.1 LoRa Technology ......................................................................................................... 4
1.2 LoRaWAN ..................................................................................................................... 6
1.2.1 LoRaWAN Network Architecture .................................................................................... 7
1.2.2 LoRaWAN Device Classes ............................................................................................ 9
1.2.3 LoRaWAN Regional Parameters .................................................................................10
1.2.4 LoRaWAN Certification ................................................................................................11
2 RF Measurements ............................................................................. 13
2.1 LoRa TX Test ..............................................................................................................13
2.1.1 Settings on DUT:..........................................................................................................14
2.1.2 6 dB Bandwidth ............................................................................................................14
2.1.3 Emission Output Power ...............................................................................................16
2.1.4 Power Spectral Density ...............................................................................................20
2.1.5 Emissions in Non-Restricted Frequency Bands ..........................................................22
2.1.6 20 dB Bandwidth (FHSS) .............................................................................................26
2.1.7 Power Spectral Density (Hybrid Mode)........................................................................28
2.2 LoRa RX Test ..............................................................................................................33
2.2.1 RX Sensitivity ...............................................................................................................33
2.2.2 Blocking Test ...............................................................................................................36
3 Production Line Testing ................................................................... 38
3.1 LoRa RX Test with CMW100 .....................................................................................38
3.1.1 RX Sensitivity ...............................................................................................................38
3.1.2 Blocking Test ...............................................................................................................41
3.2 Creating LoRa Waveforms with WinIQSIM2 ............................................................43
3.3 Example for Automation Scripts ..............................................................................45
4 Battery Life Measurement ................................................................ 47
5 References ........................................................................................ 53
6 Ordering Information ........................................................................ 54

What is LoRa?
1MA295 2e Rohde & Schwarz Characterization of LoRa Devices
3
In this application note, the following abbreviations are used for Rohde & Schwarz
instruments:
ı The R&S®SMBV100B vector signal generator is referred to as the SMBV100B.
ı The R&S®SGS100A SGMA RF source is referred to as the SGS100A.
ı The R&S®FPL1000 spectrum analyzer is referred to as the FPL1000.
ı The R&S®RTO2000 digital oscilloscope is referred to as the RTO.
ı The R&S®RT-ZVC04 multi channel power probe is referred to as the ZVC.
ı The R&S® CMW100 communications manufacturing test set is referred to as the
CMW100
ı The R&S® CMW100CRT control PC for R&S®CMW100 is referred to as the
CMW100CRT
ı The R&S® Forum application for remote control of Rohe & Schwarz instruments is
referred to as the Forum
ı R&S®WinIQSIM2 simulation software is referred to as the WinIQSIM2
LoRa and LoRaWAN are registered trademarks of the Semtech Corporation.
What is LoRa?
1MA295 2e Rohde & Schwarz Characterization of LoRa Devices
4
1 What is LoRa?
The term "LoRa" (Long Range) refers to a physical layer (PHY) with a modulation type
developed and patented by Cycleo (part of Semtech since 2012). Here, transmission
takes place in the license-free ISM bands. Owing to the low power consumption, LoRa
is ideal for data transmission in the Internet of Things (IoT). One possible field of
application is sensor technology where low bit rates are usually sufficient, the sensor
batteries last for months or years, but data often needs to be transmitted over great
distances. Examples can be found in industry, logistics, environmental technology,
agriculture, smart cities, consumption recording as well as in the smart home.
1.1 LoRa Technology
LoRa is a wireless transmission technology with a very low power consumption and is
used to transmit small amounts of data wirelessly over distances of up to 15 km. For
data transmission, LoRa uses chirp spread spectrum (CSS) modulation, which was
originally developed in the 1940s for radar applications. The term "chirp" stands for
Compressed High Intensity Radar Pulse. The linguistic meaning of the term is quite apt
when one considers how data is transmitted using this method. Owing to the relative
low power consumption for data transmission and its robustness against fading, the
Doppler effect and in-band spurious emissions, this modulation technology has in
recent decades also been used in many wireless data transmission applications. The
CSS PHY has been taken up by the IEEE and defined for low-rate wireless personal
area networks (LPWPANs) in the standard 802.15.4a.
The long range is possible thanks to a correlation mechanism which is based on band
spreading methods. This mechanism allows even extremely small signals which
disappear in the noise, to be modulated in the receiver by means of despreading. LoRa
receivers are still able to decode signals which are up to 19.5 dB below the noise.
Unlike the direct sequence spread spectrum (DSSS), which is used e.g. for UMTS or
WLAN, CSS uses chirp pulses instead of pseudo-random code sequences for
frequency spreading.
An FM or GFSK-modulated chirp pulse has a sinewave signal characteristic with
constant envelope; over time, this characteristic rises or falls continuously in frequency
(Figure 1-1). Here, the frequency bandwidth of the pulse is equivalent to the spectral
bandwidth of the signal. With CSS, this signal characteristic is used as a transmit
pulse.
This paper focuses to a lesser degree on the GFSK mode used in Europe.

What is LoRa?
1MA295 2e Rohde & Schwarz Characterization of LoRa Devices
5
Figure 1-1: FM-modulated chirp pulse with linearly rising frequency
Each pulse represents a symbol. Data transmission takes place as a chronological
sequence of rising and falling chirp pulses (Figure 1-2).
Figure 1-2: LoRa signal with rising and falling chirp pulses
The following key correlations apply to a LoRa signal:
Equation 1-1:
Symbol rate: 𝑅𝑆=1
𝑇𝑠=
𝐵𝑊
2𝑆𝐹 symbols/sec with bandwidth BW [125 kHz to 500 kHz] and
spreading factor SF [7 to 12]
Equation 1-2:
Chirp rate: 𝑅C= RS ∗ 2𝑆𝐹 chips/sec

What is LoRa?
1MA295 2e Rohde & Schwarz Characterization of LoRa Devices
6
The ratio between bandwidth and bit rate can be adjusted using the spreading factor
(SF). In this case, the SF is a measure of frequency change over time (Figure 1-3),
whereby the smallest change rate exists with SF = 12. Here, the values for the SF can
have integer values between 7 and 12.
Figure 1-3: Change of frequency over time as a function of spreading factor SF
With SF = 7, a range of 2 km is possible. As the value for the spreading value rises, so
does the signal/noise ratio and, as a result, the possible transmission distance
increases to more than 15 km (SF = 12). In this case, the symbol and bit rate drops
according to Equation 1-1: and Equation 1-3.
Owing to the orthogonality of the spread sequences, various LoRa devices with
different spread sequences and bit rates can share one frequency. The possible
bandwidths are 125 kHz, 250 kHz and 500 kHz. This results in bit rates from 290 bit/s
to 50 kbit/s.
By adding redundancy, the LoRa modulation offers variably adjustable error correction
(FEC, forward error correction). The degree of error correction is set using the code
rate (CR). For the bit rate, this results in the following relationship:
Equation 1-3:
Bit rate: 𝑅B= SF ∗𝐵𝑊
2𝑆𝐹∗
4
4+𝐶𝑅 bits/sec ; code rate, CR [1 to 4]
Optionally, with LoRa the robustness of the wireless connection can be increased by
means of frequency hopping.
1.2 LoRaWAN
LoRaWAN defines the media access protocol (MAC) and the system architecture for a
wide area network (WAN). LoRaWAN is specially designed for the energy efficiency
required by IoT devices and for a high transmission range. Furthermore, the protocol

What is LoRa?
1MA295 2e Rohde & Schwarz Characterization of LoRa Devices
7
makes communication with server-based Internet applications easier. With its
architecture, the LoRaWAN MAC is therefore a decisive factor influencing the battery
life of the LoRa devices, the network capacity, the service quality as well as the level of
security and the number of applications that the network can offer.
The interaction between the LoRa MAC, the LoRa waveform and regional factors in the
so-called LoRaWAN stack (Figure 1-4) is developed and managed by the
standardization body "LoRa Alliance“ (www.lora-alliance.org). In this body,
semiconductor companies, software companies, manufacturers of sensors and
wireless modules, mobile network operators, IT companies and testing institutions are
all working toward a harmonized LoRaWAN standard.
Figure 1-4: LoRaWAN stack
1.2.1 LoRaWAN Network Architecture
Using LoRa wireless technology, it is possible to create wireless networks which can
cover a area of many square kilometers with one single radio cell. Hundreds of IoT
devices can be connected in each radio cell. A LoRaWAN network has a star-shaped
structure. The IoT LoRa devices communicate wirelessly with gateways which send
their data to a network server. Servers on which the IoT applications run are connected
to the network server. To ensure security, communication in the LoRaWAN is
encrypted with 128 bit AES, both as far as the network server and as far as the
application server (Figure 1-5).

What is LoRa?
1MA295 2e Rohde & Schwarz Characterization of LoRa Devices
8
Figure 1-5: LoRaWAN network architecture
In the LoRaWAN network, a LoRa device does not connect to a specific gateway .
Instead, all gateways scan all channels simultaneously and are able to receive all
incoming data packets irrespective of the data rate (spreading factor). Each gateway
forwards its receive packets to the cloud-based network server (Figure 1-6). This
server contains the actual network intelligence. Here the network is managed,
redundant data packets are filtered out, security checks are performed, the data rate is
determined, and so on.
Figure 1-6: Simultaneous reception of data packets from all gateways
As the data is always received by all gateways, no handover procedure is required for
a mobile LoRa device. The transmission of data to a LoRa device takes place only via
a single gateway selected by the network server.

What is LoRa?
1MA295 2e Rohde & Schwarz Characterization of LoRa Devices
9
1.2.2 LoRaWAN Device Classes
To meet the different needs of a wide variety of applications, the LoRa devices are
divided into three different classes (A,B,C) in LoRaWAN. At least class A must be
supported by all LoRa devices. The main difference between the individual classes is
the power consumption and the latency until a LoRa device can be accessed by the
gateway in the downlink. The lower the power consumption is the longer the latency
will be (Figure 1-7).
Figure 1-7: LoRaWAN device classes
LoRa devices (class A):
Class A LoRa devices allow bidirectional communication. Each uplink data
transmission is followed by two short downlink transmission windows (Figure 1-8).
During these transmission windows, packets can be transmitted from the gateway to
the device e.g. following a prompt to confirm reception of the packet or other data.
Downlink communication from a server must always wait until the subsequently
planned uplink. In return, Class A devices have the lowest power consumption.
Figure 1-8: Operating principle of device class A

What is LoRa?
1MA295 2e Rohde & Schwarz Characterization of LoRa Devices
10
LoRa devices (class B):
Class B LoRa devices behave in the same way as class A devices, but can open
additional transmission windows at defined times. To allow the LoRa device to open a
transmission window at the planned time, every 128 seconds it receives a
time-synchronized beacon from the gateway (Figure 1-9). Apart from the network ID,
the beacon additionally contains a timestamp, GPS coordinates of the gateway and
region-specific information.
Figure 1-9: Operating principle of device class B
LoRa devices (class C):
Class C LoRa devices are usually not battery powered and have transmission windows
which are almost always open (Figure 1-10) and are only closed during transmission.
Figure 1-10: Operating principle of device class C
1.2.3 LoRaWAN Regional Parameters
Owing to regional frequency assignment plans and regulatory requirements of
standardization bodies (ETSI, FCC, ARIB, etc.), there are slight differences between
the LoRaWAN specifications. The regional parameters are listed in the document
"LoRaWAN Regional Parameters", which can be requested on LoRAWan Alliance's
website (www.lora-alliance.org). At the time of printing, version 1.0.2 contains
specifications for North America, Europe, China, Australia, India and South Korea. By
way of example, Table 1-1 shows the parameters defined in North America and
Europe by ETSI and FCC.

What is LoRa?
1MA295 2e Rohde & Schwarz Characterization of LoRa Devices
11
Europe (ETSI) North America (FCC)
Frequency band 863 MHz to 869 MHz 902 MHz to 928 MHz
Channels 10 64 +8 +8 1)
Channel bandwidth Up 125 kHz / 250 kHz 125 kHz / 500 kHz
Channel bandwidth Dn 125 kHz 500 kHz
TX power Up +14 dBm (+20 dBm allowed)
+20 dBm (+30 dBm allowed)
TX power Dn +14 dBm +27 dBm
SF Up 7 to12 7 to 10
Date rate 250 bps to 50 kbps 980 bps to 21.9 kbps
Link budget Up 155 dB 154 dB
Link budget Dn 155 dB 157 dB
Table 1-1: Regional LoRaWAN parameters
1) LoRaWAN defines 64, 125 kHz wide uplink channels from 902.3 MHz to 914.9 MHz
in steps of 200 kHz. In addition, there are eight 500 kHz wide uplink channels with an
interval of 1.6 MHz in the range 903 MHz to 914.9 MHz. The eight downlink channels
are 500 kHz wide and are in the range 923.3 MHz to 927.5 MHz (Figure 1-11).
Figure 1-11: LoRaWAN channel assignment in North America
Hybrid mode
In North America, the signal bandwidth of digitally modulated signals in the ISM band
must be at least 500 kHz according to FCC Part 15.247. This requirement does not
apply to systems with frequency hopping. In order to better utilize the signal band with
smaller bandwidths (< 500 kHz), LoRa uses the so-called hybrid mode. This mode
allows digital modulation and frequency hopping (FHSS) to be used simultaneously
with the same carrier signal. In hybrid mode, the maximum output power is limited to
+21 dBm; this means that only eight channels out of 64 uplink channels are used under
hybrid mode.
1.2.4 LoRaWAN Certification
The LoRaWAN certification (Figure 1-12) includes the verification of the LoRa device's
functionality. For this purpose, a test is conducted to determine whether the protocol
stack and the application comply with the LoRaWAN specification. The certification
ensures that application-specific LoRa devices function without error in LoRaWAN
networks. The certification does not include checking of the physical layer (PHY). To
prove that country-specific wireless communications regulations are met, parameters

What is LoRa?
1MA295 2e Rohde & Schwarz Characterization of LoRa Devices
12
such as TX power, RX power, RX sensitivity and so on must be tested separately. The
measurements required to do this are described in chapter 2.
To finally receive a Lora Alliance Certified logo for a device, a positive test report for
the national compliance test must be submitted to the Alliance certification body.
Furthermore, the device manufacturer must be a member of the LoRa Alliance. Tests
for the LoRa Alliance Certified product program may be performed by authorized LoRa
Alliance test houses only.
Figure 1-12: LoRaWAN certification process

RF Measurements
1MA295 2e Rohde & Schwarz Characterization of LoRa Devices
13
2 RF Measurements
The LoRa RF measurements for transmitters (TX) (in line with FCC Part 15.247) and
receivers (RX) using instruments from Rohde & Schwarz are described below. Table
2-1 gives an overview of the required FCC transmitter measurements with the
associated limits.
Digital modulation mode (TX-Test)
FCC Anforderung Parameter Limit
15.247(a)(2) 6 dB bandwidth ≥ 500 kHz
15.247(b)(3) Emission output power + 30 dBm
15.247(e) Power spectral density + 8 dBm / 3 kHz
15.247(d) Emissions in non-restricted bands -30 dBc
Frequency hopping spread spectrum mode (TX-Test)
FCC Anforderung Parameter Limit
15.247(a)(1) 20 dB bandwidth ≤ 500 kHz
15.247(d) Emissions in non-restricted bands - 30 dBc
Hybride mode (TX-Test)
FCC Anforderung Parameter Limit
15.247(e) power spectral density + 8 dBm / 3 kHz
Table 2-1: Receiver measurements according to FCC 15.247
Measurements according to ETSI and ARIB are performed accordingly. For receiver
(RX) measurements FCC makes no specifications. Typical transmitter measurements
(sensitivity and blocking) as recommended by Semtech are described in more detail in
chapter 2.2.
2.1 LoRa TX Test
For the transmitter test, a test signal is generated using a test tool from the transmitter
module manufacturer (see 2.1.1). The transmit signal generated in this way is fed and
analyzed using the FPL1000 spectrum analyzer. The compact FPL1000 has robust RF
properties and allows the measurement results to be displayed at high resolution on
the large touchscreen with gesture control. The arrangement of result windows on the
screen can be changed by the user; the descriptions given in this document are based
on the default display settings.

RF Measurements
1MA295 2e Rohde & Schwarz Characterization of LoRa Devices
14
Figure 2-1: Test setup for LoRa transmitter test
2.1.1 Settings on DUT:
1. Output power 20 dB
2. LoRa signal bandwidth 500 kHz
3. SF = 7 or SF = 12
4. Set the transmit frequency fTX in the range 902 MHz to 928 MHz.
5. TX continuous mode (100% transmit duty cycle)
6. Frequency hopping off
2.1.2 6 dB Bandwidth
According to FCC 15.247 (a)(2), in the frequency range 902 MHz to 928 MHz the 6 dB
signal bandwidth of a digitally modulated signal must be at least 500 kHz.
Settings on DUT:
1. As described under 2.1.1, fTX = 915 MHz, SF = 7
Settings on FPL1000:
2. Press the Preset key.
3. Press the Freq key and enter the transmit frequency set on the DUT.
4. Press the Span key and set the span to 1.5 MHz.
5. Press the BW key and set the resolution bandwidth (RBW) to 100 kHz and the
video bandwidth to 3 x RBW = 300 kHz.
6. Press the Trace key and select Trace 1. Select the Positive Peak detector and
Max Hold.

RF Measurements
1MA295 2e Rohde & Schwarz Characterization of LoRa Devices
15
7. Press the Ampt key and set the reference level such that the maximum value of
the signal is below the reference level.
8. Press the Mkr key and select Select Marker Function. In the Markers tab, select
n dB down and enter 6 dB in the Value entry field. Wait until the trace is stable.
Note down the value for the 6 dB bandwidth ndB down BW.
9. The following condition must be fulfilled: ndB down BW ≥ 500 kHz (Figure 2-2).
Figure 2-2: Measurement of 6 dB bandwidth with SF = 7
Settings on DUT:
10. As described under 2.1.1, fTX = 915 MHz, SF = 12
Settings on FPL1000:
11. To restart the measurement, press the Run Cont key twice. Wait until the trace
has stabilized. Note down the value for the 6 dB bandwidth ndB down BW.
12. The following condition must be fulfilled: ndB down BW ≥ 500 kHz (Figure 2-3).

RF Measurements
1MA295 2e Rohde & Schwarz Characterization of LoRa Devices
16
Figure 2-3: Measurement of 6 dB bandwidth with SF = 12
2.1.3 Emission Output Power
According to FCC 15.247 (b)(3), the output power of a transmitter in the frequency
range 902 MHz to 928 MHz must not exceed 1 W or 30 dBm.
The total output power and the band power respectively are determined by integrating
the power over the signal bandwidth. Here, the signal bandwidth corresponds to the
occupied bandwidth (OBW). The OBW is the bandwidth in which 99 % of the signal
power is contained.
Settings on DUT:
1. As described under 2.1.1, fTX = 915 MHz, SF = 7
Settings on FPL1000 for measurement of OBW (measurement in line with ANSI
C63-10[6] Section 6.9.3):
2. Press the Preset key.
3. Press the Freq key and enter the transmit frequency set on the DUT.
4. Press the Span key and set the span to 2 MHz (1.5 to 5 x OBW).
Measurement tip: The 6 dB bandwidth from 2.1.2 can be used as a rough
indication of the OBW to be expected.
5. Press the BW key and set the resolution bandwidth to 30 kHz (1% to 5% of the
OBW) and the video bandwidth to 100 kHz (approx. 3x RBW).
6. Press the Sweep key and set Sweep Time to 2 ms.
7. Press the Trace key and select Trace 1. Select the Positive Peak detector and
Max Hold.

RF Measurements
1MA295 2e Rohde & Schwarz Characterization of LoRa Devices
17
8. Press the Ampt key and set Reference Level such that the maximum value of the
signal is at least 10log(OBW/RBW) below the reference level.
9. Press the Meas key and select OBW under Power Measurements. Wait until the
trace is stable.
10. Note down the measured value for Occ BW = OBWSF7 (Figure 2-4).
Figure 2-4: Measurement of OBW with SF = 7
Settings on DUT:
11. As described under 2.1.1, fTX = 915 MHz, SF = 12
Settings on FPL1000:
12. Press the Sweep key, set Sweep Time to 15 ms and wait until the trace has
stabilized.
13. Note down the measured value for Occ BW = OBWSF12 (Figure 2-5).

RF Measurements
1MA295 2e Rohde & Schwarz Characterization of LoRa Devices
18
Figure 2-5: Measurement of OBW with SF = 12
Settings on DUT:
14. As described under 2.1.1, fTX = 915 MHz, SF = 12
Settings on FPL1000 for measurement of emission output power:
The measurement is performed using the band power measurement function of the
FPL1000.
15. Press the Trace key and select Trace 1. Under Trace 1, select the Average mode
and, under Detector Type, set the RMS detector. In the Average Count entry field,
enter a value of at least 100.
16. Press the Sweep key and set Sweep Time to 50 ms.
17. Press the Mkr key and, for Marker 1, enter the value for the transmit frequency set
on the DUT.
18. Press the Select Marker Function menu key and select the Band Power function.
In the Span field, enter the value noted down for OBWSF12 (Figure 2-6) and close
the window.
Figure 2-6: Entering channel bandwidth for emission output power measurement

RF Measurements
1MA295 2e Rohde & Schwarz Characterization of LoRa Devices
19
19. Press the Run Single key and wait until the number of averaging operations set
under Average Count have been performed. The result of the measurement is
shown in Figure 2-7.
Figure 2-7: Emission output power measurement with SF = 12
20. The following conditions must be fulfilled: Band power ≤ 30 dBm
Settings on DUT:
21. As described under 2.1.1, fTX =915 MHz, SF = 7
Settings on FPL1000:
22. Press the Select Marker Function menu key and, in the Span field, enter the value
noted down for OBWSF7 and then close the window.
23. Press the Run Single key and wait until the number of averaging operations set
under Average Count have been performed. The result of the measurement is
shown in Figure 2-8.

RF Measurements
1MA295 2e Rohde & Schwarz Characterization of LoRa Devices
20
Figure 2-8: Emission output power measurement with SF = 7
24. The following conditions must be fulfilled: Band power ≤ 30 dBm
2.1.4 Power Spectral Density
According to FCC 15.247(e), the power spectral density of a transmitter in the
frequency range 902 MHz to 928 MHz must at no time exceed the value of 8 dBm
relative to a bandwidth of 3 kHz during an ongoing data transmission.
Settings on DUT:
1. As described under 2.1.1, fTX = 915 MHz, SF = 7
Settings on FPL1000:
2. Press the Preset key.
3. Press the Freq key and enter the transmit frequency set on the DUT.
4. Press the Span key and set the span to at least 1.5 x OBWSF7 from 2.1.3 (Figure
2-4).
5. Press the BW key and set the resolution bandwidth (RBW) to 3 kHz and the video
bandwidth to 3 x RBW ≈ 10 kHz.
6. Press the Trace key and select Trace 1. Under Trace 1, select the Average mode
and, under Detector Type, set the RMS detector. In the Average Count entry field,
enter a value of at least 100.
7. Press the Sweep key and set Sweep Time to 10 ms.
8. Press the Ampt key and set the reference level using the Auto Level menu key.

RF Measurements
1MA295 2e Rohde & Schwarz Characterization of LoRa Devices
21
9. Press the Run Single key and wait until the number of averaging operations set
under Average Count have been performed.
10. Press the Mkr-> key and select Peak.
The measurement result is shown in Figure 2-9.
Figure 2-9: Power spectral density measurement with RBW = 3 kHz, SF = 7
11. The following conditions must be fulfilled: Power marker M1 ≤ 8 dBm
Settings on DUT:
12. As described under 2.1.1, fTX = 915 MHz, SF = 12
Settings on FPL1000:
13. Press the Span key and set the span to at least 1.5 x OBWSF12 from 2.1.3 (Figure
2-5).
14. Press the Sweep key and set Sweep Time to 500 ms.
15. Press the Ampt key and set the reference level using the Auto Level menu key.
16. Press the Run Single key and wait until the number of averaging operations set
under Average Count have been performed.
17. Press the Mkr-> key and select Peak.
The measurement result is shown in Figure 2-10.

RF Measurements
1MA295 2e Rohde & Schwarz Characterization of LoRa Devices
22
Figure 2-10: Power spectral density measurement with RBW = 3 kHz, SF = 12
18. The following conditions must be fulfilled: Power marker M1 ≤ 8 dBm
2.1.5 Emissions in Non-Restricted Frequency Bands
According to FCC 15.247(d), the radiated power outside the ISM band (902 GHz to
928 GHz) must be at least 30 dB below the maximum RF emission within the ISM
band. Below is an example demonstrating the analysis of the RF emissions of a LoRa
signal with SF7 at the lower and upper band limit.
Settings on DUT:
1. As described under 2.1.1, fTX =903 MHz (lowest channel center frequency for a
500 kHz wide LoRa signal (uplink), SF = 7
Settings on FPL1000:
2. Press the Preset key.
3. Press the Freq key and enter the transmit frequency set on the DUT.
4. Press the Span key and set the span to at least 1.5x the 6 dB signal bandwidth
from 2.1.2.
5. Press the BW key and set the resolution bandwidth (RBW) to 100 kHz. Set the
video bandwidth to ≥ 3 x RBW.
6. Press the Trace key and select Trace 1. Under Trace 1, select the Max Hold
mode and, under Detector Type, set the Positive Peak detector.
7. Press the Ampt key and adjust the reference level accordingly to the maximum
signal level. Wait until the trace is stable.

RF Measurements
1MA295 2e Rohde & Schwarz Characterization of LoRa Devices
23
8. Press the Mkr key, select Peak and note down the marker value as the reference
value Reflow (Figure 2-11).
Figure 2-11: Measurement of maximum radiated power as reference value with fTX = 903 MHz
Settings on DUT:
9. As described under 2.1.1, fTX = 914.2 MHz (highest channel center frequency for a
500 kHz wide LoRa signal (uplink), SF = 7
Settings on FPL1000:
10. Press the Freq key and enter the transmit frequency set on the DUT. Retain all
other settings. Wait until the trace is stable. Using the peak marker, note down the
value as the reference value Refhigh (Figure 2-12).

RF Measurements
1MA295 2e Rohde & Schwarz Characterization of LoRa Devices
24
Figure 2-12: Measurement of maximum radiated power as reference value with fTX = 914.2 MHz
11. Set the frequency SPAN according to the frequency range to be analyzed. In this
example, SPAN = 5 MHz. Wait until the trace is stable.
12. Press the Mkr-> key and select Search Config.
13. In the Search tab, define a range (upper edge of the ISM band) for the
marker-to-peak search. Set the Auto Max Peak function to On (Figure 2-13) .
Figure 2-13: Definition of search range for maximum level value above ISM band
14. The marker now indicates the highest level value M1 within the frequency range to
be analyzed (Figure 2-14).
15. The following condition must be fulfilled: Refhigh – M1 ≥ 30 dB

RF Measurements
1MA295 2e Rohde & Schwarz Characterization of LoRa Devices
25
Figure 2-14: Measurement of maximum radiated power at upper edge of ISM band
Settings on DUT:
16. As described under 2.1.1, fTX = 903 MHz, SF = 7
Settings on FPL1000:
17. Press the Freq key and enter the transmit frequency set on the DUT. Retain all
other settings.
18. Set the frequency SPAN according to the frequency range to be analyzed. In this
example, SPAN = 20 MHz. Wait until the trace is stable.
19. Press the Mkr-> key and select Search Config.
20. In the Search tab, define a range (lower edge of the ISM band) for the
marker-to-peak search. Set the Auto Max Peak function to On (Figure 2-15).
Figure 2-15: Definition of search range for maximum level value below ISM band
RF Measurements
1MA295 2e Rohde & Schwarz Characterization of LoRa Devices
26
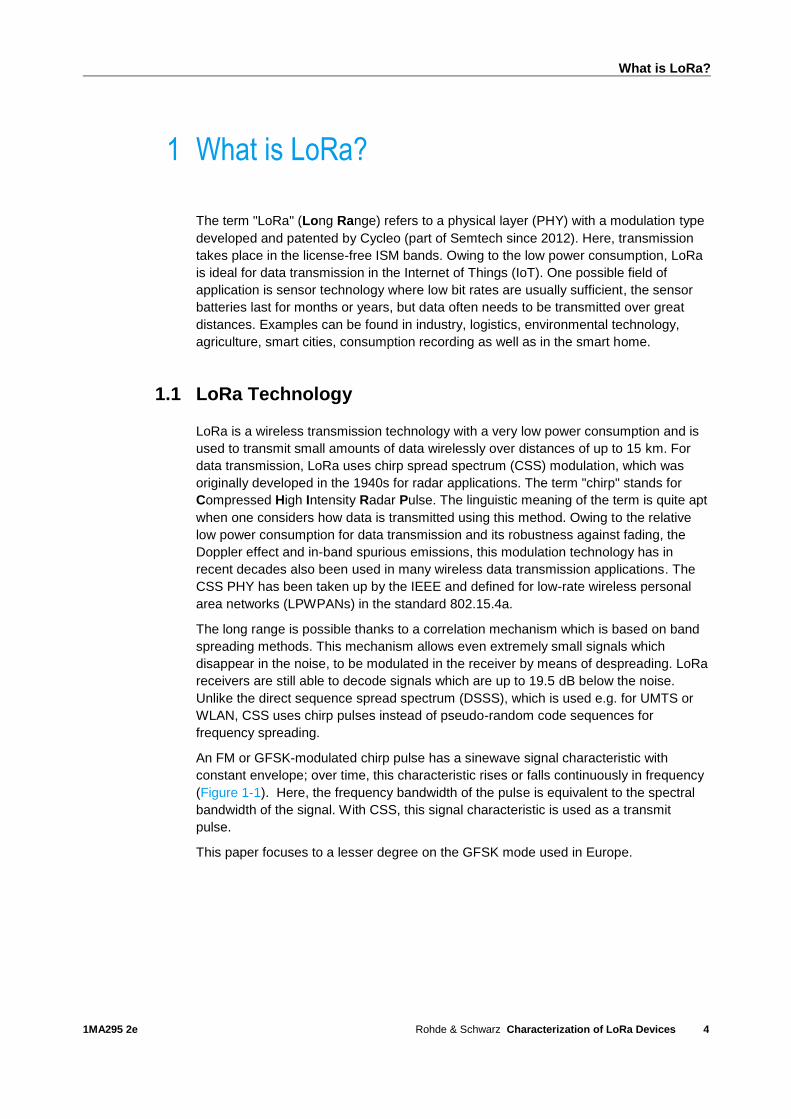
21. The marker now indicates the highest level value M1 within the frequency range to
be analyzed (Figure 2-16).
Figure 2-16: Measurement of maximum radiated power at lower edge of ISM band
22. The following condition must be fulfilled: Reflow – M1 ≥ 30 dB
2.1.6 20 dB Bandwidth (FHSS)
According to FCC 15.247(a)(1), in the frequency range 902 MHz to 928 MHz the 20 dB
bandwidth of a frequency hopping spread spectrum (FHSS) transmit signal must not
exceed the value of 500 kHz. For a LoRa signal in FHSS mode, this means that the
20 dB bandwidth of 500 kHz must not be exceeded for the signal bandwidths 125 kHz
and 250 kHz. The following measurements are performed in line with FCC Public
Notice DA 00-705 Measurement Guidelines for FHSS Systems.
Settings on DUT:
23. As described under 2.1.1, fTX = 915 MHz, but LoRa signal bandwidth 125 kHz,
SF = 7
Settings on FPL1000:
24. Press the Preset key.
25. Press the Freq key and enter the transmit frequency set on the DUT.
26. Press the Span key and set the span to at least 2 to 3 times the 20 dB bandwidth
to be expected.
27. Press the BW key and set the resolution bandwidth (RBW) to approx. 1% of the
20 dB bandwidth to be expected. Set the video bandwidth to 3 x RBW.
28. Press the Trace key and select Trace 1. Under Trace 1, select the Max Hold
mode and, under Detector Type, set the Positive Peak detector.
29. Press the Sweep key and set Sweep Time to 5 ms.

RF Measurements
1MA295 2e Rohde & Schwarz Characterization of LoRa Devices
27
30. Press the Ampt key and set the reference level using the Auto Level menu key.
31. Press the Mkr key and select Select Marker Function. In the Markers tab, select
n dB down and enter 20 dB in the Value entry field. Wait until the trace is stable. If
necessary, use the measured value for the 20 dB bandwidth (n dB down BW) to
adjust the span and resolution bandwidth in line with the conditions named above.
Wait until the trace has stabilized. Figure 2-17 shows the result of the
measurement.
Figure 2-17: Measurement of 20 dB bandwidth, LoRa signal bandwidth 125 kHz, SF = 7
32. The following condition must be fulfilled: ndB down BW ≤ 500 kHz
Settings on DUT:
33. As described under 2.1.1, fTX = 915 MHz, but LoRa signal bandwidth 250 kHz,
SF = 7
Settings on FPL1000:
34. As described above under points 1 to 10. Figure 2-18 shows the result of the
measurement for a LoRa signal with 250 kHz bandwidth.

RF Measurements
1MA295 2e Rohde & Schwarz Characterization of LoRa Devices
28
Figure 2-18: Measurement of 20 dB bandwidth, LoRa signal bandwidth 250 kHz, SF = 7
35. The following condition must be fulfilled: ndB down BW ≤ 500 kHz
2.1.7 Power Spectral Density (Hybrid Mode)
According to FCC 15.247 (a)(2), in the frequency range 902 MHz to 928 MHz the 6 dB
signal bandwidth of a digitally modulated signal must be at least 500 kHz. For smaller
LoRa bandwidths 125 kHz and 250 kHz, the data transmission must therefore take
place in the so-called hybrid mode. This mode allows a combination of frequency
hopping and digital modulation technology. According to FCC 15.247(e), the power
spectral density (PSD) of a transmitter must at no time exceed the value of 8 dBm
relative to a bandwidth of 3 kHz during an ongoing data transmission.
Settings on DUT:
1. As described under 2.1.1, fTX =915 MHz, but LoRa signal bandwidth 125 kHz,
SF = 7
Settings on FPL1000 for measurement of OBW (measurement in line with ANSI
C63-10[6] Section 6.9.3):
2. Press the Preset key.
3. Press the Freq key and enter the transmit frequency set on the DUT.
4. Press the Span key and set the span to 600 kHz (1.5 to 5 x OBW).
5. Press the BW key and set the resolution bandwidth to 10 kHz (1% to 5% of the
OBW) and the video bandwidth to 30 kHz (approx. 3x RBW).
6. Press the Sweep key and set Sweep Time to 10 ms.

RF Measurements
1MA295 2e Rohde & Schwarz Characterization of LoRa Devices
29
7. Press the Trace key and select Trace 1. Select the Positive Peak detector and
Max Hold.
8. Press the Ampt key and set Reference Level such that the maximum value of the
signal is at least 10log(OBW/RBW) below the reference level.
9. Press the Meas key and select OBW under Power Measurements. Wait until the
trace is stable.
10. Note down the measured value for Occ BW = OBWSF7,125kHz.
Settings on DUT:
11. SF = 12; retain all other settings.
Settings on FPL1000:
12. Press the Sweep key, set Sweep Time to 100 ms and wait until the trace has
stabilized.
13. Note down the measured value for Occ BW = OBWSF12,125kHz.
Settings on DUT:
14. SF = 7; retain all other settings.
Settings on FPL1000 for measurement of PSD:
15. Press the Span key and set the span to at least 1.5 x OBWSF7,125kHz.
16. Press the BW key and set the resolution bandwidth (RBW) to 3 kHz and the video
bandwidth to 3 x RBW ≈ 10 kHz.
17. Press the Trace key and select Trace 1. Under Trace 1, select the Average mode
and, under Detector Type, set the RMS detector. In the Average Count entry field,
enter a value of at least 100.
18. Press the Sweep key and set Sweep Time to 10 ms.
19. Press the Ampt key and set the reference level using the Auto Level menu key.
20. Press the Run Single key and wait until the number of averaging operations set
under Average Count have been performed.
21. Press the Mkr-> key and select Peak.
The measurement result is shown in Figure 2-19.

RF Measurements
1MA295 2e Rohde & Schwarz Characterization of LoRa Devices
30
Figure 2-19: Power spectral density measurement, LoRa signal SF = 7, 125 kHz
22. The following conditions must be fulfilled: Power marker M1 ≤ 8 dBm
Settings on DUT:
23. SF = 12; retain all other settings.
Settings on FPL1000:
24. Press the Span key and set the span to at least 1.5 x OBWSF12,125kHz.
25. Press the Sweep key and set Sweep Time to 100 ms.
26. Press the Ampt key and set the reference level using the Auto Level menu key.
27. Press the Run Single key and wait until the number of averaging operations set
under Average Count have been performed.
28. Press the Mkr-> key and select Peak.
The measurement result is shown in Figure 2-20.

RF Measurements
1MA295 2e Rohde & Schwarz Characterization of LoRa Devices
31
Figure 2-20: Power spectral density measurement, LoRa signal SF = 12, 125 kHz
29. The following conditions must be fulfilled: Power marker M1 ≤ 8 dBm
Settings on DUT:
30. As described under 2.1.1, fTX = 915 MHz, but LoRa signal bandwidth 250 kHz,
SF = 7
Settings on FPL1000 for measurement of OBW (measurement in line with ANSI
C63-10[6] Section 6.9.3):
31. Press the Span key and set the span to 750 kHz (1.5 to 5 x OBW).
32. Press the BW key and set the resolution bandwidth to 10 kHz (1% to 5% of the
OBW) and the video bandwidth to 30 kHz (approx. 3x RBW).
33. Press the Sweep key and set Sweep Time to 10 ms.
34. Press the Trace key and select Trace 1. Select the Positive Peak detector and
Max Hold.
35. Press the Ampt key and set Reference Level such that the maximum value of the
signal is at least 10log(OBW/RBW) below the reference level.
36. Press the Meas key and select OBW under Power Measurements. Wait until the
trace is stable.
37. Note down the measured value for Occ BW = OBWSF7,250kHz.
Settings on DUT:
38. SF = 12; retain all other settings.

RF Measurements
1MA295 2e Rohde & Schwarz Characterization of LoRa Devices
32
Settings on FPL1000:
39. Press the Sweep key, set Sweep Time to 100 ms and wait until the trace has
stabilized.
40. Note down the measured value for Occ BW = OBWSF12,500kHz.
Settings on DUT:
41. SF = 7; retain all other settings.
Settings on FPL1000 for measurement of PSD:
42. Press the Span key and set the span to at least 1.5 x OBWSF7,250kHz.
43. Press the BW key and set the resolution bandwidth (RBW) to 3 kHz and the video
bandwidth to 3 x RBW ≈ 10 kHz.
44. Press the Trace key and select Trace 1. Under Trace 1, select the Average mode
and, under Detector Type, set the RMS detector. In the Average Count entry field,
enter a value of at least 100.
45. Press the Sweep key and set Sweep Time to 10 ms.
46. Press the Ampt key and set the reference level using the Auto Level menu key.
47. Press the Run Single key and wait until the number of averaging operations set
under Average Count have been performed.
48. Press the Mkr-> key and select Peak.
The measurement result is shown in Figure 2-21.
Figure 2-21: Power spectral density measurement, LoRa signal SF = 7, 250 kHz
49. The following conditions must be fulfilled: Power marker M1 ≤ 8 dBm
Settings on DUT:
50. SF = 12; retain all other settings.

RF Measurements
1MA295 2e Rohde & Schwarz Characterization of LoRa Devices
33
Settings on FPL1000:
51. Press the Span key and set the span to at least 1.5 x OBWSF12,125kHz.
52. Press the Sweep key and set Sweep Time to 100 ms.
53. Press the Ampt key and set the reference level using the Auto Level menu key.
54. Press the Run Single key and wait until the number of averaging operations set
under Average Count have been performed.
55. Press the Mkr-> key and select Peak. The measurement result is shown in Figure
2-22.
Figure 2-22: Power spectral density measurement, LoRa signal SF = 12, 250 kHz
56. The following conditions must be fulfilled: Power marker M1 ≤ 8 dBm
2.2 LoRa RX Test
2.2.1 RX Sensitivity
For the RX sensitivity test, the SMBV100B generates a LoRa test signal. Signal bandwidth, spreading factor, payload length, level, frequency, etc. are variably adjustable. The generated signal is fed to the receiver in the appropriate frequency range (Figure 2-23). While the signal power is being reduced, the LoRa test tool is used to read out and monitor the packet error rate (PER). The receiver sensitivity up to which no bit errors or very few bit errors occur depends on the used spreading factor and ranges from approx ‒117 dBm to ‒137 dBm.

RF Measurements
1MA295 2e Rohde & Schwarz Characterization of LoRa Devices
34
Figure 2-23: Test setup for RX sensitivity measurement
Settings on SMBV100B:
1. Press the PRESET key.
2. Under BASEBAND select the LoRa Standard:
3. Under the Tab General, set the desired bandwidth for the LoRa signal, here
500 kHz:

RF Measurements
1MA295 2e Rohde & Schwarz Characterization of LoRa Devices
35
4. Under the tab Frame Configuartion General set the desired values for Coding
Rate and Spreading Factor:
5. Under the tab Frame Configuartion Data, set the Payload Data Length and under
Data Source select suitable Payload data:
6. Using the FREQ and LEVEL keys, set the desired frequency and level values.
Switch on the test signal using the RF On/Off and Mod On/Off key:

RF Measurements
1MA295 2e Rohde & Schwarz Characterization of LoRa Devices
36
Settings on DUT:
7. Using the LoRa test tool, configure the receiver for reception of the test signal.
8. Reduce the level of the test signal until a defined PER value is exceeded, e.g. 1%.
The level set on the signal generator corresponds to the receiver sensitivity.
2.2.2 Blocking Test
The blocking test is used to check the behavior of the receiver when an interference
signal is applied.
The test setup in Figure 2-24 consists of two signal generators, the signals from which
are fed to the DUT as a sum signal via a power combiner. Generator #1 generates an
unmodulated, sinewave interference signal which is transmitted either with a spacing of
200 kHz relative to the wanted signal (adjacent channel blocking) or at the same
frequency as the wanted signal (on-channel blocking). The SGS100A signal generator
used here is configured via a LAN or USB connection using a PC and the R&S SGMA
GUI software. Generator #2 supplies the LoRa wanted signal, which is generated as
described under 2.2.1. The PER value is measured using the LoRa test tool.
Figure 2-24: Blocking measurement at a LoRa receiver

RF Measurements
1MA295 2e Rohde & Schwarz Characterization of LoRa Devices
37
Adjacent channel blocking:
Settings on SMBV100B and DUT:
1. As described under 2.2.1, points 1 to 7.
Settings on SGS100A:
2. Perform a preset.
3. Set the frequency with a spacing of +200 kHz relative to the wanted signal
frequency used under 2.2.1, point 4.
4. Set the level such that it is 82 dB (uplink) or 78 dB (downlink) above the receiver
sensitivity value determined under 2.2.1, point 8.
Settings on SMBV100B:
5. Increase the wanted signal level until PER < 1% is reached.
6. The following condition must be fulfilled: The wanted signal level now set must not
be more than 3 dB above the receiver sensitivity value determined in 2.2.1,
point 8.
Settings on SGS100A:
7. Set the frequency with a spacing of ‒200 kHz relative to the wanted signal
frequency used under 2.2.1, point 4.
8. Repeat steps 4 to 6.
On-channel blocking:
Settings on SMBV100B and DUT:
9. As described under 2.2.1, points 1 to 7.
Settings on SGS100A:
10. Frequency = wanted signal frequency set under 2.2.1, point 4
11. Set the level such that it is 20 dB above the receiver sensitivity value determined
under 2.2.1, point 8.
Settings on SMBV100B:
12. Increase the wanted signal level until PER < 1% is reached.
13. The following condition must be fulfilled: The wanted signal level now set must not
be more than 3 dB above the receiver sensitivity value determined in 2.2.1,
point 8.

Production Line Testing
1MA295 2e Rohde & Schwarz Characterization of LoRa Devices
38
3 Production Line Testing
The CMW100 is the instrument of choice for production line testing. The features that
set the CMW100 apart from any other instrument in the market are the reduced test
time, measurement accuracy and the capability of performing test on 8 devices in
parallel. With the activated CMW100 option R&S®CMW-KW683, all eight ports can
transmit LoRa signals for testing the LoRa DUTs. CMW-KW683 comes with one LoRa
waveform file with 125 kHz bandwidth as an example. Further LoRa waveforms with
different parameters can be created with the free simulation software WinIQSIM2 (see
chapter 3.2 Creating LoRa Waveforms with WinIQSIM).
R&S® Forum is a free scripting tool for remote control of Rohde & Schwarz
instruments. It allows users to create script sequences, as well as interactive remote
control of instruments. For automated tests via remote control R&S® Forum can be
used (Figure 3-1, Figure 3-2). R&S® Forum is a free scripting tool for remote control of
Rohde & Schwarz instruments. It allows users to create script sequences, as well as
interactive remote control of instruments. Script files can range from simple command
sequences to complex programs using the popular Python programming language
3.1 LoRa RX Test with CMW100
3.1.1 RX Sensitivity
For the RX sensitivity test, the CMW100 generates a LoRa test signal by using LoRa
ARB waveform files with different parameters like signal bandwidth and spreading
factor (requires option CMW-KW683). The generated signal is fed to the receiver in the
appropriate frequency range (Figure 3-1). While the signal power is being reduced, the
LoRa test tool is used to read out and monitor the packet error rate (PER). The
receiver sensitivity up to which no bit errors or very few bit errors occur depends on the
used spreading factor and ranges from approx. ‒117 dBm to ‒137 dBm.
Figure 3-1: Test setup for RX sensitivity measurement with CMW100

Production Line Testing
1MA295 2e Rohde & Schwarz Characterization of LoRa Devices
39
Settings on CMW100:
1. Start the CMW100 Firmware on the PC and press the RESET key from the right
toolbar key. Select Global (all Applications) and press Preset:
2. In order to activate the signal generator press the SIGNAL GEN key from the right
toolbar and mark the generator taskbar entry. Press the GPRF Generator key
from the button toolbar.
3. Select the RF connectors on which the LORA signal should be output. Set the
baseband Mode to ARB and press the key Select ARB file… from the bottom
toolbar:

Production Line Testing
1MA295 2e Rohde & Schwarz Characterization of LoRa Devices
40
4. Choose the LoRa waveform file to use for the RX sensitivity test:
5. Using the FREQ and LEVEL keys on the bottom toolbar, set the desired
frequency and level values. Switch on the test signal using the GPRF Generator
button from the right toolbar:

Production Line Testing
1MA295 2e Rohde & Schwarz Characterization of LoRa Devices
41
Settings on DUT:
6. Using the LoRa test tool, configure the receiver for reception of the test signal.
7. Reduce the level of the test signal until a defined PER value is exceeded, e.g. 1%.
The level set on the signal generator corresponds to the receiver sensitivity.
3.1.2 Blocking Test
The blocking test is used to check the behavior of the receiver when an interference
signal is applied.
The test setup in Figure 3-2 consists of two signal generators, the signals from which
are fed to the DUT as a sum signal via a power combiner
Generator #1 generates an unmodulated, sinewave interference signal which is
transmitted either with a spacing of 200 kHz relative to the wanted signal (adjacent
channel blocking) or at the same frequency as the wanted signal (on-channel
blocking). The SGS100A signal generator used here is configured via a LAN or USB
connection using a PC and the R&S SGMA GUI software. Generator #2 (CMW100)
supplies the LoRa wanted signal, which is generated as described under 3.1.1. The
PER value is measured using the LoRa test tool.

Production Line Testing
1MA295 2e Rohde & Schwarz Characterization of LoRa Devices
42
Figure 3-2: Blocking measurement at a LoRa receiver with CMW100
Adjacent channel blocking:
Settings on CMW100 and DUT:
1. As described under 3.1.1, points 1 to 6.
Settings on SGS100A:
2. Perform a preset.
3. Set the frequency with a spacing of +200 kHz relative to the wanted signal
frequency used under 3.1.1, point 5.
4. Set the level such that it is 82 dB (uplink) or 78 dB (downlink) above the receiver
sensitivity value determined under 3.1.1, point 7.
Settings on CMW100:
5. Increase the wanted signal level until PER < 1% is reached.
6. The following condition must be fulfilled: The wanted signal level now set must not
be more than 3 dB above the receiver sensitivity value determined in 3.1.1,
point 7.
Settings on SGS100A:
7. Set the frequency with a spacing of ‒200 kHz relative to the wanted signal
frequency used under 2.2.1, point 5.
8. Repeat steps 4 to 6.
On-channel blocking:

Production Line Testing
1MA295 2e Rohde & Schwarz Characterization of LoRa Devices
43
Settings on CMW and DUT:
9. As described under 2.2.1, points 1 to 6.
Settings on SGS100A:
10. Frequency = wanted signal frequency set under 2.2.1, point 5.
11. Set the level such that it is 20 dB above the receiver sensitivity value determined
under 2.2.1, point 7.
Settings on CMW100:
12. Increase the wanted signal level until PER < 1% is reached.
13. The following condition must be fulfilled: The wanted signal level now set must not
be more than 3 dB above the receiver sensitivity value determined in 2.2.1,
point 7.
3.2 Creating LoRa Waveforms with WinIQSIM2
WinIQSIM2 was especially developed to easily generate digitally modulated signals on
a PC. The graphical user interface allows intuitive operation by offering a convenient
way to create standard-conforming waveforms for many configurable digital standards.
WinIQSIM2 is a freeware and can be downloaded from the R&S website.
In order to create new LoRa waveforms for the TX test follow the steps below:
1. In WinIQSim2 select LoRa.. in the Baseband menu:
2. Configure the LoRa waveform parameters like bandwidth, number of frames, coding
rate, spreading factor etc. for your needs:

Production Line Testing
1MA295 2e Rohde & Schwarz Characterization of LoRa Devices
44
3. After all parameters are adjusted start the calculation of the LoRa waveform by
using the on / off switch. Press Generate Waveform and store the new LoRa
waveform on the CMW100 control PC in "C:\ProgramData\Rohde-
Schwarz\CMW\Data\waveform\"
4. The new waveform is now ready for use together with the CMW100 as described
under 3.1.1, points 1 to 6.
Production Line Testing
1MA295 2e Rohde & Schwarz Characterization of LoRa Devices
45
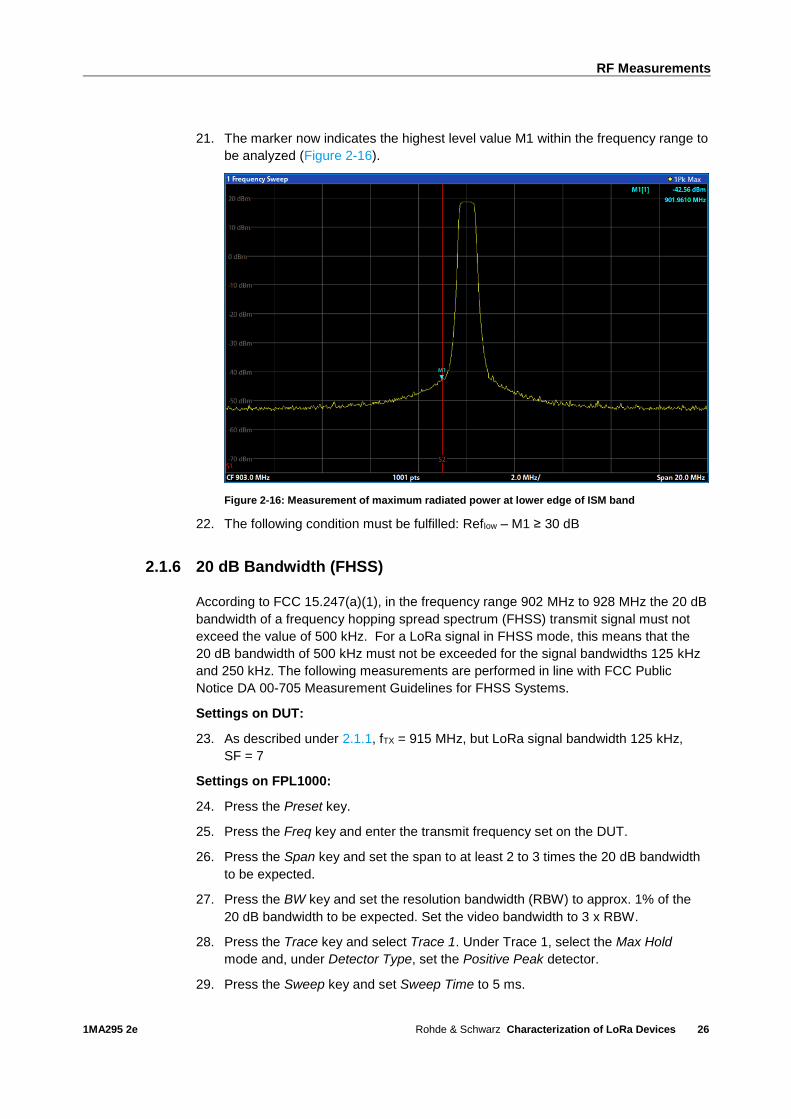
3.3 Example for Automation Scripts
The automation script introduced in this section is written in Python programming
language for use with the Forum development environment. Forum is a freeware and
can be downloaded from the R&S website. For detailed information, please see the
Application Note 1MA196 R&S® Application for Remote Control of Rohde & Schwarz
Instruments. Fig. 3-1 shows the Forum screen for the LoRa application.
Fig. 3-1: Screenshot of the Forum application for instrument remote control
The T&M instruments and the LoRa device under test can both be directly controlled
from this platform.
When FORUM is started for the first time, the T&M instruments need to be connected:
In Forum, select Settings > Instruments > Add
Configure the T&M instruments as shown in Fig. 3-2
Fig. 3-2: Instrument connection configuration on FORUM

Production Line Testing
1MA295 2e Rohde & Schwarz Characterization of LoRa Devices
46
Setup parameters can be easily changed in the program. After the next restart, the
changes are accounted. The automatic run can be halted at any time and some
additional tests then can be done by operating the instrument manually. DUT control
commands can also be directly issued from Forum in an interactive way, so that the
automatic run can be optimized step-by-step.
Python, the programming language behind Forum, offers various features beyond
instrument and DUT control. Text output files can be created and written to generate
complete test reports.
As an example the forum script “1MA295_CMW100 RX test config” automates and
configures CMW100 in the general-purpose generator mode, selects the ARB file from
the destination folder and switches on the RF.
The option R&S®CMW-KW683 needs to be installed on the CONTROL-PC.
The example waveform file "KW683_LoRa_125kHz_1frame.wv" is located in
"C:\ProgramData\Rohde-Schwarz\CMW\Data\waveform\" Fig. 3-3 shows a part of the
FORUM automation script for configuring the CMW100.
Fig. 3-3: Forum configuration of CMW100 for general-purpose generator mode
Line 63 loads the ARB file, which is defined in line 22 from the destination waveform
library folder. Lines 39 to 42 initializes the CMW100 and lines 51 to 64 configures the
instrument in the general purpose RF generator mode, sets the frequency, power level
and switches ON the RF signal transmission.

Battery Life Measurement
1MA295 2e Rohde & Schwarz Characterization of LoRa Devices
47
4 Battery Life Measurement
The power consumption of a LoRa device per transmission over time is a significant
performance metric. A key requirement for any IoT device is to have a long battery life.
In order to calculate the total service time or end of life using the same set of
battery(s), the power consumption per packet transmission need to be measured. The
devices normally switch to sleep mode for majority of its life span and only switch on to
operational mode in order to transmit data to the LoRa gateway. While operating in
sleep mode, the device experiences almost no battery drain and thus has a battery life
of ~10 to 15 years. To make sure that the mentioned battery life will be achieved, it is
also necessary to measure the power consumption in sleep mode.
The DUT that is used in this section is a LoRa capable prototype.
1. Set up the DUT and the test Instruments as shown in Figure 4-1.
Figure 4-1: Test setup for power consumption measurement on LORA devices
2. Next select Horizontal -> Setup and Configure as shown in Figure 4-2

Battery Life Measurement
1MA295 2e Rohde & Schwarz Characterization of LoRa Devices
48
Figure 4-2: Data Acquisition Setup on the RTO
3. Next select Vertical -> ZVC Multi-Channel Probe
4. Configure as shown in Figure 4-3
Figure 4-3: ZVC measurement configuration on the RTO
5. Next Select click on setting button for Z1I1
For the current measurement the RTO contains switchable shunts with the values
10 mΩ, 10 Ω and 10 kΩ. Thus, current measuring ranges from 4.5 μA to 10 A full scale
are available (Figure 4-4).
Measurement tip: for maximum flexibility, the probe can also be operated with an
external shunt that should ideally be integrated into the test setup from the beginning.
This allows adjusting the full-scale range to the expected current consumption by
selecting an appropriate shunt resistor. This leads to a measurement with higher
resolution and lower noise. In this example, the maximum expected current is
~150 mA. A 2.2 Ω resistor in the 450mV measurement range gives a current full-scale

Battery Life Measurement
1MA295 2e Rohde & Schwarz Characterization of LoRa Devices
49
range of 450mV / 2.2 Ω = 205 mA. For the sake of simplicity, this application note uses
the internal shunt with 4.5 A current range.
6. The maximum current consumption of the DUT appears to be ~150 mA, which
means that the 4.5A current range has to be chosen. Configure ZVC Current
Settings as shown in Figure 4-4
Figure 4-4: Current Measurement configuration on the RTO
7. Click on Math -> Math Setup
8. Configure the two sources and operator as shown in Figure 4-5.

Battery Life Measurement
1MA295 2e Rohde & Schwarz Characterization of LoRa Devices
50
Figure 4-5: Math function configuration for power measurement on the RTO
9. Next select Measurements -> Setup
10. Configure the Measurement Area as shown in Figure 4-6
Figure 4-6: Measurement Area settings

Battery Life Measurement
1MA295 2e Rohde & Schwarz Characterization of LoRa Devices
51
Figure 4-7 shows two plots in total. The upper plot shows both the supply voltage plot
and the current drain over time. In this plot, the current drain during packet
transmission can be seen. The lower plot shows the total power consumption over
time. Using the area (integral) measurement function on the math channel with gating
enabled allows to measure the energy consumed during one transmit frame which was
1.7535 Ws.
Figure 4-7: Power consumption measurement results on the RTO
In order to configure gated area measurement:
ı Select Meas -> Setup -> Enable > Source 1 : M1
ı Select Main : Area
ı Select Meas -> Gate/Display -> Use Gate
ı Set Start and stop time as required.
In Figure 4-8, Start: -3 s & Stop: + 3s.

Battery Life Measurement
1MA295 2e Rohde & Schwarz Characterization of LoRa Devices
52
Figure 4-8: Settings for the gated area measurement

References
1MA295 2e Rohde & Schwarz Characterization of LoRa Devices
53
5 References
[1] Federal Communications Commission. 2017. Part 15.247 of the Electronic
Code of Federal Regulations. 2017.
[2] IEEE. 2013. American National Standard of Procedures for Compliance Testing of
Unlicensed Wireless Devices. 2013. ANSI C63.10-2013.
[3] LoRa Alliance. 2017. LoRaWAN 1.1 Regional Parameters. 2017.
[4] —. 2017. LoRaWan 1.1 Specification. 2017.
[5] SEMTECH. 2015. AN1200.22 LoRa Modulation Basics. 2015.
[6] —. 2015. AN1200.26 LoRa and FCC Part 15.247 Measurement Guidance. 2015.
[7] Technical Marketing Workgroup 1.0. 2015. LoRaWan What is it? 2015.

Ordering Information
1MA295 2e Rohde & Schwarz Characterization of LoRa Devices
54
6 Ordering Information
Spectrum analyzer
Designation Type Order No.
Spectrum Analyzer 5 kHz to 3 GHz1)
R&S®FPL1003 1304.0004.03
Signal generators
Designation Type Order No.
Vector Signal Generator including baseband generator with ARB (64 Msamples, 120MHz RF bandwidth)1)
R&S®SMBV100B
1423.1003.02
8 kHz to 3 GHz R&S® SMBVB-B103 1423.6270.02
Baseband Realtime Extension R&S® SMBVB-K520 1423.7676.02
LoRa R&S®SMBVB-K131 1423.8720.02
SGMA RF Source 1) R&S®SGS100A 1416.0505.02
1 MHz to 6 GHz, CW (no modulation)
R&S®SGS-B106 1416.2308.02
Electronic Step Attenuator R&S®SGS-B26 1416.1353.02
Digital oscilloscope
Designation Type Order No.
Digital oscilloscope 600MHz, 2 channels, 10 Gsamples/s, 50/100 Msample1)
R&S®RTO2002 1329.7002k02
Digital Extension Port for RT-ZVC Support
R&S®RTO-B1E 1333.0738.02
Multi channel power probe, 1 MHz, 5 MSa/s, 18 Bit, 2/4 current inputs, 2/4 voltage inputs
R&S®RT-ZVC04 1326.0259.04
Extended Cable Set, 1 current and 1 voltage lead, length: 1 m
R&S®RT-ZA35 1333.1905.02
Solder-in Cable set,
4 current and voltage solder-in cables, solder-in pins
R&S®RT-ZA36 1333.1911.02
1) Further equipment options can be found at www.rohde-schwarz.com or contact your local Rohde & Schwarz representative.

Ordering Information
1MA295 2e Rohde & Schwarz Characterization of LoRa Devices
55
Communications Manufacturing Test Set
Designation Type Order No.
Communications Manufacturing Test Set
R&S®CMW100 1201.0002K03
Control Unit for R&S®CMW100 R&S®CMW100CTR 1210.7935K03
Spectrum analyzer R&S®CMW-KM010 1203.5953.02
Low Rate WAN (LoRa),
enable WinIQSIM2 waveforms for
ARB generator
R&S®CMW-KW683 1211.4081.02

Rohde & Schwarz
The Rohde & Schwarz electronics group offers
innovative solutions in the following business fields:
test and measurement, broadcast and media, secure
communications, cybersecurity, monitoring and
network testing. Founded more than 80 years ago,
this independent company has an extensive sales
and service network with locations in more than 70
countries.
The electronics group ranks among the world market
leaders in its established business fields. The
company is headquartered in Munich, Germany. It
also has regional headquarters in Singapore and
Columbia, Maryland, USA, to manage its operations
in these regions.
Regional contact
Europe, Africa, Middle East +49 89 4129 12345 [email protected] North America 1 888 TEST RSA (1 888 837 87 72) [email protected] Latin America +1 410 910 79 88 [email protected] Asia Pacific +65 65 13 04 88 [email protected]
China +86 800 810 82 28 |+86 400 650 58 96 [email protected]
Sustainable product design
ı Environmental compatibility and eco-footprint
ı Energy efficiency and low emissions
ı Longevity and optimized total cost of ownership
This document and any included programs may be
used only upon acceptance of the terms and
conditions of use as defined in the downloads area
of the Rohde & Schwarz Internet site.
R&S® is a registered trademark of Rohde & Schwarz GmbH &
Co. KG. Trade names are trademarks of the owners.
Rohde & Schwarz GmbH & Co. KG
Mühldorfstrasse 15 | D - 81671 München, Germany
Phone + 49 89 4129 - 0 | Fax + 49 89 4129 – 13777
www.rohde-schwarz.com
PA
D-T
-M: 3573.7
380.0
3/0
2.0
6/E
N/


![IQ Impedance Modulator Front-End for Low-Power LoRa ...devices using current cellular communication bands and infrastructures. LoRa technology presents the lowest sensitivity [8].](https://static.fdocuments.in/doc/165x107/5fad932048bbc047cb107245/iq-impedance-modulator-front-end-for-low-power-lora-devices-using-current-cellular.jpg)