Characterization of drivers maintaining atrial ...
38
1 Characterization of drivers maintaining atrial fibrillation; correlation with markers of rapidity and organization on spectral analysis Honarbakhsh S* MRCP BSc, Schilling RJ* FRCP FESC MD, Providencia R* MD, Keating E* BAppSc IBHRE CCDS, Chow A* FRCP MD, Sporton S* FRCP MD, Lowe MD* FRCP MD, Earley MJ* FRCP MD, Lambiase PD* FRCP PhD, Hunter RJ* FESC PhD. *Barts Heart Centre, St Bartholomew’s Hospital, Barts Health NHS Trust, Department of Arrhythmia Management, London, United Kingdom Corresponding Author: Dr Ross J Hunter FESC PhD Electrophysiology Consultant Barts Heart Centre Barts Health NHS Trust W. Smithfield EC1A 7BE Email: [email protected]
Transcript of Characterization of drivers maintaining atrial ...

1
Characterization of drivers maintaining atrial fibrillation; correlation with
markers of rapidity and organization on spectral analysis
Honarbakhsh S* MRCP BSc, Schilling RJ* FRCP FESC MD, Providencia R* MD,
Keating E* BAppSc IBHRE CCDS, Chow A* FRCP MD, Sporton S* FRCP MD,
Lowe MD* FRCP MD, Earley MJ* FRCP MD, Lambiase PD* FRCP PhD, Hunter RJ*
FESC PhD.
*Barts Heart Centre, St Bartholomew’s Hospital, Barts Health NHS Trust, Department
of Arrhythmia Management, London, United Kingdom
Corresponding Author:
Dr Ross J Hunter FESC PhD
Electrophysiology Consultant
Barts Heart Centre
Barts Health NHS Trust
W. Smithfield
EC1A 7BE
Email: [email protected]

2
ABSTRACT
Background:
The mechanistic role of localized drivers in persistent atrial fibrillation (AF) remains
uncertain. Characteristics of these drivers remains to be established.
Methods:
Patients undergoing catheter ablation for persistent AF were included. The
CARTOFINDER mapping system was used to identify drivers with rotational or focal
activity. The effect of ablation on drivers identified post-PV isolation was assessed and
the correlation to sites of fastest cycle length (CL), highest dominant frequency (DF)
and greatest organization using lowest CL variability and highest regularity index (RI)
as surrogates. Drivers temporal stability and recurrence rate were assessed and the
effect of PV isolation evaluated.
Results:
Thirty patients were included with 154 CARTOFINDER maps created. Potential
drivers were mapped in 29/30 patients. Forty-four potential drivers were identified with
a pre-defined ablation response in 39 (89%): 23 rotational and 16 focal. The drivers
demonstrated spatial stability with temporal periodicity with no driver demonstrating a
consecutive repetition of >6 cycles. CL stability correlated best to the driver sites (29/39
confirmed drivers, 74%). Fastest CL and highest DF correlated to driver sites whereby
the drivers showed greater temporal stability and recurrence rate. Drivers with
rotational activity showed a predilection to low voltage zones (74%) whilst focal drivers
did not (56%). PV isolation did not impact AF CL or driver site CL, DF, CL variability
and RI.

3
Conclusions:
Drivers were identified in almost all patients in the form of intermittent but repetitive
focal or rotational activation patterns. The mechanistic importance of these phenomena
was confirmed by ablation response.
Keywords: Atrial fibrillation, Rotors, Dominant frequency, Cycle length, Pulmonary
vein isolation

4
INTRODUCTION
Localized sources in the form of rotors or focal discharges may sustain AF (1-4). Data
is conflicting as to whether these drivers are temporally stable (1) or intermittent (2-4).
Optical mapping in sheep has suggested that AF is maintained by high frequency
sources and that electrograms recorded at these sites have rapid cycle length (CL) and
a high dominant frequency (DF) (5, 6). Mapping studies in humans have identified sites
with high DF (7-9). Pulmonary vein (PV) isolation and linear ablation has shown to
reduce global left atrial (LA) DF (9, 10). In one study ablation at sites of high DF
resulted in CL prolongation or AF termination (11). However, others have argued that
the lack of spatiotemporal stability of DF sites suggests that they cannot represent sites
of stable drivers (12, 13).
Better characterization of drivers in the human LA may facilitate their identification
using sequential mapping. Our group and others have recently reported mapping AF
drivers using the CARTOFINDER system (3). We sought to characterize drivers in
detail and study their relationship with electrogram characteristics in the time and
frequency domain.
METHODS
Patients undergoing catheter ablation for persistent AF (<24 months and no previous
AF ablation) were prospectively included. All procedures were performed with un-
interrupted anticoagulation therapy and intravenous heparin administration to achieve
an ACT of 300-350ms. The procedures were performed either under conscious sedation
or general anesthesia. Patients provided informed consent for their involvement in this
5
study, and the study was approved by the UK National Research Ethics Service
(16/LO/1379) and complies with declaration of Helsinki. The study was registered on
clinicaltrials.gov as a sub-study of an ongoing trial (NCT02950844).
i) Electrophysiological mapping
Mapping was performed with CARTOFINDER (CARTO, Biosense Webster, Inc, CA)
(3). LA geometry and a high-density bipolar voltage map were created using a
PentaRay® NAV catheter with 2-6-2mm electrode spacing (Biosense Webster, Inc,
CA). Points that were ≥3mm from the geometry surface were filtered as not being in
contact with the myocardium, and points were respiratory gated. To collect the
wavefront maps, a 50mm or 60mm 64-pole basket catheter was used to record unipolar
signals (Constellation, Boston Scientific, Natick, MA and FIRMap Abbott, CA, USA).
The catheter was sized from the LA diameters obtained from a transthoracic
echocardiogram performed on the day of the procedure as advised by the manufacturer.
A decapolar catheter (Biosense Webster, Inc, CA) was positioned in the coronary sinus
(CS). A Thermocool© SmartTouch™ or Thermocool© SmartTouch Surround Flow™
catheter (Biosense Webster, Inc, CA) was used for ablation. The basket catheter was
positioned in the LA through an 8Fr Mullen’s (Cook Medical, In, USA) or 8.5Fr SL1
sheath (Daig Medical, MN).
All patients had wide area circumferential ablation to achieve PV isolation. Pre and
post-PV isolation all patients had a minimum of two CARTOFINDER maps created
with the basket catheter repositioned between recordings. The post-PV isolation maps
guided further ablation in the LA. This was commenced 20min post-PV isolation to
eliminate any delayed effect of PV isolation on CL prolongation during ablation in the

6
LA body. Plausible AF drives were defined as ≥1.5 360 degrees rotations or ≥2 focal
discharges with radial spread (3). Driver sites were ablated and a confirmed driver was
defined as one whereby ablation resulted in i) slowing of CL ≥30ms ii) organization to
AT iii) termination to sinus rhythm (3). The electrogram characteristics at the
confirmed driver sites were reviewed offline.
ii) Ablation strategy at driver site
The ablation strategy used in this study has been described previously (3). In brief a
lesion was delivered at the center of the driver site with further ablation surrounding
the initial lesion in a cluster, avoiding the creation of linear lesions. Ablation was
stopped once the study pre-defined ablation response was achieved, no residual signal
identified at the ablation site or >5min of ablation had been performed. Beyond
isolating PVs and targeting potential drivers no additional ablation was performed in
AF. If the AF organized into an AT this was mapped and ablated.
iii) Driver characteristics
For each driver three characteristics were evaluated: reproducibility, recurrence and
temporal stability. Reproducibility was defined as the number of CARTOFINDER
maps in each patient that showed the same confirmed driver. The number of times a
confirmed driver was identified and met the study definition of driver during a 30-
second recording was defined as the recurrence rate. Temporal stability was defined as
the number of consecutive repetitions identified during each occurrence of a driver.
iv) CLs
Using the CARTOFINDER system CL was measured as the time difference between

7
two consecutive atrial signal annotations on the unipolar signals recorded from the
basket catheter. From this the ‘dominant CL’ for each electrode pole was determined
over a 30-second recording. The dominant CL for each electrode was defined using a
CL histogram, plotting CL on the x axis and the number of cycles on the y axis, whereby
the dominant CL is the center of the narrowest range of CLs in the histogram containing
50% of the cycles (14). The dominant CL at each pole was then reviewed firstly as a
CL map on the anatomical geometry with the colors projected varying depending on
the underlying CL thereby allowing sites with the faster dominant CL to be identified.
This was also reviewed quantitatively whereby the dominant CL obtained at each
electrode pole was compared to identify the electrode(s) with the faster dominant CLs.
The position of these poles was then identified on the anatomical geometry. The site or
sites with the fastest dominant CL were thereby identified and their relationship to sites
of confirmed drivers were evaluated.
v) DF
To determine DF, following filtering of far field ventricular signals, a Butterworth 2nd
order filter was applied to the unipolar signals. Rectification was then performed to take
the absolute value of the signal followed by applying a low pass filter to the signal
(20Hz Butterworth 2nd order). Spectral analysis was then performed using a
combination of periodogram multiplied by a Hamming window and a Welch
periodogram to estimate the power spectral density and DF. Four-second windows were
used with 50% overlap between the windows. The DF was then determined for each
four-second window and the median of these values was taken as the DF for the 30-
second recording. This was performed for all the basket electrodes that were in contact

8
and recorded unipolar signals. The DF for each electrode is then compared with each
other to identify the site of highest DF.
Using the DF data obtained, 3D DF maps were created which were superimposed on
the anatomical maps created in CARTO. Correlation between sites of highest DF and
confirmed driver sites was assessed. This was examined quantitatively by determining
the DF at each electrode and identifying the sites of highest DF in the LA. Again this
was correlated to sites of confirmed AF drivers.
To evaluate the accuracy and utility of these DF and CL calculations, the sites of highest
DF were compared to sites of fastest CLs to determine the level of correlation between
these two parameters. If these parameters were meaningful it would be expected that
these two parameters should effectively correlate with each other.
vi) CL variability (CLV) and regularity index (RI)
Two markers for organization were used; RI and CLV. The correlation between sites
of greatest organization and confirmed drivers were assessed. RI was used to assess the
spread of frequencies at each electrode over a 30-second recording. RI for each
electrode was calculated as the ratio of the power at the DF and its adjacent frequencies
for that electrode to the power of the 2.5 to 20-Hz band for each 4-second window with
the median of these values taken as the RI. Thereby sites of higher RI therefore denote
less frequency variation. Again sites of highest RI were compared to sites of confirmed
drivers.

9
The CLV was determined for each pole through taking the standard deviation (SD) of
the CLs in relation to the dominant CL for that electrode pole. This was also reviewed
as a CLV map and compared to sites of confirmed drivers.
A driver was said to co-locate with sites of fastest CL, highest DF, lowest CLV or
highest RI if the center of the driver was ≤1cm from these sites. The fastest CL, highest
DF and highest RI were defined as the CL, DF and RI within the top decile. The lowest
CLV was defined as a CLV in the bottom decile.
vii) Bipolar voltage
Areas with a bipolar voltage of <0.5mV were defined as low voltage zones (LVZs)
(15). Voltage maps were divided into non-LVZs (nLVZs) and LVZs. Sites of confirmed
AF drivers were then categorized as existing in either a nLVZ or LVZ.
vi) CFAEs
CFAEs were defined as fractionated activity (defined as continuous deflections without
pause at the isoelectric line for ≥70ms) occupying ≥70% of a 2.5 second sample (16).
Using a custom written script in Matlab (Mathworks, MA, USA) sites of CFAEs
meeting the above definition were identified on the LA geometry. The correlation
between these sites and sites of confirmed drivers were evaluated.
Statistical analysis
All statistical analyses were performed using SPSS (IBM SPSS Statistics, Version 24
IBM Corp, NY, USA). Continuous variables are displayed as mean ± SD or median
(IQR). Categorical variables are presented as a number and percentage. The student t-

10
test, or its non-parametric equivalent, Mann-Whitney U test when appropriate was used
for comparison of continuous variables. Fisher’s exact test was used for the comparison
of nominal variables. ROC curves were performed to determine the diagnostic ability
of LVZs in predicting the presence of rotational drivers. A p-value of <0.05 was
considered significant.
RESULTS
Thirty patients were prospectively included in this study. The baseline demographics
are in Table 1. In one of the 30 patients the post-PV isolation CARTOFINDER maps
were generated with inappropriate annotation of atrial signals due to excessive noise on
many of the unipolar electrograms due to damage to the basket. This patient was
therefore excluded from much of the analysis, leaving 29 patients for analysis of post-
PV isolation maps.
All procedures were performed successfully without any complications. The average
procedure duration was 264.0±62.5 min and median fluoroscopy time of 2.8min (IQR
0-3.1min). The total ablation time following PV isolation until reaching the study
endpoint (AF termination or CL slowing ≥30ms) was 3.3±0.7min. The mean LA
coverage achieved was 72.1±15.4%. The average number of bipolar voltage points
taken was 812±134.
i) Potential drivers on CARTOFINDER maps pre and post-PV isolation
The number of potential drivers identified pre and post-PV isolation is shown in Figure
1. In the 30 patients, 154 CARTOFINDER maps were created (5.3±1.3 maps per

11
patient) out of which 76 were created pre-PV isolation (2.6±0.7 maps per patient) and
78 post-PV isolation (2.7±0.7 maps per patient).
Forty-four potential drivers were identified in the 29 patients with post-PV isolation
maps (1.6±0.8 drivers per patient). Twenty-two of these 44 potential drivers in 19
patients were identified on the pre-PV isolation maps (22/44, 50%). No additional
drivers were seen on the pre-PV isolation maps that were not seen on the post-PV
isolation. The maps that did not demonstrate potential driver(s) showed a combination
of multiple broad linear wavefronts which circulated seemingly randomly, and sites of
disorganized activity with no clear discernable wavefront which was more common in
pre-PV isolation maps (25/76, 33% vs. 12/79, 15%). A majority of patients had had
only 1 potential driver identified on pre-PV isolation (16/19 patients, 84%) and post-
PV isolation maps (18/29, 62%) (Figure 1).
The anatomical location and characteristics of the potential drivers identified on post-
PV isolation maps is demonstrated in Table 2 and Figure 2. The potential drivers were
most frequently mapped to the anterior wall (14/44, 31.8%) of which a majority were
rotational drivers (42.9% focal and 57.1% rotational drivers). Following this, the roof
was the next most common site drivers were mapped to (10/44, 22.7%), of which
rotational drivers were most common (70% rotational and 30% focal drivers). Overall,
of the 44 potential drivers identified on the post-PV isolation maps, 26 were rotational
(59%) and 18 were focal with radial spread (41%). On the pre-PV isolation maps there
was an equal distribution of rotational and focal drivers (11/22, 50% rotational and
11/22, 50% focal).

12
In those patients that had drivers identified on pre-PV isolation maps the AF CL at the
LA appendage was slower than those that did not have drivers identified (171.8±19.6ms
vs. 141.2±28.0ms; p=0.03). Further to this, mean CLV was lower in those with drivers
identified compared to those that did not have drivers identified on the pre-PV isolation
maps (35.6±5.3ms vs. 41.5±5.5ms; p=0.017). There was no significant difference in
driver temporal stability with drivers seen pre and post-PV isolation compared to those
seen only post-PV isolation (3.3±0.9 vs. 2.9±0.8; p=0.13).
ii) Ablation response at the potential driver sites
Ablation at the 44 potential driver sites resulted in an effect that met the study criteria,
for a confirmed driver in 39 instances. The 5 potential driver sites where no response
to ablation was observed were identified in patients that had other potential drivers
mapped. All 29 patients had a confirmed driver identified (1.3±0.6 confirmed driver
per patient). Out of the 39 confirmed drivers 23 (59%) were rotational and 16 (41%)
were focal.
Ablation at the 39 confirmed driver sites resulted in AF termination with 20 of the
drivers (51.3%, 20 out of 29 patients (69%)). In the remaining 19 confirmed drivers
ablation resulted in slowing of the CL ≥30ms. Drivers that were also identified on the
pre-PV isolation maps were more commonly associated with AF termination compared
to drivers only identified post-PV isolation (13/18, 72.2% AF termination vs. 3/14,
21.4%; p=0.001).
iii) Reproducibility, temporal stability and recurrence of confirmed drivers

13
The confirmed drivers were shown to be reproducible with an average of 77.9±19.4%
of maps in each patient demonstrating the same confirmed driver. All confirmed drivers
were spatially conserved but were intermittent. During a 30-second recording each
driver occurred 8.7±5.4 times (the recurrence rate). During each occurrence a driver
completed 3.1±0.9 consecutive repetitions (the temporal stability). The maximum
number of consecutive repetitions was 6 for a focal driver and 4.5 for a rotational driver
(Figure 3).
Focal drivers were more temporally stable in that they complete a greater number of
consecutive repetitions than rotational drivers (3.4±0.9 vs. 2.9±0.8; p=0.07). Focal
drivers also had a higher recurrence rate than rotational drivers (11.9±6.2 vs. 6.3±3.3;
p=0.001). However, there was no significant difference in AF termination rates
between these two drivers (8/16, 50% focal vs. 12/23, 52% rotational; p=1.00).
However, when reviewing all drivers, those that resulted in AF termination showed
greater temporal stability than those that did not (3.4±0.9 vs. 2.7±0.6; p=0.001).
iv) CL and DF
Of the 154 CARTOFINDER maps the site of fastest CL was the same as the site of
highest DF in 147/154 maps (95.5%).
v) CLV and RI
Reviewing all 154 CARTOFINDER maps, sites of lowest CLV correlated to sites of
highest RI on majority of the maps (148/154, 96.1%).
v) CL, DF, CLV and RI and their correlation with confirmed driver sites

14
Table 3 demonstrates the correlation of each confirmed driver site with fastest CL,
highest DF, lowest CLV and highest RI. It also shows the relationship of the confirmed
driver sites with bipolar voltage and sites of CFAE.
Table 4 demonstrates the correlation between confirmed driver sites and fastest CL,
highest DF, lowest CLV and highest RI on a per driver and patient basis. Sites of
confirmed drivers correlated less frequently to sites of fastest CL and highest DF
compared to sites of lowest CLV and highest RI, whereby 28 (71.8%) and 26 (66.7%)
of confirmed drivers correlated to these sites respectively.
Drivers correlating with sites of fastest CL had greater temporal stability (3.5±0.9 vs.
2.8±0.6 consecutive repetitions; p<0.002) and higher recurrence rate (13.3±4.8 vs.
4.8±1.0 occurrences per 30 second recording; p<0.001) than drivers not correlating to
these sites. Similarly, drivers correlating with sites of highest DF also showed greater
temporal stability (3.6±1.0 vs. 2.8±0.6; p<0.001) and higher recurrence rate (14.5±3.7
vs. 5.1±2.0; p<0.001). This suggests that the correlation with fastest CL and highest DF
site is dependent on the temporal stability of the driver. As focal drivers had greater
temporal stability and higher recurrence rate they also correlated more frequently to
sites of highest DF (10/16, 63% vs. 5/23, 22%; p=0.018) and fastest CL (10/16, 63%
vs. 7/23, 30%; p=0.059) compared to rotational drivers. Figure 4A-C demonstrates a
focal driver site correlating to the site of lowest CLV and highest DF.
On a per patient basis, sites of fastest CL and highest DF correlated to at least one driver
in 13 (45%) and 11 out of 29 patients (38%) respectively. The lowest CLV site

15
correlated to a driver site in 25 out of 29 patients (86%). The site of highest RI
correlated to a confirmed driver site in 21 out of 29 patients (72%).
Drivers that correlated with sites of lowest CLV (20/28 vs. 0/11, p<0.001) and higher
RI (20/26 vs. 1/12, p<0.001) were associated with higher rates of AF termination.
vi) Bipolar voltage and confirmed driver sites
Out of the 39 confirmed drivers identified, a majority was mapped to LVZs (26/39,
67%). Whilst rotational drivers demonstrated a predilection for LVZs (17/23, 74%
LVZs vs. 6/23, 26% non-LVZs) focal drivers did not (9/16, 56% LVZs vs. 7/16, 44%
non-LVZs). However, this difference in characteristics between rotational and focal
drivers did not reach significance (17/23 vs. 9/16, p=0.31). A greater proportion of
LVZs was however predictive of the presence of rotational drivers on mapping with a
sensitivity of 92.9% and specificity of 77.8% respectively with an optimal cutoff of
49% (AUC 0.93, 95% CI 0.82-1.00; p=0.001).
vii) CFAE and confirmed driver sites
Thirty sites of CFAEs meeting study criteria were identified in 25 patients which
include 35 confirmed drivers (86% of patients, 1.03±0.56 CFAE sites per patient).
CFAEs were seen to predominantly involve the anterior wall including anterior LA
appendage and anteroseptum (50%) followed by posterior wall (23%), lateral wall
including antero and posterolateral (17%) and roof (10%). Out of the 30 CFAE sites,
14 correlated to sites of confirmed drivers (47%) and 14 of the 35 confirmed drivers
corresponded to CFAE sites (40%). Out of the 35 confirmed drivers, CFAE sites
correlated to 40% of rotational driver sites (8/20) and 40% of focal driver sites (6/15).
16
On a per patient basis, a CFAE site correlated to a site of at least one confirmed driver
in 13 out of the 25 patients (52%).
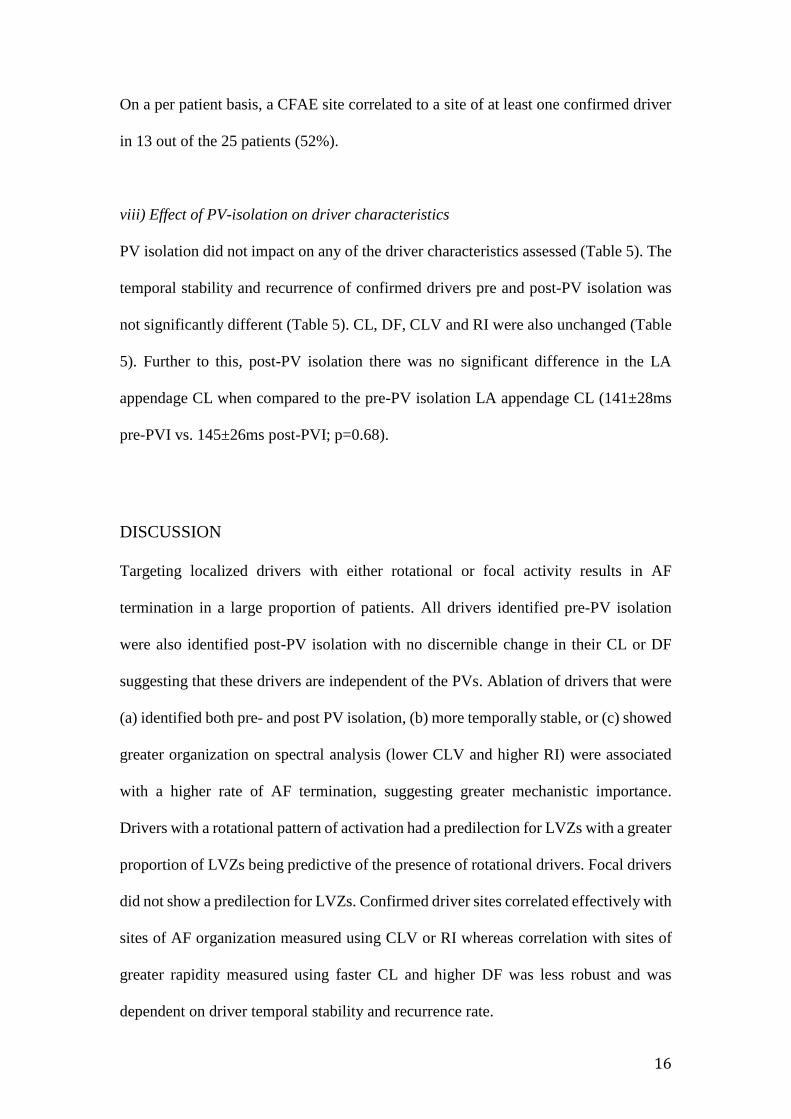
viii) Effect of PV-isolation on driver characteristics
PV isolation did not impact on any of the driver characteristics assessed (Table 5). The
temporal stability and recurrence of confirmed drivers pre and post-PV isolation was
not significantly different (Table 5). CL, DF, CLV and RI were also unchanged (Table
5). Further to this, post-PV isolation there was no significant difference in the LA
appendage CL when compared to the pre-PV isolation LA appendage CL (141±28ms
pre-PVI vs. 145±26ms post-PVI; p=0.68).
DISCUSSION
Targeting localized drivers with either rotational or focal activity results in AF
termination in a large proportion of patients. All drivers identified pre-PV isolation
were also identified post-PV isolation with no discernible change in their CL or DF
suggesting that these drivers are independent of the PVs. Ablation of drivers that were
(a) identified both pre- and post PV isolation, (b) more temporally stable, or (c) showed
greater organization on spectral analysis (lower CLV and higher RI) were associated
with a higher rate of AF termination, suggesting greater mechanistic importance.
Drivers with a rotational pattern of activation had a predilection for LVZs with a greater
proportion of LVZs being predictive of the presence of rotational drivers. Focal drivers
did not show a predilection for LVZs. Confirmed driver sites correlated effectively with
sites of AF organization measured using CLV or RI whereas correlation with sites of
greater rapidity measured using faster CL and higher DF was less robust and was
dependent on driver temporal stability and recurrence rate.
17
i) Characterization of drivers and response to ablation
Ablation at a majority of the potential drivers sites identified produced a positive
response (89%), with AF termination for more than half of the drivers. Drivers with
greater temporal stability were more likely to be associated with AF termination.
Approximately 60% of identified drivers had rotational activation and 40% were focal.
Drivers with rotational activation had a predilection for LVZs whereas focal drivers did
not. The confirmed drivers mapped in this study were spatially conserved but with
temporal periodicity. The temporal stability of the drivers were variable but no driver
completed >6 consecutive repetitions. The intermittent nature of the localized drivers
is more in line with the data obtained using the ECGi system (2) than that reported with
the TOPERA system (1). Focal drivers were shown to have a greater temporal stability
and higher recurrence rate compared to drivers with rotational activity; however, there
was no significant difference in the AF termination rates with ablation of these two
driver types. This suggests that they are similarly important in maintaining AF.
Drivers seen pre- and post-PV isolation were more commonly associated with AF
termination on ablation compared to drivers only seen post-PV isolation. Those with
drivers identified on pre-PV isolation maps had slower LA appendage CL and lower
average CL variability indicating more organized AF.
The lack of impact of PV isolation on several driver characteristics suggests that these
drivers are independent of the PVs. The response to ablation seen at the driver sites
contrasts with the lack of impact on AF CL with PV isolation. This arguably suggests

18
that although the PVs may play an important role in AF initiation, they may be less
important for the maintenance of AF than the drivers identified in this study.
ii) CL, DF, CLV and RI and their correlation with confirmed driver sites
Small non-randomized studies have shown that targeting sites of highest DF have been
associated with CL prolongation during ablation of persistent AF (11) and have shown
promising long-term success (17). However, others have argued that the lack of
spatiotemporal stability of DF sites suggests that they cannot represent sites of stable
drivers (12, 13).
It is noteworthy that some studies have highlighted a lack of correlation between DF
and CL regardless of whether unipolar or bipolar signals were analyzed or whether the
QRS was subtracted (18, 19). One potential flaw of fast fourier transform (FFT) is that
it makes the assumption that the signal is ‘stationary’ (i.e. consistent) which is not the
case in AF. The signal obtained during AF will be subject to phase shift. If a long time
window is set for the FFT analysis this phase shift can result in the FFT analysis either
failing to pick up the change in frequencies or represent these as noise which will impact
the DFs obtained. If however, a shorter time window is used, the extent of phase shift
will be minimized as there is less likely to be great variation in the signal over a short
time window and as a result less impact on the DFs obtained during the FFT analysis.
The CARTOFINDER system records a 30-second sample, but uses short 4-second
windows for analysis with 50% overlap between windows to overcome this ‘stationary
challenge’. Using this system we demonstrated a strong correlation between sites of
highest DF and fastest CLs. The closer correlation observed with this methodology is
biologically plausible and suggests a more meaningful result.

19
To date no study has mapped drivers in the human LA to allow direct comparison to
sites of rapid CL, high DF or markers of organization. These data demonstrate that
overall there was a moderate correlation between drivers and sites of rapid CL or
highest DF. However, this correlation may depend on driver temporal stability and
recurrence. Drivers that showed greater temporal stability and higher recurrence rates
correlated to sites of highest DF and fastest CL, whereas drivers that were less
temporally stable or recurred less often did not. Nevertheless, these data do not suggest
that mapping of AF using DF or fastest CL is likely to be reliable in detecting drivers.
Increased overall organization in AF has shown to be associated with termination of
AF with flecainide (20) or ablation (21). Prospectively targeting sites with increased
organization index, derived from DF has resulted in regional AF organization (22). In
this study we used two markers for organization based on signal analysis in both the
time and frequency domains: CLV and RI. These parameters correlated well with each
other and with sites of confirmed drivers. Unlike CL and DF, the correlation seen was
consistent unconditional of the characteristics of the drivers. This is compatible with
data from computer modeling studies showing that sites of increased organization as
evidenced by a high organization index correlates better with the location of drivers
than peaks in DF (23). These data suggest that CLV and RI are likely to be more useful
for detecting drivers than CL or DF.
iii) CFAE and driver sites
CFAE ablation remains controversial. We utilized a custom algorithm to identify
electrograms that had continuous fractionation for >70% of the sample, since this is

20
compatible with what others have predicted at rotor sites (5, 6) and has been shown to
correlate with CL prolongation during ablation (15, 24). However, less than half of
CFAE sites corresponded to drivers and less than half of drivers corresponded to CFAE.
This is compatible with findings by others (25). Taken together these data suggest that
CFAE are unlikely to be reliable in identifying drivers.
Limitations
In this study we focused on electrophysiological end points to determine the
mechanistic significance of potential drivers. CL prolongation was one of these
endpoints and its importance is less clear than AF termination. However, CL
prolongation has been utilized by others (3, 18, 26) and the CL slowing of ≥30ms used
to define a positive response is the most stringent definition used to date. Furthermore,
if only the drivers resulting in AF termination were considered significant the results
would be very similar albeit with fewer drivers.
Although drivers are spatially conserved these data suggest temporal periodicity.
However, it is possible that this represents intermittent failure to detect drivers perhaps
due to electrogram fractionation (27).
CONCLUSIONS
Utilizing this novel mapping system we successfully identified localized LA drivers in
all patients. AF termination or substantial CL slowing occurred with ablation of both
focal and rotational drivers, suggesting that they are important in maintaining AF.
Ablation of drivers with greater temporal stability was more likely to cause AF
termination. Electrogram analysis in the time and frequency domains showed that

21
drivers corresponded to sites of greater electrogram organization (lower CLV and
higher RI) but not markers of rapidity (high CL and DF). Randomized studies are
needed to test the clinical utility of these parameters in guiding ablation for AF.
FUNDING
A Project Grant from the British Heart Foundation (Grant number: PG/16/10/32016)
funded this work.
DISCLOSURES
Prof. Schilling has received speaker and travel grants from Biosense Webster and
research grants from Biosense Webster and Boston Scientific. Dr Hunter has received
travel grants for the purposes of attending conferences from Biosense Webster and
Medtronic. Prof Lambiase receives educational and research grants from Boston
Scientific.

22
REFERENCES
1. Narayan SM, Krummen DE, Shivkumar K, Clopton P, Rappel WJ, Miller JM.
Treatment of Atrial Fibrillation by the Ablation of Localized Sources:
CONFIRM (Conventional Ablation for Atrial Fibrillation With or Without Focal
Impulse and Rotor Modulation) Trial. J Am Coll Cardiol 2012;60:628-36.
2. Haissaguerre M, Hocini M, Denis A, et al. Drivers domains in persistent atrial
fibrillation. Circulation 2014; 130:530-8.
3. Honarbakhsh S, Schilling RJ, Dhillon G, et al. A novel mapping system for
panoramic mapping of the left atrium: application to detect and characterize
localized sources maintaining AF. JACC Clin Electrophysiol. 2017 Published
online first.
4. Benharash P, Buch E, Frank P, Share M, Tung R, Shivkumar K, Mandapati R.
Quantitative analysis of localized sources identified by focal impulse and roter
modulation mapping in atrial fibrillation. Circ Arrhythm Electrophysiol.
2015;8:554-61.
5. Skanes AC, Mandapati R, Berenfeld O, Davidenko JM, Jalife J. Spatiotemporal
periodicity during atrial fibrillation in the isolated sheep heart. Circulation.
1998;98:1236 –1248.
6. Mandapati R, Skanes AC, Chen J, Berenfeld O, Jalife J. Stable microreentrant
sources as a mechanism of atrial fibrillation in the isolated sheep heart.
Circulation. 2000;101:194 –199.
7. Lin YJ, Tai CT, Kao T, Tso HW, Higa S, Tsao HM, Chang SL, Hsieh MH,
Chen SA. Frequency analysis in different types of paraoxysmal atrial
fibrillation. J Am Coll Cardiol. 2006;47:1401-7.
8. Stiles MK, Brooks AG, Kuklik P, John B, Dimitri H, Lau DH, Wilson L, Dhar

23
S, Roberts-Thomson RL, Mackenzie L, Young GD, Sanders P. High-density
mapping of atrial fibrillation in humans: relationship between high-frequency
activation and electrogram fractionation. J Cardiovasc Electrophysiol.
2008;19:1245-53.
9. Nakahara S, Toratani N, Nakamura H, Higashi A, Takayanagi K. Spatial
relationship between high-dominant frequency sites and the liner ablation line
in persistent atrial fibrillation: its impact on complex fractionated electrograms.
Europace 2013; 15:189-197.
10. Tuan J, Jeilan M, Kundu S, Nicolson W, Chung I, Stafford PJ, Ng GA. Regional
fractionation and dominant frequency in persistent atrial fibrillation: effects of
left atrial ablation and evidence of spatial relationship. Europace 2011;13:1550-
1556.
11. Sanders P, Berenfeld O, Hocini M, Jais P, Valdyanathan R, Hsu LF, Garrigue
S, Takahashi Y, Rotter M, Sacher F, Scavee C, Ploutz-Snyder R, Jalife J,
Haissaguerre M. Spectral analysis identifies sites of high-frequency activity
maintaining atrial fibrillation in humans. Circulation 2005;112:789-797.
12. Jarman JW, Wong T, Kojodjojo P, Spohr H, Davies JE, Roughton M, Francis
DP, Kanagaratnam P, Markides V, Davies DW, Peters NS. Spatiotemporal
behavior of high dominant frequency during paroxysmal and persistent atrial
fibrillation in the human left atrium. Circ Arrhythm Electrophysiol. 2012;5:650-
8.
13. Habel N, Znojkiewicz P, Thompson N, Muller JG, Mason B, Calame J, Calame
S, Sharma S, Mirchandani G, Janks D, Bates J, Noori A, Karnbach A,
Lustgarten DL, Sobel BE, Spector P. The temporal variability of dominant
frequency and complex fractionated atrial electrograms constrains the validity

24
of sequential mapping in human atrial fibrillation. Heart Rhythm 2010;7:586-
93.
14. Houben RPM, de Grot NMS, Lindemans FW, Allessie MA. Automatic mapping
of human atrial fibrillation by template matching. Heart Rhythm 2006;3:1221–
1228.
15. Sanders P, Morton JB, Davidson NC, Spence SJ, Vohra JK, Sparks PB, Kalman
JM. Electrical remodelling of the atria in congestive heart failure:
electrophysiological and electroanatomic mapping in humans. Circulation
2003;108:1461-8.
16. Hunter RJ, Diab I, Tayebjee M, Richmond L, Sporton S, Earley MJ, Schilling
RJ. Characterization of fractionated atrial electrograms critical for maintenance
of atrial fibrillation: a randomized, controlled trial of ablation strategies (the
CFAE AF trial). Circ Arrhythm Electrophysiol. 2011;4:622-9.
17. Yoshida K, Chugh A, Good E, et al. A critical decrease in dominant frequency
and clinical outcome after catheter ablation of persistent atrial fibrillation. Heart
Rhythm 2010; 7:295-302.
18. Elvan A, Linnenbank AC, van Bemmel MW, Bamdat Misier AR, Delnoy PP,
Beukema WP, de Bakker JMT. Dominant frequency of atrial fibrillation
correlates poorly with atrial fibrillation cycle length. Circulation 2009;2:634-
644.
19. Singh SM, Heist EK, Koruth JS, Barrett CD, Ruskin JN, Mansour MC. The
relationship between electrogram cycle length and dominant frequency in
patients with persistent atrial fibrillation. J Cardiovasc Electrophysiol.
2009:20:1336-42.

25
20. Tuan J, Osman F, Jeilan M, Kundu S, Mantravadi R, Stafford PJ, Ng GA.
Increase in organization index predicts atrial fibrillation termination with
flecainide post-ablation:spectral analysis of intracardiac electrograms. Europace
2010;12:488-93.
21. Takahashi Y, Sanders P, Jais P, Hocini M, Dubois R, Rotter M, Rostock T,
Nalliah CJ, Sacher F, Clementy J, Haissaguerre M. Organization of frequency
spectra of atrial fibrillation: relevance to radiofrequency catheter ablation. J
Cardiovasc Electrophysiol. 2006;17:382-8.
22. Jarman JWE, Wong T, Kojodjojo P, Spohr H, Davies JER, Roughton M, Francis
DP, Kanagaratnam P, O’Neil MD, Markides V, Davies DW, Peters NS.
Organizational Index mapping to identify focal sources during persistent atrial
fibrillation. J Cardiovasc Electrophysiol 25;335-363.
23. Tobon C, Rodriguez JF, Ferrero Jr JM, Hornero F, Saiz J. Dominant frequency
and organization index maps in a realistic three-dimensional computational
model of atrial fibrillation. Europace 2012;14:v25-v32.
24. Takahashi Y, O’Neill MD, Hocini M, Dubois R, Matsuo S, Knecht S, Mahapatra
S, Lim KT, Jais P, Jonsson A, Sacher F, Sanders P, Rostock T, Bordachar P,
Clementy J, Klein GJ, Haissaguerre M. Characterization of electrograms
associated with termination of chronic atrial fibrillation by catheter ablation. J
Am Coll Cardiol. 2008;51:1003-1010.
25. Narayan SM, Shivkumar K, Krummen DE, Miller JM, Rappel WJ. Panoramic
electrophysiological mapping but not electrogram morphology identified stable
sources for human atrial fibrillation: stable atrial fibrillation rotors and focal
sources relate poorly to fractionated electrograms. Circ Arrhythm
Electrophysiol. 2013;6:58-67.

26
26. Haissaguerre M, Lim KT, Jacquemet V, et al. Atrial fibrillatory cycle length: a
computer stimulation and potential clinical importance. Europace 2007;9:vi64-
70.
27. Atienza F, Calvo D, Almendral J, et al. Mechanisms of fractionated electrograms
formation in the posterior left atrium during paroxysmal atrial fibrillation in
humans. J Am Coll Cardiol. 2011;57:1081-1092.

27
Table 1- Demonstrates the baseline characteristics of the cohort
Table 2-
Demonstrates
Baseline characteristics Cohort n=30
Age years mean ± SD 64±10
Male n (%) 19 (63)
Diabetes mellitus n (%) 0
Hypertension n (%) 8 (27)
TIA/CVA* n (%) 2 (7)
Ischemic heart disease n (%) 2 (7)
Cardiac surgery n (%) 1 (3)
Left ventricular EFŢ ≥ 55% n (%) 21 (70)
LA area cm2 mean ± SD 27.3±6.3
Bipolar voltage mV mean ± SD 0.39±0.17
AF duration months, mean ± SD 17.5±6.2
Previous AT ablation (including AT and AF patients) n (%)
Cavo-tricuspid isthmus-dependent flutter
Focal or micro-reentrant
4 (15)
2 (7)
Current medical strategy
Beta-blockers including Sotalol
Amiodarone
Flecainide
20 (67)
7 (23)
4 (13)
Current anticoagulation strategy
Warfarin
Noval oral anticoagulation
8 (27)
22 (73)
*TIA/CVA- transient ischemic attack/cerebrovascular attack
ŢEF- Ejection fraction

28
the characteristics of the potential AF drivers mapped with the CARTOFINDER system
and the response to ablation at the driver site
Patient ID Driver type Driver location
in LA
Proportion of maps
with driver %
Visible on pre- Ablation
PV maps response
Ablation
duration min
1 Focal Posterior/inferior lateral 100 Yes AT 2.8
2 Rotational
Focal
Anterior
Lateral
67
67
No Nil
Yes Sinus 1.8
1.8
3.2
3 Rotational Posterior LAA*/lateral 100 No SCL 2.4
4 Focal
Focal
Roof/LAA
Posterior/inferior lateral
50
50
Yes SCL
Yes AT
3.7
4.2
5 Focal
Rotational
Mid Anterior
Posterior/inferior lateral
100
100
Yes SCL
Yes AT
4.8
3.7
6 Rotational Mid Anterior 75 No AT 3.3
7 Rotational Mid Posterior/inferior 100 No A T 4.1
8 Rotational Inferior RLPVŢ/septal 67 Yes Sinus 3.8
9 Focal
Rotational
Low Anterior
Mid Roof
100
100
No SCL
Yes Sinus
3.5
4.0
10 Rotational Posterior LAA 75 No SCL 4.6
11 Rotational Anteroseptal 100 No SCL 4.1
12 Rotational Mid Roof 100 Yes Sinus 3.4
13 Rotational Mid Anterior 100 No SCL 2.8
14 Rotational Anteroseptal 100 No SCL 4.1
15 Rotational
Focal
Roof/RUPVŦ
Roof/LAA
67
67
Yes Nil
Yes SCL
3.5
2.5
16 Rotational Roof 100 Yes SCL 4.1
17 Focal Anterior LAA 100 Yes Sinus 2.2
18 Rotational Mid Roof 67 Yes AT 2.7

29
19 Focal
Rotational
Rotational
Lateral
Anteroseptal
Septal
67
67
33
No Nil
No Nil
No SCL
3.5
3.8
2.7
20 Rotational Septal 50 No AT 2.5
21 Rotational Low Anterior 75 Yes SCL 2.7
22 Focal
Focal
Septal
Posterior Roof
67
67
No SCL
Yes AT
2.7
3.3
23 Focal Anterior LAA 67 Yes Sinus 3.4
24 Rotational Mid Roof 50 No Sinus 2.7
25 Rotational Low Posterior/inferior 75 Yes Sinus 3.2
26 Focal
Rotational
Rotational
Focal
Posterior/inferior
Inferior RUPV/septal
Mid Roof
Mid Anterior
33
67
67
67
No Nil
No SCL
No SCL
Yes AT
3.1
2.5
2.9
2.8
27 Focal
Rotational
Lateral
Mid Anterior
100
67
No SCL
Yes Sinus
2.8
2.8
28 Focal
Rotational
Focal
Anterior LAA
Septal
Lateral
67
67
100
No SCL
No SCL
Yes AT
3.4
4.1
3.1
29 Focal
Rotational
Proximal CS^
Lateral
67
67
No SCL
Yes Sinus
2.2
1.9
*LAA- Left atrial appendage
ŢRLPV- Right lower pulmonary vein
ŦRUPV- Right upper pulmonary vein
^CS- Coronary sinus

30
Table 3- Demonstrates the characteristics of the confirmed drivers and their
relationship with CL, DF, CLV, RI, bipolar voltage and sites of CFAE. Highest RI,
Fastest CL and peak DF refers to the top decile. Lowest CLV refers to the lowest decile.
Patient
ID
Driver
type
Consecutive
repeats in 30 sec
mean ± SD
Recurrence
in 30sec
mean ± SD
Lowest
CLV*
Highest
RIŢ
Correlation
with
Fastest CLŦ
Peak
DF^
CFAE§
Voltage
zone
1 Focal 2.3±0.6 5.2±0.6 Yes Yes No No No nLVZ
2 Focal 4.0±0.8 7.5±0.7 Yes Yes No No No nLVZ
3 Rotational 2.3±0.6 4.5±0.8 No No No No No LVZ
4 Focal*
Focal*
2.3±0.6
4.0±2.7
14.5±0.7
16.5±0.7
Yes
Yes
Yes
Yes
Yes
Yes
Yes
Yes
Yes
Yes
LVZ
nLVZ
5 Focal*
Rotational
2.3±0.6
2.8±0.4
16.2±0.9
6.3±0.6
Yes
Yes
Yes
Yes
Yes
No
Yes
No
Yes
No
LVZ
LVZ
6 Rotational* 2.2±0.7 13.7±1.5 Yes Yes Yes Yes Yes
LVZ
7 Rotational 4.0±0.0 4.5±0.7 Yes Yes No Yes Yes LVZ
8 Rotational 3.0±0.8 4.2±0.6 Yes Yes No No No nLVZ
9 Focal
Rotational*
2.8±1.0
2.9±1.0
4.0±0.0
4.0±0.0
No
Yes
No
Yes
No
Yes
Yes
No
Yes
No
LVZ
LVZ
10 Rotational 2.3±1.1 3.6±0.9 No No No No Yes nLVZ
11 Rotational* 2.5±0.7 12.3±1.1 No No Yes Yes No LVZ
12 Rotational 2.3±0.9 3.2±0.8 Yes Yes No No No nLVZ
13 Rotational 2.4±0.8 4.3±0.9 No No No No No nLVZ
14 Rotational 2.2±0.6 5.2±0.9 No No No No Yes LVZ
15 Focal 2.8±0.8 3.5±0.7 No No No No No nLVZ
16 Rotational 2.3±0.6 5.2±0.7 Yes Yes No No N/A LVZ
17 Focal* 3.0±1.3 12.7±1.5 Yes Yes Yes Yes Yes LVZ
18 Rotational 2.8±0.9 5.6±0.3 Yes Yes No No No nLVZ
19 Rotational* 3.0±1.3 13.5±1.2 Yes No Yes No N/A LVZ

31
20 Rotational* 3.8±0.6 8.0±0.0 Yes Yes Yes Yes N/A LVZ
21 Rotational 2.7±0.1 3.7±0.6 Yes Yes No No Yes nLVZ
22 Focal*
Focal*
3.5±0.7
4.3±0.2
9.7±2.1
14.7±1.5
Yes
Yes
Yes
Yes
Yes
Yes
Yes
Yes
No
No
nLVZ
nLVZ
23 Focal* 5.1±0.1 21.5±2.1 Yes Yes Yes Yes N/A LVZ
24 Rotational 2.2±0.3 5.0±0.0 Yes Yes No No Yes LVZ
25 Rotational 4.0±0.6 4.7±1.1 Yes Yes No No No LVZ
26 Rotational
Rotational*
Focal *
2.1±0.3
4.8±0.3
4.8±0.2
4.0±1.0
10.3±1.2
18.7±1.5
No
Yes
Yes
No
Yes
Yes
No
Yes
Yes
No
Yes
Yes
No
No
Yes
LVZ
LVZ
nLVZ
27 Focal
Rotational*
2.8±0.2
4.5±0.4
5.2±1.2
12.2±1.3
No
Yes
No
Yes
No
Yes
No
Yes
No
Yes
nLVZ
LVZ
28 Focal*
Rotational
Focal*
3.5±0.1
2.5±0.1
3.8±0.1
18.0 ±0.0
6.0±1.4
18.0±0.0
Yes
No
Yes
Yes
No
Yes
Yes
No
Yes
Yes
No
Yes
No
No
No
LVZ
LVZ
nLVZ
29 Focal
Rotational
2.9±0.3
3.2±0.2
4.3±0.9
5.0±0.0
No
Yes
No
No
No
No
No
No
No
Yes
LVZ
LVZ
*CLV- Cycle length variability
ŢRI- Regularity index
ŦCL- Cycle length
^DF- Dominant frequency
§CFAE- Complex fractionated atrial electrograms

32
Table 4- Demonstrates the correlation between fastest CL, peak DF, lowest CL
variability and regularity index at confirmed driver site and at potential driver sites
where ablation had no response.
Confirmed driver sites
correlating
(out of 39 drivers)
Patients with at least one
confirmed driver correlating
(out of 29 patients)
Fastest CL* n (%)
Percentile at driver sites, mean ± SD
17 (44) 13 (45)
15.1±13.6
Highest DFŢ n (%)
Percentile at driver sites, mean ± SD
15 (38) 11 (38)
18.7±15.4
Lowest CLVŦ n (%)
Percentile at driver sites, mean ± SD
29 (74)
25 (86)
7.5±7.9
Highest RI^ n (%)
Percentile at driver sites, mean ± SD
26 (67) 21 (72)
8.4±8.1
*CL- Cycle length
ŢDF- Dominant frequency
ŦCLV- Cycle length variability
^RI- Regularity index
33
Table 5- Demonstrates driver characteristics pre and post-PV isolation and thereby the
impact of PV isolation on the drivers
Pre-PV isolation Post-PV isolation p-value
Recurrence in 30 sec,
mean ± SD
8.4±4.8 8.6±5.5 0.89
Consecutive repeats in 30 sec
mean ± SD
3.0±0.7 3.1±0.9 0.90
CL* at the driver site, ms
mean ± SD
134.1±19.9 134.1±22.7 0.98
Peak DFŢ at the driver site, Hz
mean ± SD
5.8±0.5 5.7±0.6 0.45
CLVŦ at the driver site, ms
mean ± SD
12.2±5.7 12.9±7.1 0.84
RI^ at the driver site, Hz mean ± SD 0.4±0.1 0.5±0.1 0.12
*CL- Cycle length
ŢDF- Dominant frequency
ŦCLV- Cycle length variability
^RI- Regularity index

34
FIGURE LEGEND
Figure 1- Demonstrates a flow chart of the study identifying the number of potential
drivers identified pre and post-PV isolation and how many of these were confirmed
drivers and what the response was to ablation at these sites.
Figure 2A-B-
Ai-Aii- Shows LA geometry maps in AP (Ai) and PA (Aii) position. The maps show the
distribution of the drivers on the anatomical LA surface with the red circles
representing rotational drivers and blue circles representing focal drivers.
Bi-Bii- Shows LA geometry maps in AP (Bi) and PA (Bii) position. The maps
demonstrates the percentage of the drivers mapped to each anatomical surface.
Purple= roof, blue=anterior, red=septal and yellow=posterior. The black circles
highlight anteroseptal and posterolateral surfaces.
Figure 3- Bar chart graph that demonstrates the number of consecutive repetitions a
confirmed driver showed during each occurrence. The dark grey bars represent a focal
driver and the light grey bar represents a rotational driver.
Figure 4A-C-
Ai-iii) CARTOFINDER maps on a LA CARTO geometry in a tilted supine view that
demonstrates a focal driver with radial spread along the roof.
B-C) CARTOFINDER maps on a LA CARTO geometry that demonstrates the
correlation between site of lowest CL variability (B) and highest DF (C) and the focal
driver site.

35
Figure 1

36
Figure 2A-B

37
Figure 3

38
Figure 4A-C


![Dysrhythmias (002) [Read-Only] - Aventri · Atrial AV node Ventricular Classification of Rhythm Abnormalities Supraventricular Atrial origin Atrial fibrillation Atrial flutter Atrial](https://static.fdocuments.in/doc/165x107/5f024baa7e708231d4038f22/dysrhythmias-002-read-only-aventri-atrial-av-node-ventricular-classification.jpg)