CHARACTERIZATION OF DEGRADATION …studentsrepo.um.edu.my/8329/4/Thesis_MEngSc_23112012.pdfvii...
268
CHARACTERIZATION OF DEGRADATION PRODUCTS OF ACTIVATED DIETHANOLAMINE AND METHYLDIETHANOLAMINE DURING CARBON DIOXIDE ABSORPTION AND DESORPTION PROCESSES MD. SAKINUL ISLAM FACULTY OF ENGINEERING UNIVERSITY OF MALAYA KUALA LUMPUR 2012
-
Upload
trinhkhanh -
Category
Documents
-
view
214 -
download
0
Transcript of CHARACTERIZATION OF DEGRADATION …studentsrepo.um.edu.my/8329/4/Thesis_MEngSc_23112012.pdfvii...
i
CHARACTERIZATION OF DEGRADATION PRODUCTS OF
ACTIVATED DIETHANOLAMINE AND METHYLDIETHANOLAMINE
DURING CARBON DIOXIDE ABSORPTION AND DESORPTION
PROCESSES
MD. SAKINUL ISLAM
FACULTY OF ENGINEERING UNIVERSITY OF MALAYA
KUALA LUMPUR
2012
ii
CHARACTERIZATION OF DEGRADATION PRODUCTS OF ACTIVATED DIETHANOLAMINE AND METHYLDIETHANOLAMINE
DURING CARBON DIOXIDE ABSORPTION AND DESORPTION PROCESSES
MD. SAKINUL ISLAM
DISSERTATION SUBMITTED IN FULFILMENT OF THE REQUIREMENTS FOR THE DEGREE OF MASTERS OF
ENGINEERING SCIENCE
FACULTY OF ENGINEERING UNIVERSITY OF MALAYA
KUALA LUMPUR
2012
iii
UNIVERSITI MALAYA
ORIGINAL LITERARY WORK DECLARATION
Name of Candidate: MD. SAKINUL ISLAM (I.C/Passport No:
Registration/Matric No: KGA090019
Name of Degree: MASTERS OF ENGINEERING SCIENCE (M. Eng. Sc)
Title of Project Paper/Research Report/Dissertation/Thesis (“This Work”):
“CHARACTERIZATION OF DEGRADATION PRODUCTS OF ACTIVATED
DIETHANOLAMINE AND METHYLDIETHANOLAMINE DURING CARBON
DIOXIDE ABSORPTION AND DESORPTION PROCESSES”
FIELD OF STUDY: SEPARATION PROCESS
I do solemnly and sincerely declare that:
(1) I am the sole author/writer of this Work; (2) This Work is original; (3) Any use of any work in which copyright exists was done by way of fair dealing and for
permitted purposes and any excerpt or extract from, or reference to or reproduction of any copyright work has been disclosed expressly and sufficiently and the title of the
Work and its authorship have been acknowledged in this Work;
(4) I do not have any actual knowledge nor do I ought reasonably to know that the making of this work constitutes an infringement of any copyright work;
(5) I hereby assign all and every rights in the copyright to this Work to the University of
Malaya (“UM”), who henceforth shall be owner of the copyright in this Work and that any reproduction or use in any form or by any means whatsoever is prohibited without
the written consent of UM having been first had and obtained;
(6) I am fully aware that if in the course of making this Work I have infringed any copyright whether intentionally or otherwise, I may be subject to legal action or any
other action as may be determined by UM.
Candidate‟s Signature Date: November, 2012
Subscribed and solemnly declared before,
Witness‟s Signature Date: November, 2012
Name:
Designation:
iv
“CHARACTERIZATION OF DEGRADATION PRODUCTS OF ACTIVATED
DIETHANOLAMINE AND METHYLDIETHANOLAMINE DURING CARBON
DIOXIDE ABSORPTION AND DESORPTION PROCESSES”
ABSTRACT
Degradation studies of activated Diethanolamine (DEA) and Methyldiethanolamine (MDEA)
induced by carbon dioxide were conducted in jacketed glass reactor under absorber and
stripper conditions at atmospheric pressure. Piperazine (PZ) is used as an activator in this
system. There are eighteen amines and activated amine samples studied. Pure carbon dioxide
was bubbled through the reactor till saturation. The concentration of amine and activator used
ranging from 2M to 4M and 1M to 2M respectively. On the other hand activated amine
concentrations ranged from 4M to 11M. Six generic cycles were conducted for each run during
the degradation experiments. Each cycle configured with the absorption and desorption of
carbon dioxide at 55 ˚C and 100 ˚C respectively. Samples were collected after a predetermined
experimental time and analyzed by various chromatographic methods to identify degradation
products. The degradation products were identified using ion chromatography (IC), high
performance liquid chromatography (HPLC)-UV detection and gas chromatography mass
spectroscopy (GC/MS). In the IC analysis three different columns were used for Anion, Cation
and Ion exclusion systems these are Metrosep A Supp 5 150/4.0, Metrosep C Supp 4 150/4.0
and Metrosep Organic Acids respectively. The supelco HPLC column was used to identify
polar degradation products of amine sample. In the GC-MS chromatographic analysis HP-
INNOWAX (30 m × 0.250 mm × 0.25µm) column was used. The major identified degradation
products in IC analysis are nitrate, nitrite, acetate, phosphate and ammonium. In HPLC
analysis the most common degradation products are found formamide, 2-(2-
aminoethoxy)ethanol, Diethylenetriamine, Ethyl 1-piperazinecarboxylate, N-(2-Hydroxyethyl)
ethylenediamine, Triethanolamine, 2-Methoxyethanol, Ethylene glycol, 1,4-
Dimethylpiperazine and 1-(2-Aminoethyl) piperazine. GC-MS is particularly conducted for
five alkanolamine samples which are DO2PZ2M, D05DEA4M, D10DEA7MPZ2M,
v
D13MDEA4M and D18MDEA7MPZ2M. Five degradation products are identified for
DO2PZ2M and these are Formamide, Ethylenediamine, N-formylpiperazine, Fomic acid and
Imidazole. D05DEA4M degraded sample shows ten degradation products these are
Formamide, N-(hydroxyethy1) ethylenediamine, Oxazolidone, 2-(2-aminoethoxy) ethanol, 2-
amino-2-methyl-1-propanol, N,N-bis(hydroxyethy1)- ethylenediamine, Ethylurea, 2-
methylaminoethanol, ethanol and acetone. Activated DEA sample D10DEA7MPZ2M shows
twelve DGPs these are Formamide, 1,4-Bis(2-hydroxyethyl)piperazine, Oxazolidone, 1,4-
Dimethylpiperazine, N,N-bis(hydroxyethy1)ethylenediamine, 2-dimethylaminoethanol, 1-(2-
Aminoethyl)piperazine, Ethyl-1-piperazinecarboxylate, Acetic acid, Glycolic acid, Ethyl urea
and Acetone. Inactivated MDEA samples D13MDEA4M was analyzed and eleven degradation
products are found which are 1, 4-Bis (2-hydroxyethyl)-piperazine, Bis-(2-hydroxypropyl)
amine, Oxazolidone, 2-(2-aminoethoxy)ethanol, 2-Amino-2-methyl-1-propanol, 2-
dimethylaminoethanol, Ethylurea, Glycolic acid, Acetaldehyde, Ethanol and Acetic acid.
Similarly eight degradation products are found for D18MDEA7MPZ2M sample which are 1-
Methyl piperazine, 1, 4-Bis(2-hydroxyethyl)piperazine, Bis(2-hydroxypropyl) amine, N, N-
dimethyl piperazine, 2-Amino-2-methyl-1-propanol, 2-dimethylaminoethanol, 1-(2-
aminoethyl) piperazine and ethanol. In addition two physical properties density and viscosity
of eighteen activated and inactivated amine samples are measured at 30 ˚C, 55 ˚C and 100 ˚C
and it was found that the both physical properties decreased with increasing temperature.
However, in case of increasing concentration it is significantly increases the density and
viscosity of both activated and inactivated amine solutions.
Keywords: Degradation, activated diethanolamine, activated methyldiethanolamine,
absorption, stripping, desorption
vi
“PENCIRIAM PRODUK DEGRADASI DISKTIFKAN DIETHANOLAMINE DAN
METHYLDIETHANOLAMINE SEPANJANG PROSES CARBON DIOKSIDA
PENYERAPAN DAN NYAHPENYERAPAN”
ABSTRACT TRANSLATED IN BAHASA MALAYSIA
Kajian degradasi Diethanolamine (DEA) dan Methyldiethanolamine (MDEA) yang diaktifkan
berikutan kehadiran karbon dioksida telah dijalankan di dalam reaktor kaca yang saluti cecair
penyejuk di bawah keadaan „absorber‟ dan „stripper‟ pada tekanan atmosfera. Dalam sistem
ini, Piperazine (PZ) telah dipilih sebagai bahan pengaktif. Terdapat 18 tahap kepekatan amina
dan sampel amina yang telah diaktifkan yang dikaji dalam kajian ini. Karbon dioksida tulen
telah dipam masuk ke dalam reaktor sehingga tepu. Kepekatan amina yang digunakan berada
diantara 2M kepada 4M manakala kepekatan pengaktif berada dalam lingkungan 1M kepada
2M. Sebaliknya, kepekatan amina yang diaktifkan yang digunakan adalah dari 4M kepada
11M. Enam kitaran generik telah dijalankan untuk setiap cubaan dalam eksperimen. Setiap
kitaran dikonfigurasi dengan penyerapan dan nyahpenyerapan karbon dioksida pada suhu 55 ˚
C dan 100 ˚ C masing-masing. Sampel-sampel dikumpulkan selepas tamat masa eksperimen
yang telah ditetapkan dan dianalisis dengan pelbagai kaedah kromatografi untuk mengenal
pasti produk degradasi yang belum diketahui. Produk degradasi telah dikenal pasti
menggunakan „Ionic Chromatography‟ (IC), „High Performance Liquid Chromatography‟
(HPLC) berpengesanan UV dan „Gas Chromatography-Mass Spectrometry‟ (GC / MS). Dalam
analisis IC, tiga kolum yang berbeza telah digunakan untuk sistem „Anion‟, „Cation‟ dan „Ion
Exclusion‟ iaitu Metrosep A SUPP 5 150/4.0, Metrosep C SUPP 4 150/4.0 dan Metrosep Asid
Organik masing-masing. Supelco HPLC kolum telah digunakan untuk mengenal pasti produk
degradasi berkutub dalam sampel amina. Dalam analisis kromatografi GC-MS, kolum HP-
INNOWAX (30 m × 0,250 mm × 0.25μm) telah digunakan. Produk degradasi utama yang
dikenal pasti dalam analisis IC adalah „nitrate‟, „nitrite‟, „acetate‟, „phosphate‟ dan
„ammonium‟. Dalam analisis HPLC, produk degradasi yang paling kerap ditemui merupakan
„formamide, 2 - (2-aminoethoxy) ethanol‟, „diethylenetriamine‟, „Ethyl 1-
piperazinecarboxylate‟, „N-(2-Hydroxyethyl) ethylenediamine‟, „Triethanolamine, 2-
Methoxyethanol‟, „Ethylene glycol‟, „1,4 – dimethylpiperazine‟ dan „1 - (2-Aminoethyl)
vii
piperazine‟. Kajian menggunakan GC-MS dijalankan untuk lima sampel „alkanolamine‟ iaitu
DO2PZ2M, D05DEA4M, D10DEA7MPZ2M, D13MDEA4M dan D18MDEA7MPZ2M. Lima
produk degradasi telah dikenal pasti untuk DO2PZ2M dan ini adalah „Formamide‟,
„Ethylenediamine‟, „N-formylpiperazine‟, „Fomic acid‟ dan „Imidazole‟. Sampel D05DEA4M
yang telah didegradasi menunjukkan 10 produk degradasi iaitu „Formamide‟, „N-
(hydroxyethy1) ethylenediamine‟, „Oxazolidone‟, „2 - (2-aminoethoxy) ethanol‟, „2-amino-2-
methyl-1-propanol‟, „N, N-bis (hydroxyethy1) – ethylenediamine‟, „Ethylurea‟, „2-
methylaminoethanol‟, „ethanol‟ dan „acetone‟. Sample DEA yang telah diaktifkan iaitu
D10DEA7MPZ2M menunjukkan 12 degradasi produk iaitu „Formamide‟, „1,4-Bis (2-
hydroxyethyl) piperazine‟, „Oxazolidone‟, „1,4-Dimethylpiperazine‟, „N, N-bis (hydroxyethy1)
ethylenediamine‟, „2-dimethylaminoethanol‟, „1 - (2 - aminoethyl) piperazine‟, „Ethyl-1-
piperazinecarboxylate‟, „acetic acid‟, „Glycolic acid‟, „Ethyl urea‟ dan „Acetone‟. Sampel
MDEA yang tidak diaktifkan iaitu D13MDEA4M dianalisis dan 11 produk degradasi telah
dijumpai iaitu „1, 4-Bis (2-hydroxyethyl)-piperazine‟, „Bis (2-hydroxypropyl) amine‟,
„Oxazolidone‟, „2 - (2-aminoethoxy) ethanol‟, „2-Amino -2-metil-1-propanol‟, „2-
dimethylaminoethanol‟, „Ethylurea‟, „Glycolic acid‟, „Acetal dehyde‟, „Ethanol‟ dan „Acetic
acid‟. Begitu juga lapan produk degradasi yang dijumpai untuk sampel D18MDEA7MPZ2M
iaitu „1-Methyl piperazine‟, „1, 4-Bis (2-hydroxyethyl) piperazine‟, „Bis (2-hydroxypropyl)
amine‟, „N, dimethyl piperazine N‟, „2-Amino-2-methyl -1-propanol‟, „2-
dimethylaminoethanol‟, „1 - (2-aminoethyl) piperazine‟ dan „ethanol‟. Di samping itu,
ketumpatan dan kelikatan 18 sampel amina yang diaktifkan dan tidak diaktif disukat pada suhu
30 ˚ C, 55 ˚ C dan 100 ˚ C dan didapati bahawa kedua-dua sifat fizikal berkurangan dengan
peningkatan suhu. Tetapi dalam keadaan peningkatan kepekatan, peningkatan ketara
diperhatikan bagi ketumpatan dan kelikatan amina yang diaktifkan dan yang tidak diaktifkan.
Kata Kunci: Degradasi, diethanolamine yang diaktifkan, methyldiethanolamine yang diaktifkan,
penyerapan, pelucutan, penyahserapan
viii
ACKNOWLEDGEMENT
First and foremost, I would like to thank my research advisor Dr. Brahim Si Ali and Dr.
Rozita Yusoff. I was initially drawn to Dr. Brahim‟s and Dr. Rozita‟s group solely by the
enthusiasm and excitement he exhibited when discussing his research. Upon joining his group,
I quickly learned that Brahim‟s initial impression was not just a sales pitch to attract new
graduate students; he brings that eagerness to teach – and to learn – with him every single day.
The door to his office is always open, literally and figuratively, to any graduate or
undergraduate student even those he does not supervise or teach. While Dr. Brahim and I did
not always agree on everything during our weekly meetings, I always felt like I left each
meeting having learned at least one thing I did not know before I stepped in his office. Dr.
Brahim has been a great mentor and I truly appreciate everything he has done for me. I would
also like to acknowledge all the laboratory group members that I have got to know during my
time at The University of Malaya. I extend my gratitude to all senior group members who I
could always call upon for advice while I was learning the ropes, especially Mr. Barham.
I am highly acknowledged to our all teacher in the Department of Chemical
Engineering. The head of the department he always meets with us with sweet laughing. Most
of the time we pray together actually the three times of prayer was so sweet, I never forget it.
All professors, Lecturer, my supervisor, all postgraduate students and undergraduate student
were participated in prayers and Prof. Dr. Mohd. Azlan Hussain sometimes had given us very
significant talk on religion. Prof. Mohd. K. Aroua, Dr. Aziz and Dr. Badrul are very interesting
sometimes we played football together in the play ground. These all events were so charming it
is still remind me several times every day.

ix
I am very glad on some PhD student in our laboratory they are very much helpful. I
will remember them in the all sphere of my life. Some PhD student out of our lab they were
also quite helpful and I have gotten a lot of facilities from them. I am really happty to get their
helpful hand to me. There is another laboratory which name is Bio-process laboratory, during
my sample analysis in used this lab for IC analysis. The all students of this lab were so much
petty to me. I am really happy to get many help from Boonpin, Seajean and the lab technician
Mrs. Azira.
The lab technician Ms. Fazizah, she is very helpful, from the beginning helped me very
much during the first entrance to the thermodynamics lab. I felt many problems she help me in
all step of my experiment for as example the lab uses procedure, entrance and exit procedure
etc. Mr. Isa, En. Sajali, En. Exram, En. Kamal Uddin, En. Jalal uddin everybody was so nice
they help me in all stages of my technical helps and gas supply. I have also been fortunate to
have made a number of friends in the department since I moved Dhaka to Malaysia. Faisal,
Saleh, Saied, Khalil, Mohammed, Shazzad, Anwar, A. Shimiri, Rahul, and Liza all are very
close to me.
I am also would like to highly acknowledge the Ministry of Science, Technology and
Innovation (MOSTI), Malaysia, for the project: RG003/09AET and the University of Malaya
for the financial support and for providing us with an excellent research environment.
x
DEDICATION
To my almighty Lord who has given me the ability to do research in this University
(UM), my loving parents and all Teacher, Your support and encouragement has guided
me and I am forever grateful.
xi
TABLE OF CONTENTS
Original literary Work Declaration ……………………………………………………… III
Abstract ………………………………………………………………………………….. IV
Abstract Translated in Bahasa Malaysia ............................................................................ VI
Acknowledgement ……………………………………………………………………... VIII
Dedication ………………………………………………………………………………... X
Table of Contents ……………………………………………………………………….. XI
List of Tables …………………………………………………………………………... XV
List of Figures …………………………………………………………………………. XIX
List of Symbols and Abbreviations ………………………………………………… XXVII
Chapter One: Introduction
1.1 Global Warming and Carbon Dioxide Emissions ……………………………………. 2
1.2 An Overview of CO2 Capture and Sequestration Methods …………………………... 4
1.3 Aqueous alkanolamine based absorption and stripping process ……………………... 5
1.4 Scope of this Present Work …………………………………………………………... 7
1.5 Objectives of this Research …………………………………………………………... 12
Chapter Two: Literature Review
2.1 What is Degradation and Degradation Products? ……………………………………. 14
2.2 Major causes of amine and alkanolamine degradation ………………………………. 15
2.2.1 Degradation of alkanolamine induced by sour gas components …………… 17
2.3 Chemistry of Degradation ……………………………………………………………. 19
2.4 Effect of Degradation Products on Process Parameters …………………………….... 20
2.5 Overview of the Historical Background of degradation study ……………………….. 21
2.6 Degradation of Monoethanolamine (MEA) and its blends …………………………... 23
2.6.1 Degradation products of MEA and its blends with methods ………………. 25
2.6.2 Degradation reaction of MEA and MEA blends …………………………… 29
2.7 Degradation of Diethanolamine (DEA) and its blends ………………………………. 31
2.7.1 Degradation products of DEA and DEA blends with methods ……………. 34
2.7.2 Mechanism of DEA degradation …………………………………………... 37
2.8 Degradation of Methyldiethanolamine (MDEA) and its blends ……………………... 40
2.8.1 Degradation products of MDEA and its blends ……………………………. 42
2.8.2 Degradation reaction of MDEA and MDEA blends ……………………….. 45
2.9 Degradation study of PZ, PZ-blends and reaction mechanism ………………………. 46
2.9.1 Degradation products of PZ and PZ-blends ………………………………... 47
2.9.2 Degradation of miscellaneous amines and its blends ………………………. 49
2.10 Most probable degradation products of amines and amines blends ……………….... 52
2.11 Research gap available in the open literature ……………………………………….. 53
Chapter Three: Methodology
3.1 Chemicals ……………………………………………………………………………. 55
3.2 Sample Preparation …………………………………………………………………... 55
3.3 Flow Diagram of Overall Experimental Setup and Analysis ………………………... 56
3.4 Equipment …………………………………………………………………………… 58
3.4.1 Degradation Equipment and Setup ………………………………………… 58
3.4.2 Autotitrator ………………………………………………………………… 60
3.4.3 Viscometer …………………………………………………………………. 61
3.4.4 Density Meter ……………………………………………………………… 62
3.4.5 High Performance Liquid Chromatography (HPLC) ……………………… 63
3.4.6 Gas Chromatography Mass Spectroscopy (GC-MS) ………………………. 63
3.4.7 Ion Chromatography (IC) ………………………………………………….. 64
3.5 Experimental Methods ……………………………………………………………….. 65
3.5.1 Degradation Procedure …………………………………………………….. 65
xii
3.5.2 Experimental Runs of Five Degradation Systems …………………………. 67
3.5.2.1 PZ-H2O-CO2 Systems …………………………………………… 67
3.5.2.2 DEA-H2O-CO2 Systems …………………………………………. 67
3.5.2.3 DEA-PZ-H2O-CO2 Systems ……………………………………... 68
3.5.2.4 MDEA-H2O-CO2 Systems ………………………………………. 68
3.5.2.5 MDEA-PZ-H2O-CO2 Systems …………………………………… 69
3.5.2.6 Labeling of Degraded Reaction Sample …………………………. 69
3.5.3 Analysis of Physical Properties of Degraded Reaction Solutions …………. 70
3.5.3.1 Determination of CO2 Loading …………………………………... 71
3.5.3.2 Determination of Amine Concentration ………………………….. 72
3.5.3.3 Determination of Solution Viscosity ……………………………... 72
3.5.3.4 Determination of Solution Density ………………………………. 73
3.5.4 Chromatographic Analysis of Degraded Reaction Sample ………………… 74
3.5.4.1 Ion Chromatography (IC) ………………………………………… 74
3.5.4.1.1 Anion Exchange Chromatography ……………………... 74
3.5.4.1.2 Cation Exchange Chromatography …………………….. 76
3.5.4.1.3 Ion Exclusion Chromatography (IEC) …………………. 78
3.5.4.1.4 Preparation of IC standard solutions …………………… 79
3.5.4.2 High Performance Liquid Chromatography (HPLC) …………….. 80
3.5.4.3 Gas Chromatography Mass Spectrometer (GC-MS) …………….. 82
Chapter 4: Results and Discussion
4.1 High Performance Liquid Chromatography (HPLC) Analysis with UV Detection …. 85
4.1.1 Degradation Products of PZ+H2O+CO2 System …………………………………... 86
4.1.1.1 Degradation Products of D01PZ1M Sample …………………………….. 86
4.1.1.2 Degradation Products of D02PZ2M Sample …………………………….. 89
4.1.1.3 Variation of Peak Areas of Degradation Products (DGPs) of
PZ+H2O+CO2System …………………………………………………………… 91
4.1.2 Degradation Products of DEA+H2O+CO2 System ………………………………... 92
4.1.2.1 Degradation Products of D03DEA2M Sample ………………………….. 92
4.1.2.2 Degradation Products of D04DEA3M Sample ………………………….. 95
4.1.2.3 Degradation Products of D05DEA4M Sample ………………………….. 98
4.1.2.4 Variation of Peak Areas of Identified DGPs of DEA+H2O+CO2 System.. 100
4.1.3 Degradation Products of DEA+PZ+H2O+CO2 System …………………………… 101
4.1.3.1 Degradation Products of D06DEA2MPZ1M …………………………… 101
4.1.3.2 Degradation Products of D07DEA2MPZ2M ……………………………. 103
4.1.3.3 Degradation Products of D08DEA3MPZ2M …………………………… 105
4.1.3.4 Degradation Products of D09DEA4MPZ2M …………………………… 107
4.1.3.5 Degradation Products of D10DEA7MPZ2M …………………………… 109
4.1.3.6 Variation of Peak Areas of Identified DGPs of DEA+H2O+CO2 System.. 111
4.1.4 Degradation Products of MDEA+H2O+CO2 System ……………………………… 113
4.1.4.1 Degradation Products of D11MDEA2M ………………………………… 113
4.1.4.2 Degradation Products of D12MDEA3M ………………………………… 113
4.1.4.3 Degradation Products of D13MDEA4M ………………………………… 114
4.1.4.4 Variation of Peak Areas of MDEA+H2O+CO2 System …………………. 117
4.1.5 Degradation Products of MDEA+PZ+H2O+CO2 System …………………………. 118
4.1.5.1 Degradation Products of D14MDEA2MPZ1M …………………………. 118
4.1.5.2 Degradation Products of D15MDEA2MPZ2M …………………………. 119
4.1.5.3 Degradation Products of D16MDEA3MPZ2M …………………………. 121
4.1.5.4 Degradation Products of D17MDEA4MPZ2M …………………………. 122
4.1.5.5 Degradation Products of D18MDEA7MPZ2M ………………………….. 124
4.1.5.6 Variation of Peak Areas of MDEA+PZ+H2O+CO2 System ……………... 126
4.1.6 Summary of HPLC (UV) Analysis ..……………………………………………….. 127
xiii
4.2 Ion Chromatographic (IC) Methods ………………………………………………….. 131
4.2.1 Degradation Products of PZ+H2O+CO2 System …………………………………… 131
4.2.1.1 Degradation Products of D01PZ1M ……………………………………… 131
4.2.1.2 Degradation Products of D02PZ2M ……………………………………… 133
4.2.1.3 Variation of concentration of Identified DGPs of PZ+H2O+CO2 System .. 136
4.2.2 Degradation Products of DEA+H2O+CO2 System ………………………………… 137
4.2.2.1 Degradation Products of D03DEA2M …………………………………… 137
4.2.2.2 Degradation Products of D04DEA3M …………………………………… 139
4.2.2.3 Degradation Products of D05DEA4M …………………………………… 141
4.2.2.4 Variation of Concentration of Ionic DGPs of DEA+H2O+CO2 System …. 143
4.2.3 Degradation Products of DEA+PZ+H2O+CO2 System ……………………………. 144
4.2.3.1 Degradation Products of D06DEA2MPZ1M ……………………………. 144
4.2.3.2 Degradation Products of D07DEA2MPZ2M ……………………………. 146
4.2.3.3 Degradation Products of D08DEA3MPZ2M ……………………………. 148
4.2.3.4 Degradation Products of D09DEA4MPZ2M …………………………….. 150
4.2.3.5 Degradation Products of D10DEA7MPZ2M ……………………………. 152
4.2.3.6 Variation of Concentration of Ionic DGPs of DEA+PZ+H2O+CO2 System 154
4.2.4 Degradation Products of MDEA+H2O+CO2 System ………………………………. 156
4.2.4.1 Degradation Products of D11MDEA2M …………………………………. 156
4.2.4.2 Degradation Products of D12MDEA3M …………………………………. 159
4.2.4.3 Degradation Products of D13MDEA4M …………………………………. 161
4.2.4.4 Variation of Concentration of Ionic DGPs of MDEA+H2O+CO2 System .. 163
4.2.5 Degradation Products of MDEA+PZ+H2O+CO2 System ………………………….. 164
4.2.5.1 Degradation Products of D14MDEA2MPZ1M ………………………….. 164
4.2.5.2 Degradation Products of D15MDEA2MPZ2M ………………………….. 166
4.2.5.3 Degradation Products of D16MDEA3MPZ2M ………………………….. 168
4.2.5.4 Degradation Products of D17MDEA4MPZ2M ………………………….. 170
4.2.5.5 Degradation Products of D18MDEA7MPZ2M ………………………….. 172
4.2.5.6 Variation of concentration of ionic DGPs of
MDEA+PZ+H2O+CO2 system …………………………………………………… 175
4.2.6 Summary of IC Analysis …………………………………………………………… 176
4.3 Gas Chromatography Mass Spectroscopy (GC-MS) ………………………………… 181
4.3.1 Degradation products of D02PZ2M ………………………………………... 181
4.3.2 Degradation products of D05DEA4M ……………………………………… 183
4.3.3 Degradation products of D10DEA7MPZ2M ………………………………. 185
4.3.4 Degradation products of D13MDEA4M …………………………………… 187
4.3.5 Degradation products of D18MDEA7MPZ2M ……………………………. 189
4.3.6 Variation of peak areas of DGPs for D02PZ2M, D05DEA4M,
D10DEA7MPZ2M, D13MDEA4M and D18MDEA7MPZ2M
Identified by GC-MS …………………………………………………………….. 191
4.3.7 Summary of GCMS Analysis ……………………………….……………... 194
4.4 Measurement of Viscosity and Density ……………………………………………… 196
4.4.1 Effect of Temperature, Concentration and Degradation Products on Viscosity …... 196
4.4.1.1 Effect of Amine Concentration on Viscosity …………………………… 196
4.4.1.2 Effect of Temperature on Viscosity ……………………………………... 198
4.4.1.3 Effect of Degradation on Viscosity ……………………………………… 200
4.4.2 Effect of Temperature, Concentration and Degradation Products on Density …….. 202
4.4.2.1 Effect of Concentration on Density ……………………………………… 202
4.4.2.2 Effect of Temperature on Density ……………………………………….. 203
4.4.2.3 Effect of Degradation on Density ………………………………………... 205
4.4.3 Role of Degradation Products on Density and Viscosity ………………………….. 207
xiv
Chapter 5: Conclusions and Recommendation for Future Work
5.1 Conclusions …………………………………………………………………………... 213
5.1.1 Degradation System I: PZ+H2O+CO2 ……………………………………... 213
5.1.2 Degradation System II: DEA+H2O+CO2 ………………………………….. 213
5.1.3 Degradation System III: DEA+PZ+H2O+CO2 …………………………….. 214
5.1.4 Degradation System IV: MDEA+H2O+CO2 …………………………….… 215
5.1.5 Degradation System V: MDEA+PZ+H2O+CO2 …………………………... 215
5.1.6 Density and Viscosity ……………………………………………………... 215
5.2 Recommendations …………………………………………………………………… 216
References ………………………………………………………………………………. 217
Appendix ………………………………………………………………………………... 226
Appendix A: List of Chemicals Used in This Work …………………………………….. 227
Appendix B: Retention Time of Selected Analytical Standards for HPLC ……………… 230
Appendix C: Retention Time of Selected Analytical Standards for GC-MS ……………. 231
Appendix D: Analytical Standards and Reagents for Ion Chromatography (IC) ………... 233
Appendix E: Variation of pH for Virgin & Degraded Solutions ………………………… 234
Appendix F: Measurement of Carbon Dioxide Loading of Degraded Solutions ………... 235
Appendix G: Measurement of Densities of Degraded Amine Solutions ………………… 236
Appendix H: Measurement of Viscosities (µ) of Degraded Amine Solutions …………... 237
Appendix I: Chromatograms of IC Standards with Retention Time …………………….. 238
Appendix J: Publications Related to the Present Work …………………………………. 239
Appendix K: Author Vita ………………………………………………………………… 240
xv
LIST OF TABLES
Table 1.1: Capacities of natural reservoirs for co2 sequestration ………………………… 07
Table 2.1: Degradation report of monoethanolamine (MEA) …….. …………………….. 24
Table 2.2: Degradation products of MEA ….…………………………………………….. 26
Table 2.3: Degradation products of MEA+ CO2+ H2O system …… …………………….. 28
Table 2.4: Degradation products of MEA/H2O/O2 and MEA/H2O/CO2/O2 System …….. 28
Table 2.5: Degradation background of DEA …………………………………………….. 32
Table 2.6: Degradation report of DEA ……. ……………………………………………... 33
Table 2.7: Degradation products of DEA …. …………………………………………….. 35
Table 2.8: Degradation products of DEA/CS2 …….. …………………………………….. 37
Table 2.9: Degradation reports of MDEA and MDEA-blends ……. …………………….. 41
Table 2.10: Degradation products of MDEA and MDEA-blends … …………………….. 43
Table 2.11: Degradation of PZ and PZ-Blends report …….. …………………………….. 47
Table 2.12: Degradation products and findings of PZ and PZ-Blends ……. …………….. 48
Table 2.13: Degradation report of miscellaneous amines and its blends ….. …………….. 50
Table 2.14: Degradation products and major findings of miscellaneous alkanolmines and
Its blends………………………………………………………………………………….. 50
Table 2.15: Typical example of degradation products of amine and alkanolamine ……... 52
Table 3.1: Components of formulated amine samples and code numbers of degraded reaction
samples used for labeling …..…………………………………………………………….. 70
Table 3.2: Operating condition and solvent of IC for anion analysis ……………………. 75
Table 3.3: Operating condition and solvent of IC method for cation analysis ………….... 77
Table 3.4: Operating condition and solvent of IC method for organic acids analysis ……. 79
Table 3.5: Operating condition and solvent of HPLC (UV) method for identifying degraded
alkanolamine samples ……………………………………………………………………. 81
Table 3.6: Operating condition of GC-MS techniques for analyzing CO2 induced
degradation of activated DEA and MDEA………………………………………………. 83
Table 4.1: List of carbon dioxide induced degradation products of D01PZ1M identified by
HPLC-UV method ……………………………………………………………………….. 88
xvi
Table 4.2: List of carbon dioxide induced degradation products of D02PZ2M identified by
HPLC-UV method………………………………………………………………………… 89
Table 4.3: List of carbon dioxide induced degradation products of D03DEA2M identified by
HPLC-UV method ……………………………………………………………………….. 94
Table 4.4: List of carbon dioxide induced degradation products of D04DEA3M identified by
HPLC-UV method ……………………………………………………………………….. 97
Table 4.5: List of carbon dioxide induced degradation products of D05DEA4M identified by
HPLC-UV method ……………………………………………………………………….. 99
Table 4.6: List of carbon dioxide induced degradation products of aqueous blends of
D06DEA2MPZ1M identified by HPLC-UV method ….……………………………….. 102
Table 4.7: List of carbon dioxide induced degradation products of D07DEA2MPZ2M
identified by HPLC-UV method ………………………………………………………… 104
Table 4.8: List of carbon dioxide induced degradation products of D08DEA3MPZ2M
identified by HPLC-UV method ………………………………………………………….106
Table 4.9: List of carbon dioxide induced degradation products of D09DEA4MPZ2M
identified by HPLC-UV method ………………………………………………………….108
Table 4.10: List of carbon dioxide induced degradation products of D10DEA7MPZ2M
identified by HPLC-UV method ………………………………………………………….110
Table 4.11: List of carbon dioxide induced degradation products of D11MDEA2M
identified by HPLC-UV method …….……………………………………………………115
Table 4.12: List of carbon dioxide induced degradation products of D12MDEA3M
identified by HPLC-UV method …………………………………………………….115
Table 4.13: List of carbon dioxide induced degradation products of D13MDEA4M
identified by HPLC-UV method ………………………………………………………….116
Table 4.14: List of carbon dioxide induced degradation products of D14MDEA2MPZ1M
identified by HPLC-UV method ………………………………………………………….120
Table 4.15: List of carbon dioxide induced degradation products of D15MDEA2MPZ2M
identified by HPLC-UV method ………………………………………………………….120
Table 4.16: List of carbon dioxide induced degradation products of D16MDEA3MPZ2M
identified by HPLC-UV method ………………………………………………………….123
Table 4.17: List of carbon dioxide induced degradation products of D17MDEA4MPZ2M
identified by HPLC-UV method ………………………………………………………….123
Table 4.18: List of carbon dioxide induced degradation products of D18MDEA7MPZ2M
identified by HPLC-UV method ………………………………………………………….125
xvii
Table 4.19: Degradation Products of PZ+ H2O + CO2 System Identified by HPLC-UV
Method …………………………………………………………………………………… 127
Table 4.20: Degradation Products of DEA+H2O+CO2 System Identified by HPLC-UV
Method …………………………………………………………………………………… 128
Table 4.21: Degradation Products of DEA+PZ+H2O+CO2 System Identified by HPLC-UV
Method …………………………………………………………………………………… 129
Table 4.22: Degradation Products of MDEA+H2O+CO2 System Identified by HPLC-UV
Method …………………………………………………………………………………… 130
Table 4.23: Degradation Products of MDEA+PZ+H2O+CO2 System Identified by HPLC-UV
Method …………………………………………………………………………………… 130
Table 4.24: Carbon dioxide induced degradation products of D01PZ1M identified by IC
methods …………………………………………………………………………………… 133
Table 4.25: Carbon dioxide induced degradation products of D02PZ2M identified by IC
methods …………………………………………………………………………………… 135
Table 4.26: Carbon dioxide induced degradation products of D03DEA2M identified by IC
methods …………………………………………………………………………………… 138
Table 4.27: Carbon dioxide induced degradation products of D04DEA3M identified by IC
methods …………………………………………………………………………………... 140
Table 4.28: Carbon dioxide induced degradation products of D05DEA4M identified by IC
methods …………………………………………………………………………………… 143
Table 4.29: Carbon dioxide induced degradation products of D06DEA2MPZ1M identified by
IC methods ........................................................................................................................... 146
Table 4.30: Carbon dioxide induced degradation products of D07DEA2MPZ2M identified by
IC method ………………………………………………………………………………… 148
Table 4.31: Carbon dioxide induced degradation products of D08DEA3MPZ2M identified by
IC methods ……………………………………………………………………………….. 150
Table 4.32: Carbon dioxide induced degradation products of D09DEA4MPZ2M identified by
IC methods ……………………………………………………………………………….. 152
Table 4.33: Carbon dioxide induced degradation products of D10DEA7MPZ2M identified by
IC methods ……………………………………………………………………………….. 154
Table 4.34: List of carbon dioxide induced degradation products of D11MDEA2M identified
by IC methods ...................................................................................................................... 158
Table 4.35: List of carbon dioxide induced degradation products of D12MDEA3M identified
by IC methods …………………………………………………………………………….. 161
xviii
Table 4.36: List of carbon dioxide induced degradation products of D13MDEA4M identified
by IC methods …………………………………………………………………………….. 163
Table 4.37: Carbon dioxide induced degradation products of D14MDEA2MPZ1M identified
by IC methods……………………………………………………………………………. 166
Table 4.38: Carbon dioxide induced degradation products of D15MDEA2MPZ2M identified
by IC methods……………………………………………………………………………. 168
Table 4.39: Carbon dioxide induced degradation products of D16MDEA3MPZ2M identified
by IC methods ……………………………………………………………………………. 170
Table 4.40: Carbon dioxide induced degradation products of D17MDEA4MPZ2M identified
by IC methods …………………………………………………………………………….. 172
Table 4.41: Carbon dioxide induced degradation products of D18MDEA7MPZ2M identified
by IC methods …………………………………………………………………………….. 174
Table 4.42: Degradation Products of PZ+H2O+CO2 System Identified by IC Method …. 177
Table 4.43: Degradation Products of DEA+H2O+CO2 System Identified by IC Method ... 177
Table 4.44: Degradation Products of DEA+PZ+H2O+CO2 System Identified by IC
Method ……………………………………………………………………………………. 178
Table 4.45: Degradation Products of MDEA+H2O+CO2 System Identified by IC Method 179
Table 4.46: Degradation Products of MDEA+PZ+H2O+CO2 System Identified by IC
Method …………………………………………………………………………………… 180
Table 4.47: Degradation Products of D02PZ2M of PZ+H2O+CO2 Degradation System
Identified by GC-MS and NIST data based Methods …………………………………… 182
Table 4.48: Degradation Products of D05DEA4M of DEA+H2O+CO2 Degradation System
Identified by GC-MS Method …………………………………………………………….. 184
Table 4.49: Degradation Products of D10DEA7MPZ2M of DEA+PZ+H2O+CO2 Degradation
System Identified by GC-MS Method ……………………………………………………. 186
Table 4.50: Degradation Products of D13MDEA4M of MDEA+H2O+CO2 Degradation
System Identified by GC-MS Method…………………………………………………….. 188
Table 4.51: Degradation Products of D18MDEA7MPZ2M of MDEA+PZ+H2O+CO2
Degradation System Identified by GC-MS Method ............................................................ 190
Table 4.52: Degradation Products of PZ+H2O+CO2, DEA+H2O+CO2, DEA+PZ+H2O+CO2,
MDEA+H2O+CO2 and MDEA+PZ+H2O+CO2 Degradation System Identified by GC-MS
Method …………………………………………………………………………………… 195
xix
LIST OF FIGURES
Figure 1.1: Simplified absorption/stripping system ……………………………………… 06
Figure 2.1: Formation of DGPs during sour gas sweetening process ……………………. 18
Figure 2.2: Degradation reaction mechanism of Monoethanolamine (MEA)
induced by carbon dioxide (CO2) ………………………………………………………… 30
Figure 2.3: CO2 induced degradation of DEA …………………………………………… 38
Figure 2.4: Possible route of DEA degradation reaction ………………………………… 39
Figure 2.5: Degradation reaction mechanism of MDEA/PZ blends ……………………... 45
Figure 2.6: Reaction mechanism of MDEA/PZ ………………………………………….. 46
Figure 3.1: Schematic diagram of overall experimental work and analysis ……………… 57
Figure 3.2: Schematic diagram for the degradation study of activated amine solution ….. 59
Figure 3.3: Laboratory experimental setup for the degradation study of activated amine
solution …………………………………………………………………………………... 60
Figure 3.4: Metrohm autotitrator setup with tiamo software ……………………………. 61
Figure 3.5: A Typical view of BROOKFIELD (LV) Viscometer ………………………. 62
Figure 3.6: A Typical view of Anton Paar (DMA 4500) Density Meter with automatic
software ………………………………………………………………………………….. 62
Figure 3.7: High Performance Liquid Chromatography (HPLC) ……………………….. 63
Figure 3.8: Gas Chromatography Mass Spectrometer (GC-MS) ………………………… 64
Figure 3.9: Professional Compact Metrohm Ion Chromatography ………………………. 64
Figure 3.10: Variation of pH with time during the absorbtion reaction of CO2 with
alkanolamine ……………………………………………………………………………… 66
Figure 3.11: Variation of pH with time during the desorption reaction of CO2 with
alkanolamine ……………………………………………………………………………… 66
Figure 3.12: Variation of pH with 1 M HCl during the titration of the samples …………. 71
Figure 4.1a: Chromatograms of carbon dioxide induced degradation of D01PZ1M identified
by HPLC-UV method …………………………………………………………………… 87
Figure 4.1b: Chromatograms of carbon dioxide induced degradation of D01PZ1M identified
by HPLC-UV method …………………………………………………………………… 87
xx
Figure 4.2: Chromatograms of carbon dioxide induced degradation of D02PZ2M identified
by HPLC-UV method …………………………………………………………………… 89
Figure 4.3: Variation of Degradation Products of D01PZ1M and D02PZ2M …………… 91
Figure 4.4: Chromatograms of carbon dioxide induced degradation of D03DEA2M
identified by HPLC-UV method…………………………………………………………. 93
Figure 4.5: Chromatograms of carbon dioxide induced degradation of D04DEA3M
identified by HPLC-UV method …………………………………………………………. 96
Figure 4.6: Chromatograms of carbon dioxide induced degradation of D05DEA4M
identified by HPLC-UV method …………………………………………………………. 98
Figure 4.7: Variation of Peak Areas of Identified DGPs of D03DEA2M, D04DEA3M and
D05DEA4M ……………………………………………………………………………... 100
Figure 4.8: Chromatograms of carbon dioxide induced degradation of D06DEA2MPZ1M
identified by HPLC-UV method ………………………………………………………… 101
Figure 4.9: Chromatograms of carbon dioxide induced degradation of D07DEA2MPZ2M
identified by HPLC-UV method ………………………………………………………….103
Figure 4.10: Chromatograms of carbon dioxide induced degradation of D08DEA3MPZ2M
identified by HPLC-UV method ………………………………………………………….105
Figure 4.11: Chromatograms of carbon dioxide induced degradation of D09DEA4MPZ2M
identified by HPLC-UV method ………………………………………………………… 107
Figure 4.12: Chromatograms of carbon dioxide induced degradation of D10DEA7MPZ2M
identified by HPLC-UV method ………………………………………………………….109
Figure 4.13: Variation of peak areas of D06DEA2MPZ1M, D07DEA2MPZ2M and
D08DEA3MPZ2M identified by HPLC (UV) methods ………………………………….111
Figure 4.14: Variation of peak areas of D09DEA4MPZ2M and D10DEA7MPZ2M
identified by HPLC (UV) method ……………………………………………………….. 112
Figure 4.15: Chromatograms of carbon dioxide induced degradation of D11MDEA2M
identified by HPLC-UV method ………………………………………………………… 113
Figure 4.16: Chromatograms of carbon dioxide induced degradation of D12MDEA3M
identified by HPLC-UV method ………………………………………………………….113
Figure 4.17: Chromatograms of carbon dioxide induced degradation of D13MDEA4M
identified by HPLC-UV method ………………………………………………………….114
Figure 4.18: Variation of peak areas of D11MDEA2M, D12MDEA3M and D13MDEA4M
identified by HPLC (UV) methods ……………………………………………………….117
Figure 4.19: Chromatograms of carbon dioxide induced degradation of
D14MDEA2MPZ1M identified by HPLC-UV method …………………………………. 118
xxi
Figure 4.20: Chromatograms of carbon dioxide induced degradation of
D15MDEA2MPZ2M identified by HPLC-UV method …………………………………..119
Figure 4.21: Chromatograms of carbon dioxide induced degradation of
D16MDEA3MPZ2M identified by HPLC-UV method …………………………………. 121
Figure 4.22: Chromatograms of carbon dioxide induced degradation of
D17MDEA4MPZ2M identified by HPLC-UV method …………………………………..122
Figure 4.23: Chromatograms of carbon dioxide induced degradation of
D18MDEA7MPZ2M identified by HPLC-UV method …………………………………..124
Figure 4.24: Variation of peak areas of identified DGPs of D14MDEA2MPZ1M,
D15MDEA2MPZ2M, D16MDEA3MPZ2M, D17MDEA4MPZ2M and
D18MDEA7MPZ2M identified by HPLC (UV) method …………………………………126
Figure 4.25: Chromatograms of CO2 induced degradation products of D01PZ1M sample
identified by AICM ……………………………………………………………………….132
Figure 4.26: Chromatograms of CO2 induced degradation products of D01PZ1M sample
identified by CICM ……………………………………………………………………….132
Figure 4.27: Chromatograms of CO2 induced degradation products of D01PZ1M sample
identified by OICM ……………………………………………………………………….132
Figure 4.28: Chromatograms of CO2 induced degradation products of D02PZ2M sample
identified by AICM ……………………………………………………………………….134
Figure 4.29: Chromatograms of CO2 induced degradation products of D02PZ2M sample
identified by AICM ………………………………………………………………………134
Figure 4.30: Chromatograms of CO2 induced degradation products of D02PZ2M sample
identified by CICM ………………………………………………………………………134
Figure 4.31: Chromatograms of CO2 induced degradation products of D02PZ2M sample
identified by OICM ……………………………………………………………………….135
Figure 4.32: Variation of concentration of identified DGPs of D01PZ1M and D02PZ2M by
IC methods ………………………………………………………………………………..136
Figure 4.33: Chromatogram of carbon dioxide induced degradation products of D03DEA2M
identified by anionic ion chromatographic method (AICM) ……………………………..137
Figure 4.34: Chromatogram of carbon dioxide induced degradation products of D03DEA2M
identified by cationic ion chromatographic method (CICM) ……………………………138
Figure 4.35: Chromatogram of carbon dioxide induced degradation products of D03DEA2M
identified by organic acid ion chromatographic method (OICM) ………………………..138
Figure 4.36: Chromatogram of carbon dioxide induced degradation products of D04DEA3M
identified by cationic ion chromatographic method (CICM) ……………………………139
xxii
Figure 4.37: Chromatogram of carbon dioxide induced degradation products of D04DEA3M
identified by anionic ion chromatographic method (AICM) ……………………………..139
Figure 4.38: Chromatogram of carbon dioxide induced degradation products of D04DEA3M
identified by organic acid ion chromatographic method (OICM) ………………………..140
Figure 4.39: Chromatogram of carbon dioxide induced degradation products of
DO5DEA4M identified by anionic ion chromatographic method (AICM) ……………....141
Figure 4.40: Chromatogram of carbon dioxide induced degradation products of
DO5DEA4M identified by cationic ion chromatographic method (CICM) ……………...141
Figure 4.41: Chromatogram of carbon dioxide induced degradation products of
DO5DEA4M identified by organic acid ion chromatographic method (OICM) …………142
Figure 4.42: Reaction pathways for the formation acids, aldehyde and ketone from
alkanolamine …………………………………………………………………………….. 142
Figure 4.43: Variation of concentration of identified DGPs of D03DEA2M, D04DEA3M
and D05DEA4M ………………………………………………………………………… .144
Figure 4.44: Chromatograms of carbon dioxide induced degradation of D06DEA2MPZ1M
identified by AICM ……………………………………………………………………….145
Figure 4.45: Chromatograms of carbon dioxide induced degradation of D06DEA2MPZ1M
identified by CICM ……………………………………………………………………….145
Figure 4.46: Chromatograms of carbon dioxide induced degradation of D06DEA2MPZ1M
identified by OICM ……………………………………………………………………….145
Figure 4.47: Chromatograms of carbon dioxide induced degradation of D07DEA2MPZ2M
identified by AICM ……………………………………………………………………….147
Figure 4.48: Chromatograms of carbon dioxide induced degradation of D07DEA2MPZ2M
identified by CICM ……………………………………………………………………….147
Figure 4.49: Chromatograms of carbon dioxide induced degradation of D07DEA2MPZ2M
identified by OICM ……………………………………………………………………….147
Figure 4.50: Chromatograms of carbon dioxide induced degradation of D08DEA3MPZ2M
identified by AICM ……………………………………………………………………….149
Figure 4.51: Chromatograms of carbon dioxide induced degradation of D08DEA3MPZ2M
identified by CICM ……………………………………………………………………….149
Figure 4.52: Chromatograms of carbon dioxide induced degradation of D08DEA3MPZ2M
identified by OICM ……………………………………………………………………….149
Figure 4.53: Chromatograms of carbon dioxide induced degradation of D09DEA4MPZ2M
identified by AICM ……………………………………………………………………….151

xxiii
Figure 4.54: Chromatograms of carbon dioxide induced degradation of D09DEA4MPZ2M
identified by CICM ……………………………………………………………………….151
Figure 4.55: Chromatograms of carbon dioxide induced degradation of D09DEA4MPZ2M
identified by OICM ……………………………………………………………………….151
Figure 4.56: Chromatograms of carbon dioxide induced degradation of D10DEA7MPZ2M
identified by AICM ……………………………………………………………………….153
Figure 4.57: Chromatograms of carbon dioxide induced degradation of D10DEA7MPZ2M
identified by CICM ……………………………………………………………………….153
Figure 4.58: Chromatograms of carbon dioxide induced degradation of D10DEA7MPZ2M
identified by OICM ……………………………………………………………………….153
Figure 4.59: Variation of concentration of identified DGPs of D01PZ1M and D02PZ2M by
IC methods ………………………………………………………………………………..155
Figure 4.60: Variation of concentration of identified DGPs of D01PZ1M and D02PZ2M by
IC methods ………………………………………………………………………………..156
Figure 4.61: Chromatograms of carbon dioxide induced degradation of D11MDEA2M
identified by AICM-01 ……………………………………………………………………157
Figure 4.62: Chromatograms of carbon dioxide induced degradation of D11MDEA2M
identified by AICM-02 ……………………………………………………………………157
Figure 4.63: Chromatograms of carbon dioxide induced degradation of D11MDEA2M
identified by CICM ……………………………………………………………………….157
Figure 4.64: Chromatograms of carbon dioxide induced degradation of D11MDEA2M
identified by OICM ……………………………………………………………………….158
Figure 4.65: Chromatograms of carbon dioxide induced degradation of D12MDEA3M
identified by AICM-01 ……………………………………………………………………159
Figure 4.66: Chromatograms of carbon dioxide induced degradation of D12MDEA3M
identified by AICM-02 ……………………………………………………………………160
Figure 4.67: Chromatograms of carbon dioxide induced degradation of D12MDEA3M
identified by CICM ……………………………………………………………………….160
Figure 4.68: Chromatograms of carbon dioxide induced degradation of D12MDEA3M
identified by OICM ……………………………………………………………………….160
Figure 4.69: Chromatograms of carbon dioxide induced degradation of D13MDEA4M
identified by AICM ……………………………………………………………………….162
Figure 4.70: Chromatograms of carbon dioxide induced degradation of D13MDEA4M
identified by CICM ……………………………………………………………………….162
Figure 4.71: Chromatograms of carbon dioxide induced degradation of D13MDEA4M
identified by OICM ……………………………………………………………………….162
xxiv
Figure 4.72: Variation of concentration of identified DGPs of D11MDEA2M,
D11MDEA2M and D11MDEA2M ………………………………………………………164
Figure 4.73: Chromatograms of carbon dioxide induced degradation of
D14MDEA2MPZ1M identified by AICM ………………………………………………..165
Figure 4.74: Chromatograms of carbon dioxide induced degradation of
D14MDEA2MPZ1M identified by CICM ………………………………………………..165
Figure 4.75: Chromatograms of carbon dioxide induced degradation of
D14MDEA2MPZ1M identified by OICM ………………………………………………..165
Figure 4.76: Chromatograms of carbon dioxide induced degradation of
D15MDEA2MPZ2M identified by AICM ………………………………………………..167
Figure 4.77: Chromatograms of carbon dioxide induced degradation of
D15MDEA2MPZ2M identified by CICM ………………………………………………..167
Figure 4.78: Chromatograms of carbon dioxide induced degradation of
D15MDEA2MPZ2M identified by OICM ………………………………………………..167
Figure 4.79: Chromatograms of carbon dioxide induced degradation of
D16MDEA3MPZ2M identified by AICM ………………………………………………..169
Figure 4.80: Chromatograms of carbon dioxide induced degradation of
D16MDEA3MPZ2M identified by CICM ………………………………………………..169
Figure 4.81: Chromatograms of carbon dioxide induced degradation of
D16MDEA3MPZ2M identified by OICM ………………………………………………..169
Figure 4.82: Chromatograms of carbon dioxide induced degradation of
D17MDEA4MPZ2M identified by AICM-01 ……………………………………………171
Figure 4.83: Chromatograms of carbon dioxide induced degradation of
D17MDEA4MPZ2M identified by AICM-02 ……………………………………………171
Figure 4.84: Chromatograms of carbon dioxide induced degradation of
D17MDEA4MPZ2M identified by CICM ………………………………………………..171
Figure 4.85: Chromatograms of carbon dioxide induced degradation of
D17MDEA4MPZ2M identified by OICM ………………………………………………..171
Figure 4.86: Chromatograms of carbon dioxide induced degradation of
D18MDEA7MPZ2M identified by AICM-01 ……………………………………………173
Figure 4.87: Chromatograms of carbon dioxide induced degradation of
D18MDEA7MPZ2M identified by AICM-02 ……………………………………………173
Figure 4.88: Chromatograms of carbon dioxide induced degradation of
D18MDEA7MPZ2M identified by CICM ………………………………………………..173
xxv
Figure 4.89: Chromatograms of carbon dioxide induced degradation of
D18MDEA7MPZ2M identified by OICM ………………………………………………..174
Figure 4.90: Variation of concentration of identified DGPs of D14MDEA2MPZ1M,
D15MDEA2MPZ2M and D16MDEA3MPZ2M …………………………………………175
Figure 4.91: Variation of concentration of identified DGPs of D17MDEA4MPZ2M and
D18MDEA7MPZ2M ……………………………………………………………………..176
Figure 4.92: Chromatogram of GC mass spectrum of degraded sample D02PZ2M in the
degradation system PZ+H2O+CO2 ……………………………………………………….181
Figure 4.93: Chromatogram of GC mass spectrum of degraded sample D05DEA4M in the
degradation system DEA+H2O+CO2 …………………………………………………….183
Figure 4.94: Chromatogram of GC mass spectrum of degraded sample D10DEA7MPZ2M
in the degradation system DEA+PZ+H2O+CO2 ………………………………………… 185
Figure 4.95: Chromatogram of GC mass spectrum of degraded sample D13MDEA4M in the
degradation system MDEA+H2O+CO2 …………………………………………………...187
Figure 4.96: Chromatogram of GC mass spectrum of degraded sample D18MDEA7MPZ2M
in the degradation system MDEA+PZ+H2O+CO2 ………………………………………..189
Figure 4.97: Variation of peak areas of DGPs of D02PZ2M identified by GC-MS ……...191
Figure 4.98: Variation of peak areas of DGPs of D05DEA4M and D10DEA7MPZ2M
identified by GC-MS ……………………………………………………………………...193
Figure 4.99: Variation of peak areas of DGPs of D11MDEA4M and D18MDEA7MPZ2M
identified by GC-MS ……………………………………………………………………...193
Figure 4.100: Variation of viscosities with alkanolamine concentration for activated and
inactivated DEA and MDEA at constant temperature …………………………………....197
Figure 4.101: Variation of viscosities for inactivated DEA and MDEA at 25 ˚C, 55 ˚C and
100 ˚C temperatures ………………………………………………………………………198
Figure 4.102: Variation of viscosities for activated DEA and MDEA at 25 ˚C, 55 ˚C and 100
˚C temperatures ………………………………………………………………………….. 200
Figure 4.103: Comparison between the viscosities of virgin and degraded amine solutions
for activated and inactivated DEA and MDEA at 25 ˚C temperature …………………….201
Figure 4.104: Variation of densities with alkanolamine concentration for activated and
inactivated DEA and MDEA at 30 ˚C, 55 ˚C and 100 ˚C temperatures ………………….203
Figure 4.105: Variation of densities for inactivated DEA and MDEA at 25 ˚C, 55 ˚C and
100 ˚C temperatures ………………………………………………………………………204
Figure 4.106: Variation of densities for activated DEA and MDEA at 25 ˚C, 55 ˚C and 100
˚C temperatures …………………………………………………………………………...205
xxvi
Figure 4.107: Comparison between the densities of virgin and degraded amine solutions for
activated and inactivated DEA and MDEA at 30 ˚C temperature ………………………..206
Figure 4.108: Variation of peak areas of identified degradation products of activated and
inactivated DEA and MDEA by HPLC …………………………………………………..207
Figure 4.109: Variation of peak areas of identified degradation products of DEA/PZ and
MDEA/PZ by HPLC ……………………………………………………………………...208
Figure 4.110: Variation of peak areas of identified degradation products of activated and
inactivated DEA and MDEA by GCMS ………………………………………………….209
Figure 4.111: Variation of concentration of Ionic DGPs of activated alkanolamines
identified by IC analysis …………………………………………………………………..210
Figure 4.112: Variation of concentrations of Ionic DGPs of activated and inactivated
alkanolamines identified by IC analysis …………………………………………………..211
xxvii
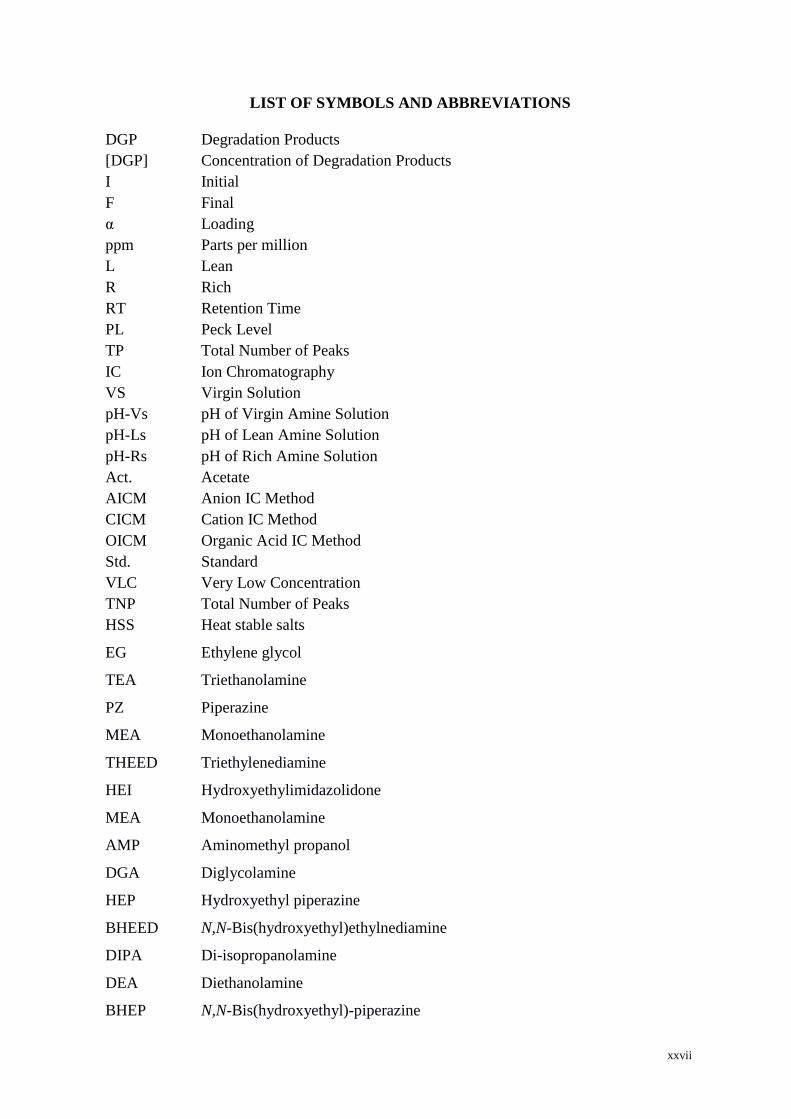
LIST OF SYMBOLS AND ABBREVIATIONS
DGP Degradation Products
[DGP] Concentration of Degradation Products
I Initial
F Final
α Loading
ppm Parts per million
L Lean
R Rich
RT Retention Time
PL Peck Level
TP Total Number of Peaks
IC Ion Chromatography
VS Virgin Solution
pH-Vs pH of Virgin Amine Solution
pH-Ls pH of Lean Amine Solution
pH-Rs pH of Rich Amine Solution
Act. Acetate
AICM Anion IC Method
CICM Cation IC Method
OICM Organic Acid IC Method
Std. Standard
VLC Very Low Concentration
TNP Total Number of Peaks
HSS Heat stable salts
EG Ethylene glycol
TEA Triethanolamine
PZ Piperazine
MEA Monoethanolamine
THEED Triethylenediamine
HEI Hydroxyethylimidazolidone
MEA Monoethanolamine
AMP Aminomethyl propanol
DGA Diglycolamine
HEP Hydroxyethyl piperazine
BHEED N,N-Bis(hydroxyethyl)ethylnediamine
DIPA Di-isopropanolamine
DEA Diethanolamine
BHEP N,N-Bis(hydroxyethyl)-piperazine
xxviii
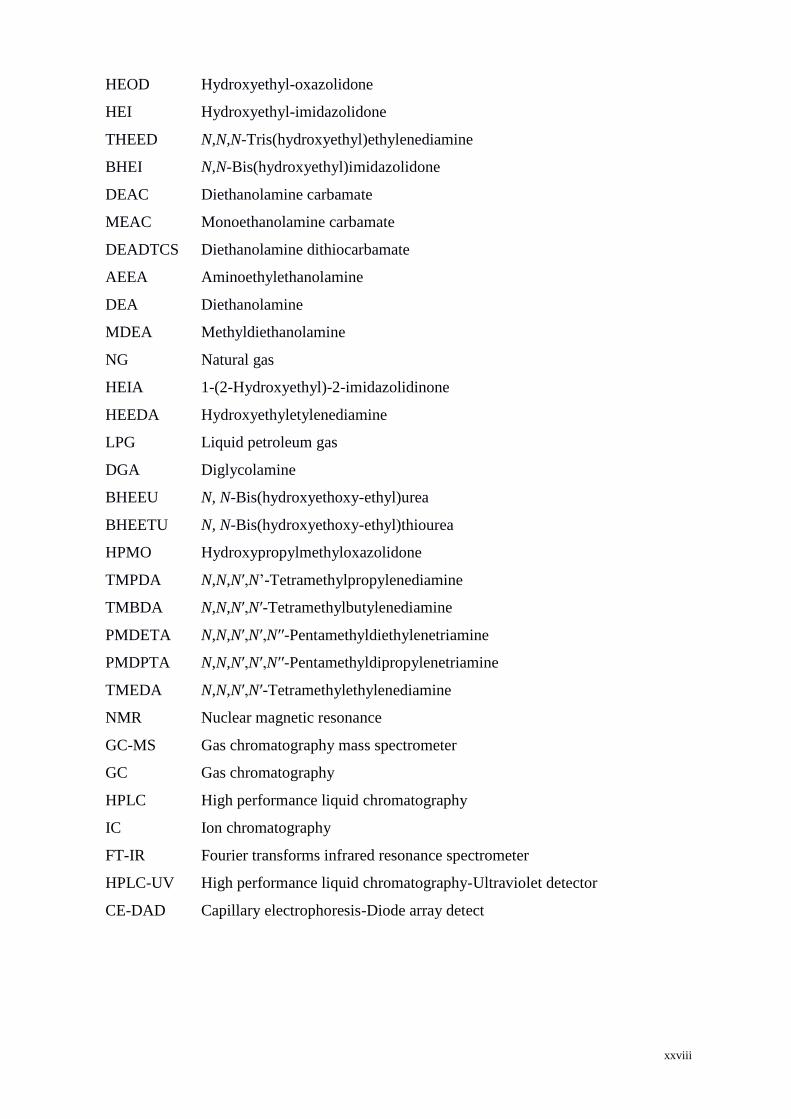
HEOD Hydroxyethyl-oxazolidone
HEI Hydroxyethyl-imidazolidone
THEED N,N,N-Tris(hydroxyethyl)ethylenediamine
BHEI N,N-Bis(hydroxyethyl)imidazolidone
DEAC Diethanolamine carbamate
MEAC Monoethanolamine carbamate
DEADTCS Diethanolamine dithiocarbamate
AEEA Aminoethylethanolamine
DEA Diethanolamine
MDEA Methyldiethanolamine
NG Natural gas
HEIA 1-(2-Hydroxyethyl)-2-imidazolidinone
HEEDA Hydroxyethyletylenediamine
LPG Liquid petroleum gas
DGA Diglycolamine
BHEEU N, N-Bis(hydroxyethoxy-ethyl)urea
BHEETU N, N-Bis(hydroxyethoxy-ethyl)thiourea
HPMO Hydroxypropylmethyloxazolidone
TMPDA N,N,N′,N‟-Tetramethylpropylenediamine
TMBDA N,N,N′,N′-Tetramethylbutylenediamine
PMDETA N,N,N′,N′,N′′-Pentamethyldiethylenetriamine
PMDPTA N,N,N′,N′,N′′-Pentamethyldipropylenetriamine
TMEDA N,N,N′,N′-Tetramethylethylenediamine
NMR Nuclear magnetic resonance
GC-MS Gas chromatography mass spectrometer
GC Gas chromatography
HPLC High performance liquid chromatography
IC Ion chromatography
FT-IR Fourier transforms infrared resonance spectrometer
HPLC-UV High performance liquid chromatography-Ultraviolet detector
CE-DAD Capillary electrophoresis-Diode array detect

1
INTRODUCTION
CHAPTER 01
2
CHAPTER 01: INTRODUCTION
Acid gases, mainly H2S and CO2, are components in a variety of gas mixtures
including natural gas, synthesis gas, flue gas, and refinery streams. H2S needs to be
completely removed from gas streams due to its toxicity and corrosiveness in refinery
operations. Carbon dioxide removal from flue gas is a necessary means of combating global
warming. Carbon dioxide is also removed from natural gas because it acts as a diluent,
increasing transportation costs and reducing the heating value of the gas. Amine-based
absorption/stripping with aqueous alkanolamines offer a competitive approach for capturing
carbon dioxide (CO2) from coal-fired power plant flue gas (Lu, B-. H. et al., 2012). The
process of separating acid gases from source gases is referred to as acid gas treating.
Industrially the most important alkanolamines are MEA, DGA, DEA, DIPA and MDEA.
However, a major problem associated with chemical absorption using alkanolamines or
alkanolamines blends is degradation through irreversible side reactions with CO2 and O2
which leads to numerous problems with the process: solvent loss, foaming, fouling, increased
viscosity and corrosion. This chapter gives an overview of CO2 emission sources and the
problems associated with these emissions. Information on the traditional absorption/stripping
process is given including information on solvent degradation. Finally, the research
background, scope and objectives of this current project are discussed.
1.1 Global Warming and Carbon Dioxide Emissions
Global warming results from the effect of what is called the 'greenhouse effect'.
Carbon dioxide (CO2), methane, water vapor, nitrous oxide and ozone are the main
greenhouse gases. The main purpose of a greenhouse is to allow sun's radiation (heat) to enter
the enclosure easily, however, does not allow the heat to be radiated back to the atmosphere.
Similar to a greenhouse, our atmosphere allows the sun's radiation to heat the Earth and slows
down the radiated heat to go back into the space. This greenhouse effect is essential to sustain
life on Earth. Now, due to the increased level of greenhouse gases, the atmosphere's ability to
3
trap and hold the heat increases more than required. As a result, the average temperature of
the earth increases and this natural phenomenon is known as 'global warming'. It is also
defined as a sustained increase in the atmosphere that causes abnormal climate change
(Egmond, S. V. & Hekker, M. P., 2012). In the following description about global warming
and carbon dioxide, a brief explanation regarding effects of global warming and CO2
emission in the atmosphere, has been provided. Power plants are the major contributors to the
increased level of carbon dioxide emissions in the atmosphere (Mercader, F. D. M. et al.,
2012). The plants work for generating electricity by burning fossil fuels in a massive scale,
which produces large amounts of CO2. Coal is known to be responsible for about 93% of the
emissions in the power plants. Natural gas produces 80% less carbon per unit of energy than
coal, and hence so much of impact on the environment results in the ever-increasing pace of
global warming (Kaveh, N. S., Wolf, K- H., Ashrafizadeh, S. N., Rudolph, E. S. J., 2012).
Vehicles Gasoline-burning engines produce about 20% of carbon dioxide emitted in the
atmosphere. The present carbon dioxide emission rate in Malaysia day by day is increasing.
The recent information of CO2 emission in Malaysia is high, at present the country occupied
30th
biggest position in the world on the basis of CO2 emission. The latest information was
found the Malaysia is the 30 biggest countries in the world on the basis of CO2 emission. The
CO2 emission in 2010 in Malaysia is 123603 metric ton per capita. In 2007 the rate was
higher than 2010, the position was 25 over 213 countries in the world.
4
1.2 An Overview of CO2 capture and sequestration methods
There are two different types of scenarios for CO2 removal from flue gas that are
usually discussed, pre-combustion and post-combustion capture (Davison et al. 2001). Pre-
combustion capture refers to gasifying a fuel with O2 to form a syn-gas of CO and H2. The
CO can easily be converted to CO2 and removed from the H2 before the combustion process,
since the syn-gas is produced at high pressure. This type of process is most commonly
associated with a coal gasified power plant, or integrated gasification combined cycle (IGCC)
power plant. Post-combustion CO2 capture involves various methods of removing the CO2
from the flue gas at the end of the power plant cycle. This type of removal method is
generally associated with a retrofit of a pulverized fuel (coal) power plant with flue gas
desulphurization (PF+FGD) or a natural gas combined cycle (NGCC) power plant. A fourth
type of power plant is generally discussed, which is a modification of the PF+FGD design.
Instead of burning coal with air, this plant uses pure O2 with recycled CO2 to control the
temperature of the boilers (CO2/O2). While producing pure O2 is expensive, the CO2 recycle
gives a significant concentration increase in the flue gas, which can reduce the cost of post-
combustion CO2 capture.
Several methods of post-combustion CO2 capture are currently being developed. The
most common technologies are cryogenics, membranes, adsorption, and aqueous
absorption/stripping (Davison et al. 2001; IEA 1999; 2003). Cryogenic separation of CO2 is
generally only used for gas streams with high concentrations of CO2. Due to the cold
temperatures of the cryogenic solvents, the gas stream must be dehydrated, which is costly
when treating the large gas volumes associated with power plant flues gas. Additionally, the
cost of refrigeration is high in these processes and makes the economics of cryogenic CO2
capture unsuitable for a flue gas application. It is difficult to achieve a high purity CO2
product with membrane separation of flue gas without extensive process modifications like
recycles and multiple stage separations.
5
This would lead to increased costs associated with re-compression of the flue gas and
large capital investments, making membrane separation an unsuitable technology. Adsorbents
are solids, such as zeolites or activated carbon that selectively binds CO2 from the flue gas.
The adsorbent beds are regenerated by either applying heat to liberate the CO2, temperature
swing adsorption (TSA), or by reducing the pressure to allow the CO2 to desorb from the
solid, pressure swing adsorption (PSA). The heat duty associated with TSA is large and PSA
requires pulling a vacuum on the adsorbent bed or compressing the flues gas prior to the CO2
separation step. Additionally, current adsorbents are limited by low selectivity and poor CO2
capacity (Davison et al. 2001). The final method of post-combustion capture is aqueous
absorption/stripping. The amine based absorption and stripping system were described in the
following with solvent degradation.
1.3 Aqueous alkanolamine based absorption and stripping process
The process of separating acid gases from source gases is commonly referred to as
Gas treating, Acid Gas Removal, or Gas Sweetening. H2S and CO2 concentrations in gas
streams vary from several parts per million to 50% by volume. Clean-up specifications also
vary widely depending on the process and the nature of impurity. Aqueous absorption and
stripping is currently the only technology that is developed enough for commercial
application of CO2 capture from flue gas. In a typical gas sweetening unit, prior to entering
the amine absorber, the acid gas will normally pass through a separator to remove solids and
liquids from the gas. In some units wash water is circulated to increase the removal of solids
and entrained liquid from the gas to avoid potential foaming in the absorber. The separator is
usually equipped with baffles and a mist extractor (eliminator), which traps the liquid
entrained in the gas before it leaves the vessel. The sour gas is then fed to the absorber where
it is contacts with the lean amine solution.
6
Absorption followed by reaction between acid gas components will take place.
Reacted amines, normally known as “Rich Amine”, will be regenerated in amine regeneration
unit which is called regenerator or stripper. The absorber is normally a tray column with
bubble caps on each tray for good liquid-gas contact. Packing column or mix of packing and
tray are also used for this purpose. The sour gas enters the bottom of the absorber at a
temperature between 40-60 oC and rises upwards through the bubble caps while the lean
amine enters at the top of the contactor and flows downwards. In order to prevent
condensation of hydrocarbon, the lean amine temperature is kept at 10 oC warmer than the
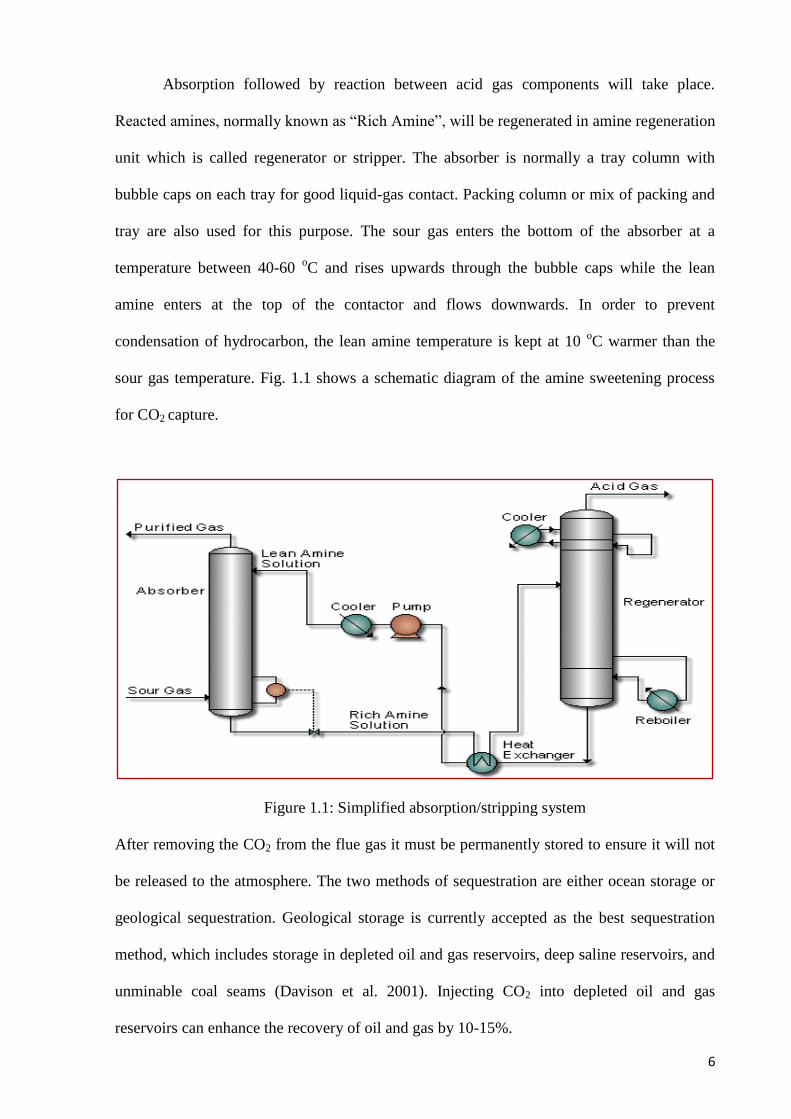
sour gas temperature. Fig. 1.1 shows a schematic diagram of the amine sweetening process
for CO2 capture.
Figure 1.1: Simplified absorption/stripping system
After removing the CO2 from the flue gas it must be permanently stored to ensure it will not
be released to the atmosphere. The two methods of sequestration are either ocean storage or
geological sequestration. Geological storage is currently accepted as the best sequestration
method, which includes storage in depleted oil and gas reservoirs, deep saline reservoirs, and
unminable coal seams (Davison et al. 2001). Injecting CO2 into depleted oil and gas
reservoirs can enhance the recovery of oil and gas by 10-15%.
7
This technique, enhanced oil recovery (EOR), is an established technique but not
widely in use today. Injection of CO2 into unminable coal seams also recovers methane that is
adsorbed on the coal. Deep saline aquifers are capped by a solid rock layer with low CO2
permeability that would ensure the CO2 stayed permanently sequestered. These aquifers are
deep underground and contain salt water making them unsuitable for drinking water supply,
and large volumes of reservoirs are available for CO2 sequestration. Both EOR and CO2
injection into unminable coal seams results in the additional recovery of valuable products
(oil and natural gas) which can help offset the cost of CO2 capture and sequestration, but the
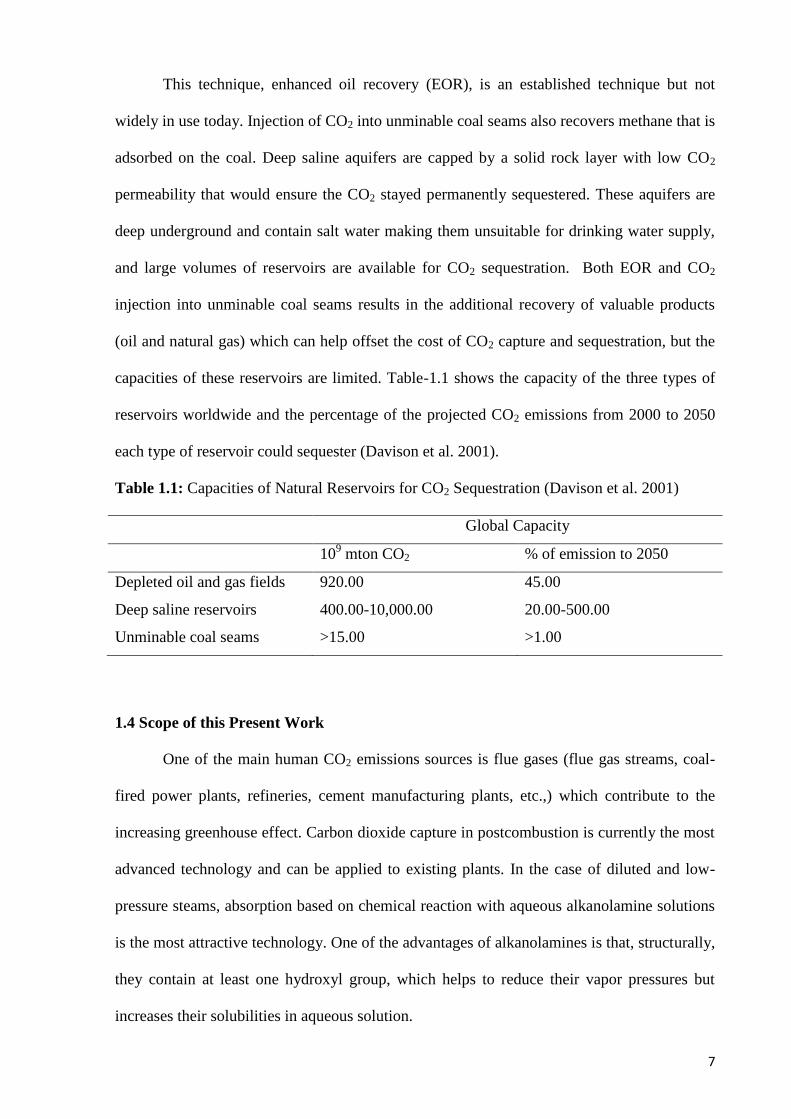
capacities of these reservoirs are limited. Table-1.1 shows the capacity of the three types of
reservoirs worldwide and the percentage of the projected CO2 emissions from 2000 to 2050
each type of reservoir could sequester (Davison et al. 2001).
Table 1.1: Capacities of Natural Reservoirs for CO2 Sequestration (Davison et al. 2001)
Global Capacity
109 mton CO2 % of emission to 2050
Depleted oil and gas fields 920.00 45.00
Deep saline reservoirs 400.00-10,000.00 20.00-500.00
Unminable coal seams >15.00 >1.00
1.4 Scope of this Present Work
One of the main human CO2 emissions sources is flue gases (flue gas streams, coal-
fired power plants, refineries, cement manufacturing plants, etc.,) which contribute to the
increasing greenhouse effect. Carbon dioxide capture in postcombustion is currently the most
advanced technology and can be applied to existing plants. In the case of diluted and low-
pressure steams, absorption based on chemical reaction with aqueous alkanolamine solutions
is the most attractive technology. One of the advantages of alkanolamines is that, structurally,
they contain at least one hydroxyl group, which helps to reduce their vapor pressures but
increases their solubilities in aqueous solution.
8
On the other hand, the amino group provides for the necessary alkalinity to absorb
CO2 (Kohl, 1997). The most common alkanolamines are used in this process are MEA, DEA,
MDEA, DIPA and AMP. Among all known solvents, ethanolamine (MEA) is the benchmark
molecule because of its properties toward CO2 capture (high absorption capacity, fast
kinetics, high water solubility, low price, etc.). But MEA is rapidly displaced by more
efficient systems. However, for low concentrations of H2S and CO2 it is preferred. This is
especially for low pressure and maximum removal of H2S and CO2. The advantages are the
high alkalinity and easy recovery from contaminated solutions. On the other hand an
irreversible product is formed with COS and CS2, it is more corrosive, high heat of reaction
with CO2 and also a high vapour pressure (Kohl A. L. R., 1979).
DEA is used for the treatment of refinery gases with COS and CS2. DEA is less
reactive with COS and CS2 than MEA and also a lower vapour pressure is needed. The
disadvantages of DEA treatment are that vacuum distillary is necessary and therefore
difficult. And when a high content of CO2 is present, DEA isn't a good choice because of the
forming corrosive degradation products (Kohl A. L. R., 1979).
MDEA is another alkanolamine which can be used for the removal of CO2. The
advantages given by Appl in 1980 are low energy requirement, high capacity and high
stability, the disadvantage the low rate of reaction with CO2. The rate of the reaction can be
increased by using promoters, without diminishing the MDEA advantages. MDEA is most
used and described by Kohl (Kohl A. L. R., 1979). However, a major disadvantages
associated with chemical absorption is solvent degradation which is defined as the
undesirable breakdown of amine to unwanted byproducts by reversible or irreversible side
reaction due to the presence of CO2 and O2. Byproducts lead to a significant decrease in
efficiency of the process (solvent losses, corrosion, foaming, fouling, and an increase in
viscosity).
9
This undesirable breakdown reduces their CO2 absorption capacity and introduces
unwanted degradation products, thus forcing the solutions to be eventually discarded. An
operational burden such as corrosion is also induced, as it has been periodically reported that
the degradation products can lead to severe corrosion (Blake, 1967; Rooney P C B, 1997).
So, development of new amines with higher chemical stability has become essential. More
and more attention has been paid to diamines recently; they seem to be good alternative
solvents because their second amine function has close properties to alcohols and increases
CO2 absorption capacity.
The rate of the reaction, high stability, high absorption and resistance to degradation
can be increased by using promoters, without diminishing the amine (MEA, DEA, MDEA)
advantages. To improve the CO2 removal processes different promoters are used. In 1980
piperazine (PZ) was found as an effective promotor for alkanolamine processes (Lensen,
2004). Recently, Piperazine (PZ) has been shown to be an effective promoter in MEA,
MDEA, and potassium carbonate due to its rapid formation of carbamates with CO2. PZ is
more effective than the conventional rate accelerators that have been used as activator in the
activated MDEA technology of BASF (Appl et al., 1982). Aqueous solutions of blended
monoethanolamine (MEA) and piperazine (PZ) have also demonstrated their promise as a
cost-effective solvent for carbon dioxide (CO2) capture from industrial flue gas streams due
to their absorption performance and energy efficiency (Dang H. R., 2003). This is also
mentioned that, concentrated, aqueous piperazine (PZ) has been investigated as a novel amine
solvent for carbon dioxide (CO2) absorption and the absorption rate with aqueous PZ is more
than double that of 7 m MEA and volatility at 40°C ranges from 10 to 19 ppm. Thermal
degradation is negligible in concentrated PZ solutions up to a temperature of 150°C, a
significant advantage over MEA systems (Freeman et al., 2009).
PZ-activated aqueous MDEA and AMP solutions combine the relatively high rate of
reaction of the former with CO2 with the lower heat of reaction of the later with CO2. From
10
these considerations, (MDEA-PZ) and (AMP-PZ) solutions appear to be attractive new
blended solvents for acid gas removal. While absorption of CO2 into MDEA and AMP has
been studied extensively in the past, only few publications have dealt with absorption of CO2
into the blends of PZ with MDEA or AMP (Bishnoi and Rochelle 2000, and 2002; Seo and
Hong 2000; Sun 2005; Xu et al 1992, 1995, and 1998; Zhang et al., 2001). Closmann et al in
2009 investigated that aqueous MDEA/PZ is an alternative to aqueous monoethanolamine
(MEA) and aqueous K+/PZ for CO2 capture from coal-fired flue gases. This is an attractive
solvent because it has greater capacity and lower equivalent work for CO2 removal than
MEA. MDEA/PZ has been successfully used for years in the natural gas industry for removal
of CO2 and hydrogen sulfide (H2S).
In the mid-ninteen eighties, in order to further improve absorption performance of
MDEA solvent, blended alkanolamine solvents have been developed by adding another
alkanolamine into MDEA. These blended solvents include MDEA–MEA, MDEA–DEA,
MDEA–DIPA, MDEA–DGA, and MDEA–AMP, etc.(Pacheco et al., 2000; Mandal et al.,
2001; Xia et al., 2003; Rinker, 1997). The blended solvents have the compatibility of
advantages of single solvent in blended solvents (Aroonwilas and Veawab, 2004). For
example, a blended solvent, which consists of a mixture of primary or secondary amine with
MDEA, combines the higher CO2 reaction rates of the primary or secondary amine with the
higher CO2 loading capacity of the MDEA. Thus, the blended solvent providing both higher
CO2 reaction rate and higher CO2 equilibrium capacity may result in substantial lower solvent
circulation rates compared to a single solvent. So the development of a new solvent for
maximum CO2 absorption can be considered as a great invention of sour gas sweetening
process. A large number amount of experimental work (Dawodu and A. Meisen, 1996;
Dawodu and Axel Meisen, 1994; Lawal and Idem, 2006; Davis, 2009; Sexton and Rochelle,
2010; Lawal et al., 2005a; Oh et al., 2003) has been done over the past few years to
characterize new solvents with respect to different properties (solubility, absorption, capacity,
11
amine volatility, etc.). Amines and alkanolamines are among several solvents that have been
investigated and current research is focus on designing a chemically stable, less corrosive
solvent with fast reaction rates and low heats of absorption to minimize energy requirements
for the regeneration of the solvent. Recently, most of the scientists have shown an increased
interest in the use of mixed amine solvents in gas‐treating processes. Blends comprising of
primary, secondary, or tertiary amines have been suggested for the industrial gas sweetening
processes (Abdi et al., 2005). Some new amine blends (TBEE, APM, DIPATBG, and TBE)
have been focused upon as having no sufficient reports on degradation.
Alkanolamines degradation with CO2 has been studied for a while: N
methyldiethanolamine (MDEA) and diethanolamine (DEA) are commonly used in natural gas
treatment and MEA is the benchmark solvent for post combustion application. Contrary to
the degradation with CO2, under actual plant operating condition was not studied very much:
only Chakma and Meisen established the relative stability of MDEA with temperature. Many
authors were interested in MEA degradation with CO2 and identified main byproducts such
as 2-oxazolidinone, N-(2-hydroxyethyl) imidazolidinone, and N-(2-hydroxyethyl)-
ethylenediamine (Polderman, 1955; Scheiman, 1962; Strazisar et al., 2003) . DEA
degradation was first studied by Kennard and Meisen (Kennard, 1980; Meisen, 1982;
Kennard and Meisen, 1983; Kennard and Allelsen, 1985) followed by Hsu (Hsu, 1985) and
Holub (Holub, 1998). Finally, MDEA degradation was also investigated and some reaction
mechanisms were suggested by Chakma and Meisen (Chakma, 1997; Chakma, 1988) and
Clark (Clark, 2004). These studies permitted to show similarities between MEA, DEA, and
MDEA degradation: in fact, the main products are amines, oxazolidinones, and
imidazolidinones. Specific information was found on the degradation of alkanolamines
blends rather than single amine‟s solution during sour gas absorption and stripping system
but in the sweetening process amine blends are still using widely.

12
Degradation of MDEA/PZ blends was conducted by several researchers but it is not
fully understand because so many degradation products were unidentified and unknown. On
the contrary, DEA/PZ solvent blend have not yet been described in the literature, and to the
best of our knowledge, this work is the first degradation study will be conducted in this
project work. In order to have a better understanding of degradation phenomenon which has
not yet been studied will approach was based on a stability comparison between activated and
inactivated amine solvent in the presence of CO2.
In this work, carbon dioxide induced degradation of activated DEA and MDEA will
be studied. The liquid phase reaction samples will be characterized by using GC-MS, IC and
HPLC (UV) in this investigation. The objectives to be achieved are ststed below.
1.5 Objectives of this Research
◙ To identify CO2 induced degradation products of conventional DEA, MDEA and PZ.
◙ To identify CO2 induced degradation products of activated DEA and MDEA (DEA/PZ and
MDEA/PZ).
◙ To investigate the effect of amine concentration on the degradation process.
◙ A comparative study of degradation stsbility of two activated amine systems DEA/PZ and
MDEA/PZ.

13
LITERATURE REVIEW
CHAPTER 02
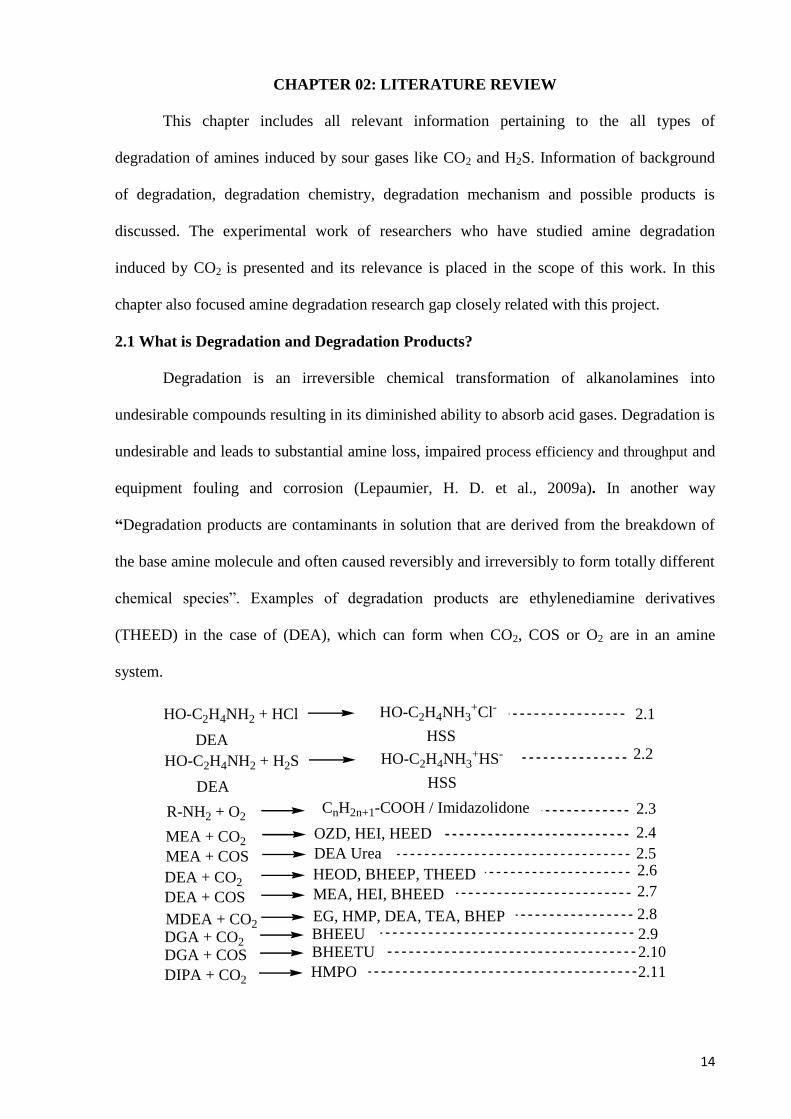
14
CHAPTER 02: LITERATURE REVIEW
This chapter includes all relevant information pertaining to the all types of
degradation of amines induced by sour gases like CO2 and H2S. Information of background
of degradation, degradation chemistry, degradation mechanism and possible products is
discussed. The experimental work of researchers who have studied amine degradation
induced by CO2 is presented and its relevance is placed in the scope of this work. In this
chapter also focused amine degradation research gap closely related with this project.
2.1 What is Degradation and Degradation Products?
Degradation is an irreversible chemical transformation of alkanolamines into
undesirable compounds resulting in its diminished ability to absorb acid gases. Degradation is
undesirable and leads to substantial amine loss, impaired process efficiency and throughput and
equipment fouling and corrosion (Lepaumier, H. D. et al., 2009a). In another way
“Degradation products are contaminants in solution that are derived from the breakdown of
the base amine molecule and often caused reversibly and irreversibly to form totally different
chemical species”. Examples of degradation products are ethylenediamine derivatives
(THEED) in the case of (DEA), which can form when CO2, COS or O2 are in an amine
system.
HO-C2H4NH2 + HCl HO-C2H4NH3+Cl-
HSSDEA
HO-C2H4NH2 + H2S HO-C2H4NH3+HS-
HSSDEA
R-NH2 + O2CnH2n+1-COOH / Imidazolidone
MEA + CO2OZD, HEI, HEED
MEA + COS DEA Urea
DEA + CO2HEOD, BHEEP, THEED
DEA + COS MEA, HEI, BHEED
MDEA + CO2EG, HMP, DEA, TEA, BHEP
DGA + CO2BHEEU
DGA + COS BHEETU
DIPA + CO2HMPO
2.1
2.2
2.3
2.4
2.52.6
2.7
2.8
2.92.10
2.11
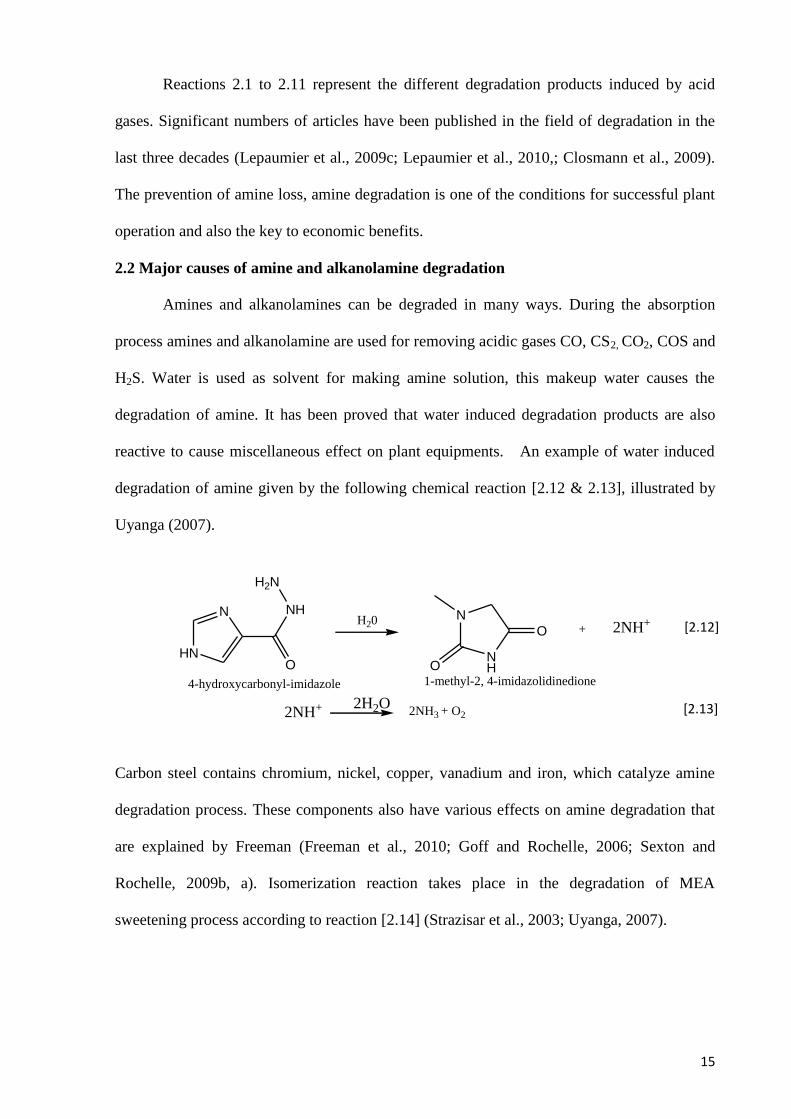
15
Reactions 2.1 to 2.11 represent the different degradation products induced by acid
gases. Significant numbers of articles have been published in the field of degradation in the
last three decades (Lepaumier et al., 2009c; Lepaumier et al., 2010,; Closmann et al., 2009).
The prevention of amine loss, amine degradation is one of the conditions for successful plant
operation and also the key to economic benefits.
2.2 Major causes of amine and alkanolamine degradation
Amines and alkanolamines can be degraded in many ways. During the absorption
process amines and alkanolamine are used for removing acidic gases CO, CS2, CO2, COS and
H2S. Water is used as solvent for making amine solution, this makeup water causes the
degradation of amine. It has been proved that water induced degradation products are also
reactive to cause miscellaneous effect on plant equipments. An example of water induced
degradation of amine given by the following chemical reaction [2.12 & 2.13], illustrated by
Uyanga (2007).
HN
N
O
NH
H2N
4-hydroxycarbonyl-imidazole
N
NHO
O + 2NH+
1-methyl-2, 4-imidazolidinedione
2NH+
H20
2H2O2NH3 + O2
Carbon steel contains chromium, nickel, copper, vanadium and iron, which catalyze amine
degradation process. These components also have various effects on amine degradation that
are explained by Freeman (Freeman et al., 2010; Goff and Rochelle, 2006; Sexton and
Rochelle, 2009b, a). Isomerization reaction takes place in the degradation of MEA
sweetening process according to reaction [2.14] (Strazisar et al., 2003; Uyanga, 2007).
[2.12]
[2.13]
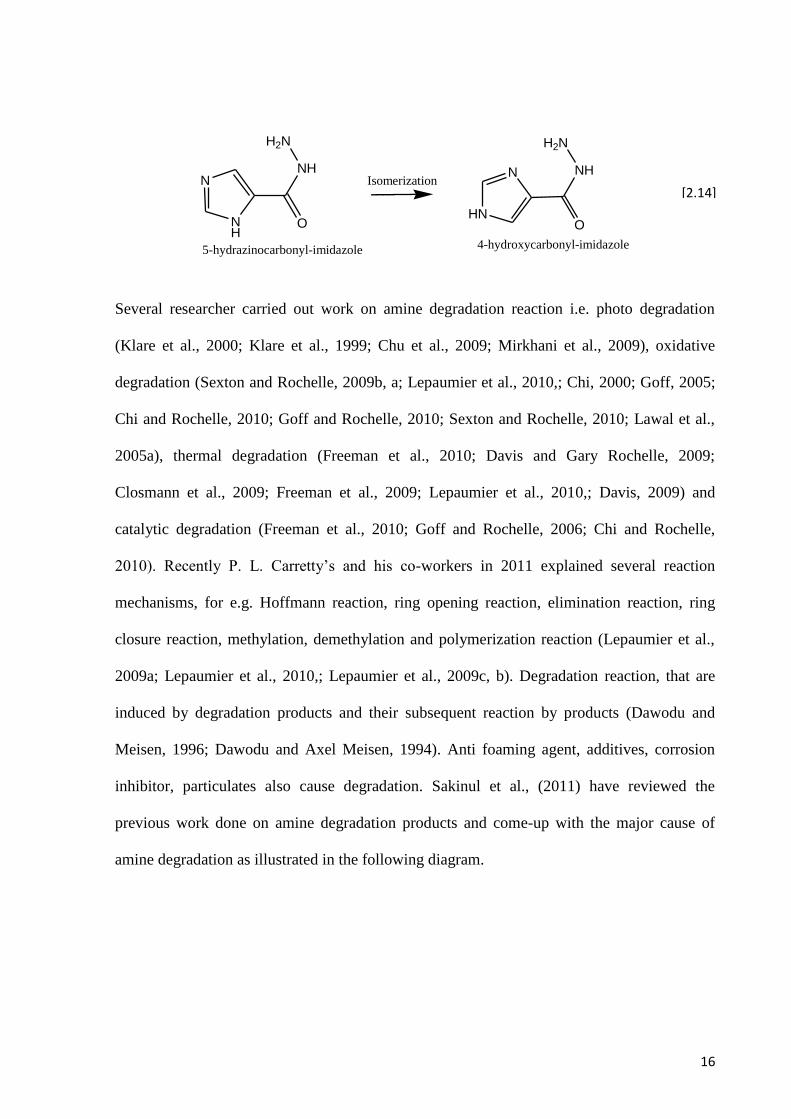
16
N
NH
O
NH
H2N
5-hydrazinocarbonyl-imidazole
HN
N
O
NH
H2N
Isomerization
4-hydroxycarbonyl-imidazole
Several researcher carried out work on amine degradation reaction i.e. photo degradation
(Klare et al., 2000; Klare et al., 1999; Chu et al., 2009; Mirkhani et al., 2009), oxidative
degradation (Sexton and Rochelle, 2009b, a; Lepaumier et al., 2010,; Chi, 2000; Goff, 2005;
Chi and Rochelle, 2010; Goff and Rochelle, 2010; Sexton and Rochelle, 2010; Lawal et al.,
2005a), thermal degradation (Freeman et al., 2010; Davis and Gary Rochelle, 2009;
Closmann et al., 2009; Freeman et al., 2009; Lepaumier et al., 2010,; Davis, 2009) and
catalytic degradation (Freeman et al., 2010; Goff and Rochelle, 2006; Chi and Rochelle,
2010). Recently P. L. Carretty‟s and his co-workers in 2011 explained several reaction
mechanisms, for e.g. Hoffmann reaction, ring opening reaction, elimination reaction, ring
closure reaction, methylation, demethylation and polymerization reaction (Lepaumier et al.,
2009a; Lepaumier et al., 2010,; Lepaumier et al., 2009c, b). Degradation reaction, that are
induced by degradation products and their subsequent reaction by products (Dawodu and
Meisen, 1996; Dawodu and Axel Meisen, 1994). Anti foaming agent, additives, corrosion
inhibitor, particulates also cause degradation. Sakinul et al., (2011) have reviewed the
previous work done on amine degradation products and come-up with the major cause of
amine degradation as illustrated in the following diagram.
[2.14]
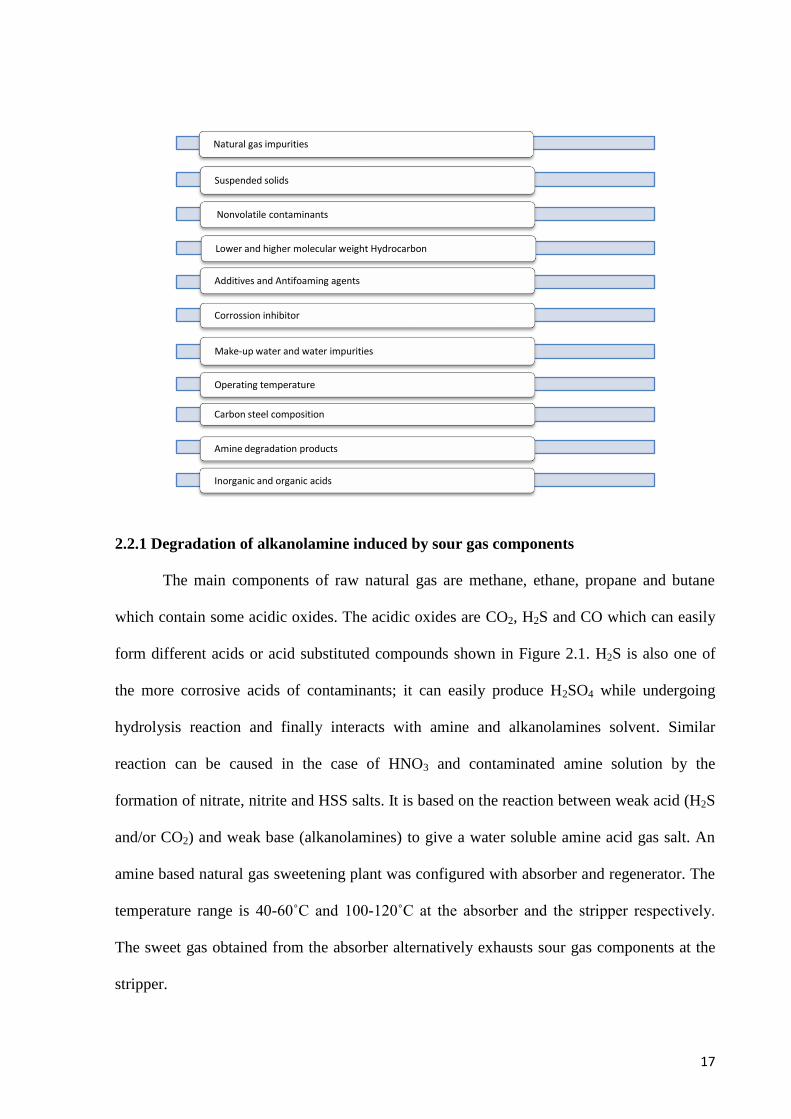
17
2.2.1 Degradation of alkanolamine induced by sour gas components
The main components of raw natural gas are methane, ethane, propane and butane
which contain some acidic oxides. The acidic oxides are CO2, H2S and CO which can easily
form different acids or acid substituted compounds shown in Figure 2.1. H2S is also one of
the more corrosive acids of contaminants; it can easily produce H2SO4 while undergoing
hydrolysis reaction and finally interacts with amine and alkanolamines solvent. Similar
reaction can be caused in the case of HNO3 and contaminated amine solution by the
formation of nitrate, nitrite and HSS salts. It is based on the reaction between weak acid (H2S
and/or CO2) and weak base (alkanolamines) to give a water soluble amine acid gas salt. An
amine based natural gas sweetening plant was configured with absorber and regenerator. The
temperature range is 40-60˚C and 100-120˚C at the absorber and the stripper respectively.
The sweet gas obtained from the absorber alternatively exhausts sour gas components at the
stripper.
Natural gas impurities
Suspended solids
Nonvolatile contaminants
Lower and higher molecular weight Hydrocarbon
Additives and Antifoaming agents
Corrossion inhibitor
Make-up water and water impurities
Operating temperature
Carbon steel composition
Amine degradation products
Inorganic and organic acids
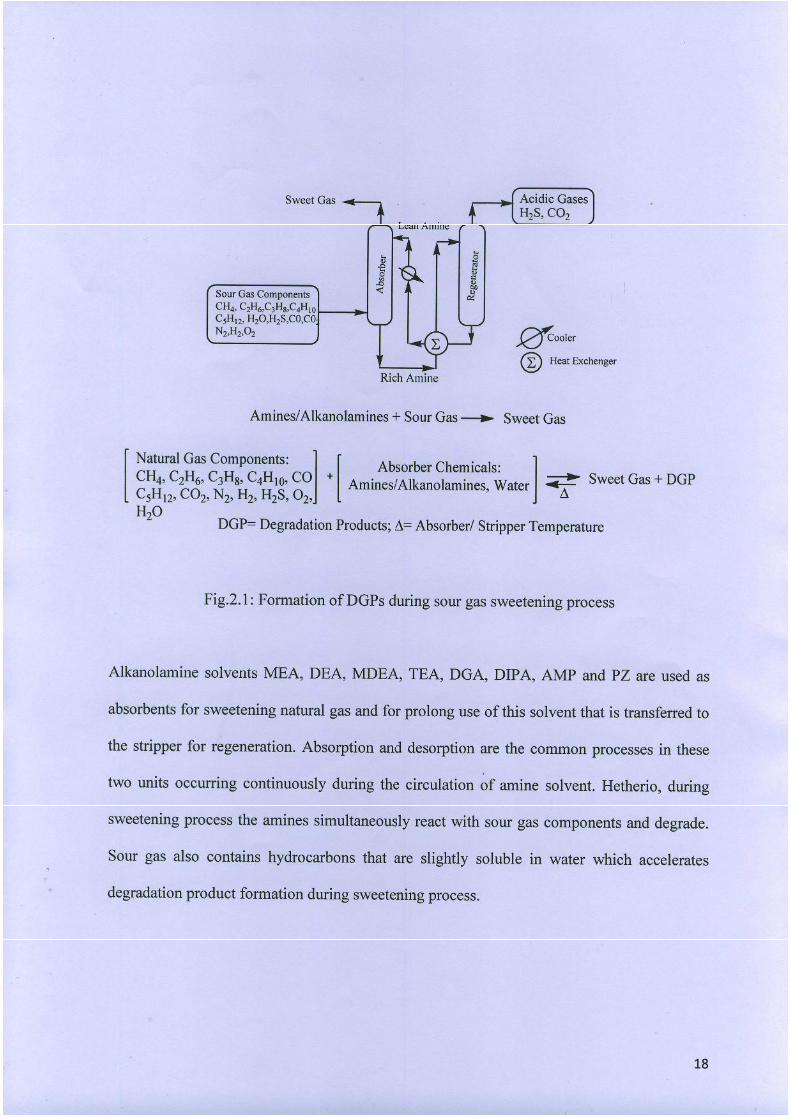
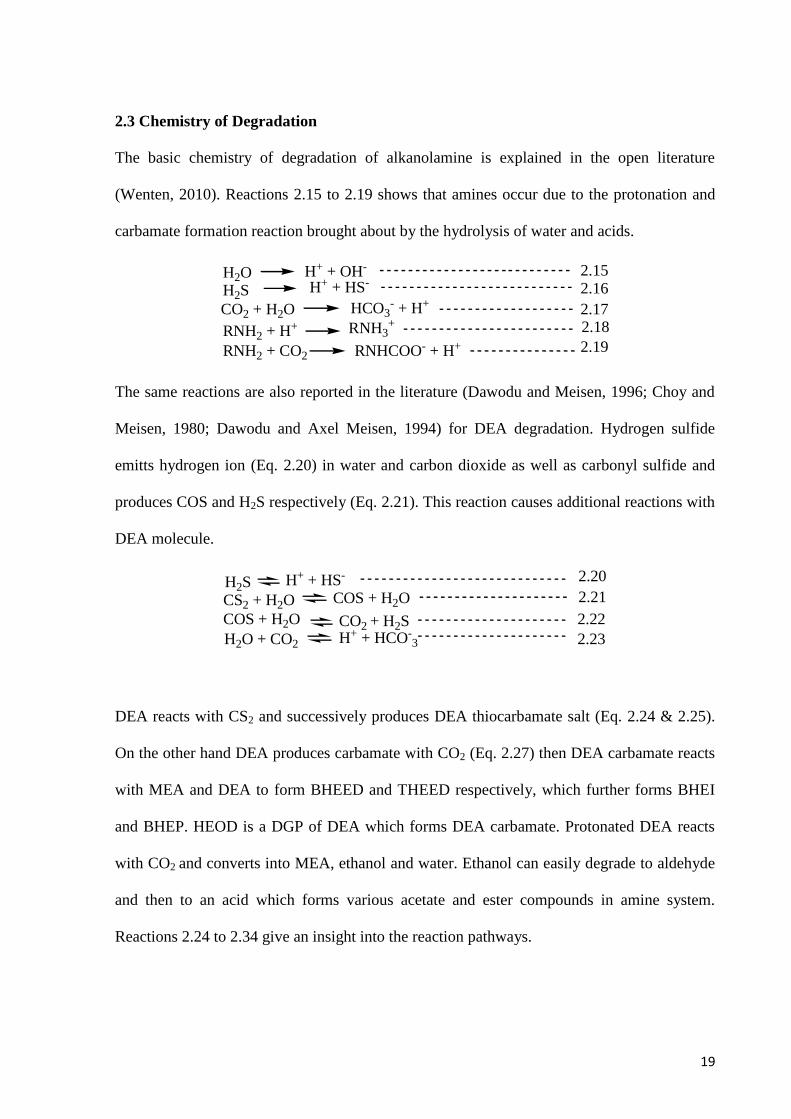
19
2.3 Chemistry of Degradation
The basic chemistry of degradation of alkanolamine is explained in the open literature
(Wenten, 2010). Reactions 2.15 to 2.19 shows that amines occur due to the protonation and
carbamate formation reaction brought about by the hydrolysis of water and acids.
H2O H+ + OH-
H2S H+ + HS-
CO2 + H2O HCO3- + H+
RNH2 + H+ RNH3+
RNH2 + CO2 RNHCOO- + H+
2.152.16
2.172.18
2.19
The same reactions are also reported in the literature (Dawodu and Meisen, 1996; Choy and
Meisen, 1980; Dawodu and Axel Meisen, 1994) for DEA degradation. Hydrogen sulfide
emitts hydrogen ion (Eq. 2.20) in water and carbon dioxide as well as carbonyl sulfide and
produces COS and H2S respectively (Eq. 2.21). This reaction causes additional reactions with
DEA molecule.
CS2 + H2O COS + H2O
COS + H2O CO2 + H2SH2O + CO2 H+ + HCO-
3
H2S H+ + HS- 2.20
2.21
2.22
2.23
DEA reacts with CS2 and successively produces DEA thiocarbamate salt (Eq. 2.24 & 2.25).
On the other hand DEA produces carbamate with CO2 (Eq. 2.27) then DEA carbamate reacts
with MEA and DEA to form BHEED and THEED respectively, which further forms BHEI
and BHEP. HEOD is a DGP of DEA which forms DEA carbamate. Protonated DEA reacts
with CO2 and converts into MEA, ethanol and water. Ethanol can easily degrade to aldehyde
and then to an acid which forms various acetate and ester compounds in amine system.
Reactions 2.24 to 2.34 give an insight into the reaction pathways.
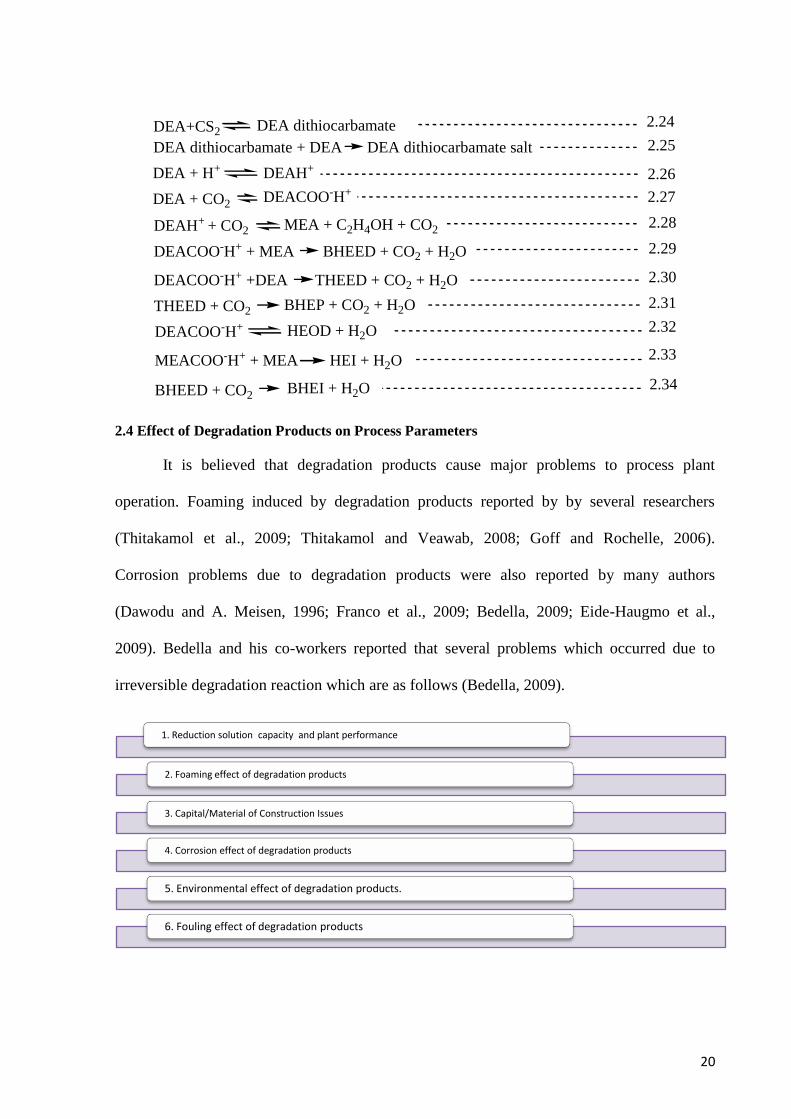
20
DEA+CS2 DEA dithiocarbamate
DEA dithiocarbamate + DEA DEA dithiocarbamate salt
DEA + H+ DEAH+
DEA + CO2DEACOO-H+
DEAH+ + CO2 MEA + C2H4OH + CO2
DEACOO-H+ + MEA BHEED + CO2 + H2O
DEACOO-H+ +DEA THEED + CO2 + H2O
DEACOO-H+ HEOD + H2O
MEACOO-H+ + MEA HEI + H2O
BHEED + CO2BHEI + H2O
THEED + CO2 BHEP + CO2 + H2O
2.24
2.25
2.26
2.27
2.28
2.29
2.30
2.31
2.32
2.33
2.34
2.4 Effect of Degradation Products on Process Parameters
It is believed that degradation products cause major problems to process plant
operation. Foaming induced by degradation products reported by by several researchers
(Thitakamol et al., 2009; Thitakamol and Veawab, 2008; Goff and Rochelle, 2006).
Corrosion problems due to degradation products were also reported by many authors
(Dawodu and A. Meisen, 1996; Franco et al., 2009; Bedella, 2009; Eide-Haugmo et al.,
2009). Bedella and his co-workers reported that several problems which occurred due to
irreversible degradation reaction which are as follows (Bedella, 2009).
1. Reduction solution capacity and plant performance
2. Foaming effect of degradation products
3. Capital/Material of Construction Issues
4. Corrosion effect of degradation products
5. Environmental effect of degradation products.
6. Fouling effect of degradation products
21
2.5 Overview of the Historical Background of Degradation Study
Degradation study of alkanolamines (MEA, DEA and MDEA) was carried out by
several authors in particularly MEA stuied by (Strazisar et al., 2003; Lepaumier et al., 2009a;
Chi and Rochelle, 2002; Goff and Rochelle, 2004; Goff and Rochelle, 2006; Davis and Gary
Rochelle, 2009; Klare et al., 2000; Franco et al., 2009; Shahi et al., 1994; Choy and Meisen,
1980; Dawodu and Meisen, 1991; Supap et al., 2006; Lepaumier et al., 2009c; Sexton and
Rochelle, 2009a, b; Ayanduntan et al., 2006; Davis, 2009; Goff and Rochelle, 2010; Strazisar
et al., 2010), MDEA (Lepaumier et al., 2009a; Blauwhoff et al., 1984; Closmann et al., 2009;
Klare et al., 2000; Shahi et al., 1994; Lepaumier et al., 2009c) and DEA (Lepaumier et al.,
2009a; Blauwhoff et al., 1984; Klare et al., 2000; Dawodu and Meisen, 1996; Shahi et al.,
1994; Choy and Meisen, 1980; Dawodu and Meisen, 1991, 1992; Kennard M. and Axel
Meisen, 1983; Lepaumier et al., 2009c, b) in the presence of H2S, COS, CO2 and/or O2 were
published in the last three decades. Dawodu and Meisen (1991) studied the thermal
degradation of COS loaded DEA using GC and GC/MS techniques and they identified up to
twenty degradation products. It was also found that the resistance to oxidative degradation
follows the order: MDEA/PZ> MDEA>PZ and DGP were found in HSS, glycolate and
formate (Closmann et al., 2009). Recently it was noted that PZ solutions were 3–5 times more
resistant to oxidation than MEA (Stephanie et al., 2010; Freeman et al., 2010). The
degradation of polyamines (TMPDA, TMBDA, PMDETA, PMDPTA, TMEDA) studied by
(Lepaumier et al., 2010,) the author identified four main DGPs for each polyamine. The
author also illustrated that tertiary amines were more stable primary and secondary amines.
However, it is not always true; four tertiary polyamines DMP, TMEDA, TMPDA, and
PMDPTA were shown to be more stable than MEA while two tertiary polyamines (TMBDA
and PMDETA) were much less stable than MEA. Freeman investigated thermal
degradation of PZ and showed that it is negligible in concentrated PZ solutions and up to a
temperature of 150°C and had a significant advantage over MEA systems (Freeman et al.,
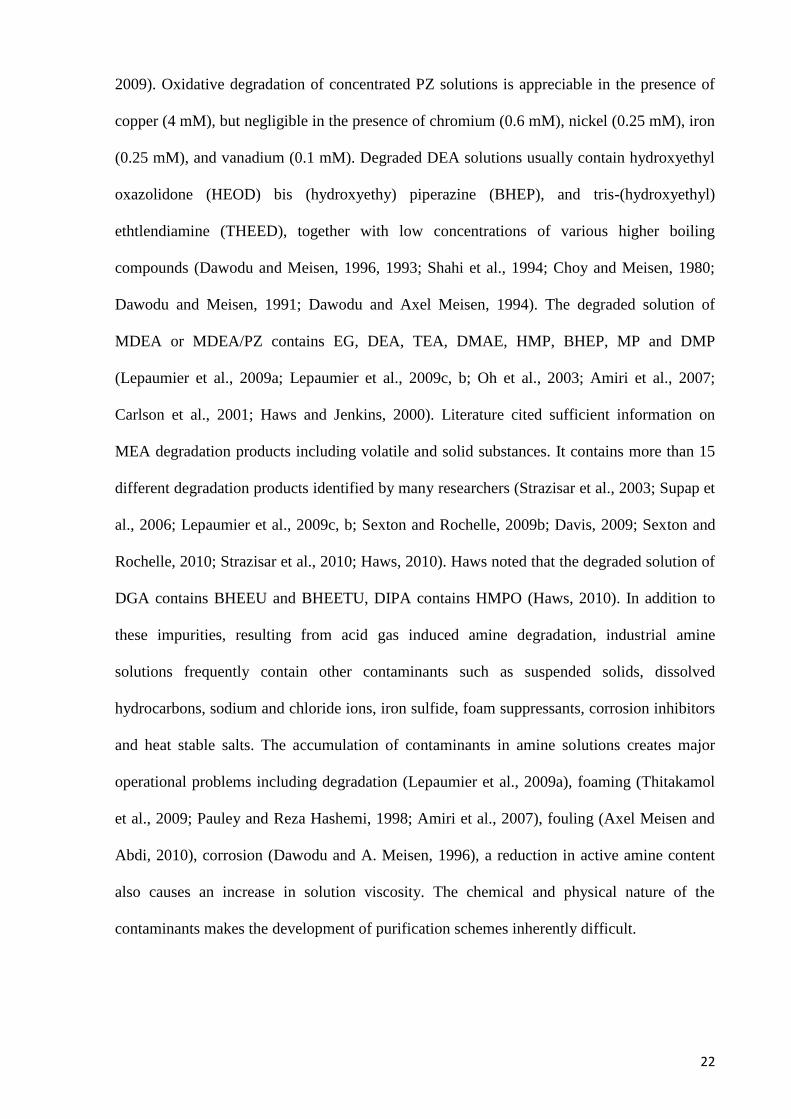
22
2009). Oxidative degradation of concentrated PZ solutions is appreciable in the presence of
copper (4 mM), but negligible in the presence of chromium (0.6 mM), nickel (0.25 mM), iron
(0.25 mM), and vanadium (0.1 mM). Degraded DEA solutions usually contain hydroxyethyl
oxazolidone (HEOD) bis (hydroxyethy) piperazine (BHEP), and tris-(hydroxyethyl)
ethtlendiamine (THEED), together with low concentrations of various higher boiling
compounds (Dawodu and Meisen, 1996, 1993; Shahi et al., 1994; Choy and Meisen, 1980;
Dawodu and Meisen, 1991; Dawodu and Axel Meisen, 1994). The degraded solution of
MDEA or MDEA/PZ contains EG, DEA, TEA, DMAE, HMP, BHEP, MP and DMP
(Lepaumier et al., 2009a; Lepaumier et al., 2009c, b; Oh et al., 2003; Amiri et al., 2007;
Carlson et al., 2001; Haws and Jenkins, 2000). Literature cited sufficient information on
MEA degradation products including volatile and solid substances. It contains more than 15
different degradation products identified by many researchers (Strazisar et al., 2003; Supap et
al., 2006; Lepaumier et al., 2009c, b; Sexton and Rochelle, 2009b; Davis, 2009; Sexton and
Rochelle, 2010; Strazisar et al., 2010; Haws, 2010). Haws noted that the degraded solution of
DGA contains BHEEU and BHEETU, DIPA contains HMPO (Haws, 2010). In addition to
these impurities, resulting from acid gas induced amine degradation, industrial amine
solutions frequently contain other contaminants such as suspended solids, dissolved
hydrocarbons, sodium and chloride ions, iron sulfide, foam suppressants, corrosion inhibitors
and heat stable salts. The accumulation of contaminants in amine solutions creates major
operational problems including degradation (Lepaumier et al., 2009a), foaming (Thitakamol
et al., 2009; Pauley and Reza Hashemi, 1998; Amiri et al., 2007), fouling (Axel Meisen and
Abdi, 2010), corrosion (Dawodu and A. Meisen, 1996), a reduction in active amine content
also causes an increase in solution viscosity. The chemical and physical nature of the
contaminants makes the development of purification schemes inherently difficult.
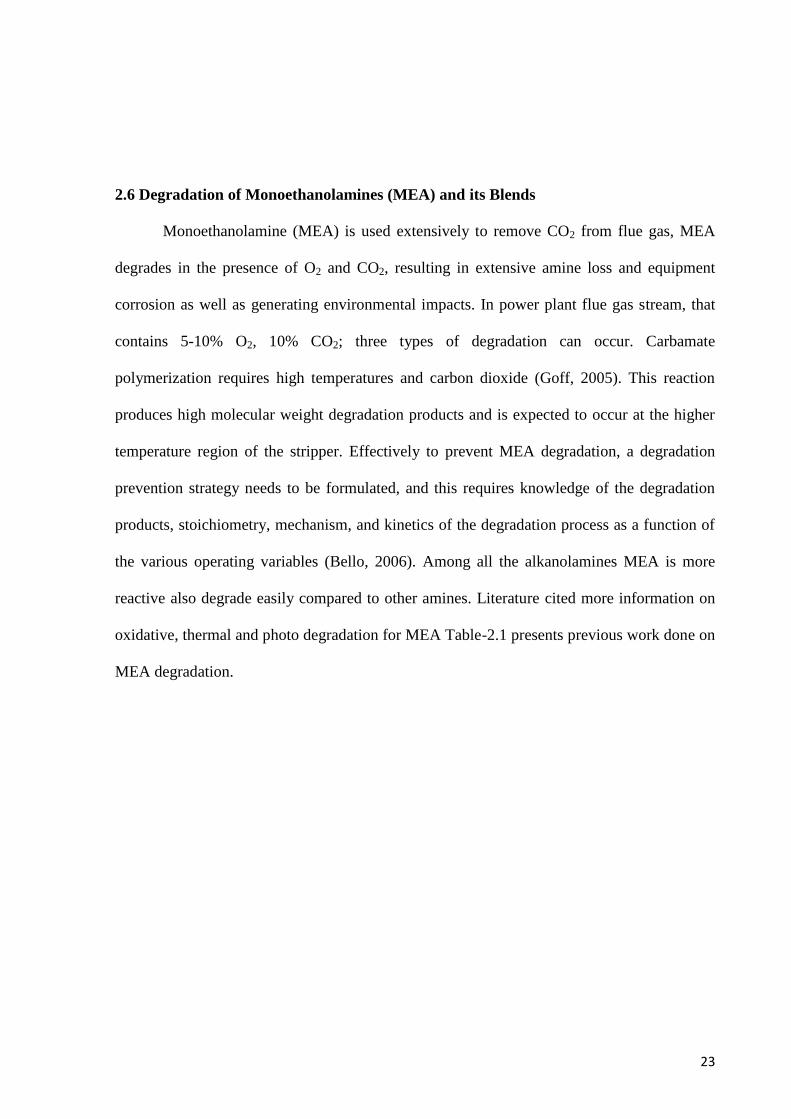
23
2.6 Degradation of Monoethanolamines (MEA) and its Blends
Monoethanolamine (MEA) is used extensively to remove CO2 from flue gas, MEA
degrades in the presence of O2 and CO2, resulting in extensive amine loss and equipment
corrosion as well as generating environmental impacts. In power plant flue gas stream, that
contains 5-10% O2, 10% CO2; three types of degradation can occur. Carbamate
polymerization requires high temperatures and carbon dioxide (Goff, 2005). This reaction
produces high molecular weight degradation products and is expected to occur at the higher
temperature region of the stripper. Effectively to prevent MEA degradation, a degradation
prevention strategy needs to be formulated, and this requires knowledge of the degradation
products, stoichiometry, mechanism, and kinetics of the degradation process as a function of
the various operating variables (Bello, 2006). Among all the alkanolamines MEA is more
reactive also degrade easily compared to other amines. Literature cited more information on
oxidative, thermal and photo degradation for MEA Table-2.1 presents previous work done on
MEA degradation.

24
Table 2.1: Degradation report of monoethanolamine (MEA) [O=Oxidative, T=Thermal, D=Degradation, P=Photo]
ID No. Author and Year Major Study Amine Solvent Reaction Gases
[1] (Strazisar et al., 2003) O.D MEA CO2
[3] (Lepaumier et al., 2009a) O.D MEA with 17 different amines CO2, O2
[4] (Chi and Rochelle, 2002) O.D MEA CO2, O2
[5] (Bello, 2006) Kinetics of O.D MEA CO2, O2
[6] (Goff and Rochelle, 2004) O.D MEA CO2, O2
[7] (Goff and Rochelle, 2006) O.D MEA CO2
[8] (Thitakamol et al., 2009) Foaming nature MEA CO2
[9] P.M.M.Blauwhoff Reaction of amines MEA,DEA,MDEA,TEA,DIPA and so on CO2
[11] G.T. Rochelle et. al T.D MEA CO2
[13] (Klare et al., 2000) P.D MEA, DEA, MDEA and so on TiO2, TiO2/Pt
[15] (Franco et al., 2009) O.D MEA CO2
[23] (Shahi et al., 1994) Advantages of GC over various
metd.
MEA; MEA+MDEA; DEA; AMP; MDEA CO2, H2S
[27] (Supap et al., 2006) O.D MEA CO2, O2
[30] (Lepaumier et al., 2009c) O.D MEA with 12 amines CO2
[31] (Lepaumier et al., 2009b) D MEA with 12 amines CO2
[33] (Sexton and Rochelle, 2009b) O.D MEA CO2, O2
[34] (Sexton and Rochelle, 2009a) O.D MEA CO2, O2
[38] (Lawal and Idem, 2006) Kinetics of O.D MEA+MDEA CO2, O2
[39] (Davis, 2009) T.D MEA CO2
[46] (Chi and Rochelle, 2010) O.D MEA CO2
[47] (Goff and Rochelle, 2004) O.D MEA CO2, O2
[48] (Sexton and Rochelle, 2010) O.D MEA+PZ CO2, O2
[49] (Lawal et al., 2005a) Reaction Mechanism of D MEA; MEA+MDEA CO2, O2
[51] (Strazisar et al., 2010) D MEA CO2
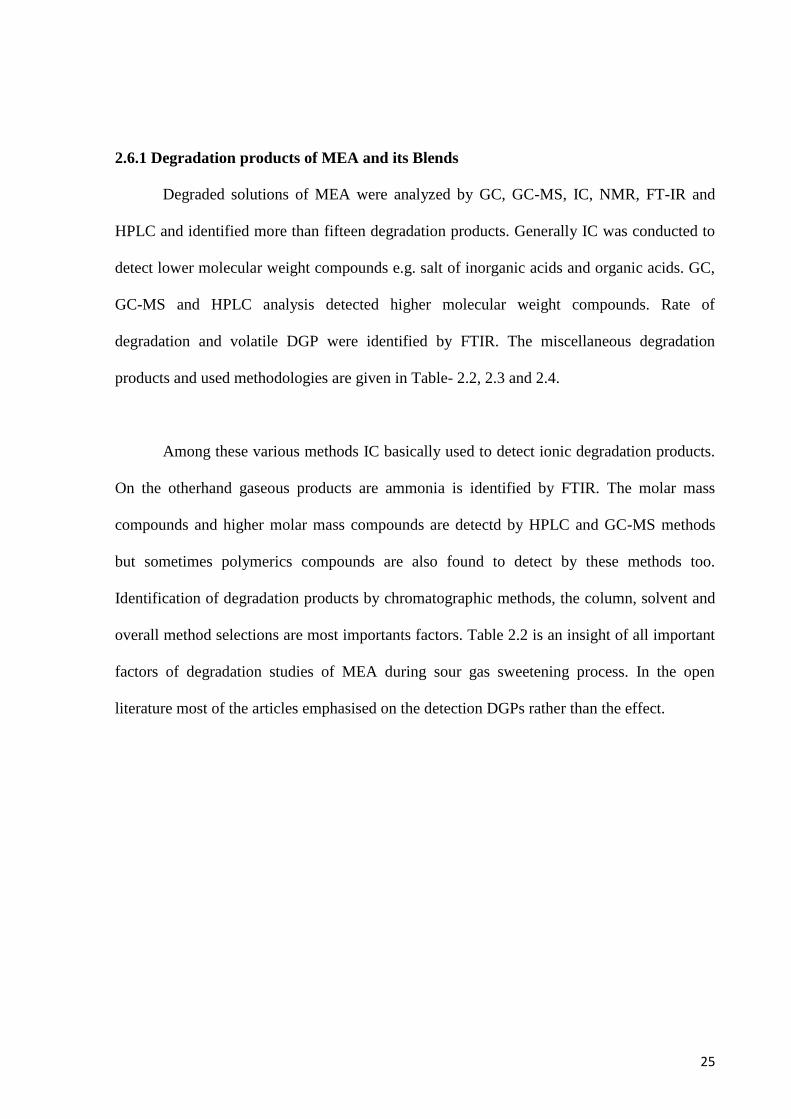
25
2.6.1 Degradation products of MEA and its Blends
Degraded solutions of MEA were analyzed by GC, GC-MS, IC, NMR, FT-IR and
HPLC and identified more than fifteen degradation products. Generally IC was conducted to
detect lower molecular weight compounds e.g. salt of inorganic acids and organic acids. GC,
GC-MS and HPLC analysis detected higher molecular weight compounds. Rate of
degradation and volatile DGP were identified by FTIR. The miscellaneous degradation
products and used methodologies are given in Table- 2.2, 2.3 and 2.4.
Among these various methods IC basically used to detect ionic degradation products.
On the otherhand gaseous products are ammonia is identified by FTIR. The molar mass
compounds and higher molar mass compounds are detectd by HPLC and GC-MS methods
but sometimes polymerics compounds are also found to detect by these methods too.
Identification of degradation products by chromatographic methods, the column, solvent and
overall method selections are most importants factors. Table 2.2 is an insight of all important
factors of degradation studies of MEA during sour gas sweetening process. In the open
literature most of the articles emphasised on the detection DGPs rather than the effect.
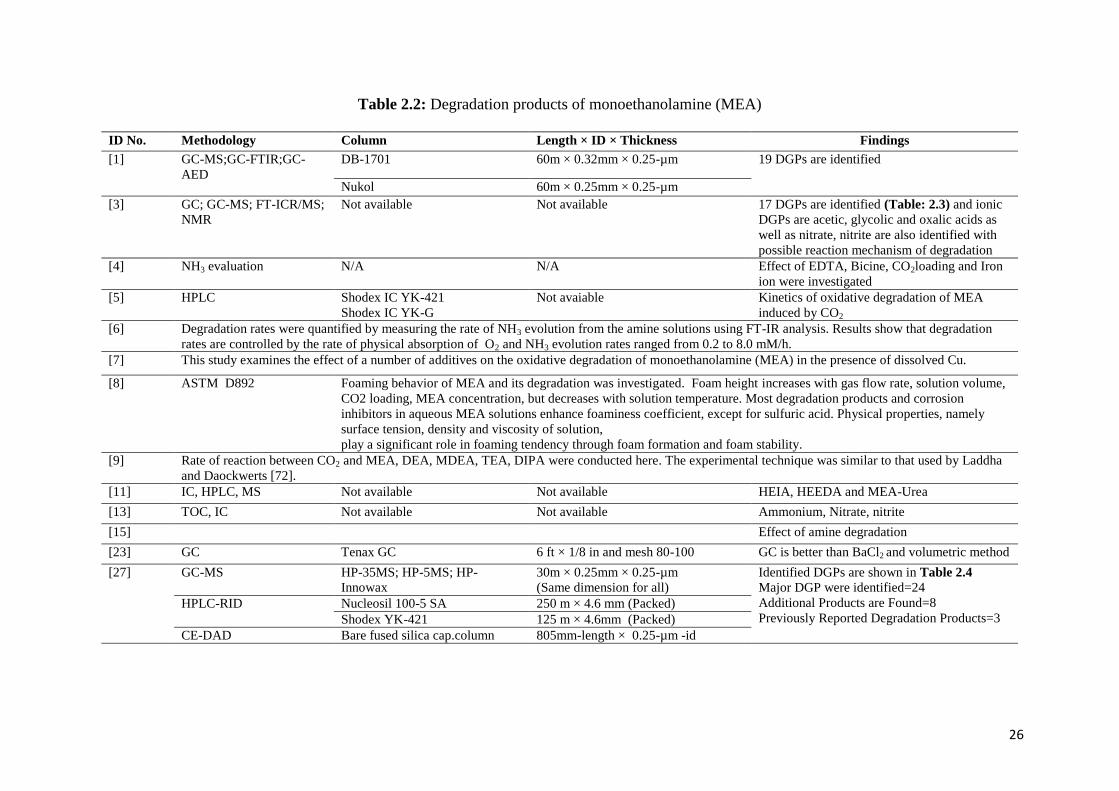
26
Table 2.2: Degradation products of monoethanolamine (MEA)
ID No. Methodology Column Length × ID × Thickness Findings
[1] GC-MS;GC-FTIR;GC-
AED
DB-1701 60m × 0.32mm × 0.25-µm 19 DGPs are identified
Nukol 60m × 0.25mm × 0.25-µm
[3] GC; GC-MS; FT-ICR/MS;
NMR
Not available Not available 17 DGPs are identified (Table: 2.3) and ionic
DGPs are acetic, glycolic and oxalic acids as
well as nitrate, nitrite are also identified with
possible reaction mechanism of degradation
[4] NH3 evaluation N/A N/A Effect of EDTA, Bicine, CO2loading and Iron
ion were investigated
[5] HPLC Shodex IC YK-421
Shodex IC YK-G
Not avaiable Kinetics of oxidative degradation of MEA
induced by CO2
[6] Degradation rates were quantified by measuring the rate of NH3 evolution from the amine solutions using FT-IR analysis. Results show that degradation
rates are controlled by the rate of physical absorption of O2 and NH3 evolution rates ranged from 0.2 to 8.0 mM/h.
[7] This study examines the effect of a number of additives on the oxidative degradation of monoethanolamine (MEA) in the presence of dissolved Cu.
[8] ASTM D892 Foaming behavior of MEA and its degradation was investigated. Foam height increases with gas flow rate, solution volume,
CO2 loading, MEA concentration, but decreases with solution temperature. Most degradation products and corrosion
inhibitors in aqueous MEA solutions enhance foaminess coefficient, except for sulfuric acid. Physical properties, namely
surface tension, density and viscosity of solution,
play a significant role in foaming tendency through foam formation and foam stability.
[9] Rate of reaction between CO2 and MEA, DEA, MDEA, TEA, DIPA were conducted here. The experimental technique was similar to that used by Laddha
and Daockwerts [72].
[11] IC, HPLC, MS Not available Not available HEIA, HEEDA and MEA-Urea
[13] TOC, IC Not available Not available Ammonium, Nitrate, nitrite
[15] Effect of amine degradation
[23] GC Tenax GC 6 ft × 1/8 in and mesh 80-100 GC is better than BaCl2 and volumetric method
[27] GC-MS HP-35MS; HP-5MS; HP-
Innowax
30m × 0.25mm × 0.25-µm
(Same dimension for all)
Identified DGPs are shown in Table 2.4
Major DGP were identified=24
Additional Products are Found=8
Previously Reported Degradation Products=3 HPLC-RID Nucleosil 100-5 SA 250 m × 4.6 mm (Packed)
Shodex YK-421 125 m × 4.6mm (Packed)
CE-DAD Bare fused silica cap.column 805mm-length × 0.25-µm -id
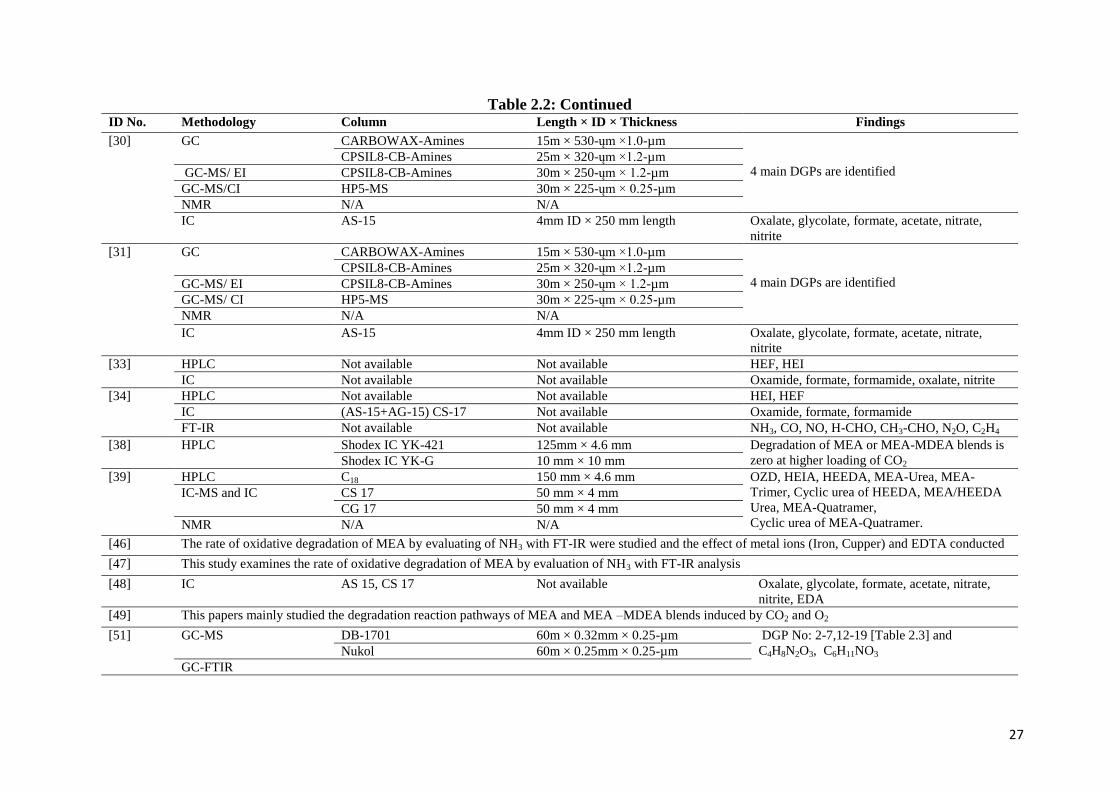
27
Table 2.2: Continued ID No. Methodology Column Length × ID × Thickness Findings
[30] GC
CARBOWAX-Amines 15m × 530-ųm ×1.0-µm
4 main DGPs are identified CPSIL8-CB-Amines 25m × 320-ųm ×1.2-µm
GC-MS/ EI CPSIL8-CB-Amines 30m × 250-ųm × 1.2-µm
GC-MS/CI HP5-MS 30m × 225-ųm × 0.25-µm
NMR N/A N/A
IC AS-15 4mm ID × 250 mm length Oxalate, glycolate, formate, acetate, nitrate,
nitrite
[31] GC
CARBOWAX-Amines 15m × 530-ųm ×1.0-µm
4 main DGPs are identified CPSIL8-CB-Amines 25m × 320-ųm ×1.2-µm
GC-MS/ EI CPSIL8-CB-Amines 30m × 250-ųm × 1.2-µm
GC-MS/ CI HP5-MS 30m × 225-ųm × 0.25-µm
NMR N/A N/A
IC AS-15 4mm ID × 250 mm length Oxalate, glycolate, formate, acetate, nitrate,
nitrite
[33] HPLC Not available Not available HEF, HEI
IC Not available Not available Oxamide, formate, formamide, oxalate, nitrite
[34] HPLC Not available Not available HEI, HEF
IC (AS-15+AG-15) CS-17 Not available Oxamide, formate, formamide
FT-IR Not available Not available NH3, CO, NO, H-CHO, CH3-CHO, N2O, C2H4
[38] HPLC Shodex IC YK-421 125mm × 4.6 mm Degradation of MEA or MEA-MDEA blends is
zero at higher loading of CO2 Shodex IC YK-G 10 mm × 10 mm
[39] HPLC C18 150 mm × 4.6 mm OZD, HEIA, HEEDA, MEA-Urea, MEA-
Trimer, Cyclic urea of HEEDA, MEA/HEEDA
Urea, MEA-Quatramer,
Cyclic urea of MEA-Quatramer.
IC-MS and IC
CS 17 50 mm × 4 mm
CG 17 50 mm × 4 mm
NMR N/A N/A
[46] The rate of oxidative degradation of MEA by evaluating of NH3 with FT-IR were studied and the effect of metal ions (Iron, Cupper) and EDTA conducted
[47] This study examines the rate of oxidative degradation of MEA by evaluation of NH3 with FT-IR analysis
[48] IC AS 15, CS 17 Not available Oxalate, glycolate, formate, acetate, nitrate,
nitrite, EDA
[49] This papers mainly studied the degradation reaction pathways of MEA and MEA –MDEA blends induced by CO2 and O2
[51] GC-MS
DB-1701 60m × 0.32mm × 0.25-µm DGP No: 2-7,12-19 [Table 2.3] and
C4H8N2O3, C6H11NO3 Nukol 60m × 0.25mm × 0.25-µm
GC-FTIR
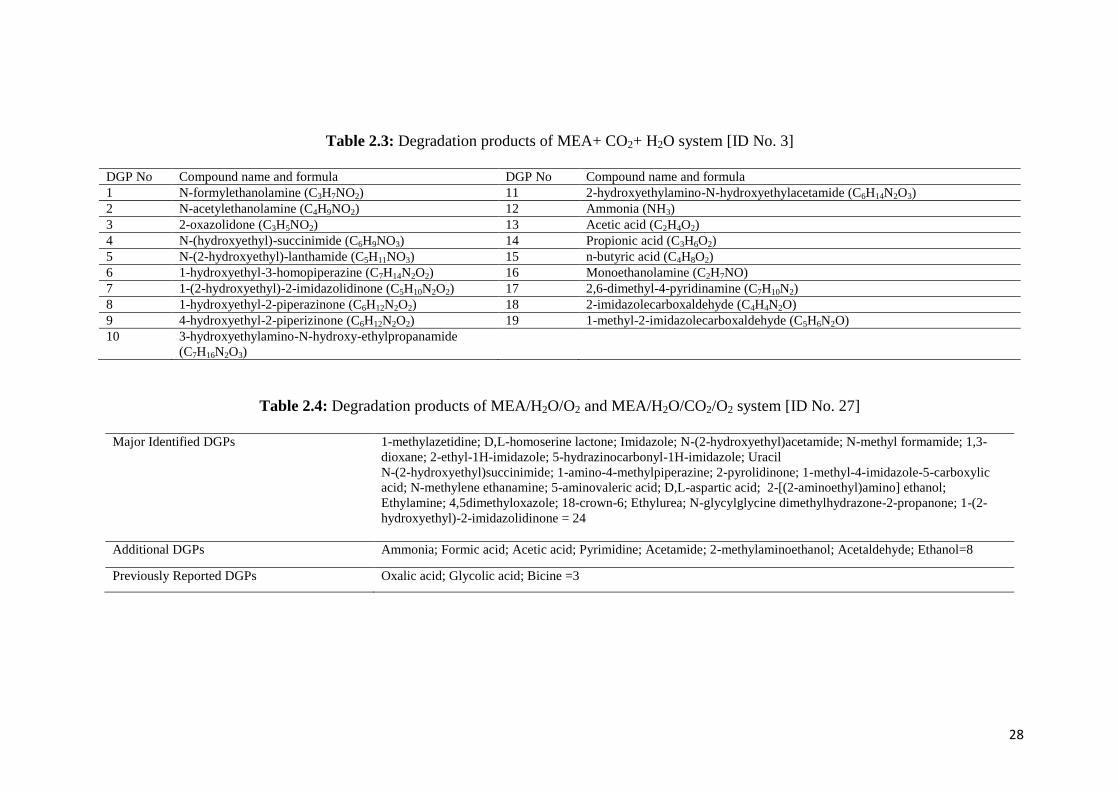
28
Table 2.3: Degradation products of MEA+ CO2+ H2O system [ID No. 3]
DGP No Compound name and formula DGP No Compound name and formula
1 N-formylethanolamine (C3H7NO2) 11 2-hydroxyethylamino-N-hydroxyethylacetamide (C6H14N2O3)
2 N-acetylethanolamine (C4H9NO2) 12 Ammonia (NH3)
3 2-oxazolidone (C3H5NO2) 13 Acetic acid (C2H4O2)
4 N-(hydroxyethyl)-succinimide (C6H9NO3) 14 Propionic acid (C3H6O2)
5 N-(2-hydroxyethyl)-lanthamide (C5H11NO3) 15 n-butyric acid (C4H8O2)
6 1-hydroxyethyl-3-homopiperazine (C7H14N2O2) 16 Monoethanolamine (C2H7NO)
7 1-(2-hydroxyethyl)-2-imidazolidinone (C5H10N2O2) 17 2,6-dimethyl-4-pyridinamine (C7H10N2)
8 1-hydroxyethyl-2-piperazinone (C6H12N2O2) 18 2-imidazolecarboxaldehyde (C4H4N2O)
9 4-hydroxyethyl-2-piperizinone (C6H12N2O2) 19 1-methyl-2-imidazolecarboxaldehyde (C5H6N2O)
10 3-hydroxyethylamino-N-hydroxy-ethylpropanamide
(C7H16N2O3)
Table 2.4: Degradation products of MEA/H2O/O2 and MEA/H2O/CO2/O2 system [ID No. 27]
Major Identified DGPs 1-methylazetidine; D,L-homoserine lactone; Imidazole; N-(2-hydroxyethyl)acetamide; N-methyl formamide; 1,3-
dioxane; 2-ethyl-1H-imidazole; 5-hydrazinocarbonyl-1H-imidazole; Uracil
N-(2-hydroxyethyl)succinimide; 1-amino-4-methylpiperazine; 2-pyrolidinone; 1-methyl-4-imidazole-5-carboxylic
acid; N-methylene ethanamine; 5-aminovaleric acid; D,L-aspartic acid; 2-[(2-aminoethyl)amino] ethanol;
Ethylamine; 4,5dimethyloxazole; 18-crown-6; Ethylurea; N-glycylglycine dimethylhydrazone-2-propanone; 1-(2-
hydroxyethyl)-2-imidazolidinone = 24
Additional DGPs Ammonia; Formic acid; Acetic acid; Pyrimidine; Acetamide; 2-methylaminoethanol; Acetaldehyde; Ethanol=8
Previously Reported DGPs Oxalic acid; Glycolic acid; Bicine =3
29
2.6.2 Degradation reaction of MEA and MEA blends
Carbon dioxide (CO2) induced degradation reaction mechanism of MEA is illustrated by Fred
Closmann (Oral presentation, 2009) which shown in the Figure 2.2. The mechanism is
different from that of Lepaumier‟s studies (Lepaumier et al., 2009a; Lepaumier et al., 2009c,
b) their results differ with respect to polymeric and oligomer degradation product. Oligomer
is formed from O2/CO2 induced degradation of MEA (Lepaumier et al., 2009a; Lepaumier et
al., 2009c, b). On the other hand F. Closmann is notted that these are polymeric degradation
products formation (Closmann, 2009). Divergent views on the formation of either polymer or
oligomer. The degradation pathways of MEA are explained in the literature (Strazisar et al.,
2003; Goff and Rochelle, 2004; Lepaumier et al., 2009a; Lepaumier et al., 2009c, b; Abdi,
1997; Lawal et al., 2005a; Strazisar et al., 2010) for protonation reaction, polymerization
reaction, isomerization reaction and miscellaneous routes. Oxidative and thermal degradation
studies of MEA were conducted by G.T. Rochelle research group (Chi and Rochelle, 2002;
Goff and Rochelle, 2004; Goff and Rochelle, 2006; Davis and Gary Rochelle, 2009; Sexton
and Rochelle, 2009b, a; Goff and Rochelle, 2010), (Lepaumier et al., 2009a; Lepaumier et al.,
2009c, b) and also many articles (Klare et al., 2000; Franco et al., 2009; Shahi et al., 1994;
Supap et al., 2006; Abdi, 1997) they attributed the degradation was enhanced by corrosion
inhibitor. Strazisar (Strazisar et al., 2003; Strazisar et al., 2010) conducted an experiment on
reclaimer bottom solution of MEA solvent and found nineteen (19) degradation products.
They explained that the same study was done in the laboratory scale but did not find all the
degradation products. It is believed that MEA degradation reaction in plant operation is
different from the laboratory condition, as some external degradation reaction occurred in the
plant but not in the laboratory. They predicted a new route for alkanolamine degradation
reaction mechanism of MEA degradation proposed by Uyanga (Uyanga, 2007) in case of a
single solvent and/or blended with MDEA, on the other hand same degradation mechanism
induced by O2 was also discussed by Lawal (Lawal et al., 2005a).
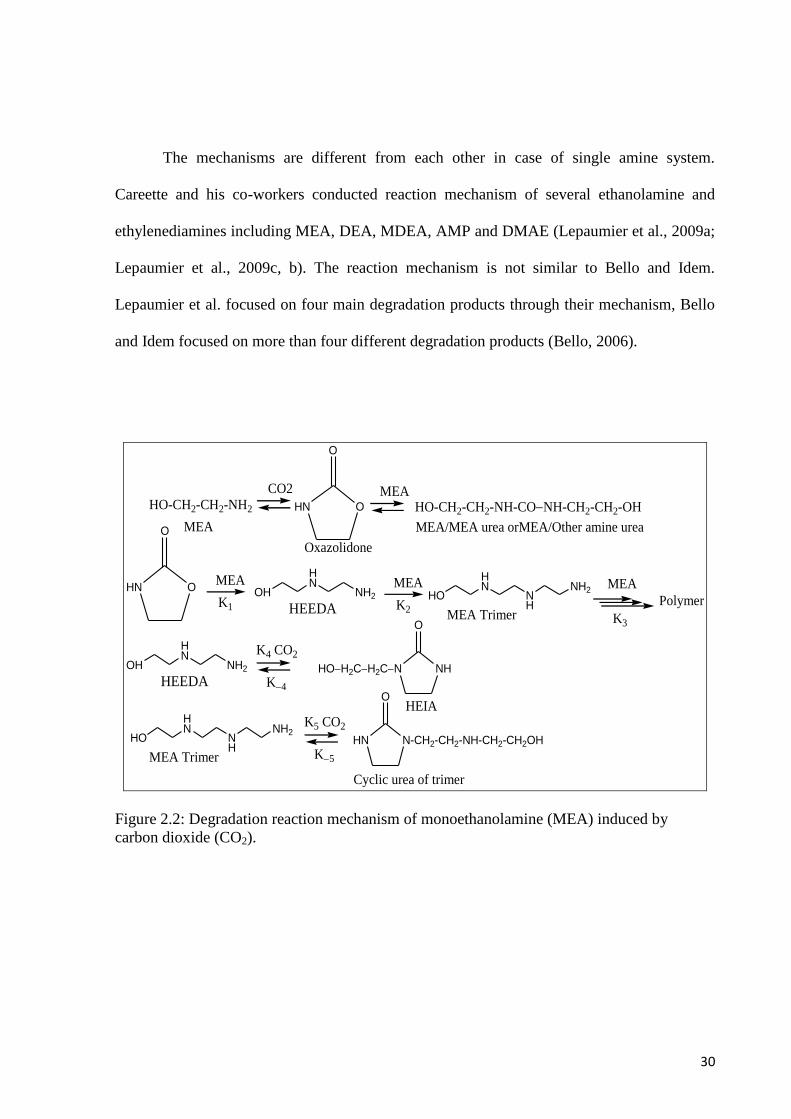
30
The mechanisms are different from each other in case of single amine system.
Careette and his co-workers conducted reaction mechanism of several ethanolamine and
ethylenediamines including MEA, DEA, MDEA, AMP and DMAE (Lepaumier et al., 2009a;
Lepaumier et al., 2009c, b). The reaction mechanism is not similar to Bello and Idem.
Lepaumier et al. focused on four main degradation products through their mechanism, Bello
and Idem focused on more than four different degradation products (Bello, 2006).
HO-CH2-CH2-NH2
MEA
HO-CH2-CH2-NH-CONH-CH2-CH2-OH
CO2
NHHOH2CH2CN
O
OHN
O
MEA
OHN
O
MEA
K1
OH
HN
NH2
HEEDAHO
HN
NH
NH2MEA
K2
MEA
K3
PolymerMEA Trimer
OH
HN
NH2
HEEDA
K4 CO2
K4
HEIA
HO
HN
NH
NH2
MEA Trimer
K5 CO2
K5
N-CH2-CH2-NH-CH2-CH2OHHN
O
Cyclic urea of trimer
Oxazolidone
MEA/MEA urea orMEA/Other amine urea
Figure 2.2: Degradation reaction mechanism of monoethanolamine (MEA) induced by
carbon dioxide (CO2).
31
2.7 Degradation of Diethanolamine (DEA) and its Blends
Aqueous diethanolamine (DEA) solutions are widely used in the oil and natural gas
industries for the absorption of carbon dioxide and hydrogen sulfide from mixtures of light
hydrocarbons. The amine solutions are subjected to regeneration by steam stripping before
recycling to the absorber. Although the principal reactions governing absorption and
desorption are certain, side reactions occur as well. Basically these side reactions are
undesirable because they result in a loss of valuable amine and give rise to degradation
products, some of which are highly corrosive. Table-2.5 reveals the degradation background
of DEA.
Diethanolamine (DEA) is an important alkanolamine successfully used within the 25–
35 wt% range in natural gas sweetening plant for sour gas absorption. Degradation study of
DEA with CO2 to form various byproducts has been demonstrated as early as 1956.
Sufficient information on DEA degradation and its blends were reported in the literature
(Lepaumier et al., 2009a; Blauwhoff et al., 1984; Klare et al., 2000; Dawodu and Meisen,
1996; Shahi et al., 1994; Choy and Meisen, 1980; Dawodu and Meisen, 1991, 1992; Kennard
M. and Axel Meisen, 1983; Lepaumier et al., 2009c, b). DEA/MDEA and DEA/AMP also
have an experience of sour gas absorption. The first blends MDEA/DEA have been used
successfully in a wide variety of natural gas sweetening applications for 20 years. In 1956,
Poldermann and Steele discovered the following reaction mechanisms (Section: 2.7.2, Figure
2.3 and Figure 2.4) during DEA/CO2 degradation. The author also mentioned that the BHEP
is a basic characteristics compound so it has no corrosion effect. Table-2.6 reveals literature
information on DEA degradation.
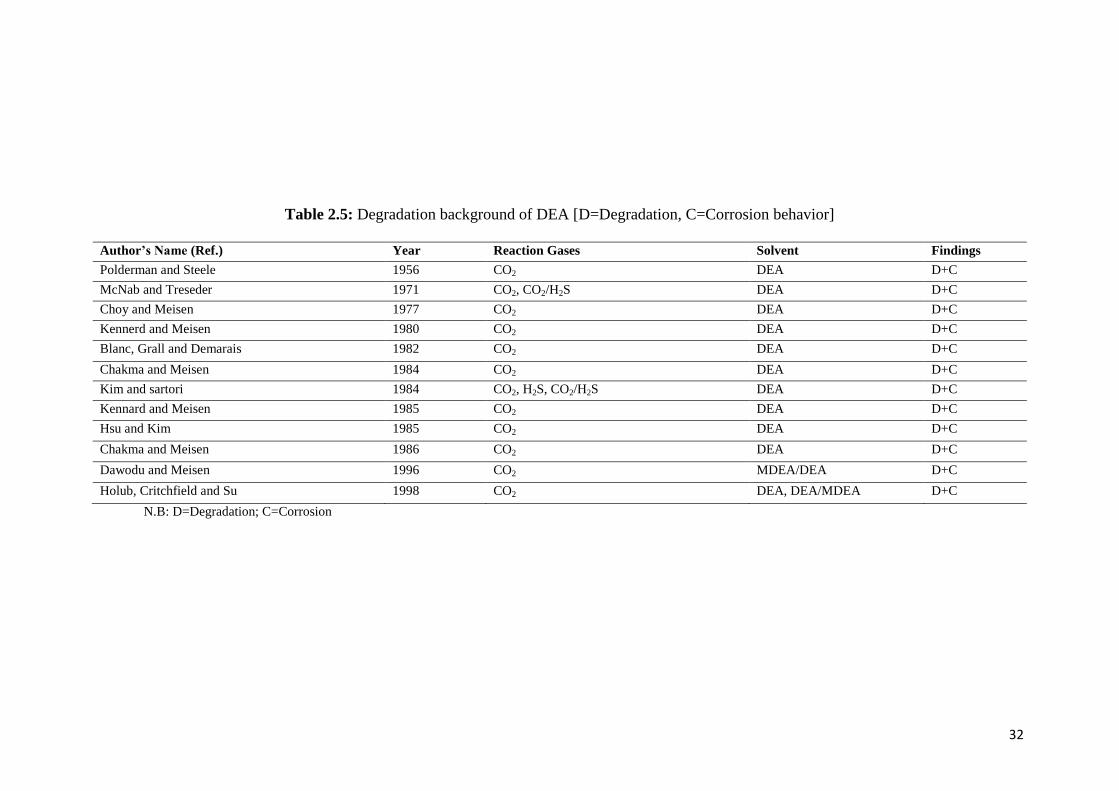
32
Table 2.5: Degradation background of DEA [D=Degradation, C=Corrosion behavior]
Author’s Name (Ref.) Year Reaction Gases Solvent Findings
Polderman and Steele 1956 CO2 DEA D+C
McNab and Treseder 1971 CO2, CO2/H2S DEA D+C
Choy and Meisen 1977 CO2 DEA D+C
Kennerd and Meisen 1980 CO2 DEA D+C
Blanc, Grall and Demarais 1982 CO2 DEA D+C
Chakma and Meisen 1984 CO2 DEA D+C
Kim and sartori 1984 CO2, H2S, CO2/H2S DEA D+C
Kennard and Meisen 1985 CO2 DEA D+C
Hsu and Kim 1985 CO2 DEA D+C
Chakma and Meisen 1986 CO2 DEA D+C
Dawodu and Meisen 1996 CO2 MDEA/DEA D+C
Holub, Critchfield and Su 1998 CO2 DEA, DEA/MDEA D+C
N.B: D=Degradation; C=Corrosion
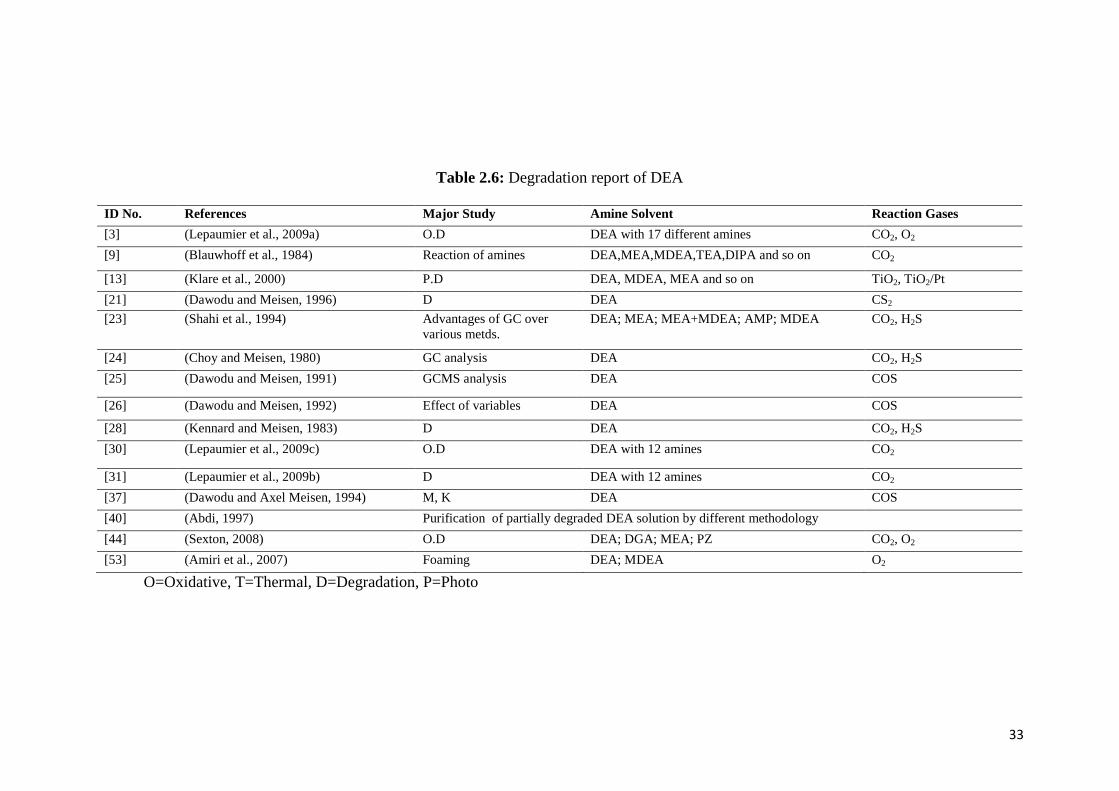
33
Table 2.6: Degradation report of DEA
ID No. References Major Study Amine Solvent Reaction Gases
[3] (Lepaumier et al., 2009a) O.D DEA with 17 different amines CO2, O2
[9] (Blauwhoff et al., 1984) Reaction of amines DEA,MEA,MDEA,TEA,DIPA and so on CO2
[13] (Klare et al., 2000) P.D DEA, MDEA, MEA and so on TiO2, TiO2/Pt
[21] (Dawodu and Meisen, 1996) D DEA CS2
[23] (Shahi et al., 1994) Advantages of GC over
various metds.
DEA; MEA; MEA+MDEA; AMP; MDEA CO2, H2S
[24] (Choy and Meisen, 1980) GC analysis DEA CO2, H2S
[25] (Dawodu and Meisen, 1991) GCMS analysis DEA COS
[26] (Dawodu and Meisen, 1992) Effect of variables DEA COS
[28] (Kennard and Meisen, 1983) D DEA CO2, H2S
[30] (Lepaumier et al., 2009c) O.D DEA with 12 amines CO2
[31] (Lepaumier et al., 2009b) D DEA with 12 amines CO2
[37] (Dawodu and Axel Meisen, 1994) M, K DEA COS
[40] (Abdi, 1997) Purification of partially degraded DEA solution by different methodology
[44] (Sexton, 2008) O.D DEA; DGA; MEA; PZ CO2, O2
[53] (Amiri et al., 2007) Foaming DEA; MDEA O2
O=Oxidative, T=Thermal, D=Degradation, P=Photo
34
2.7.1 Degradation products of DEA and DEA blends with methods
The absorption rate of DEA is comparatively lower than that of MEA. However, it
has better stability over MEA and its blends. Degradation results of DEA were found mostly
from studies conducted by the Meisen and Chakma research group. DEA degradation studies
(Versteeg and Oyevaar, 1989; Lepaumier et al., 2009a; Blauwhoff et al., 1984; Klare et al.,
2000; Dawodu and Meisen, 1996; Shahi et al., 1994; Choy and Meisen, 1980; Dawodu and
Meisen, 1991, 1992; Kennard M. and Axel Meisen, 1983; Lepaumier et al., 2009c, b)
critically reviewed and all its degradation products are reported in the Table-2.7 and 2.8.
DEA is not reclaimable under regenerator conditions (Meisen and Abdi, 2010); it
decomposes below its boiling point at atmospheric pressure. Vacuum reclaimers, however,
have been successfully used to reclaim DEA solutions (Meisen et al, 1996). Since DEA is a
secondary alkanolamine, it has a reduced affinity to reaction with H2S and CO2.
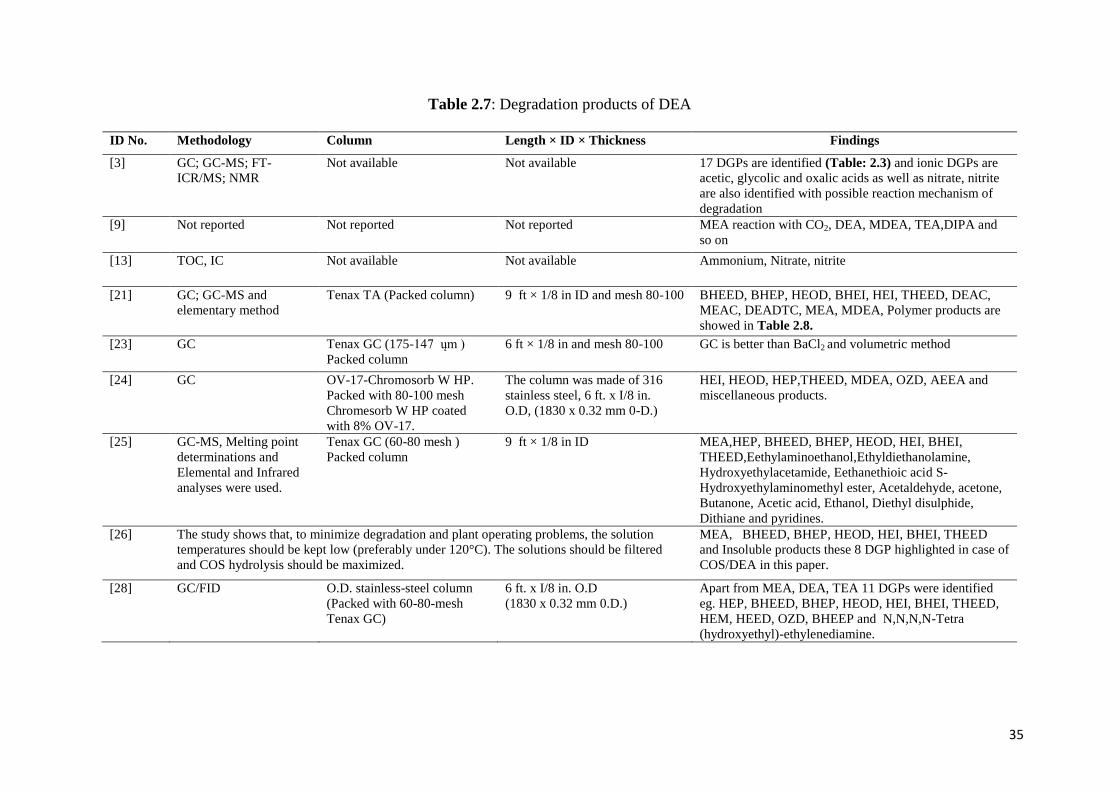
35
Table 2.7: Degradation products of DEA
ID No. Methodology Column Length × ID × Thickness Findings
[3] GC; GC-MS; FT-
ICR/MS; NMR
Not available Not available 17 DGPs are identified (Table: 2.3) and ionic DGPs are
acetic, glycolic and oxalic acids as well as nitrate, nitrite
are also identified with possible reaction mechanism of
degradation
[9] Not reported Not reported Not reported MEA reaction with CO2, DEA, MDEA, TEA,DIPA and
so on
[13] TOC, IC Not available Not available Ammonium, Nitrate, nitrite
[21] GC; GC-MS and
elementary method
Tenax TA (Packed column) 9 ft × 1/8 in ID and mesh 80-100 BHEED, BHEP, HEOD, BHEI, HEI, THEED, DEAC,
MEAC, DEADTC, MEA, MDEA, Polymer products are
showed in Table 2.8.
[23] GC Tenax GC (175-147 ųm )
Packed column
6 ft × 1/8 in and mesh 80-100 GC is better than BaCl2 and volumetric method
[24] GC OV-17-Chromosorb W HP.
Packed with 80-100 mesh
Chromesorb W HP coated
with 8% OV-17.
The column was made of 316
stainless steel, 6 ft. x I/8 in.
O.D, (1830 x 0.32 mm 0-D.)
HEI, HEOD, HEP,THEED, MDEA, OZD, AEEA and
miscellaneous products.
[25] GC-MS, Melting point
determinations and
Elemental and Infrared
analyses were used.
Tenax GC (60-80 mesh )
Packed column
9 ft × 1/8 in ID MEA,HEP, BHEED, BHEP, HEOD, HEI, BHEI,
THEED,Eethylaminoethanol,Ethyldiethanolamine,
Hydroxyethylacetamide, Eethanethioic acid S-
Hydroxyethylaminomethyl ester, Acetaldehyde, acetone,
Butanone, Acetic acid, Ethanol, Diethyl disulphide,
Dithiane and pyridines.
[26] The study shows that, to minimize degradation and plant operating problems, the solution
temperatures should be kept low (preferably under 120°C). The solutions should be filtered
and COS hydrolysis should be maximized.
MEA, BHEED, BHEP, HEOD, HEI, BHEI, THEED
and Insoluble products these 8 DGP highlighted in case of
COS/DEA in this paper.
[28] GC/FID O.D. stainless-steel column
(Packed with 60-80-mesh
Tenax GC)
6 ft. x I/8 in. O.D
(1830 x 0.32 mm 0.D.)
Apart from MEA, DEA, TEA 11 DGPs were identified
eg. HEP, BHEED, BHEP, HEOD, HEI, BHEI, THEED,
HEM, HEED, OZD, BHEEP and N,N,N,N-Tetra
(hydroxyethyl)-ethylenediamine.
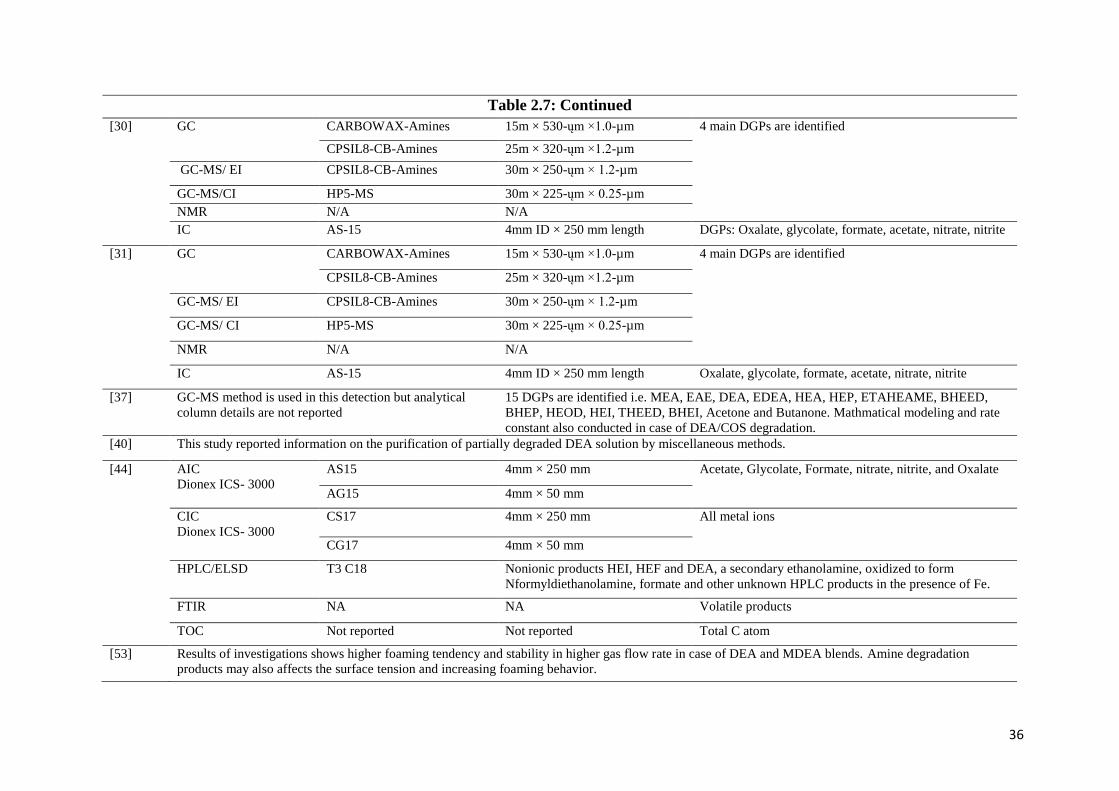
36
Table 2.7: Continued
[30] GC
CARBOWAX-Amines 15m × 530-ųm ×1.0-µm 4 main DGPs are identified
CPSIL8-CB-Amines 25m × 320-ųm ×1.2-µm
GC-MS/ EI CPSIL8-CB-Amines 30m × 250-ųm × 1.2-µm
GC-MS/CI HP5-MS 30m × 225-ųm × 0.25-µm
NMR N/A N/A
IC AS-15 4mm ID × 250 mm length DGPs: Oxalate, glycolate, formate, acetate, nitrate, nitrite
[31] GC
CARBOWAX-Amines 15m × 530-ųm ×1.0-µm 4 main DGPs are identified
CPSIL8-CB-Amines 25m × 320-ųm ×1.2-µm
GC-MS/ EI CPSIL8-CB-Amines 30m × 250-ųm × 1.2-µm
GC-MS/ CI HP5-MS 30m × 225-ųm × 0.25-µm
NMR N/A N/A
IC AS-15 4mm ID × 250 mm length Oxalate, glycolate, formate, acetate, nitrate, nitrite
[37] GC-MS method is used in this detection but analytical
column details are not reported
15 DGPs are identified i.e. MEA, EAE, DEA, EDEA, HEA, HEP, ETAHEAME, BHEED,
BHEP, HEOD, HEI, THEED, BHEI, Acetone and Butanone. Mathmatical modeling and rate
constant also conducted in case of DEA/COS degradation.
[40] This study reported information on the purification of partially degraded DEA solution by miscellaneous methods.
[44] AIC
Dionex ICS- 3000
AS15 4mm × 250 mm Acetate, Glycolate, Formate, nitrate, nitrite, and Oxalate
AG15 4mm × 50 mm
CIC
Dionex ICS- 3000
CS17 4mm × 250 mm All metal ions
CG17 4mm × 50 mm
HPLC/ELSD T3 C18 Nonionic products HEI, HEF and DEA, a secondary ethanolamine, oxidized to form
Nformyldiethanolamine, formate and other unknown HPLC products in the presence of Fe.
FTIR NA NA Volatile products
TOC Not reported Not reported Total C atom
[53] Results of investigations shows higher foaming tendency and stability in higher gas flow rate in case of DEA and MDEA blends. Amine degradation
products may also affects the surface tension and increasing foaming behavior.
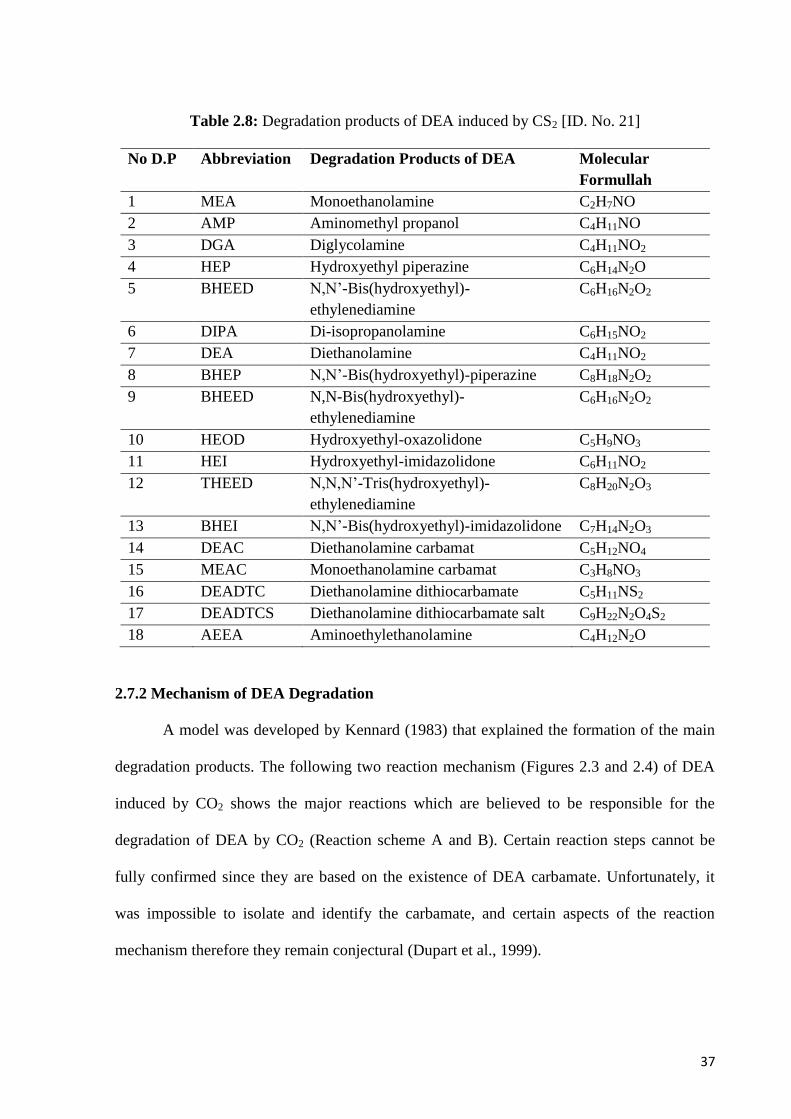
37
Table 2.8: Degradation products of DEA induced by CS2 [ID. No. 21]
No D.P Abbreviation Degradation Products of DEA Molecular
Formullah
1 MEA Monoethanolamine C2H7NO
2 AMP Aminomethyl propanol C4H11NO
3 DGA Diglycolamine C4H11NO2
4 HEP Hydroxyethyl piperazine C6H14N2O
5 BHEED N,N‟-Bis(hydroxyethyl)-
ethylenediamine
C6H16N2O2
6 DIPA Di-isopropanolamine C6H15NO2
7 DEA Diethanolamine C4H11NO2
8 BHEP N,N‟-Bis(hydroxyethyl)-piperazine C8H18N2O2
9 BHEED N,N-Bis(hydroxyethyl)-
ethylenediamine
C6H16N2O2
10 HEOD Hydroxyethyl-oxazolidone C5H9NO3
11 HEI Hydroxyethyl-imidazolidone C6H11NO2
12 THEED N,N,N‟-Tris(hydroxyethyl)-
ethylenediamine
C8H20N2O3
13 BHEI N,N‟-Bis(hydroxyethyl)-imidazolidone C7H14N2O3
14 DEAC Diethanolamine carbamat C5H12NO4
15 MEAC Monoethanolamine carbamat C3H8NO3
16 DEADTC Diethanolamine dithiocarbamate C5H11NS2
17 DEADTCS Diethanolamine dithiocarbamate salt C9H22N2O4S2
18 AEEA Aminoethylethanolamine C4H12N2O
2.7.2 Mechanism of DEA Degradation
A model was developed by Kennard (1983) that explained the formation of the main
degradation products. The following two reaction mechanism (Figures 2.3 and 2.4) of DEA
induced by CO2 shows the major reactions which are believed to be responsible for the
degradation of DEA by CO2 (Reaction scheme A and B). Certain reaction steps cannot be
fully confirmed since they are based on the existence of DEA carbamate. Unfortunately, it
was impossible to isolate and identify the carbamate, and certain aspects of the reaction
mechanism therefore they remain conjectural (Dupart et al., 1999).
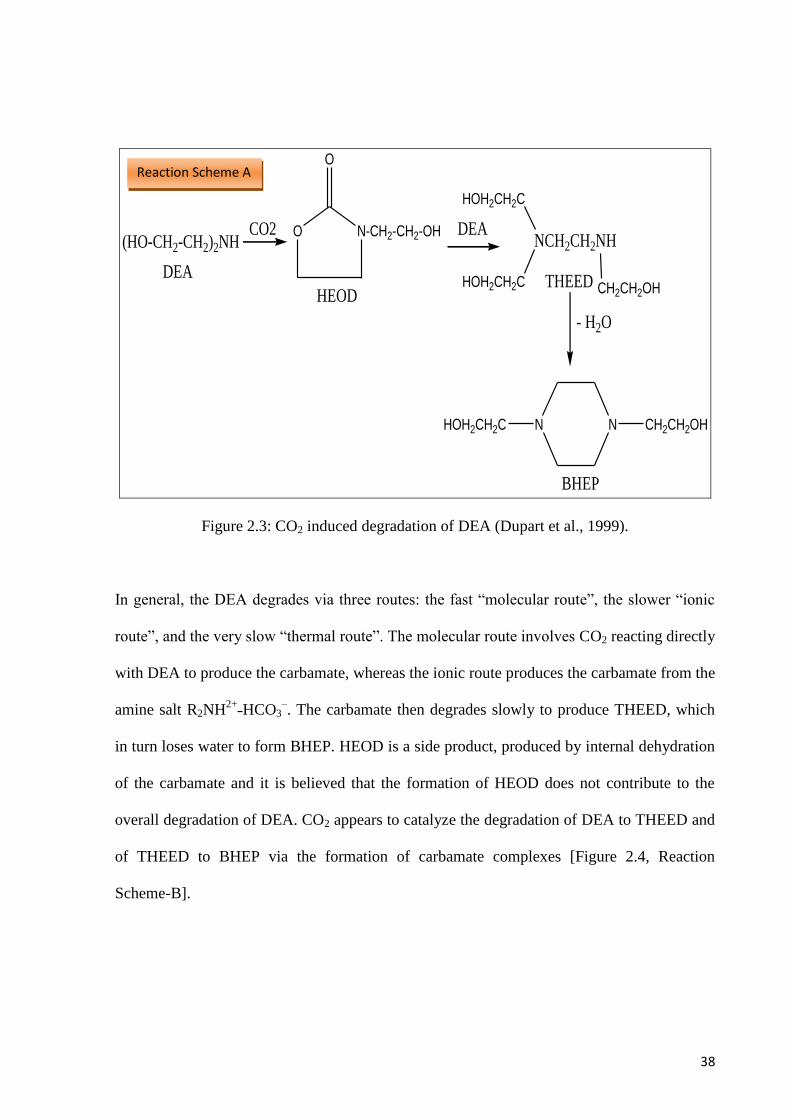
38
(HO-CH2-CH2)2NHCO2 O N-CH2-CH2-OH
O
DEA
DEA
HEOD
NCH2CH2NH
CH2CH2OH
HOH2CH2C
HOH2CH2C
- H2O
N N CH2CH2OHHOH2CH2C
THEED
BHEP
Figure 2.3: CO2 induced degradation of DEA (Dupart et al., 1999).
In general, the DEA degrades via three routes: the fast “molecular route”, the slower “ionic
route”, and the very slow “thermal route”. The molecular route involves CO2 reacting directly
with DEA to produce the carbamate, whereas the ionic route produces the carbamate from the
amine salt R2NH2+
˗HCO3–. The carbamate then degrades slowly to produce THEED, which
in turn loses water to form BHEP. HEOD is a side product, produced by internal dehydration
of the carbamate and it is believed that the formation of HEOD does not contribute to the
overall degradation of DEA. CO2 appears to catalyze the degradation of DEA to THEED and
of THEED to BHEP via the formation of carbamate complexes [Figure 2.4, Reaction
Scheme-B].
Reaction Scheme A
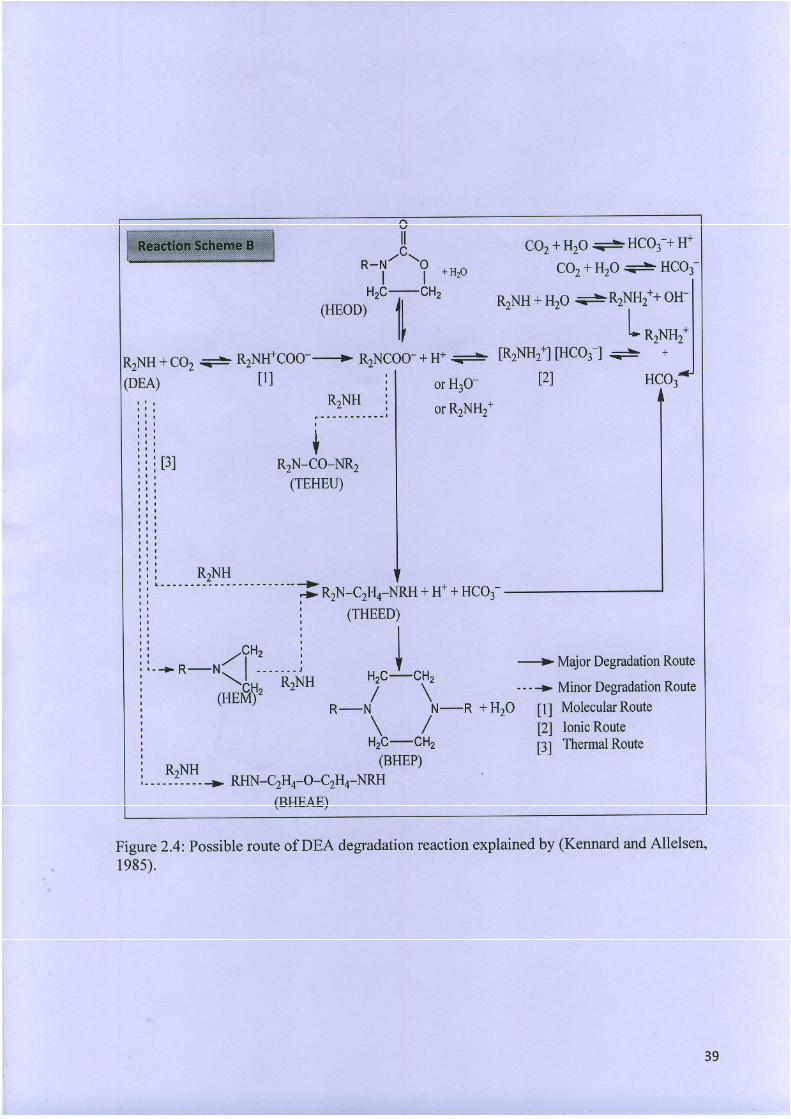

40
2.8 Degradation of Methyldiethanolamines (MDEA) and its Blends
MDEA is a tertiary amine and commonly used in the 20–50 wt% range which has a
CO2 loading capacity that approaches 1.0 mol/mol. Literature cited that, under proper
experimental condition MDEA is more prone to oxidative degradation and when used in a
mixture with MEA, and is preferentially degraded to protect MEA (Lawal et al., 2005b). The
solvent blend methyldiethanolamine/piperazine (MDEA/PZ) has been investigated as an
alternative to CO2 capture from coal-fired power plants. MDEA/PZ offers an advantage over
monoethanolamine (MEA) and MDEA alone because of its resistance to thermal and
oxidative degradation at typical absorption/stripping conditions (Closmann et al., 2009). The
degradation study of MDEA induced by CO2/O2, CO2/H2S and CO2 were conducted by many
researchers (Closmann et al., 2009; Klare et al., 2000; Shahi et al., 1994; Lepaumier et al.,
2009c; Lawal et al., 2005b) and found that, solutions with lower amine concentration are
typically employed in low-pressure, high-selectivity applications such as the selective
removal of H2S.
MDEA has several distinct advantages over primary and secondary amines, which
include lower vapour pressure, lower heats of reaction, higher resistance to degradation, and
lower corrosion rate. Most of these advantages have also been reported by Blanc et al (1982).
Depending on the application, some of them have special significance; for example, due to its
lower heat of reaction, MDEA can be employed. Table-2.9 illustrates previous research work
done on MDEA degradation.
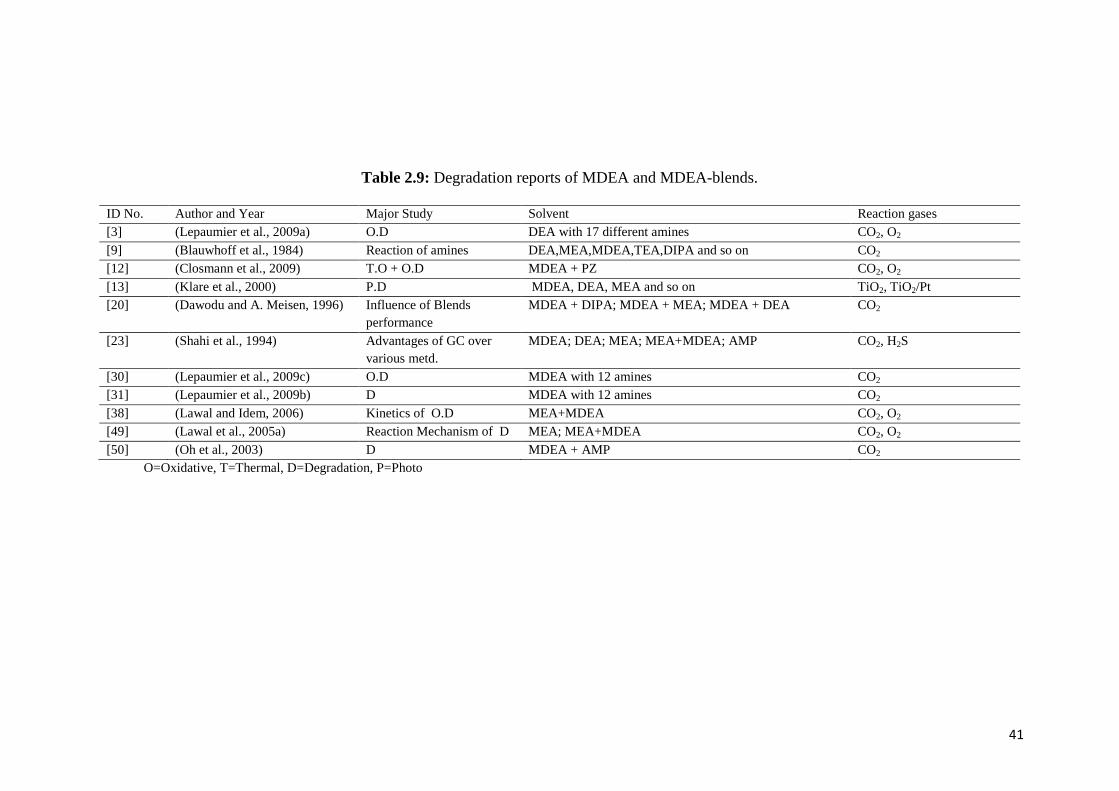
41
Table 2.9: Degradation reports of MDEA and MDEA-blends.
ID No. Author and Year Major Study Solvent Reaction gases
[3] (Lepaumier et al., 2009a) O.D DEA with 17 different amines CO2, O2
[9] (Blauwhoff et al., 1984) Reaction of amines DEA,MEA,MDEA,TEA,DIPA and so on CO2
[12] (Closmann et al., 2009) T.O + O.D MDEA + PZ CO2, O2
[13] (Klare et al., 2000) P.D MDEA, DEA, MEA and so on TiO2, TiO2/Pt
[20] (Dawodu and A. Meisen, 1996) Influence of Blends
performance
MDEA + DIPA; MDEA + MEA; MDEA + DEA CO2
[23] (Shahi et al., 1994) Advantages of GC over
various metd.
MDEA; DEA; MEA; MEA+MDEA; AMP CO2, H2S
[30] (Lepaumier et al., 2009c) O.D MDEA with 12 amines CO2
[31] (Lepaumier et al., 2009b) D MDEA with 12 amines CO2
[38] (Lawal and Idem, 2006) Kinetics of O.D MEA+MDEA CO2, O2
[49] (Lawal et al., 2005a) Reaction Mechanism of D MEA; MEA+MDEA CO2, O2
[50] (Oh et al., 2003) D MDEA + AMP CO2
O=Oxidative, T=Thermal, D=Degradation, P=Photo
42
2.8.1 Degradation products of MDEA and its Blend
While MDEA was initially thought of as non degradable, recently it has been shown
in many articles that it will often degrade in TGTU services, and efforts are being reflected
on improved reclaiming options for solvent quality control. MDEA molecule degraded into
HSS, DEA, MMEA and bicine. Bis-(hydroxyethyl) glycine (Bicine) is a degradation product
formed in the presence of DEA and unstable chemical intermediates. It is considered as a
corrosive DGP and may be removed by vacuum distillation. It has been shown that ion
exchange is not very effective in removing this compound since it is either dipolar or
zwitterions. Monomethylethanolamine (MMEA) is one of the simpler amines that may be
formed from MDEA degradation, since MMEA is a secondary amine, it will react directly
with CO2 and will begin to affect the performance of the MDEA solvent. Diethanolamine
(DEA) is also one of the simpler secondary amines that may be formed from MDEA. Since
DEA is a secondary amine, it will react directly with CO2 and will begin to affect the
performance of the MDEA solvent. Table-2.10 represents the reported degradation products
of MDEA with methodology and various analytical column (packed & capillary) details.
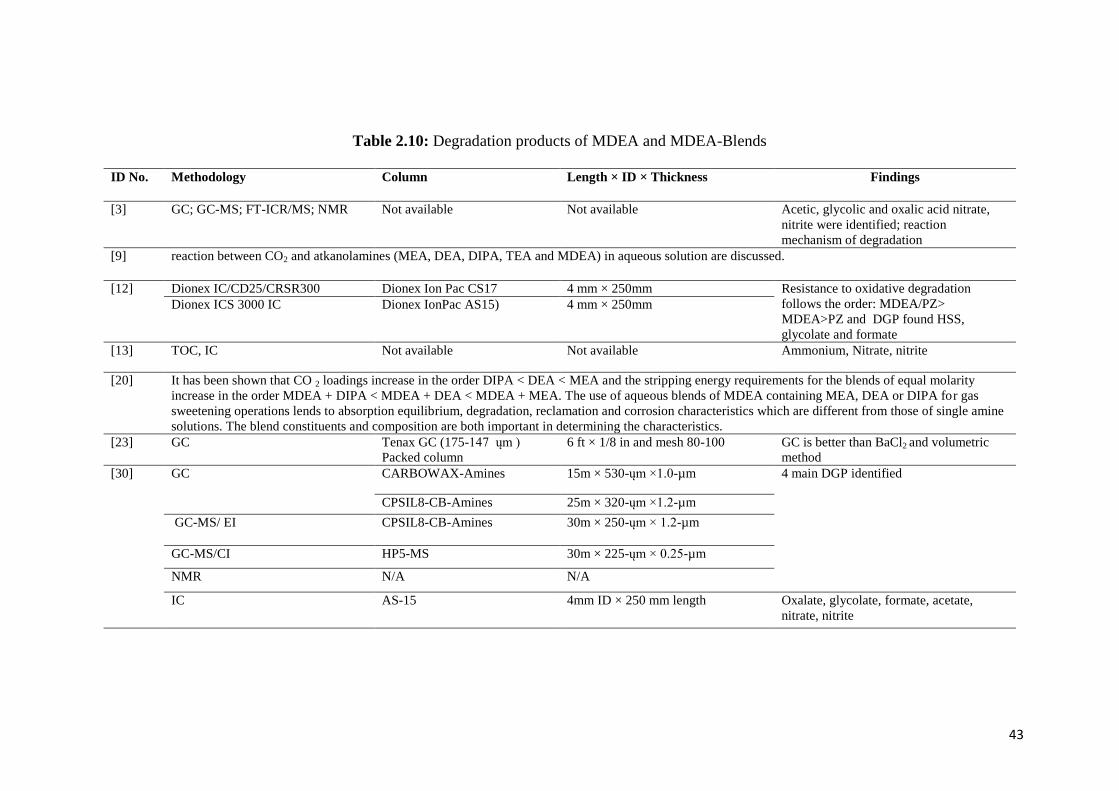
43
Table 2.10: Degradation products of MDEA and MDEA-Blends
ID No. Methodology Column Length × ID × Thickness Findings
[3] GC; GC-MS; FT-ICR/MS; NMR Not available Not available Acetic, glycolic and oxalic acid nitrate,
nitrite were identified; reaction
mechanism of degradation
[9] reaction between CO2 and atkanolamines (MEA, DEA, DIPA, TEA and MDEA) in aqueous solution are discussed.
[12] Dionex IC/CD25/CRSR300 Dionex Ion Pac CS17 4 mm × 250mm Resistance to oxidative degradation
follows the order: MDEA/PZ>
MDEA>PZ and DGP found HSS,
glycolate and formate
Dionex ICS 3000 IC Dionex IonPac AS15) 4 mm × 250mm
[13] TOC, IC Not available Not available Ammonium, Nitrate, nitrite
[20] It has been shown that CO 2 loadings increase in the order DIPA < DEA < MEA and the stripping energy requirements for the blends of equal molarity
increase in the order MDEA + DIPA < MDEA + DEA < MDEA + MEA. The use of aqueous blends of MDEA containing MEA, DEA or DIPA for gas
sweetening operations lends to absorption equilibrium, degradation, reclamation and corrosion characteristics which are different from those of single amine
solutions. The blend constituents and composition are both important in determining the characteristics.
[23] GC Tenax GC (175-147 ųm )
Packed column
6 ft × 1/8 in and mesh 80-100 GC is better than BaCl2 and volumetric
method
[30] GC
CARBOWAX-Amines 15m × 530-ųm ×1.0-µm 4 main DGP identified
CPSIL8-CB-Amines 25m × 320-ųm ×1.2-µm
GC-MS/ EI CPSIL8-CB-Amines 30m × 250-ųm × 1.2-µm
GC-MS/CI HP5-MS 30m × 225-ųm × 0.25-µm
NMR N/A N/A
IC AS-15 4mm ID × 250 mm length Oxalate, glycolate, formate, acetate,
nitrate, nitrite
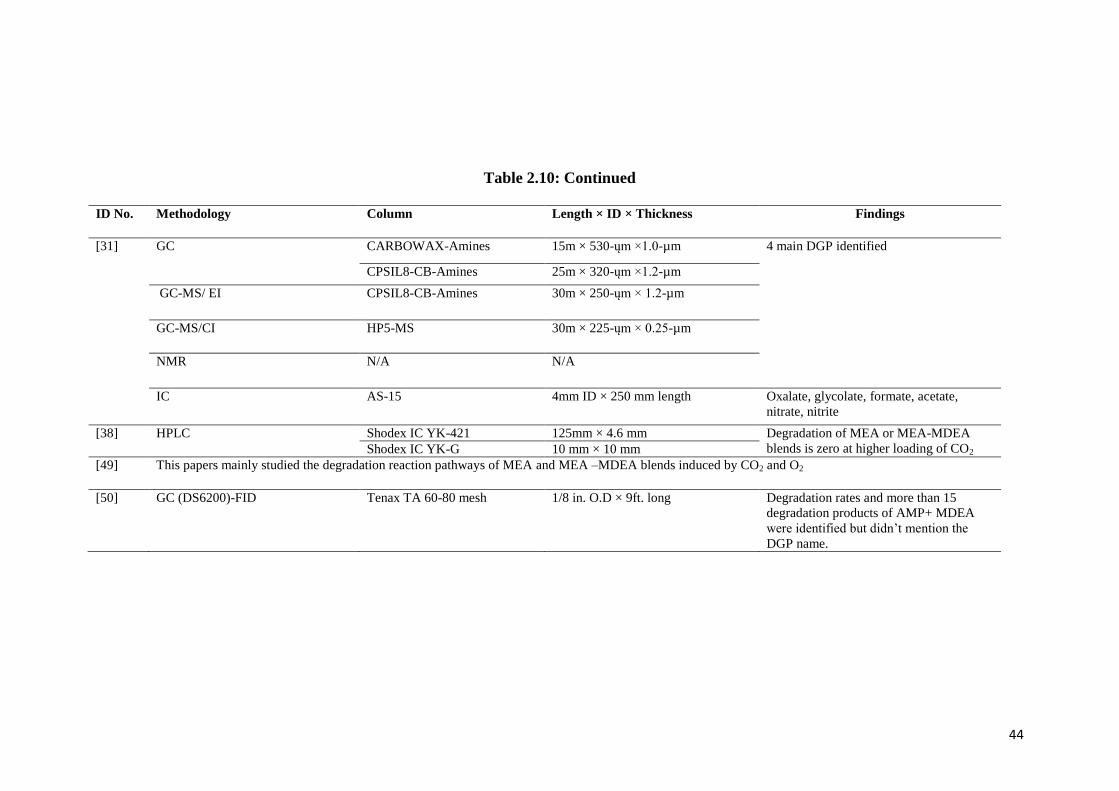
44
Table 2.10: Continued
ID No. Methodology Column Length × ID × Thickness Findings
[31] GC
CARBOWAX-Amines 15m × 530-ųm ×1.0-µm 4 main DGP identified
CPSIL8-CB-Amines 25m × 320-ųm ×1.2-µm
GC-MS/ EI CPSIL8-CB-Amines 30m × 250-ųm × 1.2-µm
GC-MS/CI HP5-MS 30m × 225-ųm × 0.25-µm
NMR N/A N/A
IC AS-15 4mm ID × 250 mm length Oxalate, glycolate, formate, acetate,
nitrate, nitrite
[38] HPLC Shodex IC YK-421 125mm × 4.6 mm Degradation of MEA or MEA-MDEA
blends is zero at higher loading of CO2 Shodex IC YK-G 10 mm × 10 mm
[49] This papers mainly studied the degradation reaction pathways of MEA and MEA –MDEA blends induced by CO2 and O2
[50] GC (DS6200)-FID Tenax TA 60-80 mesh 1/8 in. O.D × 9ft. long Degradation rates and more than 15
degradation products of AMP+ MDEA
were identified but didn‟t mention the
DGP name.
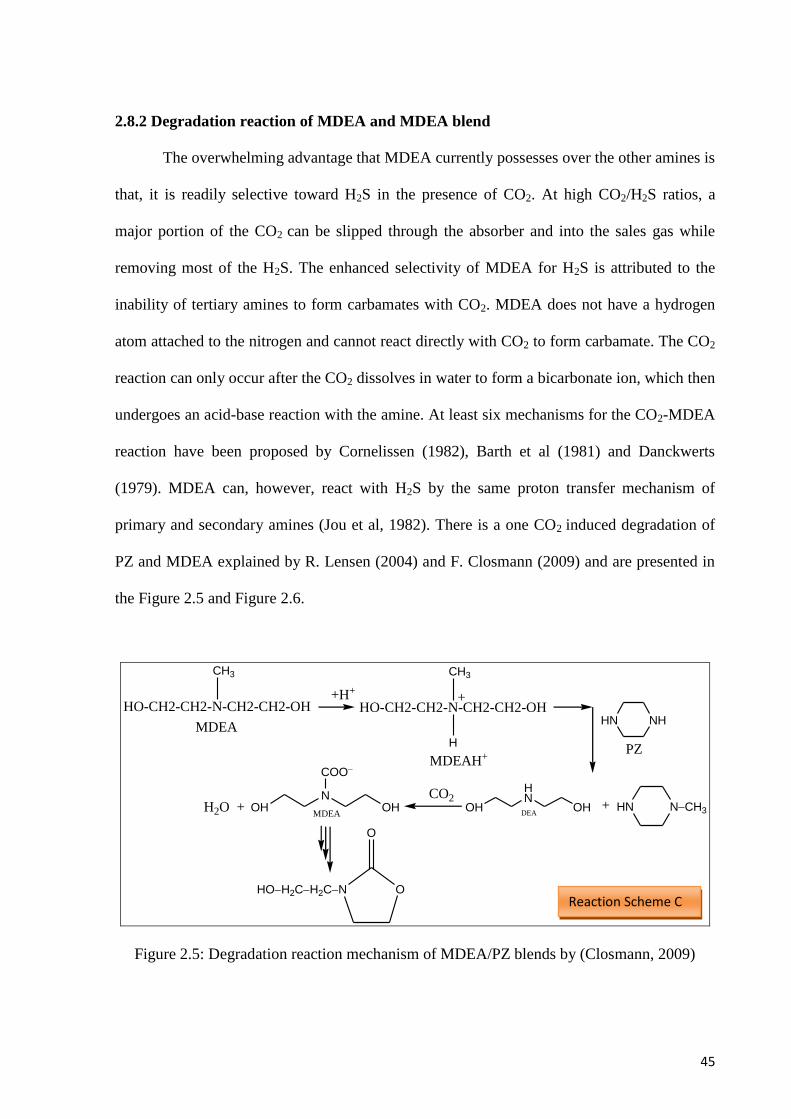
45
2.8.2 Degradation reaction of MDEA and MDEA blend
The overwhelming advantage that MDEA currently possesses over the other amines is
that, it is readily selective toward H2S in the presence of CO2. At high CO2/H2S ratios, a
major portion of the CO2 can be slipped through the absorber and into the sales gas while
removing most of the H2S. The enhanced selectivity of MDEA for H2S is attributed to the
inability of tertiary amines to form carbamates with CO2. MDEA does not have a hydrogen
atom attached to the nitrogen and cannot react directly with CO2 to form carbamate. The CO2
reaction can only occur after the CO2 dissolves in water to form a bicarbonate ion, which then
undergoes an acid-base reaction with the amine. At least six mechanisms for the CO2-MDEA
reaction have been proposed by Cornelissen (1982), Barth et al (1981) and Danckwerts
(1979). MDEA can, however, react with H2S by the same proton transfer mechanism of
primary and secondary amines (Jou et al, 1982). There is a one CO2 induced degradation of
PZ and MDEA explained by R. Lensen (2004) and F. Closmann (2009) and are presented in
the Figure 2.5 and Figure 2.6.
HN NH
OHN
OH
COO
OH
HN
OHMDEA DEA
PZ
HO-CH2-CH2-N-CH2-CH2-OH
CH3
MDEA
HO-CH2-CH2-N-CH2-CH2-OH
CH3
MDEAH+
H
+
HN NCH3+
+H+
CO2H2O +
OHOH2CH2CN
O
Figure 2.5: Degradation reaction mechanism of MDEA/PZ blends by (Closmann, 2009)
Reaction Scheme C
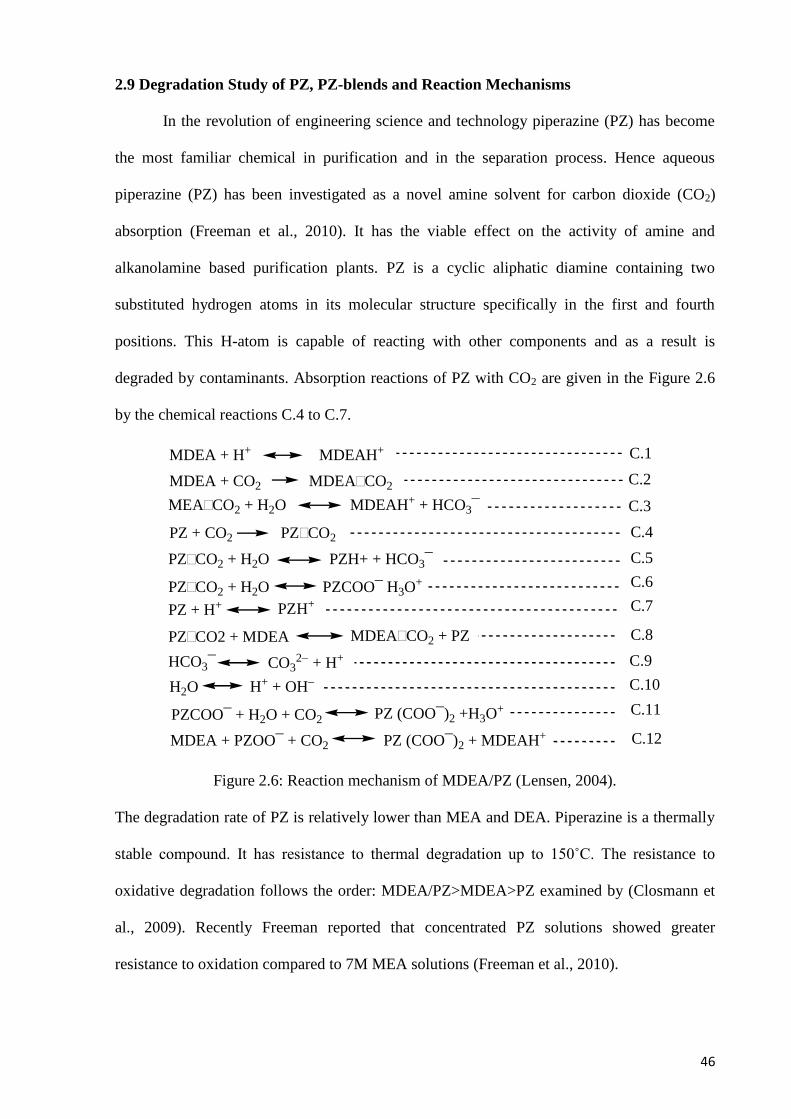
46
2.9 Degradation Study of PZ, PZ-blends and Reaction Mechanisms
In the revolution of engineering science and technology piperazine (PZ) has become
the most familiar chemical in purification and in the separation process. Hence aqueous
piperazine (PZ) has been investigated as a novel amine solvent for carbon dioxide (CO2)
absorption (Freeman et al., 2010). It has the viable effect on the activity of amine and
alkanolamine based purification plants. PZ is a cyclic aliphatic diamine containing two
substituted hydrogen atoms in its molecular structure specifically in the first and fourth
positions. This H-atom is capable of reacting with other components and as a result is
degraded by contaminants. Absorption reactions of PZ with CO2 are given in the Figure 2.6
by the chemical reactions C.4 to C.7.
MDEA + H+ MDEAH+
MDEA + CO2 MDEA�CO2
MEA�CO2 + H2O MDEAH+ + HCO3¯
PZ + CO2 PZ�CO2
PZ�CO2 + H2O PZH+ + HCO3¯
PZ�CO2 + H2O PZCOO¯ H3O+
PZ + H+ PZH+
PZ�CO2 + MDEA MDEA�CO2 + PZ
HCO3¯ CO32 + H+
H2O H+ + OH
PZCOO¯ + H2O + CO2 PZ (COO¯)2 +H3O+
MDEA + PZOO¯ + CO2 PZ (COO¯)2 + MDEAH+
C.1
C.2
C.3
C.4
C.5
C.6
C.7
C.8
C.9
C.10
C.11
C.12
Figure 2.6: Reaction mechanism of MDEA/PZ (Lensen, 2004).
The degradation rate of PZ is relatively lower than MEA and DEA. Piperazine is a thermally
stable compound. It has resistance to thermal degradation up to 150˚C. The resistance to
oxidative degradation follows the order: MDEA/PZ>MDEA>PZ examined by (Closmann et
al., 2009). Recently Freeman reported that concentrated PZ solutions showed greater
resistance to oxidation compared to 7M MEA solutions (Freeman et al., 2010).
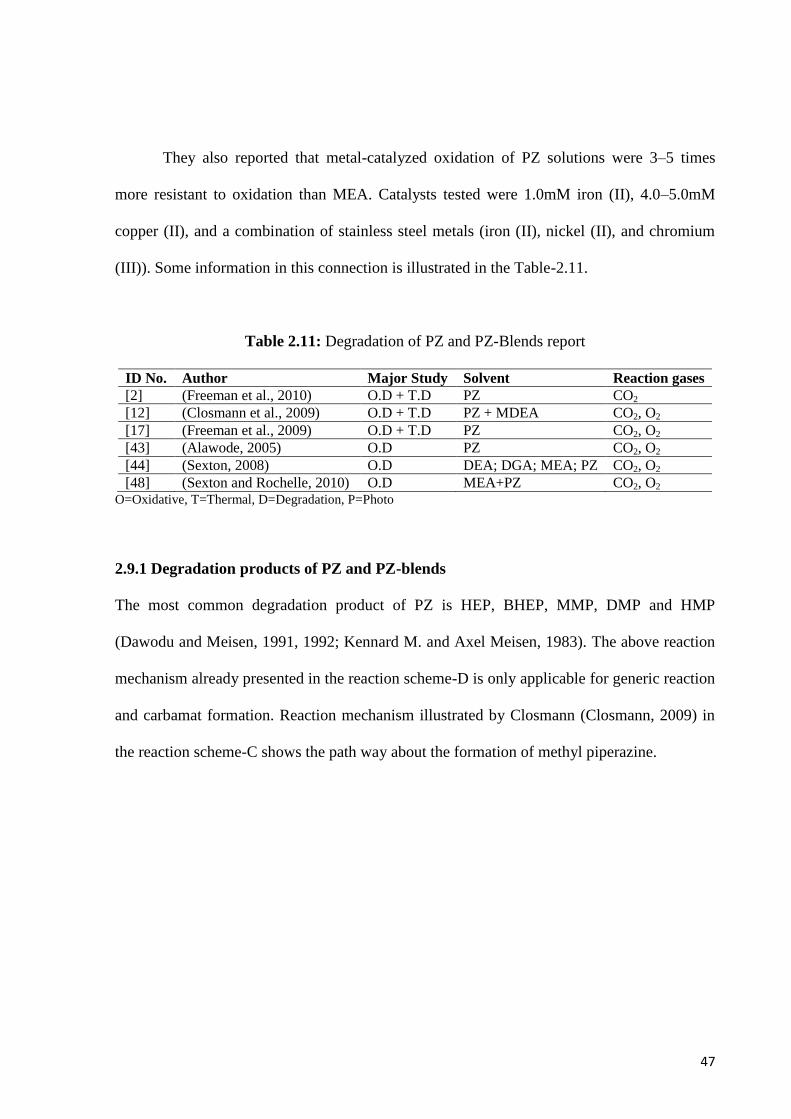
47
They also reported that metal-catalyzed oxidation of PZ solutions were 3–5 times
more resistant to oxidation than MEA. Catalysts tested were 1.0mM iron (II), 4.0–5.0mM
copper (II), and a combination of stainless steel metals (iron (II), nickel (II), and chromium
(III)). Some information in this connection is illustrated in the Table-2.11.
Table 2.11: Degradation of PZ and PZ-Blends report
ID No. Author Major Study Solvent Reaction gases
[2] (Freeman et al., 2010) O.D + T.D PZ CO2
[12] (Closmann et al., 2009) O.D + T.D PZ + MDEA CO2, O2
[17] (Freeman et al., 2009) O.D + T.D PZ CO2, O2
[43] (Alawode, 2005) O.D PZ CO2, O2
[44] (Sexton, 2008) O.D DEA; DGA; MEA; PZ CO2, O2
[48] (Sexton and Rochelle, 2010) O.D MEA+PZ CO2, O2
O=Oxidative, T=Thermal, D=Degradation, P=Photo
2.9.1 Degradation products of PZ and PZ-blends
The most common degradation product of PZ is HEP, BHEP, MMP, DMP and HMP
(Dawodu and Meisen, 1991, 1992; Kennard M. and Axel Meisen, 1983). The above reaction
mechanism already presented in the reaction scheme-D is only applicable for generic reaction
and carbamat formation. Reaction mechanism illustrated by Closmann (Closmann, 2009) in
the reaction scheme-C shows the path way about the formation of methyl piperazine.
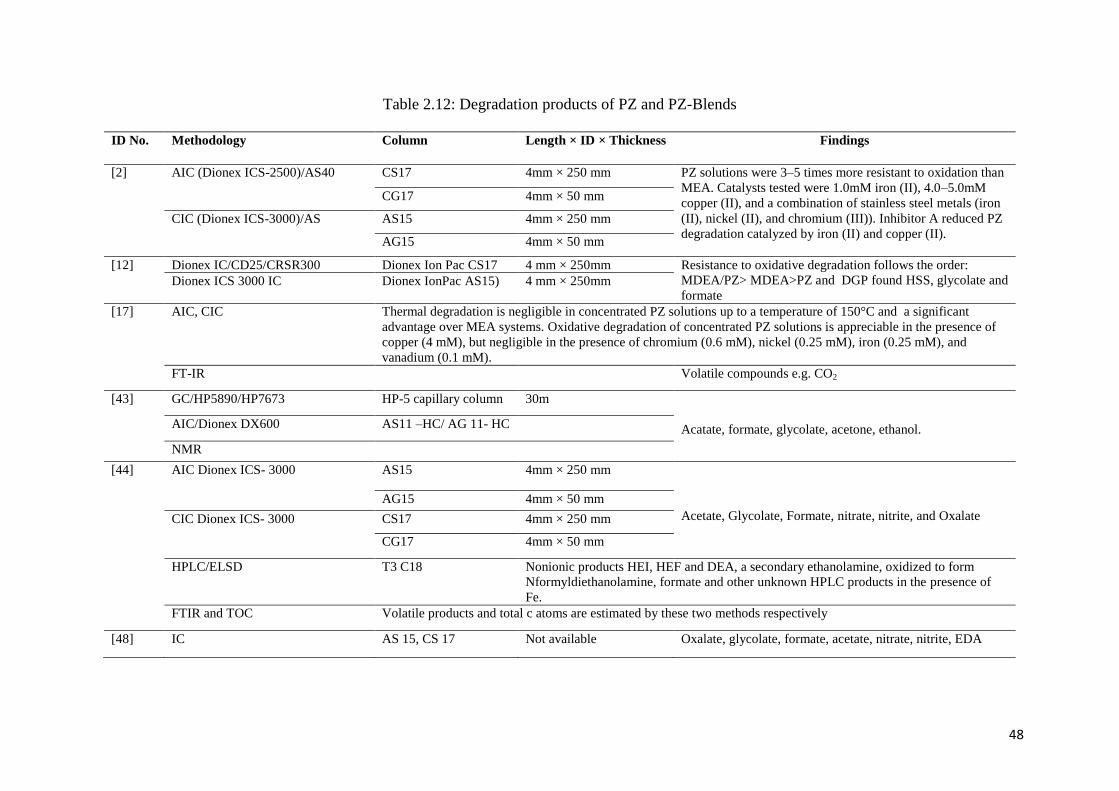
48
Table 2.12: Degradation products of PZ and PZ-Blends
ID No. Methodology Column Length × ID × Thickness Findings
[2] AIC (Dionex ICS-2500)/AS40 CS17 4mm × 250 mm PZ solutions were 3–5 times more resistant to oxidation than
MEA. Catalysts tested were 1.0mM iron (II), 4.0–5.0mM
copper (II), and a combination of stainless steel metals (iron
(II), nickel (II), and chromium (III)). Inhibitor A reduced PZ
degradation catalyzed by iron (II) and copper (II).
CG17 4mm × 50 mm
CIC (Dionex ICS-3000)/AS AS15 4mm × 250 mm
AG15 4mm × 50 mm
[12] Dionex IC/CD25/CRSR300 Dionex Ion Pac CS17 4 mm × 250mm Resistance to oxidative degradation follows the order:
MDEA/PZ> MDEA>PZ and DGP found HSS, glycolate and
formate Dionex ICS 3000 IC Dionex IonPac AS15) 4 mm × 250mm
[17] AIC, CIC Thermal degradation is negligible in concentrated PZ solutions up to a temperature of 150°C and a significant
advantage over MEA systems. Oxidative degradation of concentrated PZ solutions is appreciable in the presence of
copper (4 mM), but negligible in the presence of chromium (0.6 mM), nickel (0.25 mM), iron (0.25 mM), and
vanadium (0.1 mM).
FT-IR Volatile compounds e.g. CO2
[43] GC/HP5890/HP7673 HP-5 capillary column 30m
Acatate, formate, glycolate, acetone, ethanol. AIC/Dionex DX600 AS11 –HC/ AG 11- HC
NMR
[44] AIC Dionex ICS- 3000 AS15 4mm × 250 mm
Acetate, Glycolate, Formate, nitrate, nitrite, and Oxalate
AG15 4mm × 50 mm
CIC Dionex ICS- 3000 CS17 4mm × 250 mm
CG17 4mm × 50 mm
HPLC/ELSD T3 C18 Nonionic products HEI, HEF and DEA, a secondary ethanolamine, oxidized to form
Nformyldiethanolamine, formate and other unknown HPLC products in the presence of
Fe.
FTIR and TOC Volatile products and total c atoms are estimated by these two methods respectively
[48] IC AS 15, CS 17 Not available Oxalate, glycolate, formate, acetate, nitrate, nitrite, EDA

49
2.9.2 Degradation of Miscellaneous Amines and its Blends
With regard to this major problem of amine degradation, development of new amines
with higher chemical stability has become an essential prerequisite to successful plant
operation. Currently more attention has been paid to polyamines (Lepaumier et al., 2010,);
research seems to provide good alternatives to alkanolamines because their additional amine
functions have properties similar to those of alcohols and increase CO2 absorption capacity.
Studies on degradation, reaction mechanism and blend performance of diamines and
polyamines are given in Table-2.13.
Sterically hindered amines are more stable, with low degradation products and low
energy consumption for the purification of degraded amine solution. Depending on this
concept polyamines are considered for gas sweetening process. It can be said that those
amines that are economical and considered by all conditions are taken into industrial
application. Lepaumier and his co-workers investigated degraded polyamine solution and
identified four main DGP so these are low cost in terms of purification (Lepaumier et al.,
2010,). Same as polyamines ethanolamine and ethylenediamines (Lepaumier et al., 2009c)
are partially degraded having low degradation products.
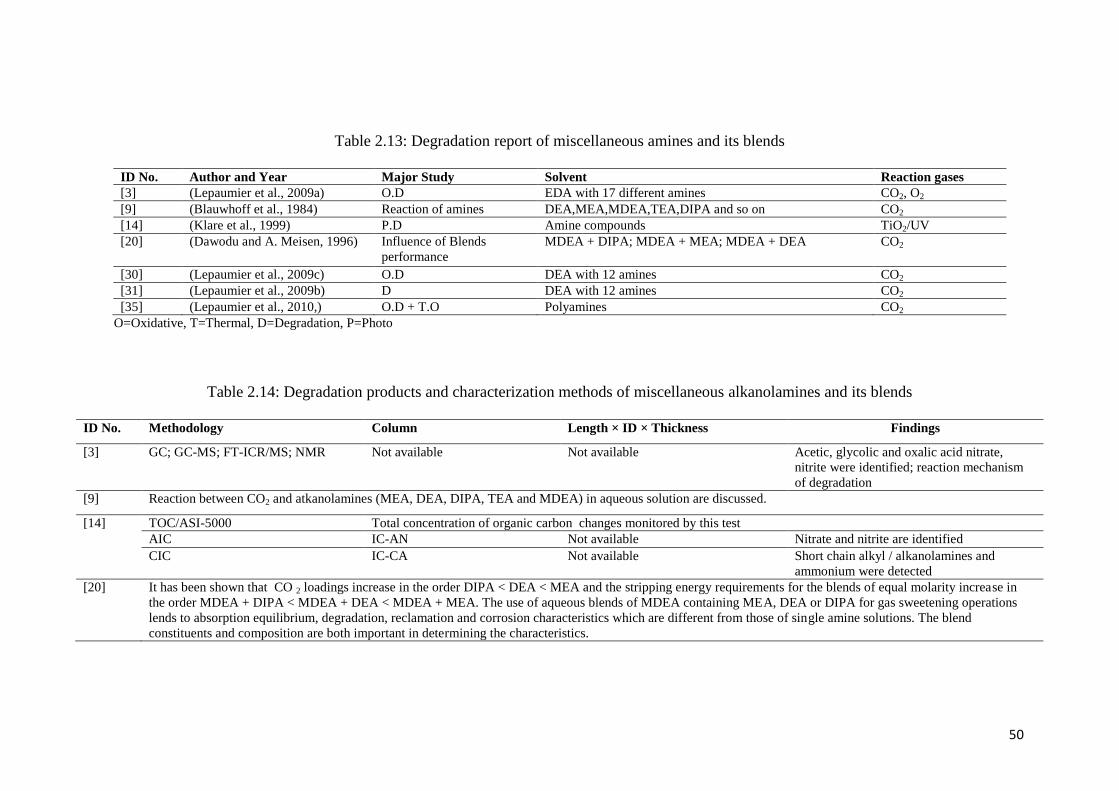
50
Table 2.13: Degradation report of miscellaneous amines and its blends
ID No. Author and Year Major Study Solvent Reaction gases
[3] (Lepaumier et al., 2009a) O.D EDA with 17 different amines CO2, O2
[9] (Blauwhoff et al., 1984) Reaction of amines DEA,MEA,MDEA,TEA,DIPA and so on CO2
[14] (Klare et al., 1999) P.D Amine compounds TiO2/UV
[20] (Dawodu and A. Meisen, 1996) Influence of Blends
performance
MDEA + DIPA; MDEA + MEA; MDEA + DEA CO2
[30] (Lepaumier et al., 2009c) O.D DEA with 12 amines CO2
[31] (Lepaumier et al., 2009b) D DEA with 12 amines CO2
[35] (Lepaumier et al., 2010,) O.D + T.O Polyamines CO2
O=Oxidative, T=Thermal, D=Degradation, P=Photo
Table 2.14: Degradation products and characterization methods of miscellaneous alkanolamines and its blends
ID No. Methodology Column Length × ID × Thickness Findings
[3] GC; GC-MS; FT-ICR/MS; NMR Not available Not available Acetic, glycolic and oxalic acid nitrate,
nitrite were identified; reaction mechanism
of degradation
[9] Reaction between CO2 and atkanolamines (MEA, DEA, DIPA, TEA and MDEA) in aqueous solution are discussed.
[14] TOC/ASI-5000 Total concentration of organic carbon changes monitored by this test
AIC IC-AN Not available Nitrate and nitrite are identified
CIC IC-CA Not available Short chain alkyl / alkanolamines and
ammonium were detected
[20] It has been shown that CO 2 loadings increase in the order DIPA < DEA < MEA and the stripping energy requirements for the blends of equal molarity increase in
the order MDEA + DIPA < MDEA + DEA < MDEA + MEA. The use of aqueous blends of MDEA containing MEA, DEA or DIPA for gas sweetening operations
lends to absorption equilibrium, degradation, reclamation and corrosion characteristics which are different from those of single amine solutions. The blend
constituents and composition are both important in determining the characteristics.
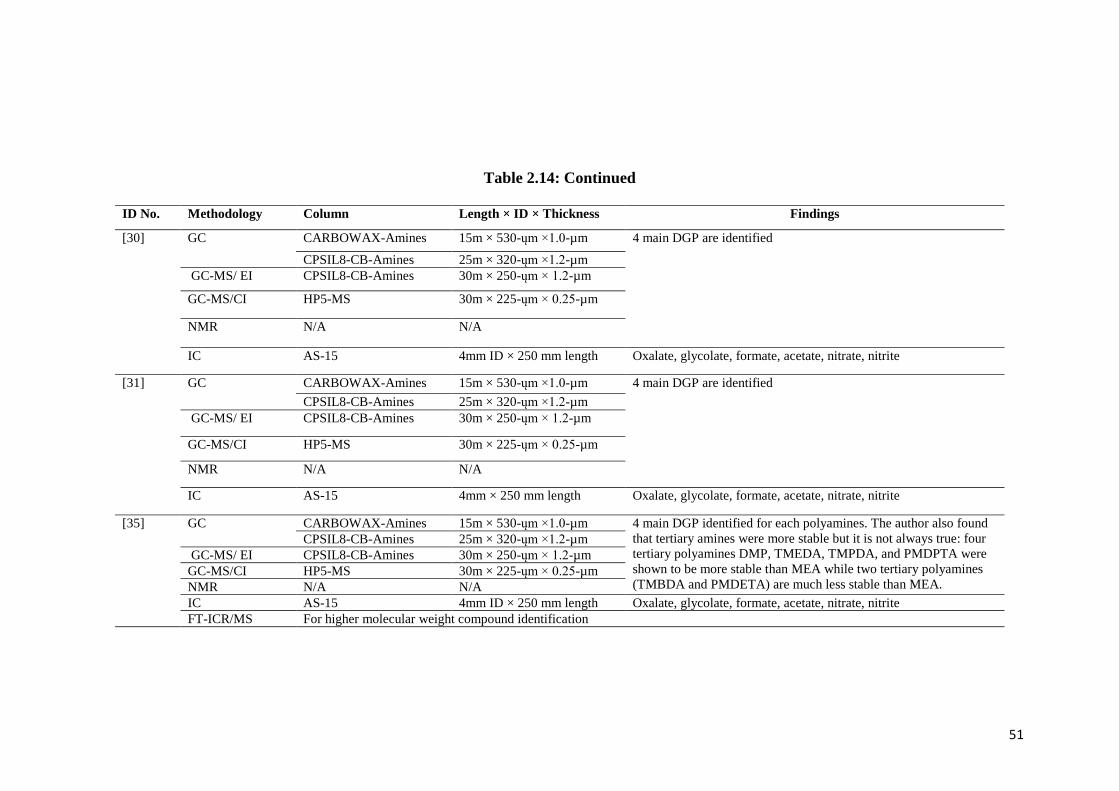
51
Table 2.14: Continued
ID No. Methodology Column Length × ID × Thickness Findings
[30] GC
CARBOWAX-Amines 15m × 530-ųm ×1.0-µm 4 main DGP are identified
CPSIL8-CB-Amines 25m × 320-ųm ×1.2-µm
GC-MS/ EI CPSIL8-CB-Amines 30m × 250-ųm × 1.2-µm
GC-MS/CI HP5-MS 30m × 225-ųm × 0.25-µm
NMR N/A N/A
IC AS-15 4mm ID × 250 mm length Oxalate, glycolate, formate, acetate, nitrate, nitrite
[31] GC
CARBOWAX-Amines 15m × 530-ųm ×1.0-µm 4 main DGP are identified
CPSIL8-CB-Amines 25m × 320-ųm ×1.2-µm
GC-MS/ EI CPSIL8-CB-Amines 30m × 250-ųm × 1.2-µm
GC-MS/CI HP5-MS 30m × 225-ųm × 0.25-µm
NMR N/A N/A
IC AS-15 4mm × 250 mm length Oxalate, glycolate, formate, acetate, nitrate, nitrite
[35] GC
CARBOWAX-Amines 15m × 530-ųm ×1.0-µm 4 main DGP identified for each polyamines. The author also found
that tertiary amines were more stable but it is not always true: four
tertiary polyamines DMP, TMEDA, TMPDA, and PMDPTA were
shown to be more stable than MEA while two tertiary polyamines
(TMBDA and PMDETA) are much less stable than MEA.
CPSIL8-CB-Amines 25m × 320-ųm ×1.2-µm
GC-MS/ EI CPSIL8-CB-Amines 30m × 250-ųm × 1.2-µm
GC-MS/CI HP5-MS 30m × 225-ųm × 0.25-µm
NMR N/A N/A
IC AS-15 4mm ID × 250 mm length Oxalate, glycolate, formate, acetate, nitrate, nitrite
FT-ICR/MS For higher molecular weight compound identification
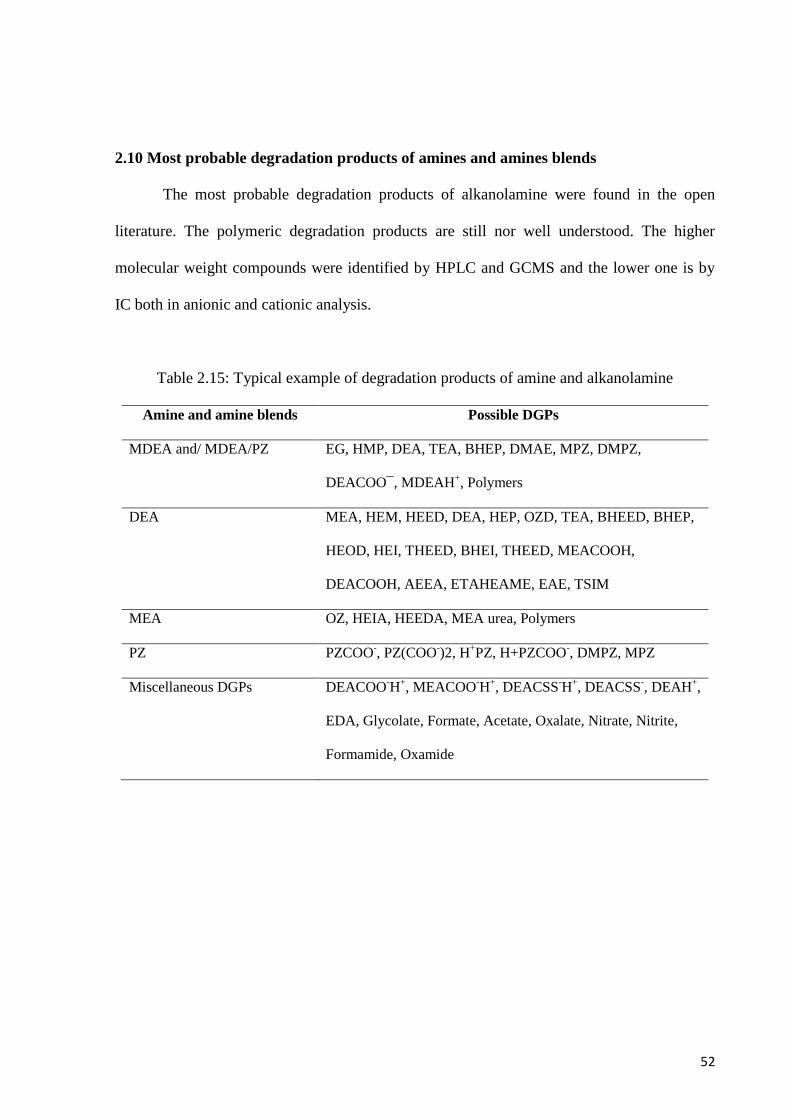
52
2.10 Most probable degradation products of amines and amines blends
The most probable degradation products of alkanolamine were found in the open
literature. The polymeric degradation products are still nor well understood. The higher
molecular weight compounds were identified by HPLC and GCMS and the lower one is by
IC both in anionic and cationic analysis.
Table 2.15: Typical example of degradation products of amine and alkanolamine
Amine and amine blends Possible DGPs
MDEA and/ MDEA/PZ EG, HMP, DEA, TEA, BHEP, DMAE, MPZ, DMPZ,
DEACOO¯, MDEAH+, Polymers
DEA MEA, HEM, HEED, DEA, HEP, OZD, TEA, BHEED, BHEP,
HEOD, HEI, THEED, BHEI, THEED, MEACOOH,
DEACOOH, AEEA, ETAHEAME, EAE, TSIM
MEA OZ, HEIA, HEEDA, MEA urea, Polymers
PZ PZCOO-, PZ(COO
-)2, H
+PZ, H+PZCOO
-, DMPZ, MPZ
Miscellaneous DGPs DEACOO-H
+, MEACOO
-H
+, DEACSS
-H
+, DEACSS
-, DEAH
+,
EDA, Glycolate, Formate, Acetate, Oxalate, Nitrate, Nitrite,
Formamide, Oxamide
53
2.11 Research gap available in the open literature
Literature cited sufficient information on the degradation of amine and alkanolamines
induced by carbon dioxide, H2S, COS, CS2 and O2 but most of these work conducted at
higher temperature and for long duration. Rochelle group emphasis the degradation of MEA
during the flue gas treatmet process and A. Meisen conducted research work on DEA
individual solution particularly in natural gas purification process induced by CO2, COS and
CS2. P. L. Careette research group specially conducted research on the identification and
degradation mechanism for several group of amines particularly on monoamine, diamine
induced by carbon dioxide. Degradation products of MDEA/PZ blends were conducted by
Fremann et al., in 2009 but some DGPs are still unknown. To the best of our knowledge
degradation studies of DEA/PZ have not yet been studied and there are no information about
DEA/PZ induced by any sour gas components was found. In addition some amines e.g.
TBEE, DIPA, DGA and TEA were used in the aqueous absorption process as replacement of
primary alkanolamines like MEA, DEA and MDEA. However these amines are yet to be
characterized for their DGP‟s. Several chromatographic methods were carried out for the
characterization of degradation products nevertheless no specific method was found for these
particular amines even though particular solvent or chromatohraphic column. Most of the
degradation studies of alkanolamine were conducted under particular temperature but the
clues of identification are not explained in some cases.
54
METHODOLOGY
CHAPTER 03
55
CHAPTER THREE: METHODOLOGY
This chapter describes the experimental apparatus and procedure for the carbon
dioxide induced degradation of carbonated solution of DEA and MDEA and their blends with
PZ. Details of the equipment, chemicals, solution preparation, typical experimental run and
analysis will be given in the following representation. In addition, this chapter deals with a
description of the analytical equipments and analytical procedure. To identify the degradation
products, Ion Chromatography (IC), Gas Chromatography Mass Spectrometer (GC-MS) and
High Performance Liquid Chromatography (HPLC) were analyzed to detect unknown
reaction products.
3.1 Chemicals
PZ, DEA and MDEA (reagent grade, 99% purity) were purchased from Mercks
Chemical Company, Germany. Few of the samples are purchased from Fischer Scientific and
rest of the chemicals and analytical standards are imported from Sigma Aldrich, Germany
which particularly listed in the appendix A. Hydrochloric acid of concentrations (1M and
2M) purchased from Mercks chemical company. The list of chemicals is given in the
appendix A with details informations like molecular formula, product ID and identity etc.
3.2 Sample Preparation
Aqueous alkanolamine solution is prepared using distilled water (DW) to the
predetermined concentration. The solution‟s concentration will then be determined by
titration with standard 1.0 M and 2.0 M HCl reagent so that the exact concentration was
ascertained. Necessary precautions should be taken to avoid any exposure of the sample to
the air during the preparation period. The following amine solutions of various concentrations
were prepared for five systems (i-v).
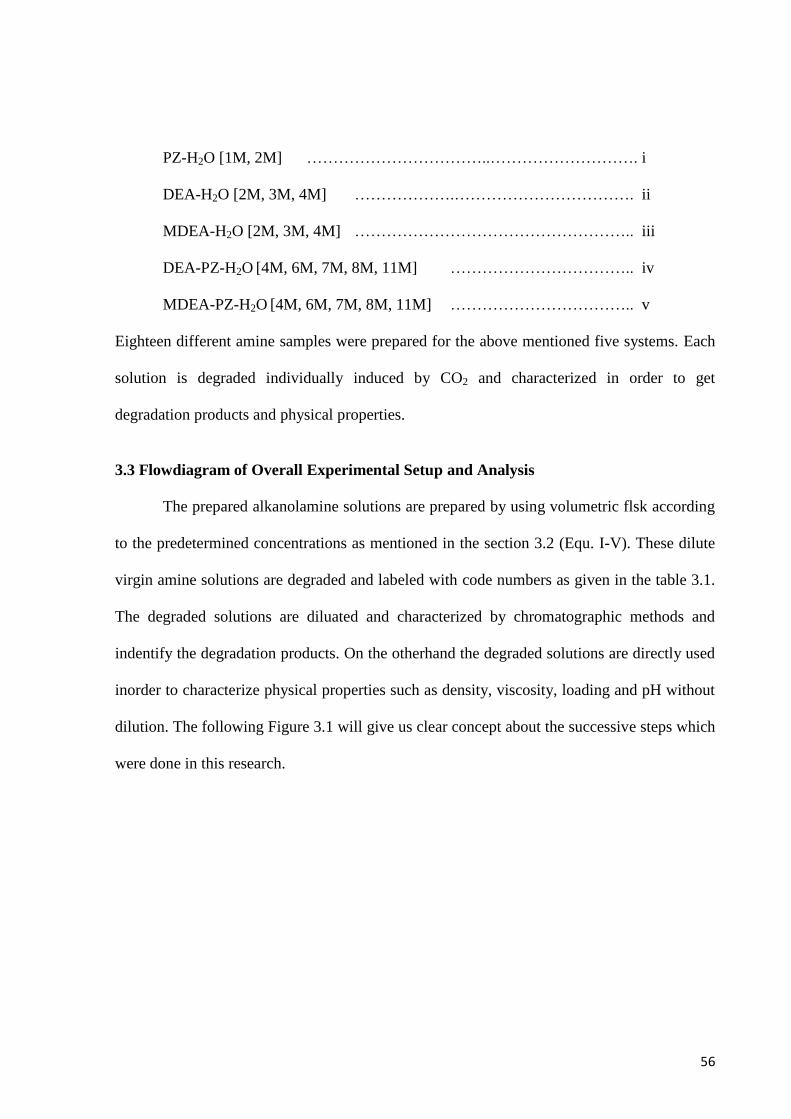
56
PZ-H2O [1M, 2M] ……………………………..………………………. i
DEA-H2O [2M, 3M, 4M] ……………….……………………………. ii
MDEA-H2O [2M, 3M, 4M] …………………………………………….. iii
DEA-PZ-H2O [4M, 6M, 7M, 8M, 11M] …………………………….. iv
MDEA-PZ-H2O [4M, 6M, 7M, 8M, 11M] …………………………….. v
Eighteen different amine samples were prepared for the above mentioned five systems. Each
solution is degraded individually induced by CO2 and characterized in order to get
degradation products and physical properties.
3.3 Flowdiagram of Overall Experimental Setup and Analysis
The prepared alkanolamine solutions are prepared by using volumetric flsk according
to the predetermined concentrations as mentioned in the section 3.2 (Equ. I-V). These dilute
virgin amine solutions are degraded and labeled with code numbers as given in the table 3.1.
The degraded solutions are diluated and characterized by chromatographic methods and
indentify the degradation products. On the otherhand the degraded solutions are directly used
inorder to characterize physical properties such as density, viscosity, loading and pH without
dilution. The following Figure 3.1 will give us clear concept about the successive steps which
were done in this research.
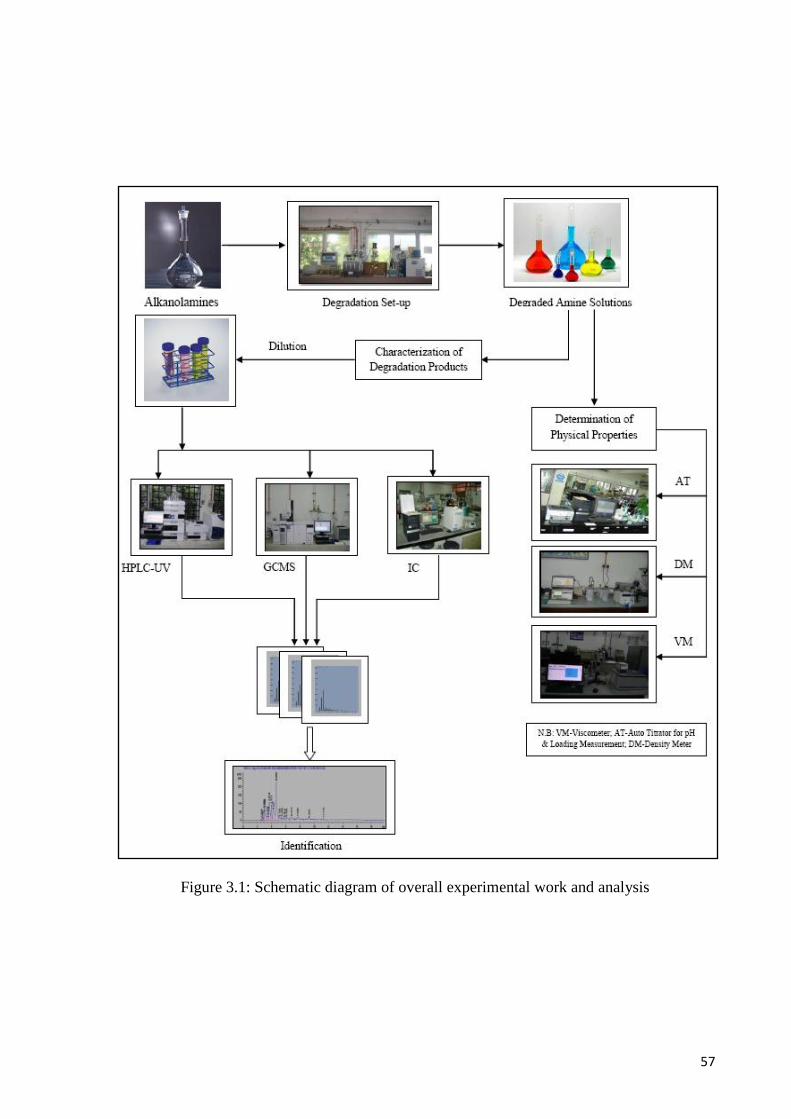
57
Figure 3.1: Schematic diagram of overall experimental work and analysis
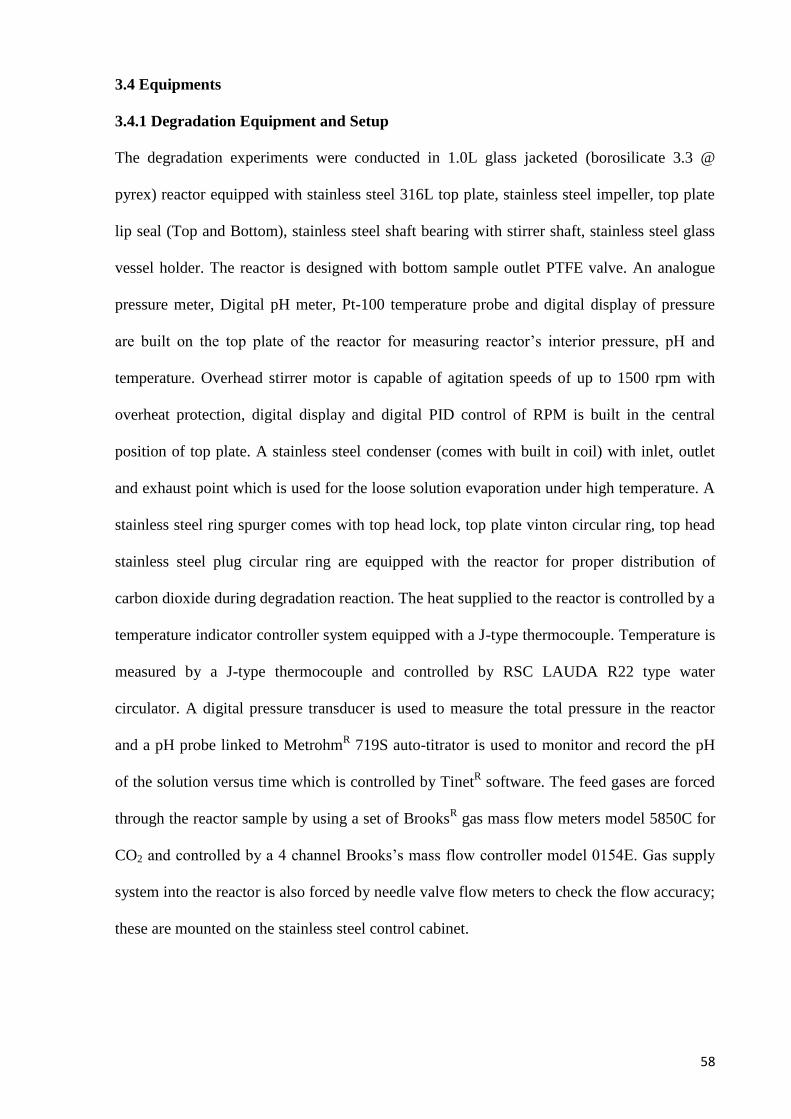
58
3.4 Equipments
3.4.1 Degradation Equipment and Setup
The degradation experiments were conducted in 1.0L glass jacketed (borosilicate 3.3 @
pyrex) reactor equipped with stainless steel 316L top plate, stainless steel impeller, top plate
lip seal (Top and Bottom), stainless steel shaft bearing with stirrer shaft, stainless steel glass
vessel holder. The reactor is designed with bottom sample outlet PTFE valve. An analogue
pressure meter, Digital pH meter, Pt-100 temperature probe and digital display of pressure
are built on the top plate of the reactor for measuring reactor‟s interior pressure, pH and
temperature. Overhead stirrer motor is capable of agitation speeds of up to 1500 rpm with
overheat protection, digital display and digital PID control of RPM is built in the central
position of top plate. A stainless steel condenser (comes with built in coil) with inlet, outlet
and exhaust point which is used for the loose solution evaporation under high temperature. A
stainless steel ring spurger comes with top head lock, top plate vinton circular ring, top head
stainless steel plug circular ring are equipped with the reactor for proper distribution of
carbon dioxide during degradation reaction. The heat supplied to the reactor is controlled by a
temperature indicator controller system equipped with a J-type thermocouple. Temperature is
measured by a J-type thermocouple and controlled by RSC LAUDA R22 type water
circulator. A digital pressure transducer is used to measure the total pressure in the reactor
and a pH probe linked to MetrohmR 719S auto-titrator is used to monitor and record the pH
of the solution versus time which is controlled by TinetR software. The feed gases are forced
through the reactor sample by using a set of BrooksR gas mass flow meters model 5850C for
CO2 and controlled by a 4 channel Brooks‟s mass flow controller model 0154E. Gas supply
system into the reactor is also forced by needle valve flow meters to check the flow accuracy;
these are mounted on the stainless steel control cabinet.
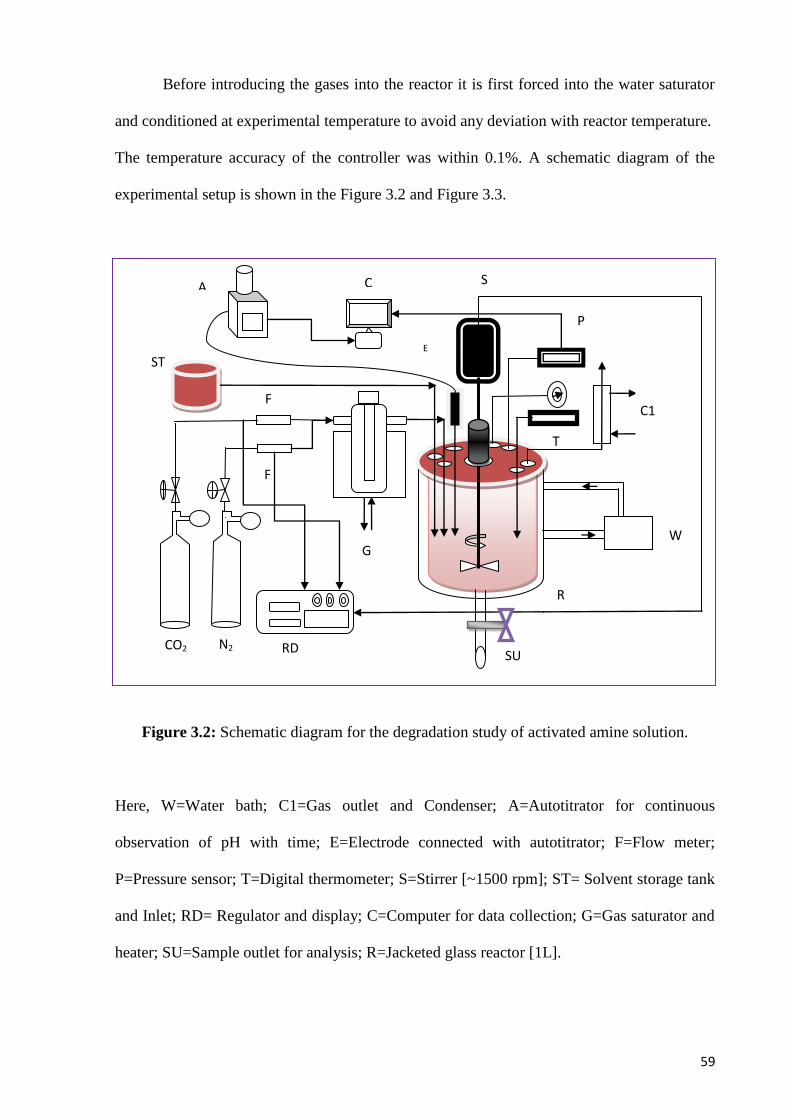
59
Before introducing the gases into the reactor it is first forced into the water saturator
and conditioned at experimental temperature to avoid any deviation with reactor temperature.
The temperature accuracy of the controller was within 0.1%. A schematic diagram of the
experimental setup is shown in the Figure 3.2 and Figure 3.3.
Figure 3.2: Schematic diagram for the degradation study of activated amine solution.
Here, W=Water bath; C1=Gas outlet and Condenser; A=Autotitrator for continuous
observation of pH with time; E=Electrode connected with autotitrator; F=Flow meter;
P=Pressure sensor; T=Digital thermometer; S=Stirrer [~1500 rpm]; ST= Solvent storage tank
and Inlet; RD= Regulator and display; C=Computer for data collection; G=Gas saturator and
heater; SU=Sample outlet for analysis; R=Jacketed glass reactor [1L].
T
C A
T
E
ST
N2 CO2
F
F
W
C1
RD SU
S
P
G
R
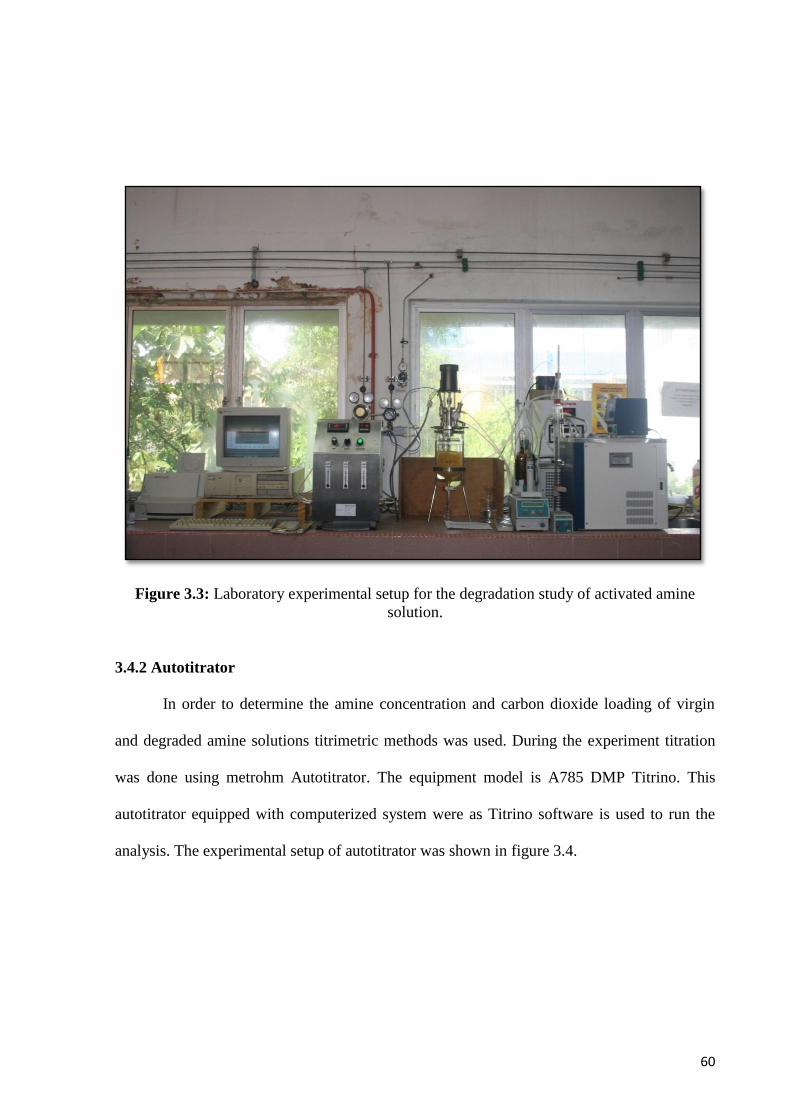
60
Figure 3.3: Laboratory experimental setup for the degradation study of activated amine
solution.
3.4.2 Autotitrator
In order to determine the amine concentration and carbon dioxide loading of virgin
and degraded amine solutions titrimetric methods was used. During the experiment titration
was done using metrohm Autotitrator. The equipment model is A785 DMP Titrino. This
autotitrator equipped with computerized system were as Titrino software is used to run the
analysis. The experimental setup of autotitrator was shown in figure 3.4.

61
Figure 3.4: Metrohm autotitrator setup with Tiamo software
3.4.3 Viscometer
The viscosity was measured using a BROOKFIELD LV SC4-18 viscometer. The
solutions were charged into jacketed vessel that was connected to thermostated bath. The bath
temperature was controlled within (0.1 K) of set temperature with a circulator temperature
controller. A typical view of this viscometer was given in the Figure 3.5.
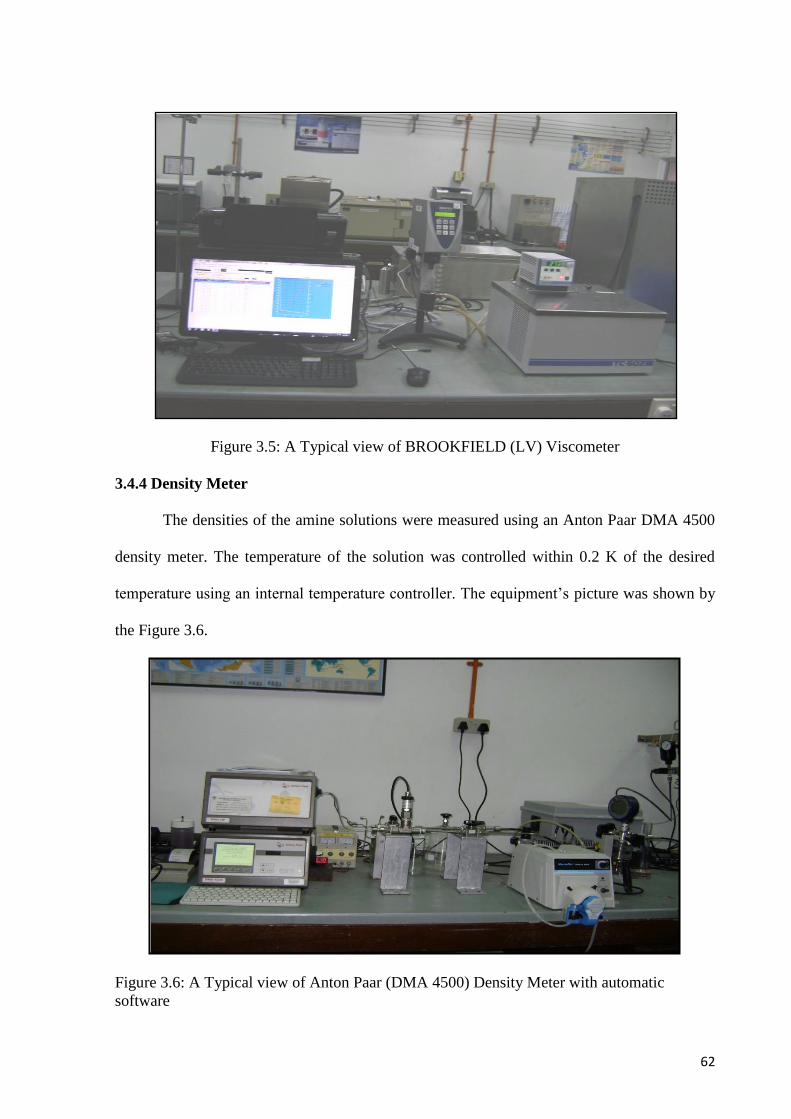
62
Figure 3.5: A Typical view of BROOKFIELD (LV) Viscometer
3.4.4 Density Meter
The densities of the amine solutions were measured using an Anton Paar DMA 4500
density meter. The temperature of the solution was controlled within 0.2 K of the desired
temperature using an internal temperature controller. The equipment‟s picture was shown by
the Figure 3.6.
Figure 3.6: A Typical view of Anton Paar (DMA 4500) Density Meter with automatic
software
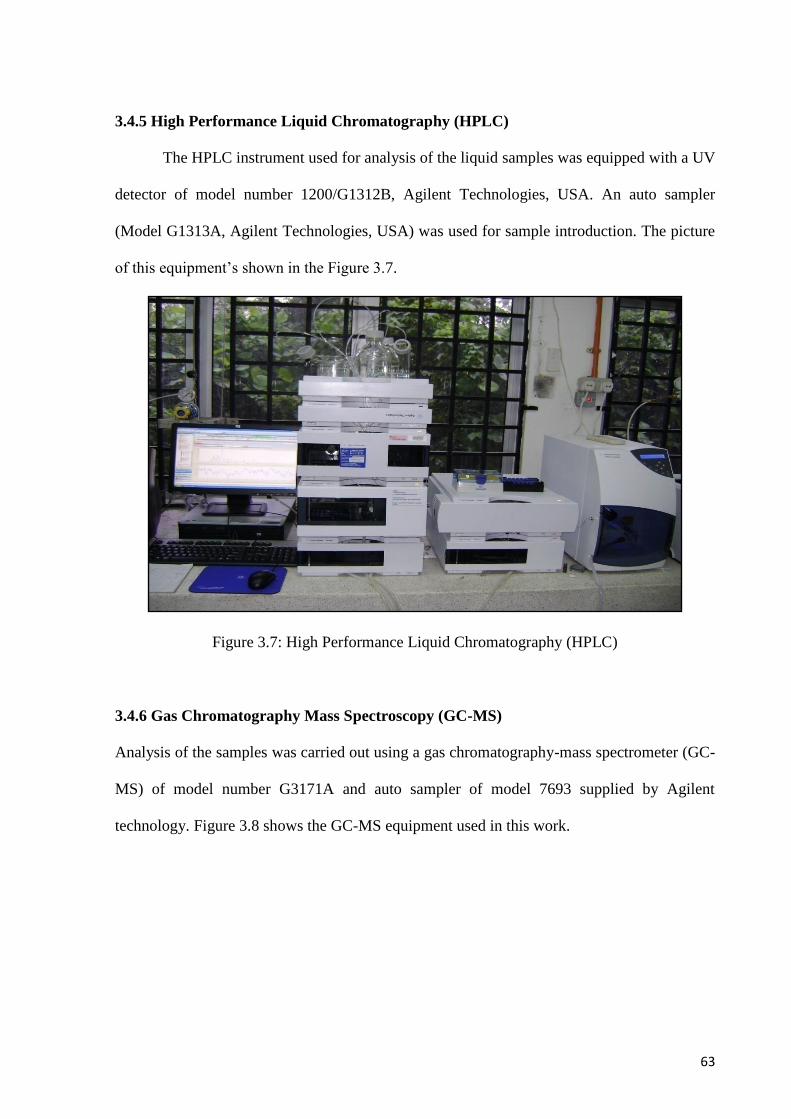
63
3.4.5 High Performance Liquid Chromatography (HPLC)
The HPLC instrument used for analysis of the liquid samples was equipped with a UV
detector of model number 1200/G1312B, Agilent Technologies, USA. An auto sampler
(Model G1313A, Agilent Technologies, USA) was used for sample introduction. The picture
of this equipment‟s shown in the Figure 3.7.
Figure 3.7: High Performance Liquid Chromatography (HPLC)
3.4.6 Gas Chromatography Mass Spectroscopy (GC-MS)
Analysis of the samples was carried out using a gas chromatography-mass spectrometer (GC-
MS) of model number G3171A and auto sampler of model 7693 supplied by Agilent
technology. Figure 3.8 shows the GC-MS equipment used in this work.
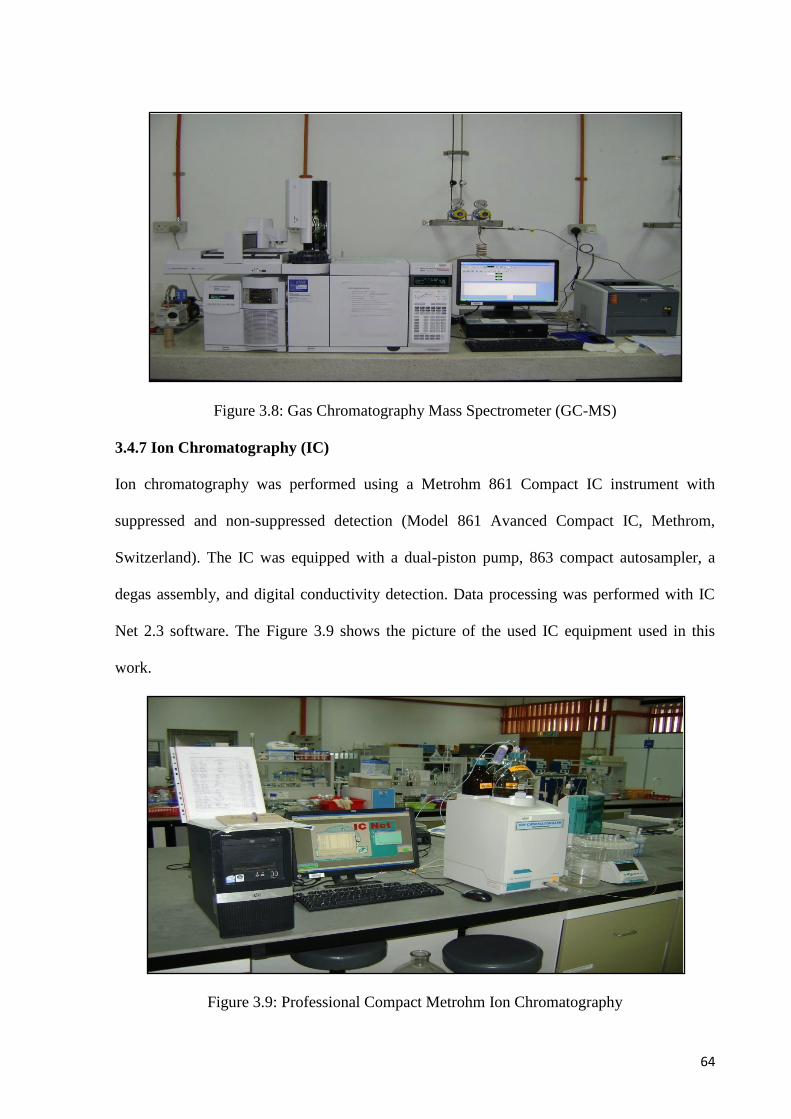
64
Figure 3.8: Gas Chromatography Mass Spectrometer (GC-MS)
3.4.7 Ion Chromatography (IC)
Ion chromatography was performed using a Metrohm 861 Compact IC instrument with
suppressed and non-suppressed detection (Model 861 Avanced Compact IC, Methrom,
Switzerland). The IC was equipped with a dual-piston pump, 863 compact autosampler, a
degas assembly, and digital conductivity detection. Data processing was performed with IC
Net 2.3 software. The Figure 3.9 shows the picture of the used IC equipment used in this
work.
Figure 3.9: Professional Compact Metrohm Ion Chromatography
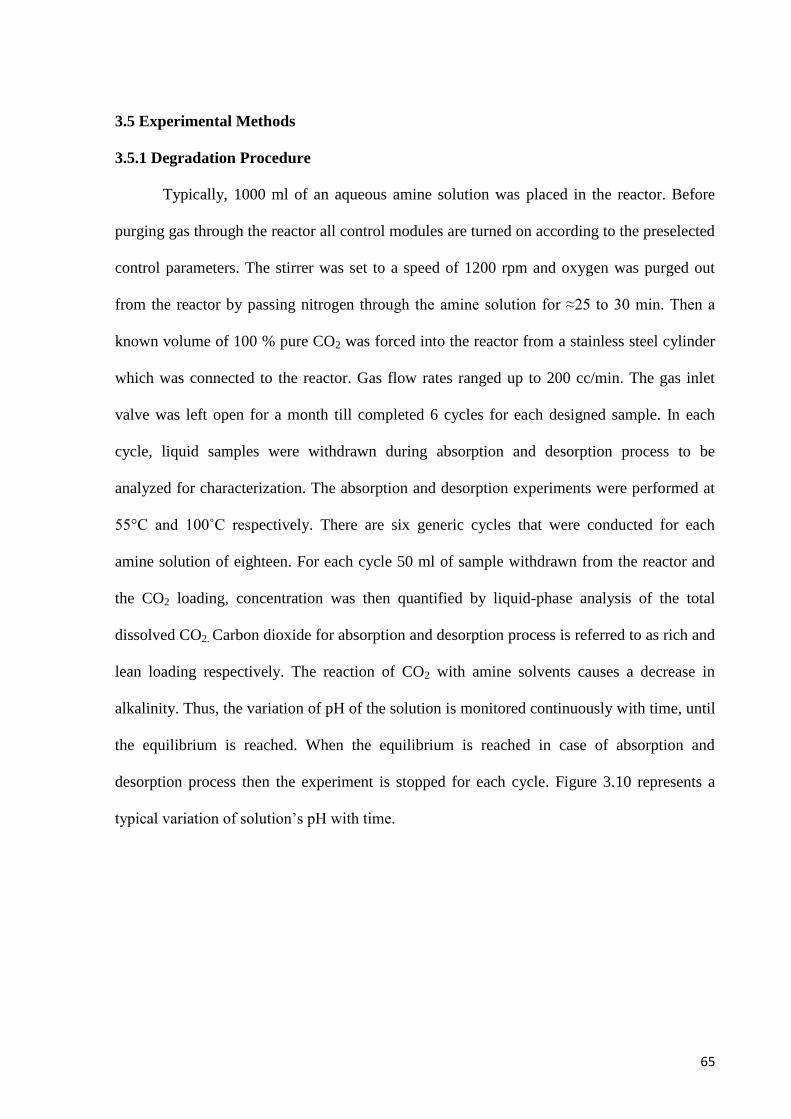
65
3.5 Experimental Methods
3.5.1 Degradation Procedure
Typically, 1000 ml of an aqueous amine solution was placed in the reactor. Before
purging gas through the reactor all control modules are turned on according to the preselected
control parameters. The stirrer was set to a speed of 1200 rpm and oxygen was purged out
from the reactor by passing nitrogen through the amine solution for ≈25 to 30 min. Then a
known volume of 100 % pure CO2 was forced into the reactor from a stainless steel cylinder
which was connected to the reactor. Gas flow rates ranged up to 200 cc/min. The gas inlet
valve was left open for a month till completed 6 cycles for each designed sample. In each
cycle, liquid samples were withdrawn during absorption and desorption process to be
analyzed for characterization. The absorption and desorption experiments were performed at
55°C and 100˚C respectively. There are six generic cycles that were conducted for each
amine solution of eighteen. For each cycle 50 ml of sample withdrawn from the reactor and
the CO2 loading, concentration was then quantified by liquid-phase analysis of the total
dissolved CO2. Carbon dioxide for absorption and desorption process is referred to as rich and
lean loading respectively. The reaction of CO2 with amine solvents causes a decrease in
alkalinity. Thus, the variation of pH of the solution is monitored continuously with time, until
the equilibrium is reached. When the equilibrium is reached in case of absorption and
desorption process then the experiment is stopped for each cycle. Figure 3.10 represents a
typical variation of solution‟s pH with time.
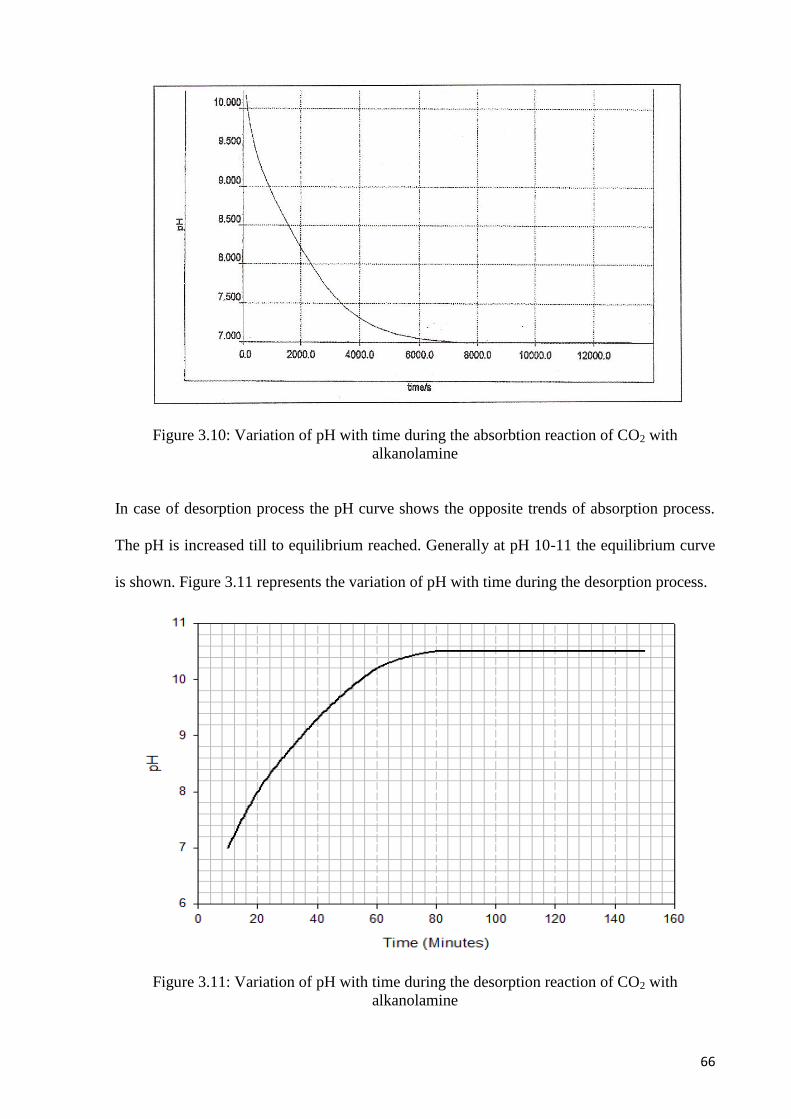
66
Figure 3.10: Variation of pH with time during the absorbtion reaction of CO2 with
alkanolamine
In case of desorption process the pH curve shows the opposite trends of absorption process.
The pH is increased till to equilibrium reached. Generally at pH 10-11 the equilibrium curve
is shown. Figure 3.11 represents the variation of pH with time during the desorption process.
Figure 3.11: Variation of pH with time during the desorption reaction of CO2 with
alkanolamine
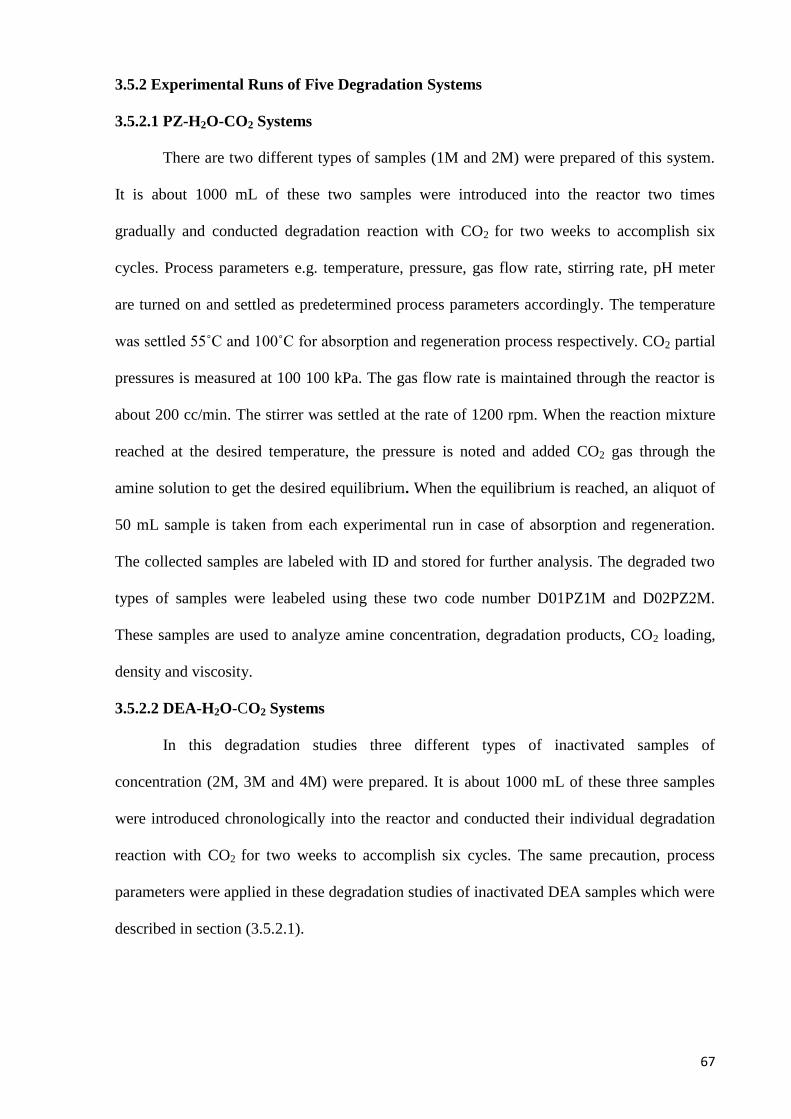
67
3.5.2 Experimental Runs of Five Degradation Systems
3.5.2.1 PZ-H2O-CO2 Systems
There are two different types of samples (1M and 2M) were prepared of this system.
It is about 1000 mL of these two samples were introduced into the reactor two times
gradually and conducted degradation reaction with CO2 for two weeks to accomplish six
cycles. Process parameters e.g. temperature, pressure, gas flow rate, stirring rate, pH meter
are turned on and settled as predetermined process parameters accordingly. The temperature
was settled 55˚C and 100˚C for absorption and regeneration process respectively. CO2 partial
pressures is measured at 100 100 kPa. The gas flow rate is maintained through the reactor is
about 200 cc/min. The stirrer was settled at the rate of 1200 rpm. When the reaction mixture
reached at the desired temperature, the pressure is noted and added CO2 gas through the
amine solution to get the desired equilibrium. When the equilibrium is reached, an aliquot of
50 mL sample is taken from each experimental run in case of absorption and regeneration.
The collected samples are labeled with ID and stored for further analysis. The degraded two
types of samples were leabeled using these two code number D01PZ1M and D02PZ2M.
These samples are used to analyze amine concentration, degradation products, CO2 loading,
density and viscosity.
3.5.2.2 DEA-H2O-CO2 Systems
In this degradation studies three different types of inactivated samples of
concentration (2M, 3M and 4M) were prepared. It is about 1000 mL of these three samples
were introduced chronologically into the reactor and conducted their individual degradation
reaction with CO2 for two weeks to accomplish six cycles. The same precaution, process
parameters were applied in these degradation studies of inactivated DEA samples which were
described in section (3.5.2.1).
68
The degraded reaction samples are collected after definite periods of absorption and
desorption process. The sample was taken at the time of six cycles for each solution‟s and
labeled using these sample codes D03DEA2M, D04DEA3M and D05DEA4M respectively as
mentioned above. Then it was labeled and stored at recommended condition for further
analysis.
3.5.2.3 DEA-PZ-H2O-CO2 Systems
Degradation studies of activated DEA, Five different types of samples were prepared
of this system. The degraded sample‟s codes of this system for five samples are
D06DEA2MPZ1M, D07DEA2MPZ2M, D08DEA3MPZ2M, D09DEA4MPZ2M and
D10DEA7MPZ2M. Typical experimental run ID is D06, D07, D08, D09 and D10 for the
above mentioned samples. The same experimental procedure and parameters were applied
during the degradation study of activated diethanolamine (DEA) solution. Degraded solutions
are used for further analysis like IC, GC-MS and HPLC in order to detect occurred
degradation products.
3.5.2.4 MDEA-H2O-CO2 Systems
In this degradation system three different types of inactivated samples were prepared.
It is about 1000 mL of these three samples were introduced chronologically into the reactor
and conducted their individual degradation reaction with CO2 for two weeks to accomplish
six cycles. The same precaution, process parameters are applied in these degradation studies
of inactivated MDEA samples which explained in the above section (3.5.2.1). Finally
degraded samples were labeled and stored for further chromatographic analysis in order to
characterize DGPs. Sample labeling was done using using these codes i.e. D11MDEA2M,
D12MDEA3M and D13MDEA4M.
69
3.5.2.5 MDEA-PZ-H2O-CO2 Systems
Degradation studies of activated MDEA, Five different types of samples were
prepared of this system. The each solution is degraded and after degradation samples are
labeled using these code numbers i.e. D14MDEA2MPZ1M, D15MDEA2MPZ2M,
D16MDEA3MPZ2M, D17MDEA4MPZ2M and D18MDEA7MPZ2M. Typical experimental runs
ID numbers for these five samples are D14, D15, D16, D17 and D18 for the above mentioned
samples. During the degradation study the same experimental procedure and parameters were
applied as explained above. The resultant degraded solutions were used for further analysis
like IC, GC-MS and HPLC to detect occurred degradation products.
3.5.2.6 Labeling of Degraded Reaction Sample
In this entire study there are eighteen typical experimental runs (D01-D18) were
conducted during degradation experiment for eighteen different concentrated solutions of five
degradation systems. After degradation all samples were leveled using given code numbers
which shown in the Table 3.1. Each degraded sample was analyzed inorder to get information
regarding DGPs and physical properties like density, viscosity, carbon dioxide loading and
concentration etc were also investigated.
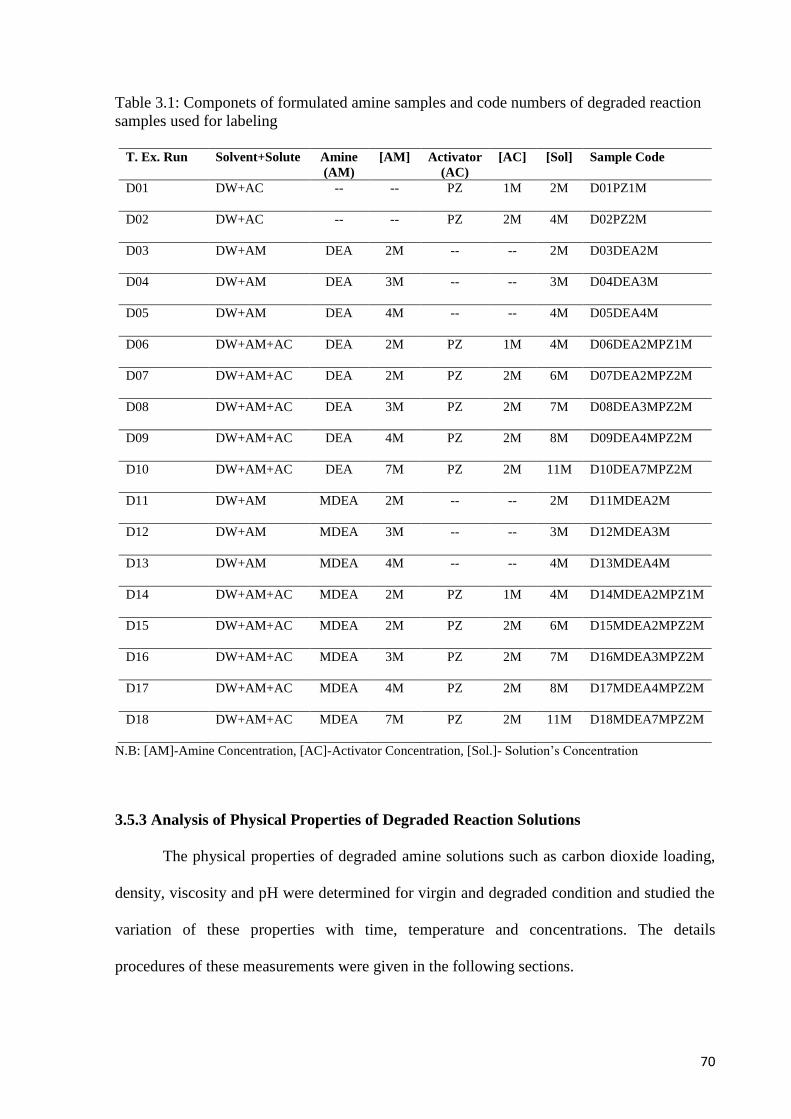
70
Table 3.1: Componets of formulated amine samples and code numbers of degraded reaction
samples used for labeling
T. Ex. Run Solvent+Solute Amine
(AM)
[AM] Activator
(AC)
[AC] [Sol] Sample Code
D01 DW+AC -- -- PZ 1M 2M D01PZ1M
D02 DW+AC -- -- PZ 2M 4M D02PZ2M
D03 DW+AM DEA 2M -- -- 2M D03DEA2M
D04 DW+AM DEA 3M -- -- 3M D04DEA3M
D05 DW+AM DEA 4M -- -- 4M D05DEA4M
D06 DW+AM+AC DEA 2M PZ 1M 4M D06DEA2MPZ1M
D07 DW+AM+AC DEA 2M PZ 2M 6M D07DEA2MPZ2M
D08 DW+AM+AC DEA 3M PZ 2M 7M D08DEA3MPZ2M
D09 DW+AM+AC DEA 4M PZ 2M 8M D09DEA4MPZ2M
D10 DW+AM+AC DEA 7M PZ 2M 11M D10DEA7MPZ2M
D11 DW+AM MDEA 2M -- -- 2M D11MDEA2M
D12 DW+AM MDEA 3M -- -- 3M D12MDEA3M
D13 DW+AM MDEA 4M -- -- 4M D13MDEA4M
D14 DW+AM+AC MDEA 2M PZ 1M 4M D14MDEA2MPZ1M
D15 DW+AM+AC MDEA 2M PZ 2M 6M D15MDEA2MPZ2M
D16 DW+AM+AC MDEA 3M PZ 2M 7M D16MDEA3MPZ2M
D17 DW+AM+AC MDEA 4M PZ 2M 8M D17MDEA4MPZ2M
D18 DW+AM+AC MDEA 7M PZ 2M 11M D18MDEA7MPZ2M
N.B: [AM]-Amine Concentration, [AC]-Activator Concentration, [Sol.]- Solution‟s Concentration
3.5.3 Analysis of Physical Properties of Degraded Reaction Solutions
The physical properties of degraded amine solutions such as carbon dioxide loading,
density, viscosity and pH were determined for virgin and degraded condition and studied the
variation of these properties with time, temperature and concentrations. The details
procedures of these measurements were given in the following sections.
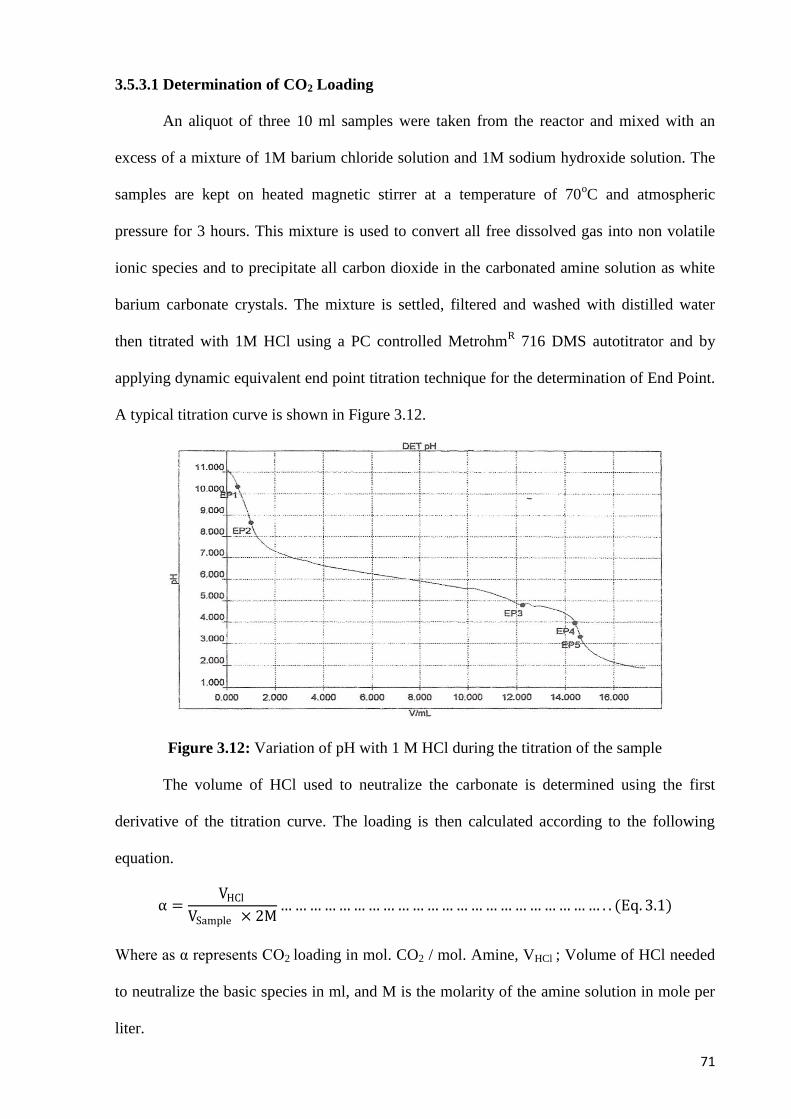
71
3.5.3.1 Determination of CO2 Loading
An aliquot of three 10 ml samples were taken from the reactor and mixed with an
excess of a mixture of 1M barium chloride solution and 1M sodium hydroxide solution. The
samples are kept on heated magnetic stirrer at a temperature of 70oC and atmospheric
pressure for 3 hours. This mixture is used to convert all free dissolved gas into non volatile
ionic species and to precipitate all carbon dioxide in the carbonated amine solution as white
barium carbonate crystals. The mixture is settled, filtered and washed with distilled water
then titrated with 1M HCl using a PC controlled MetrohmR 716 DMS autotitrator and by
applying dynamic equivalent end point titration technique for the determination of End Point.
A typical titration curve is shown in Figure 3.12.
Figure 3.12: Variation of pH with 1 M HCl during the titration of the sample
The volume of HCl used to neutralize the carbonate is determined using the first
derivative of the titration curve. The loading is then calculated according to the following
equation.
α =VHCl
VSample × 2M………………………………………………………… . . (Eq. 3.1)
Where as α represents CO2 loading in mol. CO2 / mol. Amine, VHCl ; Volume of HCl needed
to neutralize the basic species in ml, and M is the molarity of the amine solution in mole per
liter.
72
3.5.3.2 Determination of Amine Concentration
In the beginning of the experiment during the preparation of amine sample all
prepared samples which are given in the Table 3.2, their concentrations were determined
using the Metrohm autotitrator. At the end of the each typical experimental run an aliquot
sample of 10 ml of carbonated amine is titrated with 1 M HCl to check on the final amine
concentration. It is noted that high concentration amine samples are titrated using 2M
standard HCl solution during the analysis.
3.5.3.3 Determination of Solution Viscosity
The Brookfield DV-II+ Pro EXTRA viscometer measures fluid viscosity at given
shear rates. It is configured with Brookfield software, Rheocalc V3.2 which is controlled by
the computer. This viscometer is also set to the external control mode to allow for proper
communication with Rheocalc. To control the temperature it is configured with digital bath
system which model is TC-502. The used spindle model is 13RP which is adjusted with the
viscometer with right speed and time. The speed is given LV commend during measurement.
To get the automatic printed results a printer is also connected with this computing system.
During the measurement of viscosity the viscometer is put on the stand tightly and then RTD
probe is connected to the socket on the rear panel of the DV-II+ Pro EXTRA. The
Viscometer must be leveled during setting. The level is adjusted using the two leveling
screws on the base. Adjustment is done so that the bubble level on top of the viscometer is
centered within the circle.
After that the red shipping cap is removed which covers the EZ-Lock spindle chuck
on the Viscometer. During the setting period, AC power switch is turned OFF, after that the
power cord is connected to the socket and plug into the appropriate AC line. After installing
every part of the viscometer the power switch is turned to the ON position and allowed to
warm up for 10 minutes before performing auto zero.
73
When the machine is ready to use, about 5-6 ml amine samples are taken into the
sample chamber and put the spindle into the chamber in such a way that no sample is over
flooded. The sample chamber is adjusted with stand and click on the Rheocalc V3.2 software
icon and press start then automatically the measured viscosity is displayed which is noted and
recorded for information.
3.5.3.4 Determination of Solution Density
Anton Paar DMA 4500 is a digital density meter, which configured with a printer and
pump to inject the sample in to the measuring cell/chamber of the equipments. It is also
configured with a temperature controller, in order to measure the density at different
temperature. This test is conducted under normal atmospheric pressure. During the
measurement of solution‟s density, amine samples are filled about 8 to 10 mm below the rim
and place them into the magazine, starting at position 1. The special Teflon cover is then
placed with a hole in the center onto the filled amine sample vials. The magazine is turned to
the zero position by pressing the "0" key. Press the "START" key at the SP-1m. After
pressing the "START" key the magazine is turned to the first vial. When the last vial is filled
then the magazine is automatically turned to zero position. The measuring procedure is
interrupted by pressing the "STOP" key at the SP-1m in any time during test. After pressing
the "START" key, the measuring procedure is continued at the following vial.
A printer is activated and connected to the DMA 4500 density meter, a printout is
occurred after each sample has been measured. The printed results are noted and recorded for
information. Some precautions are maintained in this test analysis i.e. no empty sample is put
in the magazine and no sample is left in the measuring cell, while the SP-1m is not in
operation.
74
3.5.4 Chromatographic Analysis of Degraded Reaction Sample
3.5.4.1 Ion Chromatography (IC)
Three different modes of chromatography (anion exchange, cation exchange and ion
exclusion) were used in this investigation which simply relate to the different types of
columns used to achieve the separation of the ions. The eluent used depends on the column
type and also the mode of detection.
3.5.4.1.1 Anion Exchange Chromatograpgy
In anionic ion chromatographic method (AICM) before analyze samples the
equipment is properly connected with tubing and installing the column. To prevent the
analytical column from high pressure a gurad column is also installed through the system.
The analytical column and guard column of this method are used Metrosep A Supp 5 150/4.0
(6. 1006. 520) and Metrosep A Supp. 4/5 Guard (6. 1006. 500). Both columns are installed
without any conditioning generally operated at ambient temperature. After completing the IC
instrumental setup according to AICM then it is turn on and switch on the computer and open
IC net 2.3 software icone. Inorder to remove air bubble and old eluent from the instruments
and aspirating tubing the system is flashed with UPW for 40 minutes. The required amount of
eluent of concentration 0.1M is prepared from a mixture of Na2CO3 and NaHCO3 using UPW
on daily basis. Then 100mM H2SO4 solution was prepared for suppression regeneration.
After flashing, the eluents and suppression solutions are transferred into the tubing bottles
and set on the right position of IC. The IC machine is kept turn on for 45 to 1 hour till to get
desired flow rate, conductivity and operating pressure which are given in the table 3.2.
Degraded amine solutions are diluated using UPW with diluation ratio 1:40 (amine:water)
and filtrated by 0.2 µm PTF filter. Then filtrated solutions are filled in IC vials and labelled
according to the sample code number as well as arrange in the autosampler. This is
mentioned that during the sample arrangement into the autosampler tray first and last four
samples vials must be filled by UPW.
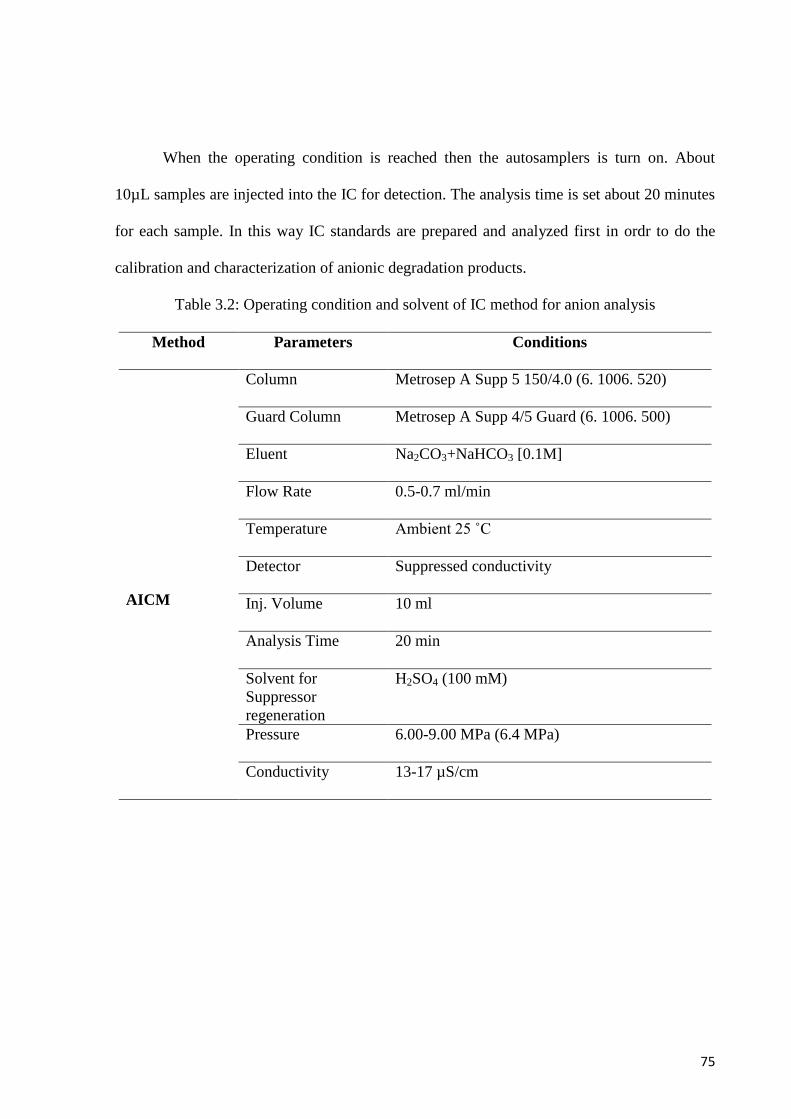
75
When the operating condition is reached then the autosamplers is turn on. About
10µL samples are injected into the IC for detection. The analysis time is set about 20 minutes
for each sample. In this way IC standards are prepared and analyzed first in ordr to do the
calibration and characterization of anionic degradation products.
Table 3.2: Operating condition and solvent of IC method for anion analysis
Method Parameters Conditions
AICM
Column Metrosep A Supp 5 150/4.0 (6. 1006. 520)
Guard Column Metrosep A Supp 4/5 Guard (6. 1006. 500)
Eluent Na2CO3+NaHCO3 [0.1M]
Flow Rate 0.5-0.7 ml/min
Temperature Ambient 25 ˚C
Detector Suppressed conductivity
Inj. Volume 10 ml
Analysis Time 20 min
Solvent for
Suppressor
regeneration
H2SO4 (100 mM)
Pressure 6.00-9.00 MPa (6.4 MPa)
Conductivity 13-17 µS/cm

76
3.5.4.1.2 Cation Exchange Chromatography
Cation analyses were carried out using the same IC equipment. CICM is a non
suppression detection process. Priror to analysis analytical columns are properly installed and
eluent is prepared. The eluent is used in ths method is a mixture of 1.7 mM HNO3 + 0.7 mM
dipicolinic acid. Since this method is a non suppression method so no solvent is used for
suppression regeneration. The analytical column and guard column of this method are used
Metrosep C Supp 4 150/4.0 (6. 1050. 420) and Metrosep C4 Guard (6.1050.500) respectively.
Both columns do not need conditioning operated at ambient temperature. Priror to start
analysis make sure that the equipment is properly connected with aspirating tubing and
installing the column without leakage. After completing the IC instrumental setup according
to CICM then it is turned on and switch on the computer and open IC net 2.3 software icon.
In order to remove air bubble and old eluent from instruments and aspirating tubing it is
flashed with UPW for 40 minutes. After flashing, the eluents is transferred into the tubing
bottles and set to the right position of IC. The IC machine is kept turn on for 45 to 1 hour to
get desired flow rate, conductivity and operating pressure which are given in the table 3.3. It
takes normally one and half hours for stabilizing and adapting the IC equipments to run the
sample. The sample preparation and typical experimental run are the same as AICM.
Degraded amine solutions are diluted using UPW with diluation ratio 1:40 (amine: water) and
it is filtred by 0.2 µm nylon filter. Then filtrated solutions are filled in IC vials and lebelled
with sample code number and arrange in autosampler. This is mentioned that during the
sample arrangement into the autosampler tray first two and last two must be filled by UPW.
When the all operating condition is reached then autosampler is turned on and about 10µL
samples are injected into the IC for detection. The analysis time is set about 20 minutus for
each sample. During the sample analysis standards are run at first and calibrated then amine
samples are analyzed to detect cationic species.
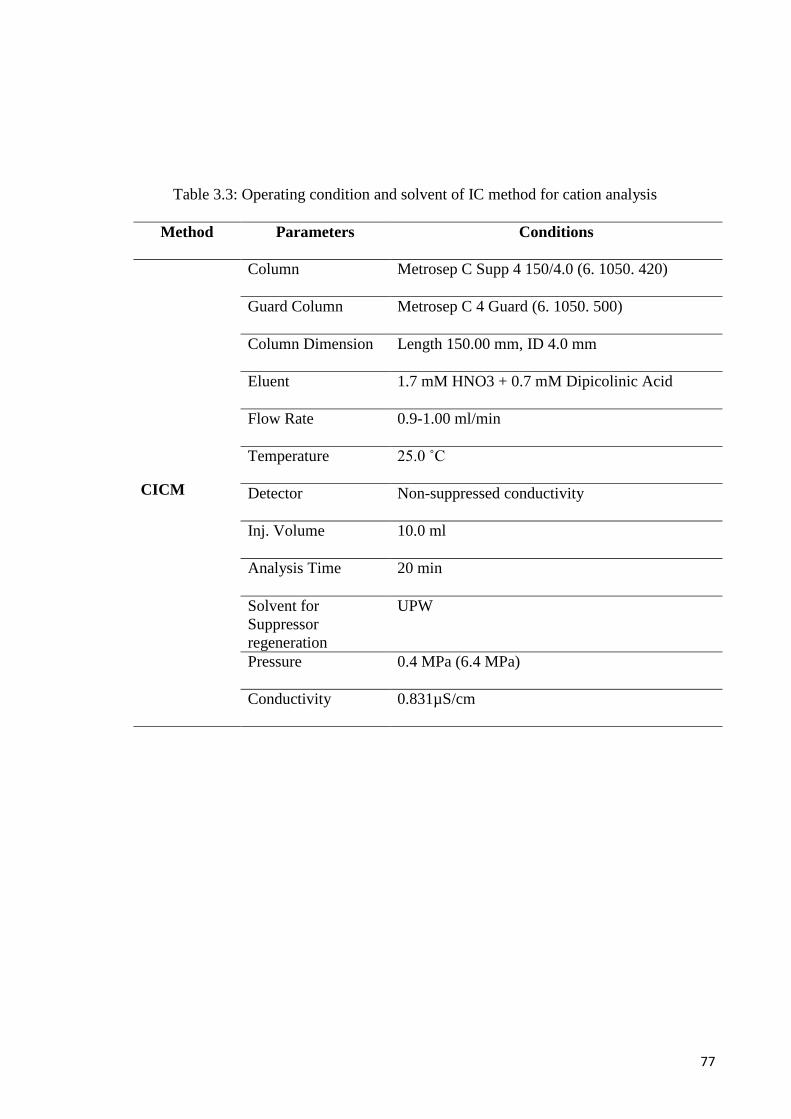
77
Table 3.3: Operating condition and solvent of IC method for cation analysis
Method Parameters Conditions
CICM
Column Metrosep C Supp 4 150/4.0 (6. 1050. 420)
Guard Column Metrosep C 4 Guard (6. 1050. 500)
Column Dimension Length 150.00 mm, ID 4.0 mm
Eluent 1.7 mM HNO3 + 0.7 mM Dipicolinic Acid
Flow Rate 0.9-1.00 ml/min
Temperature 25.0 ˚C
Detector Non-suppressed conductivity
Inj. Volume 10.0 ml
Analysis Time 20 min
Solvent for
Suppressor
regeneration
UPW
Pressure 0.4 MPa (6.4 MPa)
Conductivity 0.831µS/cm
78
3.5.4.1.3 Ion Exclusion Chromatography (IEC)
Ion exclusion chromatography (IEC) is mainly used for the separation of weak acids
or bases. The greatest importance of IEC is for the analysis of weak acids such as carboxylic
acids, carbohydrates, phenols or amino acids. In this experiment carboxylic acids are mainly
investigated using the same IC equipments. Metrosep Organic Acids (6.1005.200) analytical
column of dimention length 250 mm and ID 17.8 mm is used. To protect this column from
high pressure and liquid flow a guard column Metrosep Organic Acids Guard (6.1005.250) is
used. Priror to the analysis both columns are installed and the eluent 0.5 × 10⁻³
M H2SO4 is
prepared. Since OICM is suppression detection method so 0.01 M LiCl is also prepared as
suppression regeneration solvent. When the aspirating tubing system, column installation,
regeneration solvent preparation and elution preparation are completed then IC machine and
computer is turn on. Then IC net 2.3 software is opened and given proper commend for
flasing and analysis successively. In order to remove air bubble and eluents from previous
user through the aspirating column the whole system is flashed for 40 minutes using UPW.
After flashing, the eluents and suppression solvent placed in the respective solvent bottle and
connected with tubing. In order to start the sample analysis the system is required to be
stabilized. The stabilization is done followed by desired conductivity, pressure and solvent
flow rate which are given in the table 3.4. In this purpose the system is turn on for one and
half hour. When the desired condition for stabilization is reached then the sample analysis is
started. The sample preparation and analysis are same for all chromatographic system other
than operating condition, analytical column and stabilization condition. The sample injects
volume and analysis times are also same as with AICM and CICM.
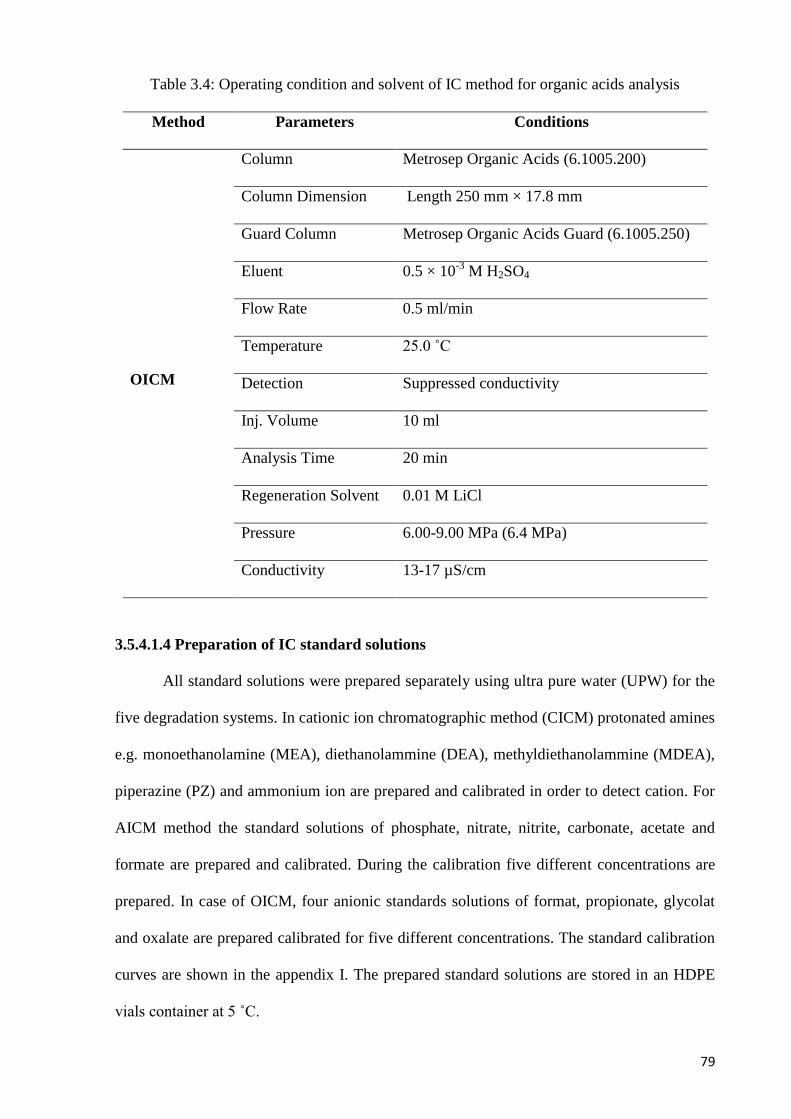
79
Table 3.4: Operating condition and solvent of IC method for organic acids analysis
Method Parameters Conditions
OICM
Column Metrosep Organic Acids (6.1005.200)
Column Dimension Length 250 mm × 17.8 mm
Guard Column Metrosep Organic Acids Guard (6.1005.250)
Eluent 0.5 × 10⁻³
M H2SO4
Flow Rate 0.5 ml/min
Temperature 25.0 ˚C
Detection Suppressed conductivity
Inj. Volume 10 ml
Analysis Time 20 min
Regeneration Solvent 0.01 M LiCl
Pressure 6.00-9.00 MPa (6.4 MPa)
Conductivity 13-17 µS/cm
3.5.4.1.4 Preparation of IC standard solutions
All standard solutions were prepared separately using ultra pure water (UPW) for the
five degradation systems. In cationic ion chromatographic method (CICM) protonated amines
e.g. monoethanolamine (MEA), diethanolammine (DEA), methyldiethanolammine (MDEA),
piperazine (PZ) and ammonium ion are prepared and calibrated in order to detect cation. For
AICM method the standard solutions of phosphate, nitrate, nitrite, carbonate, acetate and
formate are prepared and calibrated. During the calibration five different concentrations are
prepared. In case of OICM, four anionic standards solutions of format, propionate, glycolat
and oxalate are prepared calibrated for five different concentrations. The standard calibration
curves are shown in the appendix I. The prepared standard solutions are stored in an HDPE
vials container at 5 ˚C.
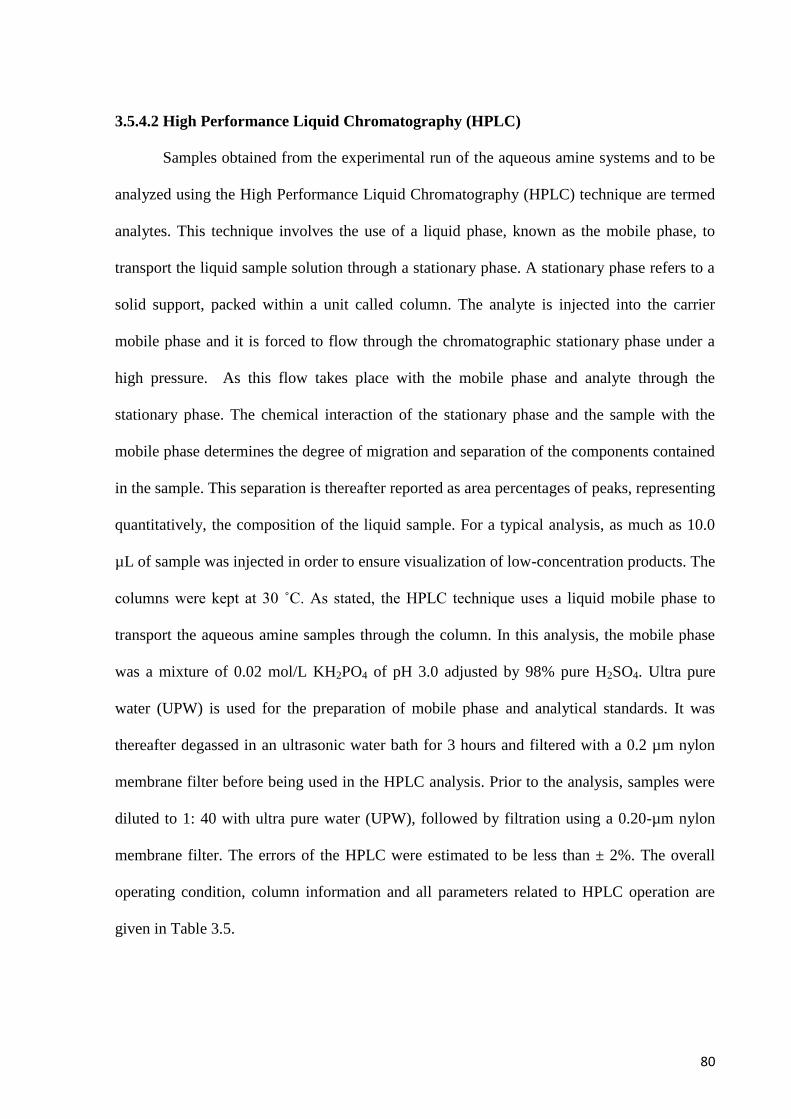
80
3.5.4.2 High Performance Liquid Chromatography (HPLC)
Samples obtained from the experimental run of the aqueous amine systems and to be
analyzed using the High Performance Liquid Chromatography (HPLC) technique are termed
analytes. This technique involves the use of a liquid phase, known as the mobile phase, to
transport the liquid sample solution through a stationary phase. A stationary phase refers to a
solid support, packed within a unit called column. The analyte is injected into the carrier
mobile phase and it is forced to flow through the chromatographic stationary phase under a
high pressure. As this flow takes place with the mobile phase and analyte through the
stationary phase. The chemical interaction of the stationary phase and the sample with the
mobile phase determines the degree of migration and separation of the components contained
in the sample. This separation is thereafter reported as area percentages of peaks, representing
quantitatively, the composition of the liquid sample. For a typical analysis, as much as 10.0
µL of sample was injected in order to ensure visualization of low-concentration products. The
columns were kept at 30 ˚C. As stated, the HPLC technique uses a liquid mobile phase to
transport the aqueous amine samples through the column. In this analysis, the mobile phase
was a mixture of 0.02 mol/L KH2PO4 of pH 3.0 adjusted by 98% pure H2SO4. Ultra pure
water (UPW) is used for the preparation of mobile phase and analytical standards. It was
thereafter degassed in an ultrasonic water bath for 3 hours and filtered with a 0.2 µm nylon
membrane filter before being used in the HPLC analysis. Prior to the analysis, samples were
diluted to 1: 40 with ultra pure water (UPW), followed by filtration using a 0.20-µm nylon
membrane filter. The errors of the HPLC were estimated to be less than ± 2%. The overall
operating condition, column information and all parameters related to HPLC operation are
given in Table 3.5.
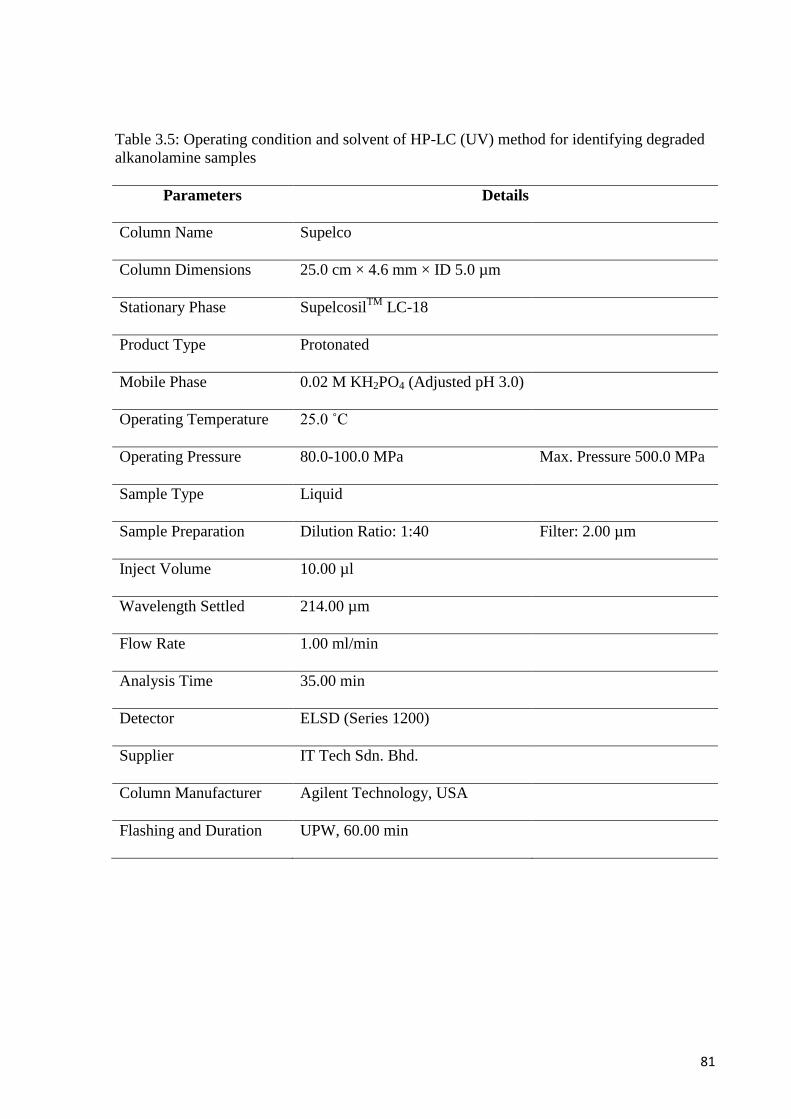
81
Table 3.5: Operating condition and solvent of HP-LC (UV) method for identifying degraded
alkanolamine samples
Parameters Details
Column Name Supelco
Column Dimensions 25.0 cm × 4.6 mm × ID 5.0 µm
Stationary Phase SupelcosilTM
LC-18
Product Type Protonated
Mobile Phase 0.02 M KH2PO4 (Adjusted pH 3.0)
Operating Temperature 25.0 ˚C
Operating Pressure 80.0-100.0 MPa Max. Pressure 500.0 MPa
Sample Type Liquid
Sample Preparation Dilution Ratio: 1:40 Filter: 2.00 µm
Inject Volume 10.00 µl
Wavelength Settled 214.00 µm
Flow Rate 1.00 ml/min
Analysis Time 35.00 min
Detector ELSD (Series 1200)
Supplier IT Tech Sdn. Bhd.
Column Manufacturer Agilent Technology, USA
Flashing and Duration UPW, 60.00 min
82
3.5.4.3 Gas Chromatography Mass Spectrometer (GC-MS)
An HP-INNOWAX (length 30 m, internal diameter 0.250 mm, thickness 0.25 µm)
packed with cross-linked polyethylene glycol was used in the GC-MS for the separation of
components. These components were identified by their mass spectra. Prior to GC/MS
analysis, each sample was diluted with ethanol to five times its original volume to avoid
column overload and to improve separation of the components. An auto injector was used to
automatically introduce samples into the GC column to give better reproducibility. Computer
fitting of the mass spectrum to the mass spectra database was part of the strategy used to
identify the samples. This was followed by the database of GCMS library in order to confirm
the identification of the components in the samples. MS scan mode was used with a mass
range from 10 to 300. The products were identified by matching their mass spectra with
commercial mass spectra of the National Institute of Standards and Technology (NIST)
database (1998 version). The samples were analyzed twice to check for reproducibility. A
matching technique that compared the mass spectra of the GC-separated components with the
NIST database was used for the initial product identification. Verification of some of the
species was subsequently performed by comparing both the mass spectra and the GC
retention time of commercially available pure standards with those of the initially identified
components. However, after certain period of degradation reaction, a large number of
degradation products are observed. The error of the GC/MS was estimated to be less than 3%.
During analysis period a 10 µL syringe with an injection volume of 1.0 µL was used and a
split mode was selected for the inlet with a split ratio of 30:1, split flow of 10.3 mL/min and
total flow of 13.9 mL/min. The inlet temperature and pressure were 70°C and 9.18 psi,
respectively. The initial temperature of the oven was 100°C with no holding time while the
final temperature was 240 °C with a hold time of 10 min with an oven ramp of 10 °C/min for
a total run time of 30 min.
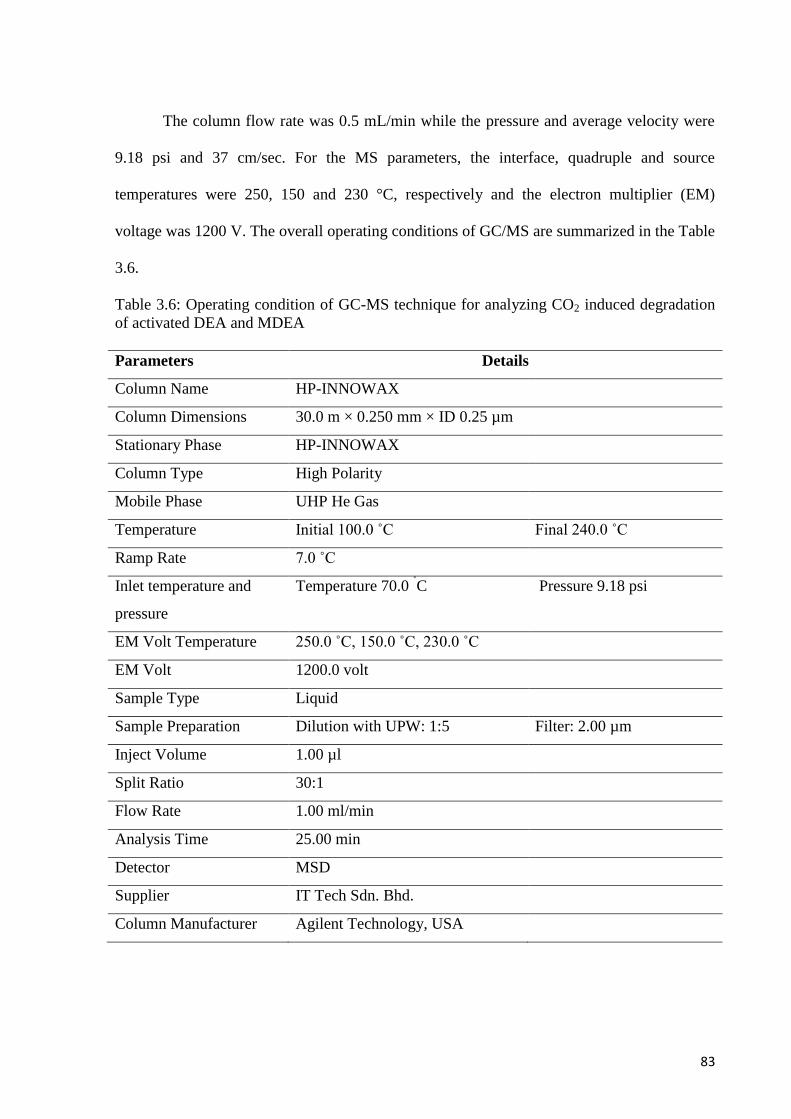
83
The column flow rate was 0.5 mL/min while the pressure and average velocity were
9.18 psi and 37 cm/sec. For the MS parameters, the interface, quadruple and source
temperatures were 250, 150 and 230 °C, respectively and the electron multiplier (EM)
voltage was 1200 V. The overall operating conditions of GC/MS are summarized in the Table
3.6.
Table 3.6: Operating condition of GC-MS technique for analyzing CO2 induced degradation
of activated DEA and MDEA
Parameters Details
Column Name HP-INNOWAX
Column Dimensions 30.0 m × 0.250 mm × ID 0.25 µm
Stationary Phase HP-INNOWAX
Column Type High Polarity
Mobile Phase UHP He Gas
Temperature Initial 100.0 ˚C Final 240.0 ˚C
Ramp Rate 7.0 ˚C
Inlet temperature and
pressure
Temperature 70.0 ˚C Pressure 9.18 psi
EM Volt Temperature 250.0 ˚C, 150.0 ˚C, 230.0 ˚C
EM Volt 1200.0 volt
Sample Type Liquid
Sample Preparation Dilution with UPW: 1:5 Filter: 2.00 µm
Inject Volume 1.00 µl
Split Ratio 30:1
Flow Rate 1.00 ml/min
Analysis Time 25.00 min
Detector MSD
Supplier IT Tech Sdn. Bhd.
Column Manufacturer Agilent Technology, USA
84
RESULTS AND DISCUSSION
CHAPTER 04

85
CHAPTER 04: RESULTS AND DISCUSSION
The characterization of degradation products of the five degradation systems for eighteen
different samples were conducted using three different chromatographic methods, High
Performance Liquid Chromatography-UV detection (HPLC-UV), Ion Chromatography (IC)
and Gas Chromatography Mass Spectroscopy (GCMS). In this chapter degradation products
of five degradation systems are discussed.
4.1 High Performance Liquid Chromatography (HPLC) Analysis with UV Detection
The initial trials were to evaluate the compatibility of the DB-WAX and Nucleosil
columns with the mobile phases used for this study is potassium dihydrogen phosphate.
Among these columns DB-WAX does not show sharp peaks during the analysis but the
Nucleosil column showed sharp peaks. Based on result between two methods Nucleosil
HPLC column and potassium dihydrogen phosphate mobile phase were selected for analysis.
During the analysis two retention times was used for low and high concentration solution.
The time was set to 25 and 35 minutes for low and high concentrated sample respectively.
The unknown degradation products were identified based on standard verification by
matching with specific retention time. There are fourty different standards including pure
alkanlamines. For each individual standard solution concentration 5.00 ppm/Liter was
prepared and retention time was noted, in this way forty standards are prepared and retention
time noted for experimental analysis. Similarly the degraded reaction samples were diluted
with UPW according to the same method and retention time was noted. The unknown
degradation products were identified based on the retention time.
86
4.1.1 Degradation Products of PZ/H2O/CO2 System
The degradation products of PZ+H2O+CO2 system are summarized in the following Table
4.1 for two different concentrations of samples are DO1PZ1M and D02PZ2M at 100 ˚C.
Figures 4.1 (a, b) and 4.2 illustrate the chromatograms of D01PZ1M and DO2PZ2M samples
respectively.
4.1.1.1 Degradation Products of D01PZ1M Sample
The sample D01PZ1M constits of 1M carbonated aqueous piperazine. There are five peaks
observed in the chromatogram where as two peaks are identified. Peak number three is
formamide and peak number five is 2-(2-aminoethoxy)-ethanol, it is also called
diglycolamine (DGA). Freeman et al. in 2009 studied the degradation behavior of PZ induced
by gas mixture (CO2+O2) and found formamide as a degradation product. Sexton conducted
an experiment on the degradation behavior of PZ by a mixture of two gases CO2 and O2 and
found formamide as degradation products too (Sexton, 2008).
The same sample D01PZ1M is analyzed two times. First time it was analyzed for twenty
minutes and second time it was analyzed for thirty five minutes. There are eight peaks were
found in the chromatogram, however only three peaks were identified. One additional DGP is
detected in this method which is 2-methoxyethanol (peak number five). Other two identified
DGPs are similar with the identified DGPs found in the figure 4.1a. The identified
degradation products are formamide, 2-methoxyethanol and 2-(2-aminoethoxy) ethanol.
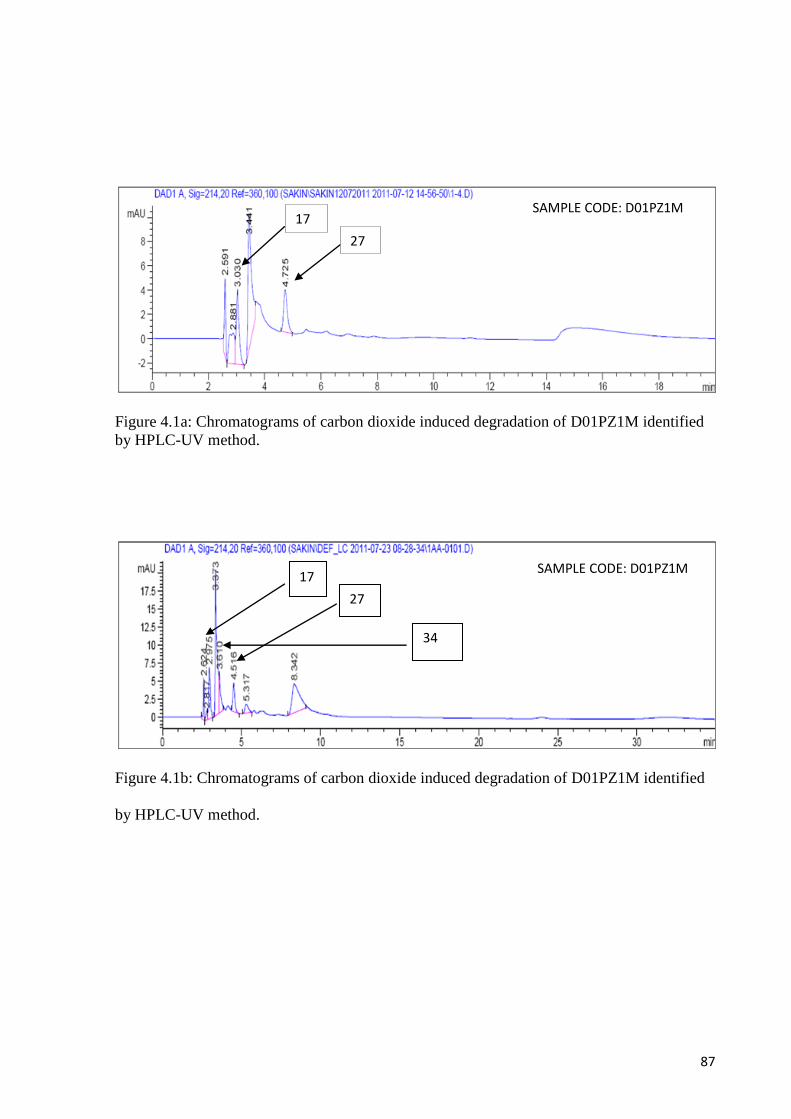
87
Figure 4.1a: Chromatograms of carbon dioxide induced degradation of D01PZ1M identified
by HPLC-UV method.
Figure 4.1b: Chromatograms of carbon dioxide induced degradation of D01PZ1M identified
by HPLC-UV method.
SAMPLE CODE: D01PZ1M 17
27
SAMPLE CODE: D01PZ1M 17
27
34
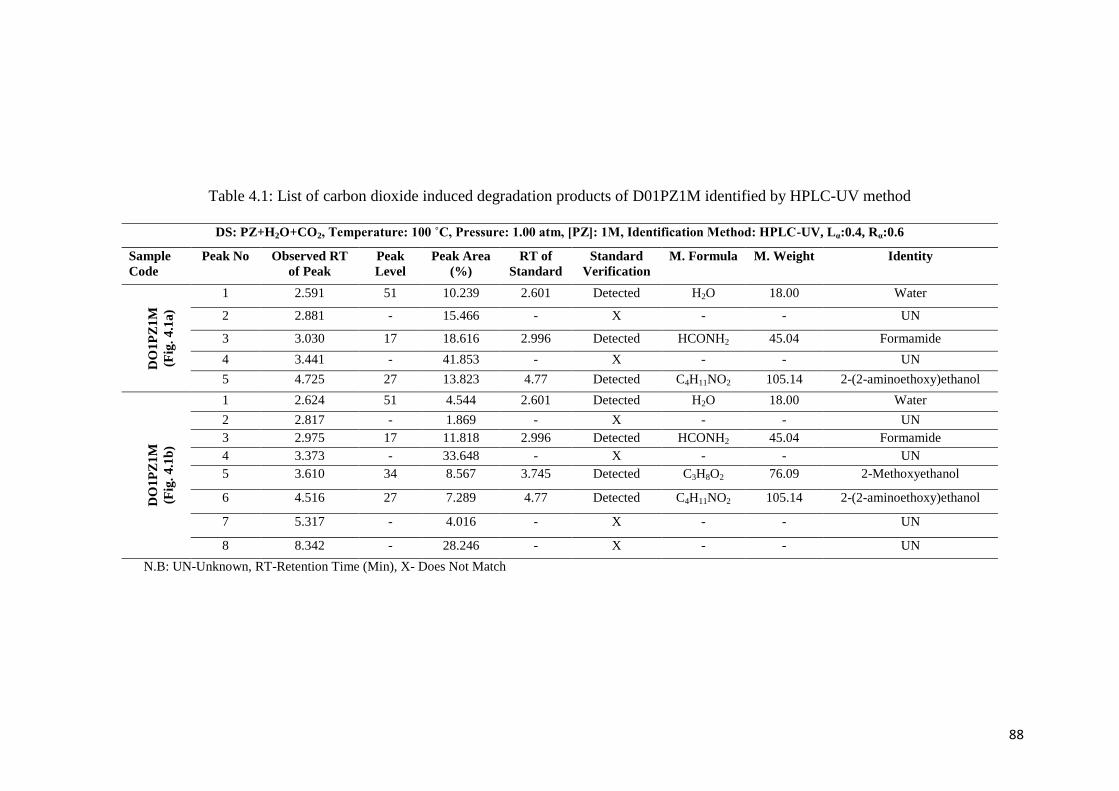
88
Table 4.1: List of carbon dioxide induced degradation products of D01PZ1M identified by HPLC-UV method
DS: PZ+H2O+CO2, Temperature: 100 ˚C, Pressure: 1.00 atm, [PZ]: 1M, Identification Method: HPLC-UV, Lα:0.4, Rα:0.6
Sample
Code
Peak No Observed RT
of Peak
Peak
Level
Peak Area
(%)
RT of
Standard
Standard
Verification
M. Formula M. Weight Identity
DO
1P
Z1
M
(Fig
. 4
.1a
)
1 2.591 51 10.239 2.601 Detected H2O 18.00 Water
2 2.881 - 15.466 - X - - UN
3 3.030 17 18.616 2.996 Detected HCONH2 45.04 Formamide
4 3.441 - 41.853 - X - - UN
5 4.725 27 13.823 4.77 Detected C4H11NO2 105.14 2-(2-aminoethoxy)ethanol
DO
1P
Z1
M
(Fig
. 4
.1b
)
1 2.624 51 4.544 2.601 Detected H2O 18.00 Water
2 2.817 - 1.869 - X - - UN
3 2.975 17 11.818 2.996 Detected HCONH2 45.04 Formamide
4 3.373 - 33.648 - X - - UN
5 3.610 34 8.567 3.745 Detected C3H8O2 76.09 2-Methoxyethanol
6 4.516 27 7.289 4.77 Detected C4H11NO2 105.14 2-(2-aminoethoxy)ethanol
7 5.317 - 4.016 - X - - UN
8 8.342 - 28.246 - X - - UN
N.B: UN-Unknown, RT-Retention Time (Min), X- Does Not Match
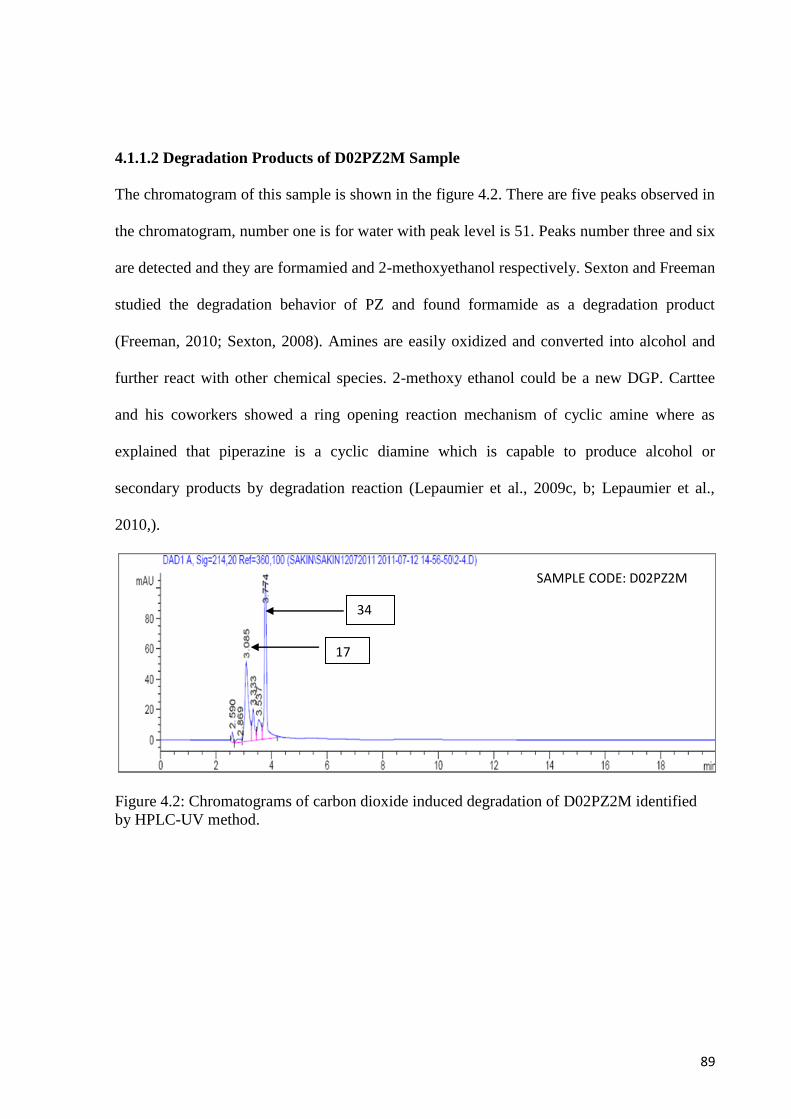
89
4.1.1.2 Degradation Products of D02PZ2M Sample
The chromatogram of this sample is shown in the figure 4.2. There are five peaks observed in
the chromatogram, number one is for water with peak level is 51. Peaks number three and six
are detected and they are formamied and 2-methoxyethanol respectively. Sexton and Freeman
studied the degradation behavior of PZ and found formamide as a degradation product
(Freeman, 2010; Sexton, 2008). Amines are easily oxidized and converted into alcohol and
further react with other chemical species. 2-methoxy ethanol could be a new DGP. Carttee
and his coworkers showed a ring opening reaction mechanism of cyclic amine where as
explained that piperazine is a cyclic diamine which is capable to produce alcohol or
secondary products by degradation reaction (Lepaumier et al., 2009c, b; Lepaumier et al.,
2010,).
Figure 4.2: Chromatograms of carbon dioxide induced degradation of D02PZ2M identified
by HPLC-UV method.
SAMPLE CODE: D02PZ2M
34
17
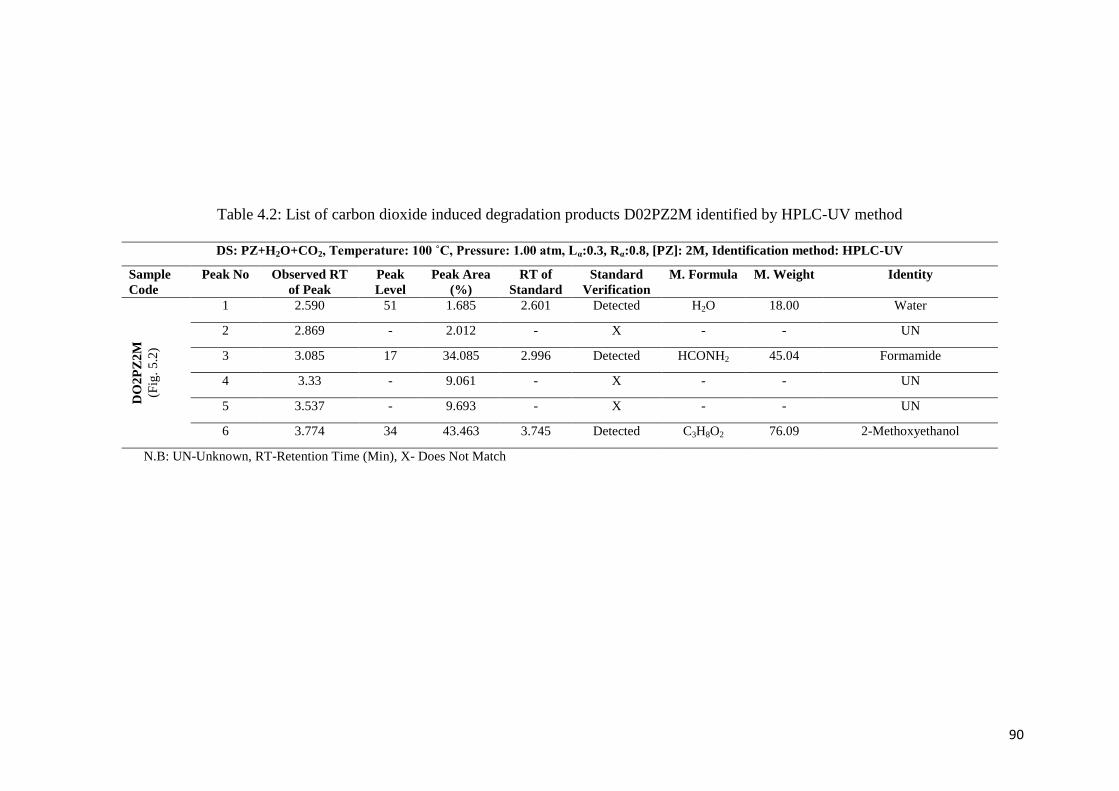
90
Table 4.2: List of carbon dioxide induced degradation products D02PZ2M identified by HPLC-UV method
DS: PZ+H2O+CO2, Temperature: 100 ˚C, Pressure: 1.00 atm, Lα:0.3, Rα:0.8, [PZ]: 2M, Identification method: HPLC-UV
Sample
Code
Peak No Observed RT
of Peak
Peak
Level
Peak Area
(%)
RT of
Standard
Standard
Verification
M. Formula M. Weight Identity
DO
2P
Z2
M
(Fig
. 5
.2)
1 2.590 51 1.685 2.601 Detected H2O 18.00 Water
2 2.869 - 2.012 - X - - UN
3 3.085 17 34.085 2.996 Detected HCONH2 45.04 Formamide
4 3.33 - 9.061 - X - - UN
5 3.537 - 9.693 - X - - UN
6 3.774 34 43.463 3.745 Detected C3H8O2 76.09 2-Methoxyethanol
N.B: UN-Unknown, RT-Retention Time (Min), X- Does Not Match

91
4.1.1.3 Variation of Peak Areas of Degradation Products (DGPs) of PZ+H2O+CO2
System
The peak area is the integration of the mass per unit volume (concentration) of eluted solute
eluted with respect to time. Peak areas can be measured manually it is obtained as the product
of the peak height and the peak width. Figure 4.3 represents the variation of peak areas of
each degradation products of D01PZ1M and D02PZ2M. The main degradation products of
D01PZ1M are found Formamide (FM) and 2-(2-aminoethoxy)ethanol (AEE) which are
indicated in the bar diagram. On the other hand for D02PZ2M, the degradation products are
identified Formamide (FM) and 2-Methoxyethanol (MOE). The unidentified peak areas of
DGPs for D01PZ1M and D02PZ2M are not indicated in the figure. From the figure it was
found that the concentration of Formamide is increasing with amine concentration and the
highest concentration of DGPs for D02PZ2M is MOE.
Figure 4.3: Variation of Degradation Products of D01PZ1M and D02PZ2M
Concentration of PZ (M)
Pe
ak A
rea
of
DG
Ps (
%)
0
10
20
30
40
50
FM
AEE
FM
MOE
D01PZ1M, Lα=0.4, T=100 0C D02PZ2M, Lα=0.3, T=100 0C
92
4.1.2 Degradation Products of DEA/H2O/CO2 System
Three different degraded solutions of this system are D03DEA2M, D04DEA3M and
D05DEA4M were analyzed and the obtained DGPs are discussed in the following section.
4.1.2.1 Degradation Products of D03DEA2M Sample
The chromatogram shown in figure 4.4 represents twelve observed peaks. Nine peaks are
identified and three of these are not detected. Among these nine peaks seven are treated as
DGPs these are formamide, 2-methoxyethanol, diethylenetriamine, 2-(2-aminoethoxy)
ethanol, triethanolamine, acetone and ethyl 1-piperazinecarboxylate. The results are
summarized in table 4.3. None of the polymeric degradation products were detected.
Diethanolamine is generally degraded into monoethanolamine (Dawodu and Meisen, 1991)
and both amines are capable to produce acids and alcohol (M. S.Islam, 2010). Later acid and
alcohol produced acetate and aldehyde and ketone. Supap and his co-workers (2006)
conducted an experiment on the degradation of MEA induced by carbon dioxide and reported
that acetone, ethanol, acetate and amides were identified by HPLC and GC-MS (Supap et al.,
2006).
Triethanolamine is a degradation product of DEA reported by Dawodu and Meisen in 1991.
Dawodu and Meisen separately conducted the degradation study of DEA induced by COS
and CO2 in both cases they identified HEP, BHEP and TEA (Dawodu and Axel Meisen,
1994; Dawodu and Meisen, 1991). Etylaminoethanol (EAE) is a derivative of ethanol, it is
identified by Dawodu and Meisen (Dawodu and Meisen, 1991). HEP and BHEP are the
byproducts of piperazine identified in the degradation of DEA, it can be argued that DEA
easily converts to PZ and it has the capability to produce further by products.
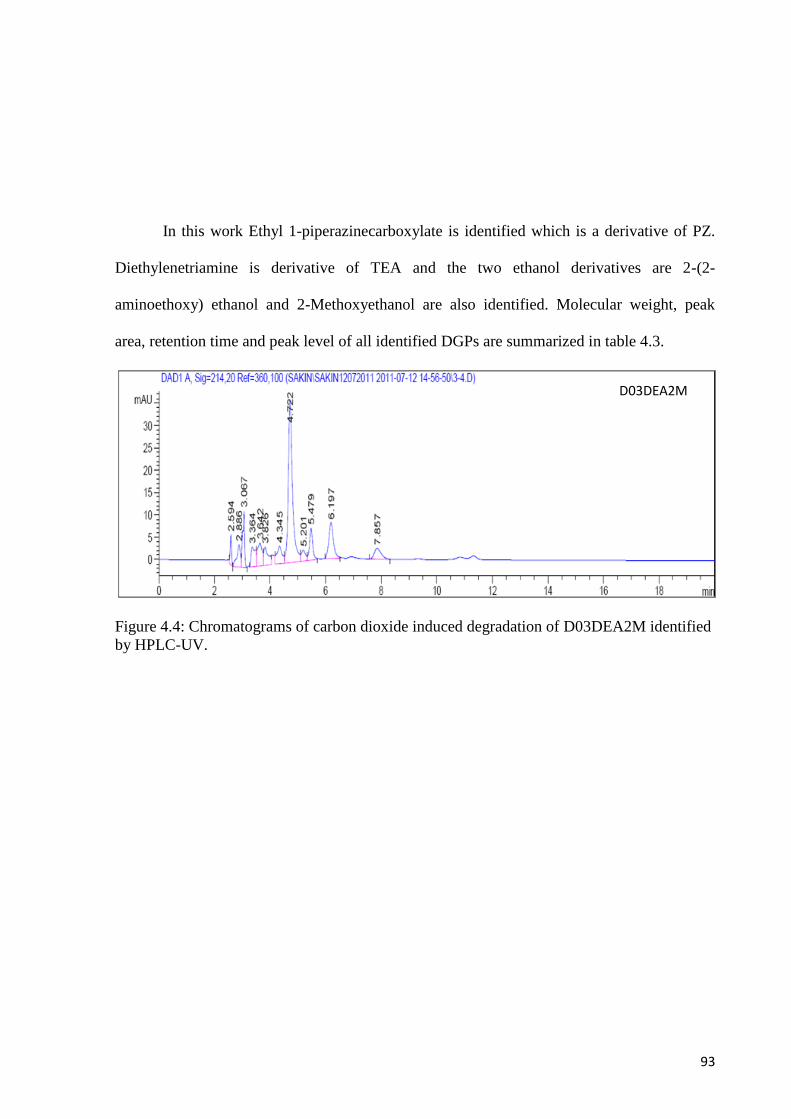
93
In this work Ethyl 1-piperazinecarboxylate is identified which is a derivative of PZ.
Diethylenetriamine is derivative of TEA and the two ethanol derivatives are 2-(2-
aminoethoxy) ethanol and 2-Methoxyethanol are also identified. Molecular weight, peak
area, retention time and peak level of all identified DGPs are summarized in table 4.3.
Figure 4.4: Chromatograms of carbon dioxide induced degradation of D03DEA2M identified
by HPLC-UV.
D03DEA2M
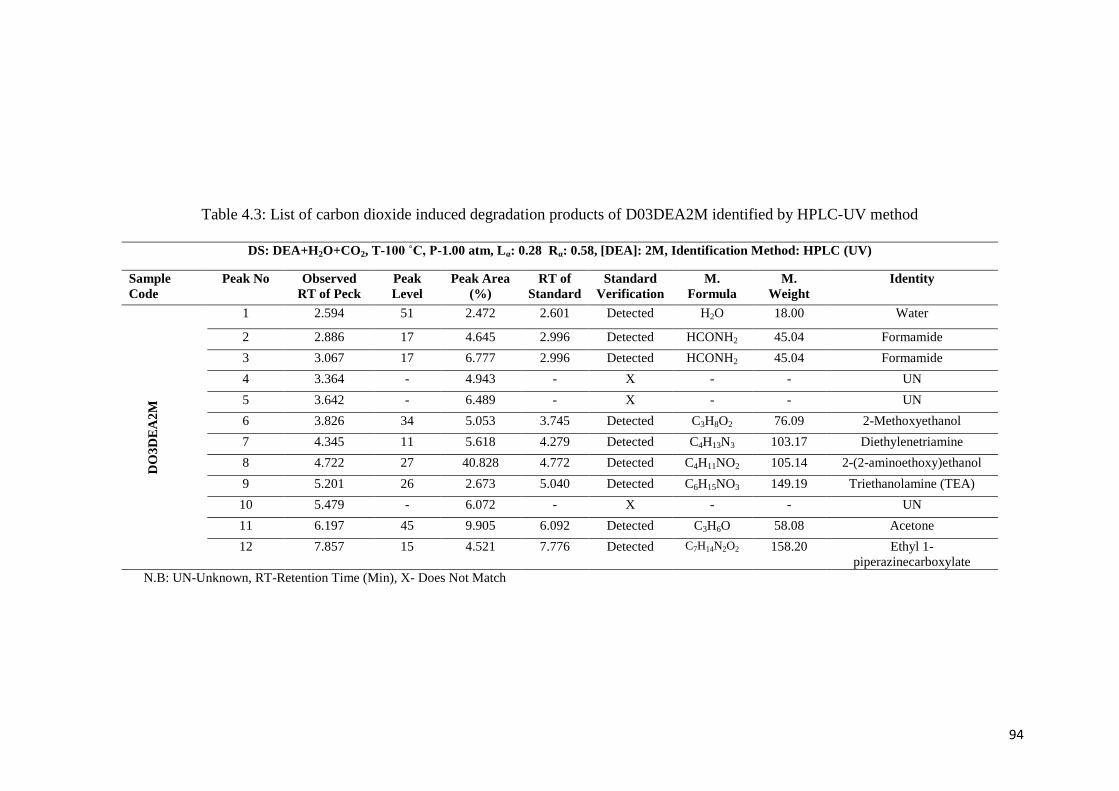
94
Table 4.3: List of carbon dioxide induced degradation products of D03DEA2M identified by HPLC-UV method
DS: DEA+H2O+CO2, T-100 ˚C, P-1.00 atm, Lα: 0.28 Rα: 0.58, [DEA]: 2M, Identification Method: HPLC (UV)
Sample
Code
Peak No Observed
RT of Peck
Peak
Level
Peak Area
(%)
RT of
Standard
Standard
Verification
M.
Formula
M.
Weight
Identity
DO
3D
EA
2M
1 2.594 51 2.472 2.601 Detected H2O 18.00 Water
2 2.886 17 4.645 2.996 Detected HCONH2 45.04 Formamide
3 3.067 17 6.777 2.996 Detected HCONH2 45.04 Formamide
4 3.364 - 4.943 - X - - UN
5 3.642 - 6.489 - X - - UN
6 3.826 34 5.053 3.745 Detected C3H8O2 76.09 2-Methoxyethanol
7 4.345 11 5.618 4.279 Detected C4H13N3 103.17 Diethylenetriamine
8 4.722 27 40.828 4.772 Detected C4H11NO2 105.14 2-(2-aminoethoxy)ethanol
9 5.201 26 2.673 5.040 Detected C6H15NO3 149.19 Triethanolamine (TEA)
10 5.479 - 6.072 - X - - UN
11 6.197 45 9.905 6.092 Detected C3H6O 58.08 Acetone
12 7.857 15 4.521 7.776 Detected C7H14N2O2 158.20 Ethyl 1-
piperazinecarboxylate
N.B: UN-Unknown, RT-Retention Time (Min), X- Does Not Match
95
4.1.2.2 Degradation Products of D04DEA3M Sample
Diethanolamine (DEA) sample with code number D04DEA3M where as the amine
concentration is 3M was degraded under experimental condition and analyzed by HPLC-UV
method. The chromatogram shown in figure 4.5 which reveals fourteen peaks of different
DGPs. Nine peaks are identified and the rest are not detected. The detected degradation
products are formamide, 2-methoxyethanol, diethylenetriamine, 2-(2-aminoethoxy) ethanol,
triethanolamine, acetone and ethyl 1-piperazinecarboxylate. The results are summarized in
table 4.4. No polymeric degradation products were detected. Supap and his co-workers in
2006 conducted CO2 induced degradation of MEA and reported that acetone, ethanol, acetate
and amides are DGP. Dawodu and Meisen separately conducted the degradation study of
DEA induced by COS and CO2 in both cases they identified HEP, BHEP and TEA as
degradation products (Dawodu and Axel Meisen, 1994; Dawodu and Meisen, 1991).
Etylaminoethanol (EAE) is a derivative of ethanol, it is identified by Dawodu and Meisen in
the above studies too (Dawodu and Meisen, 1991). HEP and BHEP are the byproducts of
piperazine identify in the degradation of DEA, in this point of view it can be said that DEA
easily converted to PZ and it has the capability to produce further by products. In this work
Ethyl 1-piperazinecarboxylate is identified this is also derivative of PZ. Diethylenetriamine
this is a derivative of TEA and two ethanol derivatives are 2-(2-aminoethoxy) ethanol, 2-
Methoxyethanol were found in this work. Peak number one is for water this is not a
degradation products as identified for the presence of process water in sample. The result is
also reported by several researchers previously (Dawodu and Meisen, 1996, 1991; M.
S.Islam, 2010).
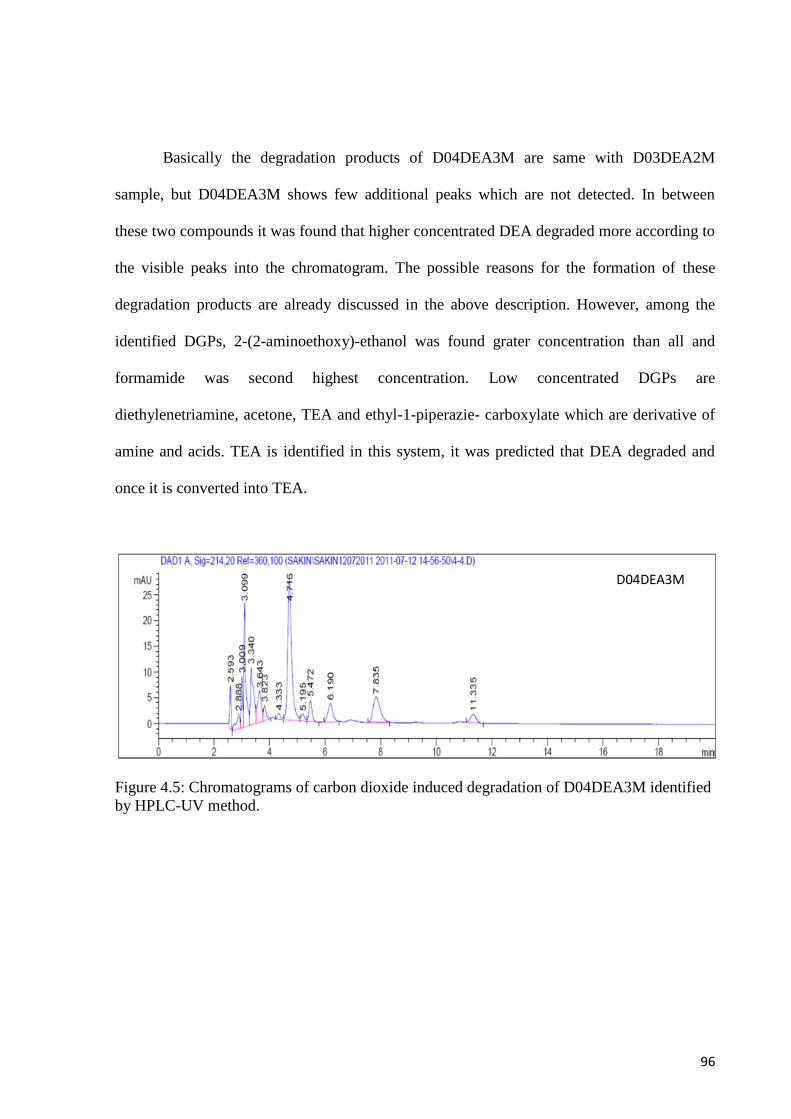
96
Basically the degradation products of D04DEA3M are same with D03DEA2M
sample, but D04DEA3M shows few additional peaks which are not detected. In between
these two compounds it was found that higher concentrated DEA degraded more according to
the visible peaks into the chromatogram. The possible reasons for the formation of these
degradation products are already discussed in the above description. However, among the
identified DGPs, 2-(2-aminoethoxy)-ethanol was found grater concentration than all and
formamide was second highest concentration. Low concentrated DGPs are
diethylenetriamine, acetone, TEA and ethyl-1-piperazie- carboxylate which are derivative of
amine and acids. TEA is identified in this system, it was predicted that DEA degraded and
once it is converted into TEA.
Figure 4.5: Chromatograms of carbon dioxide induced degradation of D04DEA3M identified
by HPLC-UV method.
D04DEA3M
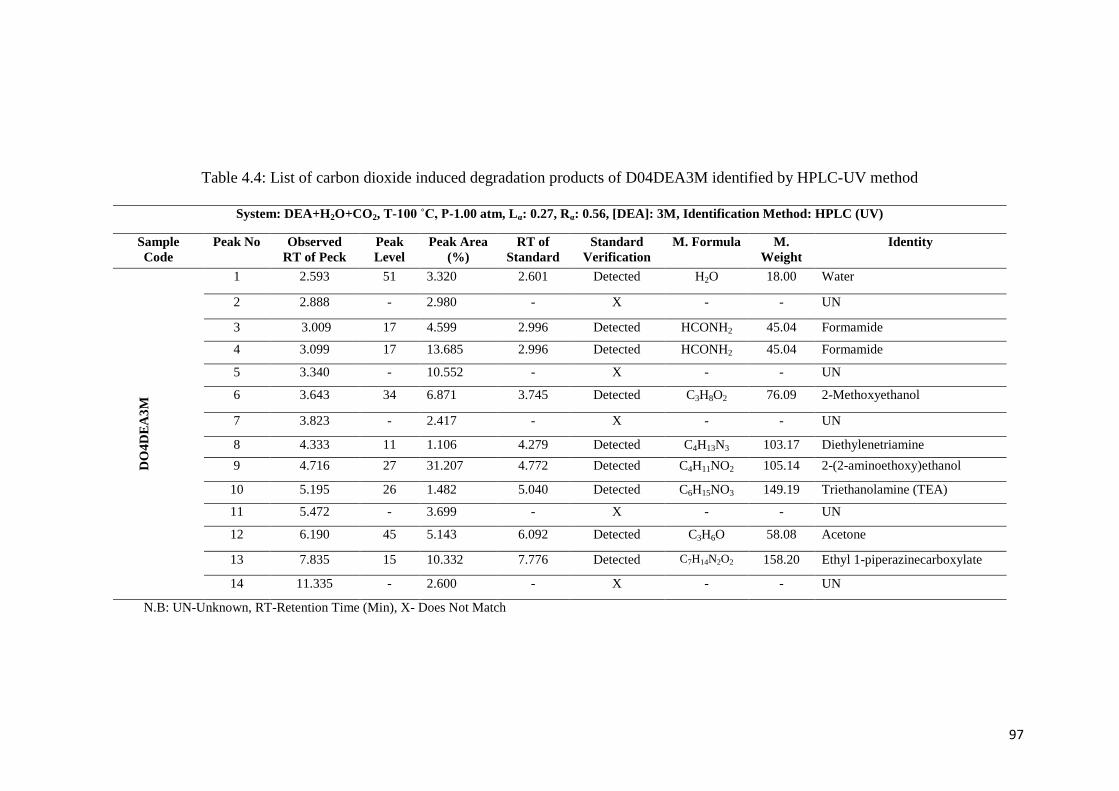
97
Table 4.4: List of carbon dioxide induced degradation products of D04DEA3M identified by HPLC-UV method
System: DEA+H2O+CO2, T-100 ˚C, P-1.00 atm, Lα: 0.27, Rα: 0.56, [DEA]: 3M, Identification Method: HPLC (UV)
Sample
Code
Peak No Observed
RT of Peck
Peak
Level
Peak Area
(%)
RT of
Standard
Standard
Verification
M. Formula M.
Weight
Identity
DO
4D
EA
3M
1 2.593 51 3.320 2.601 Detected H2O 18.00 Water
2 2.888 - 2.980 - X - - UN
3 3.009 17 4.599 2.996 Detected HCONH2 45.04 Formamide
4 3.099 17 13.685 2.996 Detected HCONH2 45.04 Formamide
5 3.340 - 10.552 - X - - UN
6 3.643 34 6.871 3.745 Detected C3H8O2 76.09 2-Methoxyethanol
7 3.823 - 2.417 - X - - UN
8 4.333 11 1.106 4.279 Detected C4H13N3 103.17 Diethylenetriamine
9 4.716 27 31.207 4.772 Detected C4H11NO2 105.14 2-(2-aminoethoxy)ethanol
10 5.195 26 1.482 5.040 Detected C6H15NO3 149.19 Triethanolamine (TEA)
11 5.472 - 3.699 - X - - UN
12 6.190 45 5.143 6.092 Detected C3H6O 58.08 Acetone
13 7.835 15 10.332 7.776 Detected C7H14N2O2 158.20 Ethyl 1-piperazinecarboxylate
14 11.335 - 2.600 - X - - UN
N.B: UN-Unknown, RT-Retention Time (Min), X- Does Not Match
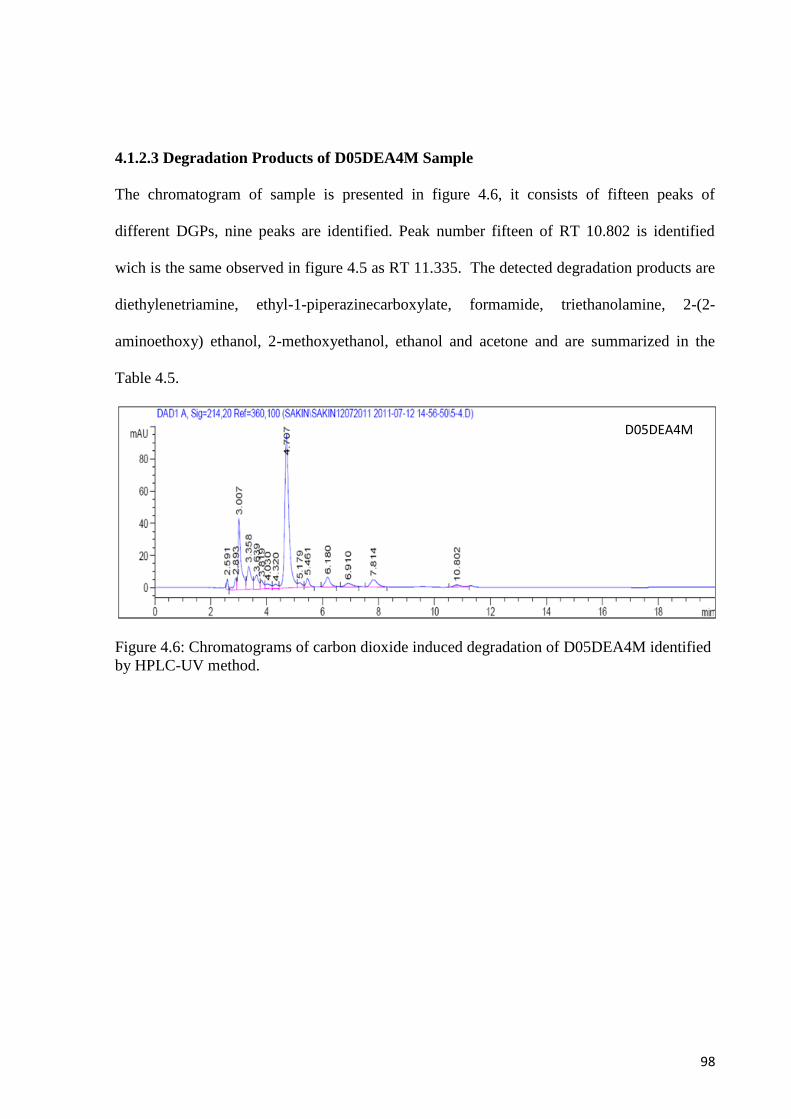
98
4.1.2.3 Degradation Products of D05DEA4M Sample
The chromatogram of sample is presented in figure 4.6, it consists of fifteen peaks of
different DGPs, nine peaks are identified. Peak number fifteen of RT 10.802 is identified
wich is the same observed in figure 4.5 as RT 11.335. The detected degradation products are
diethylenetriamine, ethyl-1-piperazinecarboxylate, formamide, triethanolamine, 2-(2-
aminoethoxy) ethanol, 2-methoxyethanol, ethanol and acetone and are summarized in the
Table 4.5.
Figure 4.6: Chromatograms of carbon dioxide induced degradation of D05DEA4M identified
by HPLC-UV method.
D05DEA4M
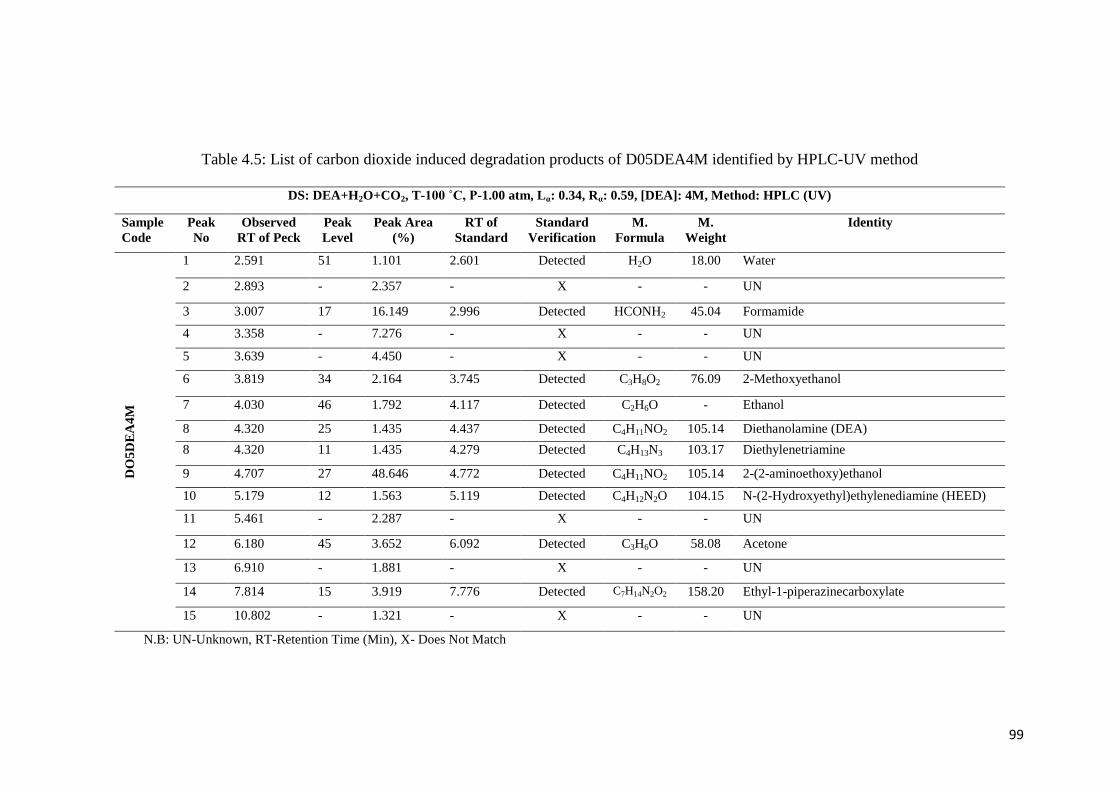
99
Table 4.5: List of carbon dioxide induced degradation products of D05DEA4M identified by HPLC-UV method
DS: DEA+H2O+CO2, T-100 ˚C, P-1.00 atm, Lα: 0.34, Rα: 0.59, [DEA]: 4M, Method: HPLC (UV)
Sample
Code
Peak
No
Observed
RT of Peck
Peak
Level
Peak Area
(%)
RT of
Standard
Standard
Verification
M.
Formula
M.
Weight
Identity
DO
5D
EA
4M
1 2.591 51 1.101 2.601 Detected H2O 18.00 Water
2 2.893 - 2.357 - X - - UN
3 3.007 17 16.149 2.996 Detected HCONH2 45.04 Formamide
4 3.358 - 7.276 - X - - UN
5 3.639 - 4.450 - X - - UN
6 3.819 34 2.164 3.745 Detected C3H8O2 76.09 2-Methoxyethanol
7 4.030 46 1.792 4.117 Detected C2H6O - Ethanol
8 4.320 25 1.435 4.437 Detected C4H11NO2 105.14 Diethanolamine (DEA)
8 4.320 11 1.435 4.279 Detected C4H13N3 103.17 Diethylenetriamine
9 4.707 27 48.646 4.772 Detected C4H11NO2 105.14 2-(2-aminoethoxy)ethanol
10 5.179 12 1.563 5.119 Detected C4H12N2O 104.15 N-(2-Hydroxyethyl)ethylenediamine (HEED)
11 5.461 - 2.287 - X - - UN
12 6.180 45 3.652 6.092 Detected C3H6O 58.08 Acetone
13 6.910 - 1.881 - X - - UN
14 7.814 15 3.919 7.776 Detected C7H14N2O2 158.20 Ethyl-1-piperazinecarboxylate
15 10.802 - 1.321 - X - - UN
N.B: UN-Unknown, RT-Retention Time (Min), X- Does Not Match
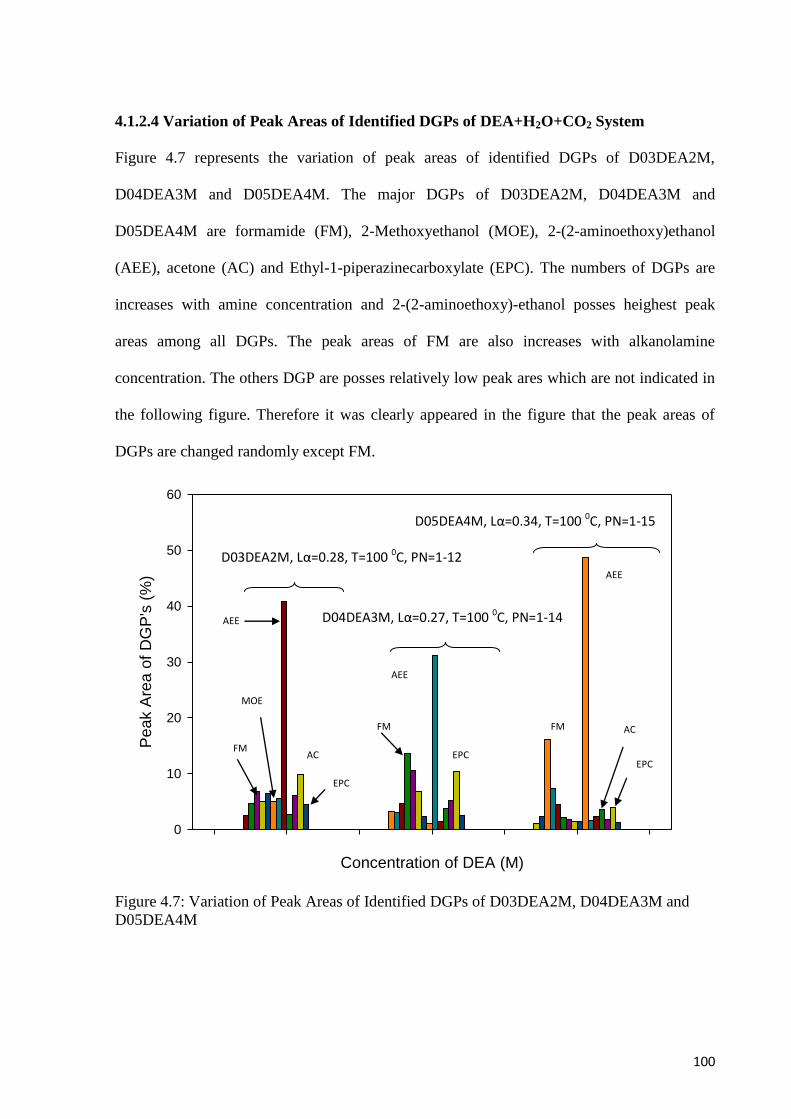
100
4.1.2.4 Variation of Peak Areas of Identified DGPs of DEA+H2O+CO2 System
Figure 4.7 represents the variation of peak areas of identified DGPs of D03DEA2M,
D04DEA3M and D05DEA4M. The major DGPs of D03DEA2M, D04DEA3M and
D05DEA4M are formamide (FM), 2-Methoxyethanol (MOE), 2-(2-aminoethoxy)ethanol
(AEE), acetone (AC) and Ethyl-1-piperazinecarboxylate (EPC). The numbers of DGPs are
increases with amine concentration and 2-(2-aminoethoxy)-ethanol posses heighest peak
areas among all DGPs. The peak areas of FM are also increases with alkanolamine
concentration. The others DGP are posses relatively low peak ares which are not indicated in
the following figure. Therefore it was clearly appeared in the figure that the peak areas of
DGPs are changed randomly except FM.
Figure 4.7: Variation of Peak Areas of Identified DGPs of D03DEA2M, D04DEA3M and
D05DEA4M
Concentration of DEA (M)
Pe
ak A
rea
of
DG
P's
(%
)
0
10
20
30
40
50
60
D03DEA2M, Lα=0.28, T=100 0C, PN=1-12
D04DEA3M, Lα=0.27, T=100 0C, PN=1-14
D05DEA4M, Lα=0.34, T=100 0C, PN=1-15
FM AC
AEE
MOE
EPC
FM
AEE
EPC
FM
AEE
AC
EPC
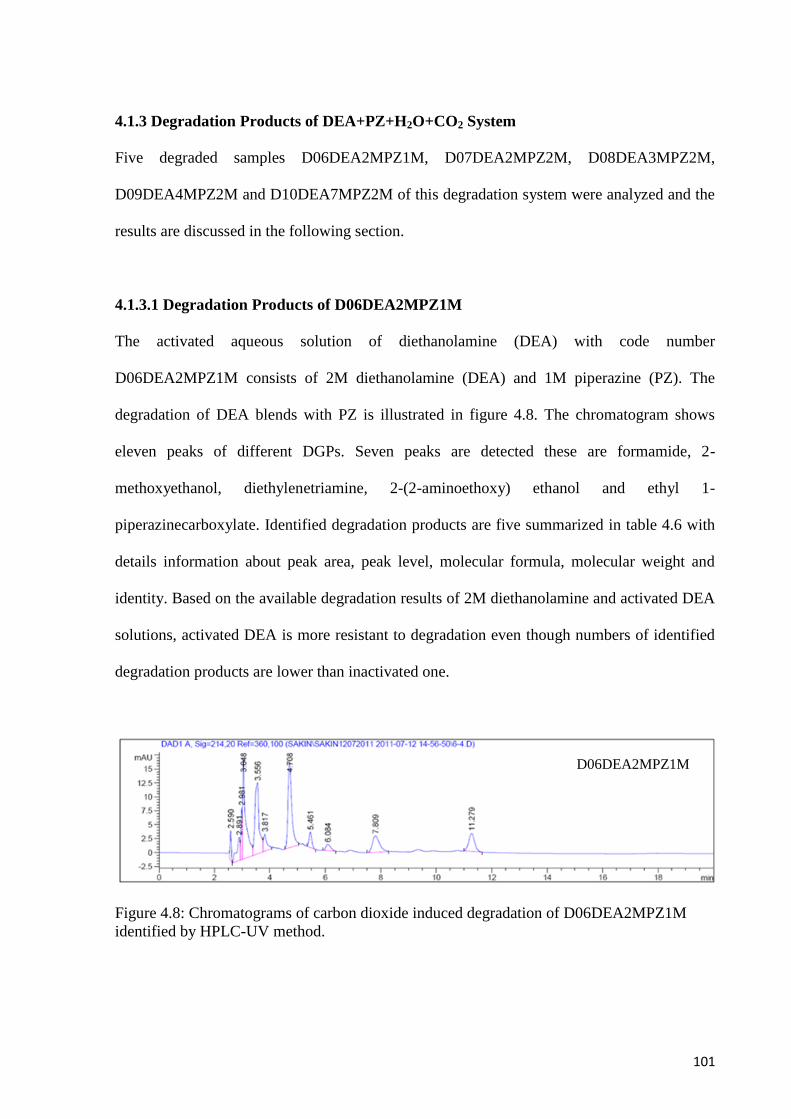
101
4.1.3 Degradation Products of DEA+PZ+H2O+CO2 System
Five degraded samples D06DEA2MPZ1M, D07DEA2MPZ2M, D08DEA3MPZ2M,
D09DEA4MPZ2M and D10DEA7MPZ2M of this degradation system were analyzed and the
results are discussed in the following section.
4.1.3.1 Degradation Products of D06DEA2MPZ1M
The activated aqueous solution of diethanolamine (DEA) with code number
D06DEA2MPZ1M consists of 2M diethanolamine (DEA) and 1M piperazine (PZ). The
degradation of DEA blends with PZ is illustrated in figure 4.8. The chromatogram shows
eleven peaks of different DGPs. Seven peaks are detected these are formamide, 2-
methoxyethanol, diethylenetriamine, 2-(2-aminoethoxy) ethanol and ethyl 1-
piperazinecarboxylate. Identified degradation products are five summarized in table 4.6 with
details information about peak area, peak level, molecular formula, molecular weight and
identity. Based on the available degradation results of 2M diethanolamine and activated DEA
solutions, activated DEA is more resistant to degradation even though numbers of identified
degradation products are lower than inactivated one.
Figure 4.8: Chromatograms of carbon dioxide induced degradation of D06DEA2MPZ1M
identified by HPLC-UV method.
D06DEA2MPZ1M
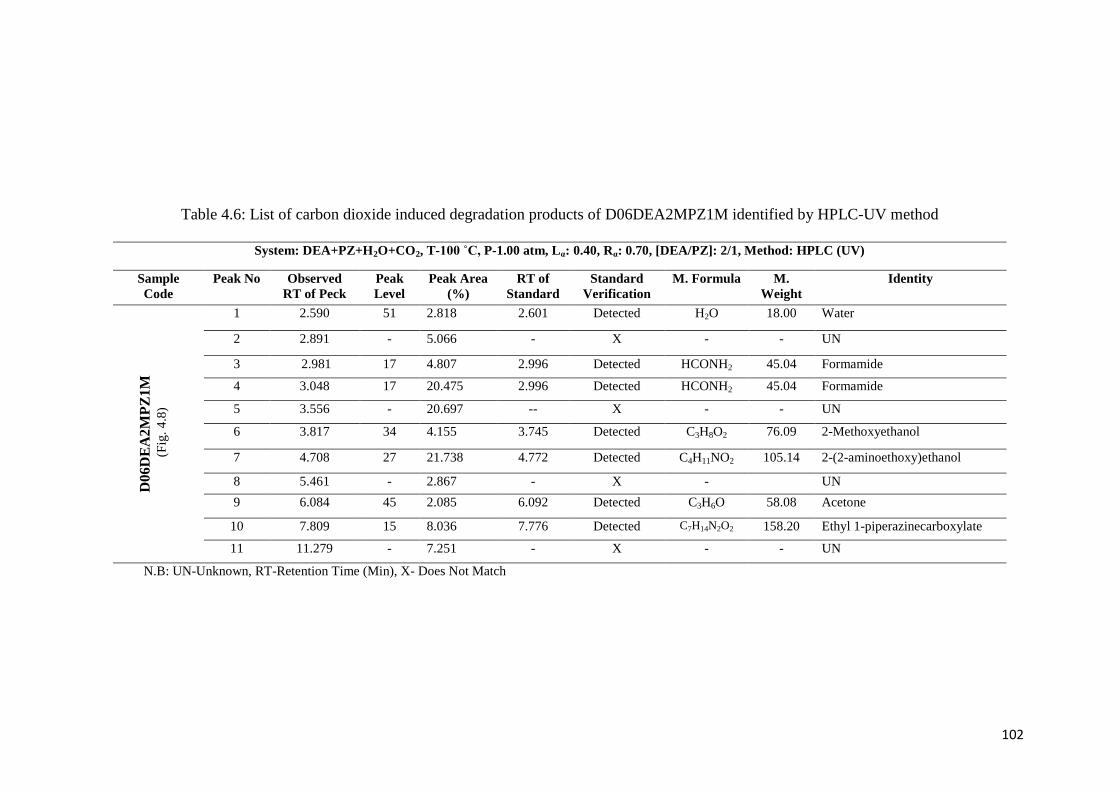
102
Table 4.6: List of carbon dioxide induced degradation products of D06DEA2MPZ1M identified by HPLC-UV method
System: DEA+PZ+H2O+CO2, T-100 ˚C, P-1.00 atm, Lα: 0.40, Rα: 0.70, [DEA/PZ]: 2/1, Method: HPLC (UV)
Sample
Code
Peak No Observed
RT of Peck
Peak
Level
Peak Area
(%)
RT of
Standard
Standard
Verification
M. Formula M.
Weight
Identity
D0
6D
EA
2M
PZ
1M
(
Fig
. 4
.8)
1 2.590 51 2.818 2.601 Detected H2O 18.00 Water
2 2.891 - 5.066 - X - - UN
3 2.981 17 4.807 2.996 Detected HCONH2 45.04 Formamide
4 3.048 17 20.475 2.996 Detected HCONH2 45.04 Formamide
5 3.556 - 20.697 -- X - - UN
6 3.817 34 4.155 3.745 Detected C3H8O2 76.09 2-Methoxyethanol
7 4.708 27 21.738 4.772 Detected C4H11NO2 105.14 2-(2-aminoethoxy)ethanol
8 5.461 - 2.867 - X - UN
9 6.084 45 2.085 6.092 Detected C3H6O 58.08 Acetone
10 7.809 15 8.036 7.776 Detected C7H14N2O2 158.20 Ethyl 1-piperazinecarboxylate
11 11.279 - 7.251 - X - - UN
N.B: UN-Unknown, RT-Retention Time (Min), X- Does Not Match
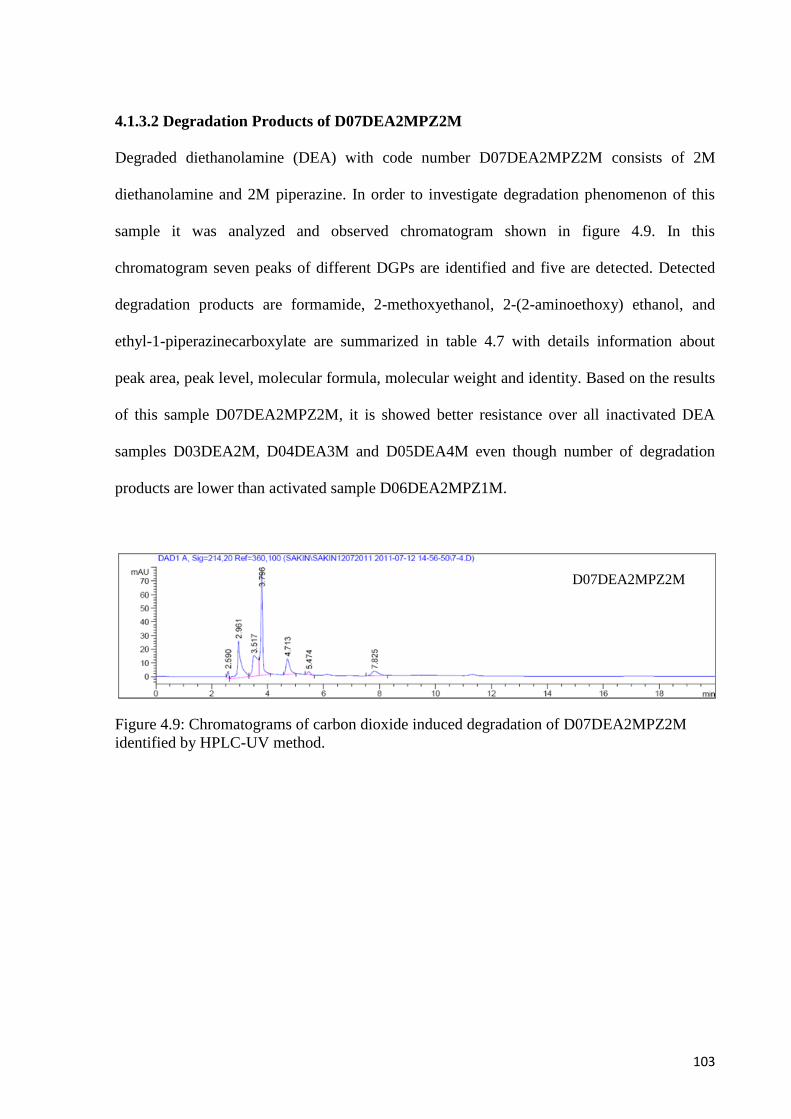
103
4.1.3.2 Degradation Products of D07DEA2MPZ2M
Degraded diethanolamine (DEA) with code number D07DEA2MPZ2M consists of 2M
diethanolamine and 2M piperazine. In order to investigate degradation phenomenon of this
sample it was analyzed and observed chromatogram shown in figure 4.9. In this
chromatogram seven peaks of different DGPs are identified and five are detected. Detected
degradation products are formamide, 2-methoxyethanol, 2-(2-aminoethoxy) ethanol, and
ethyl-1-piperazinecarboxylate are summarized in table 4.7 with details information about
peak area, peak level, molecular formula, molecular weight and identity. Based on the results
of this sample D07DEA2MPZ2M, it is showed better resistance over all inactivated DEA
samples D03DEA2M, D04DEA3M and D05DEA4M even though number of degradation
products are lower than activated sample D06DEA2MPZ1M.
Figure 4.9: Chromatograms of carbon dioxide induced degradation of D07DEA2MPZ2M
identified by HPLC-UV method.
D07DEA2MPZ2M
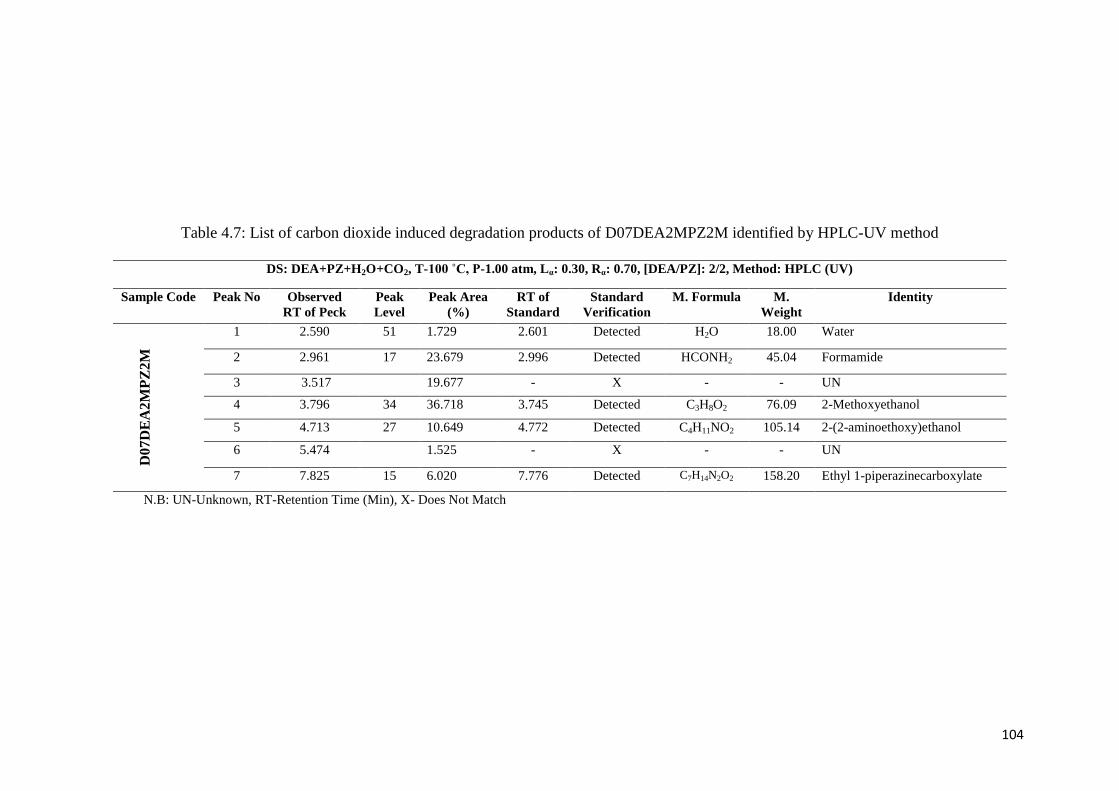
104
Table 4.7: List of carbon dioxide induced degradation products of D07DEA2MPZ2M identified by HPLC-UV method
DS: DEA+PZ+H2O+CO2, T-100 ˚C, P-1.00 atm, Lα: 0.30, Rα: 0.70, [DEA/PZ]: 2/2, Method: HPLC (UV)
Sample Code
Peak No Observed
RT of Peck
Peak
Level
Peak Area
(%)
RT of
Standard
Standard
Verification
M. Formula M.
Weight
Identity
D0
7D
EA
2M
PZ
2M
1 2.590 51 1.729 2.601 Detected H2O 18.00 Water
2 2.961 17 23.679 2.996 Detected HCONH2 45.04 Formamide
3 3.517 19.677 - X - - UN
4 3.796 34 36.718 3.745 Detected C3H8O2 76.09 2-Methoxyethanol
5 4.713 27 10.649 4.772 Detected C4H11NO2 105.14 2-(2-aminoethoxy)ethanol
6 5.474 1.525 - X - - UN
7 7.825 15 6.020 7.776 Detected C7H14N2O2 158.20 Ethyl 1-piperazinecarboxylate
N.B: UN-Unknown, RT-Retention Time (Min), X- Does Not Match
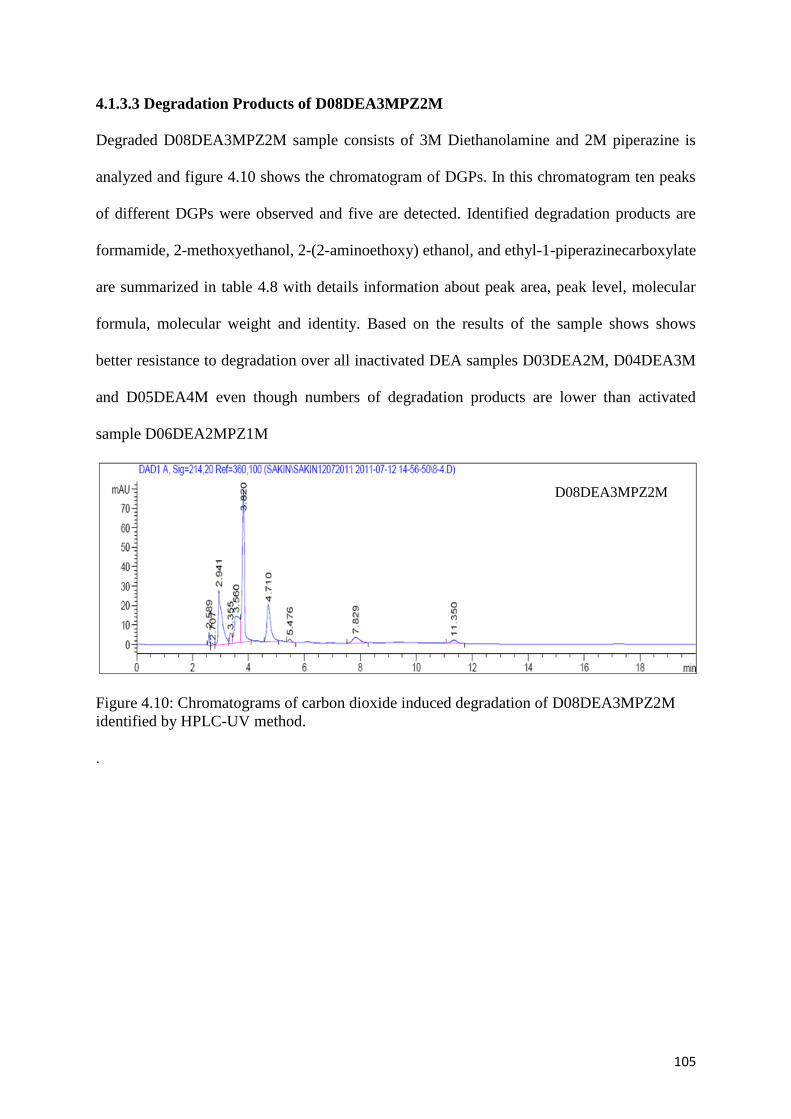
105
4.1.3.3 Degradation Products of D08DEA3MPZ2M
Degraded D08DEA3MPZ2M sample consists of 3M Diethanolamine and 2M piperazine is
analyzed and figure 4.10 shows the chromatogram of DGPs. In this chromatogram ten peaks
of different DGPs were observed and five are detected. Identified degradation products are
formamide, 2-methoxyethanol, 2-(2-aminoethoxy) ethanol, and ethyl-1-piperazinecarboxylate
are summarized in table 4.8 with details information about peak area, peak level, molecular
formula, molecular weight and identity. Based on the results of the sample shows shows
better resistance to degradation over all inactivated DEA samples D03DEA2M, D04DEA3M
and D05DEA4M even though numbers of degradation products are lower than activated
sample D06DEA2MPZ1M
Figure 4.10: Chromatograms of carbon dioxide induced degradation of D08DEA3MPZ2M
identified by HPLC-UV method.
.
D08DEA3MPZ2M
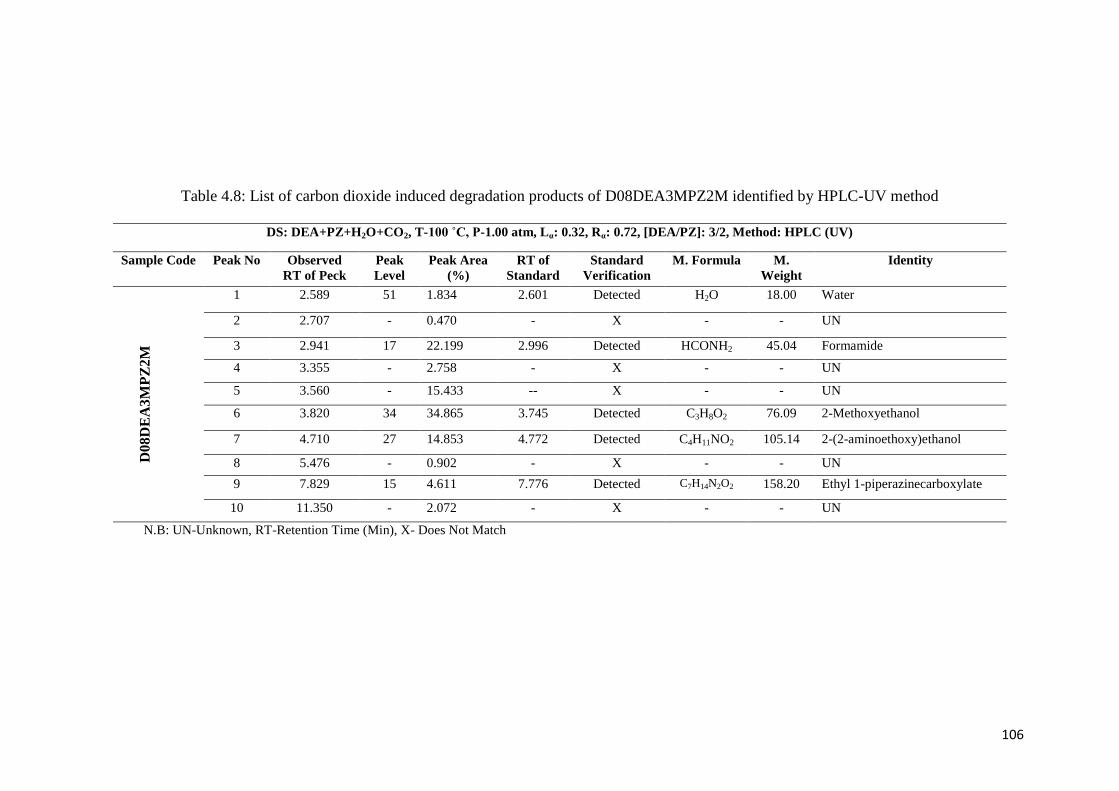
106
Table 4.8: List of carbon dioxide induced degradation products of D08DEA3MPZ2M identified by HPLC-UV method
DS: DEA+PZ+H2O+CO2, T-100 ˚C, P-1.00 atm, Lα: 0.32, Rα: 0.72, [DEA/PZ]: 3/2, Method: HPLC (UV)
Sample Code Peak No Observed
RT of Peck
Peak
Level
Peak Area
(%)
RT of
Standard
Standard
Verification
M. Formula M.
Weight
Identity
D0
8D
EA
3M
PZ
2M
1 2.589 51 1.834 2.601 Detected H2O 18.00 Water
2 2.707 - 0.470 - X - - UN
3 2.941 17 22.199 2.996 Detected HCONH2 45.04 Formamide
4 3.355 - 2.758 - X - - UN
5 3.560 - 15.433 -- X - - UN
6 3.820 34 34.865 3.745 Detected C3H8O2 76.09 2-Methoxyethanol
7 4.710 27 14.853 4.772 Detected C4H11NO2 105.14 2-(2-aminoethoxy)ethanol
8 5.476 - 0.902 - X - - UN
9 7.829 15 4.611 7.776 Detected C7H14N2O2 158.20 Ethyl 1-piperazinecarboxylate
10 11.350 - 2.072 - X - - UN
N.B: UN-Unknown, RT-Retention Time (Min), X- Does Not Match
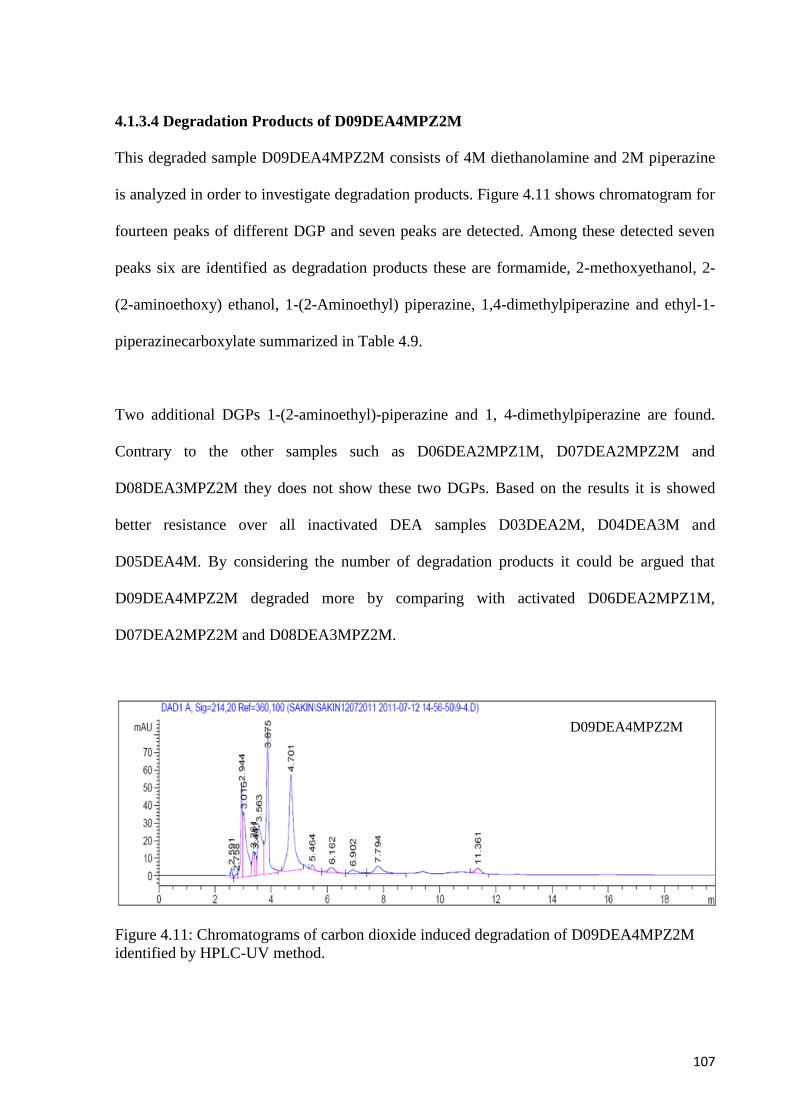
107
4.1.3.4 Degradation Products of D09DEA4MPZ2M
This degraded sample D09DEA4MPZ2M consists of 4M diethanolamine and 2M piperazine
is analyzed in order to investigate degradation products. Figure 4.11 shows chromatogram for
fourteen peaks of different DGP and seven peaks are detected. Among these detected seven
peaks six are identified as degradation products these are formamide, 2-methoxyethanol, 2-
(2-aminoethoxy) ethanol, 1-(2-Aminoethyl) piperazine, 1,4-dimethylpiperazine and ethyl-1-
piperazinecarboxylate summarized in Table 4.9.
Two additional DGPs 1-(2-aminoethyl)-piperazine and 1, 4-dimethylpiperazine are found.
Contrary to the other samples such as D06DEA2MPZ1M, D07DEA2MPZ2M and
D08DEA3MPZ2M they does not show these two DGPs. Based on the results it is showed
better resistance over all inactivated DEA samples D03DEA2M, D04DEA3M and
D05DEA4M. By considering the number of degradation products it could be argued that
D09DEA4MPZ2M degraded more by comparing with activated D06DEA2MPZ1M,
D07DEA2MPZ2M and D08DEA3MPZ2M.
Figure 4.11: Chromatograms of carbon dioxide induced degradation of D09DEA4MPZ2M
identified by HPLC-UV method.
D09DEA4MPZ2M
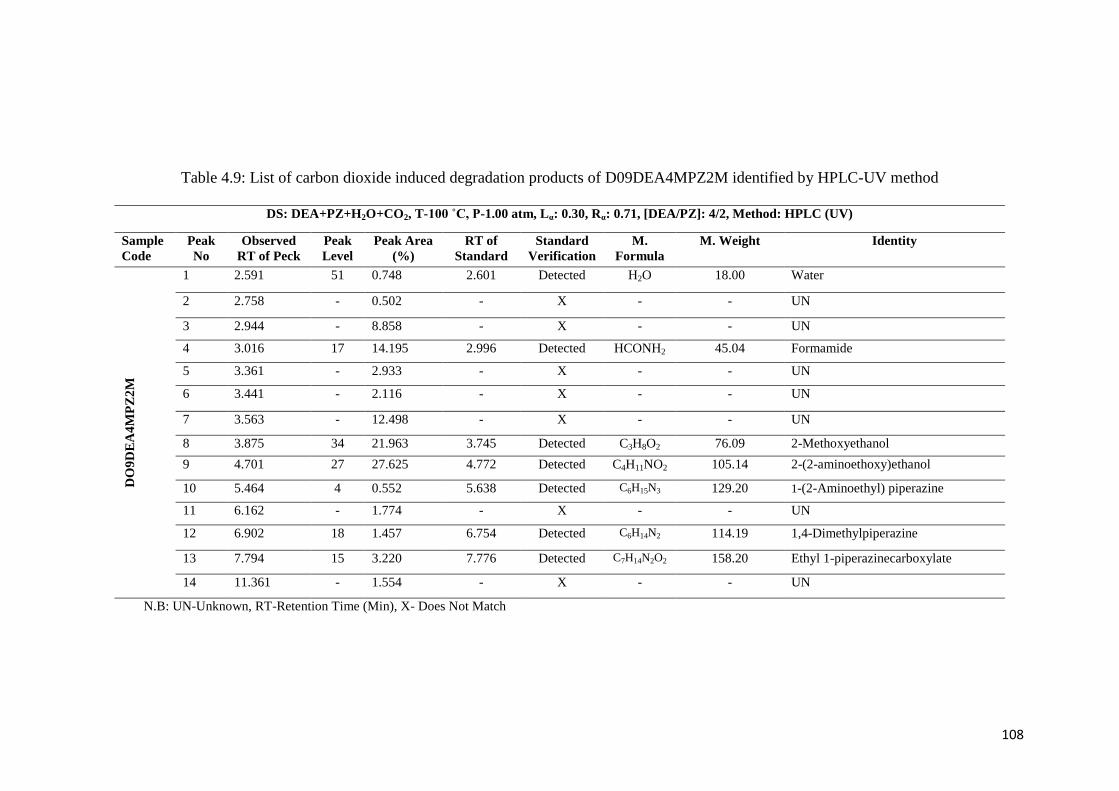
108
Table 4.9: List of carbon dioxide induced degradation products of D09DEA4MPZ2M identified by HPLC-UV method
DS: DEA+PZ+H2O+CO2, T-100 ˚C, P-1.00 atm, Lα: 0.30, Rα: 0.71, [DEA/PZ]: 4/2, Method: HPLC (UV)
Sample
Code
Peak
No
Observed
RT of Peck
Peak
Level
Peak Area
(%)
RT of
Standard
Standard
Verification
M.
Formula
M. Weight Identity
DO
9D
EA
4M
PZ
2M
1 2.591 51 0.748 2.601 Detected H2O 18.00 Water
2 2.758 - 0.502 - X - - UN
3 2.944 - 8.858 - X - - UN
4 3.016 17 14.195 2.996 Detected HCONH2 45.04 Formamide
5 3.361 - 2.933 - X - - UN
6 3.441 - 2.116 - X - - UN
7 3.563 - 12.498 - X - - UN
8 3.875 34 21.963 3.745 Detected C3H8O2 76.09 2-Methoxyethanol
9 4.701 27 27.625 4.772 Detected C4H11NO2 105.14 2-(2-aminoethoxy)ethanol
10 5.464 4 0.552 5.638 Detected C6H15N3 129.20 1-(2-Aminoethyl) piperazine
11 6.162 - 1.774 - X - - UN
12 6.902 18 1.457 6.754 Detected C6H14N2 114.19 1,4-Dimethylpiperazine
13 7.794 15 3.220 7.776 Detected C7H14N2O2 158.20 Ethyl 1-piperazinecarboxylate
14 11.361 - 1.554 - X - - UN
N.B: UN-Unknown, RT-Retention Time (Min), X- Does Not Match
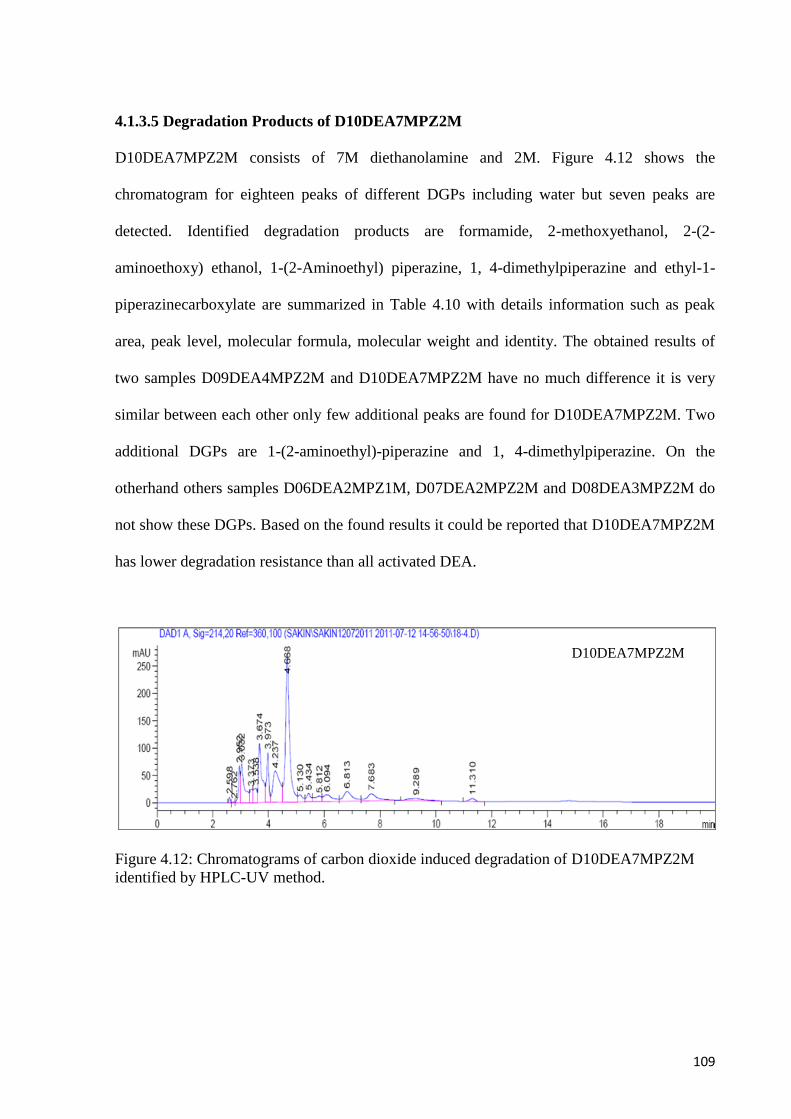
109
4.1.3.5 Degradation Products of D10DEA7MPZ2M
D10DEA7MPZ2M consists of 7M diethanolamine and 2M. Figure 4.12 shows the
chromatogram for eighteen peaks of different DGPs including water but seven peaks are
detected. Identified degradation products are formamide, 2-methoxyethanol, 2-(2-
aminoethoxy) ethanol, 1-(2-Aminoethyl) piperazine, 1, 4-dimethylpiperazine and ethyl-1-
piperazinecarboxylate are summarized in Table 4.10 with details information such as peak
area, peak level, molecular formula, molecular weight and identity. The obtained results of
two samples D09DEA4MPZ2M and D10DEA7MPZ2M have no much difference it is very
similar between each other only few additional peaks are found for D10DEA7MPZ2M. Two
additional DGPs are 1-(2-aminoethyl)-piperazine and 1, 4-dimethylpiperazine. On the
otherhand others samples D06DEA2MPZ1M, D07DEA2MPZ2M and D08DEA3MPZ2M do
not show these DGPs. Based on the found results it could be reported that D10DEA7MPZ2M
has lower degradation resistance than all activated DEA.
Figure 4.12: Chromatograms of carbon dioxide induced degradation of D10DEA7MPZ2M
identified by HPLC-UV method.
D10DEA7MPZ2M

110
Table 4.10: List of carbon dioxide induced degradation products of D10DEA7MPZ2M identified by HPLC-UV method
DS: DEA+H2O+CO2, T-100 ˚C, P-1.00 atm, Lα: 0.30, Rα: 0.73, [DEA/PZ]: 7/2, Method: HPLC (UV)
Sample
Code
Peak
No
Observed
RT of Peck
Peak
Level
Peak Area
(%)
RT of
Standard
Standard
Verification
M.
Formula
M. Weight Identity
D1
0D
EA
7M
PZ
2M
1 2.598 51 0.404 2.601 Detected H2O 18.00 Water
2 2.762 - 0.116 - X - - UN
3 2.952 - 3.224 - X - - UN
4 3.032 17 8.156 2.996 Detected HCONH2 45.04 Formamide
5 3.373 - 2.135 - X - - UN
6 3.538 - 2.697 - X - - UN
7 3.674 - 11.145 - X - - UN
8 3.973 34 6.125 3.745 Detected C3H8O2 76.09 2-Methoxyethanol
9 4.237 - 12.108 - X - - UN
10 4.668 27 32.785 4.772 Detected C4H11NO2 105.14 2-(2-aminoethoxy)ethanol
11 5.130 - 1.784 - X - - UN
12 5.434 - 1.922 - X - - UN
13 5.812 4 2.228 5.638 Detected C6H15N3 129.20 1-(2-Aminoethyl)piperazine
14 6.094 - 3.458 - X - - UN
15 6.813 18 4.755 6.754 Detected C6H14N2 114.19 1,4-Dimethylpiperazine
16 7.683 15 4.167 7.776 Detected C7H14N2O2 158.20 Ethyl 1-piperazinecarboxylate
17 9.289 - 1.848 - X - - UN
18 11.310 - 0.937 - X - - UN
N.B: UN-Unknown, RT-Retention Time (Min), X- Does Not Match
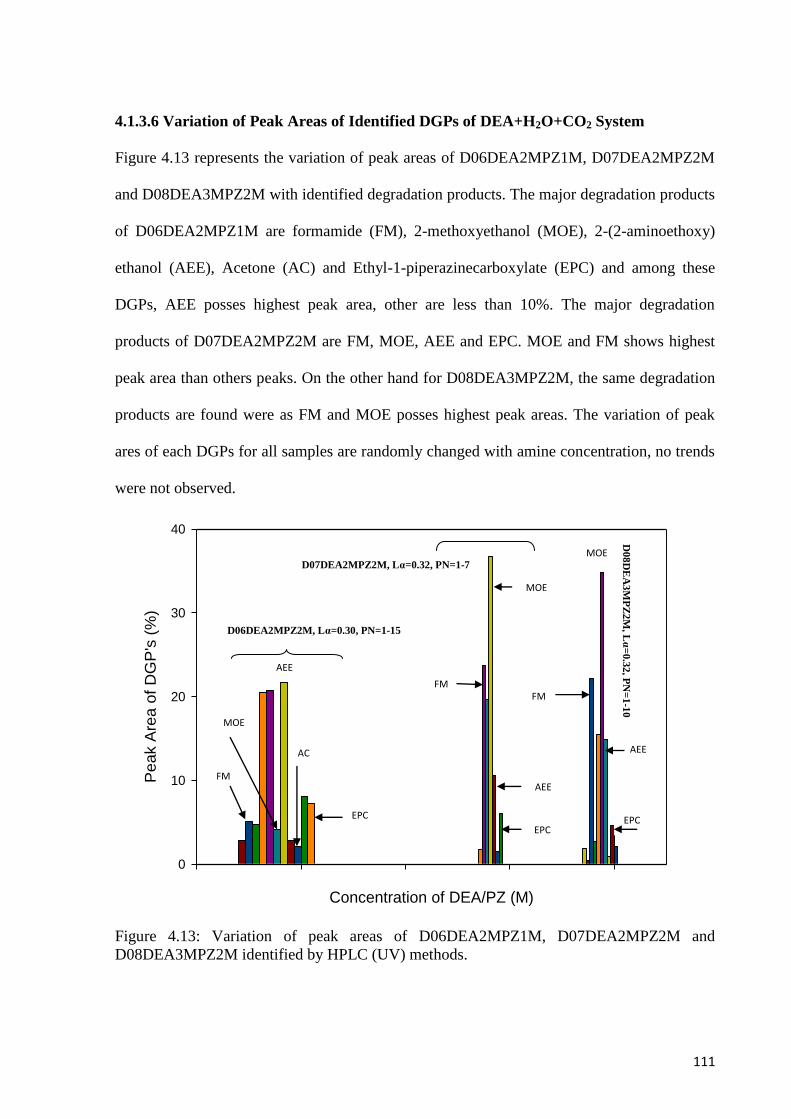
111
4.1.3.6 Variation of Peak Areas of Identified DGPs of DEA+H2O+CO2 System
Figure 4.13 represents the variation of peak areas of D06DEA2MPZ1M, D07DEA2MPZ2M
and D08DEA3MPZ2M with identified degradation products. The major degradation products
of D06DEA2MPZ1M are formamide (FM), 2-methoxyethanol (MOE), 2-(2-aminoethoxy)
ethanol (AEE), Acetone (AC) and Ethyl-1-piperazinecarboxylate (EPC) and among these
DGPs, AEE posses highest peak area, other are less than 10%. The major degradation
products of D07DEA2MPZ2M are FM, MOE, AEE and EPC. MOE and FM shows highest
peak area than others peaks. On the other hand for D08DEA3MPZ2M, the same degradation
products are found were as FM and MOE posses highest peak areas. The variation of peak
ares of each DGPs for all samples are randomly changed with amine concentration, no trends
were not observed.
Figure 4.13: Variation of peak areas of D06DEA2MPZ1M, D07DEA2MPZ2M and
D08DEA3MPZ2M identified by HPLC (UV) methods.
Concentration of DEA/PZ (M)
Pe
ak A
rea
of
DG
P's
(%
)
0
10
20
30
40
FM
MOE
AC
EPC
AEE
MOE
FM
D06DEA2MPZ2M, Lα=0.30, PN=1-15
D0
8D
EA
3M
PZ
2M
, Lα
=0.3
2, P
N=
1-1
0
EPC
AEE
FM
MOE
AEE
EPC
D07DEA2MPZ2M, Lα=0.32, PN=1-7

112
Figure 4.14 shows the variation of peak areas of D09DEA4MPZ2M and
D10DEA7MPZ2M with identified common degradation products formamide (FM), 2-
methoxyethanol (MOE), 2-(2-aminoethoxy) ethanol (AEE), 1-(2-Aminoethyl) piperazine
(AEP), 1, 4-dimethylpiperazine (DMP) and ethyl-1-piperazinecarboxylate (EPC). In this
figure comparatively AEE posses highest peak areas than all DGPs. FM and MOE were
found to posses less than 15% peak areas which decreases with amine concentration. Peak
ares AEP, DMP and EPC are increases with amine concentration.
Figure 4.14: Variation of peak areas of D09DEA4MPZ2M and D10DEA7MPZ2M identified
by HPLC (UV) method.
Concentration of DEA/PZ (M)
Pe
ak A
rea
of
DG
P's
(%
)
0
5
10
15
20
25
30
35
D09DEA4MPZ2M, Lα=0.30, PN=1-14
D1
0D
EA
7M
PZ
2M
, Lα
=0.3
0, P
N=
1-1
8
DMP
EPC
AEP
AEE
MOE
FM
FM
MOE
AEE
AEP
DMP
EPC
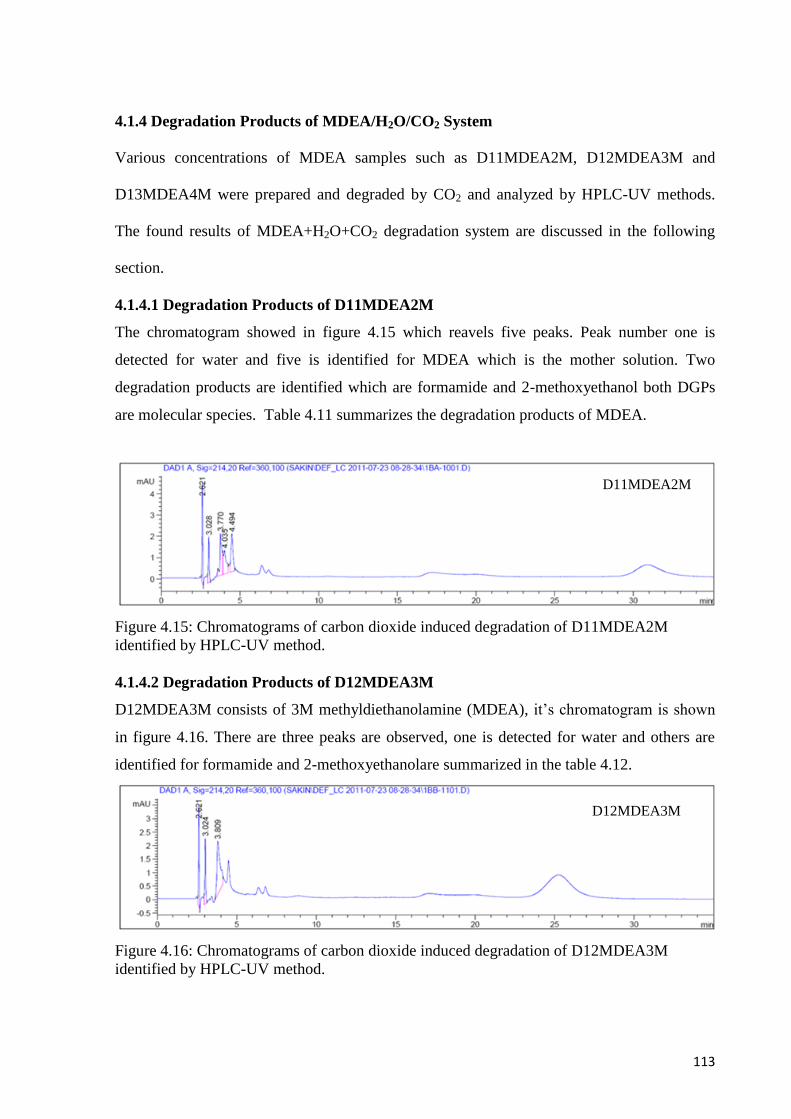
113
4.1.4 Degradation Products of MDEA/H2O/CO2 System
Various concentrations of MDEA samples such as D11MDEA2M, D12MDEA3M and
D13MDEA4M were prepared and degraded by CO2 and analyzed by HPLC-UV methods.
The found results of MDEA+H2O+CO2 degradation system are discussed in the following
section.
4.1.4.1 Degradation Products of D11MDEA2M
The chromatogram showed in figure 4.15 which reavels five peaks. Peak number one is
detected for water and five is identified for MDEA which is the mother solution. Two
degradation products are identified which are formamide and 2-methoxyethanol both DGPs
are molecular species. Table 4.11 summarizes the degradation products of MDEA.
Figure 4.15: Chromatograms of carbon dioxide induced degradation of D11MDEA2M
identified by HPLC-UV method.
4.1.4.2 Degradation Products of D12MDEA3M
D12MDEA3M consists of 3M methyldiethanolamine (MDEA), it‟s chromatogram is shown
in figure 4.16. There are three peaks are observed, one is detected for water and others are
identified for formamide and 2-methoxyethanolare summarized in the table 4.12.
Figure 4.16: Chromatograms of carbon dioxide induced degradation of D12MDEA3M
identified by HPLC-UV method.
D11MDEA2M
D12MDEA3M
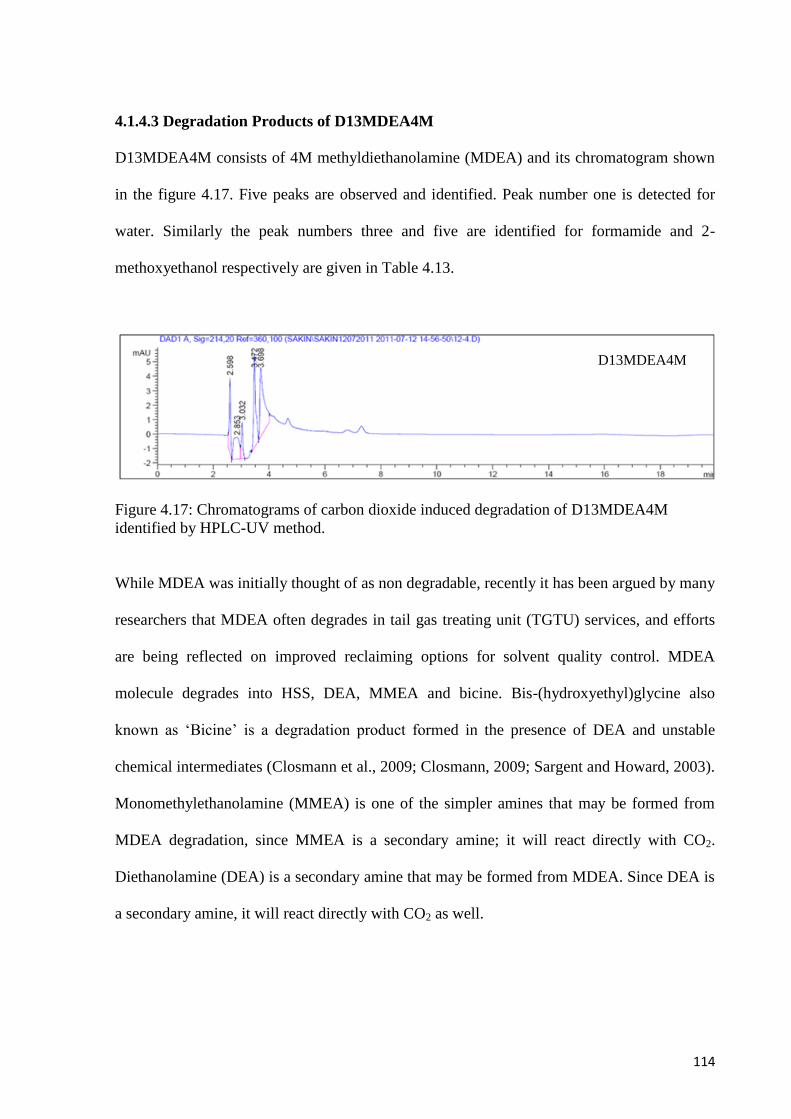
114
4.1.4.3 Degradation Products of D13MDEA4M
D13MDEA4M consists of 4M methyldiethanolamine (MDEA) and its chromatogram shown
in the figure 4.17. Five peaks are observed and identified. Peak number one is detected for
water. Similarly the peak numbers three and five are identified for formamide and 2-
methoxyethanol respectively are given in Table 4.13.
Figure 4.17: Chromatograms of carbon dioxide induced degradation of D13MDEA4M
identified by HPLC-UV method.
While MDEA was initially thought of as non degradable, recently it has been argued by many
researchers that MDEA often degrades in tail gas treating unit (TGTU) services, and efforts
are being reflected on improved reclaiming options for solvent quality control. MDEA
molecule degrades into HSS, DEA, MMEA and bicine. Bis-(hydroxyethyl)glycine also
known as „Bicine‟ is a degradation product formed in the presence of DEA and unstable
chemical intermediates (Closmann et al., 2009; Closmann, 2009; Sargent and Howard, 2003).
Monomethylethanolamine (MMEA) is one of the simpler amines that may be formed from
MDEA degradation, since MMEA is a secondary amine; it will react directly with CO2.
Diethanolamine (DEA) is a secondary amine that may be formed from MDEA. Since DEA is
a secondary amine, it will react directly with CO2 as well.
D13MDEA4M
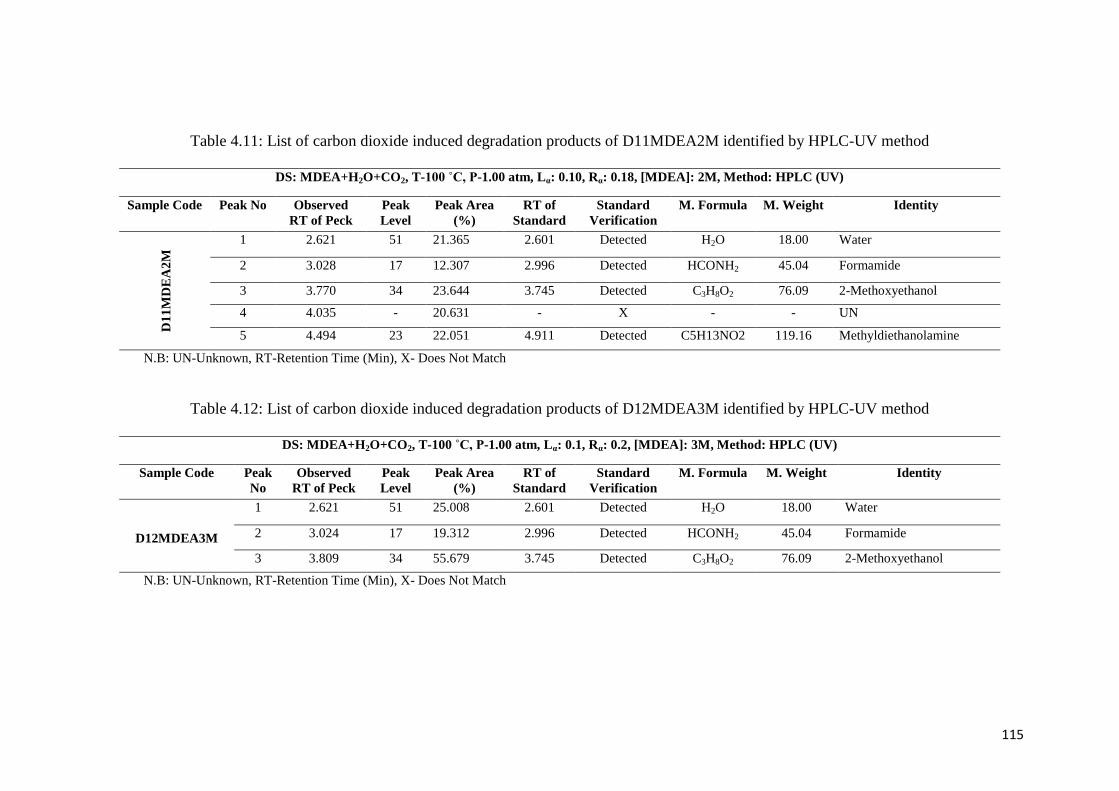
115
Table 4.11: List of carbon dioxide induced degradation products of D11MDEA2M identified by HPLC-UV method
DS: MDEA+H2O+CO2, T-100 ˚C, P-1.00 atm, Lα: 0.10, Rα: 0.18, [MDEA]: 2M, Method: HPLC (UV)
Sample Code Peak No Observed
RT of Peck
Peak
Level
Peak Area
(%)
RT of
Standard
Standard
Verification
M. Formula M. Weight Identity
D1
1M
DE
A2
M
1 2.621 51 21.365 2.601 Detected H2O 18.00 Water
2 3.028 17 12.307 2.996 Detected HCONH2 45.04 Formamide
3 3.770 34 23.644 3.745 Detected C3H8O2 76.09 2-Methoxyethanol
4 4.035 - 20.631 - X - - UN
5 4.494 23 22.051 4.911 Detected C5H13NO2 119.16 Methyldiethanolamine
N.B: UN-Unknown, RT-Retention Time (Min), X- Does Not Match
Table 4.12: List of carbon dioxide induced degradation products of D12MDEA3M identified by HPLC-UV method
DS: MDEA+H2O+CO2, T-100 ˚C, P-1.00 atm, Lα: 0.1, Rα: 0.2, [MDEA]: 3M, Method: HPLC (UV)
Sample Code
Peak
No
Observed
RT of Peck
Peak
Level
Peak Area
(%)
RT of
Standard
Standard
Verification
M. Formula M. Weight Identity
D12MDEA3M
1 2.621 51 25.008 2.601 Detected H2O 18.00 Water
2 3.024 17 19.312 2.996 Detected HCONH2 45.04 Formamide
3 3.809 34 55.679 3.745 Detected C3H8O2 76.09 2-Methoxyethanol
N.B: UN-Unknown, RT-Retention Time (Min), X- Does Not Match
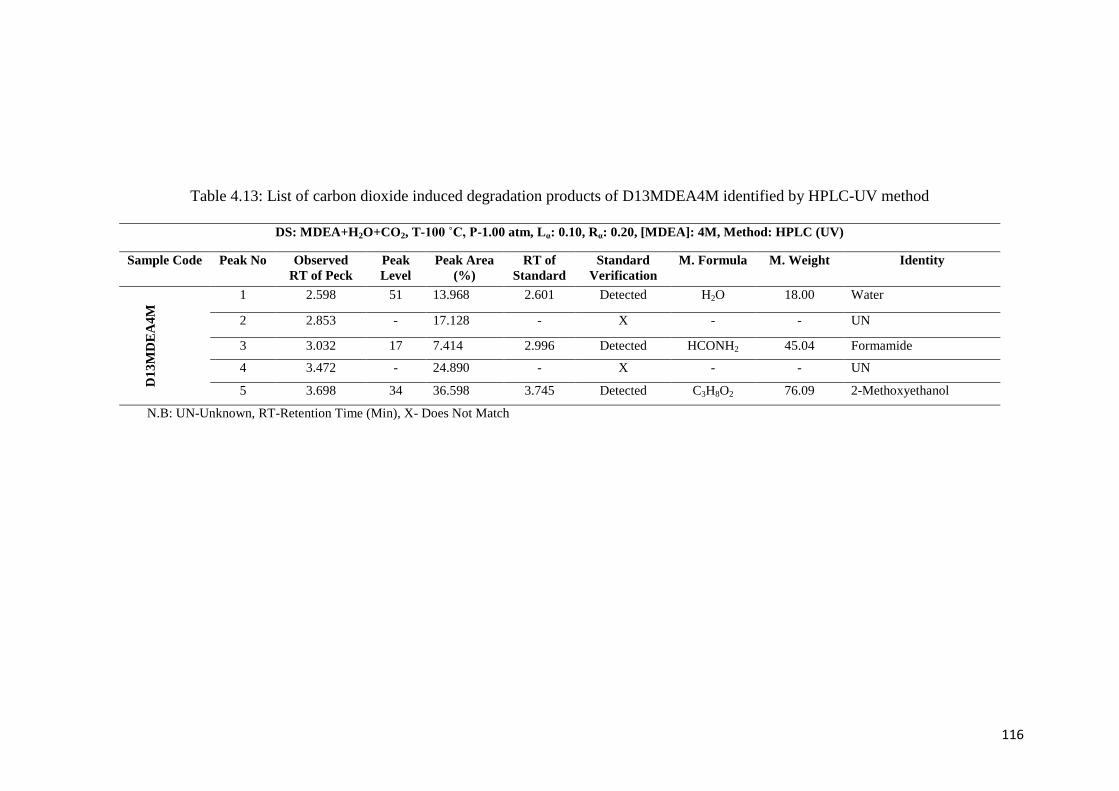
116
Table 4.13: List of carbon dioxide induced degradation products of D13MDEA4M identified by HPLC-UV method
DS: MDEA+H2O+CO2, T-100 ˚C, P-1.00 atm, Lα: 0.10, Rα: 0.20, [MDEA]: 4M, Method: HPLC (UV)
Sample Code Peak No Observed
RT of Peck
Peak
Level
Peak Area
(%)
RT of
Standard
Standard
Verification
M. Formula M. Weight Identity
D1
3M
DE
A4
M
1 2.598 51 13.968 2.601 Detected H2O 18.00 Water
2 2.853 - 17.128 - X - - UN
3 3.032 17 7.414 2.996 Detected HCONH2 45.04 Formamide
4 3.472 - 24.890 - X - - UN
5 3.698 34 36.598 3.745 Detected C3H8O2 76.09 2-Methoxyethanol
N.B: UN-Unknown, RT-Retention Time (Min), X- Does Not Match
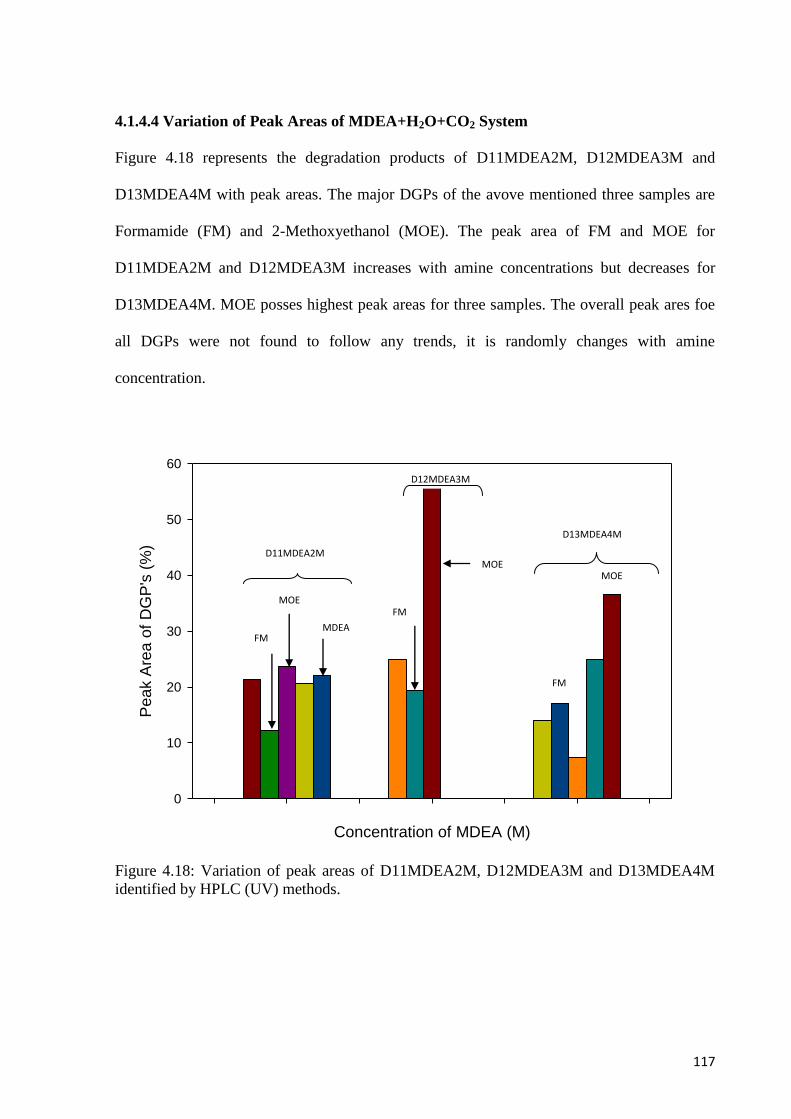
117
4.1.4.4 Variation of Peak Areas of MDEA+H2O+CO2 System
Figure 4.18 represents the degradation products of D11MDEA2M, D12MDEA3M and
D13MDEA4M with peak areas. The major DGPs of the avove mentioned three samples are
Formamide (FM) and 2-Methoxyethanol (MOE). The peak area of FM and MOE for
D11MDEA2M and D12MDEA3M increases with amine concentrations but decreases for
D13MDEA4M. MOE posses highest peak areas for three samples. The overall peak ares foe
all DGPs were not found to follow any trends, it is randomly changes with amine
concentration.
Figure 4.18: Variation of peak areas of D11MDEA2M, D12MDEA3M and D13MDEA4M
identified by HPLC (UV) methods.
Concentration of MDEA (M)
Pe
ak A
rea
of
DG
P's
(%
)
0
10
20
30
40
50
60
MDEA
MOE
FM
MOE MOE
FM
D11MDEA2M
D12MDEA3M
D13MDEA4M
FM
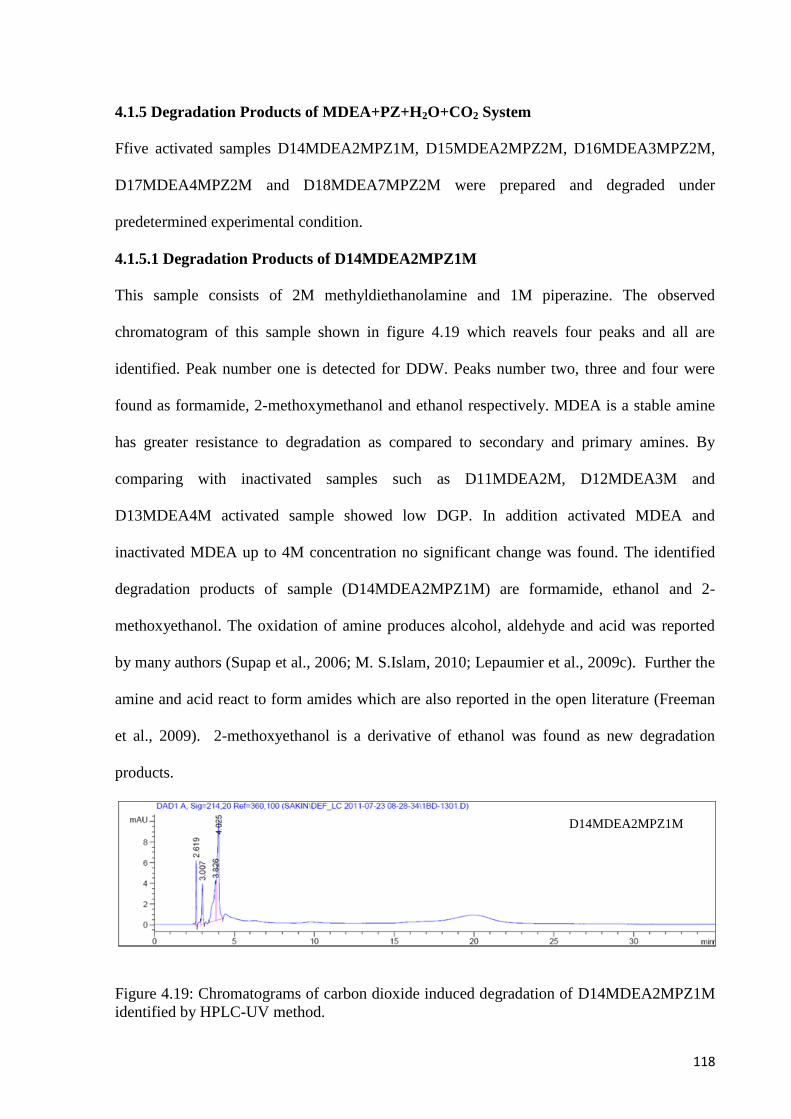
118
4.1.5 Degradation Products of MDEA+PZ+H2O+CO2 System
Ffive activated samples D14MDEA2MPZ1M, D15MDEA2MPZ2M, D16MDEA3MPZ2M,
D17MDEA4MPZ2M and D18MDEA7MPZ2M were prepared and degraded under
predetermined experimental condition.
4.1.5.1 Degradation Products of D14MDEA2MPZ1M
This sample consists of 2M methyldiethanolamine and 1M piperazine. The observed
chromatogram of this sample shown in figure 4.19 which reavels four peaks and all are
identified. Peak number one is detected for DDW. Peaks number two, three and four were
found as formamide, 2-methoxymethanol and ethanol respectively. MDEA is a stable amine
has greater resistance to degradation as compared to secondary and primary amines. By
comparing with inactivated samples such as D11MDEA2M, D12MDEA3M and
D13MDEA4M activated sample showed low DGP. In addition activated MDEA and
inactivated MDEA up to 4M concentration no significant change was found. The identified
degradation products of sample (D14MDEA2MPZ1M) are formamide, ethanol and 2-
methoxyethanol. The oxidation of amine produces alcohol, aldehyde and acid was reported
by many authors (Supap et al., 2006; M. S.Islam, 2010; Lepaumier et al., 2009c). Further the
amine and acid react to form amides which are also reported in the open literature (Freeman
et al., 2009). 2-methoxyethanol is a derivative of ethanol was found as new degradation
products.
Figure 4.19: Chromatograms of carbon dioxide induced degradation of D14MDEA2MPZ1M
identified by HPLC-UV method.
D14MDEA2MPZ1M
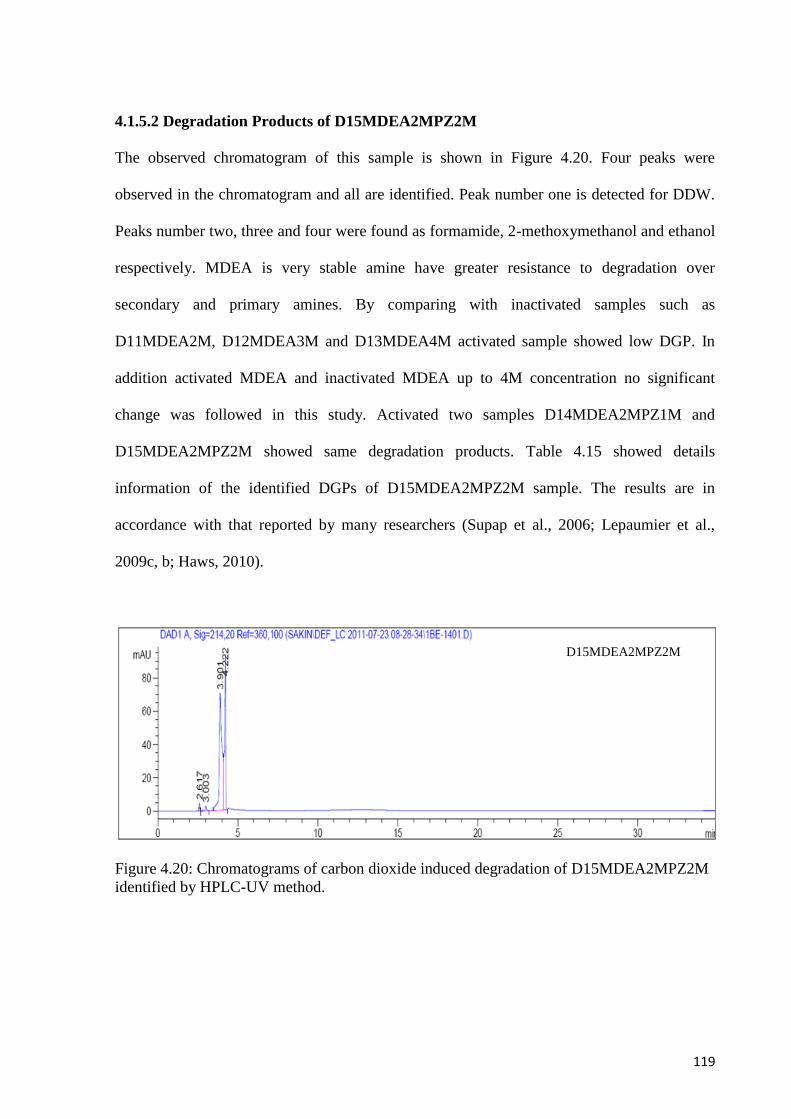
119
4.1.5.2 Degradation Products of D15MDEA2MPZ2M
The observed chromatogram of this sample is shown in Figure 4.20. Four peaks were
observed in the chromatogram and all are identified. Peak number one is detected for DDW.
Peaks number two, three and four were found as formamide, 2-methoxymethanol and ethanol
respectively. MDEA is very stable amine have greater resistance to degradation over
secondary and primary amines. By comparing with inactivated samples such as
D11MDEA2M, D12MDEA3M and D13MDEA4M activated sample showed low DGP. In
addition activated MDEA and inactivated MDEA up to 4M concentration no significant
change was followed in this study. Activated two samples D14MDEA2MPZ1M and
D15MDEA2MPZ2M showed same degradation products. Table 4.15 showed details
information of the identified DGPs of D15MDEA2MPZ2M sample. The results are in
accordance with that reported by many researchers (Supap et al., 2006; Lepaumier et al.,
2009c, b; Haws, 2010).
Figure 4.20: Chromatograms of carbon dioxide induced degradation of D15MDEA2MPZ2M
identified by HPLC-UV method.
D15MDEA2MPZ2M
M
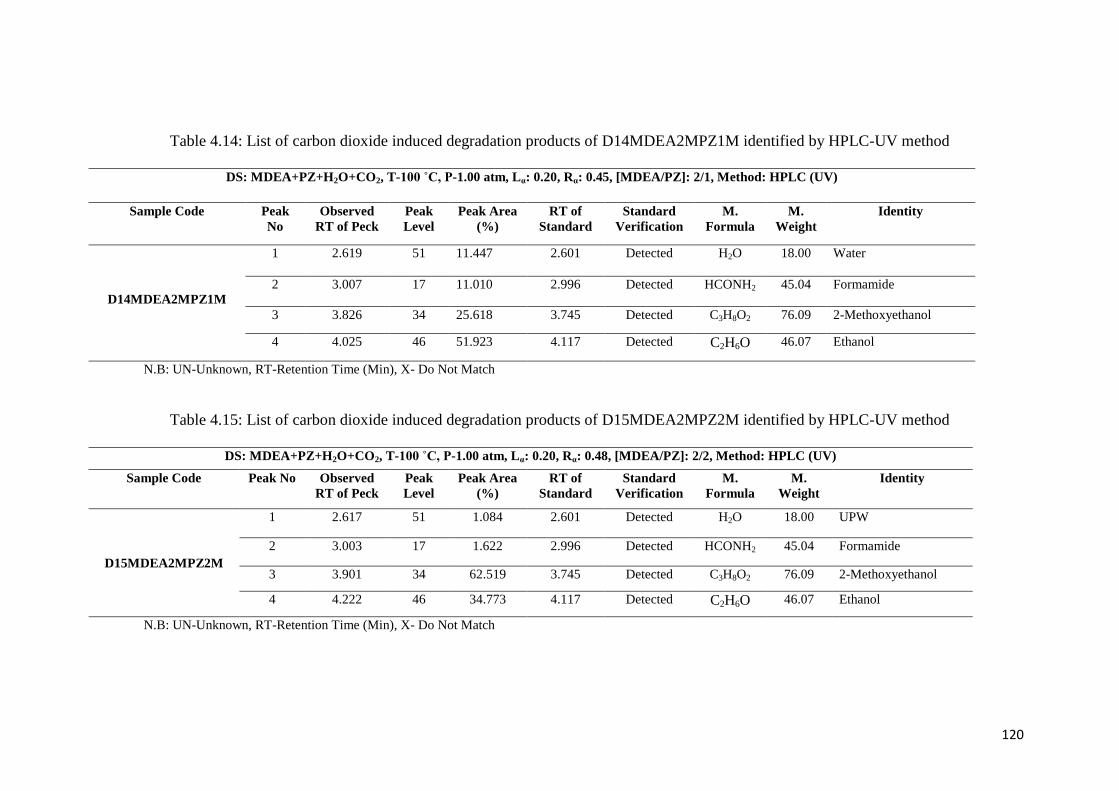
120
Table 4.14: List of carbon dioxide induced degradation products of D14MDEA2MPZ1M identified by HPLC-UV method
DS: MDEA+PZ+H2O+CO2, T-100 ˚C, P-1.00 atm, Lα: 0.20, Rα: 0.45, [MDEA/PZ]: 2/1, Method: HPLC (UV)
Sample Code
Peak
No
Observed
RT of Peck
Peak
Level
Peak Area
(%)
RT of
Standard
Standard
Verification
M.
Formula
M.
Weight
Identity
D14MDEA2MPZ1M
1 2.619 51 11.447 2.601 Detected H2O 18.00 Water
2 3.007 17 11.010 2.996 Detected HCONH2 45.04 Formamide
3 3.826 34 25.618 3.745 Detected C3H8O2 76.09 2-Methoxyethanol
4 4.025 46 51.923 4.117 Detected C2H6O 46.07 Ethanol
N.B: UN-Unknown, RT-Retention Time (Min), X- Do Not Match
Table 4.15: List of carbon dioxide induced degradation products of D15MDEA2MPZ2M identified by HPLC-UV method
DS: MDEA+PZ+H2O+CO2, T-100 ˚C, P-1.00 atm, Lα: 0.20, Rα: 0.48, [MDEA/PZ]: 2/2, Method: HPLC (UV)
Sample Code
Peak No Observed
RT of Peck
Peak
Level
Peak Area
(%)
RT of
Standard
Standard
Verification
M.
Formula
M.
Weight
Identity
D15MDEA2MPZ2M
1 2.617 51 1.084 2.601 Detected H2O 18.00 UPW
2 3.003 17 1.622 2.996 Detected HCONH2 45.04 Formamide
3 3.901 34 62.519 3.745 Detected C3H8O2 76.09 2-Methoxyethanol
4 4.222 46 34.773 4.117 Detected C2H6O 46.07 Ethanol
N.B: UN-Unknown, RT-Retention Time (Min), X- Do Not Match
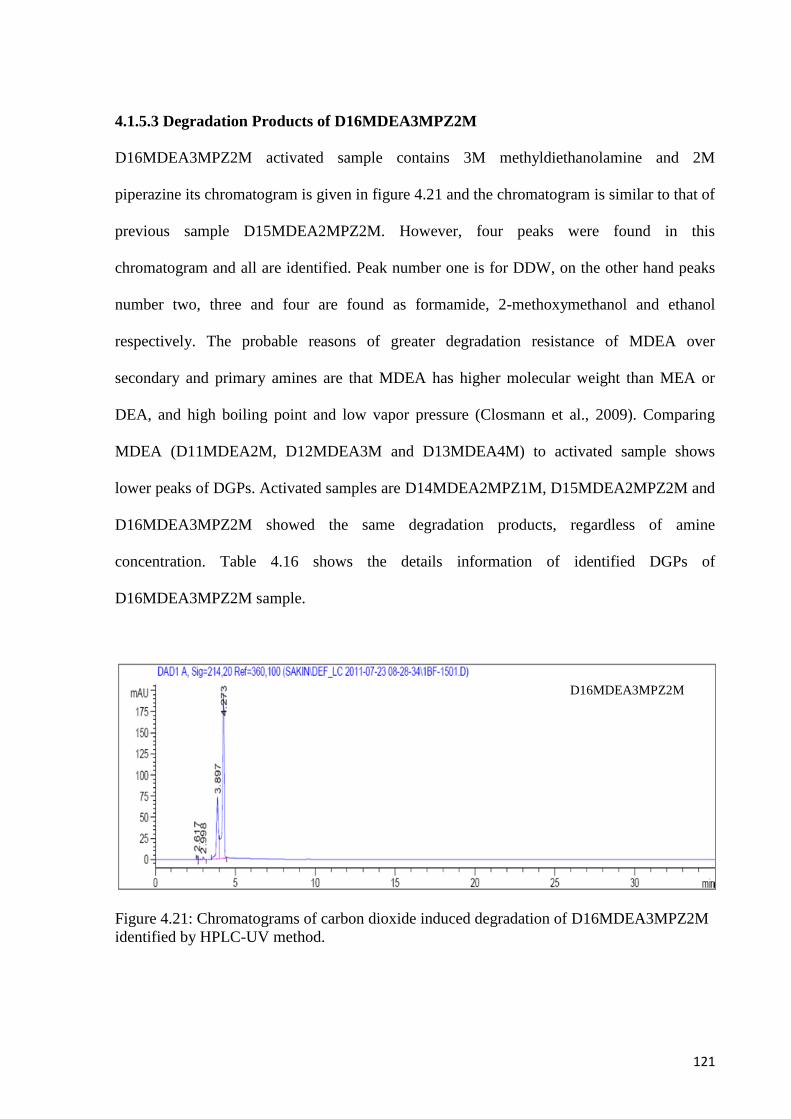
121
4.1.5.3 Degradation Products of D16MDEA3MPZ2M
D16MDEA3MPZ2M activated sample contains 3M methyldiethanolamine and 2M
piperazine its chromatogram is given in figure 4.21 and the chromatogram is similar to that of
previous sample D15MDEA2MPZ2M. However, four peaks were found in this
chromatogram and all are identified. Peak number one is for DDW, on the other hand peaks
number two, three and four are found as formamide, 2-methoxymethanol and ethanol
respectively. The probable reasons of greater degradation resistance of MDEA over
secondary and primary amines are that MDEA has higher molecular weight than MEA or
DEA, and high boiling point and low vapor pressure (Closmann et al., 2009). Comparing
MDEA (D11MDEA2M, D12MDEA3M and D13MDEA4M) to activated sample shows
lower peaks of DGPs. Activated samples are D14MDEA2MPZ1M, D15MDEA2MPZ2M and
D16MDEA3MPZ2M showed the same degradation products, regardless of amine
concentration. Table 4.16 shows the details information of identified DGPs of
D16MDEA3MPZ2M sample.
Figure 4.21: Chromatograms of carbon dioxide induced degradation of D16MDEA3MPZ2M
identified by HPLC-UV method.
D16MDEA3MPZ2M
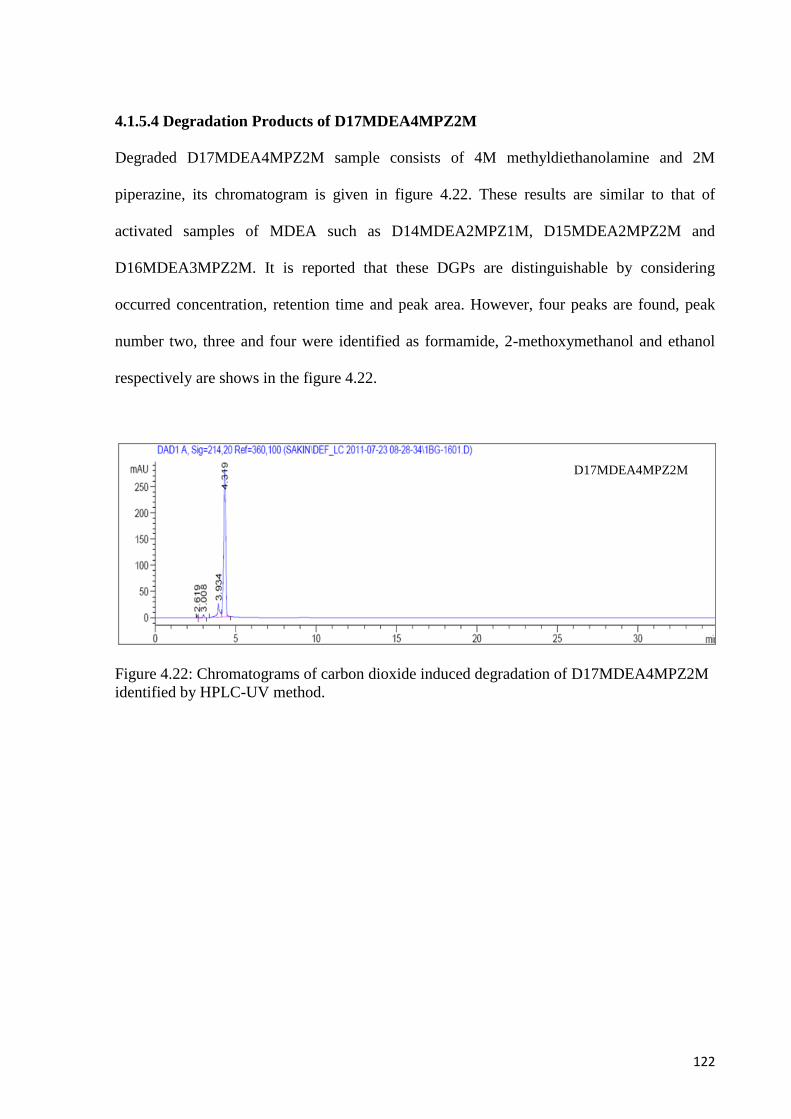
122
4.1.5.4 Degradation Products of D17MDEA4MPZ2M
Degraded D17MDEA4MPZ2M sample consists of 4M methyldiethanolamine and 2M
piperazine, its chromatogram is given in figure 4.22. These results are similar to that of
activated samples of MDEA such as D14MDEA2MPZ1M, D15MDEA2MPZ2M and
D16MDEA3MPZ2M. It is reported that these DGPs are distinguishable by considering
occurred concentration, retention time and peak area. However, four peaks are found, peak
number two, three and four were identified as formamide, 2-methoxymethanol and ethanol
respectively are shows in the figure 4.22.
Figure 4.22: Chromatograms of carbon dioxide induced degradation of D17MDEA4MPZ2M
identified by HPLC-UV method.
D17MDEA4MPZ2M
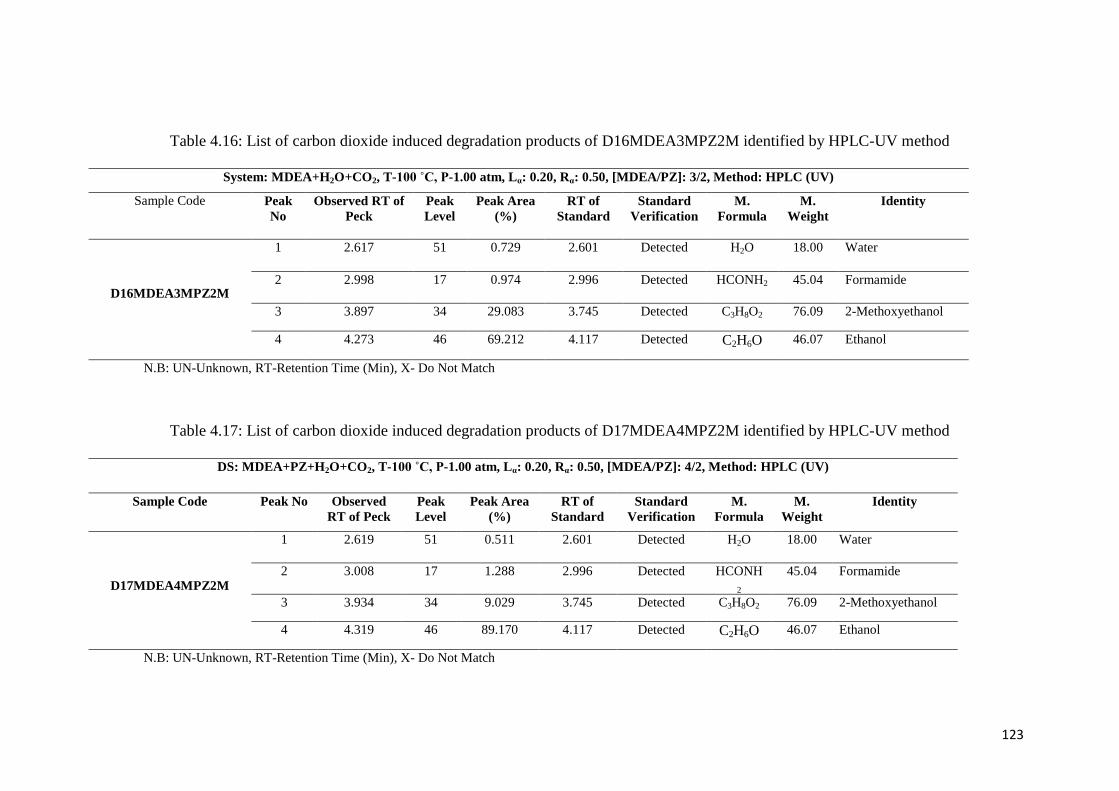
123
Table 4.16: List of carbon dioxide induced degradation products of D16MDEA3MPZ2M identified by HPLC-UV method
System: MDEA+H2O+CO2, T-100 ˚C, P-1.00 atm, Lα: 0.20, Rα: 0.50, [MDEA/PZ]: 3/2, Method: HPLC (UV)
Sample Code
Peak
No
Observed RT of
Peck
Peak
Level
Peak Area
(%)
RT of
Standard
Standard
Verification
M.
Formula
M.
Weight
Identity
D16MDEA3MPZ2M
1 2.617 51 0.729 2.601 Detected H2O 18.00 Water
2 2.998 17 0.974 2.996 Detected HCONH2 45.04 Formamide
3 3.897 34 29.083 3.745 Detected C3H8O2 76.09 2-Methoxyethanol
4 4.273 46 69.212 4.117 Detected C2H6O 46.07 Ethanol
N.B: UN-Unknown, RT-Retention Time (Min), X- Do Not Match
Table 4.17: List of carbon dioxide induced degradation products of D17MDEA4MPZ2M identified by HPLC-UV method
DS: MDEA+PZ+H2O+CO2, T-100 ˚C, P-1.00 atm, Lα: 0.20, Rα: 0.50, [MDEA/PZ]: 4/2, Method: HPLC (UV)
Sample Code
Peak No Observed
RT of Peck
Peak
Level
Peak Area
(%)
RT of
Standard
Standard
Verification
M.
Formula
M.
Weight
Identity
D17MDEA4MPZ2M
1 2.619 51 0.511 2.601 Detected H2O 18.00 Water
2 3.008 17 1.288 2.996 Detected HCONH
2
45.04 Formamide
3 3.934 34 9.029 3.745 Detected C3H8O2 76.09 2-Methoxyethanol
4 4.319 46 89.170 4.117 Detected C2H6O 46.07 Ethanol
N.B: UN-Unknown, RT-Retention Time (Min), X- Do Not Match
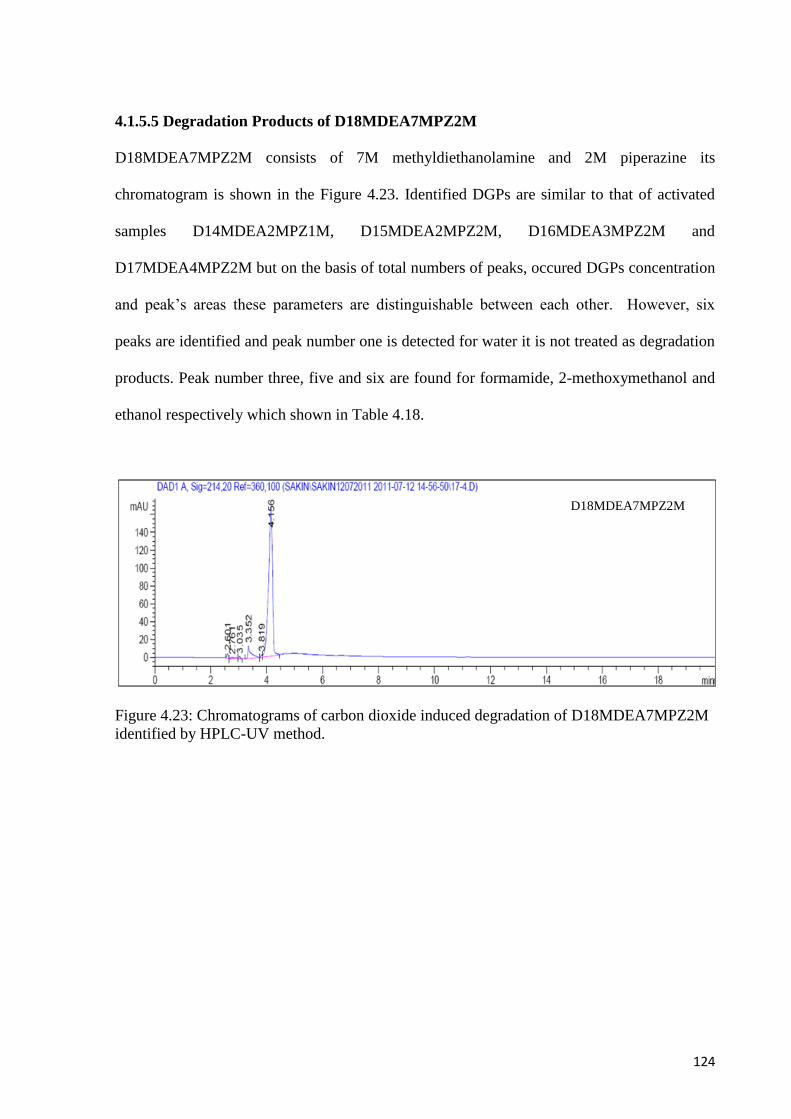
124
4.1.5.5 Degradation Products of D18MDEA7MPZ2M
D18MDEA7MPZ2M consists of 7M methyldiethanolamine and 2M piperazine its
chromatogram is shown in the Figure 4.23. Identified DGPs are similar to that of activated
samples D14MDEA2MPZ1M, D15MDEA2MPZ2M, D16MDEA3MPZ2M and
D17MDEA4MPZ2M but on the basis of total numbers of peaks, occured DGPs concentration
and peak‟s areas these parameters are distinguishable between each other. However, six
peaks are identified and peak number one is detected for water it is not treated as degradation
products. Peak number three, five and six are found for formamide, 2-methoxymethanol and
ethanol respectively which shown in Table 4.18.
Figure 4.23: Chromatograms of carbon dioxide induced degradation of D18MDEA7MPZ2M
identified by HPLC-UV method.
D18MDEA7MPZ2M
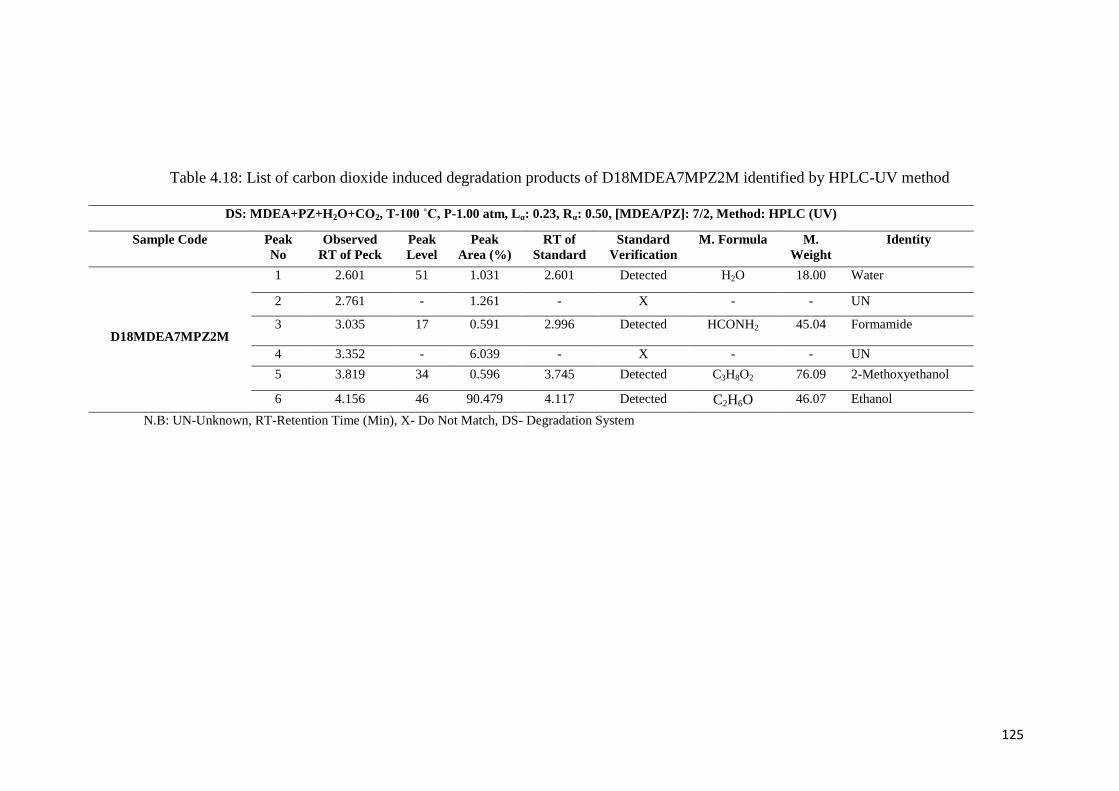
125
Table 4.18: List of carbon dioxide induced degradation products of D18MDEA7MPZ2M identified by HPLC-UV method
DS: MDEA+PZ+H2O+CO2, T-100 ˚C, P-1.00 atm, Lα: 0.23, Rα: 0.50, [MDEA/PZ]: 7/2, Method: HPLC (UV)
Sample Code
Peak
No
Observed
RT of Peck
Peak
Level
Peak
Area (%)
RT of
Standard
Standard
Verification
M. Formula M.
Weight
Identity
D18MDEA7MPZ2M
1 2.601 51 1.031 2.601 Detected H2O 18.00 Water
2 2.761 - 1.261 - X - - UN
3 3.035 17 0.591 2.996 Detected HCONH2 45.04 Formamide
4 3.352 - 6.039 - X - - UN
5 3.819 34 0.596 3.745 Detected C3H8O2 76.09 2-Methoxyethanol
6 4.156 46 90.479 4.117 Detected C2H6O 46.07 Ethanol
N.B: UN-Unknown, RT-Retention Time (Min), X- Do Not Match, DS- Degradation System
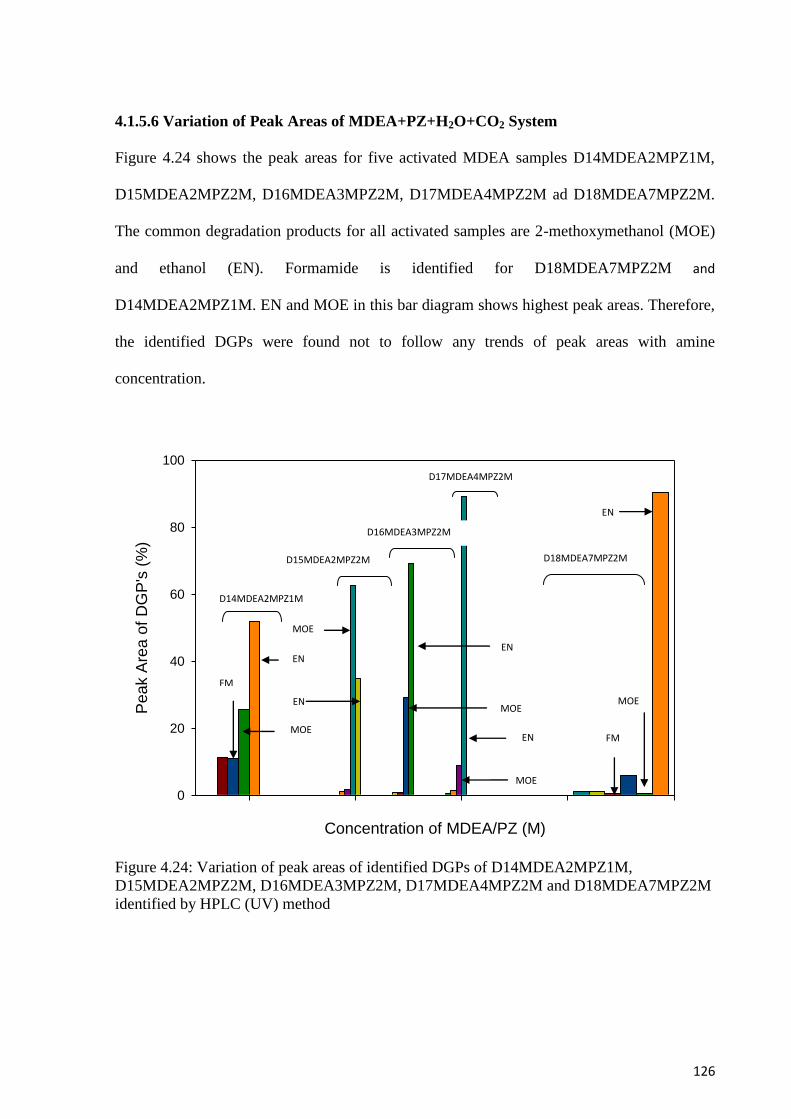
126
4.1.5.6 Variation of Peak Areas of MDEA+PZ+H2O+CO2 System
Figure 4.24 shows the peak areas for five activated MDEA samples D14MDEA2MPZ1M,
D15MDEA2MPZ2M, D16MDEA3MPZ2M, D17MDEA4MPZ2M ad D18MDEA7MPZ2M.
The common degradation products for all activated samples are 2-methoxymethanol (MOE)
and ethanol (EN). Formamide is identified for D18MDEA7MPZ2M and
D14MDEA2MPZ1M. EN and MOE in this bar diagram shows highest peak areas. Therefore,
the identified DGPs were found not to follow any trends of peak areas with amine
concentration.
Figure 4.24: Variation of peak areas of identified DGPs of D14MDEA2MPZ1M,
D15MDEA2MPZ2M, D16MDEA3MPZ2M, D17MDEA4MPZ2M and D18MDEA7MPZ2M
identified by HPLC (UV) method
Concentration of MDEA/PZ (M)
Pe
ak A
rea
of
DG
P's
(%
)
0
20
40
60
80
100
D14MDEA2MPZ1M
D16MDEA3MPZ2M
D17MDEA4MPZ2M
D18MDEA7MPZ2M
D15MDEA2MPZ2M
FM
MOE
EN
EN
MOE
FM
EN
EN
EN
MOE
MOE MOE
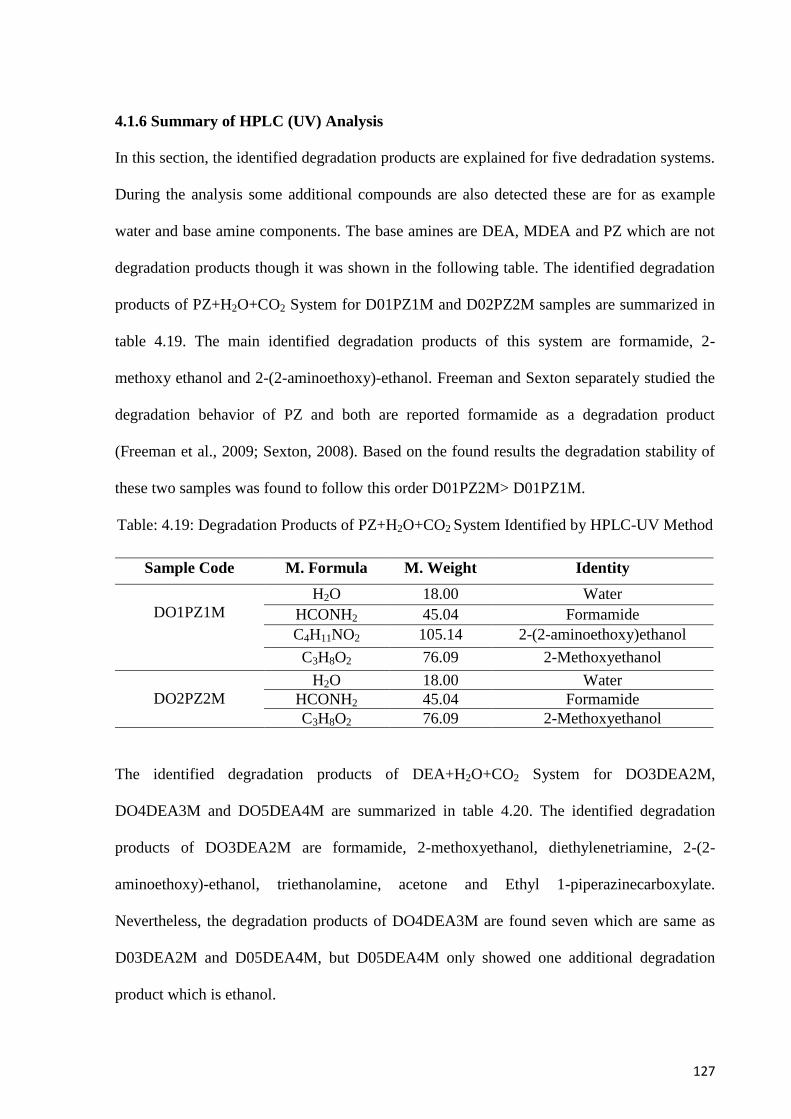
127
4.1.6 Summary of HPLC (UV) Analysis
In this section, the identified degradation products are explained for five dedradation systems.
During the analysis some additional compounds are also detected these are for as example
water and base amine components. The base amines are DEA, MDEA and PZ which are not
degradation products though it was shown in the following table. The identified degradation
products of PZ+H2O+CO2 System for D01PZ1M and D02PZ2M samples are summarized in
table 4.19. The main identified degradation products of this system are formamide, 2-
methoxy ethanol and 2-(2-aminoethoxy)-ethanol. Freeman and Sexton separately studied the
degradation behavior of PZ and both are reported formamide as a degradation product
(Freeman et al., 2009; Sexton, 2008). Based on the found results the degradation stability of
these two samples was found to follow this order D01PZ2M> D01PZ1M.
Table: 4.19: Degradation Products of PZ+H2O+CO2 System Identified by HPLC-UV Method
Sample Code M. Formula M. Weight Identity
DO1PZ1M
H2O 18.00 Water
HCONH2 45.04 Formamide
C4H11NO2 105.14 2-(2-aminoethoxy)ethanol
C3H8O2 76.09 2-Methoxyethanol
DO2PZ2M
H2O 18.00 Water
HCONH2 45.04 Formamide
C3H8O2 76.09 2-Methoxyethanol
The identified degradation products of DEA+H2O+CO2 System for DO3DEA2M,
DO4DEA3M and DO5DEA4M are summarized in table 4.20. The identified degradation
products of DO3DEA2M are formamide, 2-methoxyethanol, diethylenetriamine, 2-(2-
aminoethoxy)-ethanol, triethanolamine, acetone and Ethyl 1-piperazinecarboxylate.
Nevertheless, the degradation products of DO4DEA3M are found seven which are same as
D03DEA2M and D05DEA4M, but D05DEA4M only showed one additional degradation
product which is ethanol.
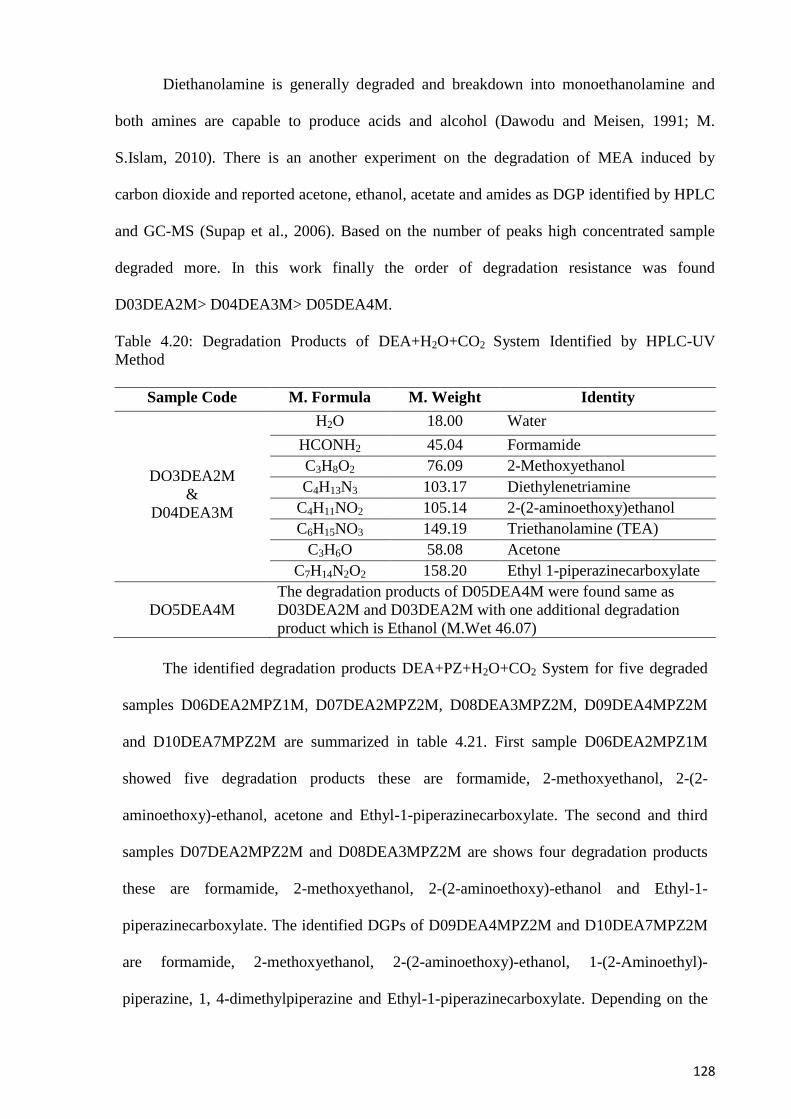
128
Diethanolamine is generally degraded and breakdown into monoethanolamine and
both amines are capable to produce acids and alcohol (Dawodu and Meisen, 1991; M.
S.Islam, 2010). There is an another experiment on the degradation of MEA induced by
carbon dioxide and reported acetone, ethanol, acetate and amides as DGP identified by HPLC
and GC-MS (Supap et al., 2006). Based on the number of peaks high concentrated sample
degraded more. In this work finally the order of degradation resistance was found
D03DEA2M> D04DEA3M> D05DEA4M.
Table 4.20: Degradation Products of DEA+H2O+CO2 System Identified by HPLC-UV
Method
Sample Code M. Formula M. Weight Identity
DO3DEA2M
&
D04DEA3M
H2O 18.00 Water
HCONH2 45.04 Formamide
C3H8O2 76.09 2-Methoxyethanol
C4H13N3 103.17 Diethylenetriamine
C4H11NO2 105.14 2-(2-aminoethoxy)ethanol
C6H15NO3 149.19 Triethanolamine (TEA)
C3H6O 58.08 Acetone
C7H14N2O2 158.20 Ethyl 1-piperazinecarboxylate
DO5DEA4M
The degradation products of D05DEA4M were found same as
D03DEA2M and D03DEA2M with one additional degradation
product which is Ethanol (M.Wet 46.07)
The identified degradation products DEA+PZ+H2O+CO2 System for five degraded
samples D06DEA2MPZ1M, D07DEA2MPZ2M, D08DEA3MPZ2M, D09DEA4MPZ2M
and D10DEA7MPZ2M are summarized in table 4.21. First sample D06DEA2MPZ1M
showed five degradation products these are formamide, 2-methoxyethanol, 2-(2-
aminoethoxy)-ethanol, acetone and Ethyl-1-piperazinecarboxylate. The second and third
samples D07DEA2MPZ2M and D08DEA3MPZ2M are shows four degradation products
these are formamide, 2-methoxyethanol, 2-(2-aminoethoxy)-ethanol and Ethyl-1-
piperazinecarboxylate. The identified DGPs of D09DEA4MPZ2M and D10DEA7MPZ2M
are formamide, 2-methoxyethanol, 2-(2-aminoethoxy)-ethanol, 1-(2-Aminoethyl)-
piperazine, 1, 4-dimethylpiperazine and Ethyl-1-piperazinecarboxylate. Depending on the
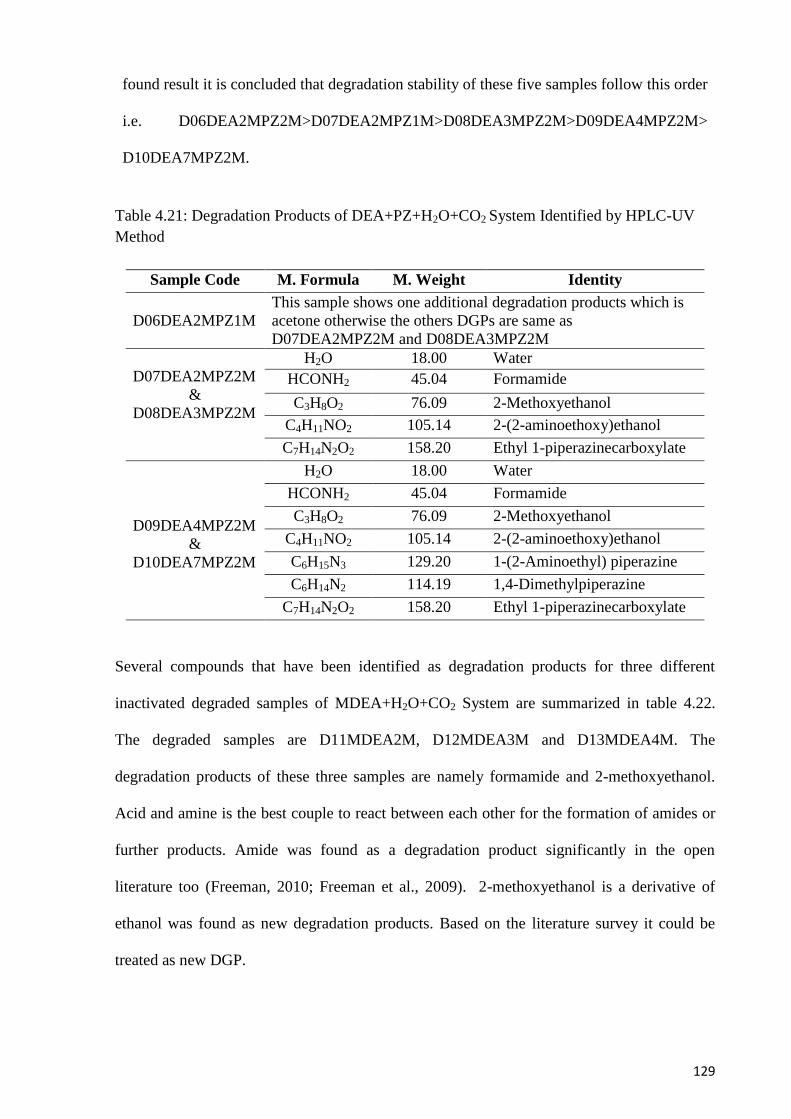
129
found result it is concluded that degradation stability of these five samples follow this order
i.e. D06DEA2MPZ2M>D07DEA2MPZ1M>D08DEA3MPZ2M>D09DEA4MPZ2M>
D10DEA7MPZ2M.
Table 4.21: Degradation Products of DEA+PZ+H2O+CO2 System Identified by HPLC-UV
Method
Sample Code M. Formula M. Weight Identity
D06DEA2MPZ1M
This sample shows one additional degradation products which is
acetone otherwise the others DGPs are same as
D07DEA2MPZ2M and D08DEA3MPZ2M
D07DEA2MPZ2M
&
D08DEA3MPZ2M
H2O 18.00 Water
HCONH2 45.04 Formamide
C3H8O2 76.09 2-Methoxyethanol
C4H11NO2 105.14 2-(2-aminoethoxy)ethanol
C7H14N2O2 158.20 Ethyl 1-piperazinecarboxylate
D09DEA4MPZ2M
&
D10DEA7MPZ2M
H2O 18.00 Water
HCONH2 45.04 Formamide
C3H8O2 76.09 2-Methoxyethanol
C4H11NO2 105.14 2-(2-aminoethoxy)ethanol
C6H15N3 129.20 1-(2-Aminoethyl) piperazine
C6H14N2 114.19 1,4-Dimethylpiperazine
C7H14N2O2 158.20 Ethyl 1-piperazinecarboxylate
Several compounds that have been identified as degradation products for three different
inactivated degraded samples of MDEA+H2O+CO2 System are summarized in table 4.22.
The degraded samples are D11MDEA2M, D12MDEA3M and D13MDEA4M. The
degradation products of these three samples are namely formamide and 2-methoxyethanol.
Acid and amine is the best couple to react between each other for the formation of amides or
further products. Amide was found as a degradation product significantly in the open
literature too (Freeman, 2010; Freeman et al., 2009). 2-methoxyethanol is a derivative of
ethanol was found as new degradation products. Based on the literature survey it could be
treated as new DGP.
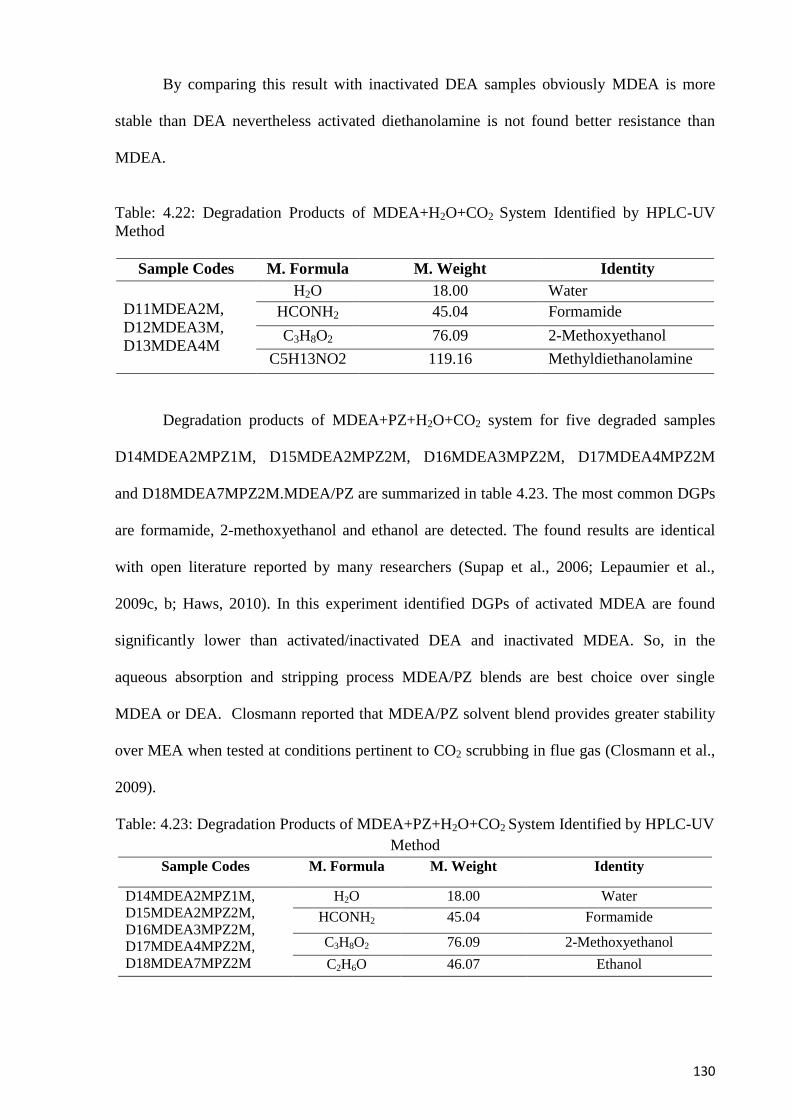
130
By comparing this result with inactivated DEA samples obviously MDEA is more
stable than DEA nevertheless activated diethanolamine is not found better resistance than
MDEA.
Table: 4.22: Degradation Products of MDEA+H2O+CO2 System Identified by HPLC-UV
Method
Sample Codes M. Formula M. Weight Identity
D11MDEA2M,
D12MDEA3M,
D13MDEA4M
H2O 18.00 Water
HCONH2 45.04 Formamide
C3H8O2 76.09 2-Methoxyethanol
C5H13NO2 119.16 Methyldiethanolamine
Degradation products of MDEA+PZ+H2O+CO2 system for five degraded samples
D14MDEA2MPZ1M, D15MDEA2MPZ2M, D16MDEA3MPZ2M, D17MDEA4MPZ2M
and D18MDEA7MPZ2M.MDEA/PZ are summarized in table 4.23. The most common DGPs
are formamide, 2-methoxyethanol and ethanol are detected. The found results are identical
with open literature reported by many researchers (Supap et al., 2006; Lepaumier et al.,
2009c, b; Haws, 2010). In this experiment identified DGPs of activated MDEA are found
significantly lower than activated/inactivated DEA and inactivated MDEA. So, in the
aqueous absorption and stripping process MDEA/PZ blends are best choice over single
MDEA or DEA. Closmann reported that MDEA/PZ solvent blend provides greater stability
over MEA when tested at conditions pertinent to CO2 scrubbing in flue gas (Closmann et al.,
2009).
Table: 4.23: Degradation Products of MDEA+PZ+H2O+CO2 System Identified by HPLC-UV
Method
Sample Codes M. Formula M. Weight Identity
D14MDEA2MPZ1M, D15MDEA2MPZ2M,
D16MDEA3MPZ2M,
D17MDEA4MPZ2M,
D18MDEA7MPZ2M
H2O 18.00 Water
HCONH2 45.04 Formamide
C3H8O2 76.09 2-Methoxyethanol
C2H6O 46.07 Ethanol
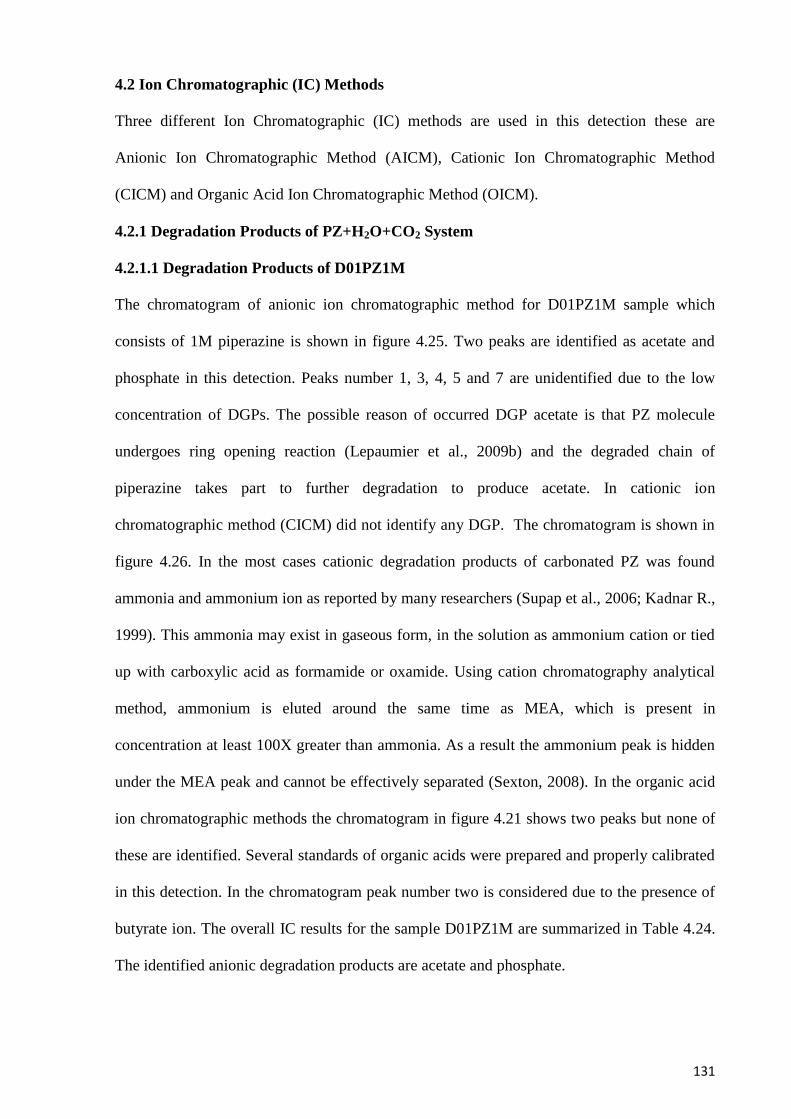
131
4.2 Ion Chromatographic (IC) Methods
Three different Ion Chromatographic (IC) methods are used in this detection these are
Anionic Ion Chromatographic Method (AICM), Cationic Ion Chromatographic Method
(CICM) and Organic Acid Ion Chromatographic Method (OICM).
4.2.1 Degradation Products of PZ+H2O+CO2 System
4.2.1.1 Degradation Products of D01PZ1M
The chromatogram of anionic ion chromatographic method for D01PZ1M sample which
consists of 1M piperazine is shown in figure 4.25. Two peaks are identified as acetate and
phosphate in this detection. Peaks number 1, 3, 4, 5 and 7 are unidentified due to the low
concentration of DGPs. The possible reason of occurred DGP acetate is that PZ molecule
undergoes ring opening reaction (Lepaumier et al., 2009b) and the degraded chain of
piperazine takes part to further degradation to produce acetate. In cationic ion
chromatographic method (CICM) did not identify any DGP. The chromatogram is shown in
figure 4.26. In the most cases cationic degradation products of carbonated PZ was found
ammonia and ammonium ion as reported by many researchers (Supap et al., 2006; Kadnar R.,
1999). This ammonia may exist in gaseous form, in the solution as ammonium cation or tied
up with carboxylic acid as formamide or oxamide. Using cation chromatography analytical
method, ammonium is eluted around the same time as MEA, which is present in
concentration at least 100X greater than ammonia. As a result the ammonium peak is hidden
under the MEA peak and cannot be effectively separated (Sexton, 2008). In the organic acid
ion chromatographic methods the chromatogram in figure 4.21 shows two peaks but none of
these are identified. Several standards of organic acids were prepared and properly calibrated
in this detection. In the chromatogram peak number two is considered due to the presence of
butyrate ion. The overall IC results for the sample D01PZ1M are summarized in Table 4.24.
The identified anionic degradation products are acetate and phosphate.
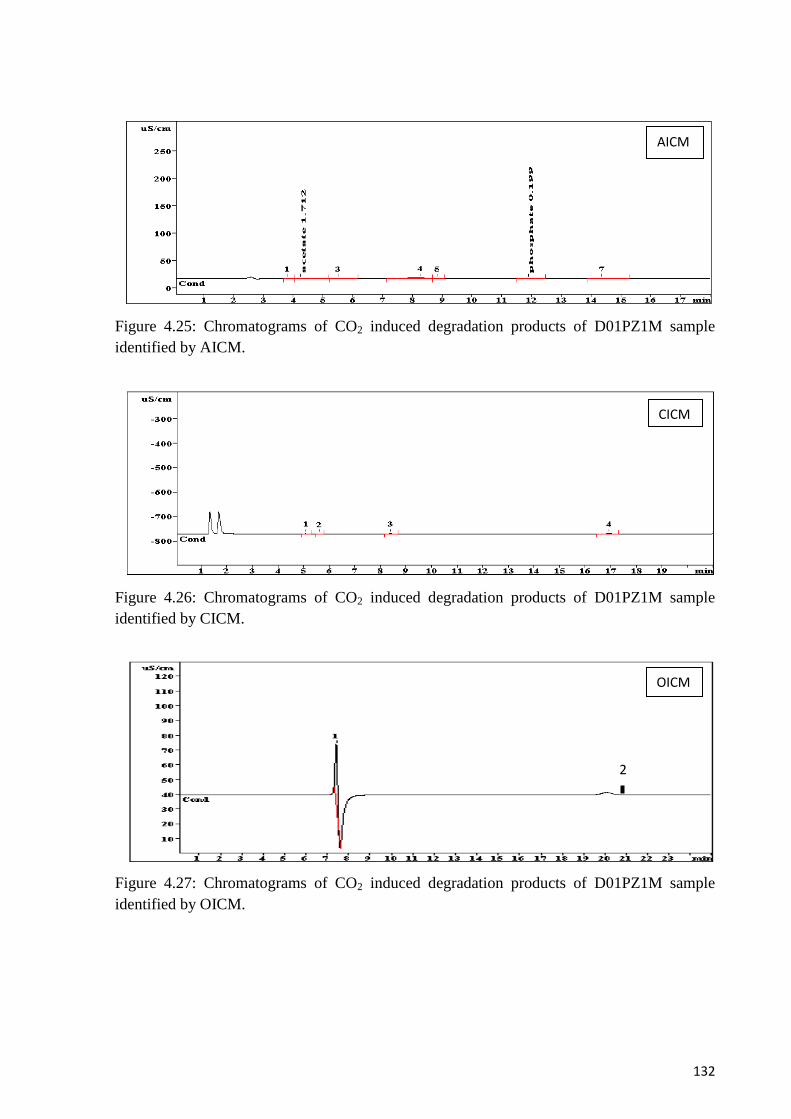
132
Figure 4.25: Chromatograms of CO2 induced degradation products of D01PZ1M sample
identified by AICM.
Figure 4.26: Chromatograms of CO2 induced degradation products of D01PZ1M sample
identified by CICM.
Figure 4.27: Chromatograms of CO2 induced degradation products of D01PZ1M sample
identified by OICM.
AICM
CICM
2
OICM
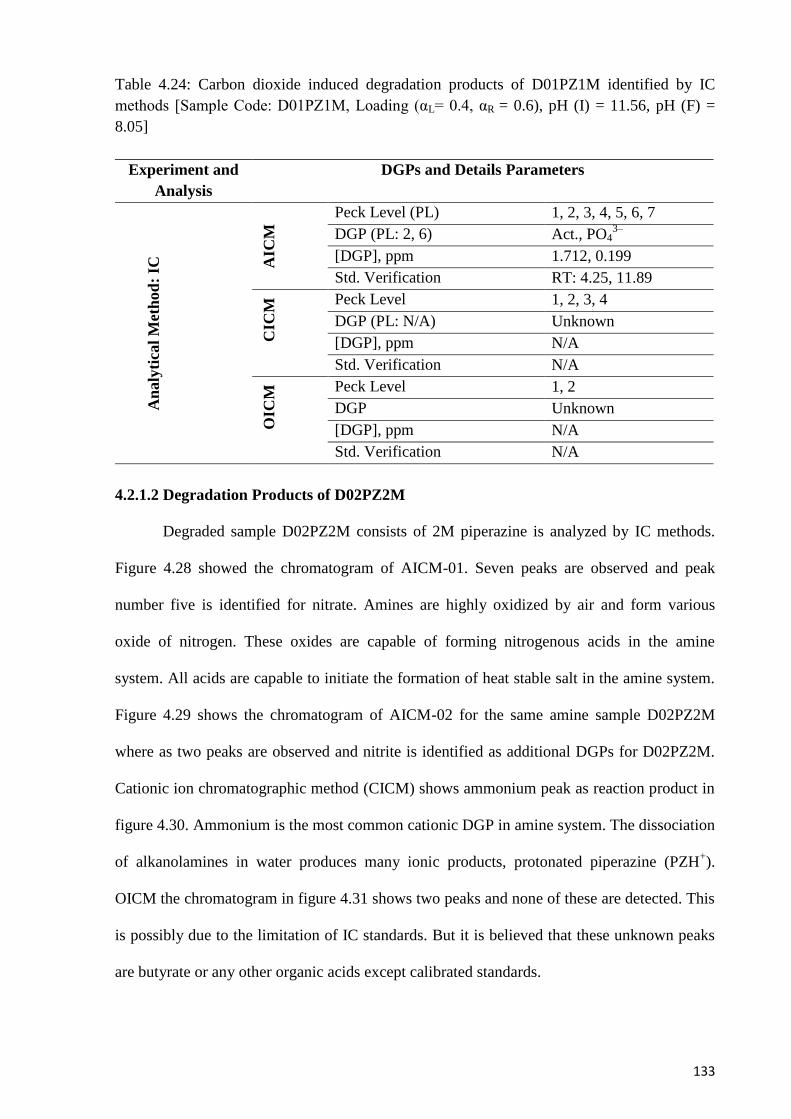
133
Table 4.24: Carbon dioxide induced degradation products of D01PZ1M identified by IC
methods [Sample Code: D01PZ1M, Loading (αL= 0.4, αR = 0.6), pH (I) = 11.56, pH (F) =
8.05]
Experiment and
Analysis
DGPs and Details Parameters
An
aly
tica
l M
eth
od
: IC
AIC
M Peck Level (PL) 1, 2, 3, 4, 5, 6, 7
DGP (PL: 2, 6) Act., PO43–
[DGP], ppm 1.712, 0.199
Std. Verification RT: 4.25, 11.89 C
ICM
Peck Level 1, 2, 3, 4
DGP (PL: N/A) Unknown
[DGP], ppm N/A
Std. Verification N/A
OIC
M Peck Level 1, 2
DGP Unknown
[DGP], ppm N/A
Std. Verification N/A
4.2.1.2 Degradation Products of D02PZ2M
Degraded sample D02PZ2M consists of 2M piperazine is analyzed by IC methods.
Figure 4.28 showed the chromatogram of AICM-01. Seven peaks are observed and peak
number five is identified for nitrate. Amines are highly oxidized by air and form various
oxide of nitrogen. These oxides are capable of forming nitrogenous acids in the amine
system. All acids are capable to initiate the formation of heat stable salt in the amine system.
Figure 4.29 shows the chromatogram of AICM-02 for the same amine sample D02PZ2M
where as two peaks are observed and nitrite is identified as additional DGPs for D02PZ2M.
Cationic ion chromatographic method (CICM) shows ammonium peak as reaction product in
figure 4.30. Ammonium is the most common cationic DGP in amine system. The dissociation
of alkanolamines in water produces many ionic products, protonated piperazine (PZH+).
OICM the chromatogram in figure 4.31 shows two peaks and none of these are detected. This
is possibly due to the limitation of IC standards. But it is believed that these unknown peaks
are butyrate or any other organic acids except calibrated standards.
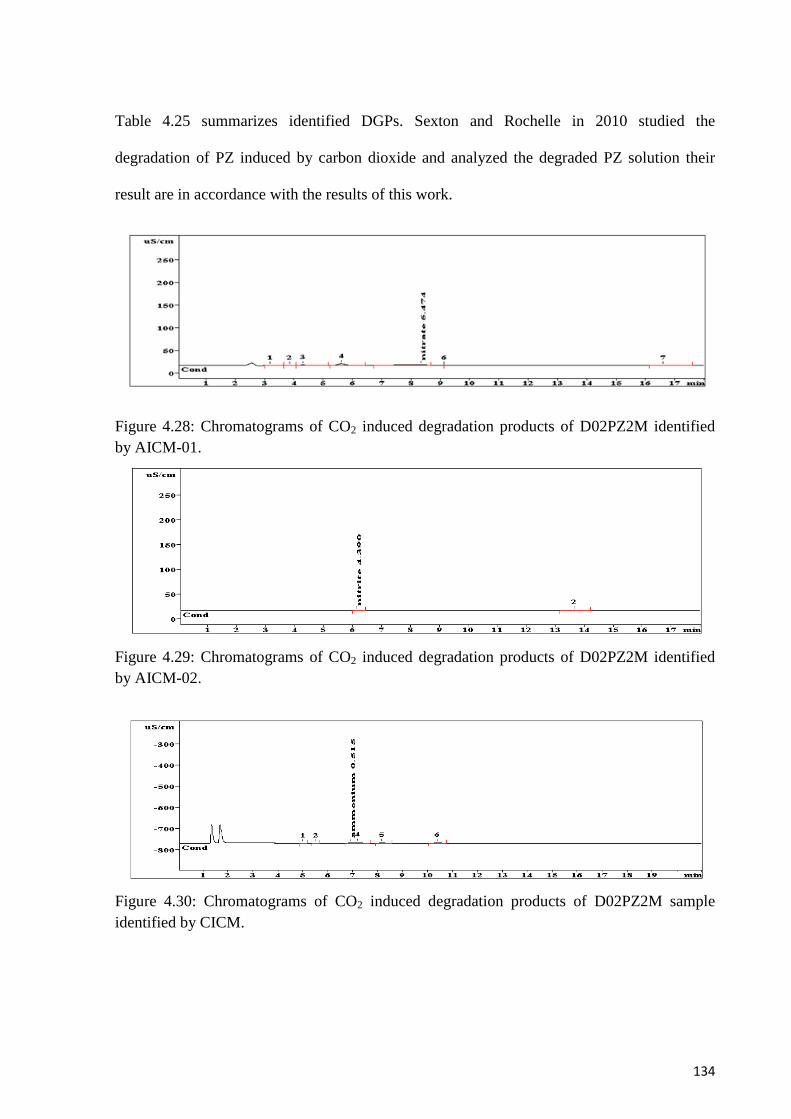
134
Table 4.25 summarizes identified DGPs. Sexton and Rochelle in 2010 studied the
degradation of PZ induced by carbon dioxide and analyzed the degraded PZ solution their
result are in accordance with the results of this work.
Figure 4.28: Chromatograms of CO2 induced degradation products of D02PZ2M identified
by AICM-01.
Figure 4.29: Chromatograms of CO2 induced degradation products of D02PZ2M identified
by AICM-02.
Figure 4.30: Chromatograms of CO2 induced degradation products of D02PZ2M sample
identified by CICM.

135
Figure 4.31: Chromatograms of CO2 induced degradation products of D02PZ2M sample
identified by OICM.
Table 4.25: Carbon dioxide induced degradation products of D02PZ2M identified by IC
methods [Sample Code: D02PZ2M, Loading (αL= 0.3, αR = 0.8), pH (I) = 11.56, pH (F) =
8.05]
Analytical
Method
DGPs and Details Parameters
An
aly
tica
l M
eth
od
: IC
AIC
M
Peck Level (PL) 1, 2, 3, 4, 5, 6, 7
DGP (PL: 5) NO3–
[DGP], ppm 6.474
Std. Verification RT: 8.33
Additional DGP, Fig. 5.5 [NO2–] = 4.390, RT-6.15
CIC
M Peck Level 1, 2, 3, 4, 5, 6
DGP (PL: 3) NH4+
[DGP], ppm 0.515
Std. Verification RT-6.91
OIC
M Peck Level 1, 2
DGP Unknown
[DGP], ppm N/A
Std. Verification N/A
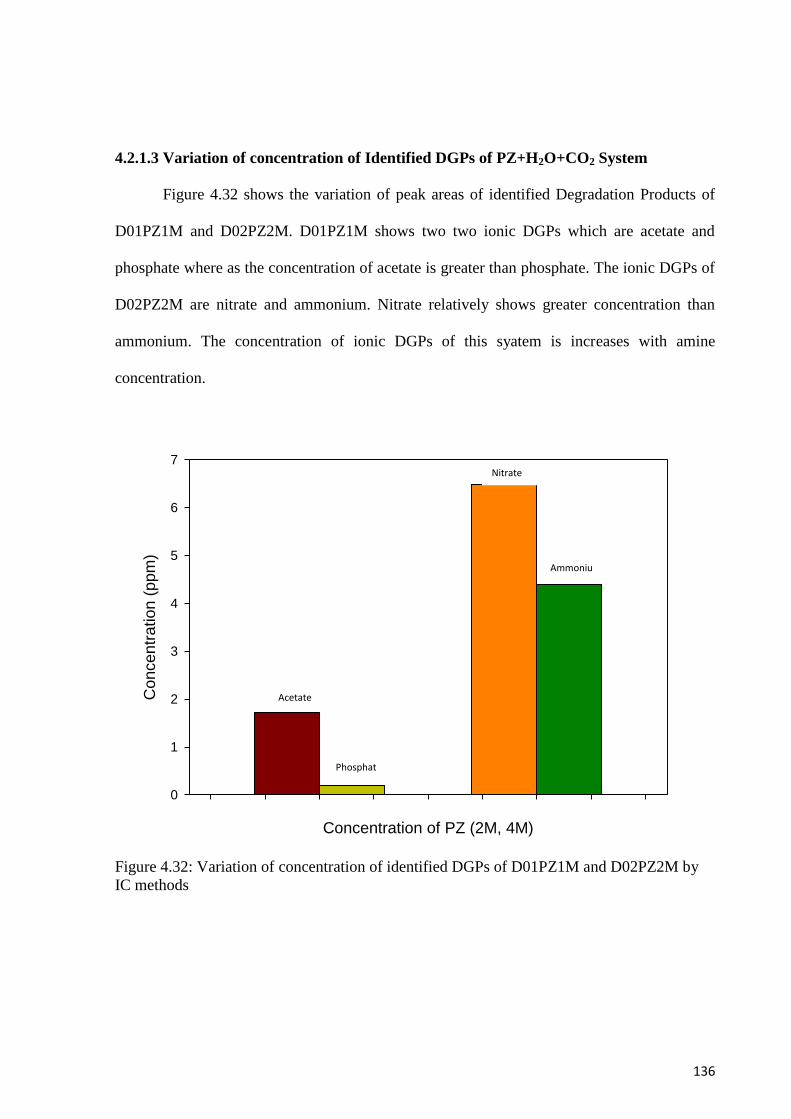
136
4.2.1.3 Variation of concentration of Identified DGPs of PZ+H2O+CO2 System
Figure 4.32 shows the variation of peak areas of identified Degradation Products of
D01PZ1M and D02PZ2M. D01PZ1M shows two two ionic DGPs which are acetate and
phosphate where as the concentration of acetate is greater than phosphate. The ionic DGPs of
D02PZ2M are nitrate and ammonium. Nitrate relatively shows greater concentration than
ammonium. The concentration of ionic DGPs of this syatem is increases with amine
concentration.
Figure 4.32: Variation of concentration of identified DGPs of D01PZ1M and D02PZ2M by
IC methods
Concentration of PZ (2M, 4M)
Co
nce
ntr
atio
n (
pp
m)
0
1
2
3
4
5
6
7
Acetate
Phosphat
e
Nitrate
Ammoniu
m
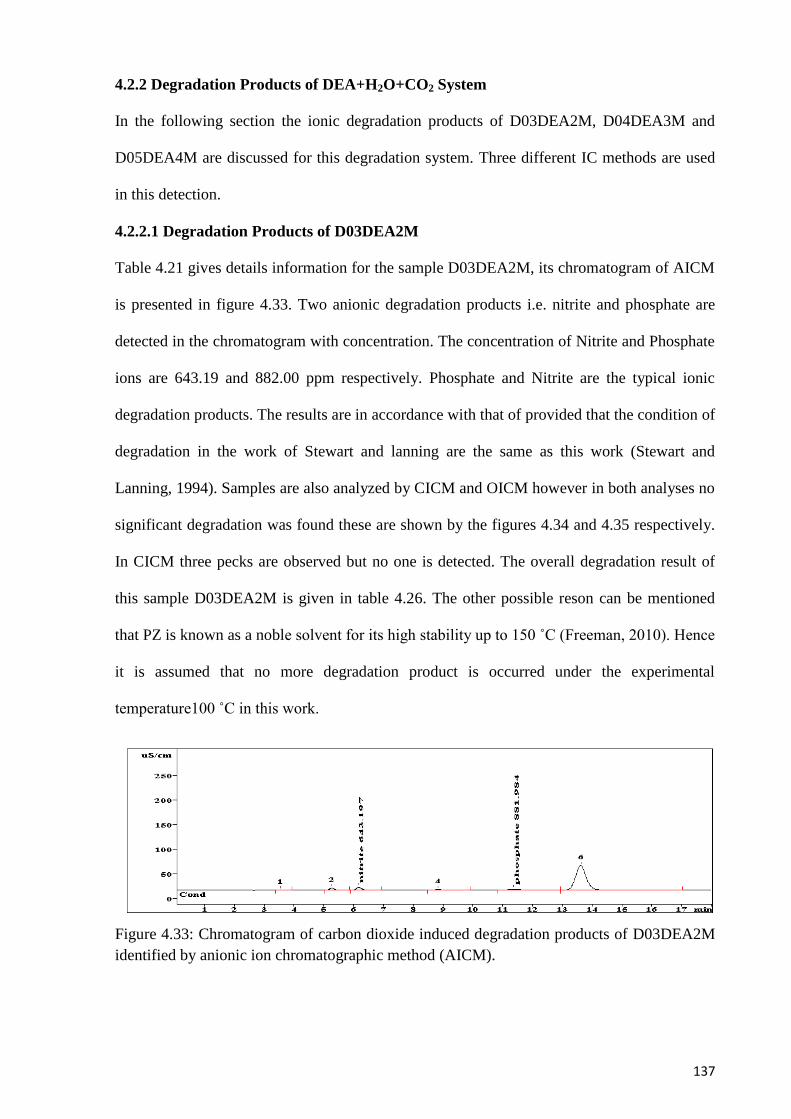
137
4.2.2 Degradation Products of DEA+H2O+CO2 System
In the following section the ionic degradation products of D03DEA2M, D04DEA3M and
D05DEA4M are discussed for this degradation system. Three different IC methods are used
in this detection.
4.2.2.1 Degradation Products of D03DEA2M
Table 4.21 gives details information for the sample D03DEA2M, its chromatogram of AICM
is presented in figure 4.33. Two anionic degradation products i.e. nitrite and phosphate are
detected in the chromatogram with concentration. The concentration of Nitrite and Phosphate
ions are 643.19 and 882.00 ppm respectively. Phosphate and Nitrite are the typical ionic
degradation products. The results are in accordance with that of provided that the condition of
degradation in the work of Stewart and lanning are the same as this work (Stewart and
Lanning, 1994). Samples are also analyzed by CICM and OICM however in both analyses no
significant degradation was found these are shown by the figures 4.34 and 4.35 respectively.
In CICM three pecks are observed but no one is detected. The overall degradation result of
this sample D03DEA2M is given in table 4.26. The other possible reson can be mentioned
that PZ is known as a noble solvent for its high stability up to 150 ˚C (Freeman, 2010). Hence
it is assumed that no more degradation product is occurred under the experimental
temperature100 ˚C in this work.
Figure 4.33: Chromatogram of carbon dioxide induced degradation products of D03DEA2M
identified by anionic ion chromatographic method (AICM).
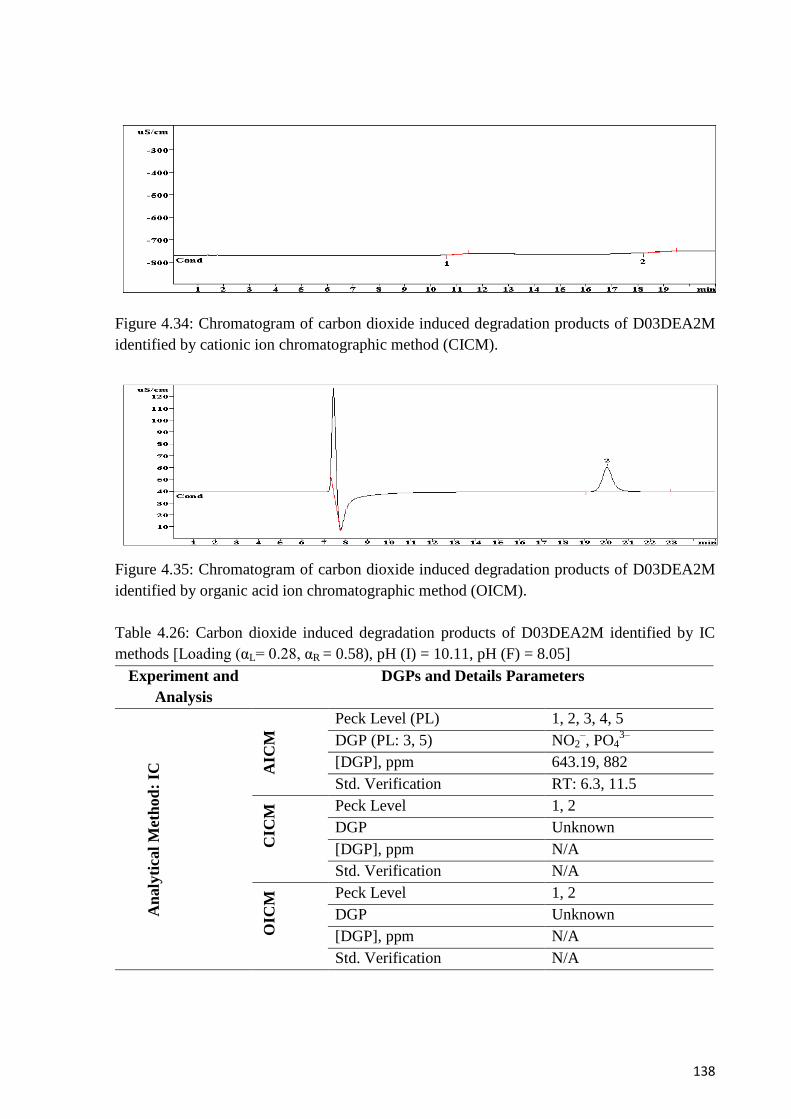
138
Figure 4.34: Chromatogram of carbon dioxide induced degradation products of D03DEA2M
identified by cationic ion chromatographic method (CICM).
Figure 4.35: Chromatogram of carbon dioxide induced degradation products of D03DEA2M
identified by organic acid ion chromatographic method (OICM).
Table 4.26: Carbon dioxide induced degradation products of D03DEA2M identified by IC
methods [Loading (αL= 0.28, αR = 0.58), pH (I) = 10.11, pH (F) = 8.05]
Experiment and
Analysis
DGPs and Details Parameters
An
aly
tica
l M
eth
od
: IC
AIC
M Peck Level (PL) 1, 2, 3, 4, 5
DGP (PL: 3, 5) NO2–, PO4
3–
[DGP], ppm 643.19, 882
Std. Verification RT: 6.3, 11.5
CIC
M Peck Level 1, 2
DGP Unknown
[DGP], ppm N/A
Std. Verification N/A
OIC
M Peck Level 1, 2
DGP Unknown
[DGP], ppm N/A
Std. Verification N/A
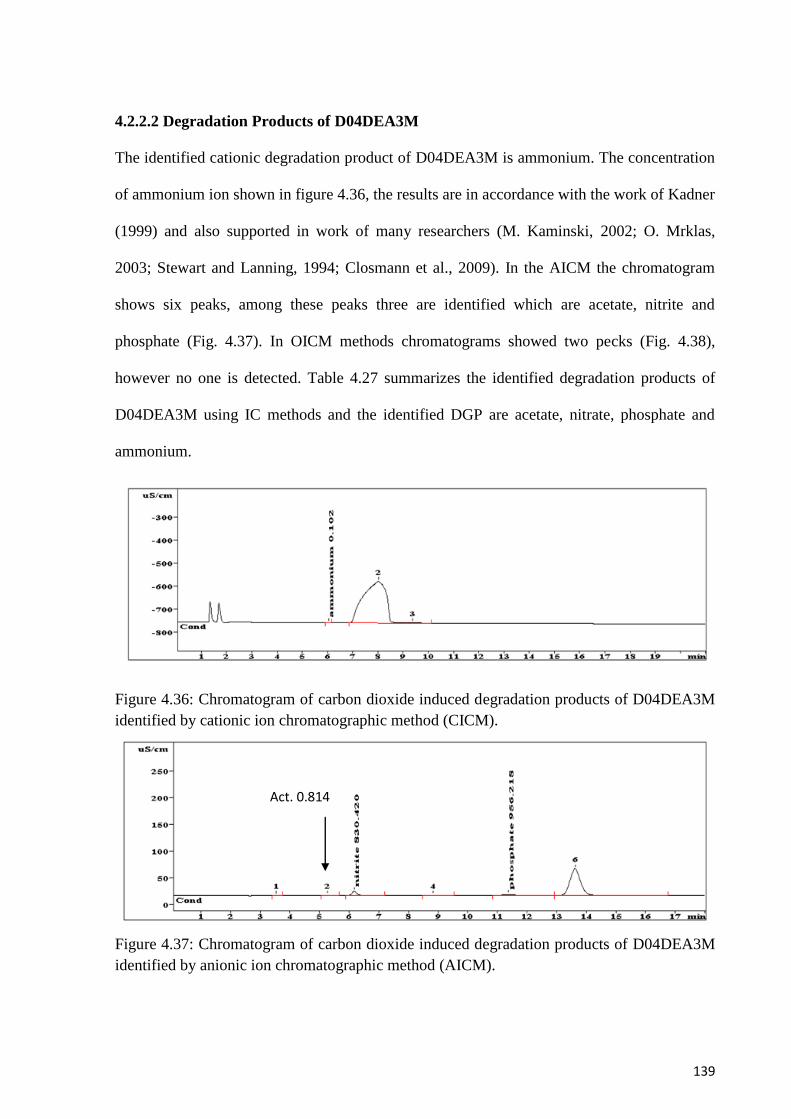
139
4.2.2.2 Degradation Products of D04DEA3M
The identified cationic degradation product of D04DEA3M is ammonium. The concentration
of ammonium ion shown in figure 4.36, the results are in accordance with the work of Kadner
(1999) and also supported in work of many researchers (M. Kaminski, 2002; O. Mrklas,
2003; Stewart and Lanning, 1994; Closmann et al., 2009). In the AICM the chromatogram
shows six peaks, among these peaks three are identified which are acetate, nitrite and
phosphate (Fig. 4.37). In OICM methods chromatograms showed two pecks (Fig. 4.38),
however no one is detected. Table 4.27 summarizes the identified degradation products of
D04DEA3M using IC methods and the identified DGP are acetate, nitrate, phosphate and
ammonium.
Figure 4.36: Chromatogram of carbon dioxide induced degradation products of D04DEA3M
identified by cationic ion chromatographic method (CICM).
Figure 4.37: Chromatogram of carbon dioxide induced degradation products of D04DEA3M
identified by anionic ion chromatographic method (AICM).
Act. 0.814
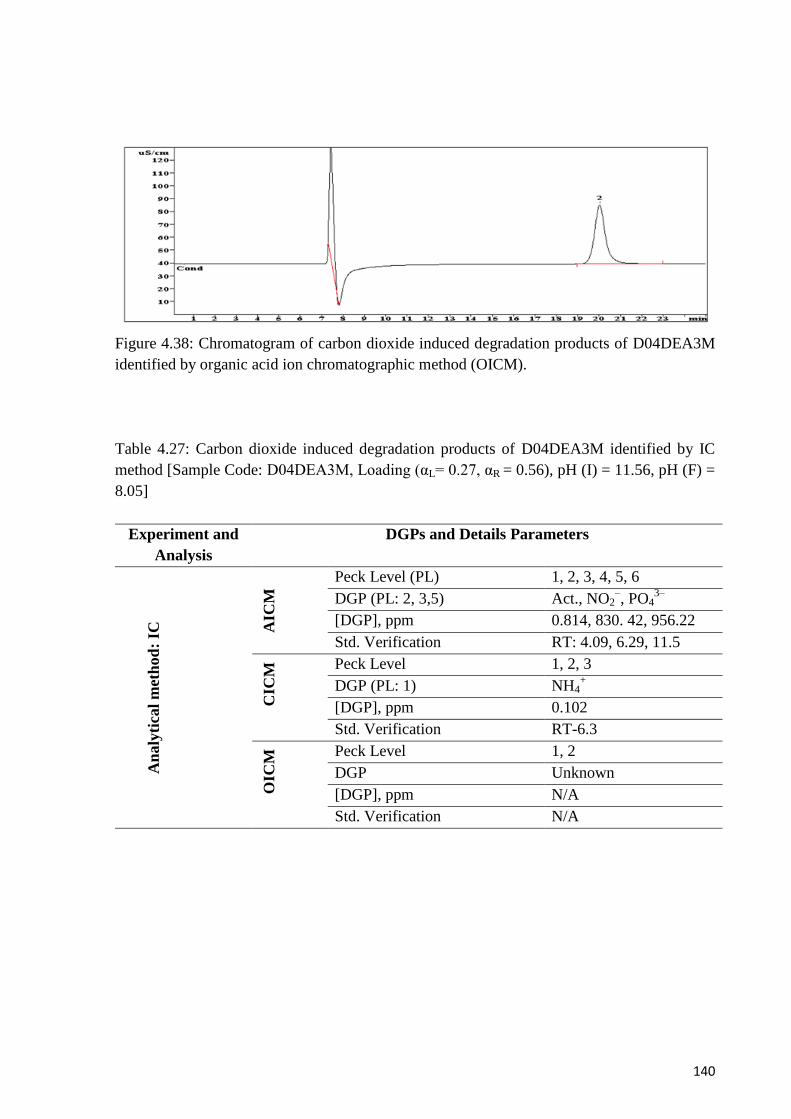
140
Figure 4.38: Chromatogram of carbon dioxide induced degradation products of D04DEA3M
identified by organic acid ion chromatographic method (OICM).
Table 4.27: Carbon dioxide induced degradation products of D04DEA3M identified by IC
method [Sample Code: D04DEA3M, Loading (αL= 0.27, αR = 0.56), pH (I) = 11.56, pH (F) =
8.05]
Experiment and
Analysis
DGPs and Details Parameters
An
aly
tica
l m
eth
od
: IC
AIC
M Peck Level (PL) 1, 2, 3, 4, 5, 6
DGP (PL: 2, 3,5) Act., NO2–, PO4
3–
[DGP], ppm 0.814, 830. 42, 956.22
Std. Verification RT: 4.09, 6.29, 11.5
CIC
M Peck Level 1, 2, 3
DGP (PL: 1) NH4+
[DGP], ppm 0.102
Std. Verification RT-6.3
OIC
M Peck Level 1, 2
DGP Unknown
[DGP], ppm N/A
Std. Verification N/A
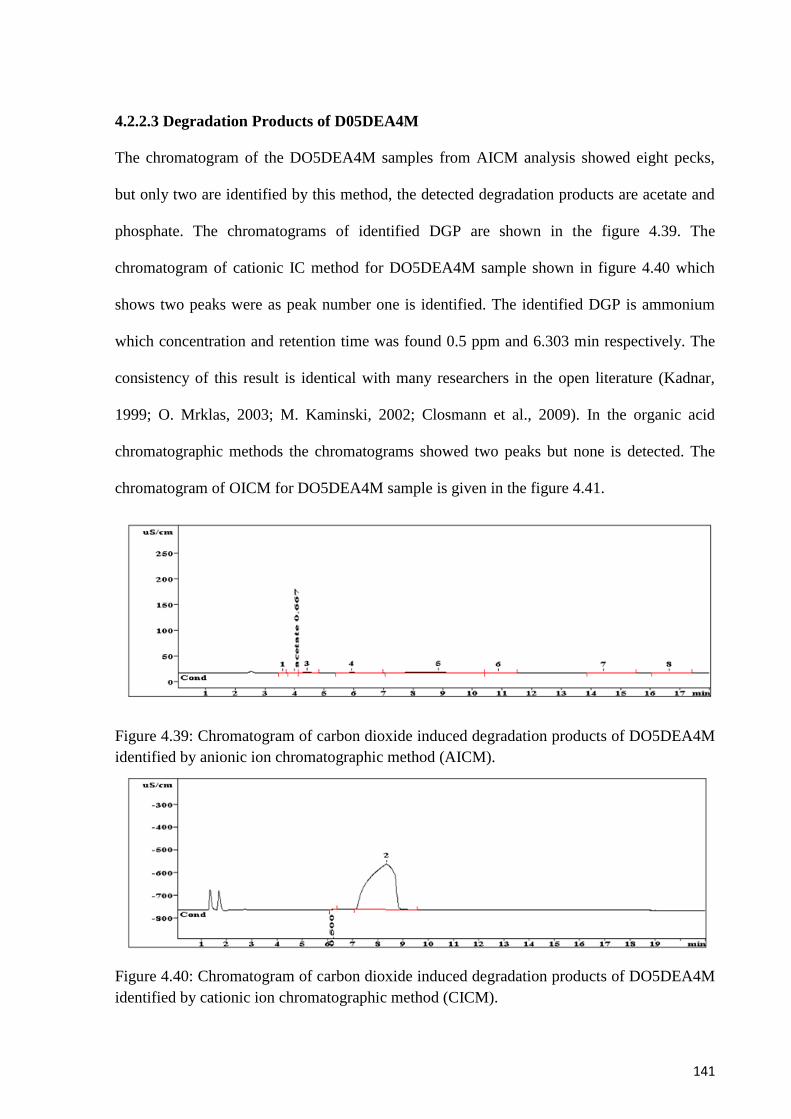
141
4.2.2.3 Degradation Products of D05DEA4M
The chromatogram of the DO5DEA4M samples from AICM analysis showed eight pecks,
but only two are identified by this method, the detected degradation products are acetate and
phosphate. The chromatograms of identified DGP are shown in the figure 4.39. The
chromatogram of cationic IC method for DO5DEA4M sample shown in figure 4.40 which
shows two peaks were as peak number one is identified. The identified DGP is ammonium
which concentration and retention time was found 0.5 ppm and 6.303 min respectively. The
consistency of this result is identical with many researchers in the open literature (Kadnar,
1999; O. Mrklas, 2003; M. Kaminski, 2002; Closmann et al., 2009). In the organic acid
chromatographic methods the chromatograms showed two peaks but none is detected. The
chromatogram of OICM for DO5DEA4M sample is given in the figure 4.41.
Figure 4.39: Chromatogram of carbon dioxide induced degradation products of DO5DEA4M
identified by anionic ion chromatographic method (AICM).
Figure 4.40: Chromatogram of carbon dioxide induced degradation products of DO5DEA4M
identified by cationic ion chromatographic method (CICM).
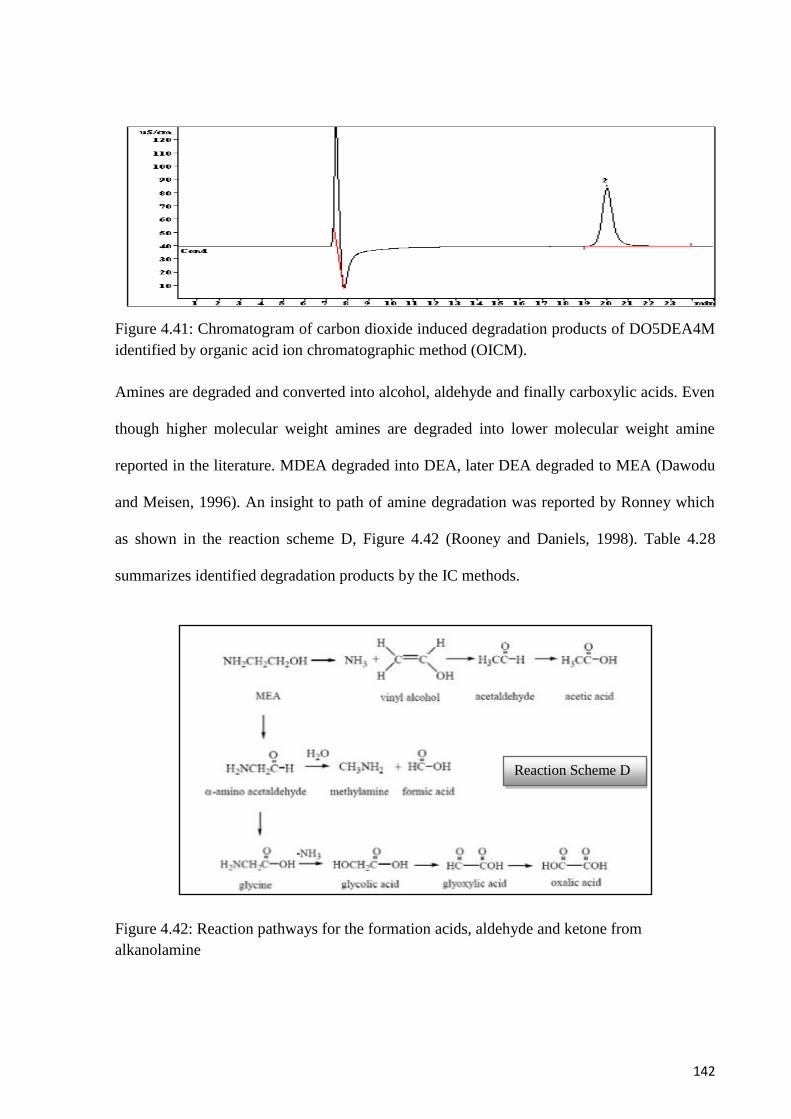
142
Figure 4.41: Chromatogram of carbon dioxide induced degradation products of DO5DEA4M
identified by organic acid ion chromatographic method (OICM).
Amines are degraded and converted into alcohol, aldehyde and finally carboxylic acids. Even
though higher molecular weight amines are degraded into lower molecular weight amine
reported in the literature. MDEA degraded into DEA, later DEA degraded to MEA (Dawodu
and Meisen, 1996). An insight to path of amine degradation was reported by Ronney which
as shown in the reaction scheme D, Figure 4.42 (Rooney and Daniels, 1998). Table 4.28
summarizes identified degradation products by the IC methods.
Figure 4.42: Reaction pathways for the formation acids, aldehyde and ketone from
alkanolamine
Reaction Scheme D
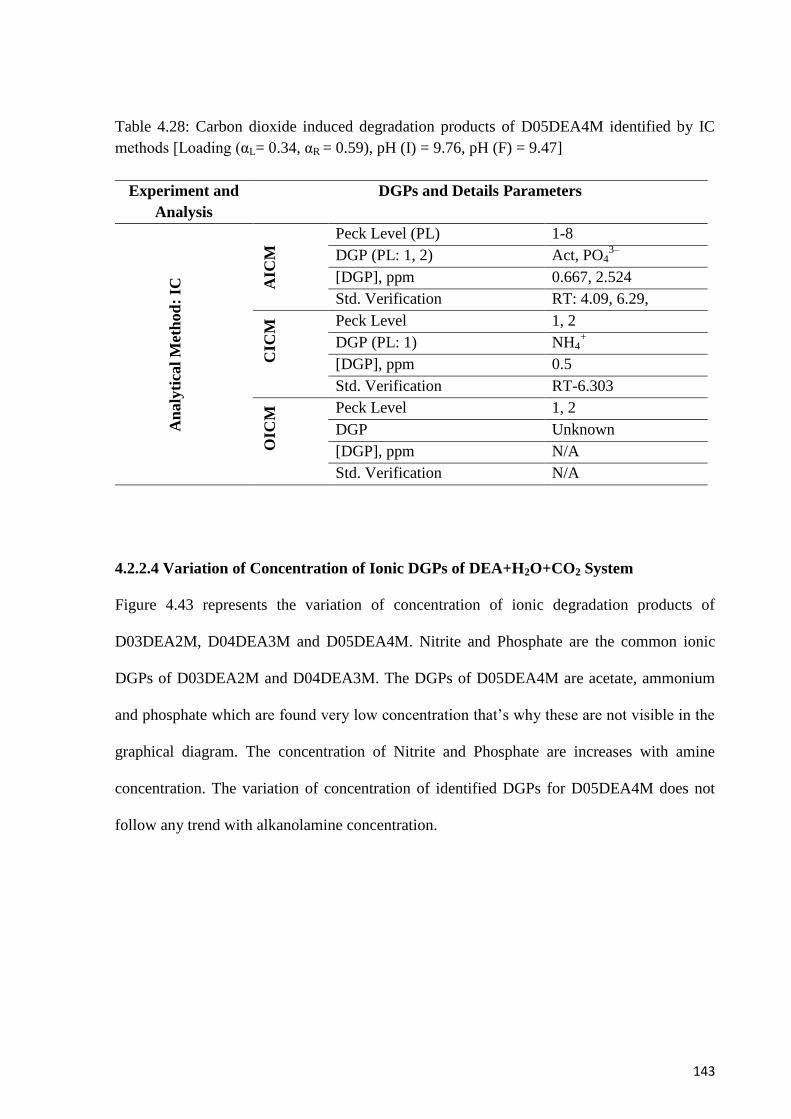
143
Table 4.28: Carbon dioxide induced degradation products of D05DEA4M identified by IC
methods [Loading (αL= 0.34, αR = 0.59), pH (I) = 9.76, pH (F) = 9.47]
Experiment and
Analysis
DGPs and Details Parameters
An
aly
tica
l M
eth
od
: IC
AIC
M Peck Level (PL) 1-8
DGP (PL: 1, 2) Act, PO43–
[DGP], ppm 0.667, 2.524
Std. Verification RT: 4.09, 6.29,
CIC
M Peck Level 1, 2
DGP (PL: 1) NH4+
[DGP], ppm 0.5
Std. Verification RT-6.303
OIC
M Peck Level 1, 2
DGP Unknown
[DGP], ppm N/A
Std. Verification N/A
4.2.2.4 Variation of Concentration of Ionic DGPs of DEA+H2O+CO2 System
Figure 4.43 represents the variation of concentration of ionic degradation products of
D03DEA2M, D04DEA3M and D05DEA4M. Nitrite and Phosphate are the common ionic
DGPs of D03DEA2M and D04DEA3M. The DGPs of D05DEA4M are acetate, ammonium
and phosphate which are found very low concentration that‟s why these are not visible in the
graphical diagram. The concentration of Nitrite and Phosphate are increases with amine
concentration. The variation of concentration of identified DGPs for D05DEA4M does not
follow any trend with alkanolamine concentration.
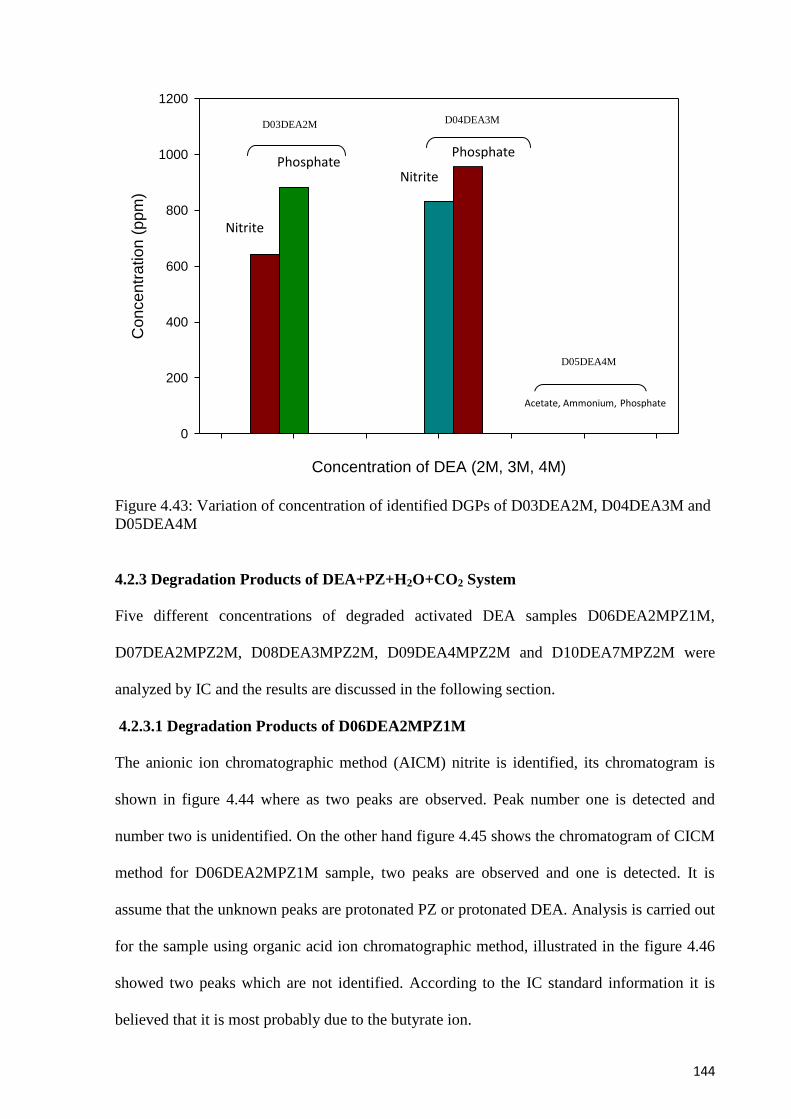
144
Figure 4.43: Variation of concentration of identified DGPs of D03DEA2M, D04DEA3M and
D05DEA4M
4.2.3 Degradation Products of DEA+PZ+H2O+CO2 System
Five different concentrations of degraded activated DEA samples D06DEA2MPZ1M,
D07DEA2MPZ2M, D08DEA3MPZ2M, D09DEA4MPZ2M and D10DEA7MPZ2M were
analyzed by IC and the results are discussed in the following section.
4.2.3.1 Degradation Products of D06DEA2MPZ1M
The anionic ion chromatographic method (AICM) nitrite is identified, its chromatogram is
shown in figure 4.44 where as two peaks are observed. Peak number one is detected and
number two is unidentified. On the other hand figure 4.45 shows the chromatogram of CICM
method for D06DEA2MPZ1M sample, two peaks are observed and one is detected. It is
assume that the unknown peaks are protonated PZ or protonated DEA. Analysis is carried out
for the sample using organic acid ion chromatographic method, illustrated in the figure 4.46
showed two peaks which are not identified. According to the IC standard information it is
believed that it is most probably due to the butyrate ion.
Concentration of DEA (2M, 3M, 4M)
Co
nce
ntr
atio
n (
pp
m)
0
200
400
600
800
1000
1200
Nitrite
Phosphate Phosphate
Nitrite
Acetate, Ammonium, Phosphate
D03DEA2M D04DEA3M
D05DEA4M
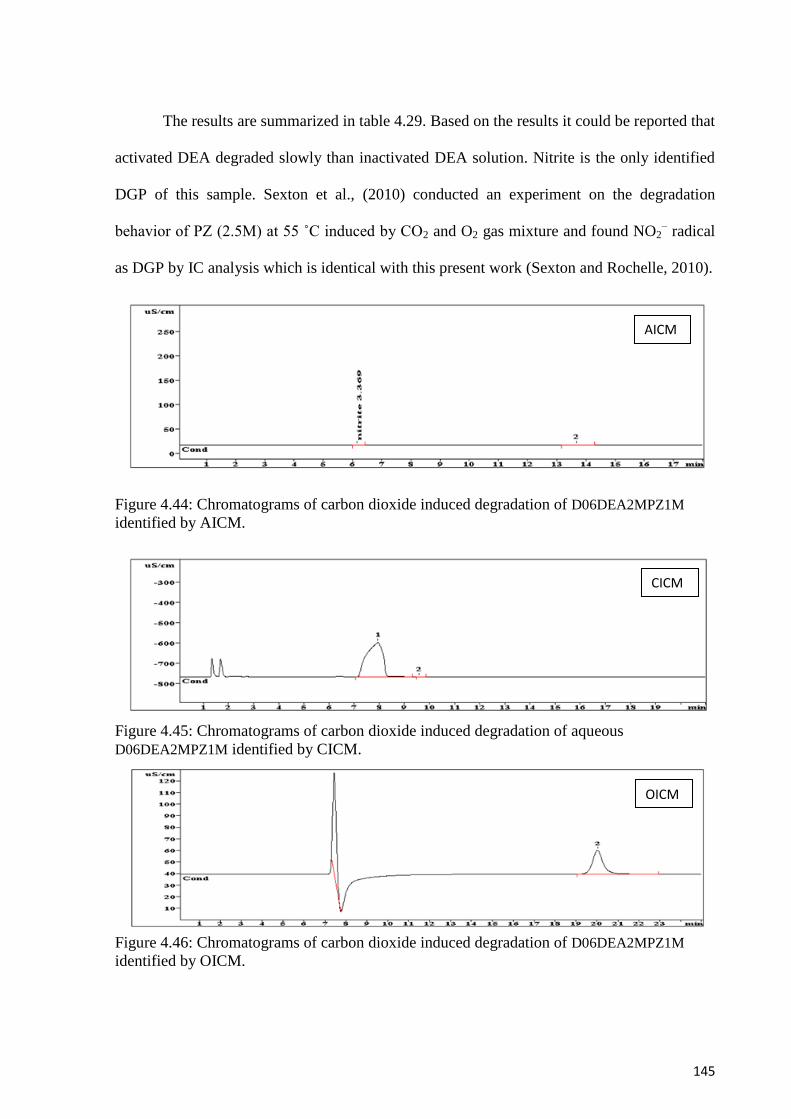
145
The results are summarized in table 4.29. Based on the results it could be reported that
activated DEA degraded slowly than inactivated DEA solution. Nitrite is the only identified
DGP of this sample. Sexton et al., (2010) conducted an experiment on the degradation
behavior of PZ (2.5M) at 55 ˚C induced by CO2 and O2 gas mixture and found NO2– radical
as DGP by IC analysis which is identical with this present work (Sexton and Rochelle, 2010).
Figure 4.44: Chromatograms of carbon dioxide induced degradation of D06DEA2MPZ1M
identified by AICM.
Figure 4.45: Chromatograms of carbon dioxide induced degradation of aqueous
D06DEA2MPZ1M identified by CICM.
Figure 4.46: Chromatograms of carbon dioxide induced degradation of D06DEA2MPZ1M
identified by OICM.
CICM
AICM
OICM
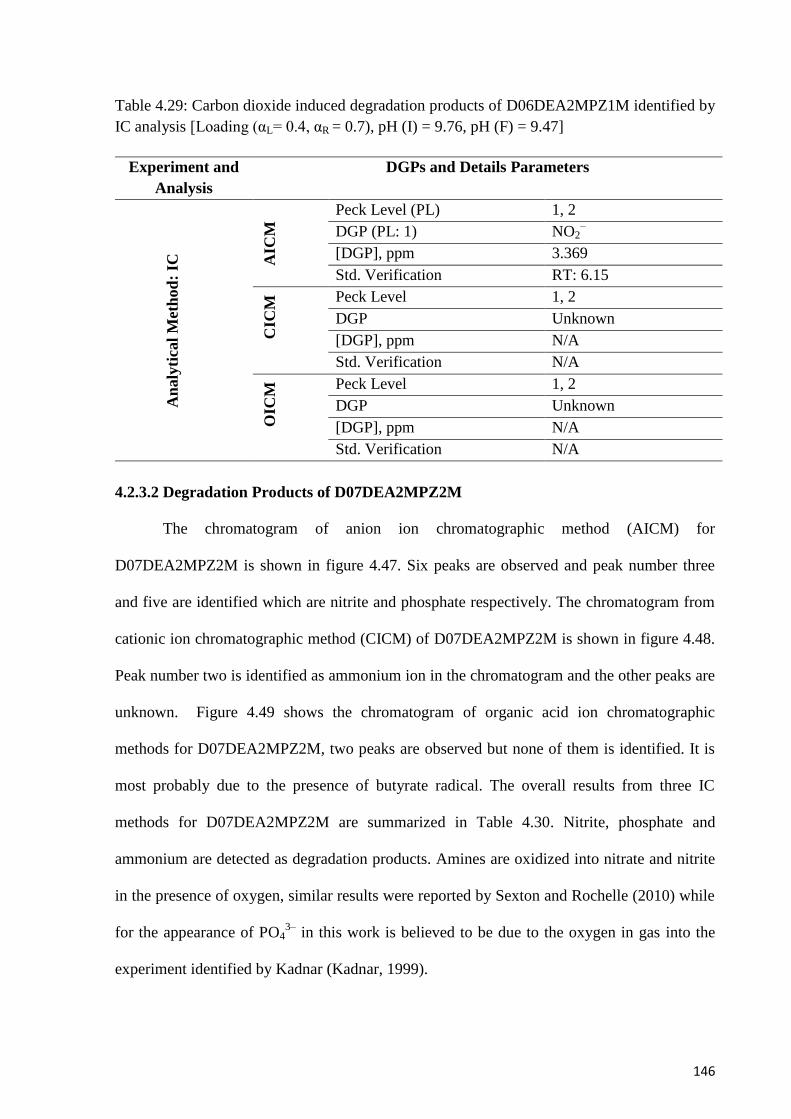
146
Table 4.29: Carbon dioxide induced degradation products of D06DEA2MPZ1M identified by
IC analysis [Loading (αL= 0.4, αR = 0.7), pH (I) = 9.76, pH (F) = 9.47]
Experiment and
Analysis
DGPs and Details Parameters
An
aly
tica
l M
eth
od
: IC
AIC
M Peck Level (PL) 1, 2
DGP (PL: 1) NO2–
[DGP], ppm 3.369
Std. Verification RT: 6.15 C
ICM
Peck Level 1, 2
DGP Unknown
[DGP], ppm N/A
Std. Verification N/A
OIC
M Peck Level 1, 2
DGP Unknown
[DGP], ppm N/A
Std. Verification N/A
4.2.3.2 Degradation Products of D07DEA2MPZ2M
The chromatogram of anion ion chromatographic method (AICM) for
D07DEA2MPZ2M is shown in figure 4.47. Six peaks are observed and peak number three
and five are identified which are nitrite and phosphate respectively. The chromatogram from
cationic ion chromatographic method (CICM) of D07DEA2MPZ2M is shown in figure 4.48.
Peak number two is identified as ammonium ion in the chromatogram and the other peaks are
unknown. Figure 4.49 shows the chromatogram of organic acid ion chromatographic
methods for D07DEA2MPZ2M, two peaks are observed but none of them is identified. It is
most probably due to the presence of butyrate radical. The overall results from three IC
methods for D07DEA2MPZ2M are summarized in Table 4.30. Nitrite, phosphate and
ammonium are detected as degradation products. Amines are oxidized into nitrate and nitrite
in the presence of oxygen, similar results were reported by Sexton and Rochelle (2010) while
for the appearance of PO43–
in this work is believed to be due to the oxygen in gas into the
experiment identified by Kadnar (Kadnar, 1999).
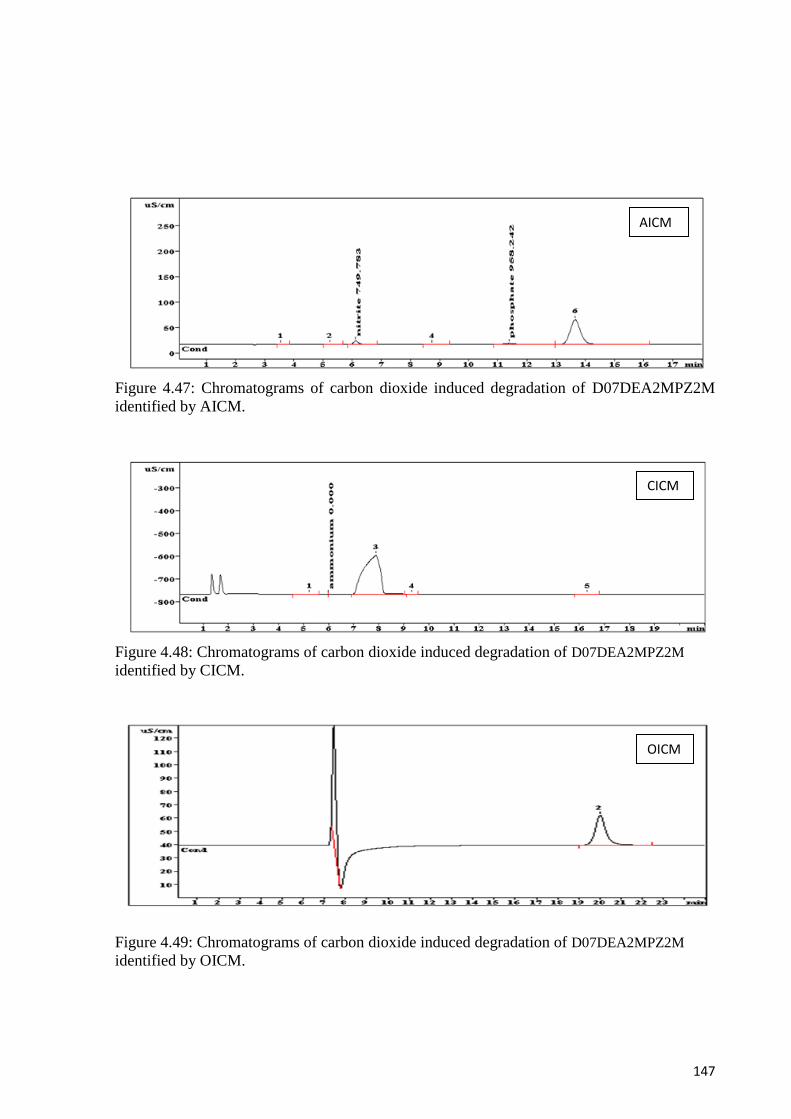
147
Figure 4.47: Chromatograms of carbon dioxide induced degradation of D07DEA2MPZ2M
identified by AICM.
Figure 4.48: Chromatograms of carbon dioxide induced degradation of D07DEA2MPZ2M
identified by CICM.
Figure 4.49: Chromatograms of carbon dioxide induced degradation of D07DEA2MPZ2M
identified by OICM.
AICM
CICM
OICM
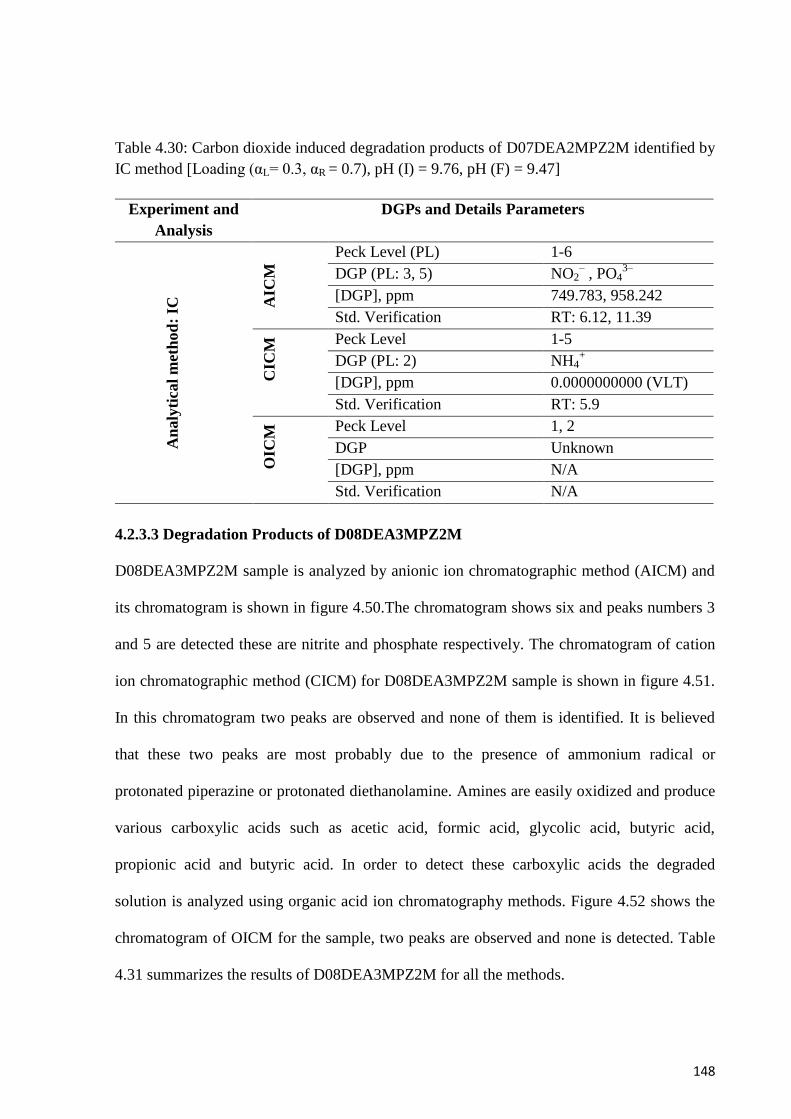
148
Table 4.30: Carbon dioxide induced degradation products of D07DEA2MPZ2M identified by
IC method [Loading (αL= 0.3, αR = 0.7), pH (I) = 9.76, pH (F) = 9.47]
Experiment and
Analysis
DGPs and Details Parameters
An
aly
tica
l m
eth
od
: IC
AIC
M Peck Level (PL) 1-6
DGP (PL: 3, 5) NO2– , PO4
3–
[DGP], ppm 749.783, 958.242
Std. Verification RT: 6.12, 11.39
CIC
M Peck Level 1-5
DGP (PL: 2) NH4+
[DGP], ppm 0.0000000000 (VLT)
Std. Verification RT: 5.9
OIC
M Peck Level 1, 2
DGP Unknown
[DGP], ppm N/A
Std. Verification N/A
4.2.3.3 Degradation Products of D08DEA3MPZ2M
D08DEA3MPZ2M sample is analyzed by anionic ion chromatographic method (AICM) and
its chromatogram is shown in figure 4.50.The chromatogram shows six and peaks numbers 3
and 5 are detected these are nitrite and phosphate respectively. The chromatogram of cation
ion chromatographic method (CICM) for D08DEA3MPZ2M sample is shown in figure 4.51.
In this chromatogram two peaks are observed and none of them is identified. It is believed
that these two peaks are most probably due to the presence of ammonium radical or
protonated piperazine or protonated diethanolamine. Amines are easily oxidized and produce
various carboxylic acids such as acetic acid, formic acid, glycolic acid, butyric acid,
propionic acid and butyric acid. In order to detect these carboxylic acids the degraded
solution is analyzed using organic acid ion chromatography methods. Figure 4.52 shows the
chromatogram of OICM for the sample, two peaks are observed and none is detected. Table
4.31 summarizes the results of D08DEA3MPZ2M for all the methods.
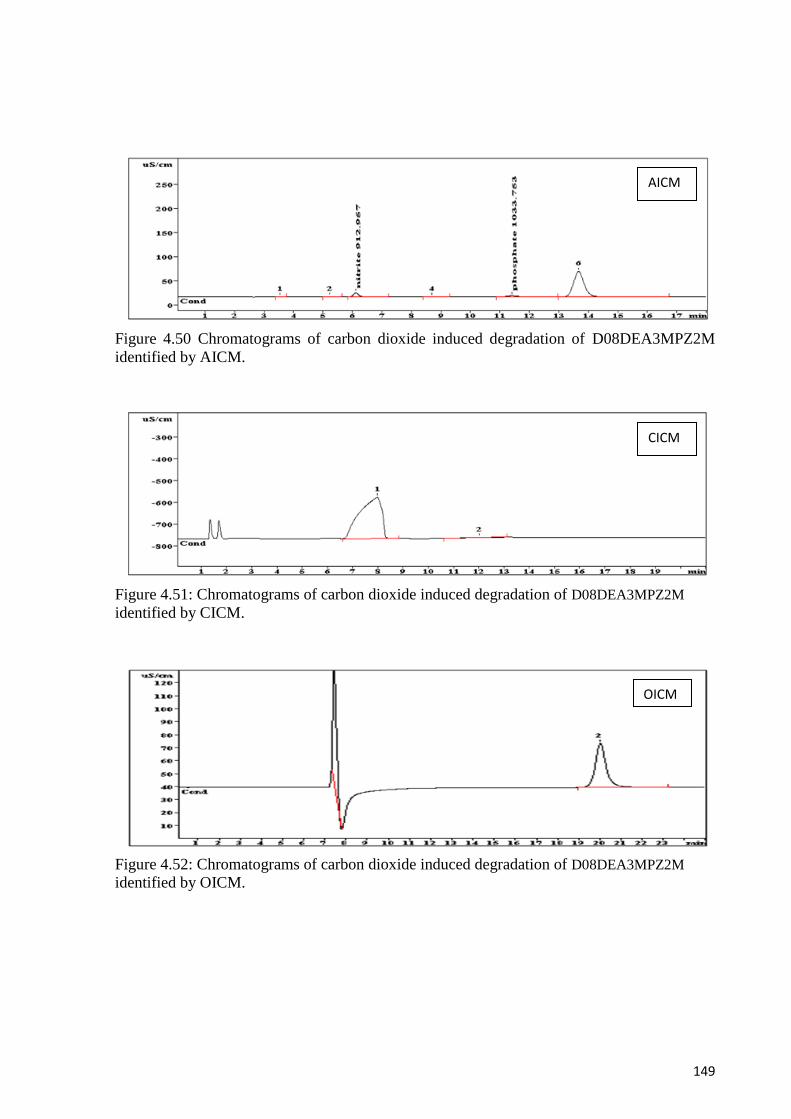
149
Figure 4.50 Chromatograms of carbon dioxide induced degradation of D08DEA3MPZ2M
identified by AICM.
Figure 4.51: Chromatograms of carbon dioxide induced degradation of D08DEA3MPZ2M
identified by CICM.
Figure 4.52: Chromatograms of carbon dioxide induced degradation of D08DEA3MPZ2M
identified by OICM.
AICM
OICM
CICM
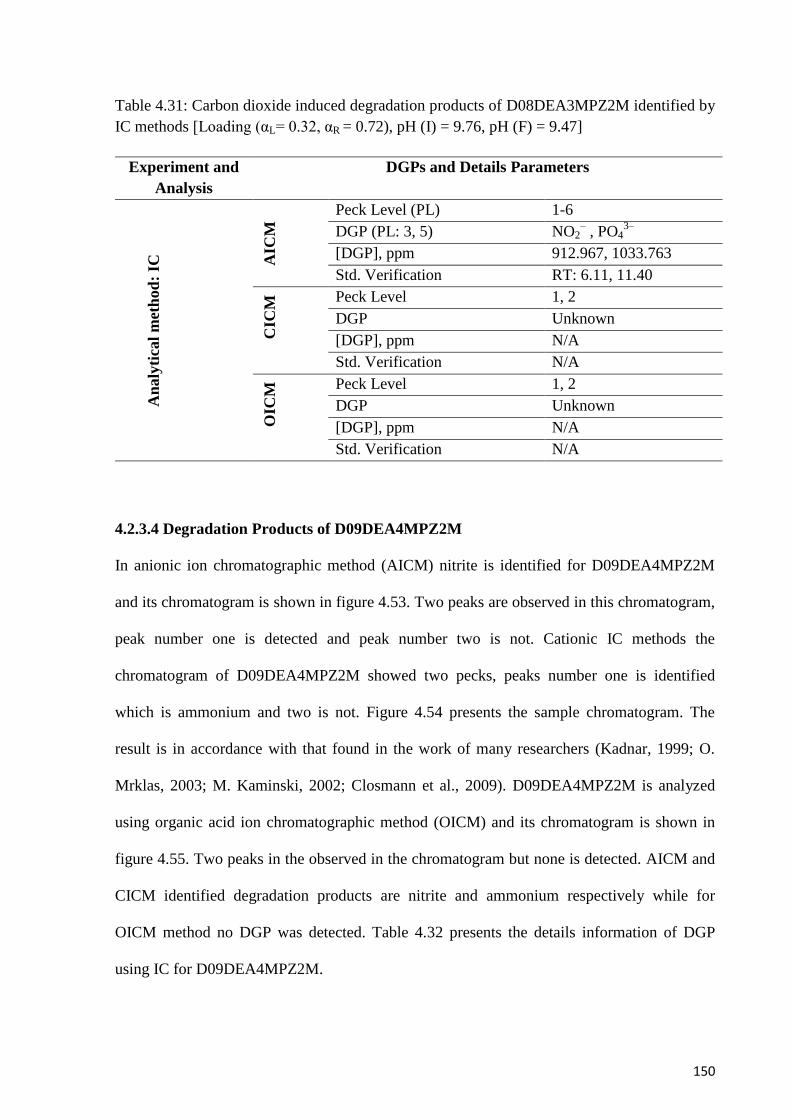
150
Table 4.31: Carbon dioxide induced degradation products of D08DEA3MPZ2M identified by
IC methods [Loading (αL= 0.32, αR = 0.72), pH (I) = 9.76, pH (F) = 9.47]
Experiment and
Analysis
DGPs and Details Parameters
An
aly
tica
l m
eth
od
: IC
AIC
M Peck Level (PL) 1-6
DGP (PL: 3, 5) NO2– , PO4
3–
[DGP], ppm 912.967, 1033.763
Std. Verification RT: 6.11, 11.40 C
ICM
Peck Level 1, 2
DGP Unknown
[DGP], ppm N/A
Std. Verification N/A
OIC
M Peck Level 1, 2
DGP Unknown
[DGP], ppm N/A
Std. Verification N/A
4.2.3.4 Degradation Products of D09DEA4MPZ2M
In anionic ion chromatographic method (AICM) nitrite is identified for D09DEA4MPZ2M
and its chromatogram is shown in figure 4.53. Two peaks are observed in this chromatogram,
peak number one is detected and peak number two is not. Cationic IC methods the
chromatogram of D09DEA4MPZ2M showed two pecks, peaks number one is identified
which is ammonium and two is not. Figure 4.54 presents the sample chromatogram. The
result is in accordance with that found in the work of many researchers (Kadnar, 1999; O.
Mrklas, 2003; M. Kaminski, 2002; Closmann et al., 2009). D09DEA4MPZ2M is analyzed
using organic acid ion chromatographic method (OICM) and its chromatogram is shown in
figure 4.55. Two peaks in the observed in the chromatogram but none is detected. AICM and
CICM identified degradation products are nitrite and ammonium respectively while for
OICM method no DGP was detected. Table 4.32 presents the details information of DGP
using IC for D09DEA4MPZ2M.
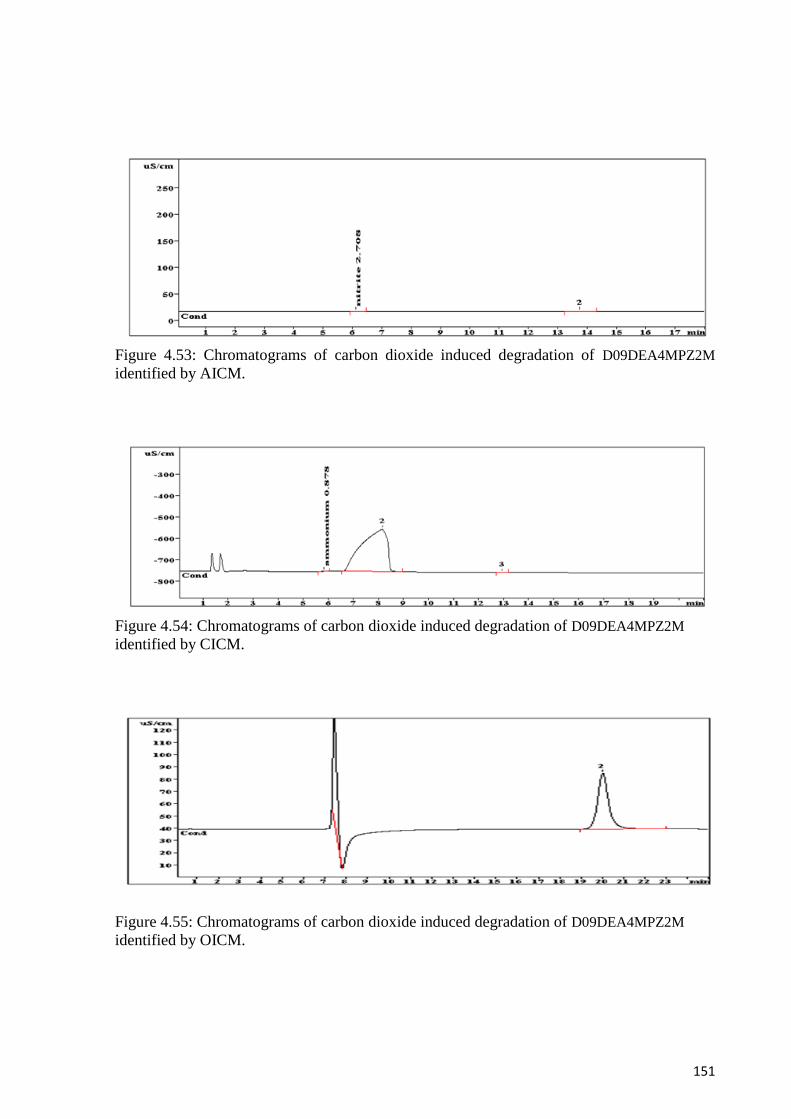
151
Figure 4.53: Chromatograms of carbon dioxide induced degradation of D09DEA4MPZ2M
identified by AICM.
Figure 4.54: Chromatograms of carbon dioxide induced degradation of D09DEA4MPZ2M
identified by CICM.
Figure 4.55: Chromatograms of carbon dioxide induced degradation of D09DEA4MPZ2M
identified by OICM.
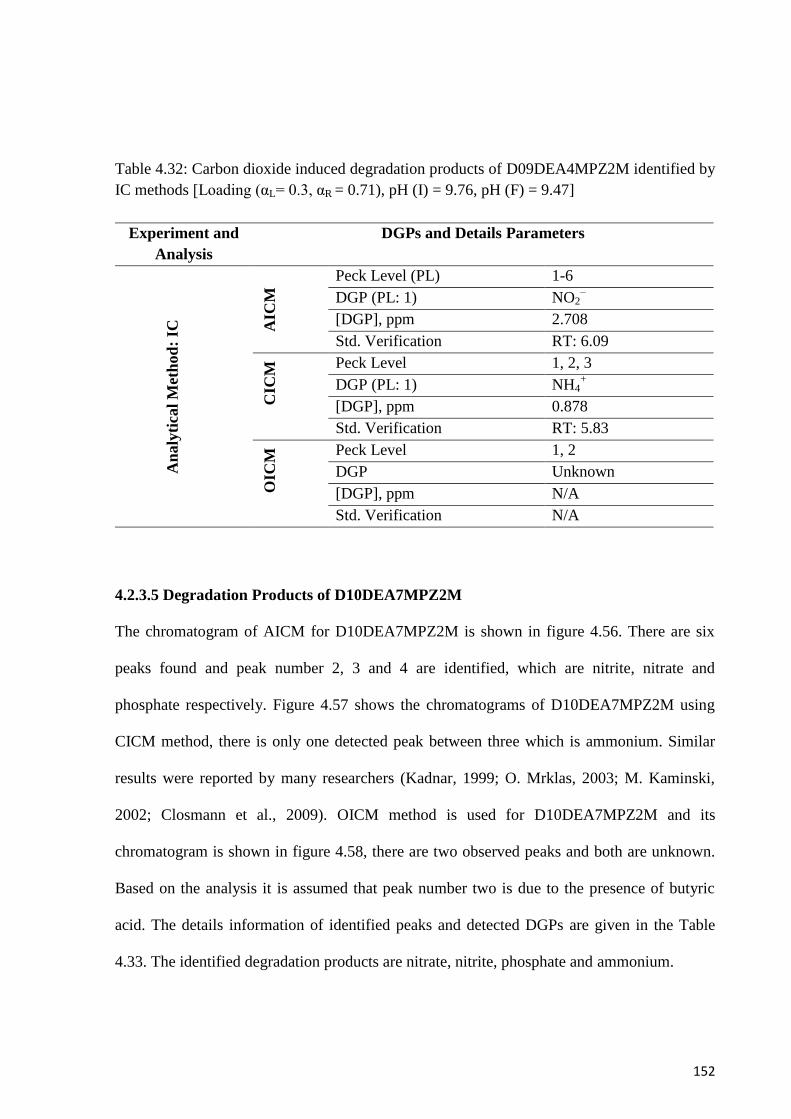
152
Table 4.32: Carbon dioxide induced degradation products of D09DEA4MPZ2M identified by
IC methods [Loading (αL= 0.3, αR = 0.71), pH (I) = 9.76, pH (F) = 9.47]
Experiment and
Analysis
DGPs and Details Parameters
An
aly
tica
l M
eth
od
: IC
AIC
M Peck Level (PL) 1-6
DGP (PL: 1) NO2–
[DGP], ppm 2.708
Std. Verification RT: 6.09
CIC
M Peck Level 1, 2, 3
DGP (PL: 1) NH4+
[DGP], ppm 0.878
Std. Verification RT: 5.83
OIC
M Peck Level 1, 2
DGP Unknown
[DGP], ppm N/A
Std. Verification N/A
4.2.3.5 Degradation Products of D10DEA7MPZ2M
The chromatogram of AICM for D10DEA7MPZ2M is shown in figure 4.56. There are six
peaks found and peak number 2, 3 and 4 are identified, which are nitrite, nitrate and
phosphate respectively. Figure 4.57 shows the chromatograms of D10DEA7MPZ2M using
CICM method, there is only one detected peak between three which is ammonium. Similar
results were reported by many researchers (Kadnar, 1999; O. Mrklas, 2003; M. Kaminski,
2002; Closmann et al., 2009). OICM method is used for D10DEA7MPZ2M and its
chromatogram is shown in figure 4.58, there are two observed peaks and both are unknown.
Based on the analysis it is assumed that peak number two is due to the presence of butyric
acid. The details information of identified peaks and detected DGPs are given in the Table
4.33. The identified degradation products are nitrate, nitrite, phosphate and ammonium.
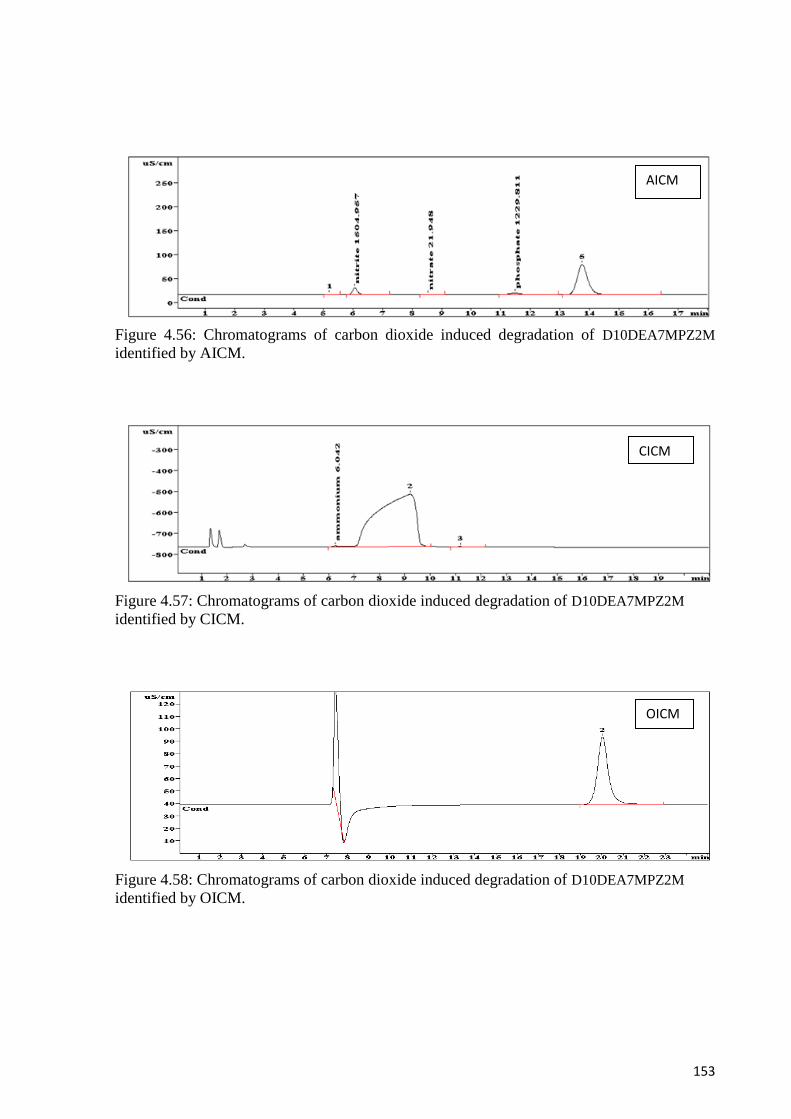
153
Figure 4.56: Chromatograms of carbon dioxide induced degradation of D10DEA7MPZ2M
identified by AICM.
Figure 4.57: Chromatograms of carbon dioxide induced degradation of D10DEA7MPZ2M
identified by CICM.
Figure 4.58: Chromatograms of carbon dioxide induced degradation of D10DEA7MPZ2M
identified by OICM.
AICM
CICM
OICM
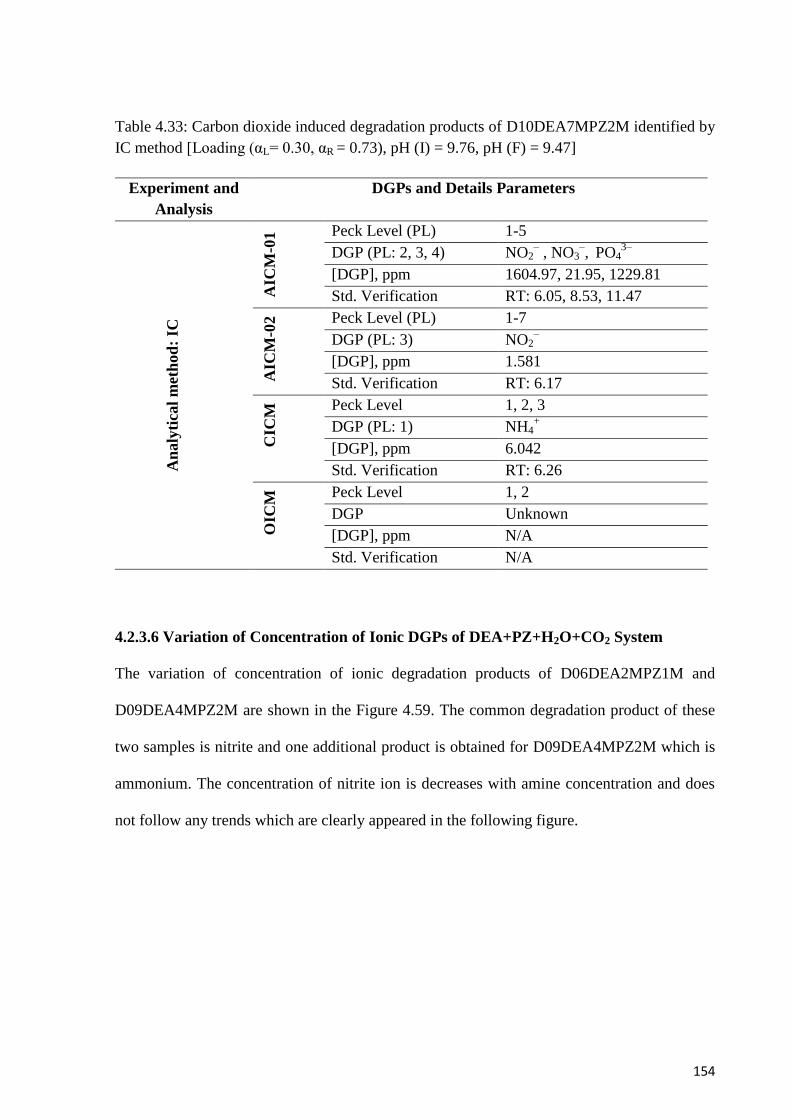
154
Table 4.33: Carbon dioxide induced degradation products of D10DEA7MPZ2M identified by
IC method [Loading (αL= 0.30, αR = 0.73), pH (I) = 9.76, pH (F) = 9.47]
Experiment and
Analysis
DGPs and Details Parameters
An
aly
tica
l m
eth
od
: IC
AIC
M-0
1 Peck Level (PL) 1-5
DGP (PL: 2, 3, 4) NO2– , NO3
–, PO4
3–
[DGP], ppm 1604.97, 21.95, 1229.81
Std. Verification RT: 6.05, 8.53, 11.47
AIC
M-0
2 Peck Level (PL) 1-7
DGP (PL: 3) NO2–
[DGP], ppm 1.581
Std. Verification RT: 6.17
CIC
M Peck Level 1, 2, 3
DGP (PL: 1) NH4+
[DGP], ppm 6.042
Std. Verification RT: 6.26
OIC
M Peck Level 1, 2
DGP Unknown
[DGP], ppm N/A
Std. Verification N/A
4.2.3.6 Variation of Concentration of Ionic DGPs of DEA+PZ+H2O+CO2 System
The variation of concentration of ionic degradation products of D06DEA2MPZ1M and
D09DEA4MPZ2M are shown in the Figure 4.59. The common degradation product of these
two samples is nitrite and one additional product is obtained for D09DEA4MPZ2M which is
ammonium. The concentration of nitrite ion is decreases with amine concentration and does
not follow any trends which are clearly appeared in the following figure.
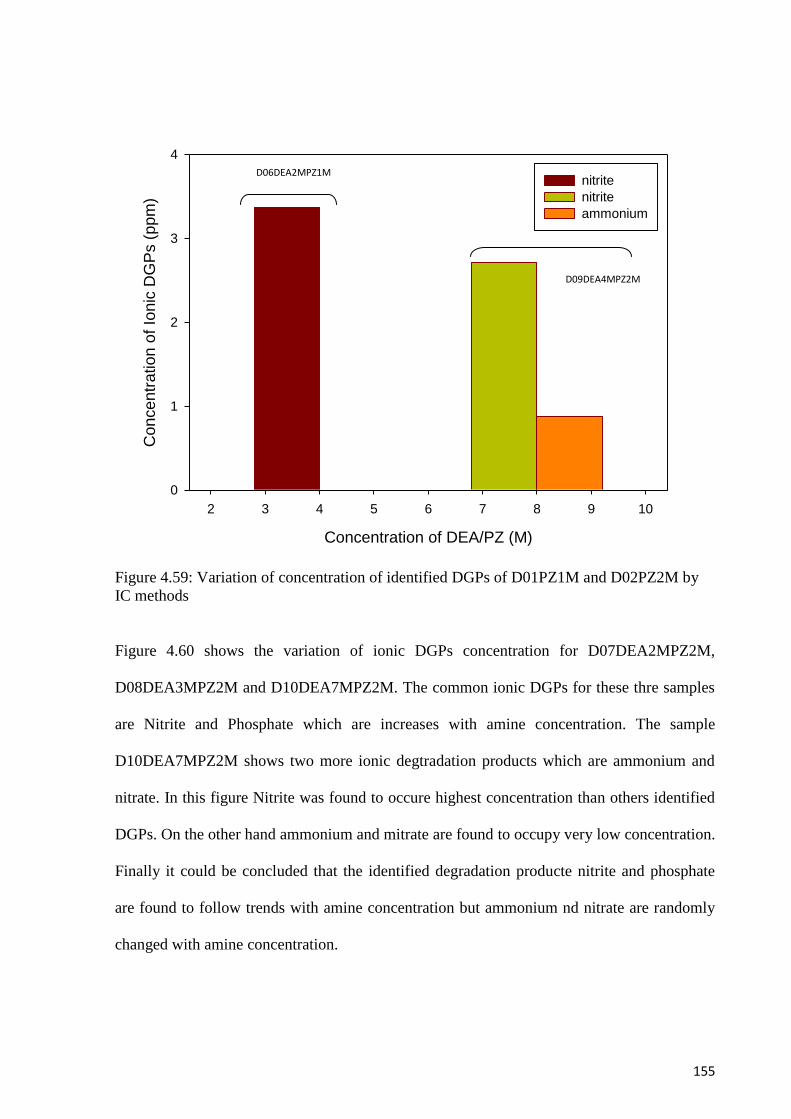
155
Figure 4.59: Variation of concentration of identified DGPs of D01PZ1M and D02PZ2M by
IC methods
Figure 4.60 shows the variation of ionic DGPs concentration for D07DEA2MPZ2M,
D08DEA3MPZ2M and D10DEA7MPZ2M. The common ionic DGPs for these thre samples
are Nitrite and Phosphate which are increases with amine concentration. The sample
D10DEA7MPZ2M shows two more ionic degtradation products which are ammonium and
nitrate. In this figure Nitrite was found to occure highest concentration than others identified
DGPs. On the other hand ammonium and mitrate are found to occupy very low concentration.
Finally it could be concluded that the identified degradation producte nitrite and phosphate
are found to follow trends with amine concentration but ammonium nd nitrate are randomly
changed with amine concentration.
Concentration of DEA/PZ (M)
2 3 4 5 6 7 8 9 10
Concentr
ation o
f Io
nic
DG
Ps (
ppm
)
0
1
2
3
4
nitrite
nitrite
ammonium
D06DEA2MPZ1M
D09DEA4MPZ2M
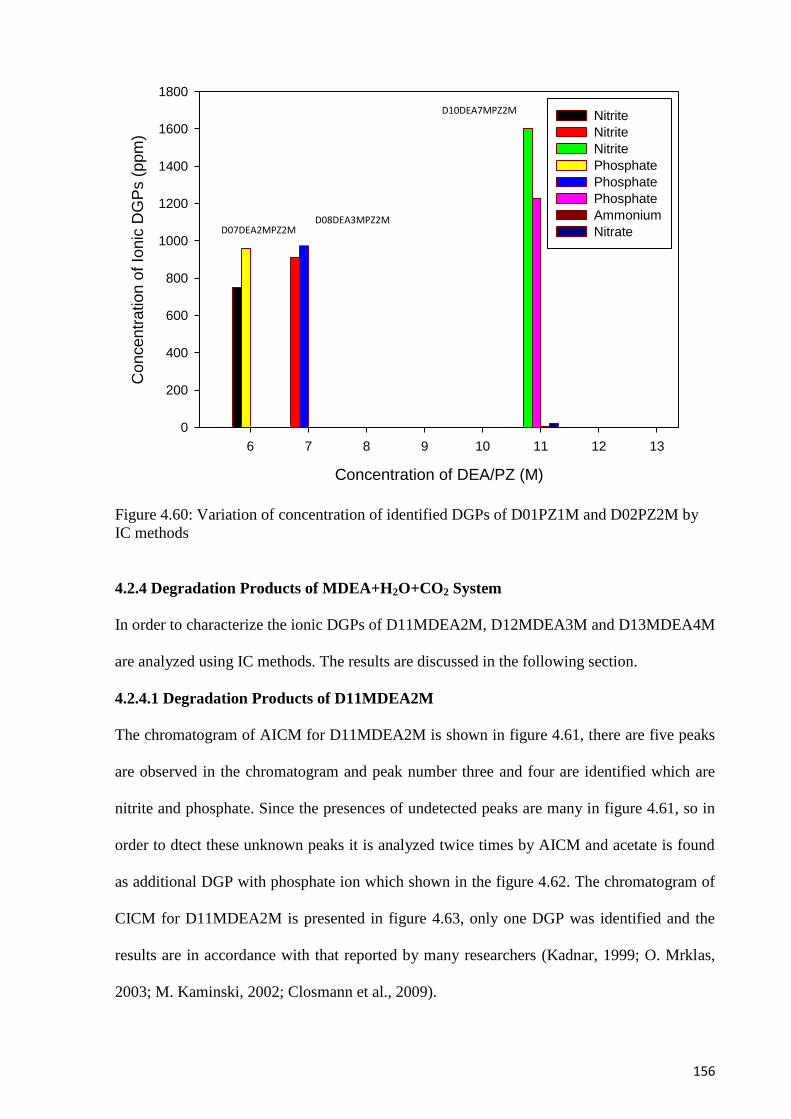
156
Figure 4.60: Variation of concentration of identified DGPs of D01PZ1M and D02PZ2M by
IC methods
4.2.4 Degradation Products of MDEA+H2O+CO2 System
In order to characterize the ionic DGPs of D11MDEA2M, D12MDEA3M and D13MDEA4M
are analyzed using IC methods. The results are discussed in the following section.
4.2.4.1 Degradation Products of D11MDEA2M
The chromatogram of AICM for D11MDEA2M is shown in figure 4.61, there are five peaks
are observed in the chromatogram and peak number three and four are identified which are
nitrite and phosphate. Since the presences of undetected peaks are many in figure 4.61, so in
order to dtect these unknown peaks it is analyzed twice times by AICM and acetate is found
as additional DGP with phosphate ion which shown in the figure 4.62. The chromatogram of
CICM for D11MDEA2M is presented in figure 4.63, only one DGP was identified and the
results are in accordance with that reported by many researchers (Kadnar, 1999; O. Mrklas,
2003; M. Kaminski, 2002; Closmann et al., 2009).
Concentration of DEA/PZ (M)
6 7 8 9 10 11 12 13
Concentr
ation o
f Io
nic
DG
Ps (
ppm
)
0
200
400
600
800
1000
1200
1400
1600
1800
Nitrite
Nitrite
Nitrite
Phosphate
Phosphate
Phosphate
Ammonium
NitrateD07DEA2MPZ2M
D08DEA3MPZ2M
D10DEA7MPZ2M
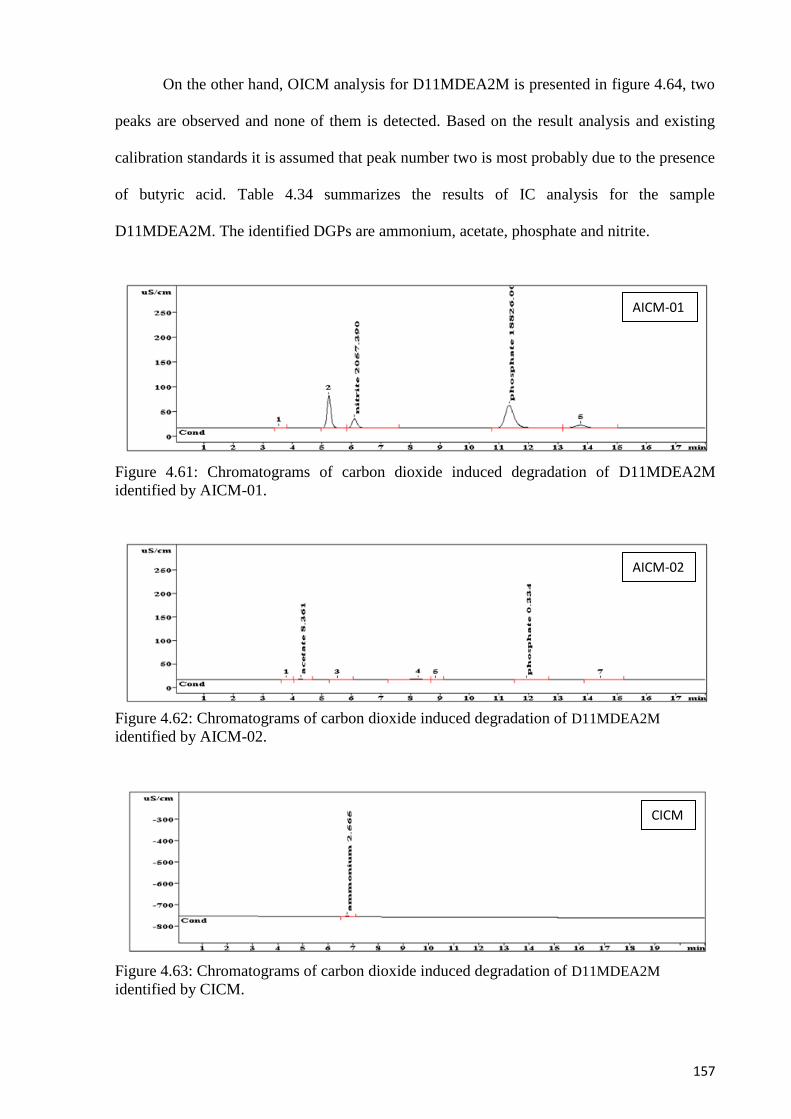
157
On the other hand, OICM analysis for D11MDEA2M is presented in figure 4.64, two
peaks are observed and none of them is detected. Based on the result analysis and existing
calibration standards it is assumed that peak number two is most probably due to the presence
of butyric acid. Table 4.34 summarizes the results of IC analysis for the sample
D11MDEA2M. The identified DGPs are ammonium, acetate, phosphate and nitrite.
Figure 4.61: Chromatograms of carbon dioxide induced degradation of D11MDEA2M
identified by AICM-01.
Figure 4.62: Chromatograms of carbon dioxide induced degradation of D11MDEA2M
identified by AICM-02.
Figure 4.63: Chromatograms of carbon dioxide induced degradation of D11MDEA2M
identified by CICM.
AICM-01
CICM
AICM-02
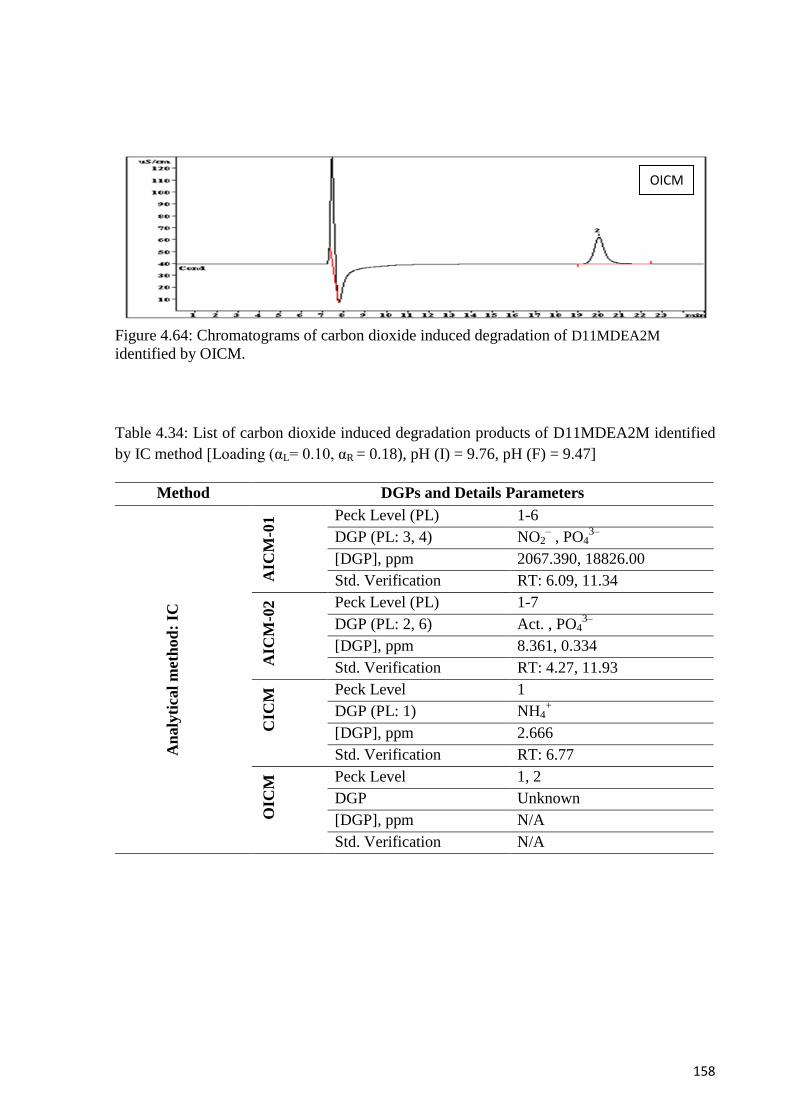
158
Figure 4.64: Chromatograms of carbon dioxide induced degradation of D11MDEA2M
identified by OICM.
Table 4.34: List of carbon dioxide induced degradation products of D11MDEA2M identified
by IC method [Loading (αL= 0.10, αR = 0.18), pH (I) = 9.76, pH (F) = 9.47]
Method DGPs and Details Parameters
An
aly
tica
l m
eth
od
: IC
AIC
M-0
1 Peck Level (PL) 1-6
DGP (PL: 3, 4) NO2– , PO4
3–
[DGP], ppm 2067.390, 18826.00
Std. Verification RT: 6.09, 11.34
AIC
M-0
2 Peck Level (PL) 1-7
DGP (PL: 2, 6) Act. , PO43–
[DGP], ppm 8.361, 0.334
Std. Verification RT: 4.27, 11.93
CIC
M Peck Level 1
DGP (PL: 1) NH4+
[DGP], ppm 2.666
Std. Verification RT: 6.77
OIC
M Peck Level 1, 2
DGP Unknown
[DGP], ppm N/A
Std. Verification N/A
OICM
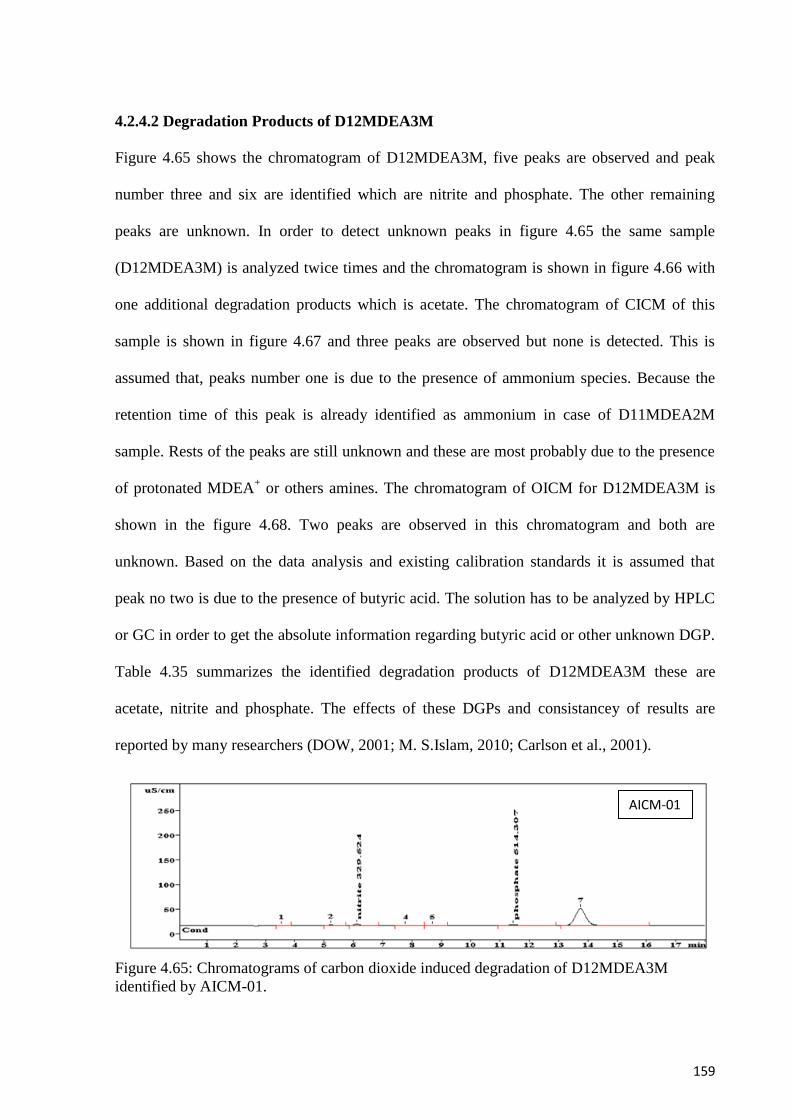
159
4.2.4.2 Degradation Products of D12MDEA3M
Figure 4.65 shows the chromatogram of D12MDEA3M, five peaks are observed and peak
number three and six are identified which are nitrite and phosphate. The other remaining
peaks are unknown. In order to detect unknown peaks in figure 4.65 the same sample
(D12MDEA3M) is analyzed twice times and the chromatogram is shown in figure 4.66 with
one additional degradation products which is acetate. The chromatogram of CICM of this
sample is shown in figure 4.67 and three peaks are observed but none is detected. This is
assumed that, peaks number one is due to the presence of ammonium species. Because the
retention time of this peak is already identified as ammonium in case of D11MDEA2M
sample. Rests of the peaks are still unknown and these are most probably due to the presence
of protonated MDEA+ or others amines. The chromatogram of OICM for D12MDEA3M is
shown in the figure 4.68. Two peaks are observed in this chromatogram and both are
unknown. Based on the data analysis and existing calibration standards it is assumed that
peak no two is due to the presence of butyric acid. The solution has to be analyzed by HPLC
or GC in order to get the absolute information regarding butyric acid or other unknown DGP.
Table 4.35 summarizes the identified degradation products of D12MDEA3M these are
acetate, nitrite and phosphate. The effects of these DGPs and consistancey of results are
reported by many researchers (DOW, 2001; M. S.Islam, 2010; Carlson et al., 2001).
Figure 4.65: Chromatograms of carbon dioxide induced degradation of D12MDEA3M
identified by AICM-01.
AICM-01
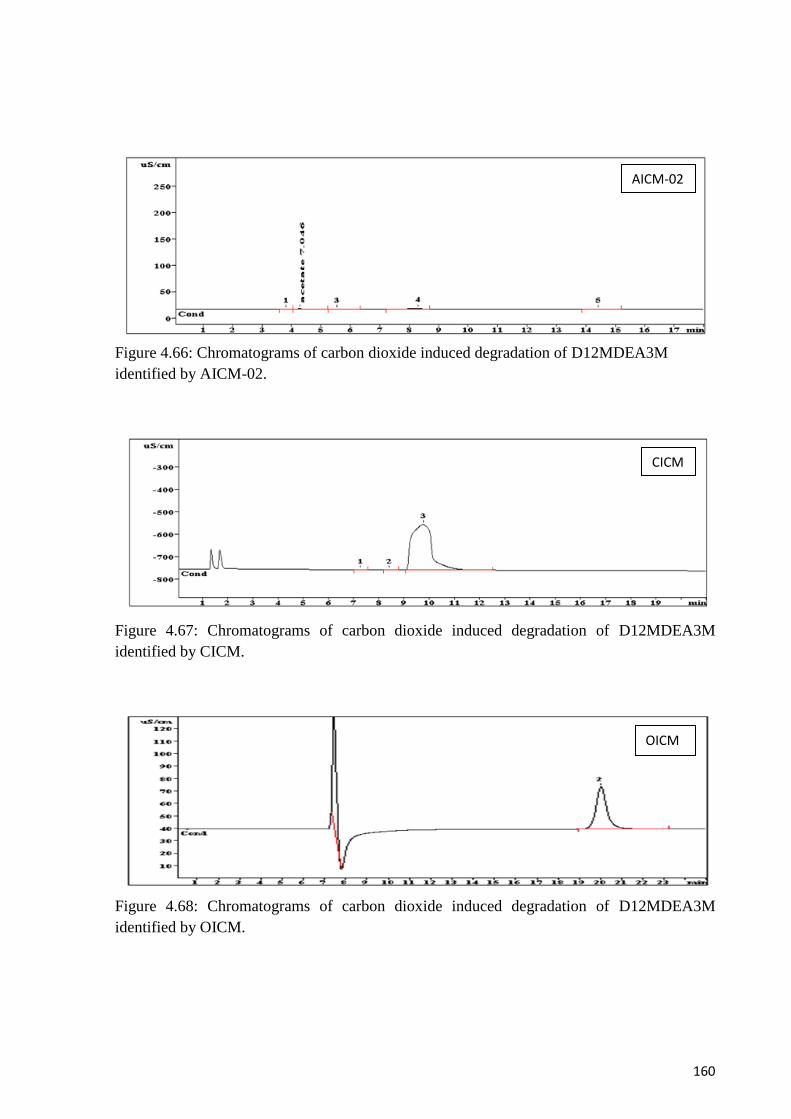
160
Figure 4.66: Chromatograms of carbon dioxide induced degradation of D12MDEA3M
identified by AICM-02.
Figure 4.67: Chromatograms of carbon dioxide induced degradation of D12MDEA3M
identified by CICM.
Figure 4.68: Chromatograms of carbon dioxide induced degradation of D12MDEA3M
identified by OICM.
AICM-02
CICM
OICM
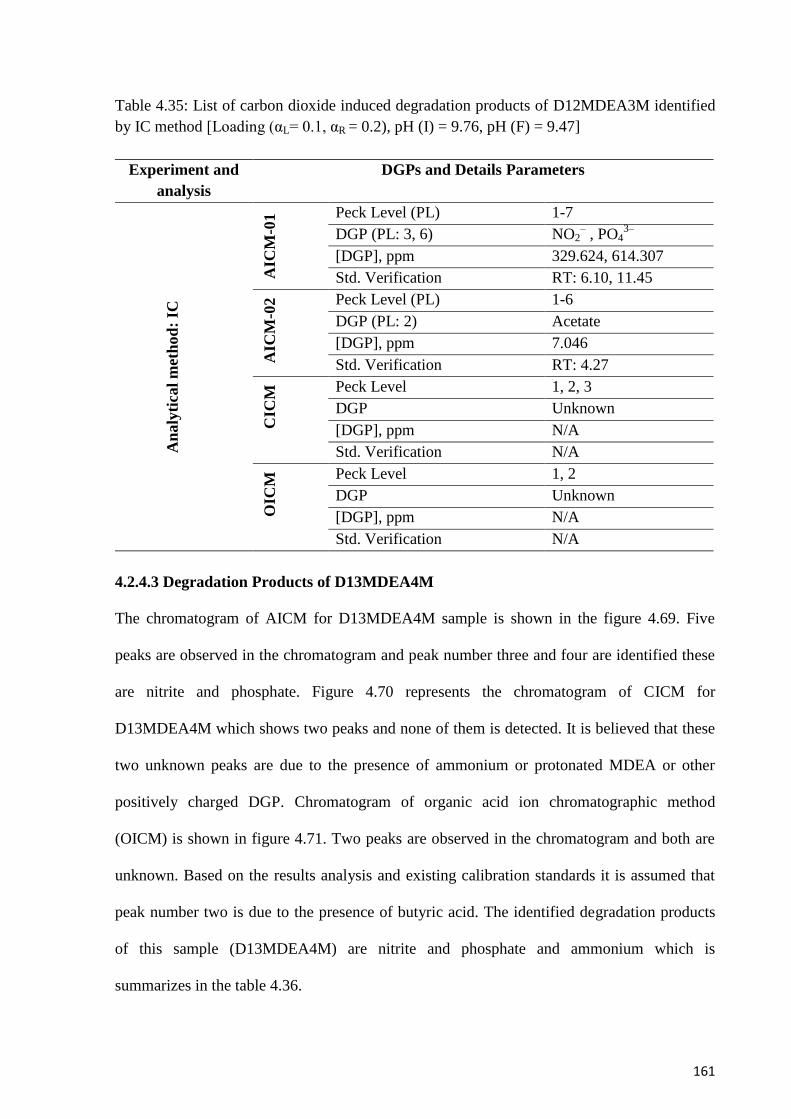
161
Table 4.35: List of carbon dioxide induced degradation products of D12MDEA3M identified
by IC method [Loading (αL= 0.1, αR = 0.2), pH (I) = 9.76, pH (F) = 9.47]
Experiment and
analysis
DGPs and Details Parameters
An
aly
tica
l m
eth
od
: IC
AIC
M-0
1 Peck Level (PL) 1-7
DGP (PL: 3, 6) NO2– , PO4
3–
[DGP], ppm 329.624, 614.307
Std. Verification RT: 6.10, 11.45 A
ICM
-02
Peck Level (PL) 1-6
DGP (PL: 2) Acetate
[DGP], ppm 7.046
Std. Verification RT: 4.27
CIC
M Peck Level 1, 2, 3
DGP Unknown
[DGP], ppm N/A
Std. Verification N/A
OIC
M Peck Level 1, 2
DGP Unknown
[DGP], ppm N/A
Std. Verification N/A
4.2.4.3 Degradation Products of D13MDEA4M
The chromatogram of AICM for D13MDEA4M sample is shown in the figure 4.69. Five
peaks are observed in the chromatogram and peak number three and four are identified these
are nitrite and phosphate. Figure 4.70 represents the chromatogram of CICM for
D13MDEA4M which shows two peaks and none of them is detected. It is believed that these
two unknown peaks are due to the presence of ammonium or protonated MDEA or other
positively charged DGP. Chromatogram of organic acid ion chromatographic method
(OICM) is shown in figure 4.71. Two peaks are observed in the chromatogram and both are
unknown. Based on the results analysis and existing calibration standards it is assumed that
peak number two is due to the presence of butyric acid. The identified degradation products
of this sample (D13MDEA4M) are nitrite and phosphate and ammonium which is
summarizes in the table 4.36.
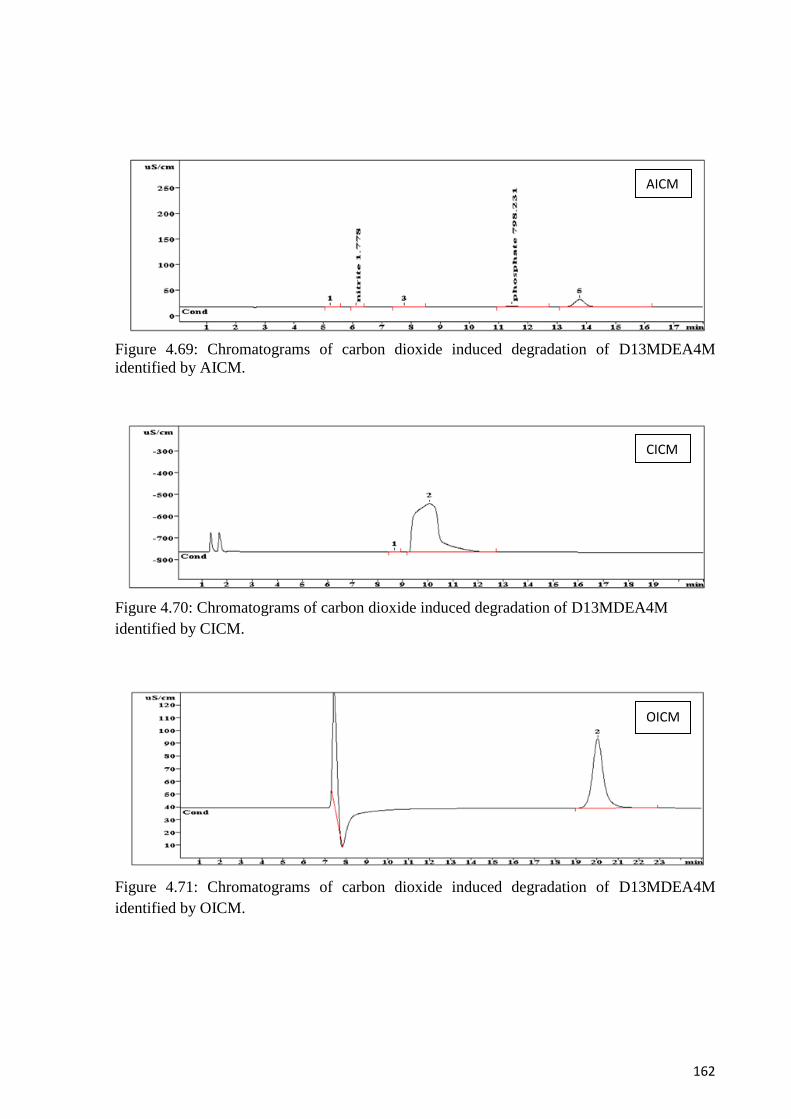
162
Figure 4.69: Chromatograms of carbon dioxide induced degradation of D13MDEA4M
identified by AICM.
Figure 4.70: Chromatograms of carbon dioxide induced degradation of D13MDEA4M
identified by CICM.
Figure 4.71: Chromatograms of carbon dioxide induced degradation of D13MDEA4M
identified by OICM.
AICM
CICM
OICM
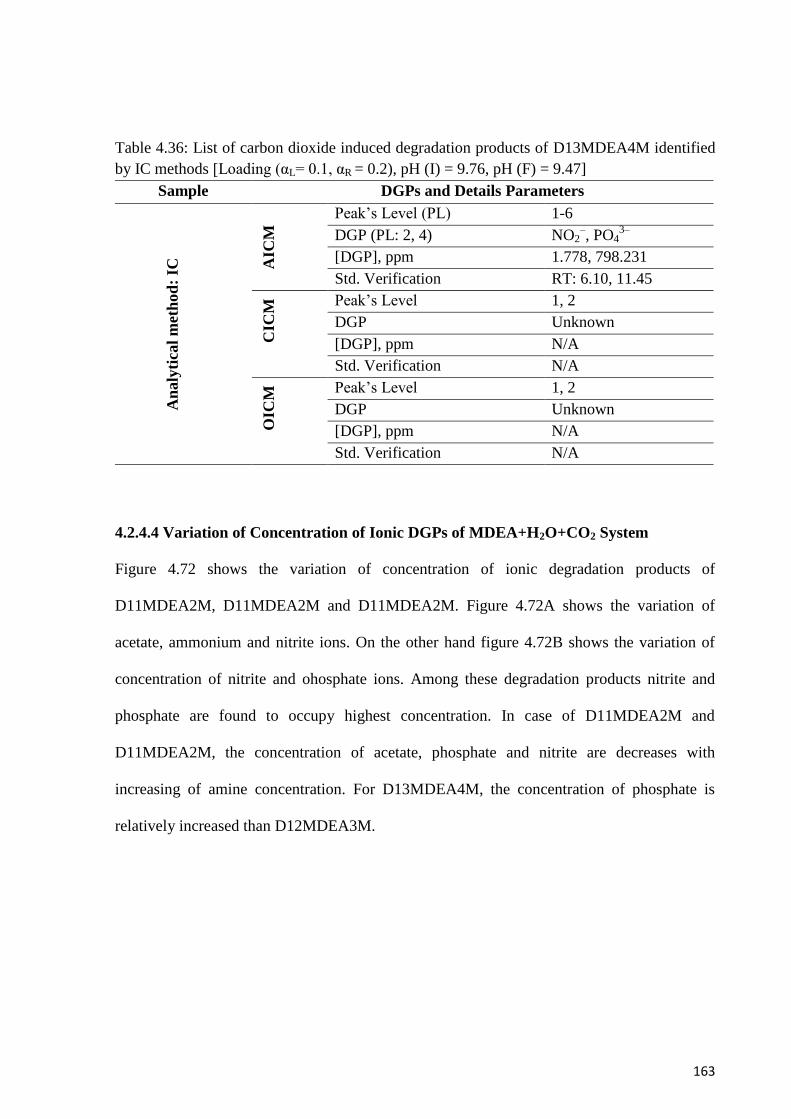
163
Table 4.36: List of carbon dioxide induced degradation products of D13MDEA4M identified
by IC methods [Loading (αL= 0.1, αR = 0.2), pH (I) = 9.76, pH (F) = 9.47]
Sample DGPs and Details Parameters
An
aly
tica
l m
eth
od
: IC
AIC
M Peak‟s Level (PL) 1-6
DGP (PL: 2, 4) NO2–, PO4
3–
[DGP], ppm 1.778, 798.231
Std. Verification RT: 6.10, 11.45 C
ICM
Peak‟s Level 1, 2
DGP Unknown
[DGP], ppm N/A
Std. Verification N/A
OIC
M Peak‟s Level 1, 2
DGP Unknown
[DGP], ppm N/A
Std. Verification N/A
4.2.4.4 Variation of Concentration of Ionic DGPs of MDEA+H2O+CO2 System
Figure 4.72 shows the variation of concentration of ionic degradation products of
D11MDEA2M, D11MDEA2M and D11MDEA2M. Figure 4.72A shows the variation of
acetate, ammonium and nitrite ions. On the other hand figure 4.72B shows the variation of
concentration of nitrite and ohosphate ions. Among these degradation products nitrite and
phosphate are found to occupy highest concentration. In case of D11MDEA2M and
D11MDEA2M, the concentration of acetate, phosphate and nitrite are decreases with
increasing of amine concentration. For D13MDEA4M, the concentration of phosphate is
relatively increased than D12MDEA3M.
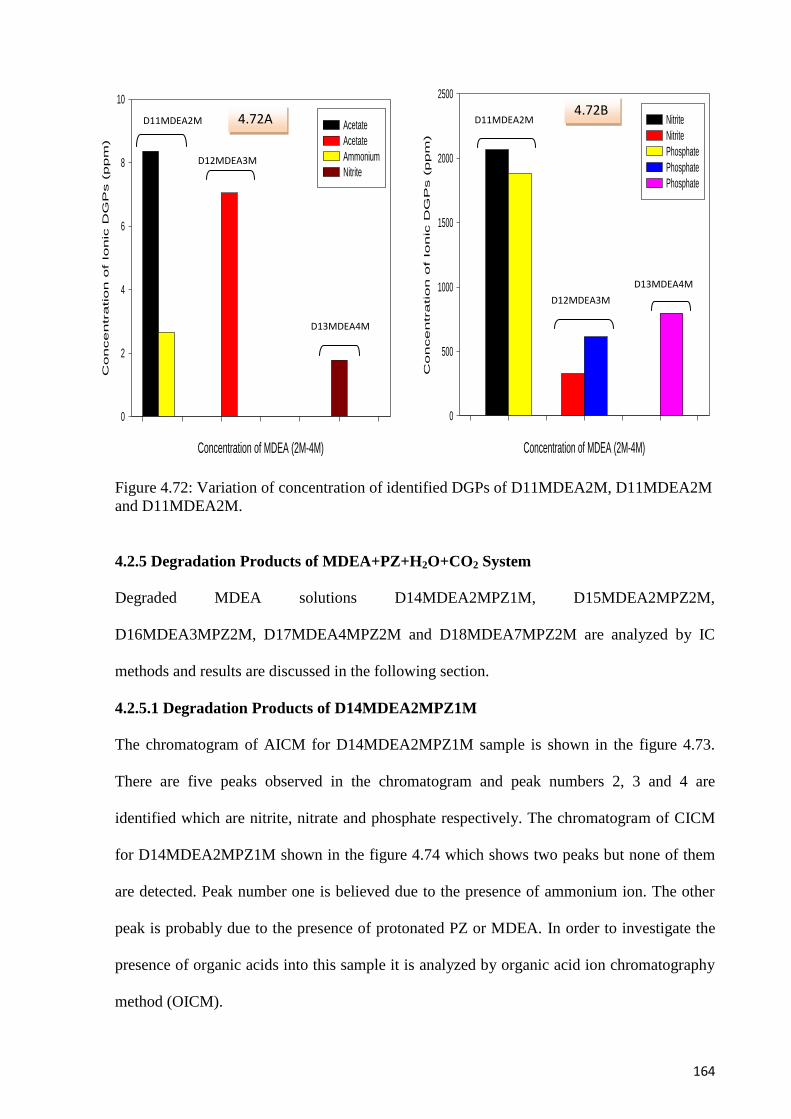
164
Figure 4.72: Variation of concentration of identified DGPs of D11MDEA2M, D11MDEA2M
and D11MDEA2M.
4.2.5 Degradation Products of MDEA+PZ+H2O+CO2 System
Degraded MDEA solutions D14MDEA2MPZ1M, D15MDEA2MPZ2M,
D16MDEA3MPZ2M, D17MDEA4MPZ2M and D18MDEA7MPZ2M are analyzed by IC
methods and results are discussed in the following section.
4.2.5.1 Degradation Products of D14MDEA2MPZ1M
The chromatogram of AICM for D14MDEA2MPZ1M sample is shown in the figure 4.73.
There are five peaks observed in the chromatogram and peak numbers 2, 3 and 4 are
identified which are nitrite, nitrate and phosphate respectively. The chromatogram of CICM
for D14MDEA2MPZ1M shown in the figure 4.74 which shows two peaks but none of them
are detected. Peak number one is believed due to the presence of ammonium ion. The other
peak is probably due to the presence of protonated PZ or MDEA. In order to investigate the
presence of organic acids into this sample it is analyzed by organic acid ion chromatography
method (OICM).
Concentration of MDEA (2M-4M)
Concentratio
n of Ionic
D
GP
s (ppm
)
0
2
4
6
8
10
Acetate
Acetate
Ammonium
Nitrite
Concentration of MDEA (2M-4M)
Co
nce
ntra
tio
n o
f Io
nic
D
GP
s (p
pm
)0
500
1000
1500
2000
2500
Nitrite
Nitrite
Phosphate
Phosphate
Phosphate
D11MDEA2M
D12MDEA3M
D13MDEA4M
D13MDEA4M
D12MDEA3M
D11MDEA2M
4.72A 4.72B
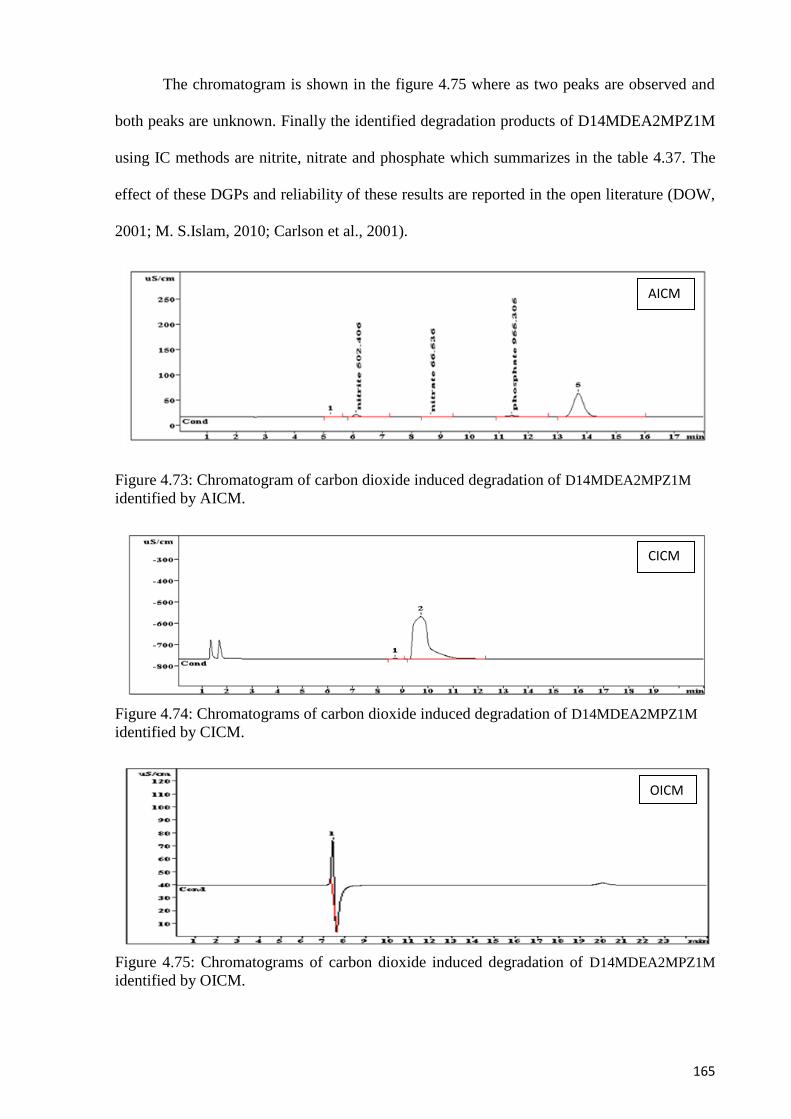
165
The chromatogram is shown in the figure 4.75 where as two peaks are observed and
both peaks are unknown. Finally the identified degradation products of D14MDEA2MPZ1M
using IC methods are nitrite, nitrate and phosphate which summarizes in the table 4.37. The
effect of these DGPs and reliability of these results are reported in the open literature (DOW,
2001; M. S.Islam, 2010; Carlson et al., 2001).
Figure 4.73: Chromatogram of carbon dioxide induced degradation of D14MDEA2MPZ1M
identified by AICM.
Figure 4.74: Chromatograms of carbon dioxide induced degradation of D14MDEA2MPZ1M
identified by CICM.
Figure 4.75: Chromatograms of carbon dioxide induced degradation of D14MDEA2MPZ1M
identified by OICM.
AICM
CICM
OICM
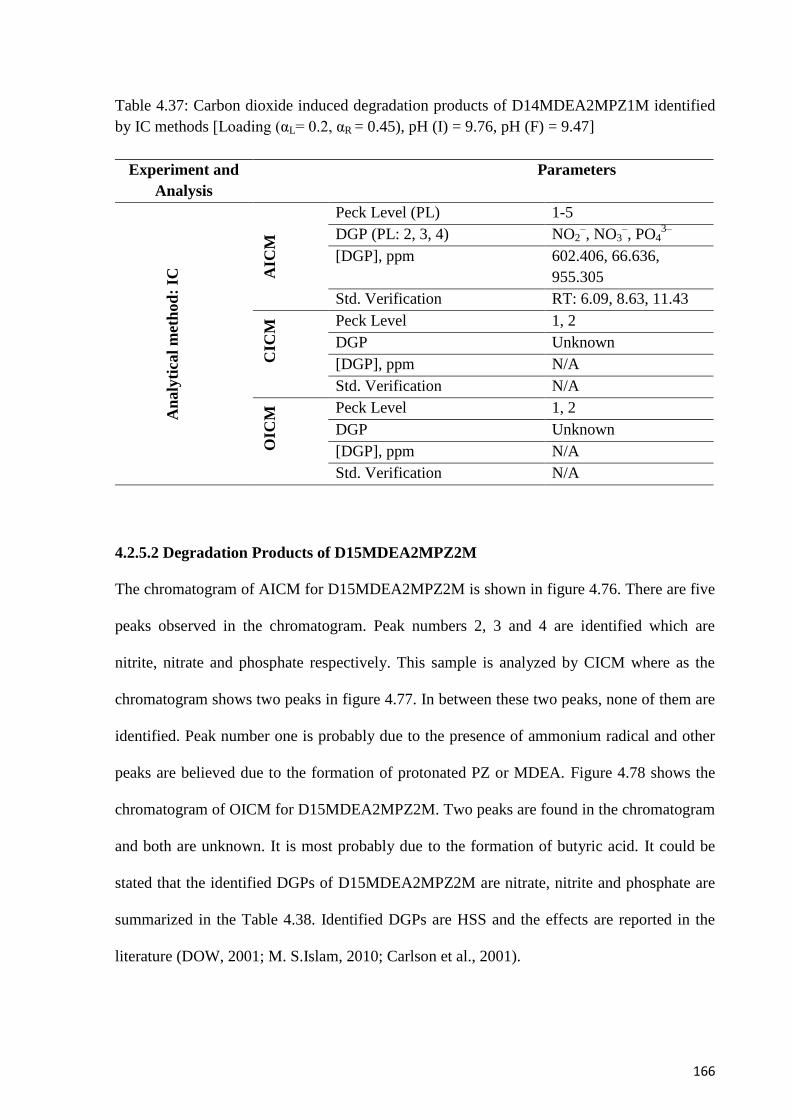
166
Table 4.37: Carbon dioxide induced degradation products of D14MDEA2MPZ1M identified
by IC methods [Loading (αL= 0.2, αR = 0.45), pH (I) = 9.76, pH (F) = 9.47]
Experiment and
Analysis
Parameters
An
aly
tica
l m
eth
od
: IC
AIC
M
Peck Level (PL) 1-5
DGP (PL: 2, 3, 4) NO2–, NO3
–, PO4
3–
[DGP], ppm 602.406, 66.636,
955.305
Std. Verification RT: 6.09, 8.63, 11.43
CIC
M Peck Level 1, 2
DGP Unknown
[DGP], ppm N/A
Std. Verification N/A
OIC
M Peck Level 1, 2
DGP Unknown
[DGP], ppm N/A
Std. Verification N/A
4.2.5.2 Degradation Products of D15MDEA2MPZ2M
The chromatogram of AICM for D15MDEA2MPZ2M is shown in figure 4.76. There are five
peaks observed in the chromatogram. Peak numbers 2, 3 and 4 are identified which are
nitrite, nitrate and phosphate respectively. This sample is analyzed by CICM where as the
chromatogram shows two peaks in figure 4.77. In between these two peaks, none of them are
identified. Peak number one is probably due to the presence of ammonium radical and other
peaks are believed due to the formation of protonated PZ or MDEA. Figure 4.78 shows the
chromatogram of OICM for D15MDEA2MPZ2M. Two peaks are found in the chromatogram
and both are unknown. It is most probably due to the formation of butyric acid. It could be
stated that the identified DGPs of D15MDEA2MPZ2M are nitrate, nitrite and phosphate are
summarized in the Table 4.38. Identified DGPs are HSS and the effects are reported in the
literature (DOW, 2001; M. S.Islam, 2010; Carlson et al., 2001).
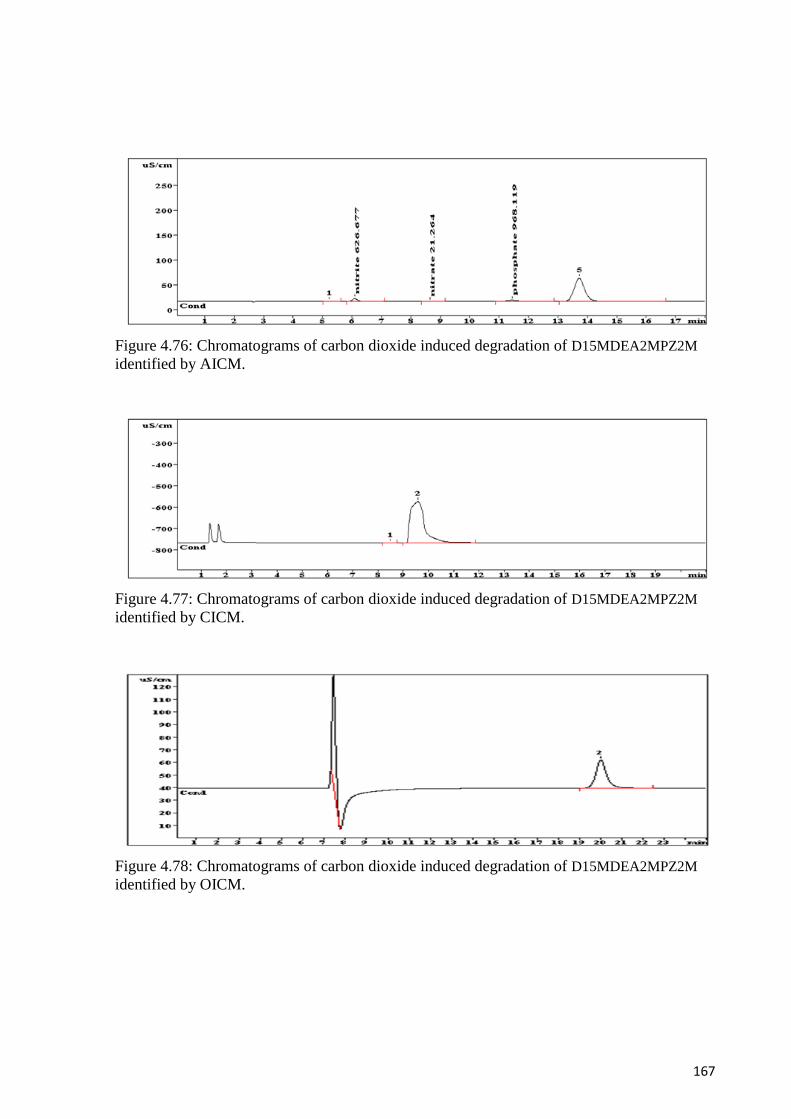
167
Figure 4.76: Chromatograms of carbon dioxide induced degradation of D15MDEA2MPZ2M
identified by AICM.
Figure 4.77: Chromatograms of carbon dioxide induced degradation of D15MDEA2MPZ2M
identified by CICM.
Figure 4.78: Chromatograms of carbon dioxide induced degradation of D15MDEA2MPZ2M
identified by OICM.
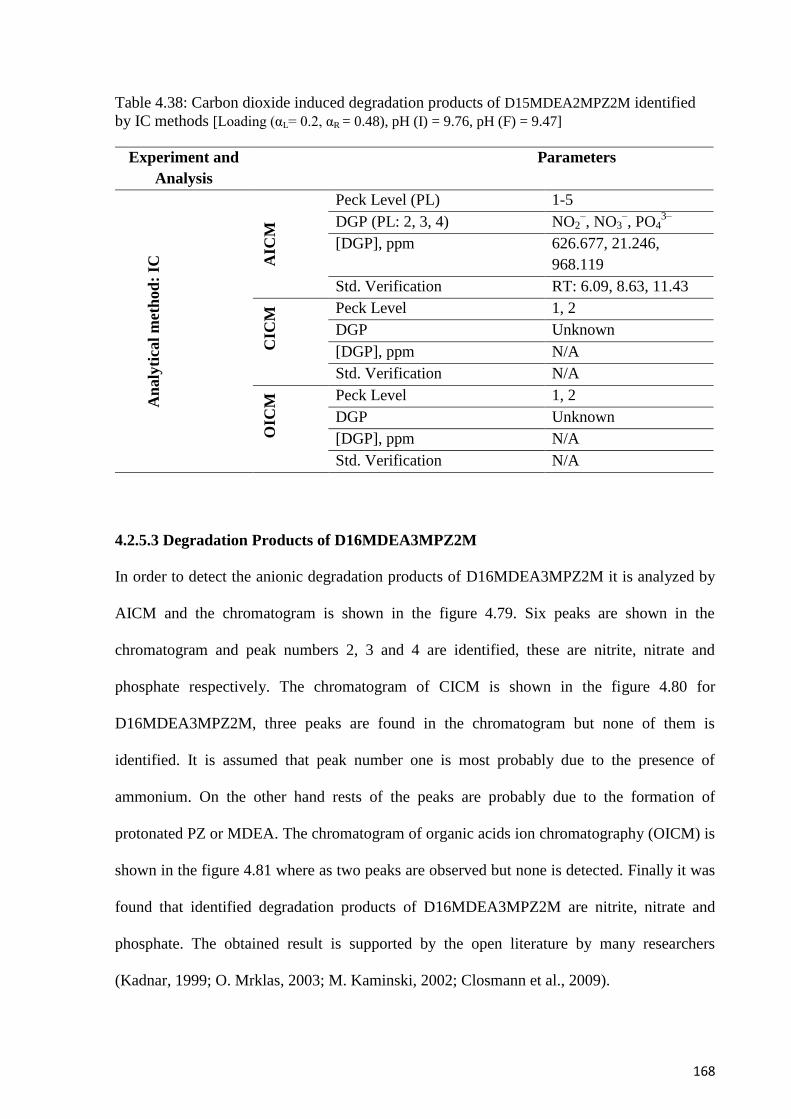
168
Table 4.38: Carbon dioxide induced degradation products of D15MDEA2MPZ2M identified
by IC methods [Loading (αL= 0.2, αR = 0.48), pH (I) = 9.76, pH (F) = 9.47]
Experiment and
Analysis
Parameters
An
aly
tica
l m
eth
od
: IC
AIC
M
Peck Level (PL) 1-5
DGP (PL: 2, 3, 4) NO2–, NO3
–, PO4
3–
[DGP], ppm 626.677, 21.246,
968.119
Std. Verification RT: 6.09, 8.63, 11.43
CIC
M Peck Level 1, 2
DGP Unknown
[DGP], ppm N/A
Std. Verification N/A
OIC
M Peck Level 1, 2
DGP Unknown
[DGP], ppm N/A
Std. Verification N/A
4.2.5.3 Degradation Products of D16MDEA3MPZ2M
In order to detect the anionic degradation products of D16MDEA3MPZ2M it is analyzed by
AICM and the chromatogram is shown in the figure 4.79. Six peaks are shown in the
chromatogram and peak numbers 2, 3 and 4 are identified, these are nitrite, nitrate and
phosphate respectively. The chromatogram of CICM is shown in the figure 4.80 for
D16MDEA3MPZ2M, three peaks are found in the chromatogram but none of them is
identified. It is assumed that peak number one is most probably due to the presence of
ammonium. On the other hand rests of the peaks are probably due to the formation of
protonated PZ or MDEA. The chromatogram of organic acids ion chromatography (OICM) is
shown in the figure 4.81 where as two peaks are observed but none is detected. Finally it was
found that identified degradation products of D16MDEA3MPZ2M are nitrite, nitrate and
phosphate. The obtained result is supported by the open literature by many researchers
(Kadnar, 1999; O. Mrklas, 2003; M. Kaminski, 2002; Closmann et al., 2009).
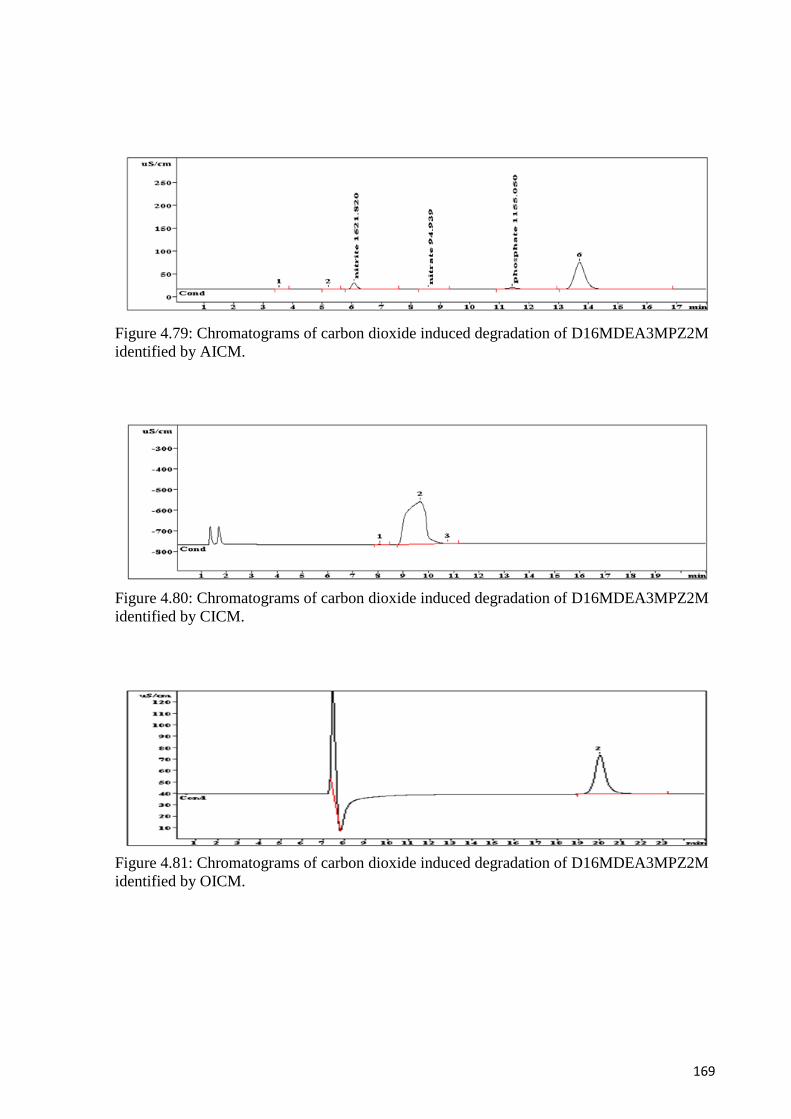
169
Figure 4.79: Chromatograms of carbon dioxide induced degradation of D16MDEA3MPZ2M
identified by AICM.
Figure 4.80: Chromatograms of carbon dioxide induced degradation of D16MDEA3MPZ2M
identified by CICM.
Figure 4.81: Chromatograms of carbon dioxide induced degradation of D16MDEA3MPZ2M
identified by OICM.
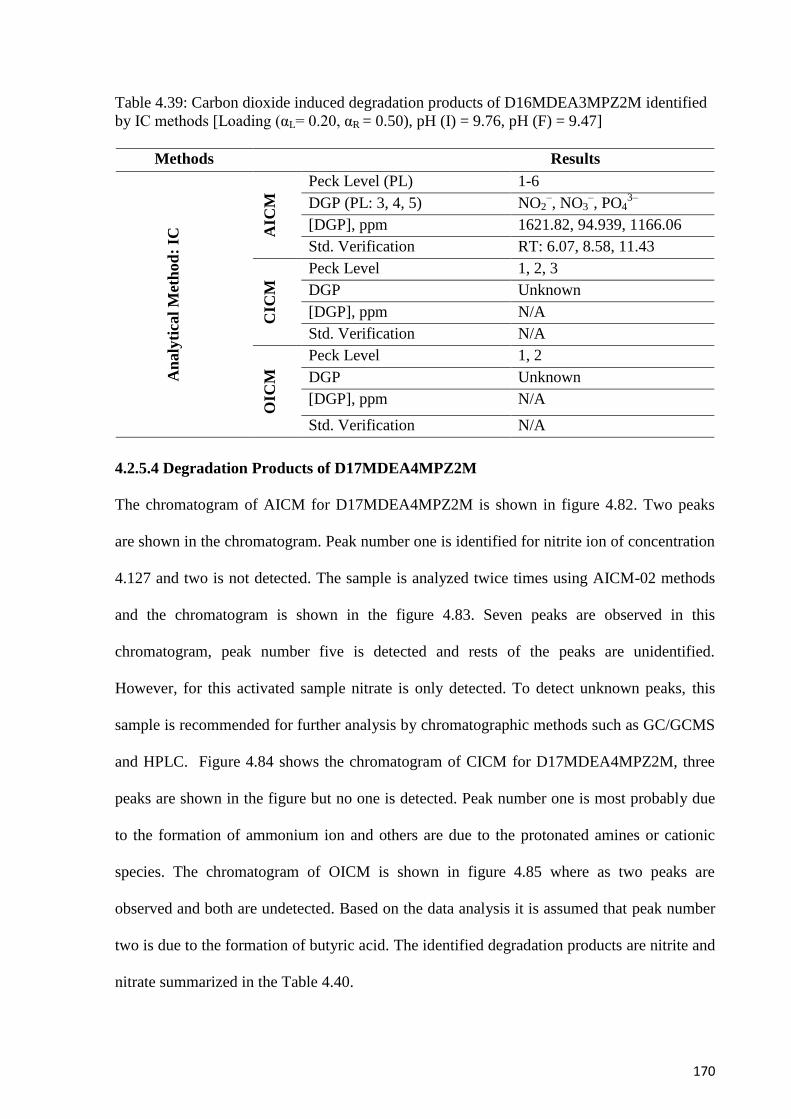
170
Table 4.39: Carbon dioxide induced degradation products of D16MDEA3MPZ2M identified
by IC methods [Loading (αL= 0.20, αR = 0.50), pH (I) = 9.76, pH (F) = 9.47]
Methods Results
An
aly
tica
l M
eth
od
: IC
AIC
M Peck Level (PL) 1-6
DGP (PL: 3, 4, 5) NO2–, NO3
–, PO4
3–
[DGP], ppm 1621.82, 94.939, 1166.06
Std. Verification RT: 6.07, 8.58, 11.43
CIC
M Peck Level 1, 2, 3
DGP Unknown
[DGP], ppm N/A
Std. Verification N/A
OIC
M
Peck Level 1, 2
DGP Unknown
[DGP], ppm N/A
Std. Verification N/A
4.2.5.4 Degradation Products of D17MDEA4MPZ2M
The chromatogram of AICM for D17MDEA4MPZ2M is shown in figure 4.82. Two peaks
are shown in the chromatogram. Peak number one is identified for nitrite ion of concentration
4.127 and two is not detected. The sample is analyzed twice times using AICM-02 methods
and the chromatogram is shown in the figure 4.83. Seven peaks are observed in this
chromatogram, peak number five is detected and rests of the peaks are unidentified.
However, for this activated sample nitrate is only detected. To detect unknown peaks, this
sample is recommended for further analysis by chromatographic methods such as GC/GCMS
and HPLC. Figure 4.84 shows the chromatogram of CICM for D17MDEA4MPZ2M, three
peaks are shown in the figure but no one is detected. Peak number one is most probably due
to the formation of ammonium ion and others are due to the protonated amines or cationic
species. The chromatogram of OICM is shown in figure 4.85 where as two peaks are
observed and both are undetected. Based on the data analysis it is assumed that peak number
two is due to the formation of butyric acid. The identified degradation products are nitrite and
nitrate summarized in the Table 4.40.
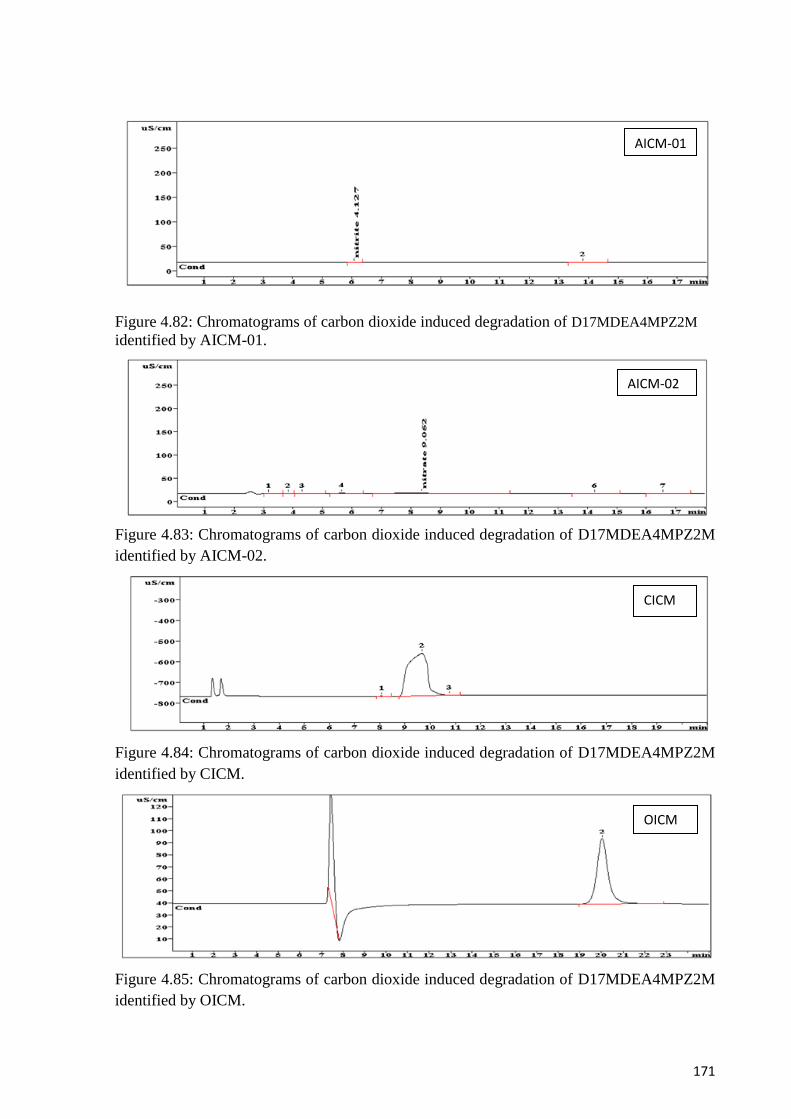
171
Figure 4.82: Chromatograms of carbon dioxide induced degradation of D17MDEA4MPZ2M
identified by AICM-01.
Figure 4.83: Chromatograms of carbon dioxide induced degradation of D17MDEA4MPZ2M
identified by AICM-02.
Figure 4.84: Chromatograms of carbon dioxide induced degradation of D17MDEA4MPZ2M
identified by CICM.
Figure 4.85: Chromatograms of carbon dioxide induced degradation of D17MDEA4MPZ2M
identified by OICM.
AICM-01
AICM-02
CICM
OICM
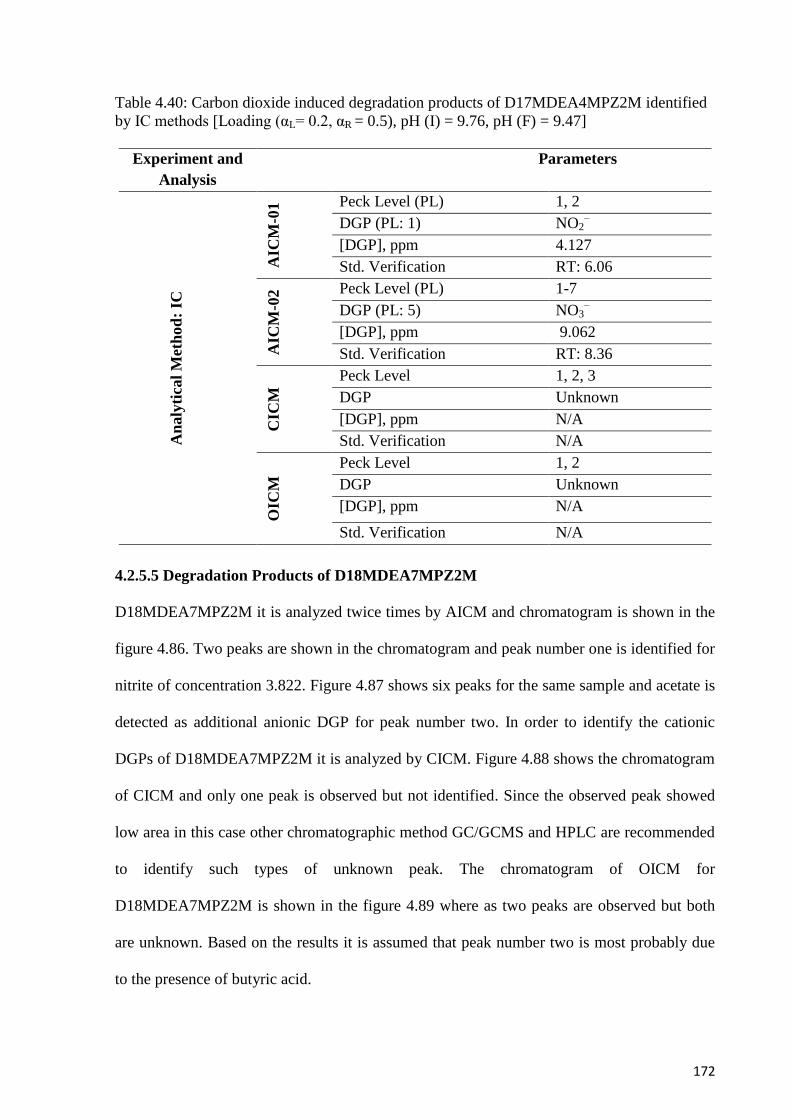
172
Table 4.40: Carbon dioxide induced degradation products of D17MDEA4MPZ2M identified
by IC methods [Loading (αL= 0.2, αR = 0.5), pH (I) = 9.76, pH (F) = 9.47]
Experiment and
Analysis
Parameters
An
aly
tica
l M
eth
od
: IC
AIC
M-0
1 Peck Level (PL) 1, 2
DGP (PL: 1) NO2–
[DGP], ppm 4.127
Std. Verification RT: 6.06 A
ICM
-02
Peck Level (PL) 1-7
DGP (PL: 5) NO3–
[DGP], ppm 9.062
Std. Verification RT: 8.36
CIC
M Peck Level 1, 2, 3
DGP Unknown
[DGP], ppm N/A
Std. Verification N/A
OIC
M
Peck Level 1, 2
DGP Unknown
[DGP], ppm N/A
Std. Verification N/A
4.2.5.5 Degradation Products of D18MDEA7MPZ2M
D18MDEA7MPZ2M it is analyzed twice times by AICM and chromatogram is shown in the
figure 4.86. Two peaks are shown in the chromatogram and peak number one is identified for
nitrite of concentration 3.822. Figure 4.87 shows six peaks for the same sample and acetate is
detected as additional anionic DGP for peak number two. In order to identify the cationic
DGPs of D18MDEA7MPZ2M it is analyzed by CICM. Figure 4.88 shows the chromatogram
of CICM and only one peak is observed but not identified. Since the observed peak showed
low area in this case other chromatographic method GC/GCMS and HPLC are recommended
to identify such types of unknown peak. The chromatogram of OICM for
D18MDEA7MPZ2M is shown in the figure 4.89 where as two peaks are observed but both
are unknown. Based on the results it is assumed that peak number two is most probably due
to the presence of butyric acid.
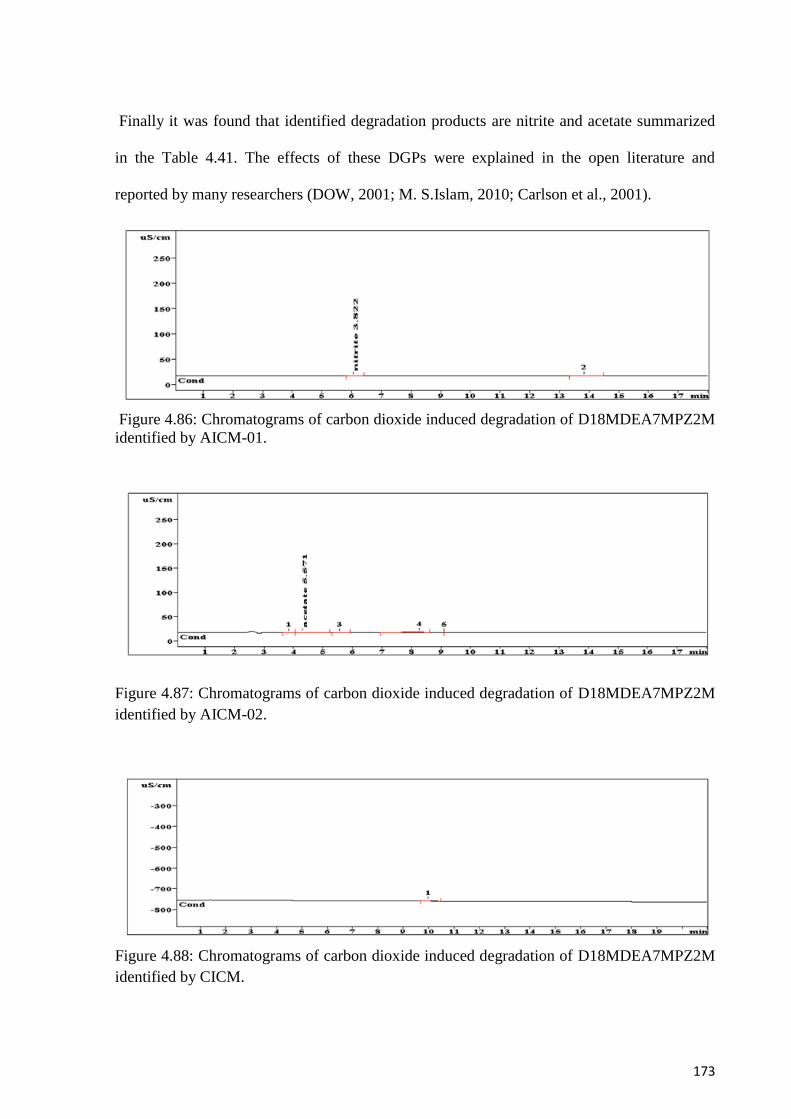
173
Finally it was found that identified degradation products are nitrite and acetate summarized
in the Table 4.41. The effects of these DGPs were explained in the open literature and
reported by many researchers (DOW, 2001; M. S.Islam, 2010; Carlson et al., 2001).
Figure 4.86: Chromatograms of carbon dioxide induced degradation of D18MDEA7MPZ2M
identified by AICM-01.
Figure 4.87: Chromatograms of carbon dioxide induced degradation of D18MDEA7MPZ2M
identified by AICM-02.
Figure 4.88: Chromatograms of carbon dioxide induced degradation of D18MDEA7MPZ2M
identified by CICM.
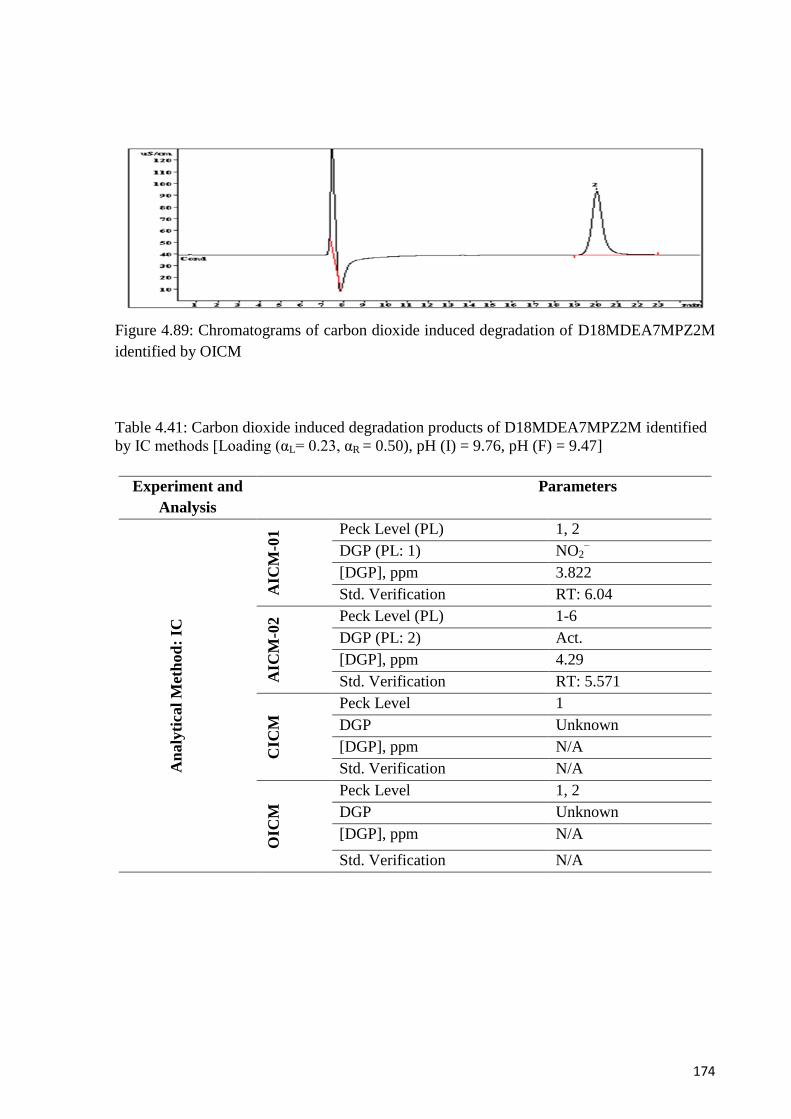
174
Figure 4.89: Chromatograms of carbon dioxide induced degradation of D18MDEA7MPZ2M
identified by OICM
Table 4.41: Carbon dioxide induced degradation products of D18MDEA7MPZ2M identified
by IC methods [Loading (αL= 0.23, αR = 0.50), pH (I) = 9.76, pH (F) = 9.47]
Experiment and
Analysis
Parameters
An
aly
tica
l M
eth
od
: IC
AIC
M-0
1 Peck Level (PL) 1, 2
DGP (PL: 1) NO2–
[DGP], ppm 3.822
Std. Verification RT: 6.04
AIC
M-0
2 Peck Level (PL) 1-6
DGP (PL: 2) Act.
[DGP], ppm 4.29
Std. Verification RT: 5.571
CIC
M Peck Level 1
DGP Unknown
[DGP], ppm N/A
Std. Verification N/A
OIC
M
Peck Level 1, 2
DGP Unknown
[DGP], ppm N/A
Std. Verification N/A
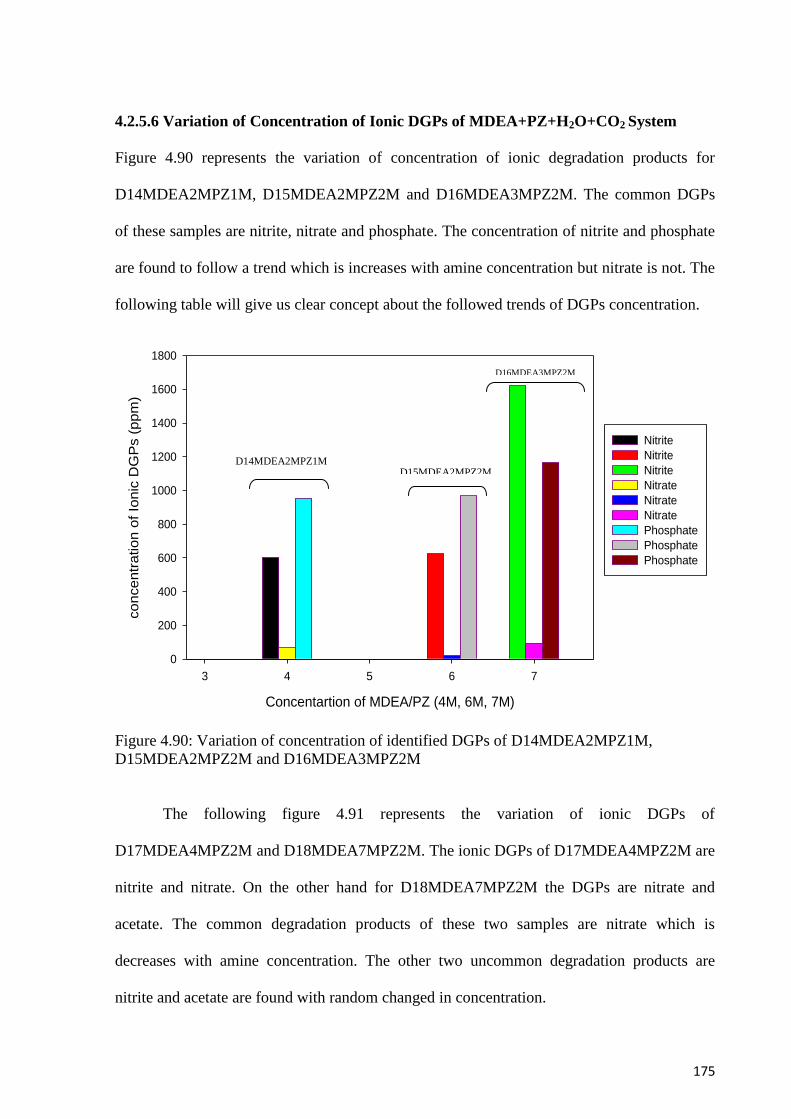
175
4.2.5.6 Variation of Concentration of Ionic DGPs of MDEA+PZ+H2O+CO2 System
Figure 4.90 represents the variation of concentration of ionic degradation products for
D14MDEA2MPZ1M, D15MDEA2MPZ2M and D16MDEA3MPZ2M. The common DGPs
of these samples are nitrite, nitrate and phosphate. The concentration of nitrite and phosphate
are found to follow a trend which is increases with amine concentration but nitrate is not. The
following table will give us clear concept about the followed trends of DGPs concentration.
Figure 4.90: Variation of concentration of identified DGPs of D14MDEA2MPZ1M,
D15MDEA2MPZ2M and D16MDEA3MPZ2M
The following figure 4.91 represents the variation of ionic DGPs of
D17MDEA4MPZ2M and D18MDEA7MPZ2M. The ionic DGPs of D17MDEA4MPZ2M are
nitrite and nitrate. On the other hand for D18MDEA7MPZ2M the DGPs are nitrate and
acetate. The common degradation products of these two samples are nitrate which is
decreases with amine concentration. The other two uncommon degradation products are
nitrite and acetate are found with random changed in concentration.
Concentartion of MDEA/PZ (4M, 6M, 7M)
3 4 5 6 7
co
nce
ntr
atio
n o
f Io
nic
DG
Ps (
pp
m)
0
200
400
600
800
1000
1200
1400
1600
1800
Nitrite
Nitrite
Nitrite
Nitrate
Nitrate
Nitrate
Phosphate
Phosphate
Phosphate
D14MDEA2MPZ1M
D16MDEA3MPZ2M
D15MDEA2MPZ2M

176
Figure 4.91: Variation of concentration of identified DGPs of D17MDEA4MPZ2M and D18MDEA7MPZ2M
4.2.6 Summary of IC Analysis
In order to identify ionic DGPs, three ion chromatographic analyses were conducted
in this degradation study. The IC methods are anionic ion chromatography (AICM), cationic
ion chromatography (CICM) and organic acid ion chromatographic method (OICM).
Identified degradation products are summarized in the following representation. Ionic DGPs
of PZ+H2O+CO2 system was given in the table 4.42 for two samples D01PZ1M and
D02PZ2M. The most common identified degradation products are acetate, nitrate, phosphate
and ammonium. All identified products are the salt of organic and inorganic acids generally
referred to as heat stable salt (HSS). The found results are identical with open literature
previously many researchers also reported these DGPs during the degradation study of PZ
and PZ blends (Stewart and Lanning, 1994; Freeman et al., 2009; Freeman et al., 2010;
Alawode, 2005; Sexton and Rochelle, 2010).
Concentration of MDEA/PZ (8M, 11M)
7 8 9 10 11 12
Concentr
ation o
f Io
nic
DG
Ps (
ppm
)
0
2
4
6
8
10
Nitrite
Nitrate
Nitrate
Acetate
D17MDEA4MPZ2M
D18MDEA7MPZ2M
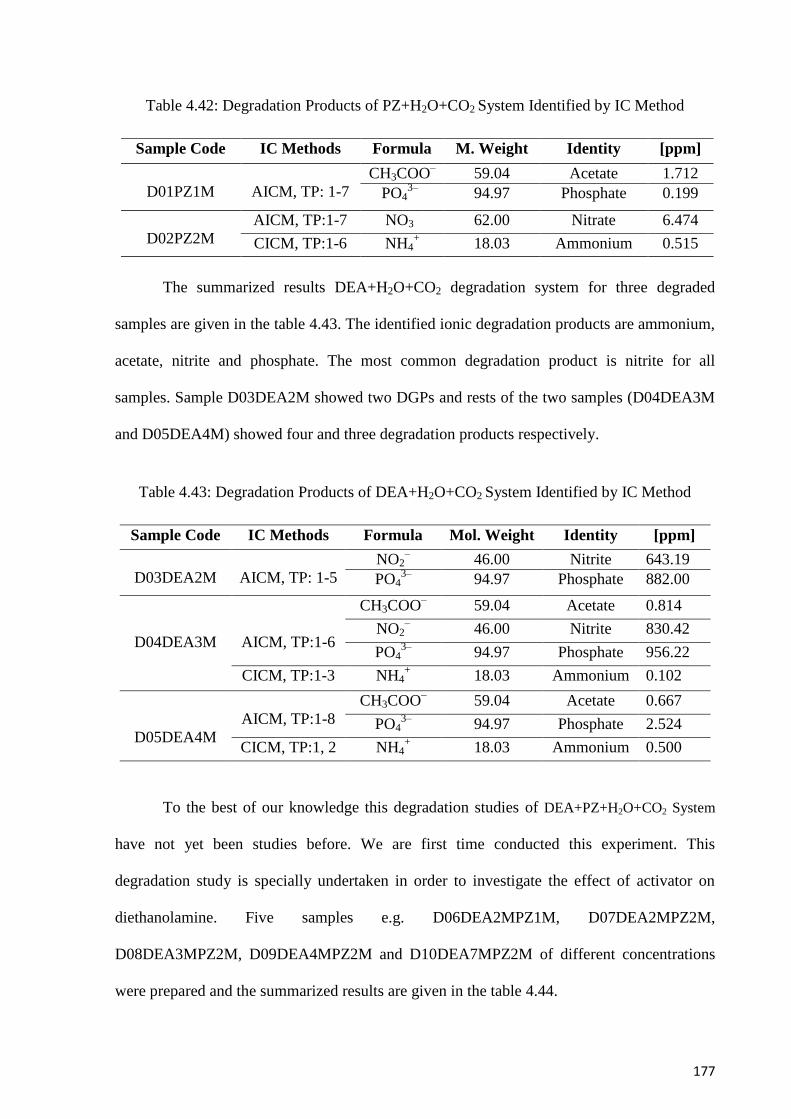
177
Table 4.42: Degradation Products of PZ+H2O+CO2 System Identified by IC Method
Sample Code IC Methods Formula M. Weight Identity [ppm]
D01PZ1M
AICM, TP: 1-7
CH3COO–
59.04 Acetate 1.712
PO43–
94.97 Phosphate 0.199
D02PZ2M
AICM, TP:1-7 NO3¯ 62.00 Nitrate 6.474
CICM, TP:1-6 NH4+ 18.03 Ammonium 0.515
The summarized results DEA+H2O+CO2 degradation system for three degraded
samples are given in the table 4.43. The identified ionic degradation products are ammonium,
acetate, nitrite and phosphate. The most common degradation product is nitrite for all
samples. Sample D03DEA2M showed two DGPs and rests of the two samples (D04DEA3M
and D05DEA4M) showed four and three degradation products respectively.
Table 4.43: Degradation Products of DEA+H2O+CO2 System Identified by IC Method
Sample Code IC Methods Formula Mol. Weight Identity [ppm]
D03DEA2M
AICM, TP: 1-5
NO2–
46.00 Nitrite 643.19
PO43–
94.97 Phosphate 882.00
D04DEA3M
AICM, TP:1-6
CH3COO–
59.04 Acetate 0.814
NO2–
46.00 Nitrite 830.42
PO43–
94.97 Phosphate 956.22
CICM, TP:1-3 NH4+ 18.03 Ammonium 0.102
D05DEA4M
AICM, TP:1-8
CH3COO–
59.04 Acetate 0.667
PO43–
94.97 Phosphate 2.524
CICM, TP:1, 2 NH4+ 18.03 Ammonium 0.500
To the best of our knowledge this degradation studies of DEA+PZ+H2O+CO2 System
have not yet been studies before. We are first time conducted this experiment. This
degradation study is specially undertaken in order to investigate the effect of activator on
diethanolamine. Five samples e.g. D06DEA2MPZ1M, D07DEA2MPZ2M,
D08DEA3MPZ2M, D09DEA4MPZ2M and D10DEA7MPZ2M of different concentrations
were prepared and the summarized results are given in the table 4.44.
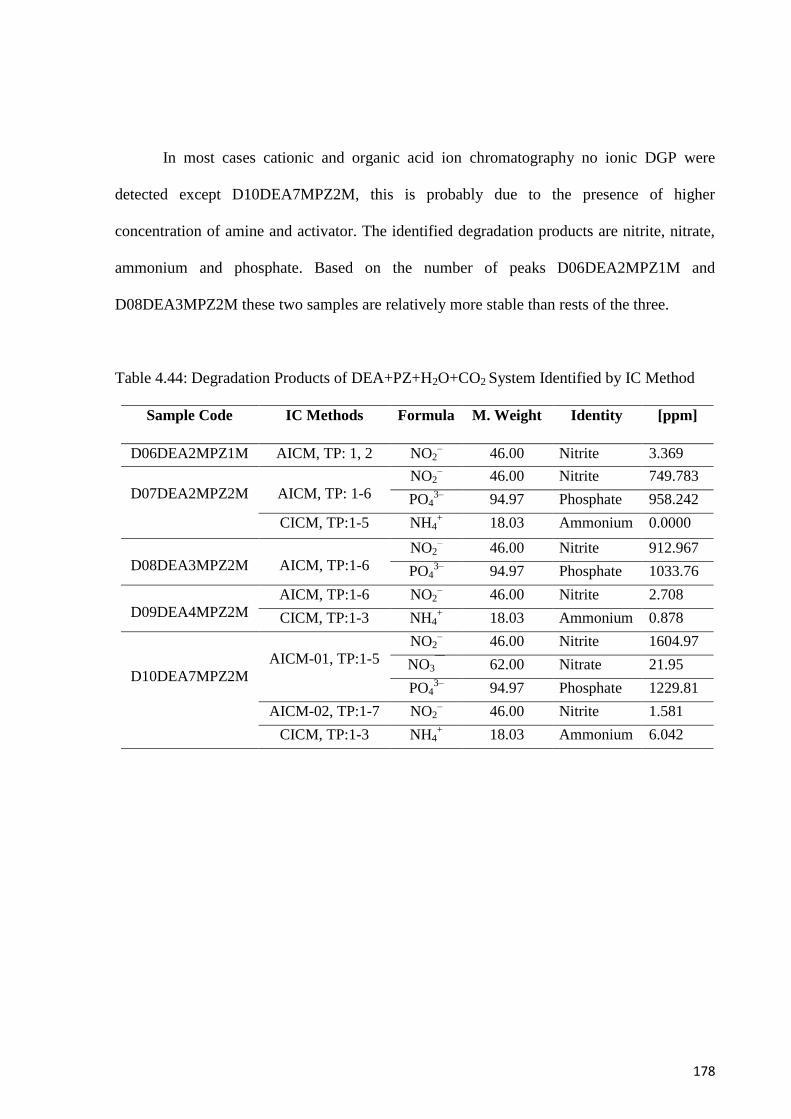
178
In most cases cationic and organic acid ion chromatography no ionic DGP were
detected except D10DEA7MPZ2M, this is probably due to the presence of higher
concentration of amine and activator. The identified degradation products are nitrite, nitrate,
ammonium and phosphate. Based on the number of peaks D06DEA2MPZ1M and
D08DEA3MPZ2M these two samples are relatively more stable than rests of the three.
Table 4.44: Degradation Products of DEA+PZ+H2O+CO2 System Identified by IC Method
Sample Code IC Methods Formula M. Weight Identity [ppm]
D06DEA2MPZ1M AICM, TP: 1, 2 NO2– 46.00 Nitrite 3.369
D07DEA2MPZ2M
AICM, TP: 1-6
NO2– 46.00 Nitrite 749.783
PO43– 94.97 Phosphate 958.242
CICM, TP:1-5 NH4+ 18.03 Ammonium 0.0000
D08DEA3MPZ2M
AICM, TP:1-6
NO2– 46.00 Nitrite 912.967
PO43– 94.97 Phosphate 1033.76
D09DEA4MPZ2M
AICM, TP:1-6 NO2– 46.00 Nitrite 2.708
CICM, TP:1-3 NH4+ 18.03 Ammonium 0.878
D10DEA7MPZ2M
AICM-01, TP:1-5
NO2– 46.00 Nitrite 1604.97
NO3¯¯ 62.00 Nitrate 21.95
PO43– 94.97 Phosphate 1229.81
AICM-02, TP:1-7 NO2– 46.00 Nitrite 1.581
CICM, TP:1-3 NH4+ 18.03 Ammonium 6.042
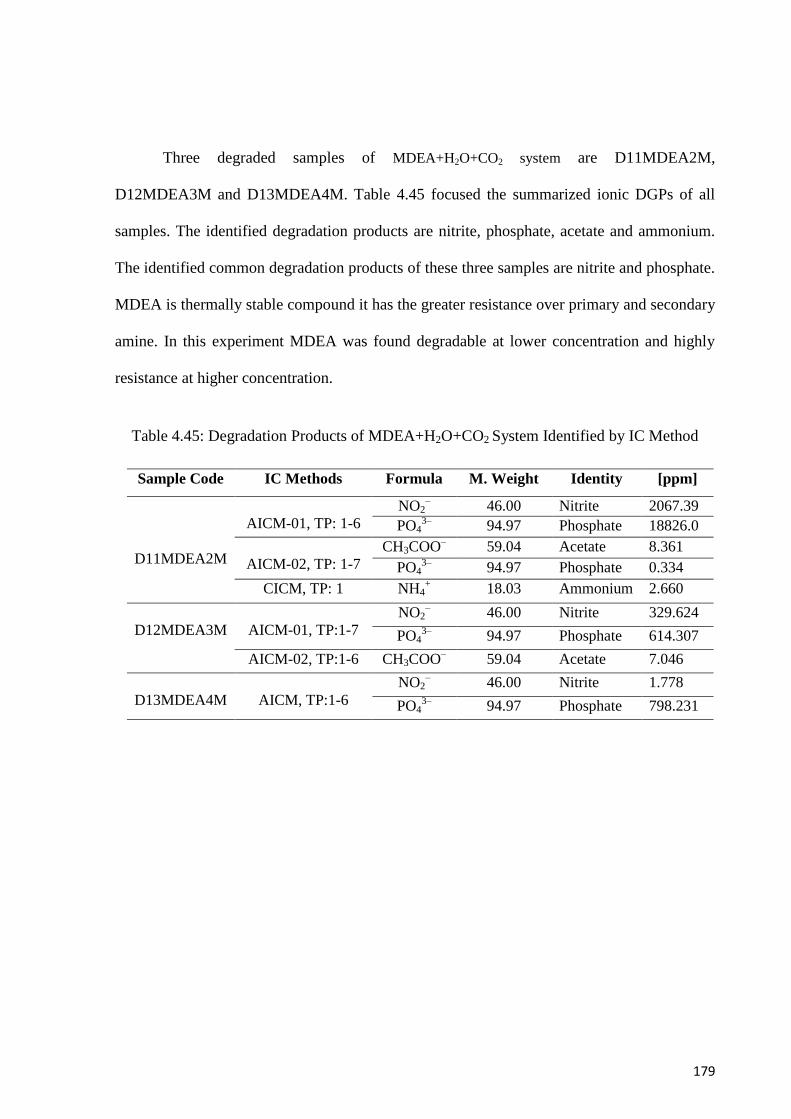
179
Three degraded samples of MDEA+H2O+CO2 system are D11MDEA2M,
D12MDEA3M and D13MDEA4M. Table 4.45 focused the summarized ionic DGPs of all
samples. The identified degradation products are nitrite, phosphate, acetate and ammonium.
The identified common degradation products of these three samples are nitrite and phosphate.
MDEA is thermally stable compound it has the greater resistance over primary and secondary
amine. In this experiment MDEA was found degradable at lower concentration and highly
resistance at higher concentration.
Table 4.45: Degradation Products of MDEA+H2O+CO2 System Identified by IC Method
Sample Code IC Methods Formula M. Weight Identity [ppm]
D11MDEA2M
AICM-01, TP: 1-6
NO2– 46.00 Nitrite 2067.39
PO43– 94.97 Phosphate 18826.0
AICM-02, TP: 1-7
CH3COO– 59.04 Acetate 8.361
PO43– 94.97 Phosphate 0.334
CICM, TP: 1 NH4+ 18.03 Ammonium 2.660
D12MDEA3M
AICM-01, TP:1-7
NO2– 46.00 Nitrite 329.624
PO43– 94.97 Phosphate 614.307
AICM-02, TP:1-6 CH3COO– 59.04 Acetate 7.046
D13MDEA4M
AICM, TP:1-6
NO2– 46.00 Nitrite 1.778
PO43– 94.97 Phosphate 798.231
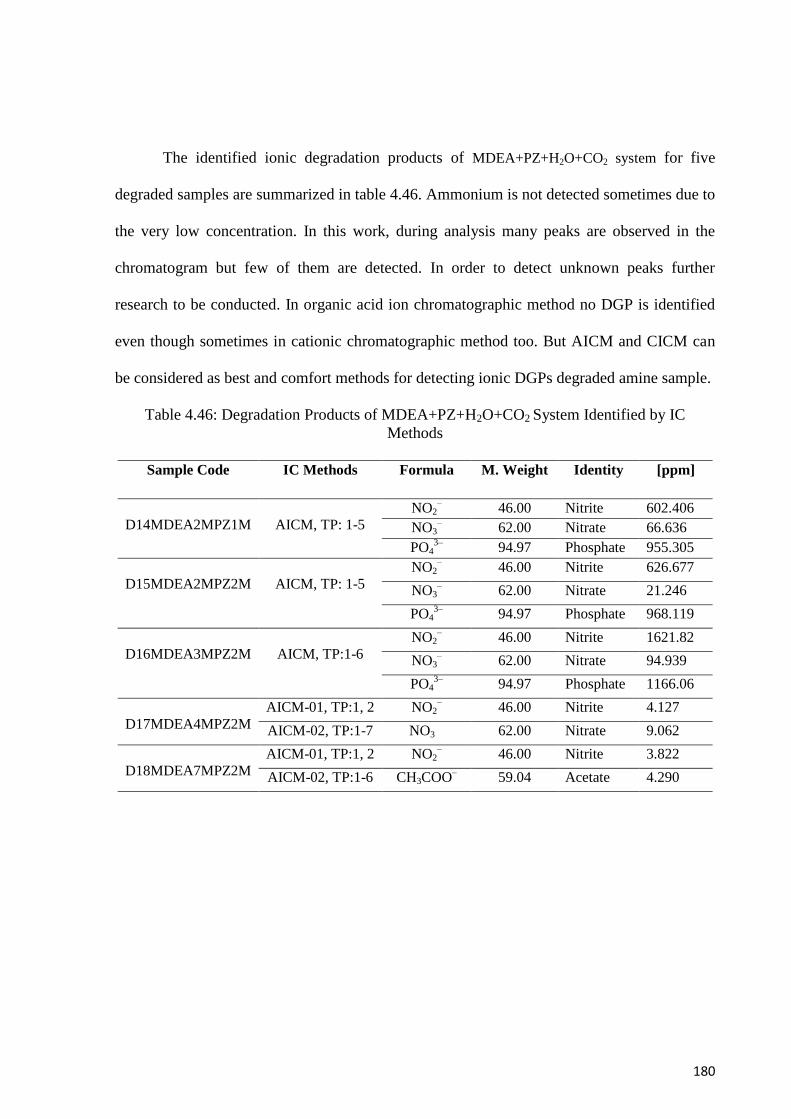
180
The identified ionic degradation products of MDEA+PZ+H2O+CO2 system for five
degraded samples are summarized in table 4.46. Ammonium is not detected sometimes due to
the very low concentration. In this work, during analysis many peaks are observed in the
chromatogram but few of them are detected. In order to detect unknown peaks further
research to be conducted. In organic acid ion chromatographic method no DGP is identified
even though sometimes in cationic chromatographic method too. But AICM and CICM can
be considered as best and comfort methods for detecting ionic DGPs degraded amine sample.
Table 4.46: Degradation Products of MDEA+PZ+H2O+CO2 System Identified by IC
Methods
Sample Code IC Methods Formula M. Weight Identity [ppm]
D14MDEA2MPZ1M
AICM, TP: 1-5
NO2–
46.00 Nitrite 602.406
NO3– 62.00 Nitrate 66.636
PO43–
94.97 Phosphate 955.305
D15MDEA2MPZ2M
AICM, TP: 1-5
NO2–
46.00 Nitrite 626.677
NO3– 62.00 Nitrate 21.246
PO43–
94.97 Phosphate 968.119
D16MDEA3MPZ2M
AICM, TP:1-6
NO2–
46.00 Nitrite 1621.82
NO3– 62.00 Nitrate 94.939
PO43–
94.97 Phosphate 1166.06
D17MDEA4MPZ2M
AICM-01, TP:1, 2 NO2–
46.00 Nitrite 4.127
AICM-02, TP:1-7 NO3¯¯
62.00 Nitrate 9.062
D18MDEA7MPZ2M
AICM-01, TP:1, 2 NO2–
46.00 Nitrite 3.822
AICM-02, TP:1-6 CH3COO–
59.04 Acetate 4.290
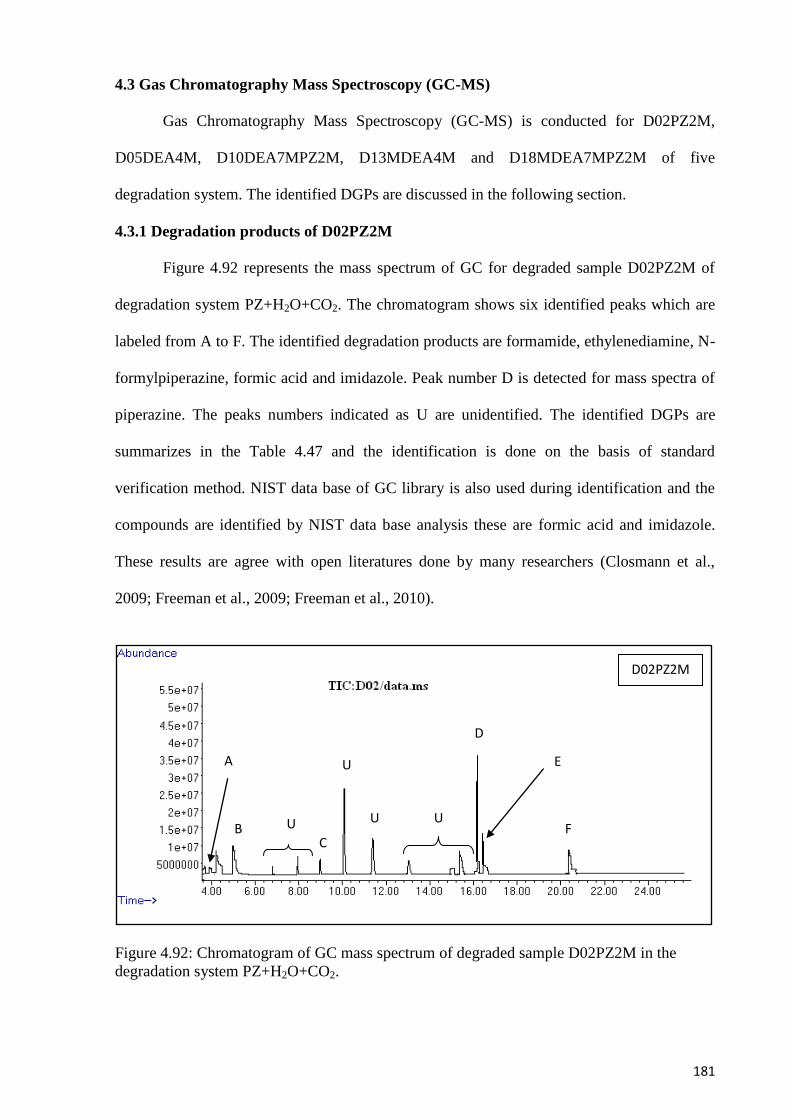
181
4.3 Gas Chromatography Mass Spectroscopy (GC-MS)
Gas Chromatography Mass Spectroscopy (GC-MS) is conducted for D02PZ2M,
D05DEA4M, D10DEA7MPZ2M, D13MDEA4M and D18MDEA7MPZ2M of five
degradation system. The identified DGPs are discussed in the following section.
4.3.1 Degradation products of D02PZ2M
Figure 4.92 represents the mass spectrum of GC for degraded sample D02PZ2M of
degradation system PZ+H2O+CO2. The chromatogram shows six identified peaks which are
labeled from A to F. The identified degradation products are formamide, ethylenediamine, N-
formylpiperazine, formic acid and imidazole. Peak number D is detected for mass spectra of
piperazine. The peaks numbers indicated as U are unidentified. The identified DGPs are
summarizes in the Table 4.47 and the identification is done on the basis of standard
verification method. NIST data base of GC library is also used during identification and the
compounds are identified by NIST data base analysis these are formic acid and imidazole.
These results are agree with open literatures done by many researchers (Closmann et al.,
2009; Freeman et al., 2009; Freeman et al., 2010).
Figure 4.92: Chromatogram of GC mass spectrum of degraded sample D02PZ2M in the
degradation system PZ+H2O+CO2.
A U
F C
B U U U
D
D02PZ2M
E
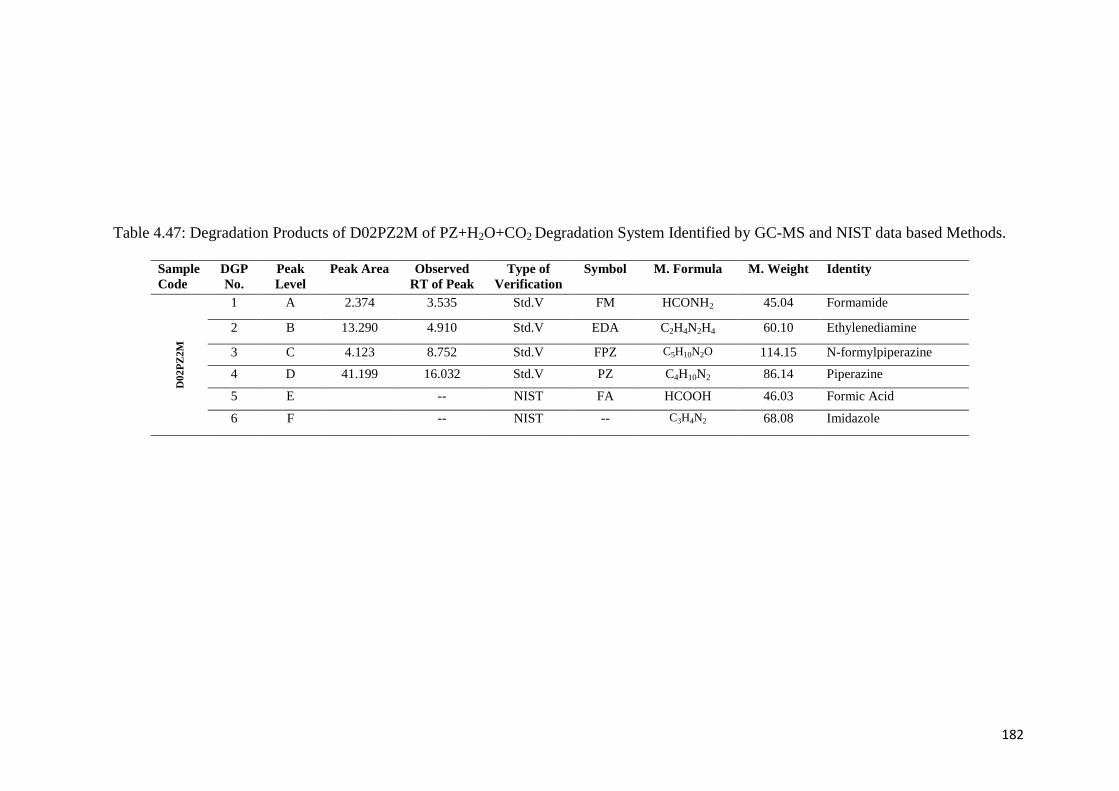
182
Table 4.47: Degradation Products of D02PZ2M of PZ+H2O+CO2 Degradation System Identified by GC-MS and NIST data based Methods.
Sample
Code
DGP
No.
Peak
Level
Peak Area Observed
RT of Peak
Type of
Verification
Symbol M. Formula M. Weight Identity
D
02
PZ
2M
1 A 2.374 3.535 Std.V FM HCONH2 45.04 Formamide
2 B 13.290 4.910 Std.V EDA C2H4N2H4 60.10 Ethylenediamine
3 C 4.123 8.752 Std.V FPZ C5H10N2O 114.15 N-formylpiperazine
4 D 41.199 16.032 Std.V PZ C4H10N2 86.14 Piperazine
5 E -- NIST FA HCOOH 46.03 Formic Acid
6 F -- NIST -- C3H4N2 68.08 Imidazole
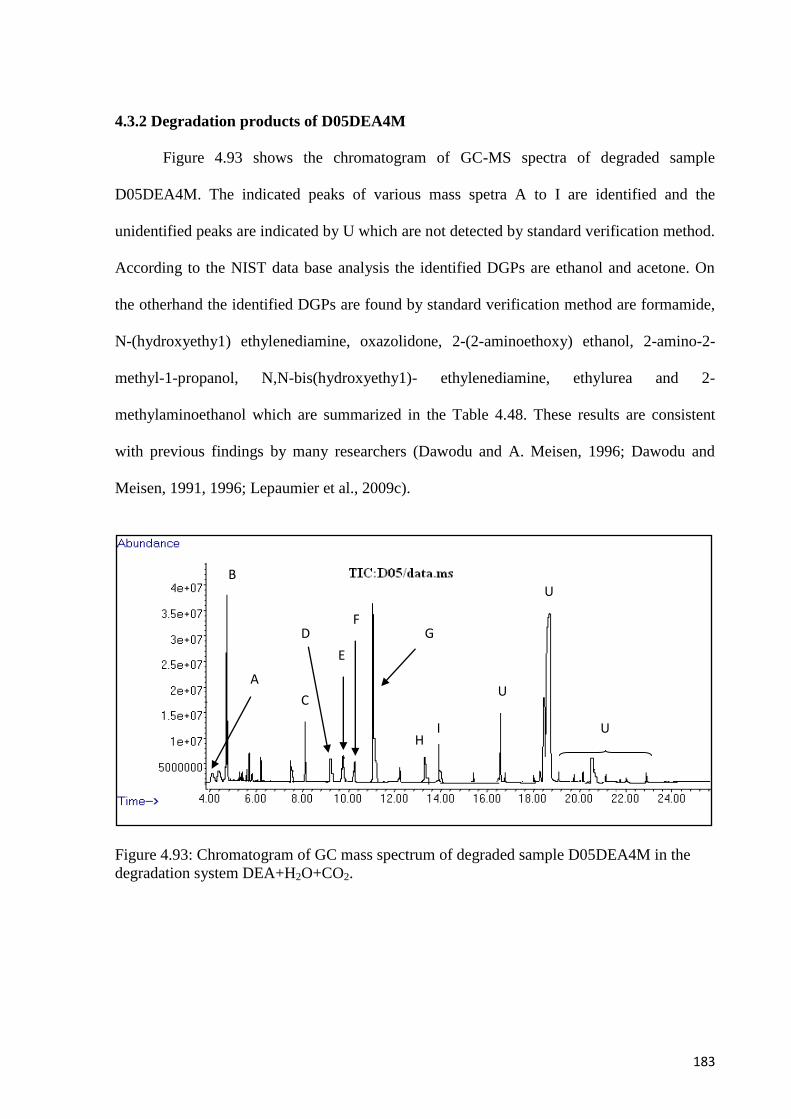
183
4.3.2 Degradation products of D05DEA4M
Figure 4.93 shows the chromatogram of GC-MS spectra of degraded sample
D05DEA4M. The indicated peaks of various mass spetra A to I are identified and the
unidentified peaks are indicated by U which are not detected by standard verification method.
According to the NIST data base analysis the identified DGPs are ethanol and acetone. On
the otherhand the identified DGPs are found by standard verification method are formamide,
N-(hydroxyethy1) ethylenediamine, oxazolidone, 2-(2-aminoethoxy) ethanol, 2-amino-2-
methyl-1-propanol, N,N-bis(hydroxyethy1)- ethylenediamine, ethylurea and 2-
methylaminoethanol which are summarized in the Table 4.48. These results are consistent
with previous findings by many researchers (Dawodu and A. Meisen, 1996; Dawodu and
Meisen, 1991, 1996; Lepaumier et al., 2009c).
Figure 4.93: Chromatogram of GC mass spectrum of degraded sample D05DEA4M in the
degradation system DEA+H2O+CO2.
A
G F
D
E
C
B
I H
U
U
U
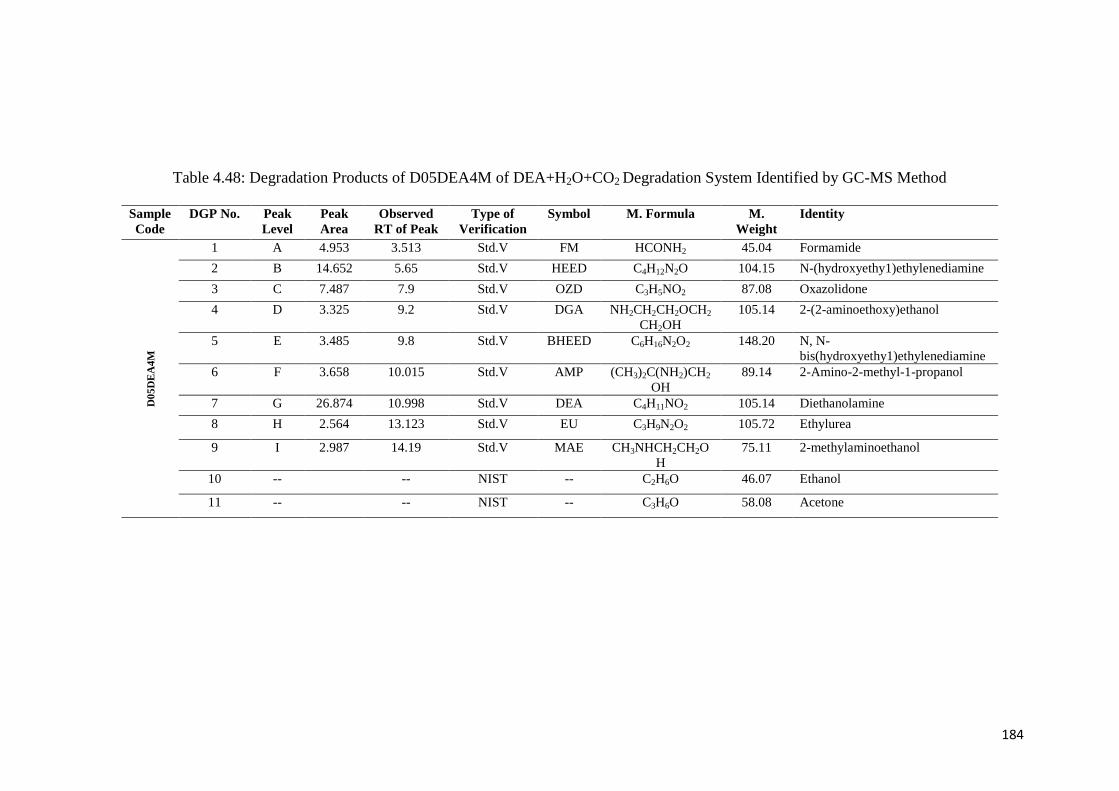
184
Table 4.48: Degradation Products of D05DEA4M of DEA+H2O+CO2 Degradation System Identified by GC-MS Method
Sample
Code
DGP No. Peak
Level
Peak
Area
Observed
RT of Peak
Type of
Verification
Symbol M. Formula M.
Weight
Identity
D
05
DE
A4
M
1 A 4.953 3.513 Std.V FM HCONH2 45.04 Formamide
2 B 14.652 5.65 Std.V HEED C4H12N2O 104.15 N-(hydroxyethy1)ethylenediamine
3 C 7.487 7.9 Std.V OZD C3H5NO2 87.08 Oxazolidone
4 D 3.325 9.2 Std.V DGA NH2CH2CH2OCH2
CH2OH
105.14 2-(2-aminoethoxy)ethanol
5 E 3.485 9.8 Std.V BHEED C6H16N2O2 148.20 N, N-
bis(hydroxyethy1)ethylenediamine
6 F 3.658 10.015 Std.V AMP (CH3)2C(NH2)CH2
OH
89.14 2-Amino-2-methyl-1-propanol
7 G 26.874 10.998 Std.V DEA C4H11NO2 105.14 Diethanolamine
8 H 2.564 13.123 Std.V EU C3H9N2O2 105.72 Ethylurea
9 I 2.987 14.19 Std.V MAE CH3NHCH2CH2O
H
75.11 2-methylaminoethanol
10 -- -- NIST -- C2H6O 46.07 Ethanol
11 -- -- NIST -- C3H6O 58.08 Acetone
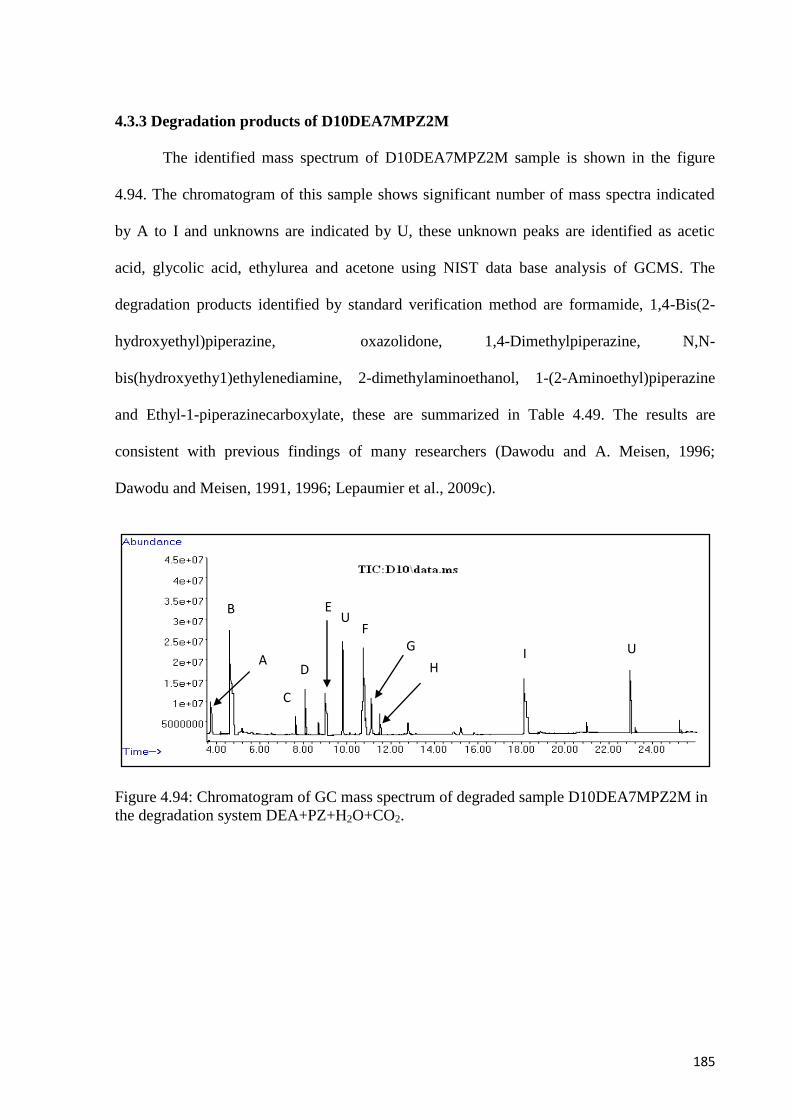
185
4.3.3 Degradation products of D10DEA7MPZ2M
The identified mass spectrum of D10DEA7MPZ2M sample is shown in the figure
4.94. The chromatogram of this sample shows significant number of mass spectra indicated
by A to I and unknowns are indicated by U, these unknown peaks are identified as acetic
acid, glycolic acid, ethylurea and acetone using NIST data base analysis of GCMS. The
degradation products identified by standard verification method are formamide, 1,4-Bis(2-
hydroxyethyl)piperazine, oxazolidone, 1,4-Dimethylpiperazine, N,N-
bis(hydroxyethy1)ethylenediamine, 2-dimethylaminoethanol, 1-(2-Aminoethyl)piperazine
and Ethyl-1-piperazinecarboxylate, these are summarized in Table 4.49. The results are
consistent with previous findings of many researchers (Dawodu and A. Meisen, 1996;
Dawodu and Meisen, 1991, 1996; Lepaumier et al., 2009c).
Figure 4.94: Chromatogram of GC mass spectrum of degraded sample D10DEA7MPZ2M in
the degradation system DEA+PZ+H2O+CO2.
A
B
C
D
E
F G
H I U
U
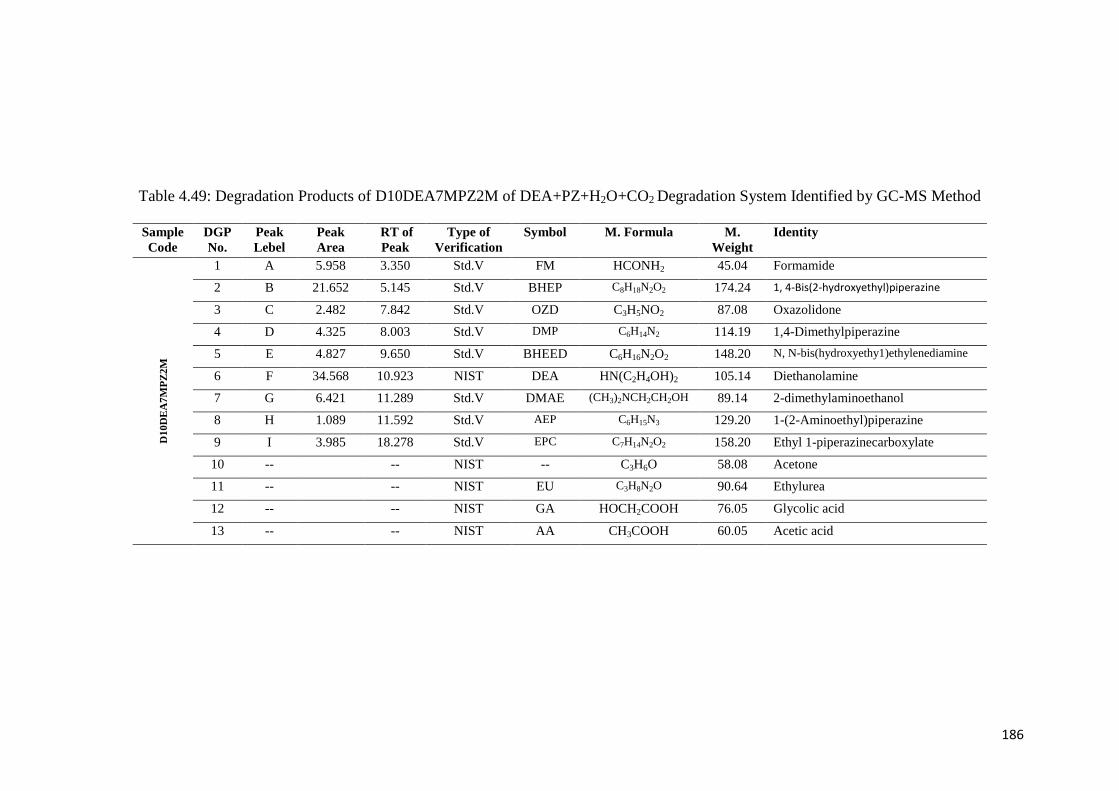
186
Table 4.49: Degradation Products of D10DEA7MPZ2M of DEA+PZ+H2O+CO2 Degradation System Identified by GC-MS Method
Sample
Code
DGP
No.
Peak
Lebel
Peak
Area
RT of
Peak
Type of
Verification
Symbol M. Formula M.
Weight
Identity
D
10
DE
A7
MP
Z2
M
1 A 5.958 3.350 Std.V FM HCONH2 45.04 Formamide
2 B 21.652 5.145 Std.V BHEP C8H18N2O2 174.24 1, 4-Bis(2-hydroxyethyl)piperazine
3 C 2.482 7.842 Std.V OZD C3H5NO2 87.08 Oxazolidone
4 D 4.325 8.003 Std.V DMP C6H14N2 114.19 1,4-Dimethylpiperazine
5 E 4.827 9.650 Std.V BHEED C6H16N2O2 148.20 N, N-bis(hydroxyethy1)ethylenediamine
6 F 34.568 10.923 NIST DEA HN(C2H4OH)2 105.14 Diethanolamine
7 G 6.421 11.289 Std.V DMAE (CH3)2NCH2CH2OH 89.14 2-dimethylaminoethanol
8 H 1.089 11.592 Std.V AEP C6H15N3 129.20 1-(2-Aminoethyl)piperazine
9 I 3.985 18.278 Std.V EPC C7H14N2O2 158.20 Ethyl 1-piperazinecarboxylate
10 -- -- NIST -- C3H6O 58.08 Acetone
11 -- -- NIST EU C3H8N2O 90.64 Ethylurea
12 -- -- NIST GA HOCH2COOH 76.05 Glycolic acid
13 -- -- NIST AA CH3COOH 60.05 Acetic acid
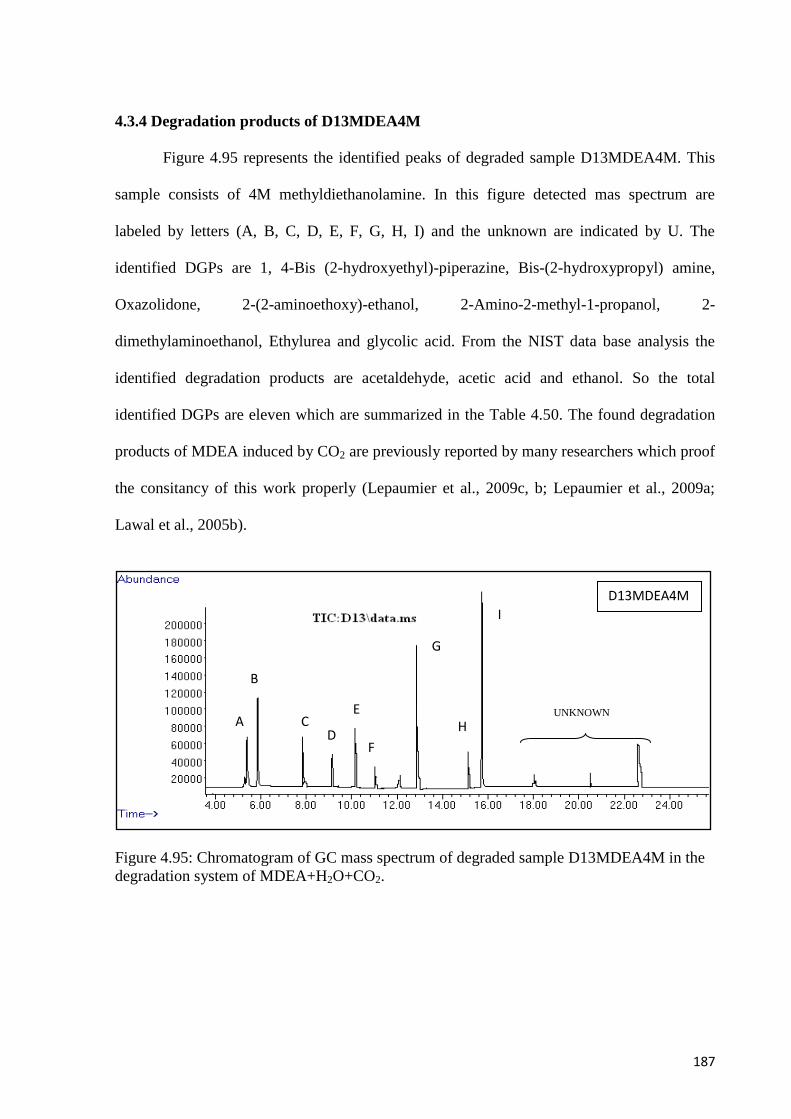
187
4.3.4 Degradation products of D13MDEA4M
Figure 4.95 represents the identified peaks of degraded sample D13MDEA4M. This
sample consists of 4M methyldiethanolamine. In this figure detected mas spectrum are
labeled by letters (A, B, C, D, E, F, G, H, I) and the unknown are indicated by U. The
identified DGPs are 1, 4-Bis (2-hydroxyethyl)-piperazine, Bis-(2-hydroxypropyl) amine,
Oxazolidone, 2-(2-aminoethoxy)-ethanol, 2-Amino-2-methyl-1-propanol, 2-
dimethylaminoethanol, Ethylurea and glycolic acid. From the NIST data base analysis the
identified degradation products are acetaldehyde, acetic acid and ethanol. So the total
identified DGPs are eleven which are summarized in the Table 4.50. The found degradation
products of MDEA induced by CO2 are previously reported by many researchers which proof
the consitancy of this work properly (Lepaumier et al., 2009c, b; Lepaumier et al., 2009a;
Lawal et al., 2005b).
Figure 4.95: Chromatogram of GC mass spectrum of degraded sample D13MDEA4M in the
degradation system of MDEA+H2O+CO2.
D13MDEA4M
A
B
E
D F
C
I
G
H UNKNOWN
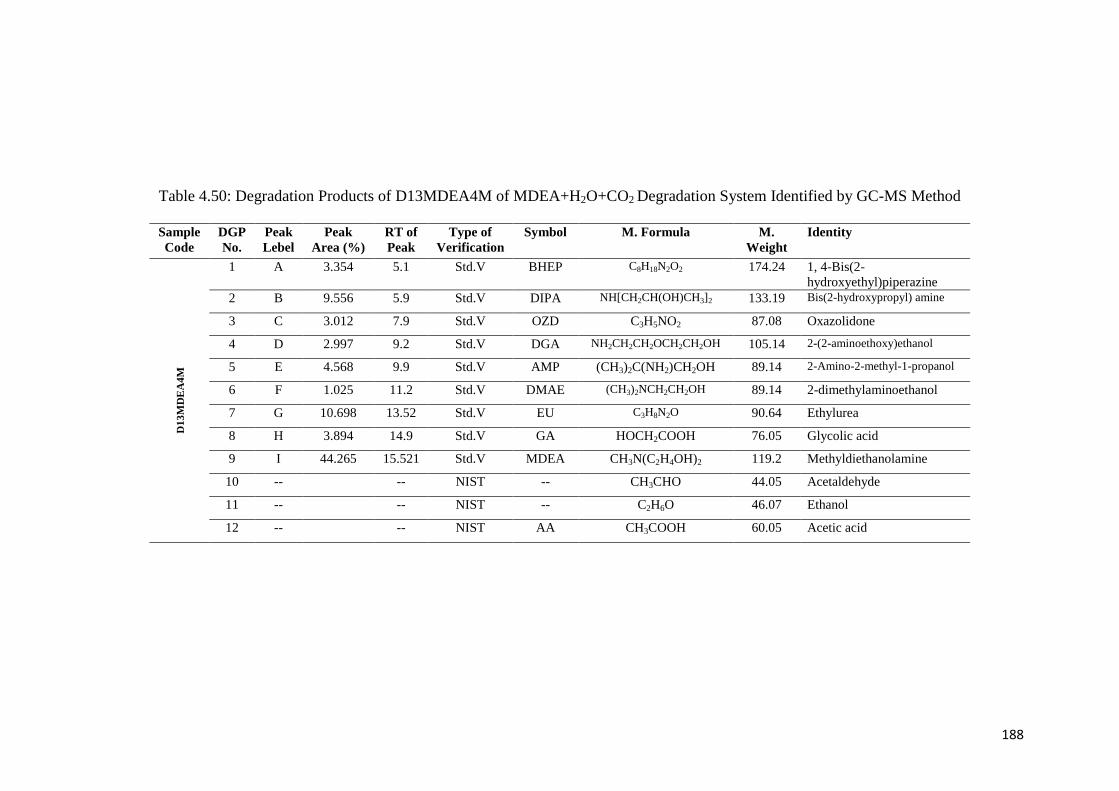
188
Table 4.50: Degradation Products of D13MDEA4M of MDEA+H2O+CO2 Degradation System Identified by GC-MS Method
Sample
Code
DGP
No.
Peak
Lebel
Peak
Area (%)
RT of
Peak
Type of
Verification
Symbol M. Formula M.
Weight
Identity
D
13
MD
EA
4M
1 A 3.354 5.1 Std.V BHEP C8H18N2O2 174.24 1, 4-Bis(2-
hydroxyethyl)piperazine
2 B 9.556 5.9 Std.V DIPA NH[CH2CH(OH)CH3]2 133.19 Bis(2-hydroxypropyl) amine
3 C 3.012 7.9 Std.V OZD C3H5NO2 87.08 Oxazolidone
4 D 2.997 9.2 Std.V DGA NH2CH2CH2OCH2CH2OH 105.14 2-(2-aminoethoxy)ethanol
5 E 4.568 9.9 Std.V AMP (CH3)2C(NH2)CH2OH 89.14 2-Amino-2-methyl-1-propanol
6 F 1.025 11.2 Std.V DMAE (CH3)2NCH2CH2OH 89.14 2-dimethylaminoethanol
7 G 10.698 13.52 Std.V EU C3H8N2O 90.64 Ethylurea
8 H 3.894 14.9 Std.V GA HOCH2COOH 76.05 Glycolic acid
9 I 44.265 15.521 Std.V MDEA CH3N(C2H4OH)2 119.2 Methyldiethanolamine
10 -- -- NIST -- CH3CHO 44.05 Acetaldehyde
11 -- -- NIST -- C2H6O 46.07 Ethanol
12 -- -- NIST AA CH3COOH 60.05 Acetic acid
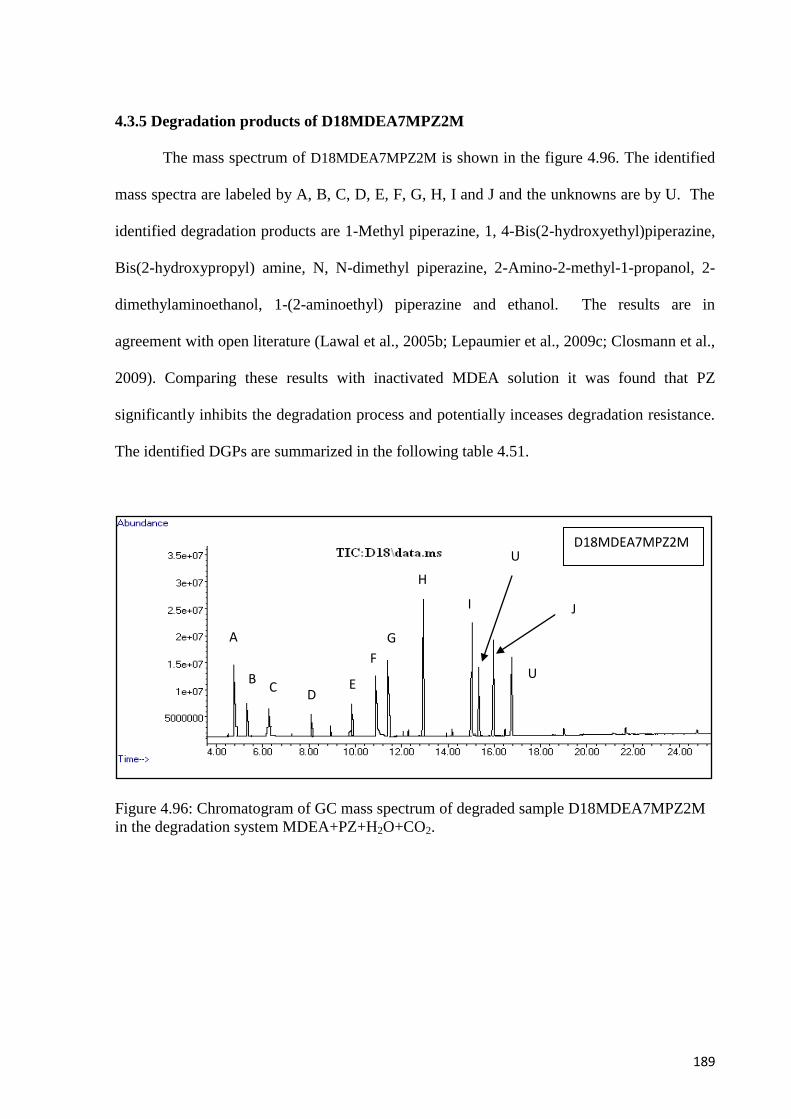
189
4.3.5 Degradation products of D18MDEA7MPZ2M
The mass spectrum of D18MDEA7MPZ2M is shown in the figure 4.96. The identified
mass spectra are labeled by A, B, C, D, E, F, G, H, I and J and the unknowns are by U. The
identified degradation products are 1-Methyl piperazine, 1, 4-Bis(2-hydroxyethyl)piperazine,
Bis(2-hydroxypropyl) amine, N, N-dimethyl piperazine, 2-Amino-2-methyl-1-propanol, 2-
dimethylaminoethanol, 1-(2-aminoethyl) piperazine and ethanol. The results are in
agreement with open literature (Lawal et al., 2005b; Lepaumier et al., 2009c; Closmann et al.,
2009). Comparing these results with inactivated MDEA solution it was found that PZ
significantly inhibits the degradation process and potentially inceases degradation resistance.
The identified DGPs are summarized in the following table 4.51.
Figure 4.96: Chromatogram of GC mass spectrum of degraded sample D18MDEA7MPZ2M
in the degradation system MDEA+PZ+H2O+CO2.
D18MDEA7MPZ2M
A
B C
D E
F
G
H
I J
U
U
F
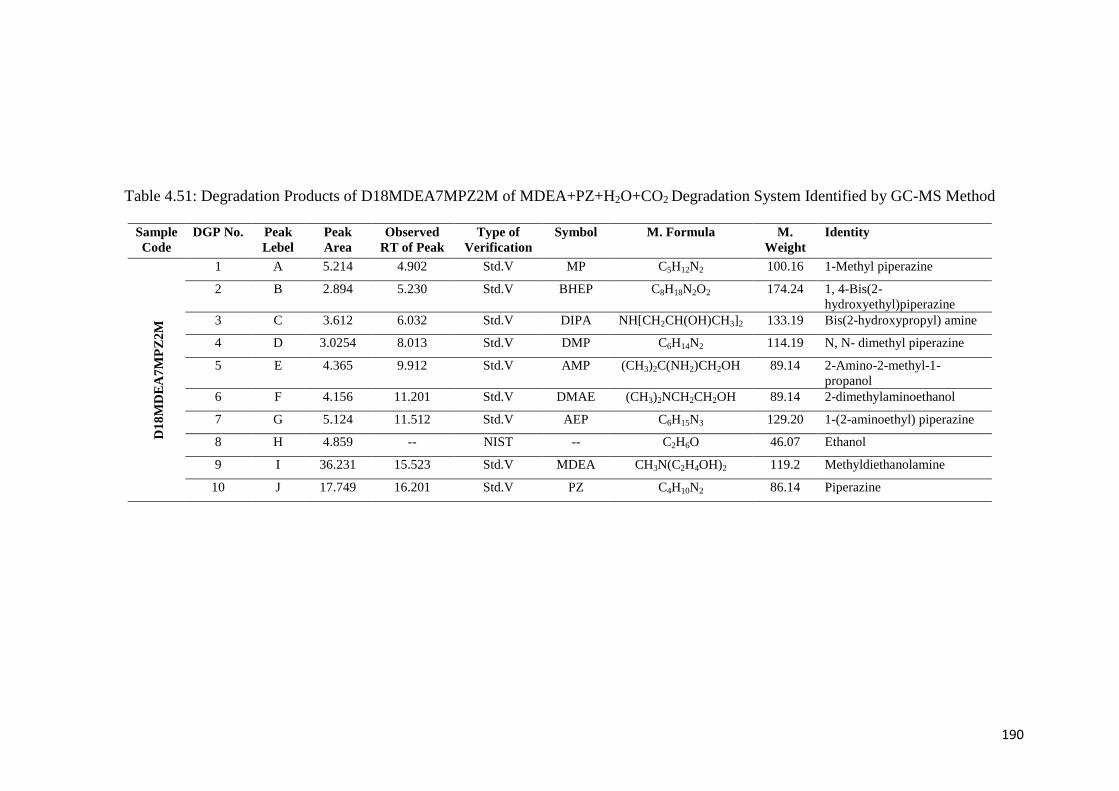
190
Table 4.51: Degradation Products of D18MDEA7MPZ2M of MDEA+PZ+H2O+CO2 Degradation System Identified by GC-MS Method
Sample
Code
DGP No. Peak
Lebel
Peak
Area
Observed
RT of Peak
Type of
Verification
Symbol M. Formula M.
Weight
Identity
D1
8M
DE
A7
MP
Z2
M
1 A 5.214 4.902 Std.V MP C5H12N2 100.16 1-Methyl piperazine
2 B 2.894 5.230 Std.V BHEP C8H18N2O2 174.24 1, 4-Bis(2-
hydroxyethyl)piperazine
3 C 3.612 6.032 Std.V DIPA NH[CH2CH(OH)CH3]2 133.19 Bis(2-hydroxypropyl) amine
4 D 3.0254 8.013 Std.V DMP C6H14N2 114.19 N, N- dimethyl piperazine
5 E 4.365 9.912 Std.V AMP (CH3)2C(NH2)CH2OH 89.14 2-Amino-2-methyl-1-
propanol
6 F 4.156 11.201 Std.V DMAE (CH3)2NCH2CH2OH 89.14 2-dimethylaminoethanol
7 G 5.124 11.512 Std.V AEP C6H15N3 129.20 1-(2-aminoethyl) piperazine
8 H 4.859 -- NIST -- C2H6O 46.07 Ethanol
9 I 36.231 15.523 Std.V MDEA CH3N(C2H4OH)2 119.2 Methyldiethanolamine
10 J 17.749 16.201 Std.V PZ C4H10N2 86.14 Piperazine

191
4.3.6 Variation of Peak Areas of DGPs of D02PZ2M, D05DEA4M, D10DEA7MPZ2M,
D13MDEA4M and D18MDEA7MPZ2M Identified by GC-MS
Figure 4.97 shows the variation of peak areas for three degradation products of
D02PZ2M. The identified degradation products are formamide (FM), ethylenediamine
(EDA) and N-formylpiperazine (FPZ). Ethylenediamine occupy highest peak area among all
identified DGPs D02PZ2M. Formamide is found very low peak area and N-formyl piperazine
is relatively found with greater peak area than FM but lower than EDA. The figure also
shows the peak areaof PZ it is almost near about 45% but this is not degradation product.
This is a base amine component of D02PZ2M sample.
Figure 4.97: Variation of peak areas of DGPs of D02PZ2M identified by GC-MS.
Concentration of D02PZ2M (2M)
1.0 1.5 2.0 2.5 3.0
Peak A
reas o
f D
GP
s (
%)
0
10
20
30
40
50
FM
EDA
FPZ
PZ
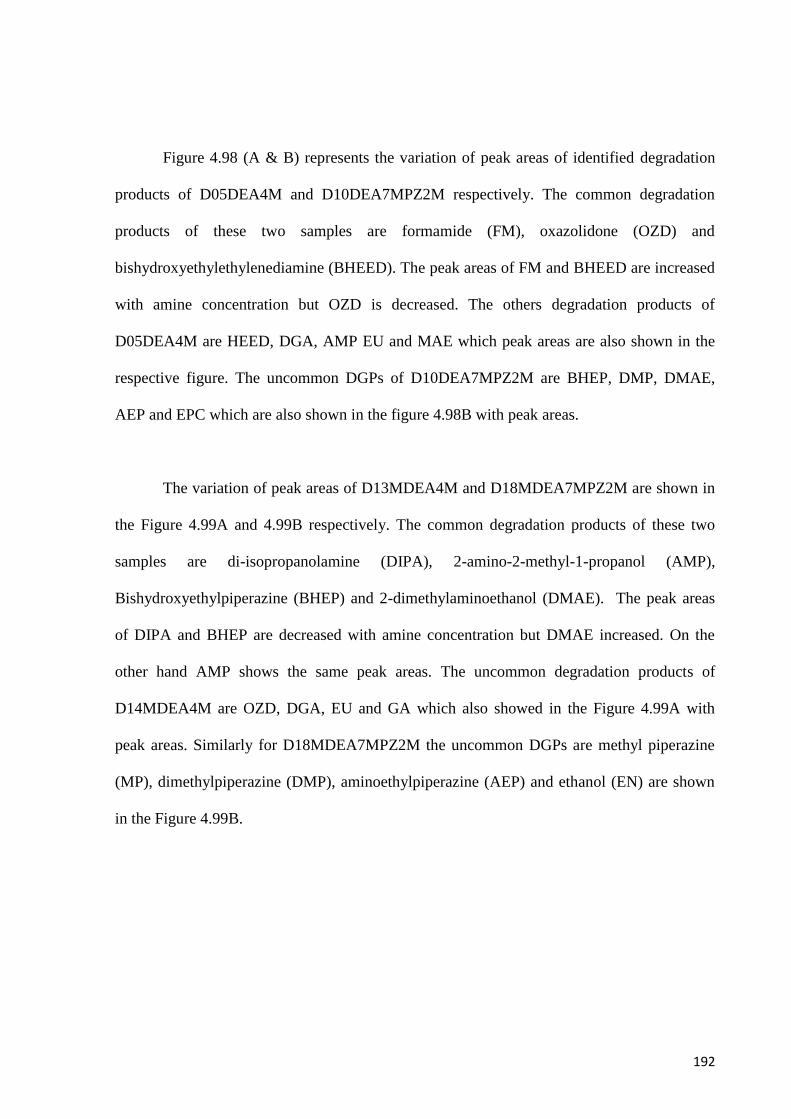
192
Figure 4.98 (A & B) represents the variation of peak areas of identified degradation
products of D05DEA4M and D10DEA7MPZ2M respectively. The common degradation
products of these two samples are formamide (FM), oxazolidone (OZD) and
bishydroxyethylethylenediamine (BHEED). The peak areas of FM and BHEED are increased
with amine concentration but OZD is decreased. The others degradation products of
D05DEA4M are HEED, DGA, AMP EU and MAE which peak areas are also shown in the
respective figure. The uncommon DGPs of D10DEA7MPZ2M are BHEP, DMP, DMAE,
AEP and EPC which are also shown in the figure 4.98B with peak areas.
The variation of peak areas of D13MDEA4M and D18MDEA7MPZ2M are shown in
the Figure 4.99A and 4.99B respectively. The common degradation products of these two
samples are di-isopropanolamine (DIPA), 2-amino-2-methyl-1-propanol (AMP),
Bishydroxyethylpiperazine (BHEP) and 2-dimethylaminoethanol (DMAE). The peak areas
of DIPA and BHEP are decreased with amine concentration but DMAE increased. On the
other hand AMP shows the same peak areas. The uncommon degradation products of
D14MDEA4M are OZD, DGA, EU and GA which also showed in the Figure 4.99A with
peak areas. Similarly for D18MDEA7MPZ2M the uncommon DGPs are methyl piperazine
(MP), dimethylpiperazine (DMP), aminoethylpiperazine (AEP) and ethanol (EN) are shown
in the Figure 4.99B.
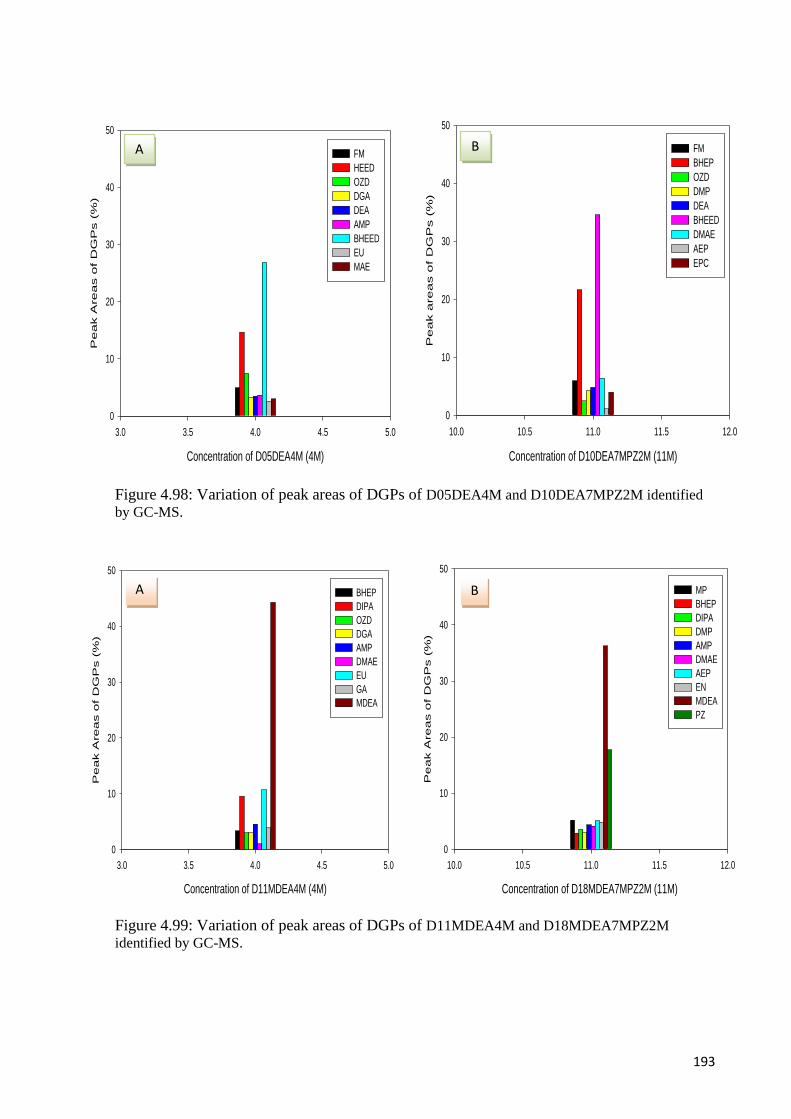
193
Figure 4.98: Variation of peak areas of DGPs of D05DEA4M and D10DEA7MPZ2M identified
by GC-MS.
Figure 4.99: Variation of peak areas of DGPs of D11MDEA4M and D18MDEA7MPZ2M
identified by GC-MS.
Concentration of D05DEA4M (4M)
3.0 3.5 4.0 4.5 5.0
Pe
ak A
re
as o
f D
GP
s (
%)
0
10
20
30
40
50
FM
HEED
OZD
DGA
DEA
AMP
BHEED
EU
MAE
Concentration of D10DEA7MPZ2M (11M)
10.0 10.5 11.0 11.5 12.0P
eak a
reas o
f D
GP
s (
%)
0
10
20
30
40
50
FM
BHEP
OZD
DMP
DEA
BHEED
DMAE
AEP
EPC
Concentration of D11MDEA4M (4M)
3.0 3.5 4.0 4.5 5.0
Peak A
reas o
f D
GP
s (
%)
0
10
20
30
40
50
BHEP
DIPA
OZD
DGA
AMP
DMAE
EU
GA
MDEA
Concentration of D18MDEA7MPZ2M (11M)
10.0 10.5 11.0 11.5 12.0
Pe
ak A
re
as o
f D
GP
s (
%)
0
10
20
30
40
50
MP
BHEP
DIPA
DMP
AMP
DMAE
AEP
EN
MDEA
PZ
A B
A B
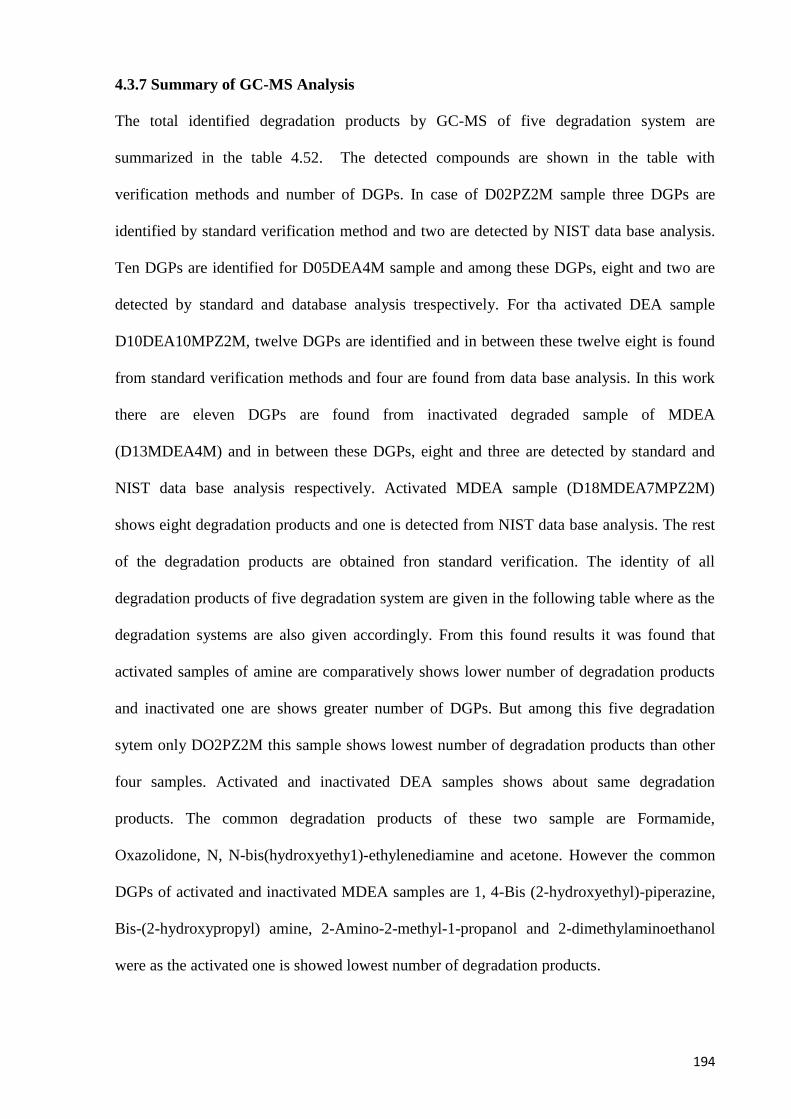
194
4.3.7 Summary of GC-MS Analysis
The total identified degradation products by GC-MS of five degradation system are
summarized in the table 4.52. The detected compounds are shown in the table with
verification methods and number of DGPs. In case of D02PZ2M sample three DGPs are
identified by standard verification method and two are detected by NIST data base analysis.
Ten DGPs are identified for D05DEA4M sample and among these DGPs, eight and two are
detected by standard and database analysis trespectively. For tha activated DEA sample
D10DEA10MPZ2M, twelve DGPs are identified and in between these twelve eight is found
from standard verification methods and four are found from data base analysis. In this work
there are eleven DGPs are found from inactivated degraded sample of MDEA
(D13MDEA4M) and in between these DGPs, eight and three are detected by standard and
NIST data base analysis respectively. Activated MDEA sample (D18MDEA7MPZ2M)
shows eight degradation products and one is detected from NIST data base analysis. The rest
of the degradation products are obtained fron standard verification. The identity of all
degradation products of five degradation system are given in the following table where as the
degradation systems are also given accordingly. From this found results it was found that
activated samples of amine are comparatively shows lower number of degradation products
and inactivated one are shows greater number of DGPs. But among this five degradation
sytem only DO2PZ2M this sample shows lowest number of degradation products than other
four samples. Activated and inactivated DEA samples shows about same degradation
products. The common degradation products of these two sample are Formamide,
Oxazolidone, N, N-bis(hydroxyethy1)-ethylenediamine and acetone. However the common
DGPs of activated and inactivated MDEA samples are 1, 4-Bis (2-hydroxyethyl)-piperazine,
Bis-(2-hydroxypropyl) amine, 2-Amino-2-methyl-1-propanol and 2-dimethylaminoethanol
were as the activated one is showed lowest number of degradation products.
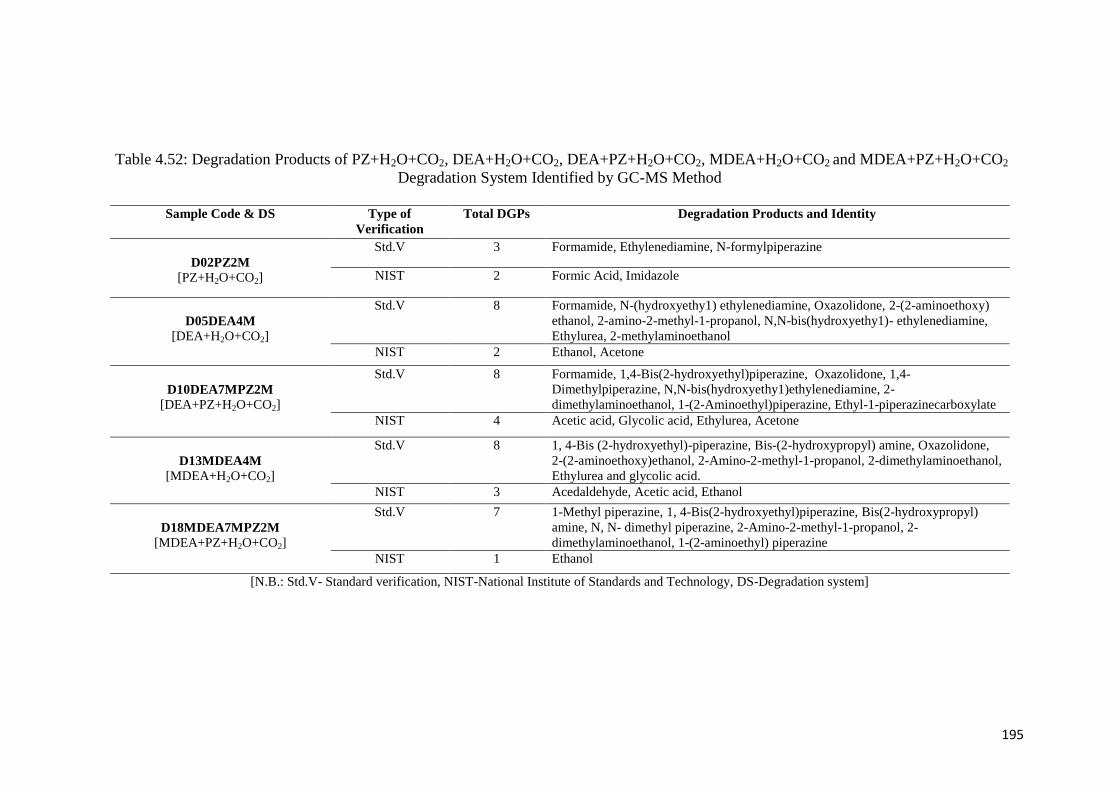
195
Table 4.52: Degradation Products of PZ+H2O+CO2, DEA+H2O+CO2, DEA+PZ+H2O+CO2, MDEA+H2O+CO2 and MDEA+PZ+H2O+CO2
Degradation System Identified by GC-MS Method
Sample Code & DS Type of
Verification
Total DGPs Degradation Products and Identity
D02PZ2M [PZ+H2O+CO2]
Std.V 3 Formamide, Ethylenediamine, N-formylpiperazine
NIST 2 Formic Acid, Imidazole
D05DEA4M
[DEA+H2O+CO2]
Std.V 8 Formamide, N-(hydroxyethy1) ethylenediamine, Oxazolidone, 2-(2-aminoethoxy)
ethanol, 2-amino-2-methyl-1-propanol, N,N-bis(hydroxyethy1)- ethylenediamine,
Ethylurea, 2-methylaminoethanol
NIST 2 Ethanol, Acetone
D10DEA7MPZ2M
[DEA+PZ+H2O+CO2]
Std.V 8 Formamide, 1,4-Bis(2-hydroxyethyl)piperazine, Oxazolidone, 1,4-
Dimethylpiperazine, N,N-bis(hydroxyethy1)ethylenediamine, 2-
dimethylaminoethanol, 1-(2-Aminoethyl)piperazine, Ethyl-1-piperazinecarboxylate
NIST 4 Acetic acid, Glycolic acid, Ethylurea, Acetone
D13MDEA4M
[MDEA+H2O+CO2]
Std.V 8 1, 4-Bis (2-hydroxyethyl)-piperazine, Bis-(2-hydroxypropyl) amine, Oxazolidone,
2-(2-aminoethoxy)ethanol, 2-Amino-2-methyl-1-propanol, 2-dimethylaminoethanol,
Ethylurea and glycolic acid.
NIST 3 Acedaldehyde, Acetic acid, Ethanol
D18MDEA7MPZ2M
[MDEA+PZ+H2O+CO2]
Std.V 7 1-Methyl piperazine, 1, 4-Bis(2-hydroxyethyl)piperazine, Bis(2-hydroxypropyl)
amine, N, N- dimethyl piperazine, 2-Amino-2-methyl-1-propanol, 2-
dimethylaminoethanol, 1-(2-aminoethyl) piperazine
NIST 1 Ethanol
[N.B.: Std.V- Standard verification, NIST-National Institute of Standards and Technology, DS-Degradation system]
196
4.4 Measurement of Viscosity and Density
The physical properties density and viscosity were measured at 30 ˚C, 55 ˚C and 100 ˚C for
five degradation system in this experiment. Aqueous amine solutions are prepared at various
concentrations of amines and activator (PZ). Inorder to investigate the effect of temperature,
concentration and degradation products on the physical properties of alkanolamines are
mainly studied here.
4.4.1 Effect of Temperature, Concentration and Degradation Products on Viscosity
4.4.1.1 Effect of Amine Concentration on Viscosity
Figure 4.100 represents the variation of viscosities of activated and inactivated DEA
and MDEA alkanolamine with respect to the solution concentrations at constant temperatures
30 ˚C, 55 ˚C and 100 ˚C. Figure 4.100A shows the variation of viscosities for inactivated
DEA and MDEA. The inactivated samples of DEA are D03DEA2M, D04DEA3M and
D05DEA4M which code numbers are D03, D04 and D05 respectively. Similarly for the
inactivated samples of MDEA are D11MDEA2M, D12MDEA3M and D13MDEA4M are
shown in the same figure 4.100A with code numbers D11, D12 and D13 respectively. The
concentration of these two sets inactivated samples are 2M, 3M and 4M respectively. The
found results are indicates that the viscosities are increases with amine concentration which is
highest at 4M solution and lowest at 2M. This trend is followed for all inactivated samples of
DEA and MDEA. For the inactivated samples of DEA, the viscosities are found to follow this
order D03DEA2M< D04DEA3M <D05DEA4M. On the other hand in case of MDEA, the
followed order is D11MDEA2M <D12MDEA3M <D13MDEA4M.
Figure 4.100B shows the variation of viscosities for activated DEA and MDEA
samples. The activated DEA samples are D06DEA2MPZ1M, D07DEA2MPZ2M,
D08DEA3MPZ2M, D09DEA4MPZ2M and D10DEA7MPZ2M which ar shown in the figure
4.100B with code numbers D06, D07, D08, D09 and D10 respectively.
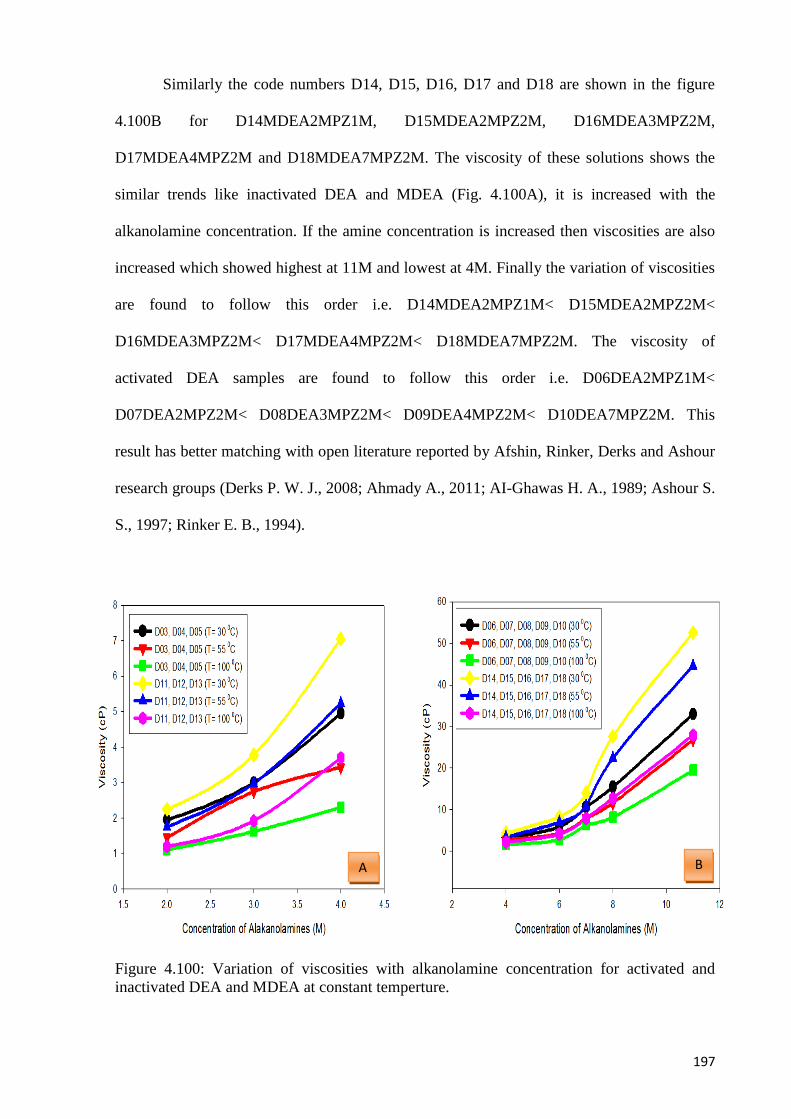
197
Similarly the code numbers D14, D15, D16, D17 and D18 are shown in the figure
4.100B for D14MDEA2MPZ1M, D15MDEA2MPZ2M, D16MDEA3MPZ2M,
D17MDEA4MPZ2M and D18MDEA7MPZ2M. The viscosity of these solutions shows the
similar trends like inactivated DEA and MDEA (Fig. 4.100A), it is increased with the
alkanolamine concentration. If the amine concentration is increased then viscosities are also
increased which showed highest at 11M and lowest at 4M. Finally the variation of viscosities
are found to follow this order i.e. D14MDEA2MPZ1M< D15MDEA2MPZ2M<
D16MDEA3MPZ2M< D17MDEA4MPZ2M< D18MDEA7MPZ2M. The viscosity of
activated DEA samples are found to follow this order i.e. D06DEA2MPZ1M<
D07DEA2MPZ2M< D08DEA3MPZ2M< D09DEA4MPZ2M< D10DEA7MPZ2M. This
result has better matching with open literature reported by Afshin, Rinker, Derks and Ashour
research groups (Derks P. W. J., 2008; Ahmady A., 2011; AI-Ghawas H. A., 1989; Ashour S.
S., 1997; Rinker E. B., 1994).
Figure 4.100: Variation of viscosities with alkanolamine concentration for activated and
inactivated DEA and MDEA at constant temperture.
A B
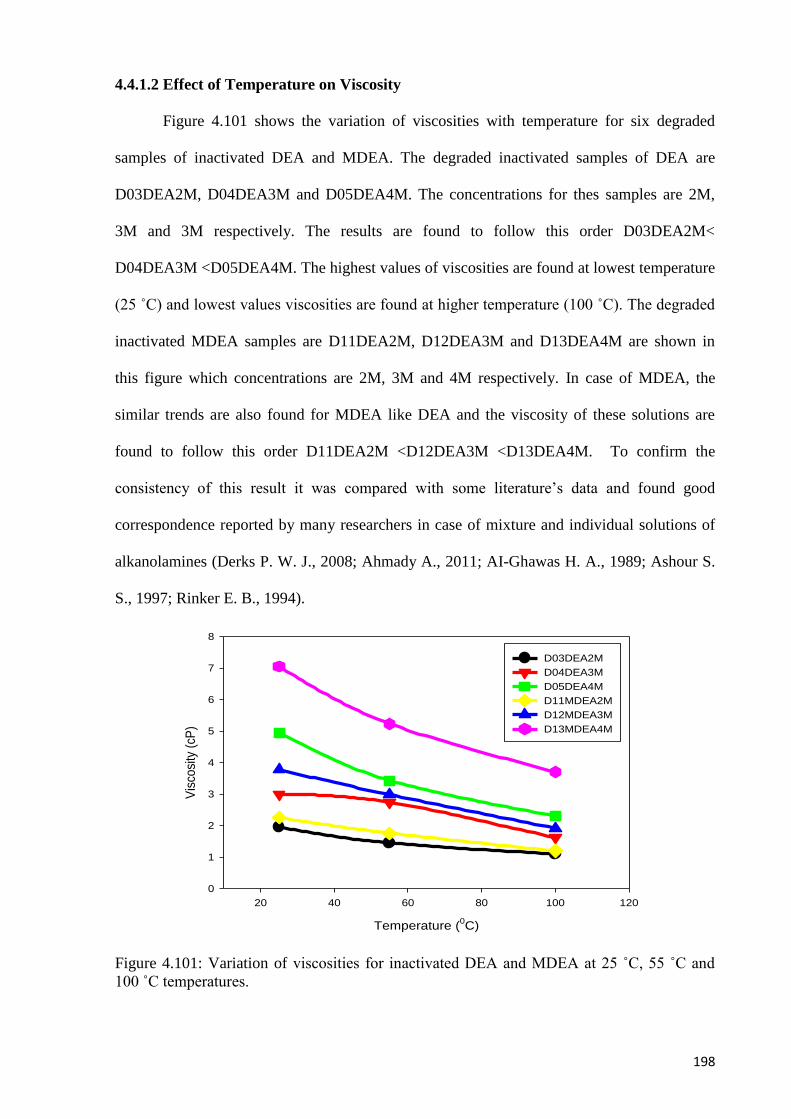
198
4.4.1.2 Effect of Temperature on Viscosity
Figure 4.101 shows the variation of viscosities with temperature for six degraded
samples of inactivated DEA and MDEA. The degraded inactivated samples of DEA are
D03DEA2M, D04DEA3M and D05DEA4M. The concentrations for thes samples are 2M,
3M and 3M respectively. The results are found to follow this order D03DEA2M<
D04DEA3M <D05DEA4M. The highest values of viscosities are found at lowest temperature
(25 ˚C) and lowest values viscosities are found at higher temperature (100 ˚C). The degraded
inactivated MDEA samples are D11DEA2M, D12DEA3M and D13DEA4M are shown in
this figure which concentrations are 2M, 3M and 4M respectively. In case of MDEA, the
similar trends are also found for MDEA like DEA and the viscosity of these solutions are
found to follow this order D11DEA2M <D12DEA3M <D13DEA4M. To confirm the
consistency of this result it was compared with some literature‟s data and found good
correspondence reported by many researchers in case of mixture and individual solutions of
alkanolamines (Derks P. W. J., 2008; Ahmady A., 2011; AI-Ghawas H. A., 1989; Ashour S.
S., 1997; Rinker E. B., 1994).
Figure 4.101: Variation of viscosities for inactivated DEA and MDEA at 25 ˚C, 55 ˚C and
100 ˚C temperatures.
Temperature (0C)
20 40 60 80 100 120
Vis
cosi
ty (
cP)
0
1
2
3
4
5
6
7
8
D03DEA2M
D04DEA3M
D05DEA4M
D11MDEA2M
D12MDEA3M
D13MDEA4M
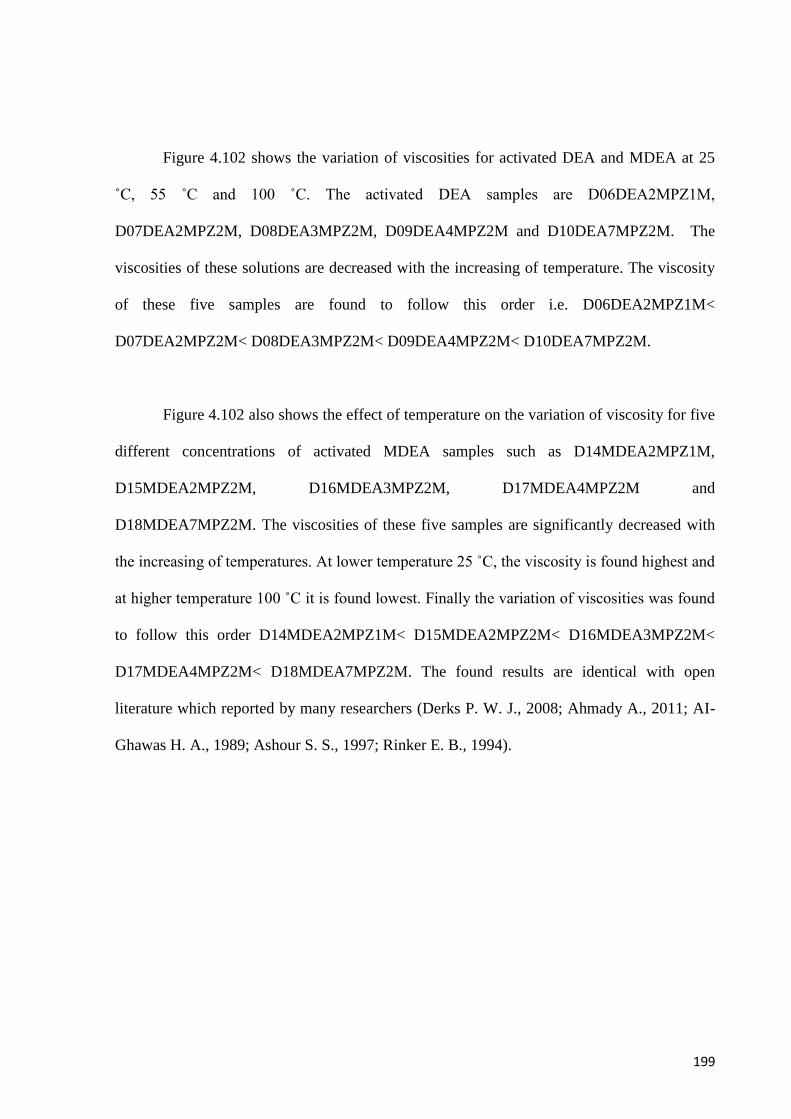
199
Figure 4.102 shows the variation of viscosities for activated DEA and MDEA at 25
˚C, 55 ˚C and 100 ˚C. The activated DEA samples are D06DEA2MPZ1M,
D07DEA2MPZ2M, D08DEA3MPZ2M, D09DEA4MPZ2M and D10DEA7MPZ2M. The
viscosities of these solutions are decreased with the increasing of temperature. The viscosity
of these five samples are found to follow this order i.e. D06DEA2MPZ1M<
D07DEA2MPZ2M< D08DEA3MPZ2M< D09DEA4MPZ2M< D10DEA7MPZ2M.
Figure 4.102 also shows the effect of temperature on the variation of viscosity for five
different concentrations of activated MDEA samples such as D14MDEA2MPZ1M,
D15MDEA2MPZ2M, D16MDEA3MPZ2M, D17MDEA4MPZ2M and
D18MDEA7MPZ2M. The viscosities of these five samples are significantly decreased with
the increasing of temperatures. At lower temperature 25 ˚C, the viscosity is found highest and
at higher temperature 100 ˚C it is found lowest. Finally the variation of viscosities was found
to follow this order D14MDEA2MPZ1M< D15MDEA2MPZ2M< D16MDEA3MPZ2M<
D17MDEA4MPZ2M< D18MDEA7MPZ2M. The found results are identical with open
literature which reported by many researchers (Derks P. W. J., 2008; Ahmady A., 2011; AI-
Ghawas H. A., 1989; Ashour S. S., 1997; Rinker E. B., 1994).
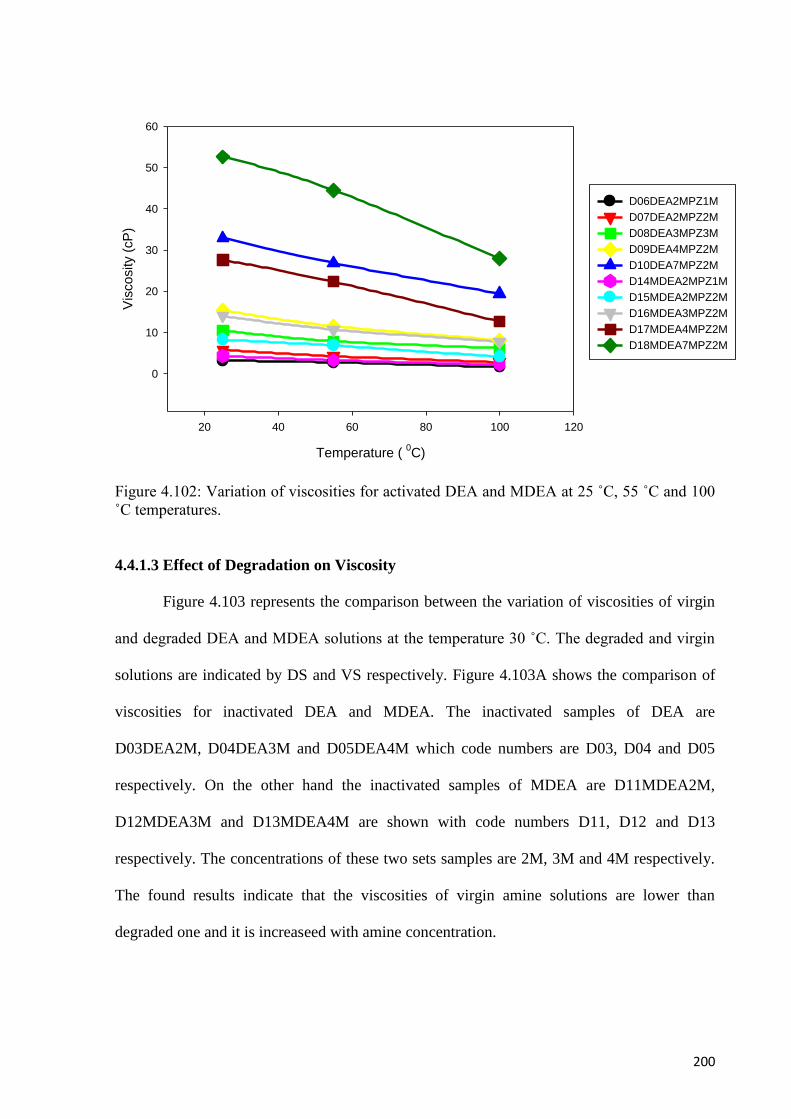
200
Figure 4.102: Variation of viscosities for activated DEA and MDEA at 25 ˚C, 55 ˚C and 100
˚C temperatures.
4.4.1.3 Effect of Degradation on Viscosity
Figure 4.103 represents the comparison between the variation of viscosities of virgin
and degraded DEA and MDEA solutions at the temperature 30 ˚C. The degraded and virgin
solutions are indicated by DS and VS respectively. Figure 4.103A shows the comparison of
viscosities for inactivated DEA and MDEA. The inactivated samples of DEA are
D03DEA2M, D04DEA3M and D05DEA4M which code numbers are D03, D04 and D05
respectively. On the other hand the inactivated samples of MDEA are D11MDEA2M,
D12MDEA3M and D13MDEA4M are shown with code numbers D11, D12 and D13
respectively. The concentrations of these two sets samples are 2M, 3M and 4M respectively.
The found results indicate that the viscosities of virgin amine solutions are lower than
degraded one and it is increaseed with amine concentration.
Temperature ( 0C)
20 40 60 80 100 120
Vis
co
sity (
cP
)
0
10
20
30
40
50
60
D06DEA2MPZ1M
D07DEA2MPZ2M
D08DEA3MPZ3M
D09DEA4MPZ2M
D10DEA7MPZ2M
D14MDEA2MPZ1M
D15MDEA2MPZ2M
D16MDEA3MPZ2M
D17MDEA4MPZ2M
D18MDEA7MPZ2M
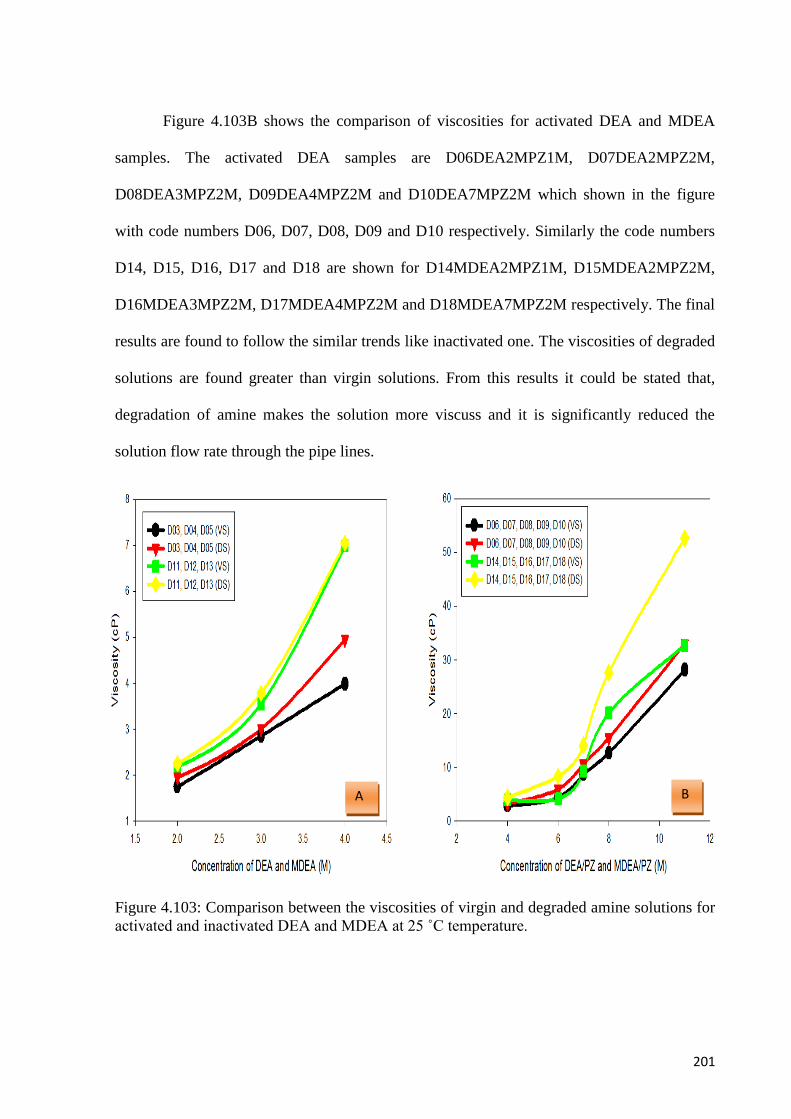
201
Figure 4.103B shows the comparison of viscosities for activated DEA and MDEA
samples. The activated DEA samples are D06DEA2MPZ1M, D07DEA2MPZ2M,
D08DEA3MPZ2M, D09DEA4MPZ2M and D10DEA7MPZ2M which shown in the figure
with code numbers D06, D07, D08, D09 and D10 respectively. Similarly the code numbers
D14, D15, D16, D17 and D18 are shown for D14MDEA2MPZ1M, D15MDEA2MPZ2M,
D16MDEA3MPZ2M, D17MDEA4MPZ2M and D18MDEA7MPZ2M respectively. The final
results are found to follow the similar trends like inactivated one. The viscosities of degraded
solutions are found greater than virgin solutions. From this results it could be stated that,
degradation of amine makes the solution more viscuss and it is significantly reduced the
solution flow rate through the pipe lines.
Figure 4.103: Comparison between the viscosities of virgin and degraded amine solutions for
activated and inactivated DEA and MDEA at 25 ˚C temperature.
A B

202
4.4.2 Effect of Temperature, Concentration and Degradation Products on Density
4.4.2.1 Effect of Concentration on Density
Figure 4.104 represents the variation of densisties with concentration for activated and
inactivated DEA and MDEA samples. The all samples are shown in the figure with specific
code numbers. The inactivated samples of DEA are D03DEA2M, D04DEA3M and
D05DEA4M shown by the code numbers D03-D05 in the figure 4.104A at 30 ˚C, 55 ˚C and
100 ˚C. In case of MDEA, the samples D11MDEA2M, D12MDEA3M and D13MDEA4M
are also shown in the same figure by the code numbers D11-D13 at the same temperatures.
The concentration of these two sets samples are 2M, 3M and 4M respectively. From this
result it was found that the densities are increased with amine concentration. The highest
values of densities are found at 4M concentration and lowest values are at 2M concentration.
In case of activated DEA and MDEA samples the results are found to follow the
similar trends which given in the figure 4.104B. The highest values of densities are found at
11.0 (M) concentration and lowest are at 4.0 (M). The activated samples of DEA are
D06DEA2MPZ1M, D07DEA2MPZ2M, D08DEA3MPZ2M, D09DEA4MPZ2M, and
D10DEA7MPZ2M which code numbers are D06 to D10 shown in the figure 4.104B at the
same temperatures. On the other hand D14, D15, D16, D17 and D18 code numbers are
shown for D14MDEA2MPZ1M, D15MDEA2MPZ2M, D16MDEA3MPZ2M,
D17MDEA4MPZ2M and D18MDEA7MPZ2M respectively.

203
Figure 4.104: Variation of densities with alkanolamine concentration for activated and
inactivated DEA and MDEA at 30 ˚C, 55 ˚C and 100 ˚C tempertures.
4.4.2.2 Effect of Temperature on Density
The variation of densities with temperature for inactivated DEA and MDEA are
shown in the Figure 4.105 at 25 ˚C, 55 ˚C and 100 ˚C temperatures. The inactivated samples
of DEA are D03DEA2M, D04DEA3M and D05DEA4M. On the other hand the inactivated
samples of MDEA are D11MDEA2M, D12MDEA3M and D13MDEA4M. In both cases the
densities are decreases with increasing of temperatures and the highest value of densities are
found at 25 ˚C temperature. At 100 ˚C temperature the densities are found lowest. The found
results are identical with open literature which reported by many researchers (Derks P. W. J.,
2008; Ahmady A., 2011; AI-Ghawas H. A., 1989; Ashour S. S., 1997; Rinker E. B., 1994).
A B
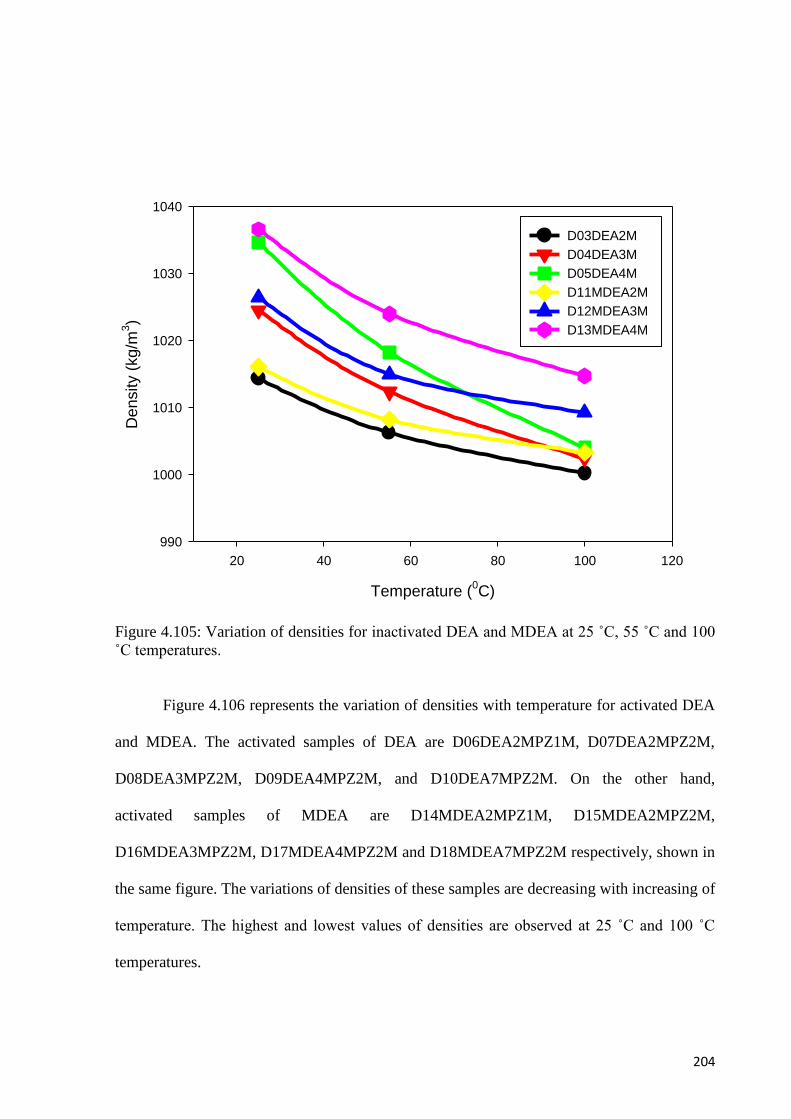
204
Figure 4.105: Variation of densities for inactivated DEA and MDEA at 25 ˚C, 55 ˚C and 100
˚C temperatures.
Figure 4.106 represents the variation of densities with temperature for activated DEA
and MDEA. The activated samples of DEA are D06DEA2MPZ1M, D07DEA2MPZ2M,
D08DEA3MPZ2M, D09DEA4MPZ2M, and D10DEA7MPZ2M. On the other hand,
activated samples of MDEA are D14MDEA2MPZ1M, D15MDEA2MPZ2M,
D16MDEA3MPZ2M, D17MDEA4MPZ2M and D18MDEA7MPZ2M respectively, shown in
the same figure. The variations of densities of these samples are decreasing with increasing of
temperature. The highest and lowest values of densities are observed at 25 ˚C and 100 ˚C
temperatures.
Temperature (0C)
20 40 60 80 100 120
Density (
kg/m
3)
990
1000
1010
1020
1030
1040
D03DEA2M
D04DEA3M
D05DEA4M
D11MDEA2M
D12MDEA3M
D13MDEA4M
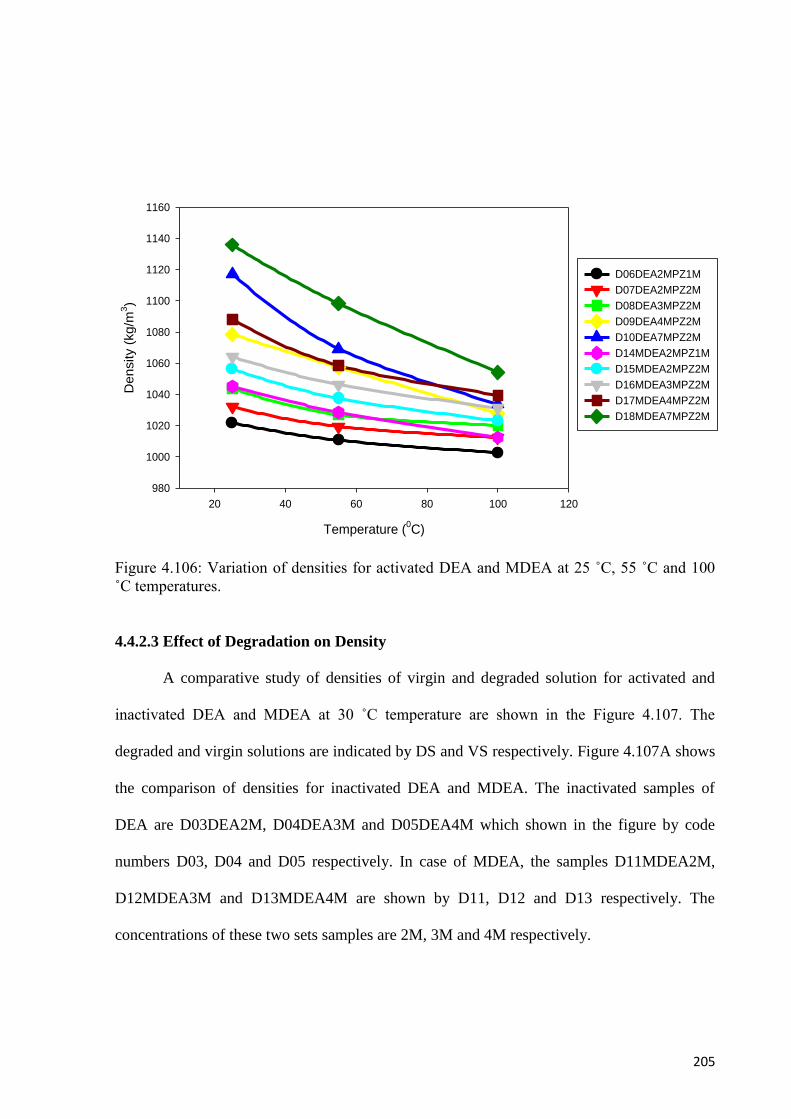
205
Figure 4.106: Variation of densities for activated DEA and MDEA at 25 ˚C, 55 ˚C and 100
˚C temperatures.
4.4.2.3 Effect of Degradation on Density
A comparative study of densities of virgin and degraded solution for activated and
inactivated DEA and MDEA at 30 ˚C temperature are shown in the Figure 4.107. The
degraded and virgin solutions are indicated by DS and VS respectively. Figure 4.107A shows
the comparison of densities for inactivated DEA and MDEA. The inactivated samples of
DEA are D03DEA2M, D04DEA3M and D05DEA4M which shown in the figure by code
numbers D03, D04 and D05 respectively. In case of MDEA, the samples D11MDEA2M,
D12MDEA3M and D13MDEA4M are shown by D11, D12 and D13 respectively. The
concentrations of these two sets samples are 2M, 3M and 4M respectively.
Temperature (0C)
20 40 60 80 100 120
Density (
kg/m
3)
980
1000
1020
1040
1060
1080
1100
1120
1140
1160
D06DEA2MPZ1M
D07DEA2MPZ2M
D08DEA3MPZ2M
D09DEA4MPZ2M
D10DEA7MPZ2M
D14MDEA2MPZ1M
D15MDEA2MPZ2M
D16MDEA3MPZ2M
D17MDEA4MPZ2M
D18MDEA7MPZ2M
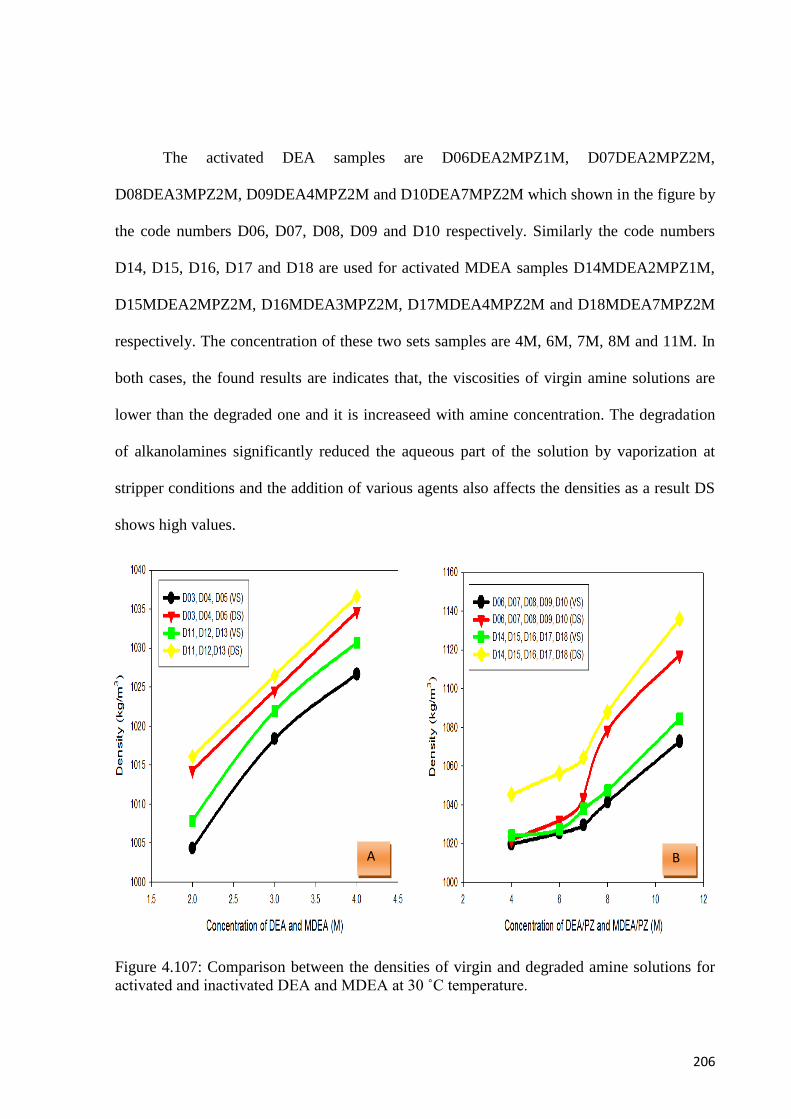
206
The activated DEA samples are D06DEA2MPZ1M, D07DEA2MPZ2M,
D08DEA3MPZ2M, D09DEA4MPZ2M and D10DEA7MPZ2M which shown in the figure by
the code numbers D06, D07, D08, D09 and D10 respectively. Similarly the code numbers
D14, D15, D16, D17 and D18 are used for activated MDEA samples D14MDEA2MPZ1M,
D15MDEA2MPZ2M, D16MDEA3MPZ2M, D17MDEA4MPZ2M and D18MDEA7MPZ2M
respectively. The concentration of these two sets samples are 4M, 6M, 7M, 8M and 11M. In
both cases, the found results are indicates that, the viscosities of virgin amine solutions are
lower than the degraded one and it is increaseed with amine concentration. The degradation
of alkanolamines significantly reduced the aqueous part of the solution by vaporization at
stripper conditions and the addition of various agents also affects the densities as a result DS
shows high values.
Figure 4.107: Comparison between the densities of virgin and degraded amine solutions for
activated and inactivated DEA and MDEA at 30 ˚C temperature.
A B
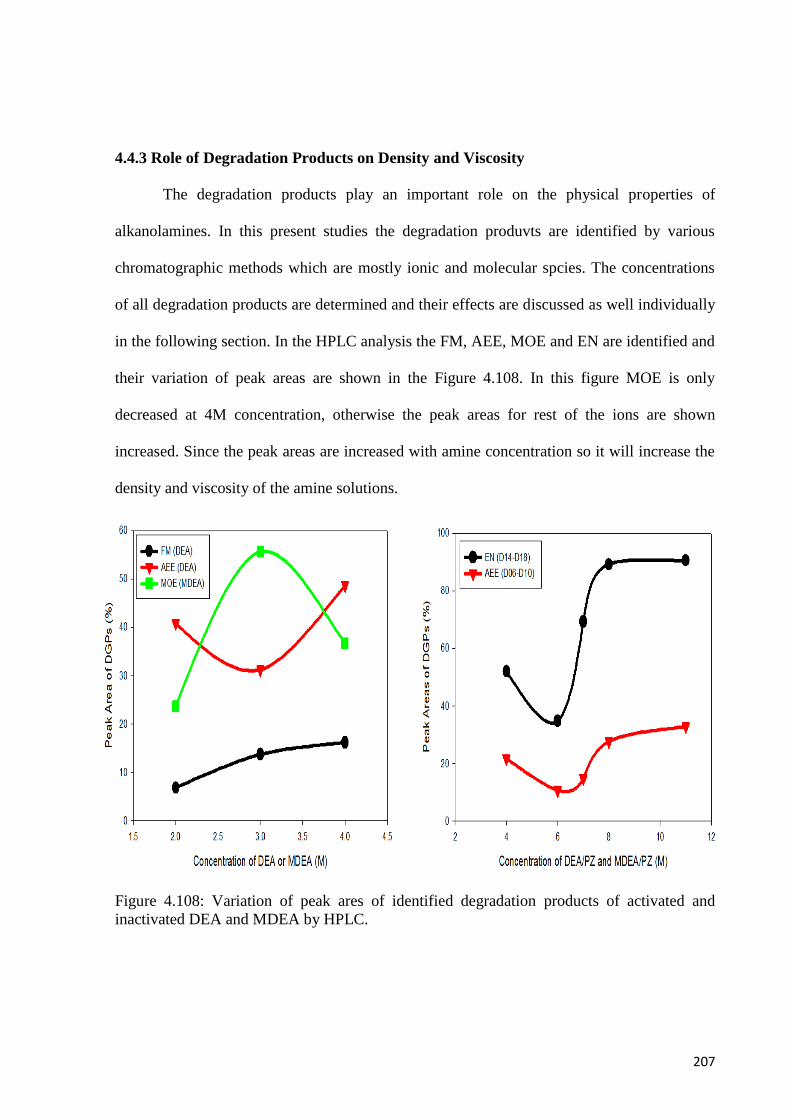
207
4.4.3 Role of Degradation Products on Density and Viscosity
The degradation products play an important role on the physical properties of
alkanolamines. In this present studies the degradation produvts are identified by various
chromatographic methods which are mostly ionic and molecular spcies. The concentrations
of all degradation products are determined and their effects are discussed as well individually
in the following section. In the HPLC analysis the FM, AEE, MOE and EN are identified and
their variation of peak areas are shown in the Figure 4.108. In this figure MOE is only
decreased at 4M concentration, otherwise the peak areas for rest of the ions are shown
increased. Since the peak areas are increased with amine concentration so it will increase the
density and viscosity of the amine solutions.
Figure 4.108: Variation of peak ares of identified degradation products of activated and
inactivated DEA and MDEA by HPLC.
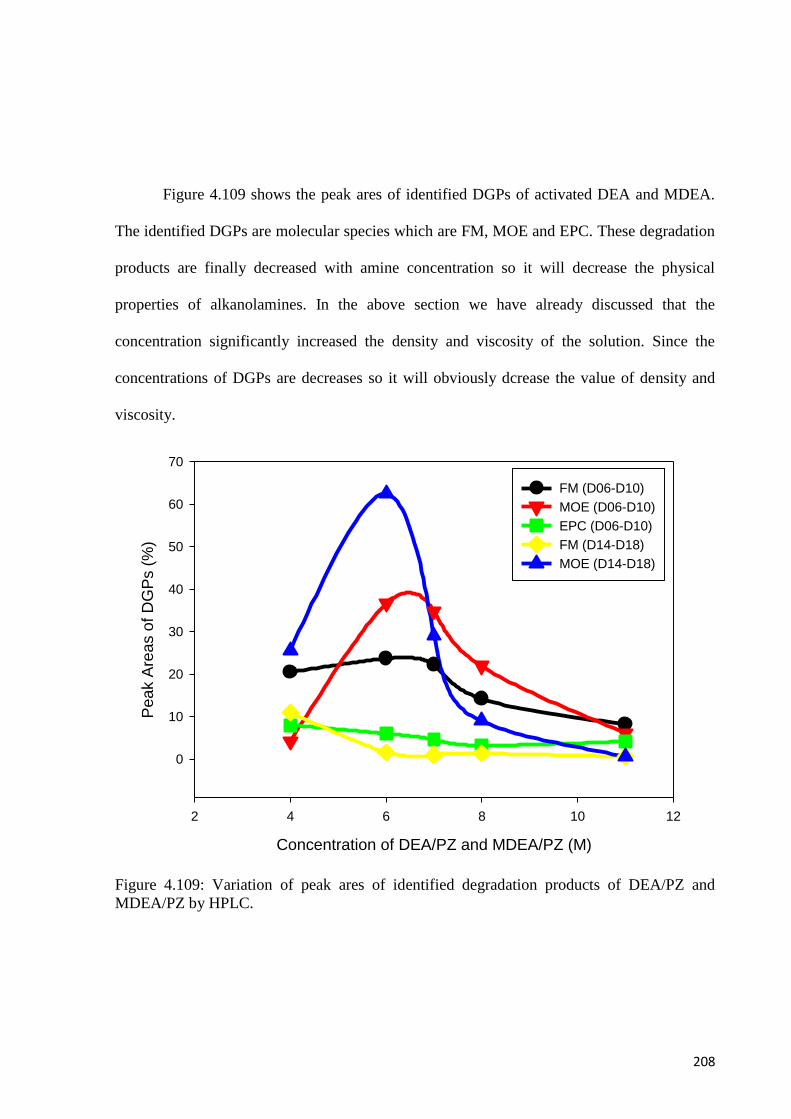
208
Figure 4.109 shows the peak ares of identified DGPs of activated DEA and MDEA.
The identified DGPs are molecular species which are FM, MOE and EPC. These degradation
products are finally decreased with amine concentration so it will decrease the physical
properties of alkanolamines. In the above section we have already discussed that the
concentration significantly increased the density and viscosity of the solution. Since the
concentrations of DGPs are decreases so it will obviously dcrease the value of density and
viscosity.
Figure 4.109: Variation of peak ares of identified degradation products of DEA/PZ and
MDEA/PZ by HPLC.
Concentration of DEA/PZ and MDEA/PZ (M)
2 4 6 8 10 12
Peak A
reas o
f D
GP
s (
%)
0
10
20
30
40
50
60
70
FM (D06-D10)
MOE (D06-D10)
EPC (D06-D10)
FM (D14-D18)
MOE (D14-D18)
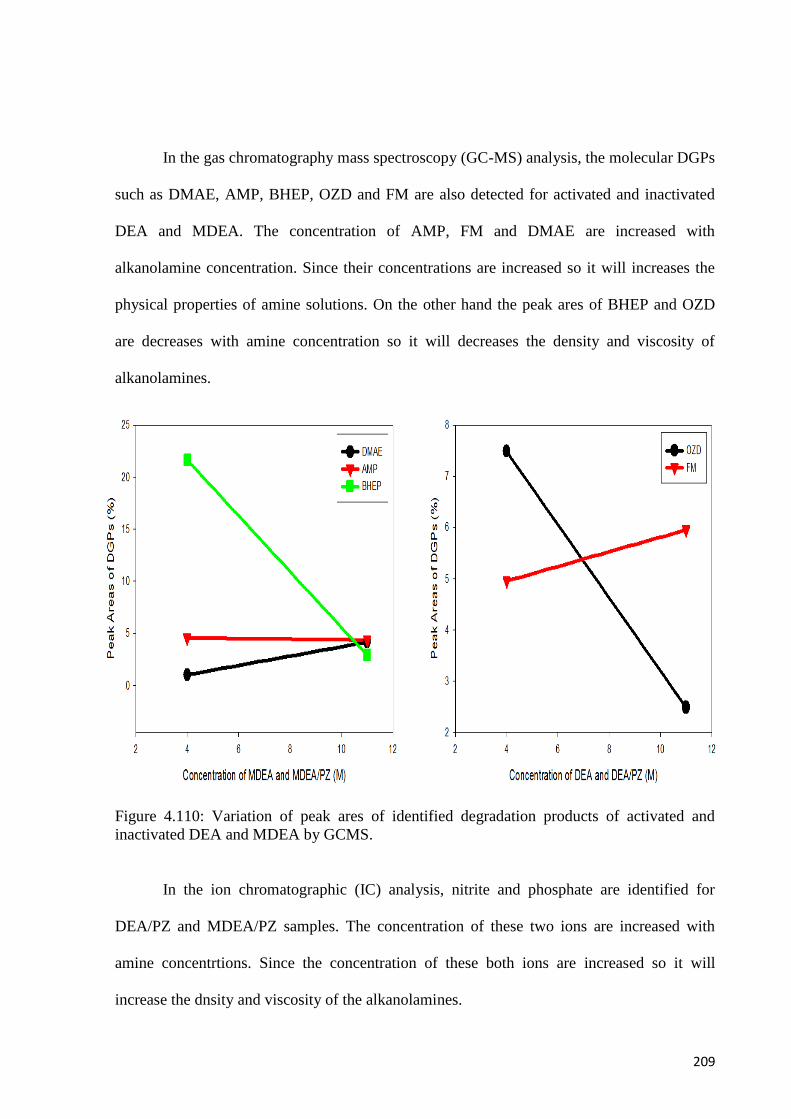
209
In the gas chromatography mass spectroscopy (GC-MS) analysis, the molecular DGPs
such as DMAE, AMP, BHEP, OZD and FM are also detected for activated and inactivated
DEA and MDEA. The concentration of AMP, FM and DMAE are increased with
alkanolamine concentration. Since their concentrations are increased so it will increases the
physical properties of amine solutions. On the other hand the peak ares of BHEP and OZD
are decreases with amine concentration so it will decreases the density and viscosity of
alkanolamines.
Figure 4.110: Variation of peak ares of identified degradation products of activated and
inactivated DEA and MDEA by GCMS.
In the ion chromatographic (IC) analysis, nitrite and phosphate are identified for
DEA/PZ and MDEA/PZ samples. The concentration of these two ions are increased with
amine concentrtions. Since the concentration of these both ions are increased so it will
increase the dnsity and viscosity of the alkanolamines.
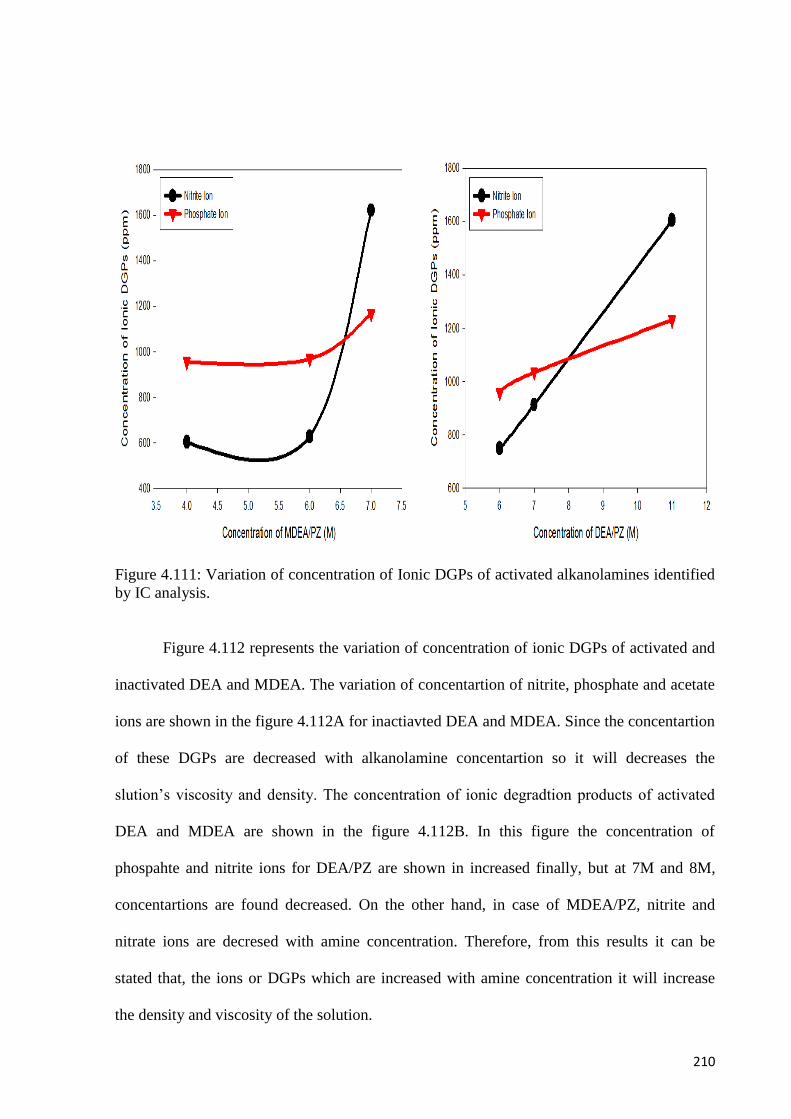
210
Figure 4.111: Variation of concentration of Ionic DGPs of activated alkanolamines identified
by IC analysis.
Figure 4.112 represents the variation of concentration of ionic DGPs of activated and
inactivated DEA and MDEA. The variation of concentartion of nitrite, phosphate and acetate
ions are shown in the figure 4.112A for inactiavted DEA and MDEA. Since the concentartion
of these DGPs are decreased with alkanolamine concentartion so it will decreases the
slution‟s viscosity and density. The concentration of ionic degradtion products of activated
DEA and MDEA are shown in the figure 4.112B. In this figure the concentration of
phospahte and nitrite ions for DEA/PZ are shown in increased finally, but at 7M and 8M,
concentartions are found decreased. On the other hand, in case of MDEA/PZ, nitrite and
nitrate ions are decresed with amine concentration. Therefore, from this results it can be
stated that, the ions or DGPs which are increased with amine concentration it will increase
the density and viscosity of the solution.
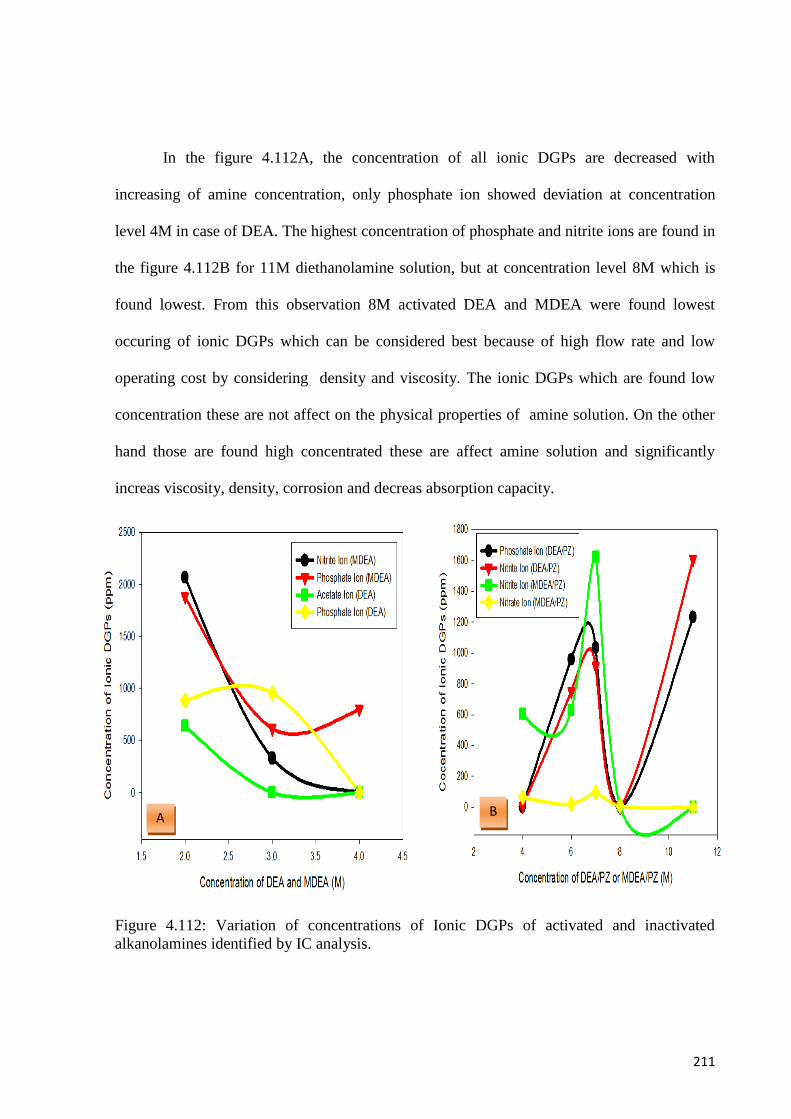
211
In the figure 4.112A, the concentration of all ionic DGPs are decreased with
increasing of amine concentration, only phosphate ion showed deviation at concentration
level 4M in case of DEA. The highest concentration of phosphate and nitrite ions are found in
the figure 4.112B for 11M diethanolamine solution, but at concentration level 8M which is
found lowest. From this observation 8M activated DEA and MDEA were found lowest
occuring of ionic DGPs which can be considered best because of high flow rate and low
operating cost by considering density and viscosity. The ionic DGPs which are found low
concentration these are not affect on the physical properties of amine solution. On the other
hand those are found high concentrated these are affect amine solution and significantly
increas viscosity, density, corrosion and decreas absorption capacity.
Figure 4.112: Variation of concentrations of Ionic DGPs of activated and inactivated
alkanolamines identified by IC analysis.
A B

212
CONCLUSIONS AND
RECOMMENDATIONS
CHAPTER 05
213
CHAPTER 05: CONCLUSIONS AND RECOMMENDATIONS
This chapter details the key findings of this study on amine degradation induced by carbon
dioxide at atmospheric conditions under true amine based absorption and stripping condition.
The degraded samples were analyzed by HPLC–UV, GC-MS and IC methods in order to
identify the degradation products (DGPs). Results are presented for five degradation system
in activated and inactivated condition. Finally, recommendations are made for future work on
amine degradation.
5.1 CONCLUSIONS
The conclusions were drawn for five degradation system in order to understand the
effect of activator on alkanolamine degradation using PZ as activator. Two amines were used
in this study these are diethanolamine (DEA) and methyldiethanolamine (MDEA).
5.1.1 Degradation System I: PZ+H2O+CO2
D01PZ1M and D02PZ2M of this degradation system are analyzed by HPLC (UV)
method and identified degradation products are formamide, 2-(2-aminoethoxyethanol) and 2-
methoxyethanol. In the IC analysis these two samples were analyzed were as acetate, nitrate,
phosphate and ammonium ions were found as ionic degradation products. The DGPs are
identified by GC-MS method for DO2PZ2M sample and which are Formamide,
Ethylenediamine, N-formylpiperazine, formic acid and imodazole.
5.1.2 Degradation System II: DEA+H2O+CO2
Three different samples were prepared of this degradation system these are
D03DEA2M, D04DEA3M and D05DEA4M. From the HPLC analysis the main degradation
products were found to be formamide, 2-methoxyethanol, diethylenetriamine, 2-(2-
aminoethoxy)-ethanol, triethanolamine, acetone, ethanol and Ethyl 1-piperazinecarboxylate.
From the IC analysis ionic DGPs were found ammonium, acetate, nitrite and phosphate. GC-
MS is only conducted for D05DEA4M of this degradation system and identified DGPs are
214
Formamide, N-(hydroxyethy1) ethylenediamine, Oxazolidone, 2-(2-aminoethoxy) ethanol, 2-
amino-2-methyl-1-propanol, N,N-bis(hydroxyethy1)- ethylenediamine, Ethylurea, 2-
methylaminoethanol, ethanol and acetone.
5.1.3 Degradation System III: DEA+PZ+H2O+CO2
D06DEA2MPZ1M activated sample of DEA is analyzed by HPLC-UV method and
six DGPs are identified which are Formamide, 2-methoxyethanol, 2-(2-aminoethoxy)-
ethanol, 1-(2-Aminoethyl)-piperazine, 1, 4-dimethylpiperazine and Ethyl-1-
piperazinecarboxylate. The other two activated DEA samples are D07DEA2MPZ2M &
D08DEA3MPZ2M shows four DGPs which are formamide, 2-methoxyethanol, 2-(2-
aminoethoxy)-ethanol and Ethyl-1-piperazinecarboxylate. The last two activated samples of
five are D09DEA4MPZ2M & D10DEA7MPZ2M shows the six common degradation
products these are formamide, 2-methoxyethanol, 2-(2-aminoethoxy)-ethanol, 1-(2-
Aminoethyl)-piperazine, 1, 4-dimethylpiperazine and Ethyl-1-piperazinecarboxylate.
Under this degradation system GC-MS is conducted for activated sample
D10DEA10MPZ2M and the identified degradation products are twelve which are
Formamide, 1,4-Bis(2-hydroxyethyl)piperazine, Oxazolidone, 1,4-Dimethylpiperazine, N,N-
bis(hydroxyethy1)ethylenediamine, 2-dimethylaminoethanol, 1-(2-Aminoethyl)piperazine,
Ethyl-1-piperazinecarboxylate, Acetic acid, Glycolic acid, Ethylurea and Acetone.
The most common ionic degradation products of these above mentioned samples are
identified by IC methods and the identified degradation products are namely nitrite, nitrate,
ammonium and phosphate.
215
5.1.4 Degradation System IV: MDEA+H2O+CO2
Three samples D11MDEA2M, D12MDEA3M and D13MDEA4M were prepared for
this degradation system, both of these analyzed and found degradation products are namely
formamide and 2-methoxyethanol. On the other hand identified ionic degradation products
are nitrite, phosphate, acetate and ammonium. GC-MS method is conducted for high
concentrated inactivated amine sample D13MDEA4M and the identified DGPs are 1, 4-Bis
(2-hydroxyethyl)-piperazine, Bis-(2-hydroxypropyl) amine, Oxazolidone, 2-(2-
aminoethoxy)ethanol, 2-Amino-2-methyl-1-propanol, 2-dimethylaminoethanol, Ethylurea,
Glycolic acid, Acetal dehyde, Ethanol and Acetic acid.
5.1.5 Degradation System V: MDEA+PZ+H2O+CO2
Activated MDEA system comprises of five different samples namely these are
D14MDEA2MPZ1M, D15MDEA2MPZ2M, D16MDEA3MPZ2M, D17MDEA4MPZ2M
and D18MDEA7MPZ2M. MDEA was found very stable and high resistance over DEA even
though activated DEA samples. The identified degradation products are formamide, 2-
methoxyethanol and ethanol. From the IC analysis identified ionic degradation products are
nitrate, nitrite, phosphate and acetate. From the GC-MS analysis for D18MDEA7MPZ2M
sample there are eight DGPs are identified which are 1-Methyl piperazine, 1, 4-Bis(2-
hydroxyethyl)piperazine, Bis(2-hydroxypropyl) amine, N, N- dimethyl piperazine, 2-Amino-
2-methyl-1-propanol, 2-dimethylaminoethanol, 1-(2-aminoethyl) piperazine and ethanol.
5.1.6 Density and Viscosity
Density and viscosity of activated and inactivated alkanolamine samples are measures
at 30 ˚C, 55 ˚C and 100 ˚C temperatures. From this result it is stated that, both parameters are
decreased when the temperatures are inceased and when the temperatures are increased the
opposite trends are observed.
216
The effect of amine concentration on density and viscosity are also studied for several
concentrations and the final result is briefly stated that, the increasing of amine concentration
significantly increases the density and viscosity. At higher concentration of amine solution,
both parameters i.e. density and viscosity are found high. The same experiences are found for
activated and inactivated samples.
5.2 Recommendations
In this study, the high performance liquid chromatography (HPLC) technique was
used in analyzing the degraded samples of activated and inactivated DEA and MDEA.
It is recommended that other techniques such as GC-MS and CE-DAD be used for the
same analysis.
During the analysis we used single column in case of HPLC and IC analysis. In order
to get more information dual column is recommended for further analysis.
In the present work identification of degradation products is only carried out, to
understand degradation phenomenon its kinetics, modeling and mechanism is
recommended for future research on this fields.
The whole experiment was conducted under absorption and stripping condition where
as the temperature was settled 55 and 100 ˚C for absorption and stripping condition
respectively. The range of temperature for stripping is 100-120 ˚C. The experiment to
be conducted at 120 ˚C for full understanding degradation phenomenon.
The degradation experiment was done at low atmospheric condition so future research
to be conducted under high pressure.
217
REFERENCES
Abdi, M. A., (1997). Purification of partially degraded diethanolamine solutions, PhD thesis,
University of British Columbia, Canada.
Abdi, M. A., Khakdaman, H. R., and Zoghi, A. T. (2005). Predicting amine blend
Performance. Petroleum Technology Quarterly, 113-117, 2005.
Ahmady, A., Hashim, M. A., Aroua, M. K., (2011). Density, viscosity, physical solubility
and diffusivity of CO2 in aqueous MDEA + [bmim][BF4] solutions from 303 to 333
K (article in press).
AI-Ghawas, H. A., Hagewiesche, D. P., Ruiz-Ibanez, G., Sandall, O. C., (1989).
Physicochemical properties important for carbon dioxide absorption in aqueous
methyldiethanolamine. J. Chem. Eng. Data, 34, 385–91.
Alawode, A. O., (2005). Oxidative Degradation of Piperazine in the Absorption of Carbon
Dioxide, Master of Science in Engineering Thesis, The University of Texas at Austin.
Amiri, A. P., Hanghi, A. A., Ehsani, M. R., (2007). Alkanolamines Foaming Tendency:
Effect of Amine Mixing, Amine Degradation and Gas Flow Rate. Farayandno, 8, 1-6.
Appl, M., Henrici, H. J., Wagner, U., Keussner, K., Volkamer, K., Fuerst, E., (1980).
Removal of CO2 and/or H2S and/or COS from gases containing these constituents,
Canadian Patent 1,090,098.
Aroonwilas, A., and Veawab, A., (2004). Characterization and Comparison of the CO2
Absorption Performance into Single and Blended Alkanolamines in a Packed
Column. Ind. Eng. Chem. Res., 43 (9), 2228-32.
Ashour, S. S., Rinker, E. B., Sandall, O. C., (1997). Correlation for estimating the
diffusivities of nitrous oxide in aqueous solution of diethanolamine and n-
methyldiethanolamine and methyldiethanolamine and the solution densities and
viscosities. Chem. Eng. Commun., 161(1), 15-24.
Meisen, A., and Abdi, M. A., (2010). Amine Degradation: Problems, Review of Research
Achievements, Recovery Techniques. Retrieved on March, 2010 at the website
http://www.ripi.ir/congress10/amine%20degradation.pdf
Ayanduntan, O., Lawal, O. A., and Idem, R. O., (2006). Kinetics of the oxidative degradation
of CO2 loaded and concentrated aqueous MEA-MDEA blends during CO2 absorption
from flue gas streams. Ind. Eng. Chem. Res., 45, 2601-2607.
Bedella, S. A., (2009). Oxidative degradation mechanisms for amines in flue gas capture.
Energy Procedia, 1, 771-778.
218
Bello, A., and Idem, R. O., (2006). Comprehensive Study of the Kinetics of the Oxidative
Degradation of CO2 Loaded and Concentrated Aqueous Monoethanolamine (MEA)
with and without Sodium Metavanadate during CO2 Absorption from Flue Gases. Ind.
Eng. Chem. Res., 45, 2569-2579.
Blake, R. J., (1967). How Acid-Gas Treating Processes Compare. Oil and Gas J., 105-108.
Blauwhoff, P. M. M., Lauwhoff, Versteeg, G. F., and Vanswaaij, W. P. M., (1984). A Study
on the reaction between CO and alkanolamines in aqueous solutions. Chemical
Engineering Science 39 (2), 207-25.
Carlson, S., Canter, S., and Jenkins, J., (2001). Canadian Gas Treating Solvent Quality
Control – Unique Challenges. Sulfur Recovery Symposium Canmore Alberta,
Houston, Texas 77031.
Chakma, A., and Meisen, A., (1997). Methyl-diethanolamine Degradation – Mechanism and
Kinetics. The Canadian Journal of Chemical Engineering, 75 (5), 861-871.
Chakma, A., and Meisen, A., (1988). Identification of methyldiethanolamine degradation
products by gas chromatography and gas chromatography mass spectrometry. J.
Chromatogr., 457, 287.
Chi, Q. S., (2000). Oxidative Degradation of Monoethanolamine, M.Sc.Eng thesis, The
University of Texas at Austin, USA.
Chi, S., and Rochelle, G. T., (2002). Oxidative Degradation of Monoethanolamine. Ind. Eng.
Chem. Res., 41, 4178-4186.
Chi, S., and Rochelle, G. T., (2010). Oxidative Degradation of Monoethanolamine. Retrieved
on February,2010 available at the website
http://www.netl.doe.gov/publications/proceedings/01/carbon_seq/p1.pdf
Choy, E. T., and Meisen, A., (1980). Gas chromatographic detection of diethanolamine and
its degradation products. Journal of Chromatography, 187, 145-52
Chu, W., Rao, Y. F., Kwan, C. Y., and Choy, W. K., (2009). Photochemical Degradation of
2,4,6-Trichlorophenol in the Brij 35 Micellar Solution: pH Control on Product
Distribution, Ind. Eng. Chem. Res., 48, 10211–6
Clark, P. D., Dowling, N. I., Davis, P. M., (2004). Introduction to sulphur chemistry and
sulphur handling. Sulphur 2004 Conference; Barcelona (Spain), October 24.
Closmann, F., (2009). Solvent degradation –MEA and MDEA/PZ blends systems, retrieved
on december,2009, available at the website
http://ena.chemeng.ntnu.no/TrondheimJointAbsorptionSeminar/Closmann_Trondhei
m_150609.pdf
219
Closmann, F., Nguyen, T., and Rochelle, G. T., (2009). MDEA/Piperazine as a solvent for
CO2 capture. Energy Procedia (1), 1351-7.
Dang, H., and Rochelle, G. T., (2003). CO2 Absorption Rate and Solubility in
Monoethanolamine/ Piperazine/ Water. Separation Science and Technology, 38(2), 337-57.
Davis, J., and Rochelle, G. T., (2009). Thermal degradation of monoethanolamine at stripper
conditions Energy Procedia (1), GHGT-9, 327-33
Davis, J. D., (2009). Thermal Degradation of Aqueous Amines Used for Carbon Dioxide
Capture, PhD thesis, The University of Texas at Austin.
Davison, J., Freund, P., Smith, A., (2001). Putting Carbon Back into the Ground. IEA
Greenhouse Gas R&D Programme.
http://www.ieaghg.org/docs/general_publications/putcback.pdf
Dawodu, O. F., and Meisen, A., (1996). Effect of composition on the performance of
alkanolamines blends for gas sweetening. Chemical engineering communications,
(144), 103-112.
Dawodu, O. F., and Meisen, A., (1991). Identification of products resulting from carbonyl
sulphide-induced degradation of diethanolamine. Journal of Chromatography, (587)
237-46.
Dawodu, O. F., and Meisen, A., (1992). The effects of operating conditions on COS-induced
degradation of aqueous diethanolamine solutions. Gas Separation & Purification, 6
(3), 115-24.
Dawodu, O. F., and Meisen, A., (1993). Gas chromatographic analysis of alkanolamine
solutions using capillary and packed columns Journal of Chromatography, 629, 297-
307.
Dawodu O, F., and Meisen A 1996 Degradation of aqueous diethanolamine solutions by
carbon disulfide Gas. Sep. Purif Vol. 10, No. 1 1-11
Dawodu, O. F., and Meisen, A., (1994). Mechanism and kinetics of COS-induced
diethanolamine degradation. Ind. Eng. Chem. Res., 33 480-487.
Derks, P. W. J., Hamborg, E. S., Hogendoorn, J. A., Niederer, J. P. M., Versteeg, G. F.,
(2008). Densities, Viscosities, and Liquid Diffusivities in aqueous piperazine and
aqueous (piperazine + N-Methyldiethanolamine) solutions. J. Chem. Eng. Data, (53),
1179-1185.
DOW (2001). Heat Stable Salt Management. Retrieved on 11 December, 2009 at the website
http://www.dow.com/PublishedLiterature/dh_0042/0901b80380042b31.pdf?filepath=
gastreating/pdfs/noreg/170-00284.pdf&fromPage=GetDoc
220
Dupart, M. S., Rooney, P. C., and Bacon, T. R., (1999). Comparing laboratory and plant data
for MDEA/DEA blends. Hydrocarbon Processing. Appril 1999 issues, 81-86.
http://www.gastreating.com/pdf/Hc%20Processing%20April%201999.pdf
Egmond, S. V., Hekker, M. P., (2012). Argument map for carbon capture and storage.
International Journal of Greenhouse Gas Control. DOI:
http://dx.doi.org/10.1016/j.ijggc.2012.08.010
Eide-Haugmo, I., Brakstad, O. G., Hoff K. A., Sorheim, K. R., Silva, E. F. D., and Svendsen,
H. F., (2009). Environmental impact of amines. Energy procedia, 1, 1297-1304.
Franco, J. A., Montigny, D., Kentisha, S. E., Perera, J. M., and Stevens, G. W., (2009).
Effect of amine degradation products on the membrane gas absorption process.
Chemical Engineering Science, 64, 4016-4023.
Freeman, S. A., Dugas, R., Wagener, D. V., Nguyen, T., and Rochelle, G. T., (2009). Carbon
dioxide capture with concentrated aqueous piperazine. Energy Procedia, 1, 1489-96.
Freeman, S. A, Davis, J., and Rochelle, G. T., (2010). Degradation of aqueous piperazine in
carbon dioxide capture. International Journal of Greenhouse Gas Control, 4(5), 756-761.
Goff, G. S., and Rochelle, G. T., (2006). Oxidation Inhibitors for Copper and Iron Catalyzed
Degradation of Monoethanolamine in CO2 Capture Processes. Ind. Eng. Chem. Res.,
45, 2513-21.
Goff, G. S., and Rochelle, G. T., (2004). Monoethanolamine Degradation: O2 Mass Transfer
Effects under CO2 Capture Conditions. Ind. Eng. Chem. Res., 43, 6400-6408.
Goff, G. S., (2005). Oxidative Degradation of Aqueous Monoethanolamine in CO2 Capture
Processes: Iron and Copper Catalysis, Inhibition and O2 Mass Transfer, PhD thesis,
the University of Texas at Austin. USA.
Goff, G. S., and Rochelle, G. T., (2010). Oxidative degradation of monoethanolamine in CO2
capture; O2 mass transfer, retrieved on January, 2010, available on the website
http://uregina.ca/ghgt7/PDF/papers/poster/453.pdf.
Haws, R., (2010). Contaminants in Amine Gas Treating. Accessed on July 13, 2010. Url:
http://www.reclaim.com/site/reference_docs/comtaminents_in_amine_gastreating.pdf
Haws, R., Jenkins, J., (2000). Contaminant Reporting in Amine Gas Treating Service. Url:
http://www.reclaim.com/site/reference_docs/contamnant_reporting_in_amine_gas_tre
ating_service.pdf
Holub, P. E., Critchfield, J. E., Su, W.-Y., (1998). Amine degradation chemistry in CO2
service. 48th
Annual Laurance Reid Gas Conditioning Conference, Norman,
Oklahoma, March 1-4, 146.
221
Hsu, C. S., Kim, C. J., (1985). Diethanolamine (DEA) degradation under gas treating
conditions. Ind. Eng. Chem. Prod. Res. Dev., 24, 630
IEA (1999), Carbon Dioxide Capture from Power Stations, IEA Greenhouse Gas R&D,
Programme: http://www.ieagreen.org.uk/capt1.htm, (Accessed 2/15/2012)
IEA (2003), CO2 Capture at Power Stations and Other Major Point Sources. International
Energy Agency, Working Party on Fossil Fuels, Paris, France.
Kaveh, N. S., Wolf, K- H., Ashrafizadeh, S. N., Rudolph, E. S. J., (2012). Effect of coal
petrology and pressure on wetting properties of wet coal for CO2 and flue gas storage.
International Journal of Greenhouse Gas Control. DOI:
http://dx.doi.org/10.1016/j.ijggc.2012.09.009
Kadnar, R., (1999). Determination of amines used in the oil and gas industry (upstream
section) by ion chromatography. Journal of Chromatography A, 850, 289-295.
Kennard, M. L., and Allelsen, A., (1985). Mechanisms and Kinetics of Diethanolamine
Degradation. Ind. Eng. Chem. Res. Fundam., 24, 129-40.
Kennard, M., and Meisen, A., (1983). Gas chromatographic technique for analyzing partially
degraded diethanolamine solutions. Journal of Chromatography, 267, 373-280.
Kennard, M., and Meisen, A., (1983). Gas chromatographic technique for analyzing partially
degraded diethanolamine solutions. Journal of Chromatography, 267, 373-380.
Kennard, M. L., Meisen, A., (1980). Control DEA degradation Hydrocarbon Process., Int.
Ed., 59, 103.
Klare, M., Scheen, J., Vogelsang, K., Jacobs, H., and Broekaert, J. A. C., (2000). Degradation
of short-chain alkyl- and alkanolamines by TiO2- and Pt/TiO2-assisted
photocatalysis. Chemosphere, 41, 353-62.
Klare, M., Waldner, G., Bauer, R., Jacobs, H., and Broekaert, J. A. C., (1999). Degradation of
nitrogen containing organic compounds by combined photocatalysis and ozonation.
Chemosphere, 38(9), 2013-2027.
Kohl, A., and Nielsen, R., (1997). “Gas Purification” 5th
Edition, Gulf Publishing, Houston,
236-239.
Kohl, A. L., and Riesenfeld, F. C., (1979). Gas Purification, Third Edition, Page No. 686,
Houston, Texas.
Lawal, O., Bello, A., and Idem, R., (2005a). Pathways and reaction products for the oxidative
degradation of CO2 loaded and concentrated aquous MEA and MEA/MDEA mixtures
during CO2 absorption from flue gases. Greenhouse Gas Control Technologies
(GGCT), 7, 1159-64.
222
Lawal, O., Bello, A., and Idem, R., (2005b). The Role of Methyl Diethanolamine (MDEA) in
Preventing the Oxidative Degradation of CO2 Loaded and Concentrated Aqueous
Monoethanolamine (MEA)-MDEA Blends during CO2 Absorption from Flue Gases.
Ind. Eng. Chem. Res., 44, 1874-96.
Lawal, O. A., and Idem, R. O., (2006). Kinetics of the oxidative degradation of CO2 loaded
and concentrated aqueous MEA-MDEA blends during CO2 absorption from flue gas
streams, Ind. Eng. Chem. Res., 45, 2601 -2607.
Lensen, R., (2004). The promoter effect of piperazine on the removal of carbon dioxide.
Retrived on August, 2009, url-Http://www.bsdfreaks.nl/files/hoofd6.pdf
Lepaumier, H. D., Picq, D., and Carrette, P. L., (2009a). Degradation Study of new solvents
for CO2 capture in post-combustion. Energy Procedia, 1, 893–900.
Lepaumier, H., Martin, S., Picq, D., Delfort, B., and Carrette, P. –L., (2010), New Amines for
CO2 Capture. III. Effect of Alkyl Chain Length between Amine Functions on
Polyamines Degradation, Ind. Eng. Chem. Res., (Article in press).
Lepaumier, H., Picq, D., and Carrette, P. –L., (2009b). New Amines for CO2 Capture I.
Mechanisms of Amine Degradation in the Presence of CO2. Ind. Eng. Chem. Res., 48,
9061-9067.
Lepaumier, H., Picq, D., and Carrette, P. –L., (2009c). New Amines for CO2 Capture II.
Oxidative Degradation Mechanisms. Ind. Eng. Chem. Res., 48, 9068–75.
Lu, B-. H., Jin, J-. J., Zhang, L., Li, W., (2012). Absorption of carbon dioxide into aqueous
blend of monoethanolamine and 1-butyl-3-methylimidazolium tetrafluoroborate.
International Journal of Greenhouse Gas Control.
http://dx.doi.org/10.1016/j.ijggc.2012.08.007
Kaminski, M., Jastrzebski, D., Przyjazny, A., Kartanowicz, R., (2002). Determination of the
amount of wash amines and ammonium ion in desulfurization products of process
gases and results of related studies. Journal of Chromatography A, 947, 217-25.
Islam, M. S., Yusoff, R., Ali B. S., (2010). Role of acids in the degradation of alkanolamine
during CO2 and H2S removal process. International Conference on Marine
Technology, BUET, Dhaka, Bangladesh.
Mandal, B. P., Guha, M., Biswas, A. K., and Bandyopadhyay, S. S., (2001). Removal
of carbon dioxide by absorption in mixed amines: Modelling of absorption in aqueous
MDEA/MEA and AMP/MEA solutions. Chem. Eng. Sci., (56), 6217-24.
Meisen, A., and Abdi, M. A., (2010) Amine Degradation: Problems, Review of Research
Achievements, Recovery Techniques, retrieved on March 21, 2010, available on the
website http://h1.ripway.com/abdolhosein2005/amin degradation- Conf-Tehran.pdf
223
Mercader, F. D. M., Magneschi, G., Fernandez, E. S., Stienstra, G. J., Goethreer, E. L.V., (
2012). Integration between a demo size post-combustion CO2 capture and full size
power plant. An integral approach on energy penalty for different process options.
International Journal of Greenhouse Gas Control.
http://dx.doi.org/10.1016/j.ijggc.2012.09.016
Meisen, A., Kennerd, M. L., (1982). DEA degradation mechanism, Hydrocarbon Process. Int.
Ed., 61, 105.
Mirkhani, V., Tangestaninejad, S., Moghadam, M., Habibi, M. H., and Vartooni A. R.,
(2009), Photodegradation of Aromatic Amines by Ag-TiO2 Photocatalyst. J. Iran.
Chem. Soc., 6 (4), 800-7.
Mrklas, O., Chu, A., Lunn, S., (2003). Determination of ethanolamine, ethylene glycol and
triethylene glycol by ion chromatography for laboratory and field biodegradation
studies, J. Environ. Monit. 5, 336-40.
Oh, K. -J., Lee, S. –S., Park, S. –W., Park, D. –W., and Shon, B. –H., (2003). Degradation of
aqueous alkanolamine solution containing CO2 and H2S, 48(1), 258-9.
http://web.anl.gov/PCS/acsfuel/preprint%20archive/Files/48_1_New%20Orleans__03
-03_0468.pdf
Pacheco, M. A., Kaganoi, S., and Rochelle, G. T., (2000). CO2 absorption into aqueous
mixtures of diglycolamine and methyldiethanolamine. Chem. Eng. Sci., 55(21), 5125-
5140.
Pauley, C. R., and Hashemi, R., (1998). Analysis of Foaming Mechanisms in Amine Plants,
American Institute of Chemical Engineer‟s Summer Meeting, August 22-24, 1988,
Denver, Colorado. www.pall.com/pdfs/Fuels-and-Chemicals/FCSTR1.pdf
Polderman, L. D., Dillon, C. P., Steele, A. B., (1955). Why monoethanolamine solution
breaks down in gas-treating service. Oil and Gas J., 54 (2), 180-3.
Rinker, E. B., Oelschlager, D. W., Colussi, A. T., Henry, K. R., Sandall, O. C., (1994).
Viscosity, density, and surface tension of binary mixtures of water and n-
methyldiethanolarnine and water and diethanolamine and tertiary mixtures of these
amines with water over the temperature range 20–100 C. J. Chem. Eng. Data, 392-
395. (Article in press).
Rinker, E. B., (1997). PhD dissertation, University of California, Santa Barbara, USA.
Rooney, P. C. B. T., Dupart, M. S., (1997). Part 2: Effect of Heat Stable Salts on MDEA
Solution Corrosivity. Hydrocarbon Process, 76 (4), 65−68, 71.
http://www.ineosllc.com/pdf/Hc%20Processing%20Mar%2096-Apr%2097.pdf
Rooney, P. C., and Daniels, D. D., (1998). Oxygen solubility in various alkanolamine/water
mixtures, Petroleum Technology Quarterly, 3(1), 97.
224
Sargent, A., and Howard, M., (2001). Texas gas plant faces ongoing battle with oxygen
contamination, Oil and gas Journal, 23, 52-58.
Scheiman, M. A., (1962). A review of monoethanolamine chemistry, V. No. 5746, U. S.
Naval Research Laboratory Report
Sexton, A. J., and Rochelle, G. T., (2009a). Catalyst and Inhibitors for MEA Oxidation
Energy Procedia, 1, 1179–1185.
Sexton, A. J., and Rochelle, G. T., (2009b). Catalysts and inhibitors for oxidative degradation
of monoethanolamine, International Journal of Greenhouse Gas Control, 3, 704–711.
Sexton, A., and Rochelle, G. T., (2010). Oxidation products of amines in CO2 capture,
Retrived on 10 May, 2010, available at the website
http://www.che.utexas.edu/rochelle_group/Pubs/Pubs/SextonGHGT8.pdf
Sexton, A. J., (2008). Amine Oxidation in CO2 Capture Processes. Ph.D Thesis, the
University of Texas at Austin, USA.
Shahi, P., Hu, Y., and Chakma, A., (1994). Gas chromatographic analysis of acid gases and
single/mixed alkanolamines. Journal of Chromatography A, 687, 121-32.
Stephanie A. F., Jason, D., and Gary, T. R., (2010). Degradation of aqueous piperazine in
carbon dioxide capture. International Journal of Greenhouse Gas Control, 4(5), 2010,
756-761.
Stewart, E. J., and Lanning, R. A., (1994). Reduce amine plant solvent losses.
http://www.gastreating.com/pdf/Hc%20Processing%20May-June%201994.pdf
Strazisar, B. R., Anderson, R. R., and White, C. M., (2003). Degradation Pathways for
Monoethanolamine in a CO2 Capture Facility. Energy & Fuels, 17, 1034-9.
Strazisar, B. R., Anderson, R. R., and White, C. M., (2010). Degradation of
Monoethanolamine Used in Carbon Dioxide Capture from Flue Gas of a Coal-fired
Electric Power Generating Station, retrived on 8 May,2010, at the website
http://www.netl.doe.gov/publications/proceedings/01/carbon_seq/4b3.pdf
Supap, T., Idem, R., Tontiwachwuthikul, P., and Saiwan, C., (2006). Analysis of
Monoethanolamine and Its Oxidative Degradation Products during CO2 Absorption
from Flue Gases: A Comparative Study of GC-MS, HPLC-RID, and CE-DAD
Analytical Techniques and Possible Optimum Combinations. Ind. Eng. Chem. Res.,
45, 2437-51.
Thitakamol, B., and Veawab, A., (2008). Foaming Behavior in CO2 Absorption Process
Using Aqueous Solutions of Single and Blended Alkanolamines. Ind. Eng. Chem.
Res., 47, 216-225.
225
Thitakamol, B., Veawab, A., and Aroonwilas, A., (2009). Foaming in amine-based CO2
capture process: experiment, modeling and simulation. Energy Procedia 1 GHGT-9.
1381-6.
Uyanga, I. J., (2007). Studies of Sulfur Dioxide and Oxygen Induced Degradation of
Monoethanolamine During Carbon Dioxide Capture From Power Plant Flue Gas
Streams, M.A.Sc thesis, University of Regina, Canada.
Versteeg, G. F., and Oyevaar, M. H., (1989). The reaction between CO2 and diethanolamine
at 298 ˚K. J. Chemica Engineering Science, 44(5), 1264-1268.
Wenten, I. G., (2010). Chemical solvent base, Innovative Solution in CO2 Nowadays, oral
presentation, retrieved on February,2010, available on the website http://www.iatmi-
cirebon.org/ver.2/control/Materi/wenten_chemical.pdf
Xia, J., Kamps, A. P. S., and Maurer, G., (2003). Solubility of H2S in (H2O plus piperazine)
and in (H2O plus MDEA plus piperazine).Fluid Phase Equilib., 207 (1), 23-34.
226
APPENDIX
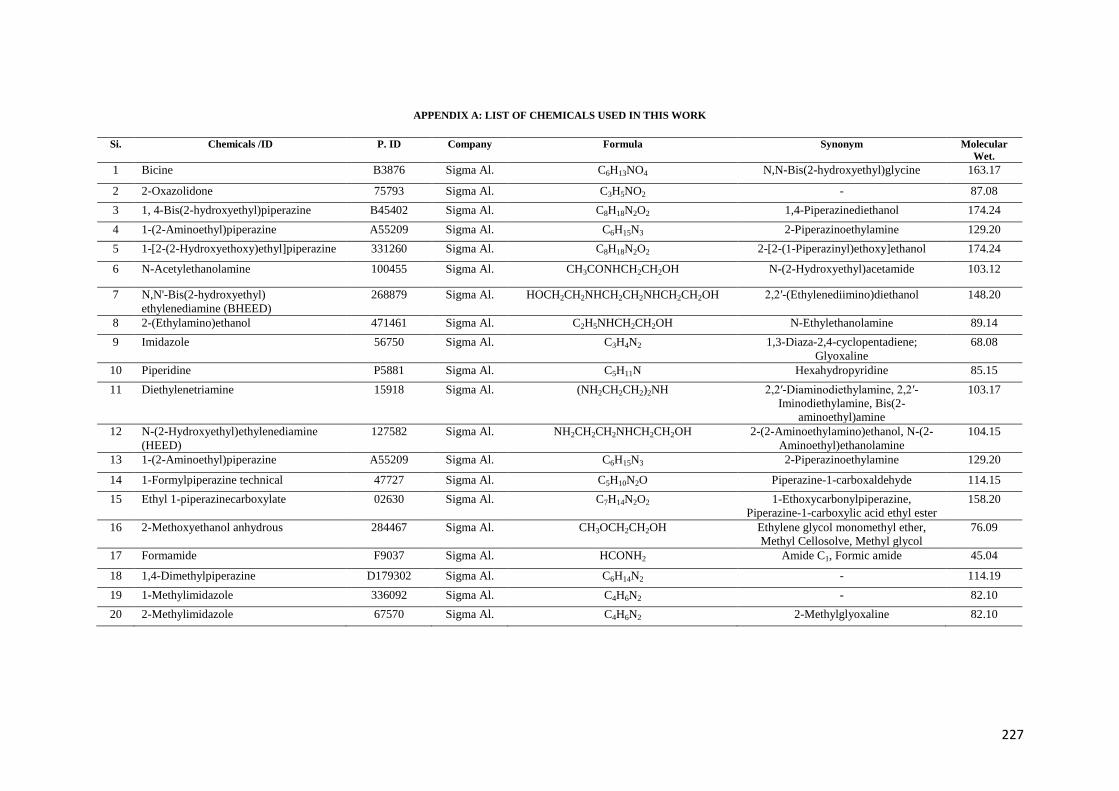
227
APPENDIX A: LIST OF CHEMICALS USED IN THIS WORK
Si. Chemicals /ID P. ID Company Formula Synonym Molecular
Wet.
1 Bicine B3876 Sigma Al. C6H13NO4 N,N-Bis(2-hydroxyethyl)glycine 163.17
2 2-Oxazolidone 75793 Sigma Al. C3H5NO2 - 87.08
3 1, 4-Bis(2-hydroxyethyl)piperazine B45402 Sigma Al. C8H18N2O2 1,4-Piperazinediethanol 174.24
4 1-(2-Aminoethyl)piperazine A55209 Sigma Al. C6H15N3 2-Piperazinoethylamine 129.20
5 1-[2-(2-Hydroxyethoxy)ethyl]piperazine 331260 Sigma Al. C8H18N2O2 2-[2-(1-Piperazinyl)ethoxy]ethanol 174.24
6 N-Acetylethanolamine 100455 Sigma Al. CH3CONHCH2CH2OH N-(2-Hydroxyethyl)acetamide 103.12
7 N,N'-Bis(2-hydroxyethyl)
ethylenediamine (BHEED)
268879 Sigma Al. HOCH2CH2NHCH2CH2NHCH2CH2OH 2,2′-(Ethylenediimino)diethanol 148.20
8 2-(Ethylamino)ethanol 471461 Sigma Al. C2H5NHCH2CH2OH N-Ethylethanolamine 89.14
9 Imidazole 56750 Sigma Al. C3H4N2 1,3-Diaza-2,4-cyclopentadiene;
Glyoxaline
68.08
10 Piperidine P5881 Sigma Al. C5H11N Hexahydropyridine 85.15
11 Diethylenetriamine 15918 Sigma Al. (NH2CH2CH2)2NH 2,2′-Diaminodiethylamine, 2,2′-
Iminodiethylamine, Bis(2-
aminoethyl)amine
103.17
12 N-(2-Hydroxyethyl)ethylenediamine
(HEED)
127582 Sigma Al. NH2CH2CH2NHCH2CH2OH 2-(2-Aminoethylamino)ethanol, N-(2-
Aminoethyl)ethanolamine
104.15
13 1-(2-Aminoethyl)piperazine A55209 Sigma Al. C6H15N3 2-Piperazinoethylamine 129.20
14 1-Formylpiperazine technical 47727 Sigma Al. C5H10N2O Piperazine-1-carboxaldehyde 114.15
15 Ethyl 1-piperazinecarboxylate 02630 Sigma Al. C7H14N2O2 1-Ethoxycarbonylpiperazine,
Piperazine-1-carboxylic acid ethyl ester
158.20
16 2-Methoxyethanol anhydrous 284467 Sigma Al. CH3OCH2CH2OH Ethylene glycol monomethyl ether,
Methyl Cellosolve, Methyl glycol
76.09
17 Formamide F9037 Sigma Al. HCONH2 Amide C1, Formic amide 45.04
18 1,4-Dimethylpiperazine D179302 Sigma Al. C6H14N2 - 114.19
19 1-Methylimidazole 336092 Sigma Al. C4H6N2 - 82.10
20 2-Methylimidazole 67570 Sigma Al. C4H6N2 2-Methylglyoxaline 82.10
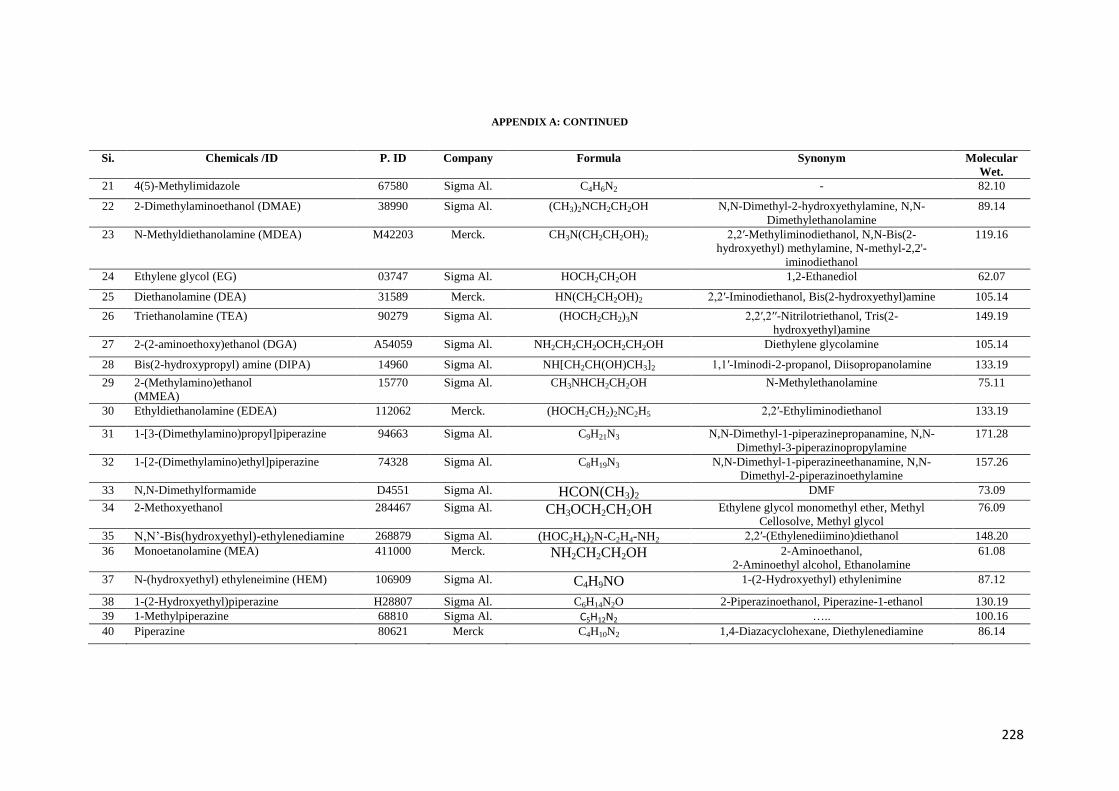
228
APPENDIX A: CONTINUED
Si. Chemicals /ID P. ID Company Formula Synonym Molecular
Wet.
21 4(5)-Methylimidazole 67580 Sigma Al. C4H6N2 - 82.10
22 2-Dimethylaminoethanol (DMAE) 38990 Sigma Al. (CH3)2NCH2CH2OH N,N-Dimethyl-2-hydroxyethylamine, N,N-
Dimethylethanolamine
89.14
23 N-Methyldiethanolamine (MDEA) M42203 Merck. CH3N(CH2CH2OH)2 2,2′-Methyliminodiethanol, N,N-Bis(2-
hydroxyethyl) methylamine, N-methyl-2,2'-
iminodiethanol
119.16
24 Ethylene glycol (EG) 03747 Sigma Al. HOCH2CH2OH 1,2-Ethanediol 62.07
25 Diethanolamine (DEA) 31589 Merck. HN(CH2CH2OH)2 2,2′-Iminodiethanol, Bis(2-hydroxyethyl)amine 105.14
26 Triethanolamine (TEA) 90279 Sigma Al. (HOCH2CH2)3N 2,2′,2′′-Nitrilotriethanol, Tris(2-
hydroxyethyl)amine
149.19
27 2-(2-aminoethoxy)ethanol (DGA) A54059 Sigma Al. NH2CH2CH2OCH2CH2OH Diethylene glycolamine 105.14
28 Bis(2-hydroxypropyl) amine (DIPA) 14960 Sigma Al. NH[CH2CH(OH)CH3]2 1,1′-Iminodi-2-propanol, Diisopropanolamine 133.19
29 2-(Methylamino)ethanol
(MMEA)
15770 Sigma Al. CH3NHCH2CH2OH N-Methylethanolamine 75.11
30 Ethyldiethanolamine (EDEA) 112062 Merck. (HOCH2CH2)2NC2H5 2,2′-Ethyliminodiethanol 133.19
31 1-[3-(Dimethylamino)propyl]piperazine 94663 Sigma Al. C9H21N3 N,N-Dimethyl-1-piperazinepropanamine, N,N-
Dimethyl-3-piperazinopropylamine
171.28
32 1-[2-(Dimethylamino)ethyl]piperazine 74328 Sigma Al. C8H19N3 N,N-Dimethyl-1-piperazineethanamine, N,N-
Dimethyl-2-piperazinoethylamine
157.26
33 N,N-Dimethylformamide D4551 Sigma Al. HCON(CH3)2 DMF 73.09
34 2-Methoxyethanol 284467 Sigma Al. CH3OCH2CH2OH Ethylene glycol monomethyl ether, Methyl
Cellosolve, Methyl glycol
76.09
35 N,N‟-Bis(hydroxyethyl)-ethylenediamine 268879 Sigma Al. (HOC2H4)2N-C2H4-NH2 2,2′-(Ethylenediimino)diethanol 148.20
36 Monoetanolamine (MEA) 411000 Merck. NH2CH2CH2OH 2-Aminoethanol,
2-Aminoethyl alcohol, Ethanolamine
61.08
37 N-(hydroxyethyl) ethyleneimine (HEM) 106909 Sigma Al. C4H9NO 1-(2-Hydroxyethyl) ethylenimine 87.12
38 1-(2-Hydroxyethyl)piperazine H28807 Sigma Al. C6H14N2O 2-Piperazinoethanol, Piperazine-1-ethanol 130.19
39 1-Methylpiperazine 68810 Sigma Al. C5H12N2 ….. 100.16
40 Piperazine 80621 Merck C4H10N2 1,4-Diazacyclohexane, Diethylenediamine 86.14
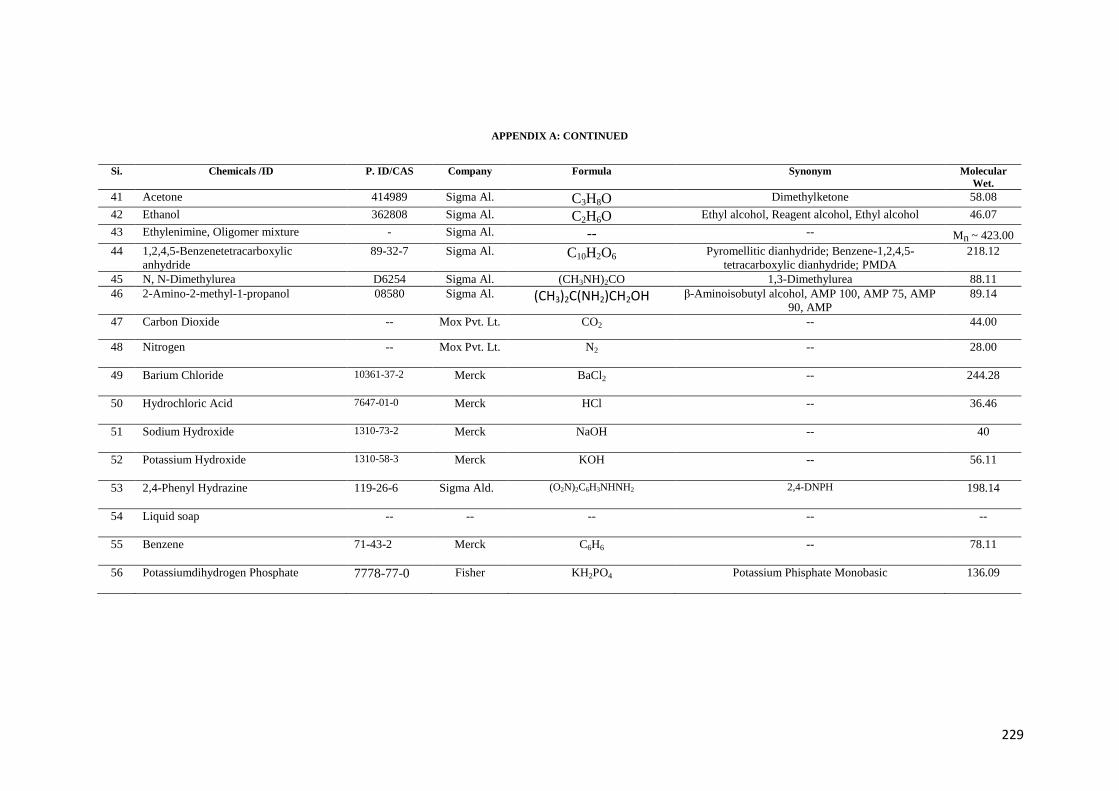
229
APPENDIX A: CONTINUED
Si. Chemicals /ID P. ID/CAS Company Formula Synonym Molecular
Wet.
41 Acetone 414989 Sigma Al. C3H8O Dimethylketone 58.08
42 Ethanol 362808 Sigma Al. C2H6O Ethyl alcohol, Reagent alcohol, Ethyl alcohol 46.07
43 Ethylenimine, Oligomer mixture - Sigma Al. -- -- Mn ~ 423.00
44 1,2,4,5-Benzenetetracarboxylic
anhydride
89-32-7 Sigma Al. C10H2O6 Pyromellitic dianhydride; Benzene-1,2,4,5-
tetracarboxylic dianhydride; PMDA
218.12
45 N, N-Dimethylurea D6254 Sigma Al. (CH3NH)2CO 1,3-Dimethylurea 88.11
46 2-Amino-2-methyl-1-propanol 08580 Sigma Al. (CH3)2C(NH2)CH2OH β-Aminoisobutyl alcohol, AMP 100, AMP 75, AMP
90, AMP
89.14
47 Carbon Dioxide -- Mox Pvt. Lt. CO2 -- 44.00
48 Nitrogen -- Mox Pvt. Lt. N2 -- 28.00
49 Barium Chloride 10361-37-2 Merck BaCl2 -- 244.28
50 Hydrochloric Acid 7647-01-0 Merck HCl -- 36.46
51 Sodium Hydroxide 1310-73-2 Merck NaOH -- 40
52 Potassium Hydroxide 1310-58-3 Merck KOH -- 56.11
53 2,4-Phenyl Hydrazine 119-26-6 Sigma Ald. (O2N)2C6H3NHNH2 2,4-DNPH 198.14
54 Liquid soap -- -- -- -- --
55 Benzene 71-43-2 Merck C6H6 -- 78.11
56 Potassiumdihydrogen Phosphate 7778-77-0 Fisher KH2PO4 Potassium Phisphate Monobasic 136.09
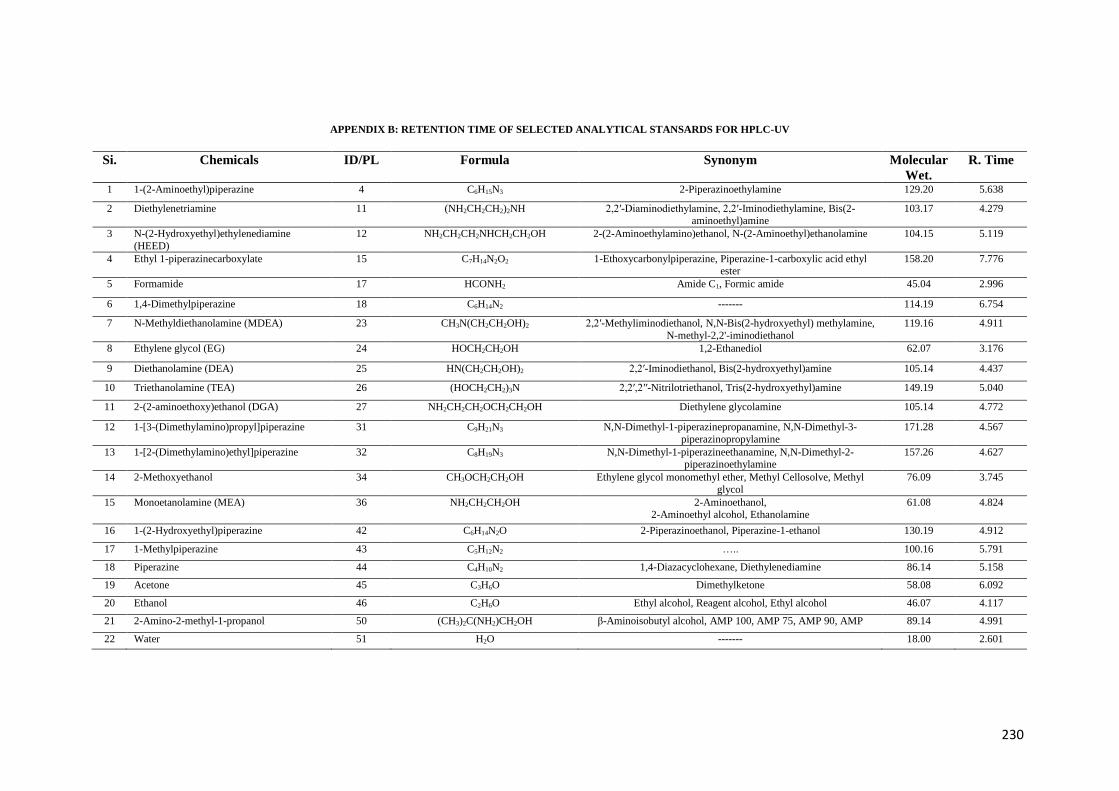
230
APPENDIX B: RETENTION TIME OF SELECTED ANALYTICAL STANSARDS FOR HPLC-UV
Si. Chemicals ID/PL Formula Synonym Molecular
Wet.
R. Time
1 1-(2-Aminoethyl)piperazine 4 C6H15N3 2-Piperazinoethylamine 129.20 5.638
2 Diethylenetriamine 11 (NH2CH2CH2)2NH 2,2′-Diaminodiethylamine, 2,2′-Iminodiethylamine, Bis(2-
aminoethyl)amine
103.17 4.279
3 N-(2-Hydroxyethyl)ethylenediamine
(HEED)
12 NH2CH2CH2NHCH2CH2OH 2-(2-Aminoethylamino)ethanol, N-(2-Aminoethyl)ethanolamine 104.15 5.119
4 Ethyl 1-piperazinecarboxylate 15 C7H14N2O2 1-Ethoxycarbonylpiperazine, Piperazine-1-carboxylic acid ethyl ester
158.20 7.776
5 Formamide 17 HCONH2 Amide C1, Formic amide 45.04 2.996
6 1,4-Dimethylpiperazine 18 C6H14N2 ------- 114.19 6.754
7 N-Methyldiethanolamine (MDEA) 23 CH3N(CH2CH2OH)2 2,2′-Methyliminodiethanol, N,N-Bis(2-hydroxyethyl) methylamine,
N-methyl-2,2'-iminodiethanol
119.16 4.911
8 Ethylene glycol (EG) 24 HOCH2CH2OH 1,2-Ethanediol 62.07 3.176
9 Diethanolamine (DEA) 25 HN(CH2CH2OH)2 2,2′-Iminodiethanol, Bis(2-hydroxyethyl)amine 105.14 4.437
10 Triethanolamine (TEA) 26 (HOCH2CH2)3N 2,2′,2′′-Nitrilotriethanol, Tris(2-hydroxyethyl)amine 149.19 5.040
11 2-(2-aminoethoxy)ethanol (DGA) 27 NH2CH2CH2OCH2CH2OH Diethylene glycolamine 105.14 4.772
12 1-[3-(Dimethylamino)propyl]piperazine 31 C9H21N3 N,N-Dimethyl-1-piperazinepropanamine, N,N-Dimethyl-3-
piperazinopropylamine
171.28 4.567
13 1-[2-(Dimethylamino)ethyl]piperazine 32 C8H19N3 N,N-Dimethyl-1-piperazineethanamine, N,N-Dimethyl-2-piperazinoethylamine
157.26 4.627
14 2-Methoxyethanol 34 CH3OCH2CH2OH Ethylene glycol monomethyl ether, Methyl Cellosolve, Methyl
glycol
76.09 3.745
15 Monoetanolamine (MEA) 36 NH2CH2CH2OH 2-Aminoethanol, 2-Aminoethyl alcohol, Ethanolamine
61.08 4.824
16 1-(2-Hydroxyethyl)piperazine 42 C6H14N2O 2-Piperazinoethanol, Piperazine-1-ethanol 130.19 4.912
17 1-Methylpiperazine 43 C5H12N2 ….. 100.16 5.791
18 Piperazine 44 C4H10N2 1,4-Diazacyclohexane, Diethylenediamine 86.14 5.158
19 Acetone 45 C3H6O Dimethylketone 58.08 6.092
20 Ethanol 46 C2H6O Ethyl alcohol, Reagent alcohol, Ethyl alcohol 46.07 4.117
21 2-Amino-2-methyl-1-propanol 50 (CH3)2C(NH2)CH2OH β-Aminoisobutyl alcohol, AMP 100, AMP 75, AMP 90, AMP 89.14 4.991
22 Water 51 H2O ------- 18.00 2.601
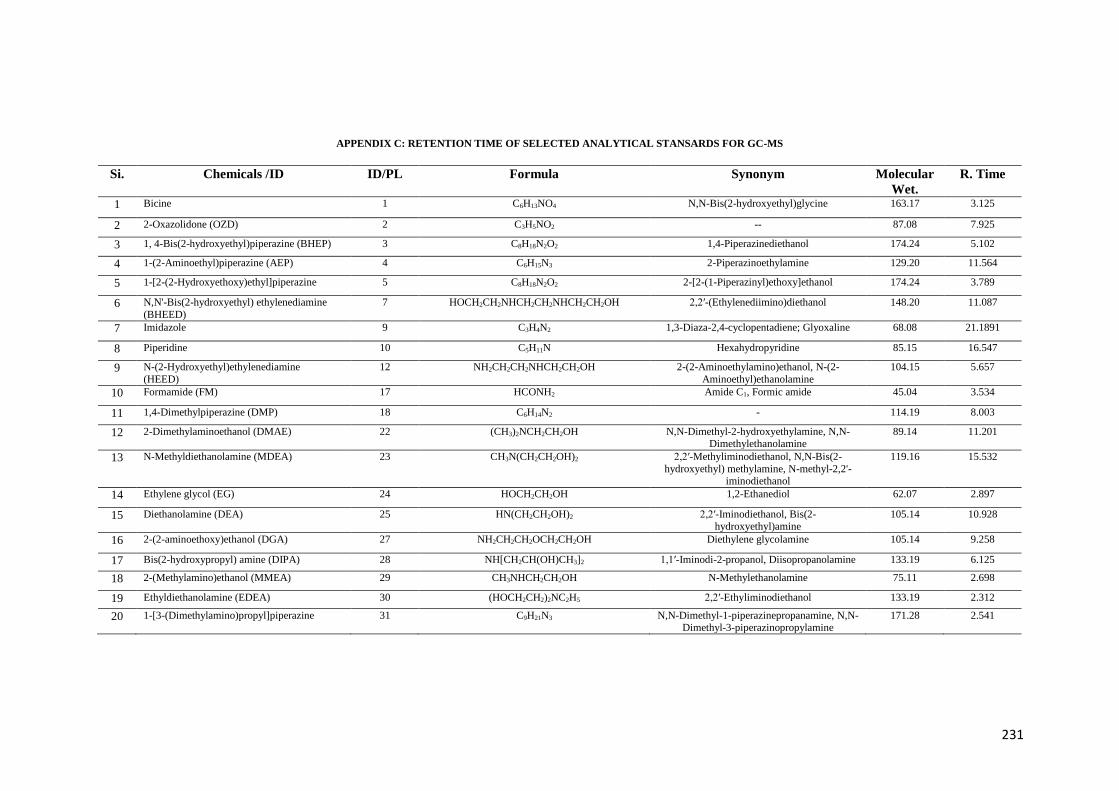
231
APPENDIX C: RETENTION TIME OF SELECTED ANALYTICAL STANSARDS FOR GC-MS
Si. Chemicals /ID ID/PL Formula Synonym Molecular
Wet.
R. Time
1 Bicine 1 C6H13NO4 N,N-Bis(2-hydroxyethyl)glycine 163.17 3.125
2 2-Oxazolidone (OZD) 2 C3H5NO2 -- 87.08 7.925
3 1, 4-Bis(2-hydroxyethyl)piperazine (BHEP) 3 C8H18N2O2 1,4-Piperazinediethanol 174.24 5.102
4 1-(2-Aminoethyl)piperazine (AEP) 4 C6H15N3 2-Piperazinoethylamine 129.20 11.564
5 1-[2-(2-Hydroxyethoxy)ethyl]piperazine 5 C8H18N2O2 2-[2-(1-Piperazinyl)ethoxy]ethanol 174.24 3.789
6 N,N'-Bis(2-hydroxyethyl) ethylenediamine
(BHEED)
7 HOCH2CH2NHCH2CH2NHCH2CH2OH 2,2′-(Ethylenediimino)diethanol 148.20 11.087
7 Imidazole 9 C3H4N2 1,3-Diaza-2,4-cyclopentadiene; Glyoxaline 68.08 21.1891
8 Piperidine 10 C5H11N Hexahydropyridine 85.15 16.547
9 N-(2-Hydroxyethyl)ethylenediamine
(HEED)
12 NH2CH2CH2NHCH2CH2OH 2-(2-Aminoethylamino)ethanol, N-(2-
Aminoethyl)ethanolamine
104.15 5.657
10 Formamide (FM) 17 HCONH2 Amide C1, Formic amide 45.04 3.534
11 1,4-Dimethylpiperazine (DMP) 18 C6H14N2 - 114.19 8.003
12 2-Dimethylaminoethanol (DMAE) 22 (CH3)2NCH2CH2OH N,N-Dimethyl-2-hydroxyethylamine, N,N-Dimethylethanolamine
89.14 11.201
13 N-Methyldiethanolamine (MDEA) 23 CH3N(CH2CH2OH)2 2,2′-Methyliminodiethanol, N,N-Bis(2-
hydroxyethyl) methylamine, N-methyl-2,2'-iminodiethanol
119.16 15.532
14 Ethylene glycol (EG) 24 HOCH2CH2OH 1,2-Ethanediol 62.07 2.897
15 Diethanolamine (DEA) 25 HN(CH2CH2OH)2 2,2′-Iminodiethanol, Bis(2-
hydroxyethyl)amine
105.14 10.928
16 2-(2-aminoethoxy)ethanol (DGA) 27 NH2CH2CH2OCH2CH2OH Diethylene glycolamine 105.14 9.258
17 Bis(2-hydroxypropyl) amine (DIPA) 28 NH[CH2CH(OH)CH3]2 1,1′-Iminodi-2-propanol, Diisopropanolamine 133.19 6.125
18 2-(Methylamino)ethanol (MMEA) 29 CH3NHCH2CH2OH N-Methylethanolamine 75.11 2.698
19 Ethyldiethanolamine (EDEA) 30 (HOCH2CH2)2NC2H5 2,2′-Ethyliminodiethanol 133.19 2.312
20 1-[3-(Dimethylamino)propyl]piperazine 31 C9H21N3 N,N-Dimethyl-1-piperazinepropanamine, N,N-Dimethyl-3-piperazinopropylamine
171.28 2.541

232
APPENDIX C: CONTINUED
Si. Chemicals /ID ID/PL Formula Synonym Molecular
Wet.
R. Time
21 1-[2-(Dimethylamino)ethyl]piperazine 32 C8H19N3 N,N-Dimethyl-1-piperazineethanamine, N,N-
Dimethyl-2-piperazinoethylamine
157.26 1.240
22 N, N‟-Bis(hydroxyethyl)-ethylenediamine 35 (HOC2H4)2N-C2H4-NH2 2,2′-(Ethylenediimino)diethanol 148.20 1.997
23 Monoetanolamine (MEA) 36 NH2CH2CH2OH 2-Aminoethanol,
2-Aminoethyl alcohol, Ethanolamine
61.08 1.521
24 N-(hydroxyethyl) ethyleneimine (HEM) 41 C4H9NO 1-(2-Hydroxyethyl) ethylenimine 87.12 1.751
25 1-(2-Hydroxyethyl)piperazine (HEP) 42 C6H14N2O 2-Piperazinoethanol, Piperazine-1-ethanol 130.19 17.231
26 1-Methylpiperazine (MP) 43 C5H12N2 ….. 100.16 5.087
27 Piperazine (PZ) 44 C4H10N2 1,4-Diazacyclohexane, Diethylenediamine 86.14 16.012
28 2-Amino-2-methyl-1-propanol (AMP) 50 (CH3)2C(NH2)CH2OH β-Aminoisobutyl alcohol, AMP 100, AMP 75,
AMP 90
89.14 9.913
29 Ethyl Urea (EU) 54 C3H8N2O -- 90.68 13.125
30 2-Methylaminoethanol (MAE) 55 (CH3)NCH2CH2OH N-Methylethanolamine 75.11 14.201
31 Ethyl 1-piperazinecarboxylate (EPC) 15 C7H14N2O2 1-Ethoxycarbonylpiperazine, Piperazine-1-
carboxylic acid ethyl ester
158.20 18.199
32 Glycolic acid (GA) 56 HOCH2COOH Hydroxyacetic acid 76.05 15.013
33 Ethylenediamine 52 C2H8N2 1,2-Diaminoethane 60.10 5.019
34 N-Formylpiperazine 53 C5H10N2O Piperazine-1-carboxaldehyde 114.15 8.712
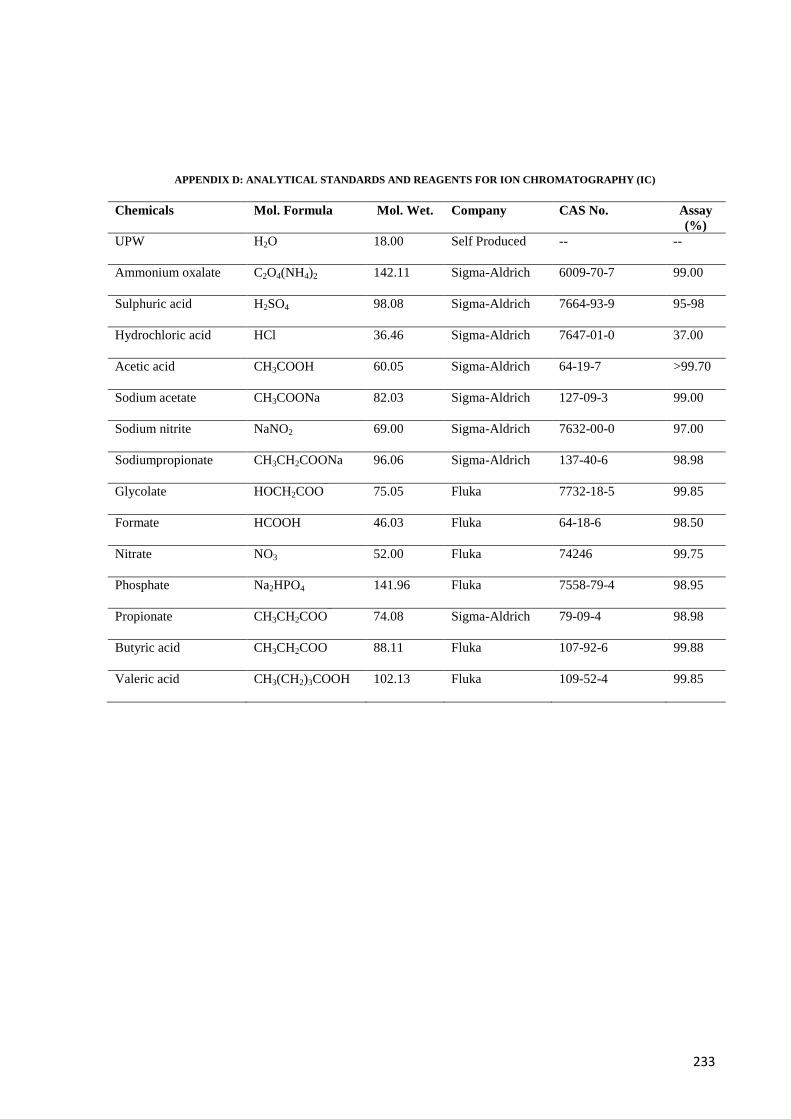
233
APPENDIX D: ANALYTICAL STANDARDS AND REAGENTS FOR ION CHROMATOGRAPHY (IC)
Chemicals Mol. Formula Mol. Wet. Company CAS No. Assay
(%)
UPW H2O 18.00 Self Produced -- --
Ammonium oxalate C2O4(NH4)2 142.11 Sigma-Aldrich 6009-70-7 99.00
Sulphuric acid H2SO4 98.08 Sigma-Aldrich 7664-93-9 95-98
Hydrochloric acid HCl 36.46 Sigma-Aldrich 7647-01-0 37.00
Acetic acid CH3COOH 60.05 Sigma-Aldrich 64-19-7 >99.70
Sodium acetate CH3COONa 82.03 Sigma-Aldrich 127-09-3 99.00
Sodium nitrite NaNO2 69.00 Sigma-Aldrich 7632-00-0 97.00
Sodiumpropionate CH3CH2COONa 96.06 Sigma-Aldrich 137-40-6 98.98
Glycolate HOCH2COO¯
75.05 Fluka 7732-18-5 99.85
Formate HCOOH 46.03 Fluka 64-18-6 98.50
Nitrate NO3¯
52.00 Fluka 74246 99.75
Phosphate Na2HPO4
141.96 Fluka 7558-79-4 98.95
Propionate CH3CH2COO¯
74.08 Sigma-Aldrich 79-09-4 98.98
Butyric acid CH3CH2COO¯ 88.11 Fluka 107-92-6 99.88
Valeric acid CH3(CH2)3COOH 102.13 Fluka 109-52-4 99.85
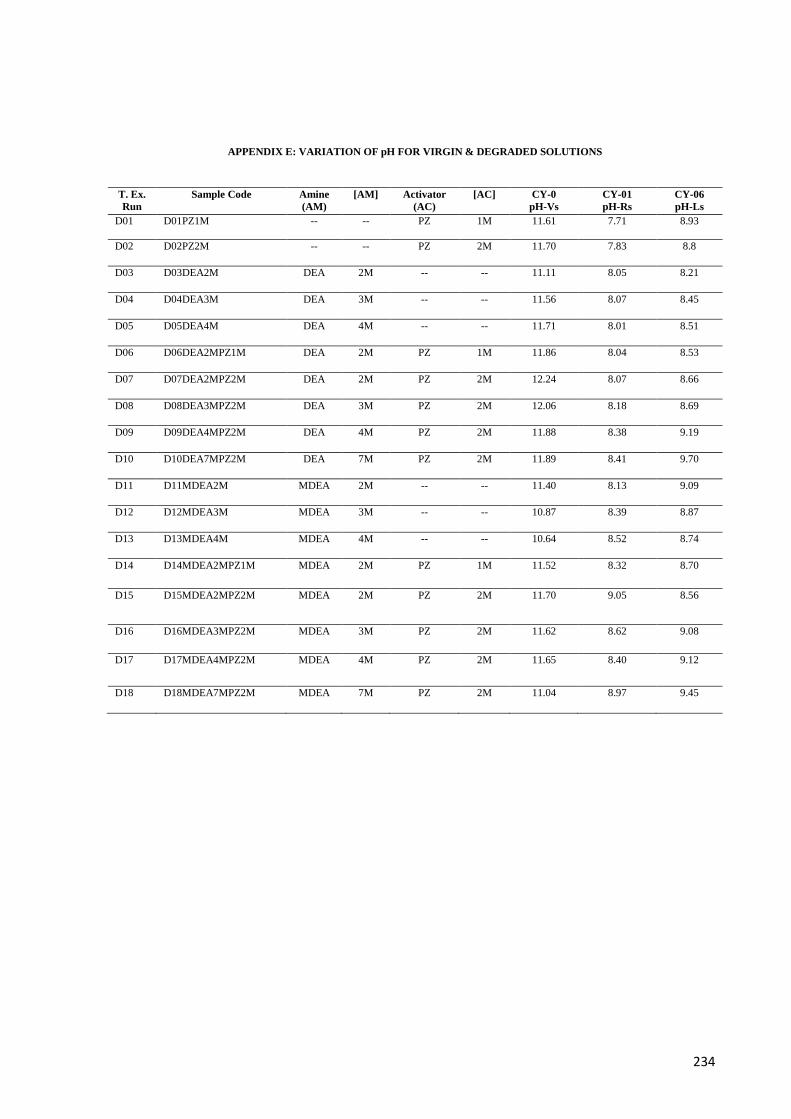
234
APPENDIX E: VARIATION OF pH FOR VIRGIN & DEGRADED SOLUTIONS
T. Ex.
Run
Sample Code Amine
(AM)
[AM] Activator
(AC)
[AC] CY-0
pH-Vs
CY-01
pH-Rs
CY-06
pH-Ls
D01 D01PZ1M -- -- PZ 1M 11.61 7.71 8.93
D02 D02PZ2M -- -- PZ 2M 11.70 7.83 8.8
D03 D03DEA2M DEA 2M -- -- 11.11 8.05 8.21
D04 D04DEA3M DEA 3M -- -- 11.56 8.07 8.45
D05 D05DEA4M DEA 4M -- -- 11.71 8.01 8.51
D06 D06DEA2MPZ1M DEA 2M PZ 1M 11.86 8.04 8.53
D07 D07DEA2MPZ2M DEA 2M PZ 2M 12.24 8.07 8.66
D08 D08DEA3MPZ2M DEA 3M PZ 2M 12.06 8.18 8.69
D09 D09DEA4MPZ2M DEA 4M PZ 2M 11.88 8.38 9.19
D10 D10DEA7MPZ2M DEA 7M PZ 2M 11.89 8.41 9.70
D11 D11MDEA2M MDEA 2M -- -- 11.40 8.13 9.09
D12 D12MDEA3M MDEA 3M -- -- 10.87 8.39 8.87
D13 D13MDEA4M MDEA 4M -- -- 10.64 8.52 8.74
D14 D14MDEA2MPZ1M MDEA 2M PZ 1M 11.52 8.32 8.70
D15 D15MDEA2MPZ2M MDEA 2M PZ 2M 11.70 9.05 8.56
D16 D16MDEA3MPZ2M MDEA 3M PZ 2M 11.62 8.62 9.08
D17 D17MDEA4MPZ2M MDEA 4M PZ 2M 11.65 8.40 9.12
D18 D18MDEA7MPZ2M MDEA 7M PZ 2M 11.04 8.97 9.45
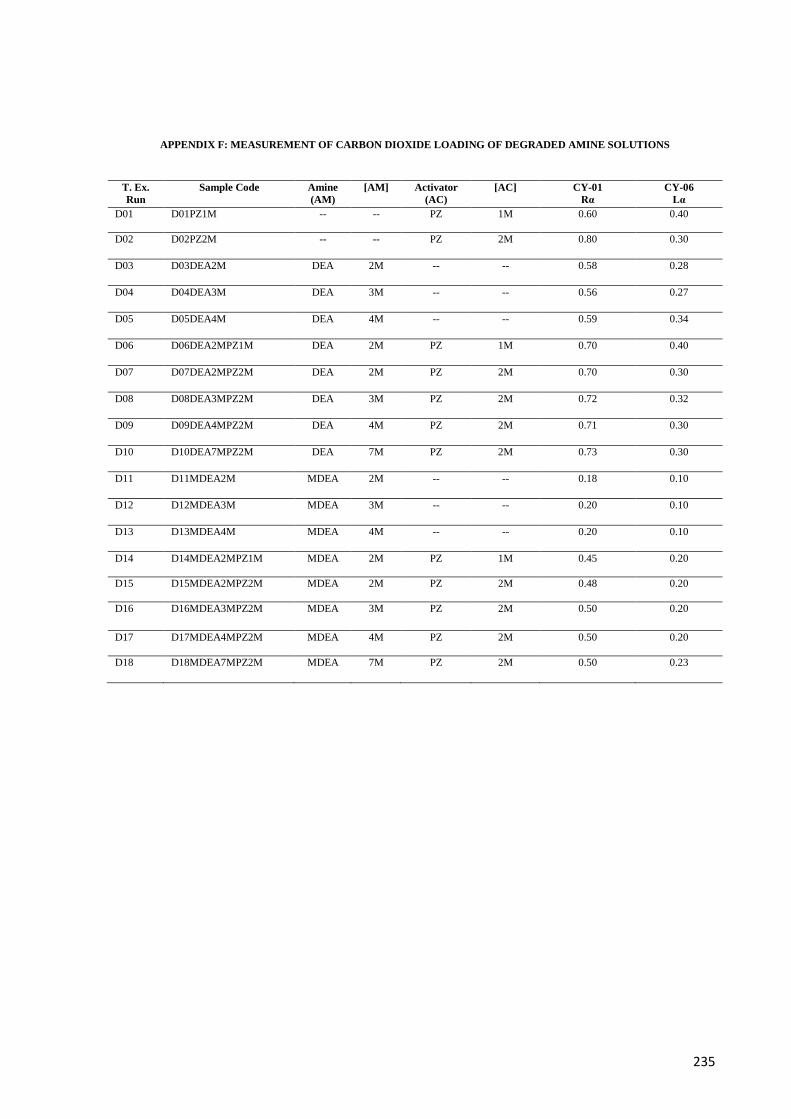
235
APPENDIX F: MEASUREMENT OF CARBON DIOXIDE LOADING OF DEGRADED AMINE SOLUTIONS
T. Ex.
Run
Sample Code Amine
(AM)
[AM] Activator
(AC)
[AC] CY-01
Rα
CY-06
Lα
D01 D01PZ1M -- -- PZ 1M 0.60 0.40
D02 D02PZ2M -- -- PZ 2M 0.80 0.30
D03 D03DEA2M DEA 2M -- -- 0.58 0.28
D04 D04DEA3M DEA 3M -- -- 0.56 0.27
D05 D05DEA4M DEA 4M -- -- 0.59 0.34
D06 D06DEA2MPZ1M DEA 2M PZ 1M 0.70 0.40
D07 D07DEA2MPZ2M DEA 2M PZ 2M 0.70 0.30
D08 D08DEA3MPZ2M DEA 3M PZ 2M 0.72 0.32
D09 D09DEA4MPZ2M DEA 4M PZ 2M 0.71 0.30
D10 D10DEA7MPZ2M DEA 7M PZ 2M 0.73 0.30
D11 D11MDEA2M MDEA 2M -- -- 0.18 0.10
D12 D12MDEA3M MDEA 3M -- -- 0.20 0.10
D13 D13MDEA4M MDEA 4M -- -- 0.20 0.10
D14 D14MDEA2MPZ1M MDEA 2M PZ 1M 0.45 0.20
D15 D15MDEA2MPZ2M MDEA 2M PZ 2M 0.48 0.20
D16 D16MDEA3MPZ2M MDEA 3M PZ 2M 0.50 0.20
D17 D17MDEA4MPZ2M MDEA 4M PZ 2M 0.50 0.20
D18 D18MDEA7MPZ2M MDEA 7M PZ 2M 0.50 0.23
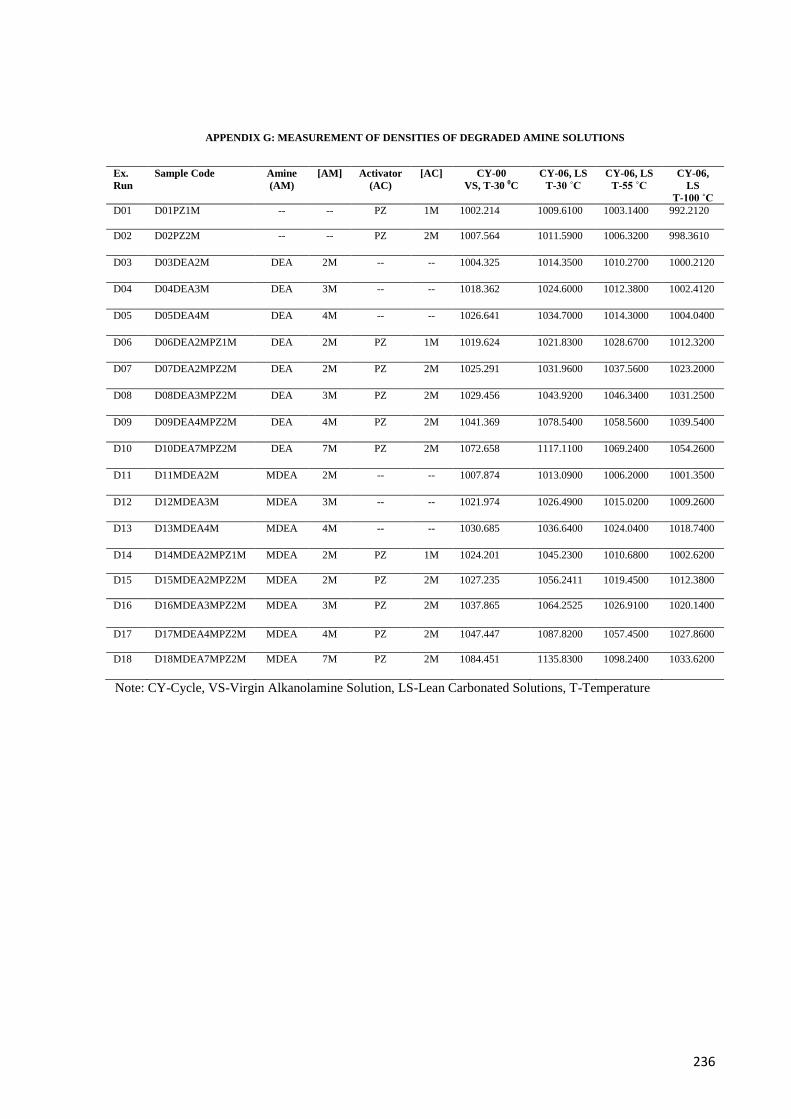
236
APPENDIX G: MEASUREMENT OF DENSITIES OF DEGRADED AMINE SOLUTIONS
Ex.
Run
Sample Code Amine
(AM)
[AM] Activator
(AC)
[AC] CY-00
VS, T-30 0C
CY-06, LS
T-30 ˚C
CY-06, LS
T-55 ˚C
CY-06,
LS
T-100 ˚C
D01 D01PZ1M -- -- PZ 1M 1002.214 1009.6100 1003.1400 992.2120
D02 D02PZ2M -- -- PZ 2M 1007.564 1011.5900 1006.3200 998.3610
D03 D03DEA2M DEA 2M -- -- 1004.325 1014.3500 1010.2700 1000.2120
D04 D04DEA3M DEA 3M -- -- 1018.362 1024.6000 1012.3800 1002.4120
D05 D05DEA4M DEA 4M -- -- 1026.641 1034.7000 1014.3000 1004.0400
D06 D06DEA2MPZ1M DEA 2M PZ 1M 1019.624 1021.8300 1028.6700 1012.3200
D07 D07DEA2MPZ2M DEA 2M PZ 2M 1025.291 1031.9600 1037.5600 1023.2000
D08 D08DEA3MPZ2M DEA 3M PZ 2M 1029.456 1043.9200 1046.3400 1031.2500
D09 D09DEA4MPZ2M DEA 4M PZ 2M 1041.369 1078.5400 1058.5600 1039.5400
D10 D10DEA7MPZ2M DEA 7M PZ 2M 1072.658 1117.1100 1069.2400 1054.2600
D11 D11MDEA2M MDEA 2M -- -- 1007.874 1013.0900 1006.2000 1001.3500
D12 D12MDEA3M MDEA 3M -- -- 1021.974 1026.4900 1015.0200 1009.2600
D13 D13MDEA4M MDEA 4M -- -- 1030.685 1036.6400 1024.0400 1018.7400
D14 D14MDEA2MPZ1M MDEA 2M PZ 1M 1024.201 1045.2300 1010.6800 1002.6200
D15 D15MDEA2MPZ2M MDEA 2M PZ 2M 1027.235 1056.2411 1019.4500 1012.3800
D16 D16MDEA3MPZ2M MDEA 3M PZ 2M 1037.865 1064.2525 1026.9100 1020.1400
D17 D17MDEA4MPZ2M MDEA 4M PZ 2M 1047.447 1087.8200 1057.4500 1027.8600
D18 D18MDEA7MPZ2M MDEA 7M PZ 2M 1084.451 1135.8300 1098.2400 1033.6200
Note: CY-Cycle, VS-Virgin Alkanolamine Solution, LS-Lean Carbonated Solutions, T-Temperature

237
APPENDIX H: MEASUREMENT OF VISCOSITIES (µ) OF DEGRADED AMINE SOLUTIONS
T. Ex.
Run
Sample Code Amine
(AM)
[AM] Activator
(AC)
[AC] CY-00
VS
CY-06, LS
T-30˚C
CY-06, LS
T-55 ˚C
CY-06, LS
T-100 ˚C
D01 D01PZ1M -- -- PZ 1M 1.127 1.9800 1.4800 1.1200
D02 D02PZ2M -- -- PZ 2M 1.456 2.1600 1.9200 1.3200
D03 D03DEA2M DEA 2M -- -- 1.745 1.9500 1.4500 1.1000
D04 D04DEA3M DEA 3M -- -- 2.852 3.0000 2.7400 1.6200
D05 D05DEA4M DEA 4M -- -- 3.984 4.9500 3.4300 2.3000
D06 D06DEA2MPZ1M DEA 2M PZ 1M 2.856 3.2100 2.8000 1.6600
D07 D07DEA2MPZ2M DEA 2M PZ 2M 4.321 5.8800 4.2800 2.8100
D08 D08DEA3MPZ2M DEA 3M PZ 2M 8.652 10.5900 7.9400 6.2800
D09 D09DEA4MPZ2M DEA 4M PZ 2M 12.654 15.4300 11.5600 8.1900
D10 D10DEA7MPZ2M DEA 7M PZ 2M 28.124 32.9900 26.8800 19.470
D11 D11MDEA2M MDEA 2M -- -- 2.288 2.2500 1.7600 1.2000
D12 D12MDEA3M MDEA 3M -- -- 3.948 3.7800 2.9800 1.9200
D13 D13MDEA4M MDEA 4M -- -- 7.782 7.0500 5.2300 3.7000
D14 D14MDEA2MPZ1M MDEA 2M PZ 1M 3.905 4.3500 3.3200 2.2000
D15 D15MDEA2MPZ2M MDEA 2M PZ 2M 4.102 8.2600 6.8700 4.1300
D16 D16MDEA3MPZ2M MDEA 3M PZ 2M 9.230 14.0700 10.7600 7.8600
D17 D17MDEA4MPZ2M MDEA 4M PZ 2M 20.062 27.6200 22.3600 12.6900
D18 D18MDEA7MPZ2M MDEA 7M PZ 2M 32.652 52.6200 44.5800 27.9300
Note: CY-Cycle, VS-Virgin Alkanolamine Solution, LS-Lean Carbonated Solutions, T-Temperature
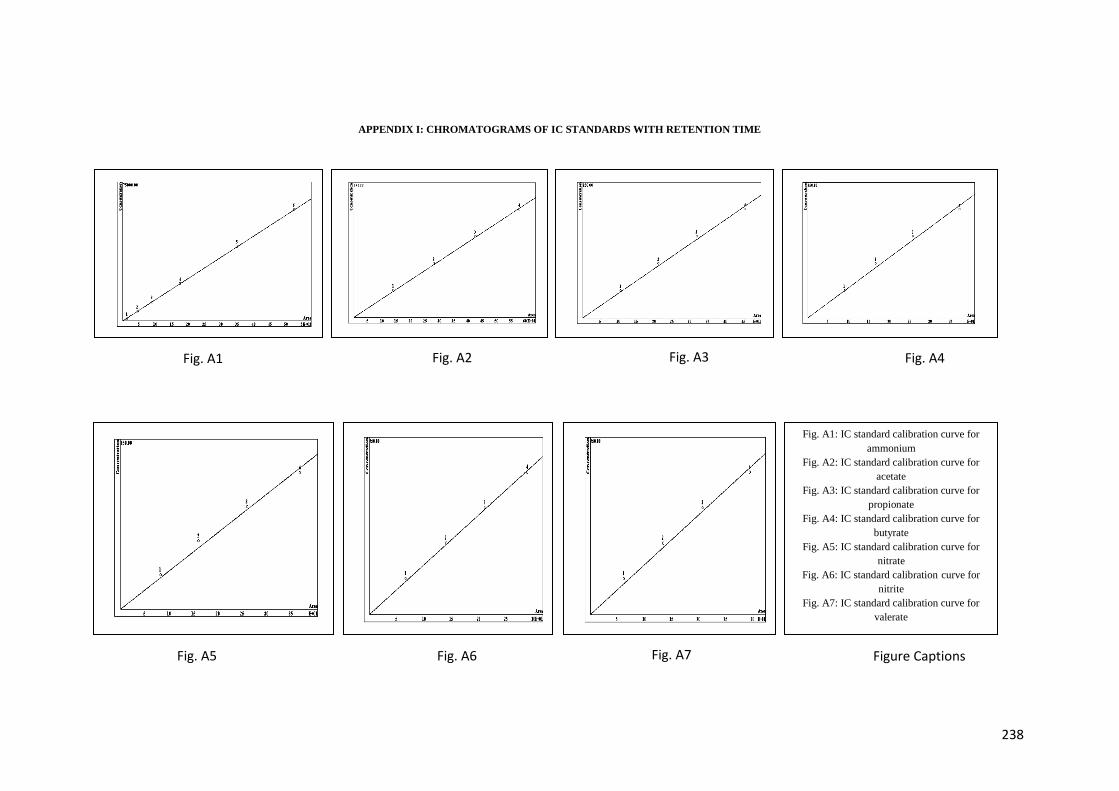
238
APPENDIX I: CHROMATOGRAMS OF IC STANDARDS WITH RETENTION TIME
Fig. A1: IC standard calibration curve for
ammonium
Fig. A2: IC standard calibration curve for
acetate
Fig. A3: IC standard calibration curve for
propionate
Fig. A4: IC standard calibration curve for
butyrate
Fig. A5: IC standard calibration curve for
nitrate
Fig. A6: IC standard calibration curve for nitrite
Fig. A7: IC standard calibration curve for
valerate
Fig. A1 Fig. A2 Fig. A3 Fig. A4
Fig. A5 Fig. A6 Fig. A7 Figure Captions
239
APPENDIX J: PUBLICATIONS RELATED TO THE PRESENT WORK
Research Articles
M. S. Islam, R. Yusoff, B. S. Ali, M. N. Islam, M. H. Chakrabarti. Degradation studies of amines and
alkanolamines during sour gas treatment process, International Journal of the Physical Sciences, 2011, 6(1): 5883-
5896 [ISI Cited Publication, Q2]
Md. Sakinul Islam, Brahim Si Ali*, Rozita Yusoff. Comparative Study on degradation studies of Diethanolamine
induced by carbon dioxide (To be Submitted in the Journal of Industrial and Engineering Chemistry, ISI Cited
Publication)
Conferences Presentation
Md. Sakinul Islam, Brahim Si Ali*, Rozita Yusoff, Mohammad Harun Chakrabarti. Identification of Products Resulting
from Carbon Dioxide Induced Degradation of Diethanolamine During Sour Gas Sweetening Process. AUN/SEED-Net, the
4th Regional Conference on Chemical Engineering, held on 9-10 February, 2012, pp. 99 (Paper ID Sep. 05).
Md. Sakinul Islam, Rozita Yusoff, Brahim Si Ali*, Degradation Reaction Mechanism of Amines and Alkanolamines in
Sour Gas Processing Plant, Asia Pacific Offshore Conference -2010, (APOC 2010), held on 13-14 December, 2010,
organized by UTM, Malaysia.
Md. Sakinul Islam, Rozita Yusoff, Brahim Si Ali*, Role of acids in the degradation of alkanolamines during CO2 and H2S
removal process, International conference on marine technology (MARTEC 2010; ISSN-22203117), held on 11-12
December, 2010, Dhaka, Bangladesh, Abstract no MARTEC-119, pp. 241-247.
Md. Sakinul Islam, Rozita Yusoff, Brahim Si Ali*, Degradation Studies of Amines and Alkanolamines During Sour Gas
Absorption and Stripping System in the natural gas industry, Third International Conference on Science & Technology
(ICSTIE 2010), UiTM, Penang, Malaysia, December 16-17, 2010, pp-15.
Md. Sakinul Islam, Rozita Yusoff, Brahim Si Ali*, Degradation reaction of Amines and Alkanolamines in sour Gas
Processing Plant, International Conference on Sustainable Mobility 2010, (ICSM2010), UTM, Malaysia December 1-3,
2010.
Others Publications
Mook, W. T., Chakrabarti, M. H., Aroua, M. K., Khan, G. M. A., Ali, B. S., Islam, M. S., and Hassan, M. A. A., Removal of
total ammonia nitrogen (TAN), nitrate and total organic carbon (TOC) from aquaculture waste water using electrochemical
technology: A review, Desalination (2011), doi:10.1016/j.desal.2011.09.029. [ISI]
M. S. Islam, R. Yusoff and B. S. Ali, Role of acid and heat stable salt in the degradation process of alkanolamine during
sour gas sweetening process, Engineering e-Transaction (ISSN 1823-6379), Electronic Journal of University of Malaya
(EJUM), Vol. 5, No. 2, December 2010, pp 53-60.
M. S. Islam, R. Yusoff and B. S. Ali, Degradation studies of amines and alkanolamines during CO2 absorption and stripping
system, Engineering e-Transaction (ISSN 1823-6379), Electronic Journal of University of Malaya (EJUM) Vol. 5, No. 2,
December 2010, pp 97-109.
Mohammed Harun Chakrabarti, Mehmood Ali, Jafar Nazir Usmani, Nasim Ahmed Khan, Diya'uddeen Basheer Hasan, Md.
Sakinul Islam, Abdul Aziz Abdul Raman, Rozita Yusoff and Mohammad Faisal Irfan. Status of biodiesel research and
development in Pakistan, Renewable & Sustainable Energy Reviews, 16 (2012), pp. 4396-4405 [ISI]
Muhammad Saleem, Mohammed Harun Chakrabarti, Diya‟uddeen Basheer Hasan, Md. Sakinul Islam, Rozita Yusoff,
Sayed Ahmad Hajimolana, Mohd. Azlan Hussain, Gazi Md. Arifuzzaman Khan and Brahim Si Ali, On Site Electrochemical
Production of Sodium Hypochlorite Disinfactant for a Power Plant Utilizing Seawater, Int. J. Electrochem. Sci., 7(2012): pp.
3929-3938. [ISI]
240
APPENDIX K: AUTHOR VITA
Mr. Md. Sakinul Islam was born on 18 August, 1979 in Village- Nando, P.O- Walia, P.S-
Lalpur, Natore, Bangladesh to Festus Mr. Md. Year Uddin and Mrs. Sahera Begum. He graduated
with a Bachelor of Science and Masters of Science degrees in Applied Chemistry and Chemical
Technology with excellent academic background from Islamic University, Kushtia 7003, Bangladesh
in 2003 and 2005 respectively. After a year of teaching service, he entered as an MPhil researcher in
the Department of Chemistry, under the Faculty of Engineering in BUET, Dhaka, Bangladesh and
finished his research on June, 2009. The MPhil degree was awarded on October 25, 2011. During his
MPhil Studies in June, 2009 he was received an offer to join in MEngSc program at the University of
Malaya, Kuala Lumpur, Malaysia and started the degree in July, 2009 under the scholastic supervision
of Dr. Brahim Si Ali and Dr. Rozita Yusoff in the Dept. of Chemical Engineering, Faculty of
Engineering.
This MEngSc thesis was typed by the author and the university is fully concern about this hypothesis
which entitled as:
“CHARACTERIZATION OF DEGRADATION PRODUCTS OF ACTIVATED
DIETHANOLAMINE AND METHYLDIETHANOLAMINE DURING CARBON DIOXIDE
ABSORPTION AND DESORPTION PROCESSES”
Author‟s Permanent Address: Village- Nando, P.O- Walia, P.S- Lalpur and District- Natore,
Bangladesh. E-mail: [email protected] or [email protected]


![Solubility of CO2 in Aqueous Solutions of Diethanolamine ...€¦ · 2 are absorption with chemical solvents such as alkanolamines [4,5]. Diethanolamine (DEA) is one of the alkanolamine](https://static.fdocuments.in/doc/165x107/5f30bd3df0b38f5b1d7f5ad2/solubility-of-co2-in-aqueous-solutions-of-diethanolamine-2-are-absorption-with.jpg)


![ENSEMBLE TRAVERTINO ALEMANIA IntegrantesAPAC-2008-Prog].pdfVII Festival Internacional de Música Renacentista y Barroca Americana “Misiones de Chiquitos” Cello Barroco James Bush](https://static.fdocuments.in/doc/165x107/5e2d1dfd75322c1699093300/ensemble-travertino-alemania-integrantes-apac-2008-progpdf-vii-festival-internacional.jpg)