
Comparison of Indoor and Outdoor Bioaerosols in Poultry Farming

Characterization of bioaerosols in Northeast Indiain terms of culturable biological entities alongwith inhalable, thoracic and alveolar particles
BINITA PATHAK1,2, DEBAJIT BORAH
3,*, ANKITA KHATANIAR4, P K BHUYAN
2
and A K BURAGOHAIN3
1Department of Physics, Dibrugarh University, Dibrugarh 786 004, India.
2Centre for Atmospheric Studies, Dibrugarh University, Dibrugarh 786 004, India.3Department of Biotechnology, The Assam Royal Global University, Guwahati 781 035, India.
4Centre for Biotechnology and Bioinformatics, Dibrugarh University, Dibrugarh 786 004, India.*Corresponding author. e-mail: [email protected]
MS received 31 May 2019; revised 4 February 2020; accepted 23 March 2020
Effort was made to analyse the biological components along with inhalable, thoracic and alveolic particlesin aerosol samples collected from nine distinct locations of Northeast India during post-monsoon season(October–November) for the very Brst time. Microscopic analysis reveals the presence of 70–90% of non-biological particles followed respectively by pollens (9–18%), animal debris (1–12%) and fungal spores(1–6%). The concentration of bacteria in air sample ranges from 45.5 to 645.84 CFU/m3. All the bacterialisolates showed sensitivity against broad (Chloramphenicol and Ampicillin) and narrow (Vancomycinand Erythromycin) spectrum antibiotics which indicates lesser threat to human health. Moreover, theconcentration of microbial content in the bioaerosol samples are less compared to some of the reportedvalues in other parts of India. The predominant microbial genera in the collected bioaerosol samples wereidentiBed as Gram positive Diplobacilli sp. followed by Diplococci sp. Pollens of 10–20 lm diameter,which are mostly considered as potential allergens, contribute only up to 20% of total pollen content inthe bioaerosol sample collected from various locations indicating healthier air.
Keywords. Bioaerosols; Diplobacilli sp.; Diplococci sp.; pollen grains; particulate matter.
1. Introduction
Particles of biological origin and droplets (e.g.,bacteria, can sustain inside a droplet in the atmo-sphere) suspended in air are termed as bioaerosols(Brandl et al. 2008; Despr�es et al. 2012; Fr€ohlich-Nowoisky et al. 2016). In a broader perspective, themajor constituents of bioaerosols may be subdi-vided into viable and non-viable components.Microbes, pollens, fungal spores (including bothpathogenic and non-pathogenic components), etc.,constitute the viable part. On the other hand,
non-biological particles, fragments of animal orinsect organs, dead cells and cell fragments, pep-tidoglycans, endotoxins, etc., represent the non-viable part (Douwes et al. 2003; Liu et al. 2018).Depending on the type and source, bioaerosolparticles can range in size from approximately 0.02to 100 lm in diameter (Brandl et al. 2008). Whilstviruses are usually smaller than 0.2 lm; bacteria,spores, and fungal cells vary within the size rangeof 0.25–60 lm. Diameters of pollens originatingfrom various gymnosperms and angiosperms rangefrom 5 to 300 lm, whereas small arthropods
J. Earth Syst. Sci. (2020) 129:141 � Indian Academy of Scienceshttps://doi.org/10.1007/s12040-020-01406-z (0123456789().,-volV)(0123456789().,-volV)
(e.g., dust mites) transported through the atmo-sphere, also termed as ‘aero-plankton’ may reachsizes up to 1 mm. Bioaerosols also frequentlyaggregates into larger entities which show a sig-nificant variation in size up to hundreds ofmicrometers (Fr€ohlich-Nowoisky et al. 2016).Bioaerosols are most abundant in the lower part ofthe atmosphere, the planetary boundary layer(PBL). Turbulent small-scale transport is respon-sible for most of the bioaerosols that arises from theEarth’s surface. Natural sources such as vegeta-tion, soil, moisture, etc., and particulate matteremitted due to anthropogenic activities such asconstruction, industries, automobiles, variouswastes, etc., form a unique combination of bioaero-sols within a particular location (Despr�es et al.2012; Ghosh et al. 2015; N�unez et al. 2016). Thehydrodynamic and kinetic factors like clouds, duststorms and air currents are some of the factorsresponsible for the transport of bioaerosols acrossPBL. However, how the transport via atmosphereaAects the abundance of micro-organisms alongwith their growth and proliferation is yet to be wellunderstood (Fr€ohlich-Nowoisky et al. 2016). Thefate of bioaerosols is dependent on their biologicalcomposition, chemical makeup as well as the pre-vailing meteorological parameters (inCuenced bylarge-scale Cow Belds, geographical locations andlocal topography) to which they are exposed (Mohr2007). The most significant environmental factorsinCuencing viability of bioaerosols are relativehumidity, solar irradiance, temperature, oxygenconcentration, etc. For example, airborne bacteriaand fungi strive in more humid conditions andmore moisture can help in rapid replication andpropagation of the same (Despr�es et al. 2012;Ghosh et al. 2015; N�unez et al. 2016).Bioaerosols significantly inCuence indoor as well
as outdoor air quality. They inCuence the Earth’senergy budget by scattering and absorbing radia-tion and can initiate the formation of cloud dro-plets by acting as cloud condensation nuclei (CCN)and ice nuclei (IN) and thus aAects precipitation(Hauspie and Pagezy 2002; Heidi et al. 2003;Creamean et al. 2013; Fr€ohlich-Nowoisky et al.2016). Orographic precipitation due to ice nucleialso shows their impacts on mesoscale cloudensembles (Phillips et al. 2008; Creamean et al.2013). Pollen grains attract water at relativehumidity, well below 100% and thus might locallyact as CCN inCuencing the cloud formation whiledecaying vegetation and the associated bacteria(causing the decomposition of the vegetation) and
marine plankton may also act as excellent icenuclei (Jaenicke 2005). Bioaerosols play animportant role in spreading biological organismsand reproductive materials (pollens, spores, etc.)and they can cause or enhance human, animal andplant diseases. These are linked to many differentadverse health eAects ranging from infectious dis-eases to acute toxic eAects, allergies, asthma andeven cancer. Bacteria and fungi within the sizerange of 1–10 lm may reach the alveoli of lungsand aAect the human respiratory system. Bacterialbioaerosols may also cause human diseases such aspneumonia, tuberculosis, brucellosis, anthrax, Qfever, etc. (Arancibia et al. 2002); whereas, fungalbioaerosols are the etiological agents of respiratorydiseases like allergic rhinitis, asthma, etc. (Bushand Portnoy 2001). Hence, characterization ofbioaerosols in terms of the concentration of viablecomponents is a major area of interest (Ghosh et al.2015; Smets et al. 2016).In India, airborne bacterial species diversity in
Mumbai city was reported elucidating the role ofbacterial endotoxin in PM induced pro-inCamma-tory response (Gangamma 2014). The study alsorevelled the abundance of spore forming and ani-mal derived pathogens in the ambient air. Evenambient temperature also shows strong positivecorrelation with the abundance of bacteria, asbacterial population is largely dependent onambient temperature (Kumar et al. 2013). Sys-tematic survey on the impact of pollen on humanhealth was initiated in India long back at Calcuttain the year 1873. Later exhaustive studies on air-borne pollen types and their concentration werecarried out. As an outcome of these studies, someimportant pollen and fungal allergens were identi-Bed, quantiBed and characterized for their aller-genic properties from 18 different places in India.For instance, in Delhi, dominant pollen typesrecorded were grasses, cheno/amaranth, Ailanthus,Ricinus, Morus, Xanthium, Cannabis, Artemisiaand Holoptelea (Singh and Shivpuri 1971; Singhand Babu 1980; Malik et al. 1991). But in northeastIndia, no such extensive reports on the character-ization of biological aerosols are available except onpollens by Singh and Kumar (2004). In this region,pollen measurement was reported only fromGuwahati with dominant pollen types: Poaceae,Cheno, Amaranth, Asteraceae, Putranjiva, Man-gifera and Eucalyptus (Singh and Kumar 2004).Hence, there is a need of identiBcation and quan-tiBcation of pollens from as many locations aspossible from the above-mentioned human health
141 Page 2 of 13 J. Earth Syst. Sci. (2020) 129:141

perspective as well as from their climatic pointof view, i.e., their contribution to total aerosolloading in the atmosphere. However, climatechange has aAected allergenic plants and pollendistribution worldwide (D’Amato et al. 2014).The northeast India, even though this region
being clothed with 66% vegetation (Dikshit andDikshit 2014) is a huge source of primary (bacteria,virus, fungi, pollens, etc.) as well as secondary(SVOC emitted by vegetation can produce sec-ondary aerosols) bioaerosols, it is less explored interms of their characterization. Biological sourcesare found to emit *1150 tera grams of carbon peryear globally in the form of VOCs, the majority ofwhich are produced by plants (the main compoundbeing isoprene) and the remaining is produced byanimals, microbes and fungi (such as molds).However, VOC is beyond the scope of the presentstudy. Further, vegetation is a source of not onlythe airborne pollens but also the microbes as itserves as a breeding ground for variety of microbes(Lindow and Brandl 2003). Researchers have iso-lated various bacteria and fungi from plants as well(Matthysse 2018). However, these species have notbeen studied as a subset of atmospheric aerosols, interms of their abundance, evolution, dynamics,etc., so far particularly over the north-easternregion of India. Pathak et al. (2012) while dis-criminating different aerosol types based on longterm monitoring over Dibrugarh located in theupper Brahmaputra basin, have found major con-tribution from unidentiBed or mixed aerosol typesapart from the identiBed types: continental aver-age, marine continental average, urban industrialand biomass burning and desert dust. Anotherstudy revealed that despite of significant urban-ization and industrialization, Northeast Indiastands second highest in aerosol loading in southand southeast Asia (Pathak et al. 2016). Thisrequires proper investigation on aerosol sourcesspecially the natural aerosols from the huge vege-tation of the region. Otherwise, the backgroundaerosols, transported and local anthropogenicaerosols cannot result in observed appreciableamount of aerosol loading in the atmospheric col-umn. As such, it can be inferred that the bioaer-osols that originate from the huge vegetation ofNortheast India may form a significant portion ofaerosols belonging to the unidentiBed type, whichstipulates proper investigation. Further, due totheir diverse nature in terms of sizes, species, bio-logical properties and detection; the quantiBcationof bioaerosols becomes very essential, which in turn
leads to bioaerosol sampling, an active and yetchallenging research area (Mainelis 2019). How-ever, majority of such samplings are conducted inindoor environments and the same in outdoorenvironments have been rare and the data remainsinsufBcient particularly covering different seasons(Lee et al. 2016). Thus, the present study aiming atthe characterization and quantiBcation of bioaer-osols in various locations of the northeast Indianregion for the Brst time will contribute to globalbioaerosol knowledge in terms of both data andscience. This will also Bll up the existing gap indiscriminating the biological component fromcomposite atmospheric aerosols, study of this kindbeing very rare in India. Again, according to sev-eral reports, the rate of incidence of various dis-eases rises in the seasons when primary bioaerosolemission into the atmosphere attains peak level(D’Amato et al. 2015; Fr€ohlich-Nowoisky et al.2016). In addition, huge vegetation of the regioncan react with air pollution and environmentalconditions, thus acting as stimulant for plantallergenicity (Su�arez-Cervera et al. 2008). Thus,monitoring of bioaerosols and their identiBcationcan help to understand the cause and relationshipof bioaerosol generated health and environmentalissues. Northeast India, being one of the significantbiodiversity hotspot regions in the globe, serves asa natural laboratory to carry out such work. Yetagain, as the region is rich in bioaerosols as well asvulnerable to cloud formation with significant amountof cloud fraction ([50%) during March–Septemberevery year; the eAect of bioaerosols on the CCN orIN formation can be further extended based on thepresent Bndings.
2. Methods
2.1 Sampling sites and prevailing meteorology
Bioaerosol samples were collected from nine dis-tinct locations of Northeast India (Bgure 1, table 1)during the post monsoon season (25th October to13th November 2018) using a portable bioaerosolspectrometer and a spore sampler. The nine dis-tinct sites of northeastern India have chosen on thebasis of high vegetation cover to urban areas inorder to examine the differences in bioaerosolcharacteristics. The meteorological parameters:temperature, humidity, pressure, wind speedand direction were measured using a rainwiseportable weather system, US. Details of the nature
J. Earth Syst. Sci. (2020) 129:141 Page 3 of 13 141

of the sites along with meteorological conditionsduring the sampling days are presented in table 1.Also, the instruments and respective parametersare briefed in table 2. Bioaerosol research, includ-ing sampling methods needs to develop a morestandardized set of guidelines for protocols (Main-elis 2019). The samples were collected during11:00–15:00 h, when the meteorological parameters(like ambient temperature and solar irradiation)exhibit maximum Cuctuation and attain peak and
dilution of air takes place due to the atmosphericboundary layer dynamics.
2.2 Bioaerosol sampling
2.2.1 Portable bioaerosol spectrometer
Bioaerosol sampling is an integral part of any bio-aerosol investigation. Three principal samplingmethods:Bltration, impactionand liquid impingement
Figure 1. Study region showing the nine distinct locations of observation. Joypur, Dibru Saikhuwa, Kaziranga, Shillong, Namsai,Dibrugarh, Jorhat, Guwahati and Dimapurin, Northeast India.
Table 1. Geographical locations and climatic conditions of the sample collection sites.
Sampling
site Coordinates
Nature of
the site
Vegetation
type
Sampling
date
Sampling
duration
Temperature
(�C)
Relative
humidity
(%)
Wind speed
(km/h)
Dibrugarh 27.46�N;
94.91�EUrban Moderate 25.10.18 11:00–15:00 h 32 60 3
Dibru
Saikhowa
27�300N;
95�230ERural Dense 27.10.18 26 70 2
Namsai 27.64�N;
95.87�ESemi-rural Moderate 28.10.18 27 76 0
Jorhat 26.73�N;
94.15�EUrban Moderate 31.10.18 30 70 5
Joypur 27�130500N;
95�260300ERural Dense 4.11.18 22 90 9
Kaziranga 26.58�N;
93.42�ERural Dense 10.11.18 23 84 6
Guwahati 26.15�N;
91.66�EUrban Moderate 11.11.18 30 64 5
Shillong 25.67�N;
91.91�ERural Moderate 12.11.18 29 66 0
Dimapur 25.90�N;
93.72�EUrban Sparse 13.11.18 28 64 2
141 Page 4 of 13 J. Earth Syst. Sci. (2020) 129:141

are being widely used and these techniques areincorporated in sampling devices (Yoo et al. 2017).However, there are no standard techniques forthe same as it may vary from experiment toexperiment as per requirement (Wang et al. 2015).Also, practice infers that it is not even possible toculture 100% of the microbes present in bioaerosolsamples under laboratory conditions. The currentstudy was carried out by using a portable GRIMMPortable Laser Aerosol Spectrometer-11.B (GRIMMAerosolTechnikAinringGmbH&Co.KG.,Germany)which is a upgraded version of GRIMM 1.109 model(Grimm and Eatough 2009; Grimm 2010) for realtime monitoring of biotic and abiotic materials withimpactor and sample carrier. The spectrometer givesround the clock measurement of aerosols at 31 sizechannels in the size range 0.25–32 lm as well as theparticle count distribution in the unit particle/litreand also asmass concentration in the unit lg/m3. Themeasuring principle of the spectrometer is the lightscattering of single particles with a semiconductorlaser as light source of 683 nm wavelength. The mea-surement uncertainty of the spectrometer lies within5%. A greased glass slide (instead of PTFE Blter) actsas an impactor in the instrument which collects theaerosols in the formof a spot on its surface.These slidesare transported to the laboratory in sterile insulatedcontainers in ice cold condition for further microbialanalysis. The collection eDciency of the glass slide isconsiderable as the sample has later been used formicrobiological analyses eAectively. The sampler col-lects thewhole bioaerosol content during the samplingprocess at a Cow rate of 1.2 l/min. The data obtainedwere analysed by using Grimm Windows Software-V2.5TM for the quantitative determination of inhal-able, thoracic and alveolic particles.
2.2.2 Burkard portable sampler
Pollens were trapped by using a Burkard pollensampler, UK, which employs a vacuum pump to
trap the pollens on the surface of a greased trans-parent polyethylene strip, at a Cow rate of 10 l/min(N�unez et al. 2016). It has a rectangular oriBce atthe top end and a slit on the slide to insert greasedtransparent polyethylene strip. The particles getimpacted on the slide in the form of a streak. Thestrip is then mounted in glycerine jelly and scannedfor pollen grains/fungal spore count undermicroscope.
2.2.3 Culturing and colony characterizationof viable microbial componentsof bioaerosol
After sampling, the glass slides were cultured bythe overlay method (Aneja 2010) by gently placingsubsequently on nutrient agar (g/L: peptone-5.0,NaCl-5.0, yeast extract-1.5, agar agar-15.0 at pH-7.4 ± 0.2 at 25�C) for the isolation of bacteria andPotato Dextrose agar (g/L: potato in infusionform-200.0, Dextrose-20.0, agar agar-15.0, pH-5.6 ± 0.2 at 25�C) for the isolation of fungi fol-lowed by incubation at 37�C for 24 and 72 h,respectively, for bacteria and fungi. It may benoted that agar is a microbial media componentwhich is used as a solidifying and nutritional sub-stance for microbial growth under lab condition.Replicas of the original culture plates have beenmade by replica plating method (Aneja 2010).BrieCy, a sterile plastic block was covered at oneend with a sterile velvet cloth. Under sterile con-ditions, the side with the velvet cloth was lightlypressed over the original culture plates and thenimmediately transferred to a fresh agar plate,where it was lightly stamped. The fresh plates werethen incubated for 24 h at 37�C. The colonies onthe new plate will grow in the exact same positionsthe original plate, thus providing replicas of theoriginal samples to be used for further tests (Aneja2010). These plates serve to preserve perfect copiesof the plates of culturable bacteria for further
Table 2. The list of instruments with model numbers and details of measured parameters.
Sl.
no. Instrument Model Parameters
1 Grimm Portable Aerosol
Spectrometer
Grimm 11-A Particulate range 0.23 lm
2 Burkard spore sampler BS02177 All fungal spores and pollens
3 Portlog Portable Automatic
Weather Station
PORTLOG
4400258
Wind speed, wind direction,
temperature, humidity,
dew point, barometer, rainfall,
solar radiation
J. Earth Syst. Sci. (2020) 129:141 Page 5 of 13 141

analyses and prevent loss of original samples.Microbial concentration in the collected bioaerosolsamples were determined by calculating the colonyforming unit (CFU) using the following formula(Srivastava et al. 2012; Lal et al. 2013):
Microbial concentration ðCFU/m3Þ
¼ Number of colonies obtained after incubation
Flow rate m3
min
� �� sampling duration ðminÞ
� � :
It may also be noted that CFU is the number ofbacteria/fungi present in the aerosol sample duringsampling which replicates to produce distinctmicrobial colonies after incubation. Each bacterialcolony was sub-cultured by streak plating tech-nique to obtain the pure microbial cultures. Asterile inoculation loop was taken and each colonywas inoculated in individual plates. As the loop isstreaked across the surface of the plates, thenumber of bacteria gets rubbed oA until identicalcolonies in terms of colony morphology, shape,elevation, surface architecture and transparencywere obtained after 24 h of incubation at 37�C andare considered as pure cultures (Aneja 2010).Microbial colonies with similar characteristics
were provided with the same identiBcation codeprior to Bnal identiBcation. Biochemical tests asprescribed by Bergey’s Manual of SystematicBacteriology were performed for the identiBcationof bacterial isolates and Lactophenol cotton bluestaining followed by microscopic identiBcation ofculturable fungal strains up to genus level (Basavaet al. 2016).
2.2.4 Enumeration and determination of viableand non-viable components of bioaerosolsamples
Fluorescence Microscopy was used to conBrm thepresence of viable bioaerosols. The prepared slideswere stained by a Cuorescent dye acridine orange.This dye stains the nucleic acids in a sample. Whenthe dye is excited by blue light, prokaryotes appeara brilliant orange on a faint greenish black back-ground, when observed under the microscope.Phase contrast microscopy is used to study living
and unstained cells. Special phase contrast objec-tives and condenser optics cause a specimen toappear brighter or darker than the background.Thus, it is suitable to study the bioaerosol samplessuch as pollen grains and fungal spores. The sam-ples were placed on a glass slide that was divided
into 1 9 1 mm2 and observed under the micro-scope. The spores and pollens were spotted andcounted manually. The numbers were then cor-roborated with the results given by the enumera-tion through ImageJ� software (Igathinathaneet al. 2008; Costa and Yang 2009). The microscopicimages were loaded into the software where thetotal number and area of the bioaerosol particleswere calculated automatically. The particle num-ber in the image and the projected area (Ap) ofeach individual particle were noted from which theequivalent projected area diameter (Deq,A) wascalculated:
Deq;A ¼ 2Ap
p
� �12
:
Any particle that is less than 15 pixels (0.37 lm)was not considered due to inclusion of falsepositives (Liu et al. 2018).
2.2.5 Safety assessment of the isolatesby antibiotic sensitivity assay
Bacterial isolates were screened for the presence ofantibiotic resistant genes by Kirby Bauer’s discdiffusion method. BrieCy, overnight bacterial brothof each bacterial isolates was spread plated onMuller-Hinton agar (g/L: Beef extract-2.00, acidhydrolysate of Casein-17.50, starch-1.50, agaragar-17.00, at pH-7.4 ± 0.2 at 25�C) and narrow(viz., Vancomycin-30 mcg and Erythromycin-15mcg) and broad spectrum antibiotic (viz., Chlo-ramphenicol-30 mcg and Ampicillin-10 mcg) discswere inoculated as per CLSI (Clinical and Labo-ratory Standards Institute, USA) guidelines(Sweeney 2018). The plates were then incubated at37�C for 24 h and clear zones around the antibioticdiscs were considered as sensitive.
3. Results and discussion
The bioaerosol spatial distribution and character-istics were examined in nine different locations ofNortheast India through a campaign mode obser-vation during the post-monsoon season, when mostof themicrobes, spores andpollens are aerosolizedbythe humid environment in the preceding monsoonseason (Lee et al. 2016). It may be noted here thatmost of themicrobes do not grow below 50% relativehumidity (RH) (Aneja 2010). The concentration ofbacteria in the atmosphere is estimated in terms of
141 Page 6 of 13 J. Earth Syst. Sci. (2020) 129:141

colony formation unit (CFU) in m3 of aerosolsvolume. CFU values were more over the highlyvegetated locations: Shillong, Kaziranga, DibruSaikhowa and Joypur compared to the urban andsemi-urban locations (i.e., Guwahati, Jorhat,Dimapur, Namsai and Dibrugarh) with less vegeta-tion cover (Bgure 2). The CFU ranges from45.5 CFU/m3 in Guwahati (an urban location) to645.9 CFU/m3 in Joypur (a rainforest area withdense vegetation cover). Over Seoul, South Korea,the concentration of culturable bacterial bioaerosolswas found to be in a range of 0–118 CFU/m3 inwinter and 20–383 CFU/m3 in summer (Lee et al.2016). The global emission of primary biologicalaerosol (PBA) bears 104 CFU/m3 of bacterial and103–104 CFU/m3 of fungal loads in near surface airparticles (Despr�es et al. 2012). Work conducted byWHO professionals on assessment of the healthhazards of biological agents present in indoor envi-ronments in Switzerlandhas suggested that the totalmicrobial load should not exceed 1000 CFU/m3
(WHO 2006). On the other hand, legal standard forpublic health set by the Ministry of Environment ofthe Republic of Korea states that the microbial loadshould not exceed 800 CFU/m3 in indoor air (Leeet al. 2016). But only a handful of reports are avail-able on such studies in India. One such study carriedout in an Indian University shows 755–1,293 CFU/m3 of fungal load; 63.6–338.8 CFU/m3 Gram posi-tive bacterial loads and 159–614 CFU/m3 Gramnegative bacterial loads in the ambient air sampleswhich somewhat corresponds the current Bndings(Srivastava et al. 2012). However, there are nodeBned standard values for concentration of
microbes in air in India (Lal et al. 2017). Whileenumerating the microorganisms in the bioaerosolsamples, the possible role of factors like countingoverlapping microbial colonies that appear as singlecolony and/or microbial colonies, which may beinhibited by other microbes with bactericidal prop-erty, may not be ignored (Srivastava et al. 2012).Even though standard microbiological procedureswere applied for the culturing of viable microbes;error quantiBcation is not possible in the presenttechnique of counting the coloniesmanually becausetwo or more overlapping colonies cannot be distin-guished from each other through the naked eye.The bacterial colonies were identiBed up to the
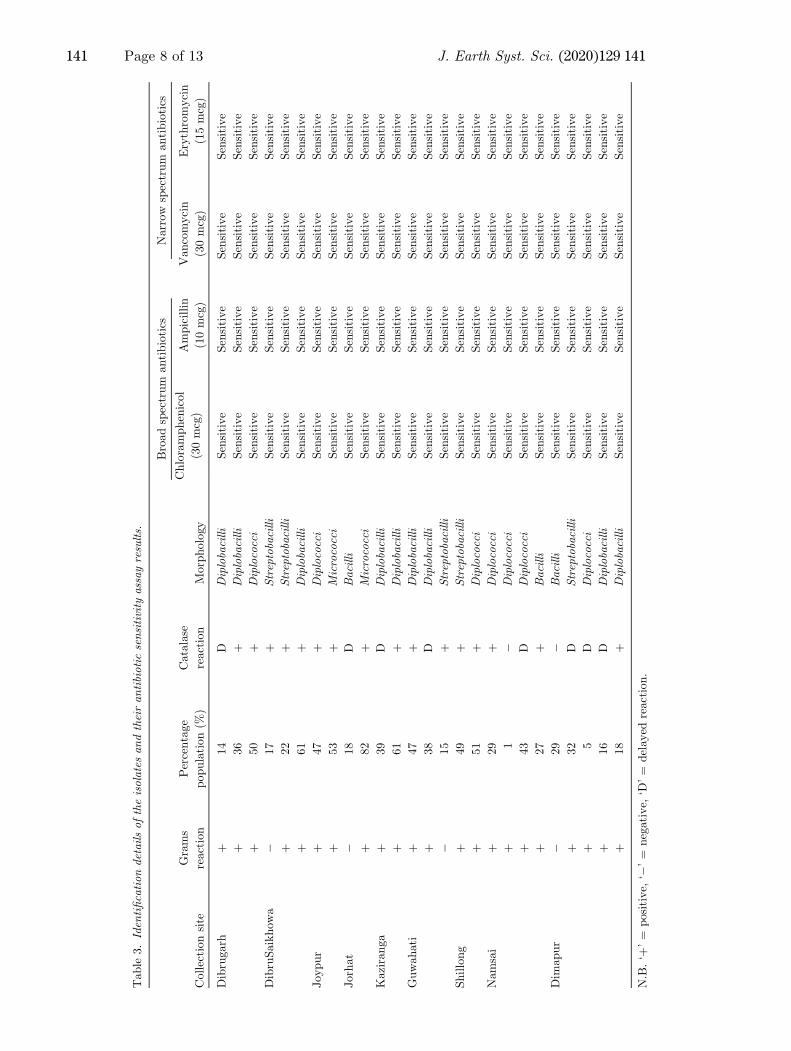
genus level with the help of biochemical charac-terization and staining techniques. The mostabundant form of microbial genus was found to beGram positive Diplobacilli followed by Diplococcisp. where both had shown positive reaction forcatalase test (table 3). Interestingly, no culturablefungal colonies were obtained even though micro-scopic analysis of bioaerosol sample, thus inferringabsence of fungal bioaerosols during post-monsoon.The rise of multidrug resistant (MDR) pathogens isgradually emerging as a major clinical problem(Nikaido and Pages 2012). Acquired antibioticresistance in the environment due to prolonged useof antibiotics and horizontal exchange of resistantgenes from bacteria to bacteria is a major issue ofconcern (Morehead and Scarbrough 2018). Pres-ence of such microbes in the environment may beara possible threat to human health (Naz et al. 2019).Prevalence of such airborne antibiotic resistantmicrobes are reported from road-side areas, poultryfarms, market places, public gatherings, oDcerooms, etc., in India and other countries (Brookset al. 2010; Yadav et al. 2015; Bragoszewska andBiedron 2018; Naz et al. 2019). Such reports havealso shown the prevalence of even Methicillin-resistant Staphylococcus aureus (MRSA) whichposes a greater threat to human health (Naz et al.2019). The current study reveals that all themicrobial isolates from the environment are sus-ceptible to both narrow and broad spectrumantibiotics, which may indicate the presence ofmicrobes with least possible threat to humanhealth as antibiotic sensitive microbes could bevery easily eradicated (Snary et al. 2004; Bernar-deau et al. 2008; Li and Webster 2018) (table 3).Pollen grains, a vital part of the Cowering plant
life cycle, are the most important biological com-ponent of ambient air. A pollen grain is a special-ized structure that encloses the Cowering plant
Figure 2. Colony formation units (CFU) of airborne ofbacteria in m�3 at different sampling sites.
J. Earth Syst. Sci. (2020) 129:141 Page 7 of 13 141
Table
3.Iden
tiBcation
detailsof
theisolates
andtheiran
tibiotic
sensitivity
assayresults.
Collectionsite
Grams
reaction
Percentage
population(%
)
Catalase
reaction
Morphology
Broadspectrum
antibiotics
Narrow
spectrum
antibiotics
Chloramphenicol
(30mcg)
Ampicillin
(10mcg)
Vancomycin
(30mcg)
Erythromycin
(15mcg)
Dibrugarh
+14
DDiplobacilli
Sensitive
Sensitive
Sensitive
Sensitive
+36
+Diplobacilli
Sensitive
Sensitive
Sensitive
Sensitive
+50
+Diplococci
Sensitive
Sensitive
Sensitive
Sensitive
DibruSaikhowa
�17
+Streptobacilli
Sensitive
Sensitive
Sensitive
Sensitive
+22
+Streptobacilli
Sensitive
Sensitive
Sensitive
Sensitive
+61
+Diplobacilli
Sensitive
Sensitive
Sensitive
Sensitive
Joypur
+47
+Diplococci
Sensitive
Sensitive
Sensitive
Sensitive
+53
+Micrococci
Sensitive
Sensitive
Sensitive
Sensitive
Jorhat
�18
DBacilli
Sensitive
Sensitive
Sensitive
Sensitive
+82
+Micrococci
Sensitive
Sensitive
Sensitive
Sensitive
Kaziranga
+39
DDiplobacilli
Sensitive
Sensitive
Sensitive
Sensitive
+61
+Diplobacilli
Sensitive
Sensitive
Sensitive
Sensitive
Guwahati
+47
+Diplobacilli
Sensitive
Sensitive
Sensitive
Sensitive
+38
DDiplobacilli
Sensitive
Sensitive
Sensitive
Sensitive
�15
+Streptobacilli
Sensitive
Sensitive
Sensitive
Sensitive
Shillong
+49
+Streptobacilli
Sensitive
Sensitive
Sensitive
Sensitive
+51
+Diplococci
Sensitive
Sensitive
Sensitive
Sensitive
Namsai
+29
+Diplococci
Sensitive
Sensitive
Sensitive
Sensitive
+1
�Diplococci
Sensitive
Sensitive
Sensitive
Sensitive
+43
DDiplococci
Sensitive
Sensitive
Sensitive
Sensitive
+27
+Bacilli
Sensitive
Sensitive
Sensitive
Sensitive
Dim
apur
�29
�Bacilli
Sensitive
Sensitive
Sensitive
Sensitive
+32
DStreptobacilli
Sensitive
Sensitive
Sensitive
Sensitive
+5
DDiplococci
Sensitive
Sensitive
Sensitive
Sensitive
+16
DDiplobacilli
Sensitive
Sensitive
Sensitive
Sensitive
+18
+Diplobacilli
Sensitive
Sensitive
Sensitive
Sensitive
N.B.‘+
’=
positive,
‘�’=
negative,
‘D’=
delayed
reaction.
141 Page 8 of 13 J. Earth Syst. Sci. (2020) 129:141

male gametes whose biological function is tofertilize the female gametophyte. Microscopicanalysis reveals maximum contribution by non-biological particles (70–90%) to the total bioaerosolsamples, followed by pollens (9–18%), animaldebris (1–12%) and fungal spores (1–6%)(Bgure 3). Maximum amount of non-biologicalcomponent was found in Jorhat, but with leastfungal spores and animal debris. Pathak et al.(2014) have also reported higher values of partic-ulate matter (*50 lg m�3) from the location Jor-hat, in a campaign mode observation over theBrahmaputra valley. Maximum percentage of pol-lens are observed in Shillong (*20%) followed byGuwahati and Namsai (Bgure 4). In Shillong, both[10 lm and \10 lm pollens are prevalent,whereas at all the other locations pollens of size\10 lm override (60–90%). Pollen concentrationis not exhibiting systematic variation like bacterialCFU counts based on vegetation or urban nature ofthe measurement locations. In general, pollens with15–90 lm diameters are mostly considered aspotential allergens as they may get rupturedsometime due to rapid hydration by moisturewhich expels very Bne water soluble starch andglycoprotein granules (\3 lm) which makes itbiologically available to evoke allergenic reaction(Miguel et al. 2006; Taketomi et al. 2006; Asamet al. 2015). Pollens are also referred to as driver ofairborne allergic diseases, which is more common indeveloping countries (D’Amato et al. 2014). Thus,from the present observations, it may be inferredthat all the observation locations, in general, donot possess potential threat to human health
during post-monsoon season in terms of allergicpollen contents. However, this may be too earlyto conclude such statements without performingany immunogenic assay which requires furtherinvestigation.Several studies revealed that there is an associ-
ation between human health with particulate pol-lution (Kumar et al. 2013; Ghorani-Azam et al.2016). It is well established that the regional pat-tern of particle deposition in the respiratory tractaAects the pathogenic potential of inhaled aerosols(Brown et al. 2013). India being one of the highestexposure levels to air pollution (in terms of PM2.5)globally, which has resulted to excessively highmortality and disease burden like lung disease,cardiovascular disease, diabetes, heart disease,stroke, chronic obstructive pulmonary disease, etc.(Lancet Planet Health 2018). Several studies onPM pollution over Indian states including thecapital city, New Delhi are available (Guttikundaand Goel 2013; Pant et al. 2018). However, unlikeother studies, the present study aims at monitoringof particulate matter (PM) concentrations forshorter duration of 4 h, in order to get informationon percentage share of thoracic and alveolar par-ticles to inhalable matter in a given volume of airand to relate this to bioaerosols. Nevertheless, suchstudies over northeast Indian states are rare. It isworthwhile to mention that bioaerosols of sizerange 1–5 lm usually remain airborne and thus arethreat to human health, whereas larger particlestend to deposit on surfaces after a short period oftime (Ghosh et al. 2015). The aerosol spectrometerused in the current study gives crucial statistical
Figure 3. Percentage distribution of different bioaerosolscomponents. Fungal spores, animal debris, pollens andnon-biological components at different sampling sites.
Figure 4. Size distribution of pollens at different samplingsites.
J. Earth Syst. Sci. (2020) 129:141 Page 9 of 13 141

data relating to particulate matter that may beabsorbed in the nasal tract (inhalable matter, PMB 100 lm), thorax (thoracic, PM B 10 lm) andalveoli (alveolar, PM B 4 lm) and cause respira-tory diseases (Petavratzi et al. 2005). Spatially, theconcentration of inhalable matter is the totalamount of particulate matter as detected by thespectrophotometer (within size range 0.25–32 lmfalls in the inhalable category and hence consideredas 100% of detected particulate matter. The per-centage shares of thoracic (PM B 10 lm) andalveolar (PM B4 lm) to inhalable (PM B 32 lmin the present case); particulate matter ispresented in Bgure 5 as a function of variablediameters of the circles.The thoracic particles share to inhalable particles
ranges from 59% (Namsai) to 98% (Joypur). Thecontribution of alveolar particles was found maxi-mum (89%) over the highest vegetation coveredlocation, i.e., Joypur; and minimum was observed inDimapur, the least vegetated location (Bgure 5). Itcan be inferred that the thoracic and alveolar
particles over Joypur, are contributed significantlyby bioaerosols as evident from highest CFU valuesand appreciable fraction of fungal spores, pollens andanimal debris (Bgures 2 and 3). These observationsare further consistent with the abundance of pollensof size B10 lm. The highest mass values of inhalableparticulate matter were detected in Dimapur fol-lowed by that in Guwahati (Bgure 6). This can beattributed to the urban nature of these sites wherevehicular emissions compared to rest of the locationsare predominant. According to some studies, theinhalable PM is contributed mainly by the trafBc inIndia followed by natural mineral dust and industrialemission and domestic burning (Karagulian et al.2015). Moreover, transported aerosols towards theNortheast India region (Gogoi et al. 2009; Pathaket al. 2010, 2016; Dohutia et al. 2019) contribute sig-nificantly to columnar loading along with locallyproduced aerosols. Proper characterization of air-borne particles and human exposure studies areimportant for making policy decisions and establishstandards to protect human health.
Figure 5. Percentage shares of thoracic and alveolar particulate matter to inhalable particulate matter as a function of variablediameters of the circles, at different sampling sites.
141 Page 10 of 13 J. Earth Syst. Sci. (2020) 129:141

4. Conclusions
The current study reports the spatial heterogeneityin the characteristics of biological aerosols overNortheast India during the post-monsoon seasonfor the very Brst time. The major viable compo-nents of bioaerosols are identiBed as pollens(9–18%), animal debris (1–12%) and fungal spores(1–6%), the dominant contributor being the non-biological aerosol particles (70–90%). The bacterialconcentration is over-riding at the highly vegetatedlocations with CFU reaching up to 645.9 CFU/m3
in Joypur, a rainforest area with dense vegetationcover than the urban and semi-urban campaignlocations. These were mostly identiBed as Grampositive Diplobacilli sp., followed by Diplococci sp.showing sensitivity against both broad (Chloram-phenicol and Ampicillin) and narrow (Vancomycinand Erythromycin) spectrum antibiotics whichindicates lesser threat to human health. The cur-rent Bndings provide a scope for metagenomicapproach in order to determine microbial popula-tion in the environment up to species level withtheir immunogenic analysis for the prediction ofpossible pathogens in the environment.
Acknowledgements
Authors acknowledge DST-SERB, Govt. of India(Grant No. ECR/2016/00132) to carry out theinterdisciplinary research in Dibrugarh University.Authors also acknowledge DBT-Delcon facility inthe Centre for Biotechnology and Bioinformatics,
Dibrugarh University. Ankita Khataniar is thank-ful to DST-SERB for providing her the researchfellowship. Dr Binita Pathak is a Junior Associatein the International Centre for Theoretical Physics,Italy.
References
Aneja K R 2010 Experiments in Microbiology, Plant Pathologyand Biotechnology; 4th edn, New Age International Pub-lishers, New Delhi, India, pp. 207–215.
Arancibia F, Bauer T T, Ewig S, Mensa J, Gonzalez J,Niederman M S and Torres A 2002 Community-acquiredpneumonia due to gram-negative bacteria and Pseu-domonas aeruginosa: Incidence, risk and prognosis; Arch.Intern. Med. 162(16) 1849–1858.
Asam C, Hofer H, Wolf M, Aglas L and Wallner M 2015 Treepollen allergens – an update from a molecular perspective;Allergy 70(10) 1201–1211.
Basava S P R, Ambati S, Jithendra K, Premanadham N,Reddy P S and Mannepuli C K 2016 EDcacy of iodine-glycerol vs. lactophenol cotton blue for identiBcation offungal elements in the clinical laboratory; Int. J. Curr.Microbiol. App. Sci. 5(11) 536–541.
Bernardeau M, Vernoux J P, Henri-Dubernet S and Gu�eguenM 2008 Safety assessment of dairy microorganisms: TheLactobacillus genus; Int. J. Food Microbiol. 126 278–285.
Bragoszewska E and Biedro�n I 2018 Indoor air quality andpotential health risk impacts of exposure to antibioticresistant bacteria in an oDce rooms in southern Poland; Int.J. Environ. Res. Public Health 15 2604.
Brandl H, D€aniken A, Hitz C and Krebs W 2008 Short-termdynamic patterns of bioaerosol generation and displace-ment in an indoor environment; Int. J. Aerobio. 24(4)203–209.
Brooks J P, McLaughlin M R, SchefCer B and Miles D M 2010Microbial and antibiotic resistant constituents associatedwith biological aerosols and poultry litter within a com-mercial poultry house; Sci. Total Environ. 408 4770–4777.
Brown J S, Gordon T, Price O and Asgharian B 2013 Thoracicand respirable particle definitions for human health riskassessment; Parti. Fibre Toxicol. 10 12.
Bush R K and Portnoy J M 2001 The role and abatementof fungal allergens in allergic diseases; J. Allergy Clin.Immunol. 107(3 Suppl) S430–S440.
Costa C and Yang S 2009 Counting pollen grains using readilyavailable, free image processing and analysis software; Ann.Bot. 104(5) 1005–1010.
Creamean J M, Suski K J, Rosenfeld D, Cazorla A, Demott PJ, Sullivan R C, White A B, Ralph F, Minnis P, ComstockJ M, Tomlinson J M and Prather K A 2013 Dust andbiological aerosols from the sahara and asia inCuenceprecipitation in the western US; Science 339 1572–1578.
D’Amato G, Cecchi L, D’Amato M and Annesi-Maesano I2014 Climate change and respiratory diseases; Eur. Respir.Rev. 23 161–169.
D’Amato G, Holgate S T, Pawankar R, Ledford D K, CecchiL, Al-Ahmad M, Al-Enezi F, Al-Muhsen S, Ansotegui I,Baena-Cagnani C E, Baker D J, Bayram H, Bergmann K C,Boulet L, Buters J T M, D’Amato M, Dorsano S, Douwes J,
Figure 6. Mass values of inhalable particulate matter atdifferent sampling sites.
J. Earth Syst. Sci. (2020) 129:141 Page 11 of 13 141

Finlay S E, Garrasi D, G�omez M, Haahtela T, Halwani R,Hassani Y, Mahboub B, Marks G, Michelozzi P, MontagniM, Nunes C, Oh J J, Popov T A, Portnoy J, Ridolo E,Ros�ario N, Rottem M, S�anchez-Borges M, Sibanda E,Sienra-Monge J J, Vitale C and Annesi-Maesano I 2015Meteorological conditions, climate change, new emergingfactors and asthma and related allergic disorders: Astatement of the world allergy organization; World AllergyOrgan. J. 8 25.
Despr�es V R, HuAman J A, Burrows S M, Hoose C, Safatov AS, Buryak G, Fr€ohlich-Nowoisky J, Elbert W, Andreae MO, P€oschl U and Jaenicke R 2012 Primary biological aerosolparticles in the atmosphere: A review; Tellus B Chem. Phys.Meteorol. 64(1) 1–58.
Dikshit K R and Dikshit J K 2014 Natural vegetation: Forestsand grasslands of north-east India; In: North-East India:Land, people and economy; Adv. Asian Human-environ.Res., Springer, Dordrecht, https://doi.org/10.1007/978-94-007-7055-3.
Dohutia P, Pathak B and Bhuyan P K 2019 Verticaldistribution of aerosol and clouds over North-East Indiaand adjoining South-Asia: EAect of aerosols on clouds;Atmos. Environ. 215 116882.
Douwes J, Thorne P, Pearce N and Heederik D 2003Bioaerosol health eAects and exposure assessment: Progressand prospects; Ann. Occup. Hyg. 47 187–200.
Fr€ohlich-Nowoisky J, Kampf C J, Weber B, HuAman J A,P€ohlker C, Andreae M O, Lang-Yona N, Burrows S M,Gunthe S S, Elbert W, Su H, Hoor P, Thines E, HoAmannT, Despr�es V R and P€oschl U 2016 Bioaerosols in the Earthsystem: Climate, health and ecosystem interactions; Atmos.Res. 182 346–376.
Gangamma S 2014 Characteristics of airborne bacteria inMumbai urban environment; Sci. Total Environ. 488–48970–74.
Ghorani-Azam A, Riahi-Zanjani B and Balali-Mood M 2016EAects of air pollution on human health and practicalmeasures for prevention in Iran; J. Res. Med. Sci. 21 65.
Ghosh B, Lal H and Srivastava A 2015 Review of bioaerosolsin indoor environment with special reference to sampling,analysis and control mechanisms; Environ. Int. 85254–272.
Gogoi M M, Moorthy K K, Babu S S and Bhuyan P K 2009Climatology of columnar aerosol properties and the inCu-ence of synoptic conditions: First-time results from thenorth-eastern region of India; J. Geophys. Res.: Atmos.114(D8) D08202, https://doi.org/10.1029/2008JD010765.
Grimm H 2010 Operation manual of Portable Laser Aerosolspectrometer and dust monitor (Model 1.108/1.109);GRIMM Aerosol Technik GmbH & Co. KG, Ainring,Germany.
Grimm H and Eatough D 2009 Aerosol measurement: The useof optical light scattering for the determination of partic-ulate size distributionand particulate mass, including thesemi-volatile fraction; J. Air Waste Manag. Assoc. 59101–107.
Guttikunda S K and Goel R 2013 Health impacts of partic-ulate pollution in a megacity – Delhi, India; Environ. Dev. 68–20.
Hauspie R C and Pagezy H 2002 The contribution of bacteriaand fungal spores to the organic carbon content of cloudwater, precipitation and aerosols; Atmos. Res. 64 109–119.
Heidi B, Heinrich G, Regina H, Anne K, Georg R, Franziska Zand Hans P 2003 Airborne bacteria as cloud condensationnuclei; J. Geophys. Res. 108 1919–1964.
Igathinathane C, Pordesimo L, Columbus E, Batchelor WandMethuku S 2008 Shape identiBcation and particles sizedistribution from basic shape parameters using ImageJ;Comput. Electron Agr. 63(2) 168–182.
Jaenicke R 2005 Abundance of cellular material and proteinsin the atmosphere; Science 308(5718) 73.
Karagulian F, Belis C A, Dora C F C, Pr€uss-Ust€un A M,Bonjour S, Adair-Rohani H and Markus A 2015 Contribu-tions to cities’ ambient particulate matter (PM): Asystematic review of local source contributions at globallevel; Atmos. Environ. 120 475–483.
Kumar B, Gupta G P, Singh S and Kulshrestha U C 2013 Studyof abundance and characterization of culturable bioaerosol atDelhi, India; Int. J. Environ. Eng. Manag. 4 219–226.
Lal H, Ghosh B, Srivastava A and Srivastava A 2017IdentiBcation and characterization of size-segregatedbioaerosols at different sites in Delhi; Aerosol Air Qual.Res. 17 1570–1581.
Lal H, Punia T, Ghosh B, Srivastava A and Jain V K 2013Comparative study of bioaerosol during monsoon and post-monsoon seasons at four sensitive sites in Delhi region; Int.J. Adv. Earth Environ. Sci. 1(2) 1–7.
Lancet Planet Health 2018 india state-level disease burdeninitiative air pollution collaborators. The impact of airpollution on deaths, disease burden and life expectancyacross the states of India: The global burden of disease study2017, http://dx.doi.org/10.1016/S2542-5196(18)30261-4.
Lee B U K, Lee G and Heo K J 2016 Concentration ofculturable bioaerosols during winter; J. Aerosol. Sci. 94 1–8.
Li B and Webster T J 2018 Bacteria antibiotic resistance: Newchallenges and opportunities for implant-associated ortho-paedic infections; J. Orthop. Res. 36 22–32.
Lindow S and Brandl M 2003 Microbiology of the Phyllo-sphere; Appl. Env. Microbiol. 69 1875–1883.
Liu H, Zhang Z, Wen N and Wang C 2018 Determination andrisk assessment of airborne endotoxin concentrations in auniversity campus; J. Aerosol. Sci. 115 146–157.
Mainelis G 2019 Bioaerosol sampling: Classical approaches,advances and perspectives, aerosol science and technology;Aerosol. Sci. Tech., https://doi.org/10.1080/02786826.2019.1671950.
Malik P, Singh A B, Babu C R and Gangal S V 1991Atmospheric concentration of pollen grains at humanheight; Grana. 30 129–136.
Matthysse A 2018 Adherence of bacteria to plant surfacesmeasured in the laboratory; J. Vis. Exp. 136 56599,https://doi.org/10.3791/56599.
Miguel A G, Taylor P E, House J, Glovsky M M and Flagan RC 2006 Meteorological inCuences on respirable fragmentrelease from Chinese Elm pollen; Aero. Sci. Technol. 40690–696.
Mohr A 2007 Fate and transport of microorganisms in air; In:Manual of Environmental Microbiology, 3rd edn (eds) HurstC, Crawford R, Garland J, Lipson D, Mills A and Stetzen-bach L, ASM Press, Washington, DC, pp. 961–971, https://doi.org/10.1128/9781555815882.ch76.
Morehead M S and Scarbrough C 2018 Emergence of globalantibiotic resistance; Prim. Care Clin. ODce Pract. 45467–484.
141 Page 12 of 13 J. Earth Syst. Sci. (2020) 129:141

Naz N, Nasim F H and Pasha T S 2019 Prevalence ofantibiotic-resistant airborne bacteria along roadsides inRahim Yar Khan, Pakistan; Pol. J. Environ. Stud. 281295–1303.
Nikaido H and Pages J M 2012 Broad-speciBcity eAlux pumpsand their role in multidrug resistance of Gram-negativebacteria; FEMS Microbiol. Rev. 36 340–363.
N�unez A, de Paz A G, Alberto R, Ana G M, Antonio A,Guti�errez-Bustillo A, Montserrat M and Diego A 2016Monitoring of airborne biological particles in outdooratmosphere. Part 1: Importance, variability and ratios;Int. Microbiol. 19(1) 1–13.
Pant P, Lal R M, Guttikunda S K, Russell A G, Nagpure A S,Ramaswami A and Peltier R E 2018 Monitoring particulatematter in India: Recent trends and future outlook; AirQual. Atmos. Health. 12(1) 45–58.
Pathak B, Bhuyan P K, Gogoi M M and Bhuyan K 2012Seasonal heterogeneity in aerosol types over Dibrugarh,north-eastern India; Atmos. Environ. 47 307–315.
Pathak B, Borgohain A, Bhuyan P K, Kundu S S, Sudhakar S,Gogoi M and Takemura T 2014 Spatial heterogeneity innear surface aerosol characteristics across the BrahmaputraValley; J. Earth Syst. Sci. 123 651–663.
Pathak B, Subba T, Dahutia P, Bhuyan P K, Moorthy K K,Gogoi M M, Babu S S, Chutia L, Ajay P, Biswas J, BharaliC, Borgohain A, Dhar P, Guha A, De B K, Banik T,Chakraborty M, Kundu S S, Sudhakar S and Singh S B2016 Aerosol characteristics in north-east India usingARFINET spectral optical depth measurements; Atmos.Environ. 125 461–473.
Pathak B, Kalita G, Bhuyan K, Bhuyan P K and MoorthyK K 2010 Aerosol temporal characteristics and its impacton shortwave radiative forcing at a location in the North-east of India; J. Geophys. Res. 115 D19204.
Petavratzi E, Kingman S and Lowndes I 2005 Particulatesfrom mining operations: A review of sources, eAects andregulations; Miner. Eng. 18(12) 1183–1199.
Phillips V T J, DeMott P J and Andronache C 2008 Anempirical parameterization of heterogeneous ice nucleationfor multiple chemical species of aerosol; J. Atmos. Sci.65(9) 2757–2783.
Singh A B and Kumar P 2004 Aerial pollen diversity in Indiaand their clinical significance in allergic diseases; Indian J.Clin. Biochem. 19 190–201.
Singh A B and Babu C R 1980 Pollen types in the atmosphereof Delhi; Phytomorphology 30 180–189.
Singh K and Shivpuri D N 1971 Studies on yet unknownallergenic pollen of Delhi state metropolitan: Botanicalaspects; Indian J. Med. Res. 59 1392–1410.
Smets W, Moretti S, Denys S and Lebeer S 2016 Airbornebacteria in the atmosphere: Presence, purpose and poten-tial; Atmos. Environ. 139 214–221.
Snary E L, Kelly L A, Davison H C, Teale C J and WooldridgeM 2004 Antimicrobial resistance: A microbial risk assess-ment perspective; J. Antimicrob. Chemother. 53 906–917.
Srivastava A, Singh M and Jain V K 2012 IdentiBcation andcharacterization of size-segregated bioaerosols at Jawahar-lal Nehru University, New Delhi; Nat. Hazards 60(2)485–499.
Su�arez-Cervera M, Castells T, Vega-Maray A, Civantos E, delPozo V, Fern�andez-Gonz�alez D, Moreno-Grau S, Moral A,L�opez-Iglesias C, Lahoz C and Seoane-Camba J A 2008EAects of air pollution on cup a 3 allergen in Cupressusarizonica pollen grains; Ann. Allergy Asthma Immunol. 10157–66.
Sweeney M T 2018 CLSI performance standards for antimi-crobial disk and dilution susceptibility tests for bacteriaisolated from animals. Clinical and Laboratory StandardsInstitute, CLSI standard VET01, Wayne, PA.
Taketomi E, Sopelete M, de Sousa Moreira P and de AssisMachado Vieira F 2006 Pollen allergic disease: Pollens andits major allergens; Braz. J. Otorhinolaryngol. 72(4)562–567.
Wang C H, Chen B T, Han B C, Liu A C Y, Hung P C, Chen CY and Chao H J 2015 Field evaluation of personal samplingmethods for multiple bioaerosols; PLoS ONE 10(3)e0120308.
WHO 2006 Health Risk Assessment of Air Pollution: GeneralPrinciples; Geneva, Switzerland.
Yadav J, Kumar A, Mahor P, Goel A K, Chaudhary H S,Yadava P K, Yadav H and Kumar P 2015 Distribution ofairborne microbes and antibiotic susceptibility pattern ofbacteria during Gwalior trade fair, central India; J. Formos.Med. Assoc. 114 639–646.
Yoo K, Lee T, Choi E, Yang J, Shukla S, Hwang S and Park J2017 Molecular approaches for the detection and monitor-ing of microbial communities in bioaerosols: A review;J. Environ. Sci. 51 234–247.
Corresponding editor: SURESH BABU
J. Earth Syst. Sci. (2020) 129:141 Page 13 of 13 141


