CHARACTERIZATION OF BALD EAGLE WINTER NIGHT ROOST … · 1 CHARACTERIZATION OF BALD EAGLE WINTER...
21
1 CHARACTERIZATION OF BALD EAGLE WINTER NIGHT ROOST HABITAT ALONG THE UPPER MISSISSIPPI RIVER BRIAN C.E. HALL Department of Resource Analysis, Saint Mary’s University of Minnesota, Winona, MN 55987 ABSTRACT In recent years, winter bald eagle (Haliaeetus leucocephalus) populations along the upper Mississippi River have been slowly growing. Ensuring the survival and continued growth of bald eagle populations requires a better understanding of their ecological requirements and behavior. An important element of the bald eagles' life history is suitable areas for winter night roosting. The Minnesota Department of Natural Resources' (MN DNR) Nongame Wildlife Program has been studying the known bald eagle winter night roost sites in the upper Mississippi River valley since 1988. An understanding of why bald eagles favor some sites for winter night roosting may allow for better management of the needs of bald eagles, natural communities, and human communities. The purpose of this study was primarily to characterize and quantify selected aspects of known bald eagle winter night roost sites, and secondarily to use the results of the analysis as criteria for predicting potential future roost habitat. Five sites with known winter eagle use were studied. Forestry information for each site was collected. Roost sites were modeled in a Geographic Information System (GIS) to permit analysis of several spatial characteristics. Results of analyses were used as parameters in a model to predict additional areas suitable for eagle use. The roost sites typically had mature forest cover. Roost slopes ranged from flat to 55 degrees. Aspects, where significantly present, were northeast and east. Distance from the roost to
Transcript of CHARACTERIZATION OF BALD EAGLE WINTER NIGHT ROOST … · 1 CHARACTERIZATION OF BALD EAGLE WINTER...
1
CHARACTERIZATION OF BALD EAGLE WINTER NIGHT ROOST HABITAT ALONG THE UPPER MISSISSIPPI RIVER BRIAN C.E. HALL Department of Resource Analysis, Saint Mary’s University of Minnesota, Winona, MN 55987
ABSTRACT
In recent years, winter bald eagle (Haliaeetus leucocephalus) populations along the upper
Mississippi River have been slowly growing. Ensuring the survival and continued growth of bald
eagle populations requires a better understanding of their ecological requirements and behavior.
An important element of the bald eagles' life history is suitable areas for winter night roosting.
The Minnesota Department of Natural Resources' (MN DNR) Nongame Wildlife Program has
been studying the known bald eagle winter night roost sites in the upper Mississippi River valley
since 1988. An understanding of why bald eagles favor some sites for winter night roosting may
allow for better management of the needs of bald eagles, natural communities, and human
communities.
The purpose of this study was primarily to characterize and quantify selected aspects of
known bald eagle winter night roost sites, and secondarily to use the results of the analysis as
criteria for predicting potential future roost habitat. Five sites with known winter eagle use were
studied. Forestry information for each site was collected. Roost sites were modeled in a
Geographic Information System (GIS) to permit analysis of several spatial characteristics.
Results of analyses were used as parameters in a model to predict additional areas suitable for
eagle use.
The roost sites typically had mature forest cover. Roost slopes ranged from flat to 55
degrees. Aspects, where significantly present, were northeast and east. Distance from the roost to
2
ice-free water was at most 2250 meters. Distance from the roost to the nearest road was at a
minimum 120 meters. Known roost sites fell within areas predicted in the model to be potential
roost habitat.
Introduction
In recent years, bald eagle (Haliaeetus leucocephalus) populations overwintering along
the upper Mississippi River have been slowly growing (Bonnie Erpelding, personal
communication). Ensuring the survival and continued growth of winter bald eagle populations
requires a better understanding of their ecological requirements and behavior. An important
element of the bald eagle's life history is suitable areas for winter night roosting.
Stalmaster (1987) defines a roost as “an area where eagles rest and sleep during the
night.” Wintering bald eagles congregate in small areas that afford them a degree of protection
from cold weather. Roosts are traditionally used for successive years (Stalmaster, 1987). Mature
forest stands are preferred, as are forest and landform configurations that provide shelter from
cold winds. Suitable roost areas that are closer to the daytime feeding areas reduce the energetic
cost of flying to and from the roost. Eagles may switch to satellite roost sites (roosts with aspects
or other properties that provide shelter from non-prevailing winds) when cold winter winds blow
from unusual directions. Roosts may also have a social function in that younger eagles have a
chance to observe and emulate the successful strategies of mature eagles (Stalmaster, 1987).
Previous studies have measured nonbreeding bald eagle roost habitat. A study of bald
eagle roost habitat on the northern Chesapeake Bay found that winter communal roosts tended to
be in stands with greater canopy height, more canopy cover, and more snags than random sites.

3
Roost sites were closer to water and farther from paved roads and buildings than random sites
(Buehler, et al.. 1991).
It is the purpose of this study to characterize five known upper Mississippi River bald
eagle winter roost sites so that researchers and managers may have a better understanding of the
habitat needs of bald eagles. Another goal is to use the results of the analysis to develop a
predictive model that can serve to prioritize areas for further investigation as to their potential for
eagle inhabitation.
METHODS
Overview of Analyses
This study conducted analyses at two spatial scales: roost along with immediate
surroundings and landscape level. A roost was given a 500 meter buffer, based on the
recommendation of Mark Martell (1992), to define the extent for the first stage of analysis.
Analysis of the roost and its immediate surroundings included determination of forest
composition, slope and aspect. Landscape level analysis consisted of determining proximity to
human disturbances (roads and railroads) and distance to ice-free waters.
Findings of the above analyses were subsequently used as the criteria for predicting the
suitability of other areas in the upper Mississippi River valley as potential bald eagle winter roost
habitat.
Description of Study Sites
4
Five areas with known long-term bald eagle roost usage were selected for study. These
areas were selected by Bonnie Erpelding, Minnesota Department of Natural Resources,
Nongame Wildlife Division. They have been heavily used by wintering bald eagle populations
for successive years. These sites can be categorized as 'critical roosts' as they meet one or more
of the following criteria (adapted for winter season from Martell, 1992):
- used > 14 nights per season
- used > 14 nights per season by > 15 eagles per night; or
- has been documented as active for more that 5 years
All five study sites occur on or near the upper Mississippi River, between the cities of Red Wing,
Minnesota and Guttenberg, Iowa (Figure One).
The northernmost study site lies northeast of Red Wing, Minnesota and is called Colville
Park, after the nearby city park (Figure Two). The roost site itself is located on two privately
owned islands in the middle of Dead Slough Lake. The surrounding islands are variously part of
the Pierce County (Wisconsin) Islands State Wildlife Area, part of Colville Park, or owned by
Northern States Power. Islands with floodplain forest vegetation surround the roost site. There
are high bluffs 1200 meters south and 3600 meters north of this nearly flat roost site. There is
often ice-free water near the site, caused primarily by the heated water discharge of the Northern
States Power Prairie Island nuclear powerplant which lies about eleven rivermiles upstream
(Galli, 1997, personal communication).
The Wacouta Bay study site lies about five kilometers downstream of Colville Park
(Figure Three). The roost site sits on a steep (24 degree slope) northeast-facing bluffside. The
main channel of the Mississippi River, Wacouta Bay and several islands are nearby. The nearest
5
ice-free water is part of the same stretch of open water that passes by the Colville Park site. The
Wacouta Bay site is privately owned.
The third study site is called Reads Landing, after the Minnesota town across the main
channel of the Mississippi River (Figure Four). This nearly flat site lies in an area of islands and
backwaters at the confluence of the Mississippi and Chippewa rivers. Ice-free water is caused by
the Chippewa River flowing into the Mississippi River, creating an alluvial dam. As the water of
Lake Pepin flows through the bottleneck, the water accelerates and ice formation is prevented.
Most of the site is public land as part of the Upper Mississippi River Wildlife and Fish Refuge; a
small portion west of the Chippewa River is private land.
Downstream of Reads Landing lies the fourth study site, Zumbro Bottoms, named for its
location in the floodplain of the Zumbro River (Figure Five). Zumbro Bottoms lies east of
Kellogg, Minnesota, close to the confluence of the Zumbro and Mississippi rivers. The Zumbro
River flows through the study site, which is made up of mostly floodplain forest. The site is
nearly flat. Ice-free water lies roughly three kilometers northeast of the site and is caused by
Lock and Dam 4 at Alma, Wisconsin. The site is mostly public land as part of the Upper
Mississippi River Wildlife and Fish Refuge.
The last and southernmost study site is called Eagle Valley after the private nature
reserve in which it resides (Figure Six). Eagle Valley lies about five kilometers south of Glen
Haven, Wisconsin. The roost site is on a steep (24 degree) east-facing slope facing away from
the river. The study site is mostly forested land on hilltops, slopes and bottoms. Ice-free water
occurred immediately downstream of Lock and Dam 10, which lies westnorthwest of the study
site, as well as a few smaller patches of ice-free water closer to the roost site. The site is privately
owned by the Eagle Valley Nature Preserve.

6
Delineation of Study Sites
The specific location and area of the four northernmost roost sites was determined by
Bonnie Erpelding (Minnesota Department of Natural Resources, Nongame Wildlife division),
based on her familiarity with the sites. The delineation of the Eagle Valley roost site was done
by Brett Mandernack, manager of the Eagle Valley Nature Preserve. In each case, the outline of
the roost site was drawn onto a color photocopy of a 7.5 minute U.S.G.S. topographic map.
Following the recommendation of Mark Martell (1992), the roost sites were given a 500 meter
buffer to define the extent of analysis.
Forest Inventories
The Colville Park, Reads Landing, and Zumbro Bottoms sites had their forest
composition inventoried during this study. The forest stand mapping methodology was that used
by the LaCrescent, MN United States Army Corps of Engineers forestry division. Recent aerial
photographs of the sites were used to spatially reference the results of forest inventories.
The Colville Park study area was partially inventoried on 7/14/97 and 7/15/97. The roost
site itself and the connecting lands were not inventoried due to the inability to contact the
landowners. The Wacouta Bay study area was not inventoried during this study. However, the
land was qualitatively described in 1991 and 1992 by Hannah Dunevitz, a plant ecologist with
the Minnesota Department of Natural Resources. This information was used for characterizing
the forest composition of the site. The Reads Landing study area was inventoried in June and
October 1997. A small portion of the Zumbro Bottoms study area was not inventoried. Zumbro
Bottoms inventories were performed in June 1997. The Eagle Valley study area was outside of

7
the operational range of the USACE forestry division, and so was not inventoried. However, the
Eagle Valley Nature Preserve in 1996 commissioned a master plan which included forest cover
characterization. All forestry information for Eagle Valley in this report is derived from the
master plan (Anderson et al.., 1996).
The forest inventories used an adaptation of standard field stand mapping. A forest
inventory team of two to four members would walk to a chosen point in the study area and
reference their location on an aerial photograph. The crew would take a set of measurements,
described below. When measurements were completed, the crew would pace out 5 chains (100.6
meters) in a prescribed direction. The new location would be referenced on the aerial photograph
to the best of their ability. A new set of measurements would be taken, and the process repeated
in coordination with other crews until the entire study area had been inventoried.
At each location the following measurements were taken (complete forest inventory
results are in Appendix A):
• Basal area per acre: This was determined by using the Bitterlich method.
• Percent crown cover: This was determined by using a densiometer.
• Number of snags: Snags (dead but standing trees) taller than breast height were counted.
• First, second and third dominant overstory species: For each, the number, average diameter
breast height, and average height were recorded. Species dominance ranking was estimated in
the field. Diameter at breast height was estimated using a Biltmore stick. Height was estimated
using an angle gauge at a distance of one chain (20.1 meters).
For every identifiable forest stand, one dominant overstory tree was cored to obtain an
estimate of growth in the last ten years and the age of the tree. This figure was used to represent
the age of the forest stand.

8
The data collected in the field were taken to the USACE office in LaCrescent, MN.
There, the locations on the aerial photograph were grouped into stands sharing dominant
characteristics. The stands were given identity codes and were digitized by USACE staff into a
geographic information system (GIS) using ArcInfo software developed by Environmental
Systems Research Institute. The resulting forest inventory coverages were zoom transferred onto
topographic base maps to remove photo distortion. Forest stand summary data were added to the
coverage by the author.
Database Development
Data for the project were stored and manipulated on a SUN Ultra 2 Creator workstation
with a UNIX operating system. Coverages were created, attributed and manipulated using
ArcInfo version 7.1. Further analysis and graphic output were done using ArcView version 3.0b
with the Spatial Analyst extension.
All coverages for the project used the Universal Transverse Mercator projection, Zone
15, Datum NAD83 with units in meters. In addition to being a common and familiar projection,
UTM was chosen because it has minimal distortion of area and distance.
Digital Raster Graphics (DRG), which are digital, georeferenced images of 7.5 minute
U.S.G.S. topographic maps, were selected as the basemaps for this project. Where spatial
discrepancies between the DRGs and other data existed, such as land/water boundaries, the
1:24,000 scale DRGs were used as the standard of accuracy.
Data Layers

9
The following data layers were used in the first stage of analysis:
• Digital Raster Graphics (DRG): These were produced by the United States Geological
Survey (USGS) and obtained from the Environmental Management Technical Center (EMTC),
Onalaska, WI.
• Roads, railroads, and miscellaneous transportation: Shapefiles representing vectorized roads,
railroads and miscellaneous transportation features at a scale of 1:100,000 were obtained from
the EMTC. These were merged into one coverage for each feature class covering the entire study
area.
• Slope and Aspect: Polygon coverages with slope and aspect attributes were created from
1:24,000 scale Digital Elevation Models (DEMs). These consist of a regular spacing of points
with elevational data and were obtained from the USGS Eros Data Center in Sioux Falls, South
Dakota. These DEMs were created using the first generation "level one" methodology and
contain errors which result in a banded look to topography. Yet, they were the best data available
at the time of the study.
• Visible Areas: The goal was not only to analyze the closest human features, but also to
determine which of those features were likely to be in the eagle's line of sight from the roost.
Visibility was calculated using the average canopy height for each roost as the elevation of the
observation point. No distance limitation was included. Any area not visually obstructed by
intervening terrain was considered to be a visible area.
• Open Water: Open water coverages estimate the minimum extent of ice-free and thus
huntable water during the coldest part of the year. These areas were estimated by Joan Galli,
Minnesota Department of Natural Resources, nongame wildlife division. Galli has flown
numerous times over the Mississippi River valley examining bald eagles and their habitat. Open

10
water areas for the Eagle Valley site were estimated by Brett Mandernack. The estimations of
ice-free waters were heads-up digitized using the DRGs as a backdrop.
• Forest Inventory Data: Each study site has a polygon coverage which conveys relatively
homogenous forest stands. These polygons were attributed with all forest inventory data
collected. Unsurveyed areas of Colville Park and Reads Landing have no attribute information.
Analysis Procedures
All data themes were imported into an Arcview project. For each study site, distances
from the roost polygon to the nearest open water, the nearest human features, and the nearest
visible human features were measured using the Arcview measure tool. Slope and aspect values
were summarized for each roost polygon. The attribute tables of the forestry coverages were
queried to summarize the forestry characteristics of each roost and study area, where data
existed.
The second stage of analysis attempted to locate other areas in the upper Mississippi
River Valley that share some of the characteristics of the study sites. This stage of analysis
covered an area extending 10,000 meters from the approximate centerline of the Mississippi
River from Hastings, MN to Dubuque, IA. These areas may warrant further investigation
regarding their suitability for winter bald eagle use. Data layers used in this stage included:
• Roads: the same coverage as explained above.
• Open Water: This coverage represents the author’s estimation of where there is ice-free water
in the Mississippi River in January. This coverage includes the open water coverages described
above as well as additional open water sites placed immediately below dams.

11
• Small scale landcover: This 1:250,000 scale coverage came from the U.S.G.S. Geographic
Information Retrieval and Analysis System (GIRAS) files. Although source dates ranged from
mid 1970s to early 1980s, this was the most recent small-scale landcover data available. Land
use was classified according to the Anderson classification system (Anderson et al.., 1976)
which is a hierarchical system of general (level 1) to more specific (level 2) characterization.
This model was run as follows:
• Since the small-scale landcover data only noted the presence or absence of forest landcover
with no further detail, the first step in the predictive model was to extract only those areas which
were identified as having forest landcover.
• Next, all forested tracts within the study area were attributed according to their distance from
the nearest ice-free water. This was done using Arcview spatial analyst. These attributes were
converted to an interval ranking system where areas closer to ice-free water had a higher rank.
• Each area was also attributed according to its distance from the nearest road. These attributes
were converted to an interval ranking system where areas further from roads had a higher rank.
• Lastly, the rankings for distance from ice-free water and the distance from roads were
summed, with the distance from ice-free water ranks receiving a weighting factor of
approximately four. This was to reflect the general consensus found in the literature that it is
more important for roosting bald eagles to be nearer ice-free waters than to be away from roads.
The summed score represented a predicted bald eagle roost habitat suitability score on an ordinal
scale.

12
Results
The Colville Park study site encompassed an area of 1710.4 hectares. The roost consisted
of 62.3 hectares, of which 3.4 hectares were land. The roost site was essentially flat (slope of
0.097 degrees), meaning there was no significant aspect. The roost was about 115 meters from
estimated ice-free water. The roost was about 760, 680, and 830 meters from the nearest road,
railroad line, and power transmission line, respectively. All of these features were estimated to
be visible to an eagle perched in the middle of the roost. Forest composition data for the roost
were not available. Study site-wide forest composition indices include dominant overstory
species of silver maple (Acer saccharinum), with average diameter at breast height (dbh) of 16.3
inches (range: 15 -19. N = 3), and average height of 72.3 feet (range: 71 - 75. N = 3). Other
indices include an average basal area of 314 square feet per acre (range: 30 - 124. N = 4),
average understory cover of 71.25 percent (range: 29 - 100. N = 4), and average age of forest of
56 years (range: 43 -73. N = 3) (See Table One).
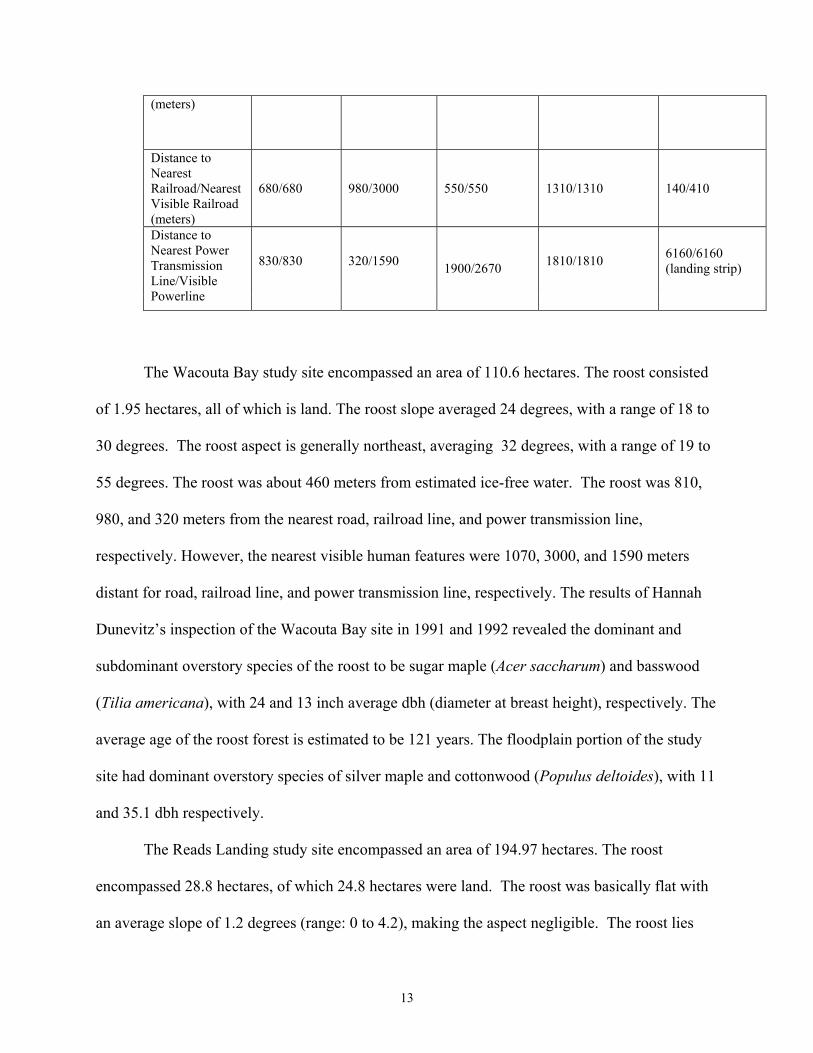
Table One. Geographic and spatial characteristics of the five roost sites. Colville Park Wacouta Bay Reads Landing Zumbro Bottoms Eagle Valley
Slope, average (degrees) 0 24 1 1 24
Slope, min-max (degrees)
0 - 0 18-30 0 - 4 0 – 4 3 – 42
Aspect, average (degrees)
None 33 None None 95
Aspect, min – max (degrees) None 19 - 56 None None 34 – 354
Distance to Open Water (meters) 120 460 190 2250 740
Distance to Nearest Road/Nearest Visible Road
760/760 810/1070 620/620 470/470 120/320
13
(meters)
Distance to Nearest Railroad/Nearest Visible Railroad (meters)
680/680 980/3000 550/550 1310/1310 140/410
830/830 320/1590 1810/1810 6160/6160 (landing strip)
Distance to Nearest Power Transmission Line/Visible Powerline
1900/2670
The Wacouta Bay study site encompassed an area of 110.6 hectares. The roost consisted
of 1.95 hectares, all of which is land. The roost slope averaged 24 degrees, with a range of 18 to
30 degrees. The roost aspect is generally northeast, averaging 32 degrees, with a range of 19 to
55 degrees. The roost was about 460 meters from estimated ice-free water. The roost was 810,
980, and 320 meters from the nearest road, railroad line, and power transmission line,
respectively. However, the nearest visible human features were 1070, 3000, and 1590 meters
distant for road, railroad line, and power transmission line, respectively. The results of Hannah
Dunevitz’s inspection of the Wacouta Bay site in 1991 and 1992 revealed the dominant and
subdominant overstory species of the roost to be sugar maple (Acer saccharum) and basswood
(Tilia americana), with 24 and 13 inch average dbh (diameter at breast height), respectively. The
average age of the roost forest is estimated to be 121 years. The floodplain portion of the study
site had dominant overstory species of silver maple and cottonwood (Populus deltoides), with 11
and 35.1 dbh respectively.
The Reads Landing study site encompassed an area of 194.97 hectares. The roost
encompassed 28.8 hectares, of which 24.8 hectares were land. The roost was basically flat with
an average slope of 1.2 degrees (range: 0 to 4.2), making the aspect negligible. The roost lies
14
190 meters from the estimated ice-free water. The roost was 620, 550, and 1900 meters away
from the nearest road, railroad line and power transmission line, respectively. The nearest power
transmission line visible from the roost was 2670 meters distant. Forest composition indices for
the roost include silver maple as the dominant overstory species, with an average height of 77
feet. Crown closure ranged from 51 - 75 percent. The forest averaged 69 years old. The basal
area averaged 101 square feet per acre. Snags averaged 10.75 per acre. For the entire study area,
the basal area averaged 59 square feet per acre.
The Zumbro Bottoms study site encompassed an area of 188.0 hectares. The roost
encompassed 21.8 hectares, of which 14.8 hectares were land. The roost was basically flat with
an average slope of 1.1 degrees (range: 0 to 4.2). This makes the aspect negligible. The roost
lies 2250 meters from the estimated ice-free water. The roost was 470, 1310, and 1810 meters
distant from the nearest road, railroad line and power transmission line, respectively. All of these
were estimated to be visible from the roost. Forest composition indices for the roost include
silver maple as the dominant overstory species, with an average height of 84 feet. The
subdominant overstory species was cottonwood with an average height of 89 feet. Crown closure
ranged from 76 to 100 percent. The forest averaged 47 years old. The basal area averaged 120
square feet per acre. Snags averaged 5.5 per acre.
The Eagle Valley study site encompassed 150.2 hectares. The roost encompassed 6.8
hectares, all of which is land. The slope of the roost averaged 24 degrees (range: 3 - 42 degrees).
The aspect was generally to the east, averaging 94 degrees (range: 34 to 354 degrees). The roost
lies 740 meters from the estimated ice-free water. The roost was 120, 140, and 6,160 meters
distant from the nearest road, railroad, and power transmission line, respectively. The nearest
road and railroad that was estimated to be visible from the roost lay 320 and 410 meters distant,

15
respectively. Red oak (Quercus rubra) and white oak (Quercus alba) are the dominant overstory
species in the roost. Subdominant overstory species included sugar maple and bigtooth aspen
(Populus grandidentata). The basal area for the roost was 162 square feet per acre. The density
was 145 trees per acre.
Three sites had no slope, and two (Wacouta Bay and Eagle Valley) had average slopes of
24 degrees. The maximum slope was 42 degrees at the Eagle Valley site. Three sites had no
important aspect, and two had aspects generally northeast and east. The site closest to ice-free
water was Colville Park, at 120 meters. The site most distant from ice-free water was Zumbro
Bottoms, at 2250 meters. The closest road to a roost site was at the Eagle Valley site, at 120
meters. However, this road is not visible from the site. The nearest visible road is at the Eagle
Valley site, at 320 meters.
The roost sites themselves as well as the wider study area were predominantly covered by
mature silver and sugar maples, red and white oak, and cottonwood trees. Forest stands were
generally mature, with high crown closure and understory cover (See Appendix A).
The predictive model assigned an ordinal-scale ranking to areas in the upper Mississippi
River valley. It made fairly reasonable predictions as to the potential for future roost habitat, as
evidenced by the known sites falling within areas of high potential suitability scores (Figure
Seven). The predictive model generated an interval scale ranging from 3, the least likely be be
suitable for roosting, to 33, the most likely to be suitable. Due to it’s coarse resolution and age,
the GIRAS landcover data set did not identify land at the Colville Park roost site at all. The other
roost sites had predicted suitability values ranging from a low of 18 at Eagle Valley (range 18 –
20), 22 - 25 at Zumbro Bottoms, 26 at Wacouta Bay, and 24 – 31 at Reads Landing.

16
Discussion
It was thought that slope would be an important factor in the siting of bald eagle night
roosts. While slope clearly afforded a degree of protection from winds on the Wacouta Bay and
Eagle Valley sites, slope made little contribution to wind protection in the other three sites. As
expected, those sites with a significant slope had aspects facing away from the prevailing winter
winds. It must also be noted that when wind direction changes, the location of the nights roost
may also change. A slope providing protection from a northwesterly wind provides little
protection from a southeasterly wind. When the winds shift, eagles may roost in other areas. This
is why the predictive model does not select for a certain slope or aspect. Under varying weather
conditions, eagles may need a variety of habitats to protect them from the elements.
As indicated in the literature, proximity to ice-free water appeared not to be a limiting
factor for eagle roosts. Reported distances from roost sites and food sources range from 0.25 km
to 24 km (Chester, et al. 1990).
Camp et al. (1997) suggest using viewsheds as complements to buffer zones for the
restriction of human activity around Golden Eagle (Aquila chrysaetos) nesting sites. Camp noted
the Dual Disturbance Threshold Model developed by McGarigal et al. (1991) which
hypothesizes that wildlife responds to approaching humans physiologically (agitation distance)
before they respond behaviorally by flushing (flushing distance). Physiological responses
(increased heart rate, diverted attention) can have adverse effects on nesting success. Camp et al.
(1997) suggest using the viewshed as calculated using GIS techniques as an estimation of the
agitation distance of wildlife.

17
Other researchers have found that bald eagles prefer to perch and roost in areas at some
distance from human disturbance. Human disturbance types have been variously described as
developed or agricultural landcover (Beuhler, et al., 1992), houses, dirt or paved roads, fields,
forest harvest areas, major powerlines and campgrounds (Chester et al., 1990).
Chester et al.. found that bald eagles in North Carolina in the summer perched closer to
houses and powerlines and further from paved roads and campgrounds than random sites. This
could perhaps be attributed to the inanimate nature of powerlines and (to a lesser degree) houses,
and the more active disturbance from active campgrounds and roads. As indicated in the
literature, bald eagles prefer mature forest stands and large trees for roosting sites (Martell,
1992; Steenhof, 1980; Chester, 1990; Buehler, 1991).
The predictive model developed an ordinal scale where a greater value indicated a
greater predicted potential as roost habitat suitability. The predictive model evaluated areas
based on three attributes:
• The presence or absence of forest landcover
• The distance an area was from the nearest predicted area of ice-free waters
• The distance an area was from the nearest road.
The distance from the nearest road factor was given less importance in the model than the
distance from the nearest ice-free water factor. This recognizes the relative importance of these
two factors (Tom Dunstan, personal communication). The locations of the known roost sites are
shown superimposed on the results of the predictive model in Figure Seven. Most known roost
sites fell in the middle to upper range of the predicted suitability values.
The predictive model could be improved by employing an up-to-date landcover dataset,
as well as one that provided more detail on forest composition. The relative importance of
18
distance from roads compared to distance to ice-free water was an estimation. Further studies
into bald eagle reactions to different types of disturbances may help to determine the relationship
between the two factors explored in the model.
ACKNOWLEDGEMENTS
• The St. Mary's University of Minnesota Resource Analysis Department; especially those who
served on my committee: Dr. John Nosek, Rory Vose, and Hank DeHaan.
19
• The Resource Studies Center, Winona, MN for their expertise and generosity.
• The Minnesota Department of Natural Resources for funding.
• Bonnie Erpelding, MN DNR, for the idea and assistance.
• Randy Urich, Dan Oles, and the forestry crew of the LaCrescent, MN office, U.S. Army
Corps of Engineers, for fieldwork and GIS assistance.
• Brett Mandernack, manager of Eagle Valley, for kind assistance.
• Joan Galli, MN DNR, for ice-cover information.
• The creature itself, Haliaeetus leucocephalus.
• Kathryn Scott, for support and guidance.
REFERENCES
Anderson, J.R., E.E. Hardy, J.T. Roach, and R.E. Witmer. 1976. A land use and land
cover classification system for use with remote sensor data. U.S. Geol. Surv. Prog. Paper 964.
20
Anderson, M., S. Will-Wolf, and E.A. Howell. 1996. Eagle Valley Nature Reserve, Part
1: Site Analysis and Master Plan. University of Wisconsin-Madison.
Buehler, D.A., T.J. Mersmann, J.D. Fraser, and J.K.D. Seegar. 1991. Nonbreeding Bald
Eagle Communal and Solitary Roosting Behavior and Roost Habitat on the Northern Chesapeake
Bay. Journal of Wildlife Management. 55(2):273-281.
Camp, R.J., D. T. Sinton, and R.L. Knight. 1997. Viewsheds: a complementary
management approach to buffer zones. Wildlife Society Bulletin, 25(3):612-615.
Chester, D.N., D.F. Stauffer, T.J. Smith, D.R. Luukkonen, J.D. Fraser. 1990. Habitat Use
by Nonbreeding Bald Eagles in North Carolina. Journal of Wildlife Management. 54(2):223-234.
Dunnevutz, Hannah. 1997. Unpublished report.
Dunstan, Thomas C. Department of Biological Sciences, Western Illinois University,
Macomb. IL. Personal Communication. 23 April. 1998.
Erpelding, Bonnie. Minnesota Department of Natural Resources, Nongame Wildlife
Division. Personal Communication. 1997.
Martell, M. 1992. Bald Eagle Winter Management Guidelines. U.S. Fish and Wildlife

21
Service.
McGarigal, K., R. Anthony, and F. Issacs. 1991. Interactions of humans and bald eagles
on the Columbia River estuary. Wildlife Monographs no. 115. Wildlife Society, Bethesda, MD.
Miller, M. and L. Pfannmuller. 1991. 1990 Bald Eagle Population in Minnesota.
Minnesota Department of Natural Resources Section of Wildlife – Nongame Wildlife Program,
Biological Report No. 38., State of Minnesota.
Stalmaster, M. 1987. The Bald Eagle. New York. Universe Books.
Steenhof, K., S. Berlinger, and L. Fredrickson. 1980. Habitat Use by Wintering Bald
Eagles in South Dakota. Journal of Wildlife Management. 44(4):798-805.