Characterization of a miniature, ultra-high-field, ion
24
ORIGINAL RESEARCH Characterization of a miniature, ultra-high-field, ion mobility spectrometer Ashley Wilks & Matthew Hart & Andrew Koehl & John Somerville & Billy Boyle & David Ruiz-Alonso Received: 29 February 2012 / Revised: 14 June 2012 / Accepted: 22 June 2012 / Published online: 30 August 2012 # Springer-Verlag 2012 Abstract By combining a multiple micron-gap ion separa- tor with a novel high-frequency separation waveform drive topology, it has been possible to considerably extend the separation field limits employed in Field Asymmetric Ion Mobility Spectrometry (FAIMS)/Differential Mobility Spec- trometry (DMS); giving rise to an Ultra-High-Field opera- tional domain. A miniature spectrometer, based around the multi-micron-gap ion separator and ultra-high-field drivers, has been developed to meet the continuing industrial need for sensitive (sub-ppm), broadband and fast (second time- scale) response volatile chemical detection. The packaged miniature spectrometer measures 12×12×15 cm, weighs 1.2 kg and is fully standalone; consisting of the core multi-micron gap ion separator assembly and RF/DC elec- tronic drivers integrated with pneumatic handling/sample conditioning elements, together with ancillary temperature, flow and humidity sensing for stable closed loop operation (under local microprocessor control). The combination of multiple micron-gap ion separators with the novel high- frequency separation waveform drive topology enables ion separations to be performed over scanning electric field ranges of 0 to >75 kV·cm −1 (0 to >∼320 Td at 101 kPa), offering a potential solution to trace and ultra-trace chemical detection/monitoring problems, that conventional IMS and DMS/FAIMS may otherwise find challenging. In this ultra- high field operational regime effective ion temperatures may be “swept” from ambient to >1000 K because critically , the effective ion temperature scales to at least the square of the applied field. With this field induced ion heating a con- trolled manipulation (or switching) of the ion chemistry within the separation channel (the ion drift region) may be invoked. For example, ion fragmentation via thermal dissociation can be induced. Chemical separation and iden- tification is thus derived from the unique kinetic and ther- modynamic behavior of ions assessed over a very broad effective temperature range. In addition to describing the novel miniature spectrometer, this paper addresses key aspects of ultra-high-field operation, which render it distinct from traditional ion mobility technologies and principles. In particular, this paper essays a model of ultra-high-field operation and highlights model deviations, whilst providing clear theoretical explanation backed up with experimental evidence. Keywords FAIMS . DMS . Ultra-high-fields . Rapid thermal modulation . Ion kinetics . Miniature spectrometer Introduction Since its conception in the early 1980’ s[1] and first publi- cation in the early 1990’ s[2] Differentially Mobility Spec- trometry (DMS)/Field Asymmetric Ion Mobility Spectrometry (FAIMS) has become recognized as a useful tool in the separation and characterization of gas phase ions. Two clear and differentiable separator configurations have become well established; the cylindrical design [3] and the planar design [4] and the associated operational models for each of these core designs have been discussed in some detail, e.g. [5]. A broad range of specific applications of the technology (toward the solution of challenging chemical A. Wilks (*) Owlstone Inc., 761 Main Avenue, Norwalk, CT 06851, USA e-mail: [email protected] M. Hart : A. Koehl : J. Somerville : B. Boyle : D. Ruiz-Alonso Owlstone Ltd, 127 Cambridge Science Park, Cambridge CB4 0GD, UK Int. J. Ion Mobil. Spec. (2012) 15:199–222 DOI 10.1007/s12127-012-0109-x
Transcript of Characterization of a miniature, ultra-high-field, ion
ORIGINAL RESEARCH
Characterization of a miniature, ultra-high-field, ionmobility spectrometer
Ashley Wilks & Matthew Hart & Andrew Koehl &John Somerville & Billy Boyle & David Ruiz-Alonso
Received: 29 February 2012 /Revised: 14 June 2012 /Accepted: 22 June 2012 /Published online: 30 August 2012# Springer-Verlag 2012
Abstract By combining a multiple micron-gap ion separa-tor with a novel high-frequency separation waveform drivetopology, it has been possible to considerably extend theseparation field limits employed in Field Asymmetric IonMobility Spectrometry (FAIMS)/Differential Mobility Spec-trometry (DMS); giving rise to an Ultra-High-Field opera-tional domain. A miniature spectrometer, based around themulti-micron-gap ion separator and ultra-high-field drivers,has been developed to meet the continuing industrial needfor sensitive (sub-ppm), broadband and fast (second time-scale) response volatile chemical detection. The packagedminiature spectrometer measures 12×12×15 cm, weighs1.2 kg and is fully standalone; consisting of the coremulti-micron gap ion separator assembly and RF/DC elec-tronic drivers integrated with pneumatic handling/sampleconditioning elements, together with ancillary temperature,flow and humidity sensing for stable closed loop operation(under local microprocessor control). The combination ofmultiple micron-gap ion separators with the novel high-frequency separation waveform drive topology enables ionseparations to be performed over scanning electric fieldranges of 0 to >75 kV·cm−1 (0 to >∼320 Td at 101 kPa),offering a potential solution to trace and ultra-trace chemicaldetection/monitoring problems, that conventional IMS andDMS/FAIMS may otherwise find challenging. In this ultra-high field operational regime effective ion temperatures may
be “swept” from ambient to >1000 K because critically, theeffective ion temperature scales to at least the square of theapplied field. With this field induced ion heating a con-trolled manipulation (or switching) of the ion chemistrywithin the separation channel (the ion drift region) may beinvoked. For example, ion fragmentation via thermaldissociation can be induced. Chemical separation and iden-tification is thus derived from the unique kinetic and ther-modynamic behavior of ions assessed over a very broadeffective temperature range. In addition to describing thenovel miniature spectrometer, this paper addresses keyaspects of ultra-high-field operation, which render it distinctfrom traditional ion mobility technologies and principles. Inparticular, this paper essays a model of ultra-high-fieldoperation and highlights model deviations, whilst providingclear theoretical explanation backed up with experimentalevidence.
Keywords FAIMS . DMS . Ultra-high-fields . Rapidthermal modulation . Ion kinetics . Miniature spectrometer
Introduction
Since its conception in the early 1980’s [1] and first publi-cation in the early 1990’s [2] Differentially Mobility Spec-trometry (DMS)/Field Asymmetric Ion Mobil i tySpectrometry (FAIMS) has become recognized as a usefultool in the separation and characterization of gas phase ions.Two clear and differentiable separator configurations havebecome well established; the cylindrical design [3] and theplanar design [4] and the associated operational models foreach of these core designs have been discussed in somedetail, e.g. [5]. A broad range of specific applications ofthe technology (toward the solution of challenging chemical
A. Wilks (*)Owlstone Inc.,761 Main Avenue,Norwalk, CT 06851, USAe-mail: [email protected]
M. Hart :A. Koehl : J. Somerville : B. Boyle :D. Ruiz-AlonsoOwlstone Ltd,127 Cambridge Science Park,Cambridge CB4 0GD, UK
Int. J. Ion Mobil. Spec. (2012) 15:199–222DOI 10.1007/s12127-012-0109-x

and biochemical separation problems) have also been de-scribed. These include uses of the technology in stand-aloneform, e.g. [6], hyphenated with Mass Spectrometry, e.g. [7,8] and hyphenated with Gas Chromatography, e.g. [9–14].A comprehensive technology applications review was givenby Kolakowski and Mester [15] and significantly a compre-hensive text dedicated to the fundamental science behindDMS/FAIMS was published 2 years later [16]. Since 2009there have been numerous more works relating instrumentaldevelopments and applications (including; [17–25]), evolv-ing both the fundamental scientific understanding of thetechnology and appreciation of its broader analytical utility.
The present authors have been developing DMS/FAIMStechnology since 2004 and the result of this effort has beenthe realization of what can be shown to be a miniaturespectrometer with a unique mode of operation. A significantaspect in technology realization has been the ability to drivea planar variant of DMS/FAIMS, at extremely high (Ultra-High) fields (>75 kV·cm−1, >320 Td at 101 kPa). In theearly days of development the effects of operating an ionseparation system at these ultra-high-fields were not fullyunderstood; it was believed that models applicable to DMS/FAIMS would directly extend and be sufficient for spectralprediction/interpretation. Detailed data analysis and theoret-ical work has since revealed that the traditional modelapproximations breakdown; in particular the truncated formof the α-function, describing the field dependence of ionmobility, is no longer effective. This is thought to be largelydue to the extremely high effective ion temperatures (Teff)generated at ultra-high-fields, given that Teff scales to at leastthe square of the applied field.
On the basis of our up-to-date understanding, presentDMS /FAIMS model approximations do not adequatelyrepresent the separation principles when operating at ultra-high fields. Importantly, the kinetics and thermodynamics ofions within the separation region are fundamental drivers inthe separation and identification process and these are ma-nipulated by a rapidly scanning electric field. The scanningelectric field enables effective ion temperatures to be eval-uated from ambient to >1000 K on single-second time-scales. Chemical separation and identification is ultimatelyderived from the unique kinetic and thermodynamic behav-ior of an ion that is generated from the analytical sample.Specifically, information relating to the field dependent mo-bility and fragmentation pattern of individual ions may beextracted and utilized in chemical classification.
In introducing the model of operation it is necessary tostart with a discussion of the principles of electric-field-based gas-phase ion separations and in particular the well-established concept of ion mobility in a neutral drift gas. Theminiature spectrometer described herein utilizes an oscillat-ing electric field and does therefore have clear parallels withconventional DMS/ FAIMS operating at lower applied fields
(<35 kV·cm−1, ∼150 Td at 101 kPa, 101.3 kPa.). It is thusessential to provide an overview of DMS/FAIMS basedseparation principles before expanding the discussion toincorporate the principles and differentiators associated withultra-high-field operation that ultimately define the uniquemodel of operation.
Foundations
Under standard conditions (101.3 kPa and 293.15 K) and ina low electric field (<5 kV·cm−1) the mobility coefficient (K,m2·V−1·s−1) of a singly charged ion, in a neutral drift gas, isprincipally governed by its reduced mass μ (kg) and colli-sional cross section Ω (m2). K can be approximated by thewell-known Mason-Shramp equation [26], where e is theelementary charge constant (∼1.602×10⁻¹⁹ C), Teff the gastemperature (K), kb Boltzmann’s constant (J·K−1) and N themolecular density of neutrals in the gas (the drift gas)supporting the ion (2.503×1025 m−3)—
K ¼ 3e
16N� 2p
μkbT
� �12
� 1Ω
ð1Þ
Under increasing (but sub-ultra-high-) field conditionsthe local temperature (or effective temperature—Teff) of theion begins to rise and can no longer be approximated to thegas temperature. With this increase in temperature the clus-ter ion is modified, it may expand (via the thermal popula-tion of rotationally and vibrational excited states) or contract(through the loss of a neutral entity, e.g. a weakly dipole- orinduced-dipole-bound solvent molecule derived from thedrift gas). This will lead to a modification of the collisionalcross-section parameter (Ω). At these higher applied fields,Ω is replaced by the effective-ion-temperature dependentcollisional cross-section parameter (Ω(Teff)) and the gastemperature T by Teff (Eq. 2).
K Teff
� � � 3e
16N� 2p
μkbTeff
� �12
� 1
Ω Teff
� � ð2Þ
At constant N (i.e. gas constant pressure) the mobilitycoefficient K is thereby electric field dependent by virtue ofthe influence of the electric field on Teff and K is thereforemolecular specific on the basis of its dependence on Ω. Thisphenomenon is exploited for molecular separation and iden-tification in DMS/FAIMS based systems. By passing anionized gas through the gap between a pair of electrodes,over which an oscillating asymmetric electric field is ap-plied, the mobility of the ion will oscillate between a low-field mobility K0 (which may be approximated to be repre-sentative of the reduced mobility coefficient (K0) i.e., themobility at an applied field of low magnitude, where Teff ≈T) and a high-field mobility KE. The change in K (ΔK)
200 Int. J. Ion Mobil. Spec. (2012) 15:199–222

occurring in the high-field portion of the asymmetric wave-form is a result of a high-field influence on Teff and Ω(Teff).
Field dependence of K
At Standard Temperature and Pressure (STP) the field de-pendency of KE (at least to an approximation over a mod-erate field range i.e., ∼0–35 kV·cm−1) may be related to thelow-field mobility K0, through Eq. 3, whereby α is thefunction of the KE/K0 versus E curve, e.g. [16, 27].
KE ¼ K0 1þ aðEÞ½ � ð3ÞThe α-function is polynomial expandable in even powers
(Eq. 4), where the coefficients α2, α4…αn, are specific tothe ion, and more importantly the parent molecule (or mo-lecular fragment) forming the ion.
KE ¼ K0 1þ a2E2 þ a4E
4:::þ anE2n
� � ð4ÞUnder the aforementioned moderate field ranges the
high-order terms can usually be neglected since they are ofdiminishing significance (in the realms of experimentalprecision) and Eq. 4 can be truncated to the fourth order—
KE ¼ K0½1þ a2E2 þ a4E
4� ð5ÞSince DMS/FAIMS systems utilize a non-perfect square
waveform to drive the oscillating field (Fig. 1), it is ex-tremely important that E is accurately defined. E is the zero-to-peak amplitude of the electric field generated by a wave-form of zero-to-peak voltage (VD) across electrodes of gapseparation g (cm−1). This is referred to as the DispersionField—ED (kV·cm−1).
This variable field definition is very important since theassumption that K0 is representative of the low-field mobil-ity does not hold up well at very high fields (where the fieldacross the separation electrodes will actually be significantin the “low field” portion of the applied asymmetric field).This is potentially one of the aspects of ultra-high-fieldoperation that distinguishes it from variants of FAIMS/DMS, which operate over a lower range of ED (∼0–35 kV·cm−1 c.f., 0–75 kV·cm−1) and absolutely stressesthe approximations associated with the truncation of the α-function to only the fourth order. We shall go on to evaluatethis aspect throughout this paper.
The α-coefficients in Eq. 5 are very small relative to E(∼10−5, ∼10−9 respectively) and may be positive or negativein sign. The ratio KE/K0 may therefore be >1 or <1, reflect-ing the fact that the high-field mobility K(E) may be lessthan, or greater than, the low-field mobility at various pointsacross the KE/K0 versus E curve. By the same token we cansay that ΔK (defined as KE–K0) is positive in sign when thehigh-field mobility exceeds the low-field mobility and neg-ative in sign when the opposite is the case. For low and
medium molecular weight species (e.g. volatile and semi-volatile organic compounds of molecular weight<∼300 g·mol−1) ΔK will typically range from 0 % to10 % of the low field mobility (K0) and this should be keptin mind (i.e. the differential mobility is small relative to low-or high-field mobility).
In rough terms, a positive ΔK is observed when the ion“shrinks” (i.e. the Ω decreases) on the transition between thelow-field and high-field portion ED, while a negative ΔK isobserved when the ion “expands” (i.e. Ω increases) on thetransition. The Ω(Teff) function is very nonlinear and isdependent on a variety of molecular specific physical andchemical properties (e.g. ion clustering/declustering kineticsand the efficiency of energy transfer during ion-neutralmolecular collisions). As such, the sign of ΔK can changewith increasing ED.
Separation mechanism
Post ionization, ions are transported transversely (perpen-dicular to the applied field) through the separator electrodesin a uniform gas flow. At constant ED theΔK induced by theoscillating asymmetric field manifests as alternation of thelongitudinal (parallel to the field) drift velocity (νD, cm·s−1)between the high-field portion of the applied waveform (of aduration τ, s) and low-field portion of the applied waveform(of a duration t, s). This is illustrated in Fig. 2.
The longitudinal drift velocity is given by the relationνD0K·E. When KE>K0, νD will be higher (and the longitu-dinal distance covered by the ion greater) in the high-fieldportion of the applied waveform. Conversely, it will belower (and the longitudinal distance covered by the ion less)in the low-field portion of the applied waveform. WhenKE<K0 the opposite will apply. Simply, the direction ofthe longitudinal drift will depend on the sign of ΔK; thenet drift being in the direction of one separator electrodewhen ΔK is positive in sign and toward the opposite elec-trode when ΔK is negative in sign. At a given ED, only ionsof ΔK00, or else those whose drift velocities are matchedsuch that the longitudinal high-field drift path length dh (cm)is equal to the longitudinal low-field drift path length dl
1,will be carried fully parallel to the gas flow and detected(Fig. 2). Other ions will be neutralized on the separatorelectrodes. Clearly, the condition where ΔK00 (i.e. KE/K001) is very precisely field dependent (as Fig. 2 illustrates)and only true at relatively high, or else very low, ED.Nevertheless, subtly tuning EC (∼±5 %) around a givenED set point will be sufficient to offset any net longitudinaldrift experienced by an ion of a given ΔK. This tuning fieldis referred to as the Compensation Field (EC) and in
1 Through the relation dh 0 νD(h)·τ and dl 0 νD(l)·t, where νD(h) are νD(l)are the respective high- and low-field drift velocities
Int. J. Ion Mobil. Spec. (2012) 15:199–222 201

sweeping EC, ions are selectively filtered on the basis oftheir ΔK. Further, since ΔK exhibits molecular speci-ficity and is a strong function of ED, the ion currentoutput obtained when stepping ED in combination witha sweeping EC offers a highly molecular-selective out-put. This EC:ED output is the Dispersion Spectrum,which will be familiar from DMS/FAIMS.
Standardization of electric field to E/N
The mobility co-efficient K is pressure dependent by virtueof the 1/N dependency in Eqs. 1 and 2. Normalization withrespect to pressure is therefore essential to overcome theeffects of natural meteorological and altitude variations andE (V·m−1) is replaced with E/N (V·m2). The importance ofthis has been explicitly discussed by Nazarov et al. [28]. At
STP (101.3 kPa and 295.15 K) N (m−3) is very large(2.503×1025 m−3) and E/N and very small (∼10−19 V·m2 atE0200 kV·cm−1 under the same STP condition). A moreconvenient unit in E/N expression, for spectral representa-tion, is the Townsend (Td), where 1 Td010−21 V·m2.
Logistics of ultra-high field operation
Operation at ultra-high-fields requires the use of verynarrow-gap (micron-scale) ion separators (Fig. 3), in orderto relax the engineering challenges associated with wave-form driver design [29]. Minimizing this gap ultimatelyenables higher fields to be generated with lower voltageand smaller form-factor waveform drivers. That said; wave-form driver development requires an exceptional apprecia-tion for magnetic circuit design. The development of high-
Fig. 1 a Idealized square rectangular waveform and actual waveform(b) whereby HF and LF respectively represent the high field and lowfield portion of the applied field. The Dispersion Field (ED) is defined
by the zero-to-peak voltage of the applied waveform (VD) across theelectrodes that form the ion separator (see also Fig. 2)
Fig. 2 Ion Drift in an oscillating electric field. A variable high-voltageasymmetric waveform of low-voltage-pulse duration t (s) and high-voltage duration τ (s) and peak voltage VD is applied between electro-des of gap g (cm), creating a variable Field of VD/g (kV·cm
−1), throughwhich ions oscillate and adopt a net longitudinal drift path length (dh–dl), which is determined by their high- and low-field drift velocity
(νD(h) and νD(l)) and the high field/low field pulse duration. A bias DC“tuning voltage” (Vc) applied on top of the applied waveform enablessubtle adjustment of VD to counter the drift experienced by an ion of aspecific ΔK, where ΔK is the difference between the high field ionmobility (KE) and low field ion mobility (K0)
202 Int. J. Ion Mobil. Spec. (2012) 15:199–222

voltage, high-frequency asymmetric waveforms, with a“size and power” optimized topology, has in some respectsbeen a beyond state-of-the-art exercise and this paper there-fore strives to articulate an unambiguous separation wave-form analysis.
Use of such narrow gaps also warrants the use of shortion separation channels and substantially higher asymmetricwaveform frequencies, as compared to those employed in alarger-gap design; such as described by Krylov et al. [30],(300 μm c.f. 1 cm and 27 MHz c.f. 1 MHz respectively).Short ion separation channels must be employed in order tomaximize ion transmission, and high waveform frequenciesmust be employed such that a sufficient number of ionoscillations may occur (in a short ion separation channel)to promote ion separation, as has been discussed byShvartsburg et al. [31]. The combination of high frequencyand short channels means that ion-molecule collisions areminimized in the low field (LF) and high field (HF) periodof the applied waveform (between which, ion-chemistry ismanipulated) as well as in the short timescale (μs) transitthrough the channel (Fig. 4). This has some profound effectson ion chemistry, since separation timescales become morecomparable to natural ion-neutral collision frequencies atatmospheric pressure (∼5 GHz). Short-lived ion fragmentsgenerated within the ion separator may therefore be observedand utilized in classification, as we shall go on to discuss laterin this paper.
Instrumental specifics
The ion separator (as was illustrated in Fig. 3) consists of 27ion channels of gap width (g)034.5 (±0.2) μm2 and length(L)0300 (±5) μm. It is fabricated by etching a 37 mm longserpentine channel into a silicon wafer to form a 1.2 mm2
open area. The gap surfaces are made of high-conductivity
silicon and are electrically connected via wire bonding tometal pads on the face of the silicon. The chip is packagedand mounted onto a bespoke high-temperature co-fired ce-ramic (HTCC) package.
The asymmetric waveform is synthesized using a proprie-tary Radio Frequency (RF) circuit design. The RF outputcontains significant higher-order terms but can be approximat-ed by 2 sinusoids—a fundamental and its first harmonic. Thefirst harmonic is 1/2 the amplitude of fundamental and 90° outof phase, yielding a waveform described by the function:
V ðtÞ ¼ sin w1tð Þ þ 0:5cos w2tð Þ ð6ÞWhere ω1 and ω2 are the angular frequencies of the
fundamental and first harmonic, respectively, and V is thevoltage (V). A digital oscilloscope recording of the wave-form as applied across the ion separation electrodes wasshown in Fig. 1(b).
The amplitude of the waveform in the high-field segment(VD) is variable up to ∼250 V corresponding to a dispersion
Fig. 3 The “inter-digitated” micro-fabricated ion separator utilized forultra-high-field operation (based on a design first presented byBoyle et al.[29]). a Etched ion separator in sensor package, bMagnification of sensorsurface showing serpentine ion separator channels (of 35 μm separation
gap), c Simulation of cross-section through senor showing parallel sepa-ration channel arrangement (with schematic of ion passing through achannel overlaid where ΔE denotes the applied field)
Fig. 4 Schematic representing ion transport through the ion separatorshown in Fig. 3. Ion–neutral collisions (of ∼5 GHz in frequency)during each high-field (HF) and low-field (LF) cycle, at operationalpressure (∼100 kPa), are relatively few
2 The ion filter has a manufacturing specification in the channel widthof 35±0.6 μm. The measurement tolerance on the channel width aftermanufacture is 0.2 μm.
Int. J. Ion Mobil. Spec. (2012) 15:199–222 203

field (ED) range of 0–75 kV·cm−1 (equivalent to ED/N00–320 Td under standard atmospheric operational con-ditions, 101.3 kPa). The addressable ED resolution is14 V·cm−1 corresponding to ED/N061 mTd under thesame conditions and may be stepped at rates of up to10 divisions per second parallel with the “tuning” com-pensation field sweep (EC).
EC is generated by a DC voltage superimposed on theasymmetric waveform as was illustrated in Fig. 2. The DCvoltage may be swept in a range of ±8 V with <2 mVaddressable resolution at a rate of 1.3 ms·step−1, yieldingan EC of ±2.3 kV·cm−1 and <1 V·cm−1 resolution (equiva-lent to EC/N±10 Td, with 2 mTd resolution under standardatmospheric pressure operational conditions). A sweep of±6 Td more than adequately suffices (as one approachesmaximum ED/N) for volatile and semi-volatile compounds(MW<350 AMU).
Ions are carried through the ion separator in air at ambi-ent pressure. The ion source is a custom designed coronadischarge that generates both positive and negative ions.The ion separator may be heated in a range of ambient to60 (±1)°C and is monitored/stabilized by means of a tem-perature sensor (TC74A5-5.0VAT;Microchip Inc, Chandler,AZ) in feedback loop with the heater controller. The inletsample may be diluted in a ratio ranging from 3:1 to 30:1 ina recirculating dry and purified air flow, whereby the airexiting the ion separator is purified through an activatedcharcoal and molecular sieve “scrubber” with integratedparticulate filter. The standard flow rate through the ionseparator is 380 (±10) cm3·min−1 and the sample inlet todiluent flow ratio is controlled by a variable solenoid valveat the outlet of the sensor assembly (where the sensorassembly is defined as an assembly of the ion source, ionseparator package, ion detector and ancillary sensing devi-ces, Fig. 5). An exhaust solenoid placed in front of thevariable solenoid allows for complete air recirculation (i.e.shut-off of the inlet sample flow) providing protection from
contamination scenarios. Air is pulled through the sensorassembly by means of a rotary vane pump. A temperatureand pressure sensor (BMP085; Bosch, Gerlingen, Germany)is mounted at the exit of the sensor assembly to accuratelymonitor the gas temperature and pressure. A humidity andtemperature sensor (SHT15: Sensirion AG, Stäfa, Switzer-land) is mounted at the sample inlet to monitor these ambi-ent (environmental) variables (Figs. 6 and 7)
The ion detector electrode consists of a gold plated hex-agonal grid of 6×0.5 mm holes positioned 1 mm after thechip and biased at ±30 V on alternating sweeps of EC forcation and anion detection. The ion current impacting theelectrode is measured by a Transimpedance Amplifier(TIA). As standard a EC sweep time of 420 ms with 400EC steps, yields a sampling time of approximately1 ms·step−1. Ion current response data is passed to a localprocessor (ARM 7- TDMI, Texas Instruments, Dallas, TX),which serves also to set spectral acquisition parameters (EC
range, ED range, step size, etc.). High-level systems controlis performed by a laptop PC (Latitude E5500; Dell Inc,Round Rock, TX), with a custom control/data acquisitionuser interface (LabVIEW 8.5; National Instruments, Austin,TX) which is linked by USB to the local processor. This userinterface also serves to present spectral data in real time andlog data for offline analysis.
Separation waveform analysis
As was noted in the introduction, the generation of a high-voltage, high-frequency asymmetric waveform is non-trivial. RF circuits are inherently non-linear, so the separa-tion waveform applied across the ion separator must be wellcharacterized through the operational field range. The wave-form employed by the authors closely matches the sum of 2sinusoids described by Eq. 6 but is non-ideal. The peakwaveform voltage is not a linear function of the bias appliedto the RF oscillator (or, more specifically, the equivalentcircuit formed by the RF circuit coupled to the ion separa-tor) and the precise function of the waveform exhibits somedependence on this bias voltage. Comparisons against aFAIMS/DMS model can only be made with clear quantifi-cation of critical waveform parameters through the opera-tional field range. These critical parameters are; i) the power(and thus V) transfer function—Vp(Vb), ii) the peak voltagevs. frequency response—ω(Vp) and iii) the precise functionof the waveform—f(t). The importance of i) is automaticallyrealized through inspection of Eq. 3 and the importance ofii) can be rationalized (when considering also the ratio of HFand LF period) in terms of its impact on ion kinetics in theHF and LF segment of the applied waveform. The impor-tance of iii) is less straightforward but a mathematical de-scription has been widely discussed [5, 32, 33]. Thisdescription reduces the separation waveform to a series of
Fig. 5 “Sensor head” arrangement of the miniature spectrometer (de-scribed in text and in Fig. 6). L represents the separation channel length(300 μm) and g the separation channel gap (34.5 μm) across which thedispersion field (ED) and compensation field (EC) is applied
204 Int. J. Ion Mobil. Spec. (2012) 15:199–222

coefficients which help define the EC:ED spectrum for agiven ion, in a separation field derived from a waveformof function f(t). The waveform coefficients are defined as—
h f ni ¼ T−1 �Z T
0f nðtÞdt: ð7Þ
where T is the period of the waveform (i.e., t + τ in Fig. 2).In the field dependence of ion mobility approximated byEq. 4 the lower-order coefficients <f2>, <f3> and <f5> are ofspecific importance.
All critical waveform parameters have been evaluatedthrough assessment of the waveform as measured across
the serpentine assembly of ion separator electrodes. The wave-formwas recorded at a range of oscillator bias voltages using ahigh-sample-rate digital storage oscilloscope and impedance-matched coupling probe. The peak and minimum waveformvoltages, as a function of the drive voltage, were then derivedto obtain the drive voltage to RF output voltage transferfunction, before subsequently deriving the separation wave-form coefficients <f2>, <f3> and <f5> and also the ω(Vp)dependencies. The data are summarized in Figs. 8 and 9.
The VP(Vb) response (Fig. 8) could be closely approxi-mated to a 3rd order polynomial, with measurement uncer-tainties scaling roughly with Vb. These were ∼±2.5 % RSD,except at the lowest Vb setting at which measurements weretaken, where an RSD of ∼ ±10 % was observed. It is to benoted that accuracy in Vp is less critical at the very low endof the scale, since at low ED/N (<25 Td) ion peaks are onlypartially resolved. On this basis one could conclude that theVp of the waveform was quantitatively characterized forprecise ED/N scaling.
The ω(Vp) response (Fig. 9a) was effectively constant(given measurement uncertainties) across the working Vp
range. Taking the mean of all measurements the wave-form frequency was defined as 27.15 (±0.04) MHz.More interesting were the derived <fn> waveform coef-ficients, which account for departures of the waveformfunction from Eq. 6 (due to the presence of higher-orderterms). The coefficients were well defined at any singleVp but varied across the working Vp range. These coef-ficients ranged from 0.1918–0.2348, 0.0634–0.1073 and0.0654–0.1052, for <f2>, <f3> and <f5> respectively. At
Fig. 6 The miniaturespectrometer; system diagram
Fig. 7 Photograph of Hardware layout excluding case work withvisible parts annotated. The “scrubber assembly slots into the baseand the pump is located at the exhaust assembly (reverse side of viewshown here). A systems diagram was shown in Fig. 6
Int. J. Ion Mobil. Spec. (2012) 15:199–222 205

the minimum Vp measurement point the measured <f3>and <f5> coefficients deviated most from the meanvalues and these points were dropped from the finalmean <fn> calculations. The <f2>, <f3> and <f5> coefficientswere thereby defined as 0.2134 (±0.0160), 0.0967 (±0.0048)and 0.0879 (±0.0070). The validity of using averaged acrossoperation field range <fn> values in spectral evaluations isaddressed in “Ion peak position”.
Definition of Ion residence time
A firm definition of the ion residence time (tres) within the ionchannel is required in order to perform effective systems vali-dation. The gas flow through the ion channel is laminar(parabolic). Ions are only detected when νD(h) 0 νD(l) (c.f.Fig. 2) and these ions emanate from the center of the ionchannel. Under a laminar flow condition the maximum flowvelocity (vmax, m·s−1) occurs at the center of the ion channel,whilst the minimum flow (vmin) velocity occurs at the edges.The average flow velocity (vAv) is defined as Q/A, where Q isthe gas flow rate (m3·s−1) and A the surface area of open flowchannels (m2). In a macro-circular channel vmax (under a lam-inar flow condition) is easily defined by the expression 2Q/A.For a rectangular (planar) micro-channel, however this relation-ship does not hold. Indeed, the accurate determination of vmax isan involved process [34]. A reasonable approximation cannevertheless be made by integrating the equation which definesthe flow velocity (vx) at any point (x), between the extremes ± x,through the cross-section of the ion channel; i.e., vx ¼ vmax1� x2ð Þ. Doing so one derives the expression vmax ¼ 3
2 � vAv ,i.e., the maximum flow velocity defining tres is 1.5 that of theaverage flow velocity and tres is given by the expression—
tres ¼ LA 1:5 � Qð Þ= ð8ÞBased on our open channel area of 1.17 mm2, channel
length of 300 μm and a typical operational flow rate of 350–400 cm3·s−1 this yields an ion residence time of ∼30–40 μs.
Model of operation
The spectral output (the Dispersion Spectrum) is analogous tothat observed in conventional DMS/FAIMS in so far as itconsists of an m × n matrix of ion current measurements at mcompensation field (EC/N) and n dispersion field (ED/N)
Fig. 9 a Measured Waveform frequencies across peak waveformvoltage range (uncertainties represent standard deviations, n03). bWaveform coefficients <f2> (black data points •), <f3> (dark greydata points ) and <f5> (light grey data points ) across peak
waveform voltage range derived from the observed waveform, (errorsfor n03 measurements relating each peak waveform voltage point were<0.005, i.e., <5 % RSD)
Fig. 8 aMeasured peak (black data points •) and minimum (grey datapoints ) waveform voltages as a function of RF waveform generatordrive voltage. The peak and minimum voltage transfer functions close-ly fits a 3rd order polynomial, y0a+bx+cx2+dx3, where constant a isfixed to 0V (R2>0.999). b Residual data (obs—fitted) for the peakwaveform voltage, where error bars are the standard deviation for threereplicate measurements across the serpentine assembly of ion separatorelectrodes
206 Int. J. Ion Mobil. Spec. (2012) 15:199–222

settings (Fig. 10). A spectral peak at fixed ED/N can be char-acterized by its Gaussian parameters, i.e., position (EC/N),height (I) and width (w). The EC:ED spectrum, which is theevolution of Gaussian response as a function of ED/N, can becharacterized by the derived Gaussian parameters. A dense EC:ED spectrum may be obtained on single second timescalesbecause ion separation times are short (∼30 μs). The EC:EDspectrum is viewed holistically in deriving information aboutthe analyzed sample and performing chemical classification.
In discussing the model of operation it is helpful to estab-lish a foundation based on the DMS/FAIMSmodel and then tobuild upon this. DMS/FAIMSmodels are well established andprovide an invaluable point of reference in the lead up to thediscussion of ultra-high-field operation. The work ofGuevremont [5], Krylov et al. [32] and Shvartsburg [16] isfundamental in the discussion that follows.
Ion peak position
At lower ED/N (<140 Td) it may be shown [32] that the peakposition (EC/N) may be approximated by considering thefield dependency of the ion–mobility coefficient (describedby the alpha-function, Eq. 5) and the Dispersion Fieldamplitude (ED/N) by the relation—
EC N= ¼ c3 ED N=ð Þ3 þ c5 ED N=ð Þ5 ð9Þ
in which the constants c3 and c5 are given by—
c3 ¼ a2hf 3i ð10Þ
c5 ¼ a4hf 5ið Þ � 3c3a2hf 2ið Þ ð11Þand <f2>, <f3> and <f5> are separation waveform coefficientsdictated by the function of the waveform from which thescanning ED/N is generated. These waveform coefficients weredefined, for the waveform employed by the present authors, in“Separation waveform analysis”. On this basis, a simulation ofthe EC:ED spectrum is possible given a knowledge of the α2
and α4 parameters. The inverse problem is solvable; i.e., α2
andα4 parameters may be derived from a statistical fit of Eq. 9to the empirical spectral data, given knowledge of the <f2>,<f3> and <f5> separation waveform coefficients.
It may be recalled from “Separation waveform analysis”that the waveform coefficients show some deviation acrossthe Vp range. In data evaluation the mean values are used.The validity of this requires consideration, given that thepeak position is dependent on these coefficients. To evaluatethis we model the EC:ED response for the acetone monomerand dimer using the minimum, mean and maximum valuesfor each of the derived coefficients recorded in Fig. 8b(ignoring the data points at Vp011V). The result is shownin Fig. 11. Whilst we do see some offset at any fixed ED/N, itshould be remembered that there is already a marginaluncertainty in the dispersion field (∼ ±2 %) from the Vp(Vb)
Fig. 10 The EC:ED spectrum represents the ion current at the output ofthe ion separator as a function of the Compensation Field (EC/N) andthe Dispersion Field (ED/N). The Ion Transmission spectrum representsthe integrated ion current for each resolved peak as a function of ED
Fig. 11 a and b Simulated EC:ED responses for the acetone monomer(a) and dimer (b) using the minimum, mean and maximum values foreach of the derived fn coefficients recorded in Fig. 8b. Black lines (—)
are the mean, light grey dashed lines ( ) are the minimums and darkgrey dashed lines ( ) the maximums. The α2 and α4 coefficientsused in spectral simulation were taken from Krylov et al. [35]
Int. J. Ion Mobil. Spec. (2012) 15:199–222 207

transfer function (Fig. 9). On this basis, any offset intro-duced from uncertainties in the waveform coefficients canbe considered relatively insignificant.
Limitations of the truncated form of the α-model and Ionbreakdown at high-field
The problem with the truncated form of the α-function(Eq. 5) is that it is only holds at lower ED/N (<150 Td). Athigher ED/N the truncated model predicts that the peak EC/Nposition → ED/N (Fig. 11), whereas real ions do not behaveas such (e.g. Fig. 12). Comparisons of Figs. 11 and 12indicate that at higher ED/N there is a need to retain higherorder α terms, as shall be addressed in “Validation anddiscussion: observed vs. theory”. It is also necessary toconsider that the KE/K0 versus E/N curve (described by theα-function) is not continuous, since ions will undergo struc-tural breakdown at sufficiently high-field. Appreciation ofwhy this is the case requires a detailed consideration of theion chemistry within the ion separator, in particular thekinetic and thermodynamic impacts resulting from the high-ly non-linear dependency of effective ion temperature (Teff)on ED/N. This is explored in “Ion peak intensity”, whichaddresses ion transmission and peak intensity.
Ion peak intensity
Understanding the relationship between ED/N and the ionpeak intensity requires a combined consideration of 1) ion
transmission through the separator (dictated by the drift gasflow rate, molecular ion diffusion and the combined length/width of the ion separation channel) and 2) ion chemistry inthe ion separator. The former is easier to address since it hasbeen well defined for the lower field (DMS/FAIMS) case byKrylov et al. [32].
Lower field range (<150Td)
The multi-channel ion separator described in “Instrumentalspecifics” is effectively an assembly of 27 parallel planarelectrodes and the ion density distribution within the ionseparation channels fits the “weak focusing” case describedby Krylov et al. [32]. However, the analysis of those authorsrationalizes in terms of peak height since for the planar ionseparator they describe, the peak width could be reasonablyapproximated as being independent of ED/N. In the case ofthe multi-channel ion separator described by the presentauthors, the peak width exhibits a dependence on ED/N (asshall be explained in “Peak width”). As such peak heightmust be substituted for peak area (integrated ion current),which is independent of broadening effects encounteredacross the ED/N scan range.
The integrated peak ion current (AI) will be a fraction ofthe “averaged over cross-section” input integrated peak ioncurrent, AI(in). In the weak focusing case AI may be approx-imated through the Equation—
AI ¼ AI inð ÞQ� exp �tresp2DII geff
2�� � ð12Þ
where Q is the gas flow rate (m3·s−1), tres the ion residencetime in the ion separator (s), DII the anisotropic ion diffusioncoefficient (m2·s−1) and geff the effective gap width (m).
geff is smaller than the physical gap width (g) and correctsfor the longitudinal (parallel to the applied field) displace-ment of an ion during a HF (dh) or LF (dl) waveform cycle(Fig. 4), noting that at the ion peak dh0dl. Using geff0g−dland (recalling from “Introduction”) that d(l) 0 υD(l)·t andυD(l)0K0Emin, geff is defined by—
geff ¼ g � K0 Emin tð Þ ð13Þwhere Emin (V·m−1) is the average field across the ionseparator in the duration of a LF cycle of the ED/N wave-form. geff is thereby proportional to 1/Emin, across the scan-ning ED/N range. Figure 13 shows that for a typical ion ofK0 ≈ 1.8×10⁻⁴ m2·V−1·s−1, this scales from geff0g (i.e.,35 μm) at ED00 kV·cm−1, through geff ≈ 25 μm at the nearmaximal ED of 75 kV·cm−1 (i.e., Emin ≈ 18 kV·cm−1, basedon the waveform described in Eq. 6); noting that geff isstrictly dependent on the field strength E (V·m−1), as op-posed E/N (V·m2).
The other field-dependent term in Eq. 12 is the aniso-tropic ion diffusion coefficient (DII), which accounts for
Fig. 12 EC:ED peak trajectories for monomer and dimers of acetone(light grey data points , ), 2-butanone (black data points •, ■) andDimethyl, Methyl Phosphonate (dark grey data points , ) obtainedexperimentally using vapor concentrations of ∼1 ppm by volume at∼10 ppm by volume H2O. Note: lines (—) are point by point beta-spline connectors through the data and serve only as a guide to the eye
208 Int. J. Ion Mobil. Spec. (2012) 15:199–222

longitudinal diffusional losses to the ion separator electrodesduring transit [16]. DII is defined by Eq. 14—
DII ¼ D 1þ hF2iFIIMK20N
20 ED N=ð Þ2 3kbTð Þ=
h ið14Þ
where M is the molecular weight of the drift gas (kg), D isthe isotropic diffusion coefficient defined by the Einsteinrelationship—
D ¼ kbTK0N0 qN= ð15Þand FII is a property of the ion–neutral molecule potential,which may be approximated by Eq. 16 (in which m is themolecular weight of the ion). The other terms appearing inEqs. 13, 14 and 15 have their previous meanings.
FII ¼ 1þ 2m M þ 2mð Þ=ð Þ ð16ÞReplacing geff and DII in Eq. 12 with an array of outputs
from Eqs. 13 and 14, computed for a specific ion species,across the operational ED/N range, we arrive at the purelyphysical field-dependent transmission behavior of the ion.This is exclusive of consideration of intra-molecular andinter-molecular ion–ion or ion–neutral interactions. In a the-oretical analysis we do this for acetone, butanone and DMMP(monomers and dimers), as well as the hydrated proton anddioxygen anion (Fig. 14). What this reveals is the strongdependency on K0, which should not be surprising given theappearance of the K0 term in Eqs. 13, 14 and 15. The FII
contribution embedded in Eq. 14 is, by comparison, a negli-gible factor in determining the transmission behavior since,usually m >> M and 2m/(M+2m) tends to unity (Table 1).
Higher field range (>120Td)
At higher ED/N (>120Td) the above transmission modelmay begin to break down. The model does not account for(in particular); the kinetic and thermodynamic aspects of ionbehavior within the ion separator, which are driven by the
field-heating effect, where we define field heating as theraising of the effective temperature of the ion to a tempera-ture exceeding its surroundings. Effective ion temperaturescales ∼(ED/N)
2 so, as one enters the ultra-high-field opera-tional regime, field heating strongly dictates the ion trans-mission behavior, since ions may dissociate, formingentities with entirely different K0 values.
The field heating process is due to the conversion ofkinetic energy acquired by ions in the applied field to thermalenergy on collision with neutrals. In the absence of an appliedfield the total energy (ET, J) of the ions and neutrals is definedby the Maxwell-Boltzmann relation; ET ¼ 3
2 kb T . In anapplied field the kinetic energy is raised by 1
2M v2D is themolecular weight average (kg) of the ions and neutrals (whichis effectively the average molecular mass of the neutral gassince the ion concentration relative to neutral carriers willalways be very low) and νD is the ion drift velocity at thediscrete applied field. Referring back to “Field dependence of
Fig. 13 a DII(ED/N) for various product ions of differing K0 (listed inTable 1) and b geff(ED/N) for the same ions. 1) dioxygen anion, 2)acetone monomer, 3) hydrated proton, 4) butanone monomer, 5)DMMP monomer, 6) acetone dimer, 7) butanone dimer, 8) DMMP
dimer. All computations are at 318K (gas temperature) and 101.3 kPawith a 388 cm·min−1 gas flow rate and system configuration as per“Instrumental specifics”
Fig. 14 a Ion transmission (without consideration of inter and intra-molecular interactions in the ion filter region) for various product ionsof differing K0 (listed in Table 1) at a gas temperature of 318K andpressure of 101.3 kPa. Numbering corresponds to ion identities shownin the caption to Fig. 13. All computations are at 318K (gas tempera-ture) and 101.3 kPa with a 388 cm·min−1 gas flow rate and systemconfiguration as per “Instrumental specifics”
Int. J. Ion Mobil. Spec. (2012) 15:199–222 209
K” it can been seen νD0K(E/N)ED and the energy (ET) cantherefore be redefined by Eq. 17, where T is the ion temper-ature in the absence of the applied field and K(E/N) is the highfield mobility (m2·V−1·s−1).
ET ¼ 3
2kbT þ 1
2M K E N=ð Þ2 ED N=ð Þ2 ð17Þ
If it is assumed that ion to neutral collisions are elasticand the kinetic energy acquired in the applied field isretained in the velocity of the ion (in a dynamic equilibriumwith its surroundings) the ion temperature will be raised toan effective temperature, Teff (K) and the total energy toET ¼ 3
2 kb Teff . Insertion of ET ¼ 32 kb Teff into Eq. 17 and
factorizing terms, Teff reduces to Eq. 18 whereby K(E/N)
is replaced by K(0).
Teff ¼ T þM K20 N
20 ED N=ð Þ2 3kbð Þ= ð18Þ
Polyatomic molecular ion clusters, however do not un-dergo elastic collisions because some of the kinetic energy isconserved and distributed amongst the rotational and vibra-tional degrees of freedom of the molecular ion. Teff willsubsequently be reduced by a factor ζ, the ion–neutralcollision efficiency factor3—
Teff ¼ T þ zM K20 N
20 ED N=ð Þ2 3kbð Þ= ð19Þ
For ion clusters of molecular weights representative ofvolatile and semi-volatile chemicals (100–400 g·mol−1) fac-tors of ∼0.4 to ∼0.7 can be regarded as typical e.g., Krylovet al. [40] and applied fields of >80Td raise Teff to manyhundreds of Kelvin above the neutral gas temperature (T).This may promote dissociation and fragmentation of the ion,
which may be considered by an analysis of kinetic processeson the ion within the ion separation region.
The residence time of an ion in the separation region is onlya small fraction of that in the ionization region (which we defineas the space between the ionizer and entrance to the ion sepa-rator). At very low ED/N < 10 Td, where Teff is only marginallyhigher than T, ions with a lifetime exceeding the residence timein the ionization region will remain intact on their traversethrough the separation region. At increasing ED/N however,ion reactions become kinetically favorable. Such processesmay include; 1) dissociation of ion–dipole- (and ion-induced-dipole-) bound solvating neutrals derived from the drift gas(e.g., H2O, N2, etc.), 2) dissociation of proton bound speciesand 3) dissociation via the cleavage of a covalent site (i.e.,fragmentation). If E/N raises Teff so as to favor ion dissociationby one or more of these processes (on the timescale of ionresidence time integrated across all high field segments of theED/N waveform) the conformation of the ion on exit from theseparator will not match that on its entrance and the transmis-sion model described in “Lower field range (<150Td)” cannothold (because K0 changes with the conformation of the ion).Citing the above dissociation processes, one can generalize thatthe dissociation energies order; 1<2<3, since an ion–dipoleinteraction is weaker than an ionic hydrogen bond and a cova-lent bond is stronger than an ionic hydrogen bond. At increas-ingly high ED/N (and hence increasing Teff) these dissociationprocesses may be observed in the same order.
To set the scene in this discussion we shall model thedissociation of the symmetrical proton bound dimer(M2H
+), to a protonated monomer (MH+) and neutral (M),as defined by the general reaction—
M 2Hþ ! MHþ þM ð20Þ
Under normal system operating conditions the concentra-tion of M is << than other neutrals (the drift gas). The iondissociates, as per Eq. 20, during the high-field portion of thewaveform (when the ion is “hot”). However, the probability ofthe reverse association reaction is negligible during the low-
3 The collisional efficiency factor (ζ) is also a function of the gastemperature (T). To simplify this initial analysis we assume it to beindependent of T. In practice the gas temperature is fixed, eliminatingthis variable (i.e., such that it becomes wholly integrated within theempirically derived data).
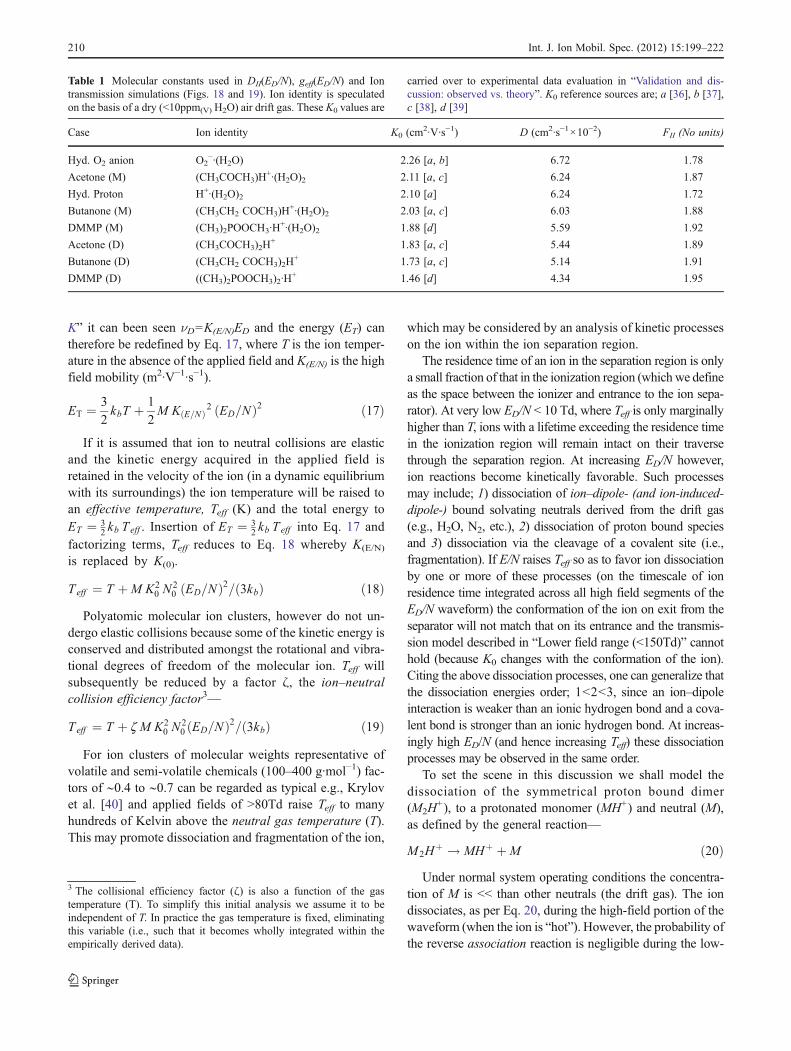
Table 1 Molecular constants used in DII(ED/N), geff(ED/N) and Iontransmission simulations (Figs. 18 and 19). Ion identity is speculatedon the basis of a dry (<10ppm(V) H2O) air drift gas. These K0 values are
carried over to experimental data evaluation in “Validation and dis-cussion: observed vs. theory”. K0 reference sources are; a [36], b [37],c [38], d [39]
Case Ion identity K0 (cm2·V·s−1) D (cm2·s−1×10⁻²) FII (No units)
Hyd. O2 anion O2−·(H2O) 2.26 [a, b] 6.72 1.78
Acetone (M) (CH3COCH3)H+·(H2O)2 2.11 [a, c] 6.24 1.87
Hyd. Proton H+·(H2O)2 2.10 [a] 6.24 1.72
Butanone (M) (CH3CH2 COCH3)H+·(H2O)2 2.03 [a, c] 6.03 1.88
DMMP (M) (CH3)2POOCH3·H+·(H2O)2 1.88 [d] 5.59 1.92
Acetone (D) (CH3COCH3)2H+ 1.83 [a, c] 5.44 1.89
Butanone (D) (CH3CH2 COCH3)2H+ 1.73 [a, c] 5.14 1.91
DMMP (D) ((CH3)2POOCH3)2·H+ 1.46 [d] 4.34 1.95
210 Int. J. Ion Mobil. Spec. (2012) 15:199–222
field period of the waveform (when the ion is “cool”) becausethe probability of a monomer (MH+) and neutral (M) collisionis negligible on the timescale of the low-field period. Underthese conditions, the rate (r, mol·s−1) of dissociation can bedefined by the first-order rate law, where [M2H
+] is the con-centration of dimer ions exiting the ion separator, t is the timethe dimer ion spends in the ion separator (s) and k isthe first-order rate constant (s−1).
r ¼ �d M 2Hþ½ � dt= ¼ k M 2H
þ½ � ð21ÞAt time 0 t, the concentration of dimer ions in the ion
separator [M2H+]t, relative to the concentration of ions en-
tering the separator at t00 [M2H+]0, can be expressed by the
integrated first-order rate law—
M 2Hþ½ �t ¼ M 2H
þ½ �0 exp�kt ð22Þand the first-order rate constant (k) by—
k ¼ �ln M 2Hþ½ �t M 2H
þ½ �0 � 1 t=� ð23Þ
For the dimer cluster ion to make it through the separatorand be detected its lifetime must exceed its residence time inthe separator (tres). Going a step further, for any dimer ions tobe detected a finite proportion exceeding the level defining thesignal to noise ratio of the system must remain undissociatedon transit through the separation region. From Eq. 23, the half-life of the dissociation process (t1/2) will be given by—
t1 2= ¼ ln 2 k= ð24ÞThe dimer dissociation rate constant (k) will exhibit some
dependency on the molecule from which the dimer origi-nates. Positive ion mode dimers are bound by an ionichydrogen bond and typical binding energies range 90–130 kJ·mol−1, with dissociation rate constants <<1 s−1 atSTP. This delivers stability at lower ED/N, where Teff iswithin a few tens of Kelvin of T (Fig. 20) and many dimerstherefore present themselves through the lower half of theED/N scan range (<150 kV·cm−1). However, k is extremelytemperature dependent and at increasing ED/N it may beexpected that the ion residence time at high field (Dτ(h))(where the ion is “hot”) tends to >>t1/2, i.e. a vast proportionof dimer ions break down and the dimer response disappears.
To predict/interpret the breakdown field an understandingof the relationship of Teff in relation to k is required. This isgiven by the Arrhenius equation (Eq. 25) in which R is theideal gas constant (8.3145 J·mol·K−1), EA the activation ener-gy of dissociation (J·mol−1) and A the Arrhenius constant(s−1).
k Teff
� � ¼ A � exp� EA R Teff
�� � ð25Þ
EA is related to the standard enthalpy of formation (−ΔH°,J·mol−1), which is the binding energy of the ionic hydrogen
bond holding the dimer together through the expression ΔH°0EA+RT, where T is standard temperature (293.15 K). For manyproton-bound dimers reference tables exist for ΔH°, e.g., Na-tional Institute of Standards web book [41] and thus EA iscalculable. The Arrhenius constant (A, which is usually a veryhigh power of e) can bemore difficult to look-up and very oftenthis is derived empirically). There are, however examples thatcan be pulled out from the literature e.g., [42]. As anapproximation, logA016.0 may be employed. In thispresent analysis the proton-bound dimer of DMMP istaken as an opportune case example, since its break-down has also been experimentally analyzed throughDMS / FAIMS by An et al. [43].
LogA and EA for the dissociation of the DMMP dimer areshown in Table 2. Substituting these values in Eq. 25 oneobserves (unsurprisingly) the dramatic exponential increase indimer dissociation rate constant (k) over the Teff range (∼300–1200 K) that correlates to the scanable ED /N range of ∼0–300Td at 101 kPa (for this DMMP dimer case). At ∼160 Td,t1/2 ≈ Dτ(h) and at 180 Td, Dτ(h) exceeds t1/2 by >10 (Fig. 15).
The correlation between the thermal dependence of k andthe ion transmission spectrum of the dimer will now becomeclearer. The ratio of dimer ions exiting the ion separator[M2H
+]t, to those entering it [M2H+]0, can be determined
from Eq. 22, by replacing t with Dτ(h) and k with k(Teff),where k(Teff) is the dimer dissociation rate constant at theeffective ion temperature in the high-field portion of theapplied waveform (i.e., Teff at ED/N). This yields Eq. 26,which ultimately defines the kinetic contribution to theshape function of the dimer Ion Transmission Spectrum(ITS).
M 2Hþ½ �t M 2H
þ½ �0� ¼ exp�k Teff
� �DtðhÞ ð26Þ
Thus, where the dimer is stable in the ion separator, i.e.k(Teff)Dτ(h) << t1/2, a stable dimer response will be observedthrough the stepping of ED/N (if losses to the separationelectrodes due to anisotropic diffusion defined by the DII
term in Eq. 12 are neglected). However, at some point ED/Nraises Teff such that k(Teff)Dτ(h) ≈ t1/2 and then readily suchthat k(Teff)Dτ(h) >> t1/2. With the exponential dependency ofM 2Hþ½ � M 2Hþ½ �= 0 on k(Teff)Dτ(h) this drop off is dramatic(Fig. 16)
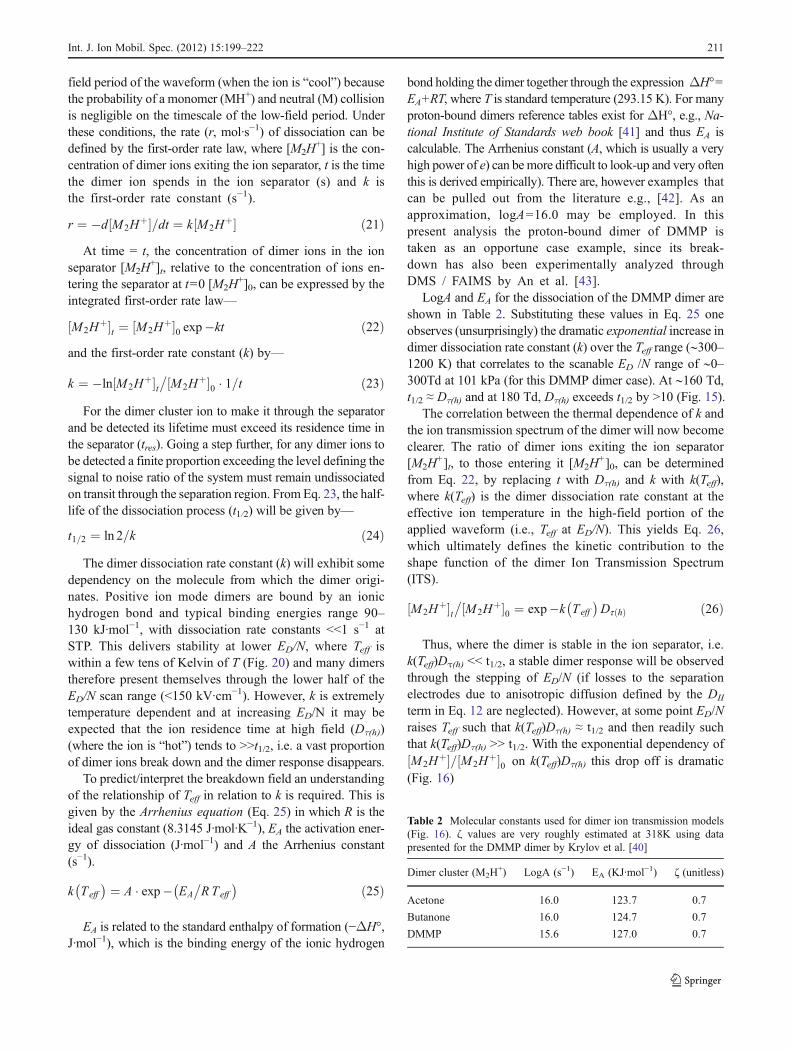
Table 2 Molecular constants used for dimer ion transmission models(Fig. 16). ζ values are very roughly estimated at 318K using datapresented for the DMMP dimer by Krylov et al. [40]
Dimer cluster (M2H+) LogA (s−1) EA (KJ·mol−1) ζ (unitless)
Acetone 16.0 123.7 0.7
Butanone 16.0 124.7 0.7
DMMP 15.6 127.0 0.7
Int. J. Ion Mobil. Spec. (2012) 15:199–222 211

Peak width
For a planar FAIMS/DMS separator the peak width (W1/2) asFull Width at Half Maximum (FWHM), V·m−1 is given by—
W 1 2= ¼ 4N K0N 0=ð Þ � DII ln 2 tres=ð Þ1 2= ð27Þ
where, t is the ion residence time (s) and the other terms havetheir previous meanings. DII exhibits an ED/N dependence byvirtue of Eq. 14 and thus so does the peak width. At constantpressure the W1/2(ED/N) function evolves from near flat atlower ED/N (<100Td) to quadratic at very high ED/N(>300Td) (Fig. 17). In the 0.5 mm planar FAIMS topologyexploited by Krylov et al. [32] data was only gathered in the 0to 120Td ED/N range, meaning the effects of anisotropicdiffusion on peak broadening were minimal (i.e., the peakwidth could be assumed relatively constant through their
operational ED/N range). For the very high ED/N operationemployed by the present authors this is not the case, as isclearly illustrated in Fig. 17 (which models the W1/2(ED/N)responses for the example ion cases given in Table 1).
Validation and discussion: observed vs. theory
The model discussed in the previous section is somewhatsemi-quantitative. Limitations include, for example, the esti-mates one makes relating the various molecular ion con-stants (e.g., ζ, k and A) and the approximation of KE for K0
in Teff calculations. These limitations can be qualified in anexperiment vs. theory evaluation and we do so in thissection; examining the cases of acetone, butanone andDMMP cluster ions, as well as that of the positive andnegative ion mode reactant ions (which one assumes hereto be the hydrated proton and hydrated dioxygen anion; of
Fig. 16 Dashed lines ( ) predicted proton-bound dimer ion trans-mission spectra at 101.3 kPa (where M2Hþ½ �t M 2Hþ½ �0
�is assumed
proportional to ion current, i.e., ignoring diffusional losses) for acetone(1), butanone (2) and DMMP (3) using log A and EA and ζ constantsfor (Teff calculation) shown in Table 2 and gas temperature (T) of 318K.Solid bold lines (—) are the same predicted transmission spectra wherediffusional losses are also accounted. K0 values listed in Table 1 wereused in all computations
Fig. 17 Computed W1/2(ED/N) curves for product ions of differing K0
(Table 1). Numbering corresponds to the ion identities shown in thecaption to Fig. 13. All computations are at 318K (gas temperature) and101.3 kPa with a 388 cm·min−1 gas flow rate and system configurationas per “Instrumental specifics”
Fig. 15 a DMMP dimer dissociation rate constant (k) as a function ofthe effective ion temperature (Teff) using LogA015.6s−1 and EA0127kJ·mol−1 (with Teff calculated from Eq. 19 using T0318K and ζ0
0.72). b Ratio of DMMP dimer half-life life to integrated high fielddrift period in the ion separator (Dτ(h)) of 13.5 μs using k(Teff) from a.The definition of the ion efficiency factor (ζ) is given in section 3.3.2
212 Int. J. Ion Mobil. Spec. (2012) 15:199–222

general formula H+(H2O)n and O2−(H2O)n). These cases
have been chosen because they have been the subject ofmany IMS and DMS/FAIMS studies and many of the mo-lecular ion constants defined in Eqs. 1 through 24 have beenderived empirically. Acetone, butanone and DMMP alsoyield relatively stable monomer ion clusters, enabling as-sessment throughout our working ED/N range, without thecomplication (in model evaluation) of ion fragmentation. Inthis particular evaluation and analytical treatment we drawspecific attention to the work of the following; An et al. [43,44], Krylov et al. [32, 35, 40], Eiceman and Stone [45],Ewing et al. [42] and Stone [46].
Experimental
Experimental conditions were set to replicate thoseemployed by Krylov et al. [35]. Deviations from theseconditions are explicitly highlighted.
Vapor sample preparations and system environmentalparameters
Acetone, butanone and DMMP vapors were generated byPTFE incubated permeation sources. Vapor generation sys-tems (OVG-4; Owlstone Ltd., Cambridge, UK) equippedwith outlet spit flow controls were used for permeationsource incubation and manipulation of vapor level output.The vapor generator diluent gas was clean dry air outputfrom a Zero Air generator passed over a 90A molecularsieve and activated carbon filter. PTFE source permeationrates were determined gravimetrically over an incubationperiod of 4 weeks. Acetone, butanone and DMMP utilizedin permeation sources was Analytical Standard grade,>99.9 % purity (Sigma Aldrich, Poole, UK). The split flowoutput of the vapor generator was mixed with a clean dry airflow of the same standard as that fed into the vapor gener-ator, in order to manipulate the vapor level presented to thesensor platform. The gas flow rate through the sensor was388 (±5) cm3·min−1. This consisted of a 18 cm3·min−1 sam-ple inlet flow and 370 cm3·min−1 recirculating air flow. “Atsensor” vapor levels studied ranged from 4 to 100 ppb(V).
Pressure was monitored continuously at the output of thesensor assembly (via the pressure sensor indicated in Fig. 6)and logged with the output ion current data for later Tdconversion. Sample humidity was monitored at the sensoroutlet by means of a high precision hygrometer (Cermet IIIS, Michell Instruments Ltd, Cambridge, UK) and maintained<10 ppm(V) H2O for all experimental data reported herein.
Spectral data acquisition and post processing
EC:ED spectra were generated with EC drive settings of 401data points in the −6 V to −6 V range and ED settings of 51
points in the –0 to 60 V (Vb) range. This yielded 29.9 mV EC
resolution and ED 1.1 V resolution respectively, equating toEC/N resolution of ∼40 mTd and ED/N resolution of ∼11 Tdat 101 kPa). Spectra were obtained in replicates of at least 20over the course of 10 days of experimentation. Raw spectrawere processed off-line using a proprietary peak extractionalgorithm, which reduced each raw spectrum to a set ofGaussian peak parameters (EC/N, Area and width) at eachED sample point in the scanned ED/N range. Further postprocessing (mathematical/statistical processing and graphi-cal representation) was performed using Origin version 6.0(Microcal Software Inc., Northampton, MA).
Ion peak position
Krylov et al. [35] studied the field dependent mobilities of thegas-phase protonated monomers and proton-bound dimers ofstraight-chain ketones (of carbon numbers 3 to 10) in a dry air(∼1 ppm H2O) drift gas, using a planar FAIMS system con-figuration described by Miller et al. [4]. The α2 and α4
parameters (c.f. Eq. 5) for each ketone, under their experimen-tal conditions, were determined with considerable precision(<5 % LSD). In a separate publication Krylov et al. [32]presented EC:ED spectra and alpha plots for the DMMPmonomer and dimer, as well as the solvated proton andsolvated dioxygen anion (respectively the positive and nega-tive ion mode reactant ions). This information offered thepresent authors with an opportunity for comparison, utilizingthe system described in “Instrumental specifics”.
In Figs. 18 and 19 we compare empirically derived EC:ED responses, for the above mentioned cases, with thetheoretical, utilizing α2 and α4 coefficients quoted (or de-rived) from the above mentioned literature. In spectral rep-resentation we transpose ED/N (the independent variable inEq. 9) to the Y axis and EC/N (the dependent variable inEq. 9) to the X axis, in convention with DMS / FAIMSstandard for an intuitive spectral view (as illustrated inFig. 10). The sign of the EC/N axis is also reversed fromthat used in the above quoted literature to maintain conven-tion with standard spatial representation of orthogonal axes.The signs of the α2 and α4 coefficients taken from theliterature have therefore been reversed accordingly for thisevaluation. Predicted responses have thus been modeled bymeans of Eq. 9, using the α2 and α4 coefficients shown inTable 3 and our known <f2>, <f3> and <f5> waveformcoefficients (“Instrumental specifics”). Our experimentaldata have been fitted to the truncated form of the alphamodel using only data in the lower half of the workingED/N range (<140 Td). Attempting to fit this truncated formof the model across the entire range leads to a poor fit sinceit predicts EC/N → ED/N at high ED/N (c.f. “Ion peakposition”) and instead one needs to retain higher order terms(as also illustrated in Figs. 18 and 19). Comparison of
Int. J. Ion Mobil. Spec. (2012) 15:199–222 213

experimentally derived α2 and α4 coefficients at lower ED/Nwith those published, nevertheless makes a useful point ofreference in discussion. These derived α2 and α4 coeffi-cients are also shown in Table 3.
On first inspection Table 3 may seem alarming becauseof the marginal correlation between the comparative sets ofα2 and α4 coefficients (a marginal correlation that is illus-trated explicitly in Figs. 18 and 19). However, it must beappreciated that the α parameters are very dependent onexperimental conditions, in particular the ppmv water con-centration at the sensor (particularly at significantly sub-ambient moisture levels, <10 ppm(v)). “Experimental” indi-cates that we were only able to roughly replicate the exper-imental conditions described in the literature. It is thequalitative comparison that is of more interest and criticallyone must remember that chemical classification is basedonly partially on the Ec;ED profile in ion separations per-formed at ultra-high-fields (as shall be discussed in “Ionpeak intensity & ion transmission” and “Ion peak width”).
Acetone and butanone
Qualitatively, the monomer and dimer responses of both ace-tone and butanone (comparing experimental data with the
predicted responses) agree well at lower ED/N range. For themonomers the alpha model fits well at ED/N <140 Td and forthe dimers it fits well at ED/N <100 Td. At higher ED/N thealpha model breaks down for both monomer and dimer astheorized. The monomer response extends to a considerablyhigher ED/N than the dimer. The dimer response would beexpected to decay in the mid ED/N range because of field-induced dissociation at the higher effective ion temperaturesencountered in this mid ED/N range. This shall be discussedfurther in “Ion peak intensity & ion transmission”.
With respect to the deviation of the monomer responsefrom the alpha model at higher ED/N it may be accuratelystated that at higher ED/N the effective ion temperature inthe lower-field period of the applied waveform actuallybecomes appreciably higher than the gas temperature andthat the approximation of the ion mobility to K0 made inEq. 5 is no longer valid. For example, at a peak field of 200Td the maximum field in the low-field period reaches ∼70Td. It may further be postulated that the model focuses tooheavily on the physical process of the “solvation and des-olvation” of neutrals. Whilst this is effective in the lowerhalf of the ED/N range (where effective ion temperatures aremodulated only to within a few hundred K of the gastemperature) it may not be expected to be as effective at
Fig. 18 Experimental (black data points •) and predicted EC:ED
responses using the truncated form of the alpha-function (Eq. 9) withα2 and α4 inputs shown in Table 3 and waveform co-efficients deter-mined in “Separation waveform analysis” (dashed lines ) for ace-tone monomer (a), acetone dimer (b), butanone monomer (c) andbutanone dimer (d). The light grey lines ( ) are least squares fits ofEq. 9 to the low field (ED/N <140Td) data points only, whilst the black
solid lines are fit of an expanded form of Eq. 9 (Expanded to the ninthorder, i.e., Ec/N0c3·(ED/N)
3+ c5·(ED/N)5+ c7·(ED/N)
7+ c9·(ED/N)9, in
which the constants c7 and c9 are composed of the higher order αn
terms and higher order waveform co-efficients <fn>). Experimentaluncertainties in the determined EC/N values are less than the rangecaptured within the area of the plotted data points (i.e., <0.05Td)
214 Int. J. Ion Mobil. Spec. (2012) 15:199–222

higher ED/N, where effective ion temperatures become sohigh that that the ion cluster is entirely desolvated. This isdiscussed further in “Ion peak intensity & ion transmission”,since the ion transmission spectrum provides additionalinformation for this debate.
DMMP
The monomer and dimer responses of DMMP (Fig. 19a andb) do not fit as well with the Krylov et al. [32] predicted
responses, although the alpha model still holds in the lowerhalf of the ED/N scan range. There was some uncertaintywith respect to the precise experimental conditionsemployed by Krylov et al. [35] (e.g., ppm(v) H2O and gastemperature) and any mismatch in conditions employed inthis present work and the conditions employed in the workof those authors would invalidate any comparison. Insteadwe focus on a comparison with our own acetone and buta-none responses (shown in Fig. 18). The gross observationfor both the monomer and dimer cases are the much reduced
Table 3 α2 and α4 coefficientsdetermined by Krylov comparedwith those obtained in this work
aThese literature values werederived from data presented inFig. 3 of Krylov et al. [32],whilst the others were taken di-rectly from Table 1 of Krylov etal. [35]
Case Literature [32, 35] This work
α2 α4 α2 α4
Acetone (M) −3.1×10⁻⁵ 9.5×10⁻¹⁰ −2.1×10⁻⁵ 1.2×10⁻⁹
Acetone (D) −1.3×10⁻⁵ 1.8×10⁻⁹ −9.9×10⁻⁶ 1.1×10⁻⁹
Butanone (M) −2.7×10⁻⁵ 1.2×10⁻⁹ −1.7×10⁻⁵ 9.7×10⁻¹⁰
Butanone (D) −8.0×10⁻⁶ 6.0×10⁻¹⁰ −6.6×10⁻⁶ 7.9×10⁻¹⁰
DMMP (M) a −2.5×10⁻⁵ 2.5×10⁻⁹ −7.7×10⁻⁶ 4.1×10⁻¹⁰
DMMP (D) a −3.8×10⁻⁶ 1.5×10⁻⁹ 7.2×10⁻⁷ 8.0×10⁻¹¹
Hyd. Proton a −1.7×10⁻⁵ 2.6×10⁻¹¹ −2.5×10⁻⁵ 9.0×10⁻¹⁰
Hyd. O2 aniona −2.3×10⁻⁵ 1.3×10⁻⁹ −3.8×10⁻⁵ 2.7×10⁻⁹
Fig. 19 Experimental (black data points •) and predicted EC:ED
responses using the truncated form of the alpha-function (Eq. 9) withα2 and α4 inputs shown in Table 3 and waveform co-efficient deter-mined in “Separation waveform analysis” (dashed lines ) for;DMMP monomer (a), DMMP dimer (b), hydrated proton (c) anddioxygen anion (d). The light grey solid lines ( ) are least squares
fits of Eq. 9 to the low field (ED/N <140Td) data points only, whilst theblack solid lines are fit of an expanded form of Eq. 9 (see Fig. 18Legend). Experimental uncertainties in the determined EC/N values areless than the range captured within the area of the plotted data points(i.e., <0.05Td)
Int. J. Ion Mobil. Spec. (2012) 15:199–222 215

–EC/N of the turning point and extension of each response toa higher ED/N. This is interpret in terms of the relativelylarger collision cross sections (Ω) of the monomer and dimerof DMMP (compared to their acetone/butanone counter-parts), which is reflected in their lower respective ion mobi-lities (Table 1). Solvation/desolvation with neutrals therebycontributes less to the ΔK between high and low field,reducing the negative EC/N shift.
Reactant ions
The reactant ions present in the lower half of the ED/N scanrange only. Transmission losses may be expected to attenuatethe reactant ion signals at high fields because of their relativelyhigh mobilities (c.f. Table 1 and the DII term in Eq. 12). Thepositive ion mode reactant ion (which we assume here to bethe hydrated proton) correlates very well with that predictedthrough the literature comparison, whereas the correlationwith the negative ion mode reactant ion (which we assumeto be the hydrated dioxygen ion) shows some deviation. Thelatter is tentatively considered to be an artifact of the use of acorona ionization source by the present authors (as opposed toa Ni63 ion source used in the literature quoted system). Thishypothesis is evaluated further by consideration of the iontransmission and peak width data (“Ion peak intensity & iontransmission” and “Ion peak width”).
Ion peak intensity & ion transmission
The Ion Transmission Spectrum (ITS), which the authorsdefine as the integrated ion current of a resolved (or partiallyresolved) peak (as a function of ED/N) is equally, if not moreimportant, for classification purposes in ultra-high-field op-eration. Specifically the ITS is able to reveal informationrelating ion kinetics within the ion separator.
Reactant ions
The positive ion mode and negative ion mode reactant ions(for which data was generated simultaneously) make for anattractive study case, since in a clean system they presentthemselves wholly independently. The transmission spectrarelating to Fig. 19c and normalized to the ion transmission atED/N 0 0 are shown in Fig. 20. The ion transmission can beapproximated to Eq. 12 (with normalization eliminating pre-exponential factors), whereby the key parameter becomes K0
embedded in the DII and geff terms. The positive ion modereactant ion seems to be the more straightforward of the twocases to explain. The transmission profile fits between thatpredicted for the H+(H2O)n of K002.10 and 2.45. At increas-ing ED/N the solvation number (n) of the cluster is expected toreduce and with this the ion mobility (K) increases. Thetransmission profile transits from that for the cluster with thehigher n (lower K) to that with lower n (higher K).
The Negative IonMode response is less obvious. Under theexperimental conditions the reactant ion would be expected tobe either mono-hydrated [O2
−(H2O)] or de-hydrated [O2−],
given the observations by Krylov et al. [40] in their evaluationof Temperature Effects in FAIMS. However, neitherK0 fits theobserved profile. A non-linear least-squares fit of Eq. 12 to thedata extracts a K0 of 2.70 (±0.03) cm
2·V−1·s−1, which suggestsa different negative reactant ion (possibly derived from thecorona ion source). A mass-spectral evaluation of corona ionchemistry has subsequently been undertaken and will be asubject of a separate article.
Dimers
A model for the dimer response was well established in “Ionpeak intensity”, where it was shown that the precise break-down field of a dimer will be dictated by the effective-ion-
Fig. 20 a Positive ion mode reactant ion transmission spectra. Exper-imental data (normalized to the integrated peak ion current at ED/N00)is indicated by black circles (•) with dashed line ( ) beta splineconnectors. Dashed line 1 is the predicted ion transmission using a K0
of 2.1 cm2·V·s−1 and dashed line 2 is that using a K0 of 2.45 cm2·V·s−1.
a Negative ion mode reactant ion transmission spectra. Experimental
data (normalized to the integrated peak ion current at ED/N00) isindicated by black circles (•) with dashed line ( ) beta spline con-nectors. Solid line (—) 1 is the predicted ion transmission using a K0 of2.26 cm2·V·s−1 and dashed line 2 is that using a K0 of 2.55 cm2·V·s−1.Solid line 3 is a non-linear least-squares fit of Eq. 12 to the experi-mental data
216 Int. J. Ion Mobil. Spec. (2012) 15:199–222

temperature-dependent first-order rate constant k(Teff) andthe integrated high-field ion residence time of the ion inthe separation channel (Dτ(h)) (c.f. Eq. 26). The experimen-tal ITS for each of the three study cases (Acetone, Butanoneand DMMP) are shown in Fig. 21, with the predictedresponses (combining diffusional and kinetic transmissionlosses) overlaid. Field-dependent dimer breakdown is evi-dent in the experimental data. The correlation between theexperimental and predicted transmission spectra is not exactbut this must be expected because of model approximations.We summarize that the breakdown for butanone and acetoneoccurs at a lower than predicted ED/N. This suggests that theion-neutral collisional efficiency factor (ζ) of 0.7 (used inthe Teff(ED/N) computations input into the transmissionmodel) was overestimated, assuming confidence in the K0
parameters listed in Table 1 and the LogA and EA parameterslisted in Table 2. For DMMP we observe that the breakdownoccurs at an ED/N of the order expected when using ζ00.55in the Teff(ED/N) computations input into the transmissionmodel. This is the ζ value estimated at the gas temperature(318K) using ζ(T) data from An et al. [43]. On the otherhand, using ζ00.7, estimated from the ζ(T) data of Krylovet al. [40], yields a poorer correlation between experimentand model.
Whilst dimer breakdown is the prominent feature in thedimer ITS, transmission behaviors at ED/N below the break-down threshold should not be neglected. Below 100Td kineticlosses are negligible and the transmission is dictated wholly byEq. 12. Experimental observations in this lower EDN regiondeviate from the predicted and there are subtle features (“dips”,etc.) embedded in the transmission profile at lower ED/N that
suggest higher order ion transport phenomena. Again, theexperimental data are too sparse to comfortably qualify thisdiscrepancy. However one may postulate that K0 uncertaintiesin theDII(ED/N) computation are a contributory factor. A higherresolution study of the ITS would be beneficial to evaluate this.
Monomers
Acetone, butanone and DMMP monomers are thermally sta-ble; that is they are not prone to fragmentation at an intramo-lecular (covalent) site, except at very high Teff (∼900 K). Theyare also relatively small molecules, so when thermally inducedfragmentation does occur, the fragmentation products will beof low MW (and of small collision cross-section). They willhave a mobility greater than that of the parent ion. On thisbasis one may presuppose that when the presence of dimer issuppressed (by keeping the vapor concentration at the sensorlow) an ITS that strictly follows Eq. 12 (and similar to reactantions, shown in Fig. 20) would be observed (since at fragmen-tation any fragment ions will exhibit diffusional transmissionlosses that exceed the ion detection threshold). This hypothe-sis was tested by observing the ion transmission spectra ofAcetone, Butanone and DMMP at sensor levels of 4 ppb(v)—avapor level that was found sufficiently low so as to reduce thedimer response to <1/5th that of the monomer response at themonomer/dimer peak resolution point (∼40 Td). The resultsare shown in Fig. 22.
Whilst there is some correlation between the observed andpredicted ITS at lower E/N, there is an explicit lack of corre-lation at higher E/N. Equation 12 predicts the transmission todecay exponentially with increasing E/N whereas the profile“valleys” (point i), “peaks” (point ii) and then “decays” (pointiii) below the peak detection threshold on scanning throughthe 120–250 Td range. At point B, the observed transmissionexceeds the predicted by a factor >102.Whilst this observationis surprising and we are as yet unsure as to the precise physicalprocess responsible for this effect4, it is ultimately beneficial.First, it delivers much improved sensitivity in the mid ED/Nscan range and secondly the valley (i) and peak (ii) points (aswell as well as the end point iii) exhibit molecular selectivity.In respect of the latter, the monomer ITS delivers a usefulclassification feature.
At higher vapor concentrations, where the dimer tomonomer peak ratio is >> 1 (in the lower ED/N range) anITS response of the form shown in Fig. 22 may appear more
Fig. 21 Normalized Ion transmission spectra at gas temperature 318Kfor acetone (red squares ), butanone (blue circles ) and DMMP(green squares ) dimers, where error bars are 1 standard deviationof the mean. Predicted responses for acetone (1) butanone (2) andDMMP (3a and 3b) are indicated with dashed lines ( ). The pre-dicted responses are based on the combination of field dependentdiffusional losses and kinetic losses determined by Eqs. 12 and 26,using input data shown in Tables 1 and 2. For DMMP 3a has beendetermined by using ζ00.7 [40] in the Teff(ED/N) computations inputinto the transmission model, whereas 3b uses ζ00.55 [43]
4 It has now been considered that the reduced ion residence time ofnewly formed monomer ions in the separation region (generated ondimer breakdown) will lead to some additional increase in monomerresponse (since these ions have less of the ion separator to travelthrough and are less susceptible to diffusional losses). However, atthe time of writing a full numerical analysis of this hypothesis wasincomplete.
Int. J. Ion Mobil. Spec. (2012) 15:199–222 217
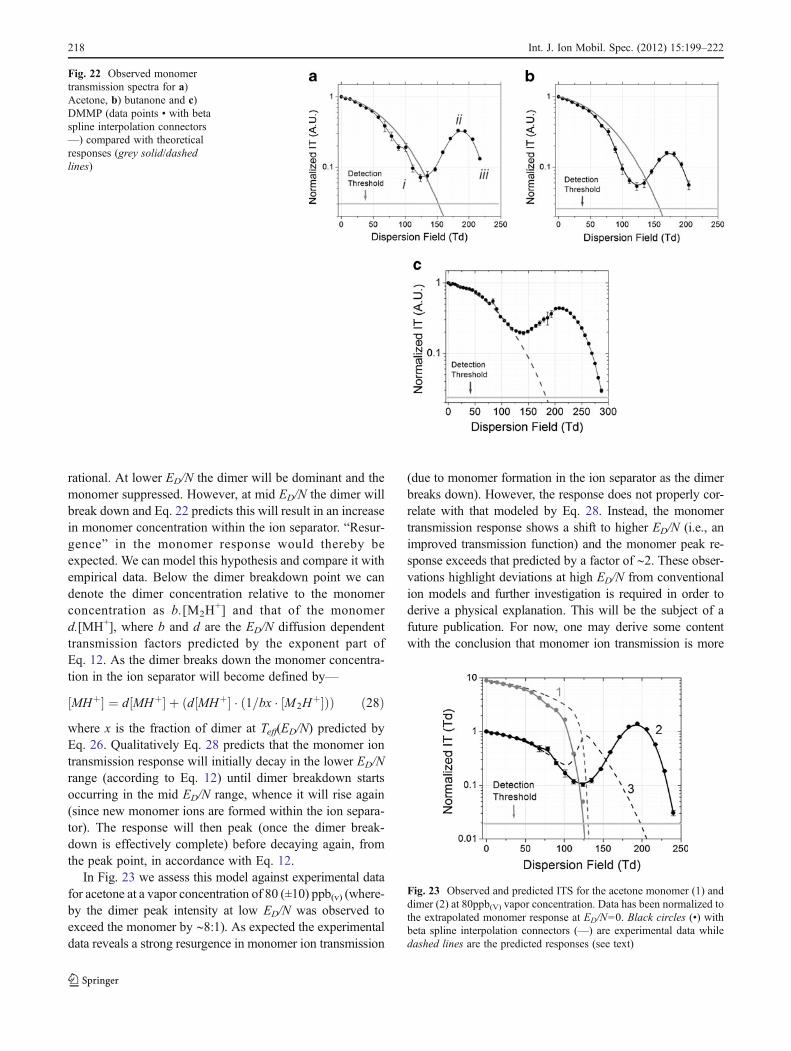
rational. At lower ED/N the dimer will be dominant and themonomer suppressed. However, at mid ED/N the dimer willbreak down and Eq. 22 predicts this will result in an increasein monomer concentration within the ion separator. “Resur-gence” in the monomer response would thereby beexpected. We can model this hypothesis and compare it withempirical data. Below the dimer breakdown point we candenote the dimer concentration relative to the monomerconcentration as b.[M2H
+] and that of the monomerd.[MH+], where b and d are the ED/N diffusion dependenttransmission factors predicted by the exponent part ofEq. 12. As the dimer breaks down the monomer concentra-tion in the ion separator will become defined by—
MHþ½ � ¼ d MHþ½ � þ d MHþ½ � � 1 bx= � M 2Hþ½ �ð Þð Þ ð28Þ
where x is the fraction of dimer at Teff(ED/N) predicted byEq. 26. Qualitatively Eq. 28 predicts that the monomer iontransmission response will initially decay in the lower ED/Nrange (according to Eq. 12) until dimer breakdown startsoccurring in the mid ED/N range, whence it will rise again(since new monomer ions are formed within the ion separa-tor). The response will then peak (once the dimer break-down is effectively complete) before decaying again, fromthe peak point, in accordance with Eq. 12.
In Fig. 23 we assess this model against experimental datafor acetone at a vapor concentration of 80 (±10) ppb(v) (where-by the dimer peak intensity at low ED/N was observed toexceed the monomer by ∼8:1). As expected the experimentaldata reveals a strong resurgence in monomer ion transmission
(due to monomer formation in the ion separator as the dimerbreaks down). However, the response does not properly cor-relate with that modeled by Eq. 28. Instead, the monomertransmission response shows a shift to higher ED/N (i.e., animproved transmission function) and the monomer peak re-sponse exceeds that predicted by a factor of ∼2. These obser-vations highlight deviations at high ED/N from conventionalion models and further investigation is required in order toderive a physical explanation. This will be the subject of afuture publication. For now, one may derive some contentwith the conclusion that monomer ion transmission is more
Fig. 22 Observed monomertransmission spectra for a)Acetone, b) butanone and c)DMMP (data points • with betaspline interpolation connectors—) compared with theoreticalresponses (grey solid/dashedlines)
Fig. 23 Observed and predicted ITS for the acetone monomer (1) anddimer (2) at 80ppb(V) vapor concentration. Data has been normalized tothe extrapolated monomer response at ED/N00. Black circles (•) withbeta spline interpolation connectors (—) are experimental data whiledashed lines are the predicted responses (see text)
218 Int. J. Ion Mobil. Spec. (2012) 15:199–222

efficient than that predicted by Eq. 12, ultimately resulting inimproved sensitivity through the higher end of the ED/N range.
Ion peak width
Replacing DII in Eq. 27 with the Einstein Equation (Eq. 15)it is possible to derive an expression that allows for thedetermination of K0 from the peak width (W1/2, V·m
−1) atzero ED/N—
K0 ¼ 16N ln 2 � kbTN 0 qtres W 2
1 2=
ð29Þ
On initial inspection this appears an attractive means bywhich to determine K0 from the empirically derived W1/2.However, there are two complications. First, there is ofcourse no ion separation at zero field, so for species gener-ating more than one ion, the zero field peak is a sum of theindividual Gaussians. Secondly, the ion residence time mustbe accurately defined, which as we have seen in “Definitionof ion residence time” is challenging since the flow velocityin the ion channel can only realistically be approximated towithin a few percent in a rectangular micro-channel. It ispossible nonetheless, to focus on a clean dry air sample andcompare observed peaks for the hydrated proton and hydrat-ed dioxygen anion with the theoretical prediction. One maygo a step further and accurately establish the true ion resi-dence time by substituting well referenced K0 values forthese particular “air derived” reactant ions.
Reactant ions
We begin by looking at the experimental vs. predicted W1/
2(ED/N) responses for the reactant ions (Fig. 24). At low ED/N (<50 Td) a good correlation between experiment andtheory is observed (when substituting the K0 values shownin Table 1 into the Eq. 27). Just a small, relatively constantoffset of 0.02 Td between experiment and theory is ob-served. If it is assumed that the ion residence time (tres) isaccurately defined, one might suggest that this is due to a
discrepancy between the actual K0 and that input in themodel for W1/2 determination and it is possible to test this.
Extrapolating the observed W1/2(ED/N) data points in the0–50Td range to zero (Fig. 24b), one obtains a zero Td W1/
2’s of 0.2738 (±0.0013) for the hydrated dioxygen anion and0.2883 (±0.0010) for the hydrated proton. Feeding these val-ues into Eq. 29 yields a K0 of 1.99 (±0.01) cm
2·V·s−1 and 1.80(±0.01) cm2·V·s−1 for the respective cases (compared to theirliterature values of 2.26 and 2.10 cm2·V·s−1). One wouldconclude from this (assuming our reactant ion identities arecorrectly assigned) that tres is not acutely defined. If thereverse problem is solved and the literature quoted K0 valuesare used in combination with the zero Td extrapolated exper-imental W1/2(ED/N) data, in order to obtain tres, one obtainstres031.9 (±0.2) μs for the hydrated dioxygen anion and30.9 μs (±0.2) for the hydrated proton. This compares to acomputed tres at the working flow rate (388 cm−3·min−1) of36.9 μs. It may seem that a further analysis of the micro-channel gas flow is warranted. However, it must not beneglected that the ion transmission spectra (Fig. 20) wouldnot correlate as well under the assumption of a shorter tres(since ion transmission would increase). It seems more likelythat there is an additional factor that broadens the peak.
Moving on to consider the W1/2(ED/N) response at higherED/N one observes a considerable deviation from experi-ment and theory. W1/2(ED/N) does not evolve smoothly andbegins to exceed the predicted W1/2 appreciably (> twice thepredicted W1/2 at ∼110 Td). The additional broadening maybe attributed to one or a combination of 3 factors. First, wemay be running into a situation whereby we encounter anassembly of ions of differing hydration number—(H2O)n.The reactant ions are very small and have high K values>2.1 cm2·V−1s−1. Any change in hydration number willhave a large impact on K and the ion assembly will become“partially” resolved into its ΔK(ED/N) elements. However,the resolution is not sufficient for the peak extraction algo-rithm to pick out the peaks and they become integrated as asingle broad peak. The second aspect is that at increasingfield the ion is driven toward desolvation (dissociation of theion–dipole bound water neutral). Near the dissociation point
Fig. 24 a Observed (1 and 2)and predicted (i ad ii) W1/2(ED/N) profiles for the positive ionmode and negative ion modereactant ions (of assumedidentity given in Table 2). bExperimental positive ion mode(1) and negative ion mode (2)observed in the 0–50Td range,where the error bars are stan-dard deviations (n020)
Int. J. Ion Mobil. Spec. (2012) 15:199–222 219

the collision cross-section of the ion increases dispropor-tionally (particularly for small cluster ions) and K undergoesa rapid decrease over a narrow ED/N range. This broadensthe peak by virtue of Eq. 27. The third aspect, relating alsodesolvation, is that at increasing ED/N the equilibrium ofcluster ion species in the separator shifts from higher solva-tion number (lower K) to lower solvation number (higherK). Newly created ions within the ion separator have ashorter separation path (i.e., shorter tres), which leads to abroadening of the peak by virtue of Eq. 27.
Monomers and dimers
Whilst, for the monomers and dimers presented in this casestudy it is not possible to effectively evaluate the W1/2(E/N)response at very low ED/N (<50 Td) due to marginal peakresolution, it is informative to study the response at higherED/N where the peaks are fully resolved. The observed andpredicted responses for the monomers/dimers are shown inFig. 25. At lower ED/N (<130 Td) experimental and pre-dicted data do correlate well. At higher ED/N an increasingdeviation from the predicted is observed. In the case of thedimer the observedW1/2(ED/N) tends exponential around thebreakdown field. The monomer response is more stable butshows unusual features (turning points similar to thoseobserved for the hydrated dioxygen anion). They may berelated to the K variations invoked through field induceddesolvation. Ultimately a higher-resolution study is requiredto fulfill understanding here. However, it should be appre-ciated that these turning points may be expected to be ion-specific and may therefore of use in analyte classification.
Conclusions
This paper has drawn attention to differences in the opera-tional models applied in conventional lower field range
DMS/FAIMS systems as compared to a system that operatesover a significantly higher field range. The system describedhas been evaluated over a field range of 0–300 Td, approx-imately doubling the field range explored in previouslydescribed systems (e.g. those based on designs first pre-sented by Guevremont and Purves [3] and Miller [4]). Thekey aspect of higher-field operation is the non-linear depen-dency of effective ion temperature on applied electric field.Doubling the operational field significantly increases theeffective temperature range over which an ion can be stud-ied because of the ∼Teff ∝ (ED/N)
2 dependency. For smallervolatile and semi-volatile molecules (<300 AMU) Teff>1000K may be reached. This has profound outcomes, sincethe high effective ion temperatures lead to the fragmentationof ions within the ion separation region and these fragmen-tations can be expected to exhibit field-dependent specificityby virtue of their unique kinetic and thermodynamic constants.Existing FAIMS/DMS models presented by Guevremont [5]and Krylov et al. [32] have been evaluated but do not neces-sarily represent ion separations fully at higher operationalfields. In particular, the truncation of the α-function to thefourth order (α2 and α4 terms only), does not hold up wellabove ∼150Td, even for stable ions that do not readily disso-ciate. For more stable ions, such as the acetone, butanone andDMMP examples used in the case study of this communica-tion, higher order α terms become important. Nonetheless,these operational models have been invaluable in thesystem characterization presented herein and it is hopedthat the paper may serve, in part, as a useful review ofthese models.
It must not be neglected that higher effective fields mayalso be generated in systems with limited waveform voltagerange by reducing the operational pressure. High ion tem-peratures may then, in principle, be exploited in these sys-tems too. For example, at 0.5atm (∼50 kPa) a systemdelivering a high-field range of 0 to 150 kV·cm−1 willestablish an effective field range of 0–300 Td. However, a
Fig. 25 a Experimental W1/2(E/N) responses for acetone (1), butanone(2) and DMMP (3) monomers shown as data circles (•), squares (■),and triangles (▲) respectively (with beta spline interpolation) com-pared with predictions (4) shown as black dashed lines (acetone),
light grey dashed lines (butanone) and dark grey dashed lines(DMMP). b Dimer responses (with equivalent annotations).
Errors are standard deviations, where for acetone and butanone n020, whilst for DMMP n05)
220 Int. J. Ion Mobil. Spec. (2012) 15:199–222

challenge associated with low pressure operation is the lossof ion transmission (and thus sensitivity), particularly atlower operational waveform frequencies, since ion transmis-sion is ∼ ∝ 1/(ED/N)
2. Further, the width of a (stable) ionpeak is ∼ ∝ 1/P1/2 (at fixed ion residence time), so a reduc-tion in operational pressure has a resolution penalty, withoutany increase in the ion separation time and thus data rate. Insummary, the authors have elected to operate with a shortion channel, fast separation, high ion transmission topologyin combination with ultra-high field drivers, in order toexploit the analytical information available at ultra-high-fields. Whilst a subject for further debate, the Ion Transmis-sion Spectrum (ITS) offers much potential for improvedhigh data rate classification when used in conjunction withthe conventional EC:ED spectral response.
It should be pointed out that in laboratory based opera-tional scenarios, systems operating over lower operationalfield ranges may be optimized for separation performancethough the addition of neutral modifiers to the make-up gasflow (e.g. [23]). The separation characteristics are optimizedthrough the neutral species influence on ion cluster chemis-try. However, this paper has focused rather more on themeans of the exploitation possibilities of a stand-alone andrapidly fieldable sensor platform, by accessing analyticalspace at ultra-high fields. This paper has presented a plat-form with such a stand-alone potential; that is a packagedminiature spectrometer has been developed measuring 12×12×15 cm, weighing 1.2 kg and consisting of the coremulti-micron gap ion separator assembly and RF/DC elec-tronic drivers integrated with pneumatic handling/sampleconditioning elements, together with ancillary temperature,flow and humidity sensing for stable closed loop operationunder local microprocessor control.
It is appreciated that ab inito spectral modeling at ultra-high fields is complicated by uncertainties in molecular ionconstants, in particular the ion–neutral collision efficiencyfactor (ζ) and kinetic parameters that dictate fragmentation(i.e., the Arrhenius constant A and the effective-ion-temperature-dependent rate constant k(Teff). In practice, em-pirical training delivers data in which these constants arewholly integrated and critically, a mature, well-characterizedsystem solution has been described that can allow thesetraining data to be generated with confidence. Comprehen-sive system evaluation remains to be communicated. Inparticular it is now necessary to define key system metrics(sensitivity, resolving power, chemical selectivity and quan-titative response) in the context of real world analyticalapplications. Attention need also be paid to chemometricmethods applied to real time data handling. The system iscurrently undergoing extensive laboratory and field trials inrelation to trace Volatile Organic Compound (VOC) andToxic Industrial Chemical (TIC) monitoring. The data out-put from this activity will enable full attention to be paid to
system metrics and chemometric methods. It is envisagedthat this present communication will serve as a clear refer-ence point for these forthcoming application specific tech-nology evaluations.
Acknowledgements The financial support from the US DefenseThreat Reduction Agency (Contract # HDTRA1-08-C-0010) isgratefully acknowledged in the development and maturation of theUltra-High Field ion separation technology.
References
1. Gorshkov MP (1982), USSR Inventor’s Certificate No. 966,5832. Buryakov IA, Krylov EV, Makas AL, Nazarov EG, Pervukhin VV,
Rasulev UK (1991) Ion division by their mobility in high-tensionalternating electric field. Sov Tech Phys Lett 17:446–447
3. Purves RW, Guevremont R (1999) Electrospray ionization high-field asymmetric waveform ion mobility spectrometry-mass spec-trometry. Anal Chem 71:2346–2357
4. Miller RA, Eiceman GA, Nazarov EG (2002) A micromachinedfield asymmetric ion mobility spectrometer (FA-IMS). Int J IonMob Spectrom 5:118–134
5. Guevremont R (2004) High-field asymmetric waveform ion mo-bility spectrometry: a new tool for mass spectrometry. J Chroma-togr A 1058:3–19
6. Petinarides J, Griffin TM, Miller RA, Nazarov EG, Bashall AD(2005) Implementation of a new technology for point detection.Proc SPIE 65:5795
7. Barnett DA, Ells B, Guevremont R, Purves RW (2002) Applica-tion of ESI-FAIMS-MS to the analysis of tryptic peptides. J AmSoc Mass Spectrom 13:1282–1291
8. Xia YQ, Steven WT, Mohammed J (2008) LC-FAIMS-MS/MS forquantification of a peptide in plasma and evaluation of FAIMS globalselectivity from plasma components. Anal Chem 80:7137–7143
9. Buryakov IA (2004) Express analysis of explosives, chemicalwarfare agents and drugs with multicapillary column gas chroma-tography and ion mobility increment spectrometry. J ChromatogrB 800:75–82
10. Eiceman GA, Krylov EV, Tadjikov B, Ewing RG, Nazarov EG,Miller RA (2004) Differential mobility spectrometry of chlorocar-bons with a micro-fabricated drift tube. Analyst 129:297–304
11. KrebsMD, Zapata AM,Nazarov EG,Miller RA, Costa IS, SonensheinAL, Davis CE (2005) Microfabricated differential mobility spectrom-etry with pyrolysis gas chromatography for chemical characterizationof bacteria. IEEE Sens J 5:696–703
12. Schmidt H, Tadjimukhamedov F, Mohrenz IV, Smith GB, EicemanGA (2004) Microfabricated differential mobility spectrometry withpyrolysis gas chromatography for chemical characterization ofbacteria. Anal Chem 76:5208–5217
13. Lambertus GR, Fix CS, Reidy SM, Miller RA, Wheeler D, NazarovE, Sacks R (2005) Silicon microfabricated column with microfabri-cated differential mobility spectrometer for GC analysis of volatileorganic compounds. Anal Chem 77:7563–7757
14. Cagan A, Schmidt H, Rodriguez JE, Eiceman GA (2010) Fast gaschromatography - differential ion mobility spectrometry of explo-sives from TATP to Tetryl without gas atmosphere modifiers. Int JIon Mobil Spectrom 13:157–165
15. Kolakowski BM, Mester Z (2007) Review of applications of high-field asymmetric waveform ion mobility spectrometry (FAIMS)and differential mobility spectrometry (DMS). Analyst 132:842–864
Int. J. Ion Mobil. Spec. (2012) 15:199–222 221

16. Shvartsburg AA (2009) Differential ion mobility spectrometry.CRC Press, Boca Raton
17. Barnett DA, Ouellette RJ (2011) Elimination of the helium require-ment in high-field asymmetric waveform ion mobility spectrome-try (FAIMS): beneficial effects of decreasing the analyzer gapwidth on peptide analysis. Rapid Commun Mass Spectrom25:1959–1971
18. Brown LJ, Toutoungi DE, Devenport NA, Reynolds J, Kaur-AtwalG, Boyle P, Creaser CS (2010) Miniaturized ultra high field asym-metric waveform ion mobility spectrometry combined with massspectrometry for peptide analysis. Anal Chem 82:9827–9834
19. Brown LJ, Smith RW, Toutoungi DE, Reynolds JC, Bristow AWT,Ray A, Sage A, Wilson ID, Weston DJ, Boyle B, Creaser CS(2012) Enhanced analyte detection using in-source fragmentationof field asymmetric waveform ion mobility spectrometry-selectedions in combination with time-of-flight mass spectrometry. AnalChem 84:4095–4103
20. Canterbury JD, Gladden J, Buck L, Olund R, MacCoss MJ (2010)A high voltage asymmetric waveform generator for FAIMS. J AmSoc Mass Spectrom 21:1118–1121
21. Creese AJ, Cooper HJ (2012) Separation and identification ofisomeric glycopeptides by high field asymmetric waveform ionmobility spectrometry. Anal Chem 84:2597–2601
22. Rorrer LC, Yost RA (2011) Solvent vapor effects on planar high-field asymmetric waveform ion mobility spectrometry. Int J MassSpectrom 300:173–181
23. Schneider BB, Covey TR, Coy SL, Krylov EV, Nazarov EG (2010)Control of chemical effects in the separation process of a differentialmobility mass spectrometer system. Eur J Mass Spectrom 16:57–71
24. Shvartsburg AA, Prior DC, Tang K, Smith RD (2010) High-resolution differential ion mobility separations using planar ana-lyzers at elevated dispersion fields. Anal Chem 82:7649–7655
25. Shvartsburg AA, Zheng Y, Smith RD, Kelleher NL (2012) IonMobility Separation of variant histone tails extending to the “mid-dle-down” range. Anal Chem 84(10):4271–4276
26. Mason EA, McDaniel EW (1988) Transport properties of ions ingases. Wiley, New York
27. Eiceman GA, Karpas Z (2005) Ion mobility spectrometry. CRCPress, Boca Raton
28. Nazarov EG, Coy SL, Krylov EV, Miller RA, Eiceman GA (2006)Pressure effects in differential mobility spectrometry. Anal Chem78:7697–7706
29. Boyle B, Koehl A, Ruiz-Alonso D, Rush M, Parris R, Wilks A(2008). A MEMS fabricated device for field asymmetric ion mo-bility spectrometry. Proceedings of the 59th Pittcon Conference,New Orleans, LA
30. Krylov EV, Nazarov EG, Miller RA, Tadjikov B, Eiceman GA(2001) Micromachined planar field asymmetric ion mobility spec-trometer. Sensors Actuators A 91:301–312
31. Shvartsburg AA, Smith RD, Wilks A, Koehl A, Ruiz D, Boyle B(2009) Ultrafast differential Ion mobility spectrometry in multi-channel microchips. Anal Chem 81:6489–6495
32. Krylov EV, Nazarov EG, Miller RA (2007) Differential mobilityspectrometer: model of operation. Int J Mass Spectrom 266:76–85
33. Shvartsburg AA, Smith RD (2008) Optimum waveforms for dif-ferential ion mobility spectrometry. J Am Soc Mass Spectrom19:1286–1295
34. Tamayol A, Bahrami M (2010) Laminar flow in microchannelswith noncircular cross section. J Fluids Eng 132:111201
35. Krylov EV, Nazarov EG, Miller RA, Tadjikov B, Eiceman GA(2002) Field dependence of mobilities for gas-phase-protonatedmonomers and proton-bound dimers of ketones by planar fieldasymmetric ion mobility spectrometry (PFAIMS). J Phys ChemA 106:5437–5444
36. Vautz W, Bödeker B, Baumbach JI, Bader S, Westhoff M, Perl T(2009) An implementable approach to obtain reproducible reducedion mobility. Int J Ion Mobil Spectrom 12:47–57
37. Revercomb HE, Mason EA (1975) Theory of plasma chromatog-raphy/gaseous electrophoresis. Anal Chem 47:970–983
38. Bensch H, Leonhardt M (2002) Comparison of drift times ofdifferent IMS. Int J Ion Mobil Spectrom 3:7–10
39. Tabrizchi M, Rouholahnejad F (2005) Comparing the effects oftemperature and pressure on ion mobility. J Phys D: Appl Phys38:857–867
40. Krylov EV, Coy SL, Nazarov EG (2009) Temperature effects indifferential mobility spectrometry. Int J Mass Spectrom 279:119–125
41. US Department of Commerce; National Institute of Standards andTechnology web book (2011), Gaithersburg. http://webbook.nist.gov/cgi/cbook.cgi?ID0B5000324. Accessed 2nd Feb 2012
42. Ewing RG, Eiceman GA, Harden CS, Stone JA (2006) the kineticsof the decompositions of the proton bound dimers of 1,4-dime-thylpyridine and dimethyl methylphosphonate from atmospherepressure ion mobility spectra. Int J Mass Spectrom 76:255–256
43. An X, Eiceman GA, Stone JA (2010) A determination of theeffective temperatures for the dissociation of the proton bounddimer of dimethyl methylphosphonate in a planar differential mo-bility spectrometer. Int J Ion Mobil Spectrom 13:25–36
44. An X, Eiceman GA, Rodriguez JE, Stone JA (2011) Gas phasefragmentation of protonated esters in air at ambient pressurethrough ion heating by electric field in differential mobility spec-trometry. Int J Mass Spectrom 303:181–190
45. Eiceman GA, Stone JA (2009) In: March RE, Todd JFA (eds)Practical aspects of trapped ion mass spectrometry, Volume V387–415. Boca Raton, CRC Press
46. Stone JA (2002) The Kinetics and thermodynamics of ion solva-tion applicable to ion mobility spectrometry. Int J Ion Mob Spec-trom 5:19–41
222 Int. J. Ion Mobil. Spec. (2012) 15:199–222